Aerial Rivers and Lakes: Looking at Large-Scale Moisture Transport and Its Relation to Amazonia and...
15
Aerial Rivers and Lakes: Looking at Large-Scale Moisture Transport and Its Relation to Amazonia and to Subtropical Rainfall in South America JOSEFINA MORAES ARRAUT AND CARLOS NOBRE Instituto Nacional de Pesquisas Espaciais, Sa ˜ o Paulo, Brazil HENRIQUE M. J. BARBOSA Universidade de Sa ˜ o Paulo, Sa ˜ o Paulo, Brazil GUILLERMO OBREGON AND JOSE ´ MARENGO Instituto Nacional de Pesquisas Espaciais, Sa ˜ o Paulo, Brazil (Manuscript received 4 November 2010, in final form 17 June 2011) ABSTRACT This is an observational study of the large-scale moisture transport over South America, with some analyses on its relation to subtropical rainfall. The concept of aerial rivers is proposed as a framework: it is an analogy between the main pathways of moisture flow in the atmosphere and surface rivers. Opposite to surface rivers, aerial rivers gain (lose) water through evaporation (precipitation). The magnitude of the vertically integrated moisture transport is discharge, and precipitable water is like the mass of the liquid column—multiplied by an equivalent speed it gives discharge. Trade wind flow into Amazonia, and the north/northwesterly flow to the subtropics, east of the Andes, are aerial rivers. Aerial lakes are the sections of a moisture pathway where the flow slows down and broadens, because of diffluence, and becomes deeper, with higher precipitable water. This is the case over Amazonia, downstream of the trade wind confluence. In the dry season, moisture from the aerial lake is transported northeastward, but weaker flow over southern Amazonia heads southward toward the sub- tropics. Southern Amazonia appears as a source of moisture to this flow. Aerial river discharge to the subtropics is comparable to that of the Amazon River. The variations of the amount of moisture coming from Amazonia have an important effect over the variability of discharge. Correlations between the flow from Amazonia and sub- tropical rainfall are not strong. However, some months within the set of dry seasons observed showed a strong increase (decrease) occurring together with an important increase (decrease) in subtropical rainfall. 1. Introduction In this paper, the large-scale moisture transport over South America is studied throughout the year, using a novel approach. Some exploratory analyses are pre- sented regarding the relation between this transport and subtropical rainfall. Emphasis is given to the dry season, when the potential effects of deforestation owing to the exchange of moisture between the surface and the at- mosphere would be more intensely felt. The South American subtropics are quite humid in comparison to the usually drier subtropical belts of the planet, which are generally under the subsidence branch of the Hadley cell. Although there is clearly a wet sea- son, there are areas with high rainfall throughout the year. These areas are fed by large-scale moisture trans- port. This work specifically considers the large-scale moisture flow over Amazonia, which veers southward to flow toward the subtropics, and the rainfall areas that it feeds. The South Atlantic convergence zone (SACZ) region receives most of its moisture from the northerly branch of the South Atlantic subtropical high and is not dealt with here. The following questions are considered. d Is Amazonia a source of moisture for the atmosphere— when and where? There has been much speculation on this issue because of measurements (such as in Nobre et al. 1991) showing a moister atmosphere over forests than over the adjacent ocean. Corresponding author address: Josefina Moraes Arraut, Centro de Cie ˆncias do Sistema Terrestre, Instituto Nacional de Pesquisas Espaciais, Av. dos Astronautas, 1758, Sa ˜o Jose ´ dos Campos, Sao Paulo 12227-010, Brazil. E-mail: josefi[email protected] 15 JANUARY 2012 ARRAUT ET AL. 543 DOI: 10.1175/2011JCLI4189.1 Ó 2012 American Meteorological Society
Transcript of Aerial Rivers and Lakes: Looking at Large-Scale Moisture Transport and Its Relation to Amazonia and...

Aerial Rivers and Lakes: Looking at Large-Scale Moisture Transport and Its Relationto Amazonia and to Subtropical Rainfall in South America
JOSEFINA MORAES ARRAUT AND CARLOS NOBRE
Instituto Nacional de Pesquisas Espaciais, Sao Paulo, Brazil
HENRIQUE M. J. BARBOSA
Universidade de Sao Paulo, Sao Paulo, Brazil
GUILLERMO OBREGON AND JOSE MARENGO
Instituto Nacional de Pesquisas Espaciais, Sao Paulo, Brazil
(Manuscript received 4 November 2010, in final form 17 June 2011)
ABSTRACT
This is an observational study of the large-scale moisture transport over South America, with some analyses
on its relation to subtropical rainfall. The concept of aerial rivers is proposed as a framework: it is an analogy
between the main pathways of moisture flow in the atmosphere and surface rivers. Opposite to surface rivers,
aerial rivers gain (lose) water through evaporation (precipitation). The magnitude of the vertically integrated
moisture transport is discharge, and precipitable water is like the mass of the liquid column—multiplied by an
equivalent speed it gives discharge. Trade wind flow into Amazonia, and the north/northwesterly flow to the
subtropics, east of the Andes, are aerial rivers. Aerial lakes are the sections of a moisture pathway where the
flow slows down and broadens, because of diffluence, and becomes deeper, with higher precipitable water. This
is the case over Amazonia, downstream of the trade wind confluence. In the dry season, moisture from the aerial
lake is transported northeastward, but weaker flow over southern Amazonia heads southward toward the sub-
tropics. Southern Amazonia appears as a source of moisture to this flow. Aerial river discharge to the subtropics is
comparable to that of the Amazon River. The variations of the amount of moisture coming from Amazonia have
an important effect over the variability of discharge. Correlations between the flow from Amazonia and sub-
tropical rainfall are not strong. However, some months within the set of dry seasons observed showed a strong
increase (decrease) occurring together with an important increase (decrease) in subtropical rainfall.
1. Introduction
In this paper, the large-scale moisture transport over
South America is studied throughout the year, using
a novel approach. Some exploratory analyses are pre-
sented regarding the relation between this transport and
subtropical rainfall. Emphasis is given to the dry season,
when the potential effects of deforestation owing to the
exchange of moisture between the surface and the at-
mosphere would be more intensely felt.
The South American subtropics are quite humid in
comparison to the usually drier subtropical belts of the
planet, which are generally under the subsidence branch
of the Hadley cell. Although there is clearly a wet sea-
son, there are areas with high rainfall throughout the
year. These areas are fed by large-scale moisture trans-
port. This work specifically considers the large-scale
moisture flow over Amazonia, which veers southward to
flow toward the subtropics, and the rainfall areas that it
feeds. The South Atlantic convergence zone (SACZ)
region receives most of its moisture from the northerly
branch of the South Atlantic subtropical high and is not
dealt with here.
The following questions are considered.
d Is Amazonia a source of moisture for the atmosphere—
when and where? There has been much speculation on
this issue because of measurements (such as in Nobre
et al. 1991) showing a moister atmosphere over forests
than over the adjacent ocean.
Corresponding author address: Josefina Moraes Arraut, Centro
de Ciencias do Sistema Terrestre, Instituto Nacional de Pesquisas
Espaciais, Av. dos Astronautas, 1758, Sao Jose dos Campos, Sao
Paulo 12227-010, Brazil.
E-mail: [email protected]
15 JANUARY 2012 A R R A U T E T A L . 543
DOI: 10.1175/2011JCLI4189.1
� 2012 American Meteorological Society
d How much moisture is delivered by the large-scale
flow to the high-rainfall regions in the subtropics?d What is the importance of moisture coming from
Amazonia to this flow?d What is the role of exchanges with the surface along
the way?d How is the variation of the amount of moisture leaving
Amazonia related to the variation of subtropical
rainfall?
a. Aerial rivers
The term atmospheric river was proposed in Newell
et al. (1992), Newell and Zhu (1994), and Zhu and Newell
(1998) in reference to filamentary structures in the verti-
cally integrated moisture flow field, which are responsible
for very intense transport. These are typical of the ex-
tratropical latitudes, where the flow shows turbulence in
the large scale. At any given time a small number of these
structures, generally around four or five, can account for
more than 90% of the poleward moisture transport in
the midlatitudes. The moisture flow east of the Andes
was identified as a filamentary structure and therefore an
atmospheric river in Newell et al. (1992); however, little is
mentioned in subsequent literature on the subject, prob-
ably because it holds little dynamical resemblance to the
more poleward-lying rivers.
Preferential pathways of moisture flow can also be
identified in the tropics, although they could not be de-
scribed as filamentary. Oftentimes, moisture will flow
over large distances from the deep tropics to the sub-
tropics and beyond. Observations show that long-term
mean high rainfall in the southern subtropics during
southern summer occurs where the trade winds flow
poleward after undergoing sharp turns: the South Pacific
convergence zone (SPCZ); the SACZ (Kodama 1992);
and across South America east of the Andes (Arraut and
Satyamurty 2009). This last pathway was called an aerial
river in Arraut and Satyamurty. The section of this flow
lying adjacent to the Andes will, on some occasions,
develop a core of particularly high speed called the
South American low-level jet.
Intense moisture fluxes are often called moisture con-
veyor belts in the literature. However, this analogy draws
attention away from the fact that exchanges between the
surface and the atmosphere take place along the way.
In some cases these may be quite intense, as with mois-
ture coming from the tropical Atlantic and going over
Amazonia on its way to the South American subtropics.
The term aerial river is proposed here for all preferential
pathways of moisture flow, filamentary or broad, because
a near-complete symmetry/analogy can be established
with the surface rivers. Aerial rivers lose water through
precipitation and gain it through evaporation, while with
surface rivers just the opposite takes place. The magni-
tude of the vertically integrated moisture transport is the
discharge at each point, and precipitable water is like the
mass of the liquid column, which is directly proportional
to its height—multiplied by an equivalent speed it gives
discharge. Use of the aerial river image also allows for
the slower, broader, and moister sections of a moisture
pathway, such as over Amazonia, to be suitably described
as aerial lakes, as will be done later in this paper.
SEASONAL AERIAL RIVERS
When studies aiming to relate moisture transport and
rainfall are carried out on the weather time scale, the
path of moisture feeding the rainfall can be directly
identified. However, in this work we intend to identify
the preferential pathways, or aerial rivers, on the longer
climatic time scales.
Locations of strong rainfall over the continent must be
characterized by large-scale convergence of moisture
transport in the atmosphere. In this way mean rainfall
can be used to identify the main regions of mean con-
vergence. If the long-term mean moisture transport ex-
hibits a predominant pathway leading to an important
rainfall region, that flow shows the mean convergence. It
can be inferred to often be the pathway of moisture
during individual rainfall events. This way of linking the
weather and the climate time scales was used in Arraut
and Satyamurty (2009). In the present work, it is used to
identify predominant pathways of moisture flow to the
subtropics throughout the year, or seasonal aerial rivers.
b. East of the Andes moisture transport, andsubtropical weather and climate
Weather and climate in the South American subtrop-
ics, particularly during summer and adjacent months,
result in large part from the interplay between the in-
flow of moisture from the tropics and the incursion of
synoptic disturbances originated in the midlatitudes.
Garreaud and Wallace (1998) showed this flow to inten-
sify preceding cool-air incursions, in response to the
deepening of the northwestern Argentinean low (NAL),
moistening the subtropical plains. Consequently, intense
rainfall occurs ahead of the incursion. Salio et al. (2002)
undertook a systematic study of summertime Chaco jet
events, a special case of South American low-level jet
with a large southward extension, finding their flow into
the subtropics to be 10 times stronger than climatology,
fostering intense rainfall, which accounts for an impor-
tant part of the seasonal total. A baroclinic wave train
extending from the Pacific into the continent was found
in the extratropics. Seluchi et al. (2003) and Saulo et al.
(2004) showed that, south of 258S, intense moisture flow
544 J O U R N A L O F C L I M A T E VOLUME 25
to the east of the Andes is mostly synoptically driven and
due to the intensification of the NAL. Siqueira and
Machado (2004) studied convective systems associated
with frontal incursions, finding enhancement of mois-
ture transport from Amazonia toward them to occur in
the majority of cases. Salio et al. (2007) showed that
subtropical mesoscale convective complexes (MCCs)
are 3½ times more common on days when a Chaco jet is
present than on other days. The northeastward advance-
ment of a baroclinic zone causes their displacement.
Mendes et al. (2007) studied cyclogenesis over the south-
ern region of South America and observed a moist en-
tropy reservoir northwest of the cyclone formation due
to an intensification of the northerly flow along the
eastern flanks of the Andes. Arraut (2007) presented a
systematic study of summertime fronts, showing intense
moisture transport from the tropics to take place prior to
and during the frontal events, geostrophically acceler-
ated by an intense NAL. Saulo et al. (2007) found the
intense convergence of low-level winds associated with
deep convection to introduce ageostrophic components
in the northerly moisture flow into the subtropics.
c. Is Amazonia a source of moisture for theatmosphere?
The possible role of Amazonia as a source of moisture
for the atmosphere and the variability in time and space
of this source is presently under debate, largely moti-
vated by observations of moister air over the forest than
over the adjacent Atlantic during southern summer (see,
for instance, Nobre et al. 1991). Insight into this issue can
be gained by considering the water balance for the whole
basin. In this case precipitation is the only external source,
while water is lost to evaporation and to river discharge
into the ocean. The basin cannot be a year-round sys-
tematic moisture source to the atmosphere because it
would dry out.
The moisture balance equation for the surface (Peixoto
and Oort 1992) is
P 2 E 5 Rt 1 S, (1)
where P is precipitation, E is evaporation, Rt is the total
runoff [surface plus underground (Rs 1 Ru)], and S is the
variation in soil and surface water storage.
For the whole basin, Rt . 0 always. If P 2 E , 0, then
S , 2Rt , 0. If S . 0, then P 2 E . Rt. In other words,
net evaporation occurs at the expense of soil moisture,
which must be decreasing by a value larger than runoff.
If the soil is moistening, then precipitation is exceeding
evaporation by more than the value of runoff.
The hydrological response to rainfall in such a large
basin as Amazonia is a complicated matter. However,
during the wet season, there is overall moistening of the
soil, leading one to expect that the basin is acting as a
sink of moisture, even though atmospheric humidity is at
its highest, as will be seen. Nothing can be inferred from
soil drying alone. Particularly in the dry season, when in-
tense rainfall is restricted to a smaller area over Amazonia,
there can be important spatial variability in the source/
sink behavior. It is worth investigating if the forest acts
as a source of moisture to the subtropics in its driest
season.
2. Data and calculations
Most of the data used in this study consist of tem-
perature, specific humidity, wind fields, and surface
pressure taken from the European Centre for Medium-
Range Weather Forecasts Interim Reanalysis (ERA-
Interim) (Dee et al. 2011). ERA-Interim is a gridpoint
dataset with a 1.58 horizontal resolution and 37 vertical
pressure levels, between 1000 and 1 hPa, provided at 6-h
intervals. As noticed by Dee and Uppala (2008), ERA-
Interim performs much better than its predecessors,
such as the 40-yr ECMWF Re-Analysis (ERA-40)
(Uppala et al. 2005) and the Japanese 25-year Reanalysis
(JRA-25) (Onogi et al. 2007), particularly when it comes
to humidity analysis. Known problems with ERA-40,
such as the excessive tropical precipitation (Uppala
et al. 2005) and the method used for humidity analysis
(Andersson et al. 2005), were corrected in ERA-Interim,
significantly reducing the bias in both total column water
vapor and tropical precipitation (Dee and Uppala 2008).
The Global Precipitation Climatology Project (GPCP)
version 2.1 combined precipitation dataset (Huffman
et al. 2009) is also used. It is composed of monthly fields
with 18 horizontal resolution. The studied period is
from January 1989 to December 2008, common to
both datasets.
Moisture transport, in meters per second, was calcu-
lated at 6-h intervals and integrated from surface pres-
sure to 1 hPa to give QV (kg m21 s21):
QV 5
ð1hPa
Ps
qvdP
g, (2)
where v is the wind vector (m s21), q the specific hu-
midity (kg kg21), P is pressure (N m22), and g the ac-
celeration due to gravity (m s22). Divergence of QV was
calculated using finite differences.
The monthly and longer-term means of moisture trans-
port and divergence were obtained by averaging the 6-h
values. The amount of water vapor transported across
a longitudinal or latitudinal segment is simply the line
integral of the vertically integrated moisture transport
15 JANUARY 2012 A R R A U T E T A L . 545

component perpendicular to that segment. For conve-
nience, the values obtained in kilograms per second are
converted to gigaton per day multiplying by 864 3 10210.
For some comparisons, temperature and humidity from
the National Centers for Environmental Prediction–
National Center for Atmospheric Research (NCEP–
NCAR) 40-Year Reanalysis (Kalnay et al. 1996),
full-resolution ERA-40 (Uppala et al. 2005), and level-3
data from the Atmospheric Infrared Sounder (AIRS)
(Le Marshall et al. 2006) on board the Aqua satellite
were used. The resolutions of these monthly datasets are
28, 1.1258, and 18, respectively.
An exploratory analysis was undertaken on the re-
lation between moisture outflow from Amazonia and
rainfall in subtropical South America, for each season.
This outflow was represented by the meridional moisture
FIG. 1. Mean seasonal precipitation (shaded, mm day21) and vertically integrated moisture transport (vectors) are shown for NM
(Nov–Mar), AJ (Apr–Jun), JA (Jul–Aug), and SO (Sep–Oct).
546 J O U R N A L O F C L I M A T E VOLUME 25

transport across 128S, zonally averaged from 758 to 558W.
Deseasonalized time series were prepared for each sea-
son by taking each monthly mean within the season, for
every year of the studied period, and subtracting the
corresponding long-term monthly mean. The same was
done for rainfall, and the two time series were correlated
at each grid point. A Student’s t test was used to evaluate
the statistical significance of these correlations.
For the dry season, the large-scale situation for months
with strong (weak) moisture transport from Amazonia,
aerial river discharge, and subtropical rainfall was ana-
lyzed through compositing analysis. In search of global
oceanic and atmospheric characteristics related to these
situations, the sea surface temperature (SST) difference
between them was calculated as well, and composites of
the meridional geopotential height anomalies at 850 and
FIG. 2. Magnitude of mean seasonal vertically integrated moisture transport (shaded, kg m21 s21) and precipitable water (contours,
kg m22) are shown for NM (Nov–Mar), AJ (Apr–Jun), JA (Jul–Aug), and SO (Sep–Oct).
15 JANUARY 2012 A R R A U T E T A L . 547
300 hPa were built. These anomalies were used to high-
light atmospheric waves in high latitudes.
3. Results
a. Climatological features of precipitation andmoisture transport
1) ANNUAL MARCH OF PRECIPITATION
Long-term monthly mean fields were used to identify
qualitative spatial patterns in subtropical rainfall. These
were then used to divide the year into seasons. Long-
term mean rainfall and moisture transport are shown for
these seasons in Fig. 1. November–March (NDJFM) was
termed ‘‘wet.’’ The South Atlantic convergence zone
(SACZ) pattern is configured and rainfall is high over
all of Southern Hemisphere Amazonia, with a diagonal
band extending from its west into the subtropics and
Atlantic. It is also when the subtropical plains east of the
Andes receive the most rainfall. July–August (JA) was
termed ‘‘dry.’’ In the subtropics fairly high rainfall is
only present over southern Brazil, where the end of a
diagonal band of precipitation, with its maximum over
the southwestern Atlantic, touches the continent. There
were two transition seasons, April–June (AMJ) and
September–October (SO), quite similar in their sub-
tropical patterns: both have high rainfall restricted to
southern Brazil, with a local maximum contained in the
diagonal band that extends into the ocean.
2) MOISTURE TRANSPORT
Amazonia lies fully in the path of the moisture-laden
trade winds, and throughout the year it receives most or
part of the flow coming from the trade wind confluence.
During the wet season interhemispheric flow is strong,
and most of the moisture entering western Amazonia
comes from the northern tropical ocean. During the other
seasons both hemispheres provide important contributions.
Year-round, part of this moisture veers over western
Amazonia and is transported southward, toward high
rainfall areas in the subtropics. The amount of moisture
leaving Amazonia toward the south varies greatly within
the year. East of the Andes there is confluence with flow
coming zonally over the continent from the Atlantic.
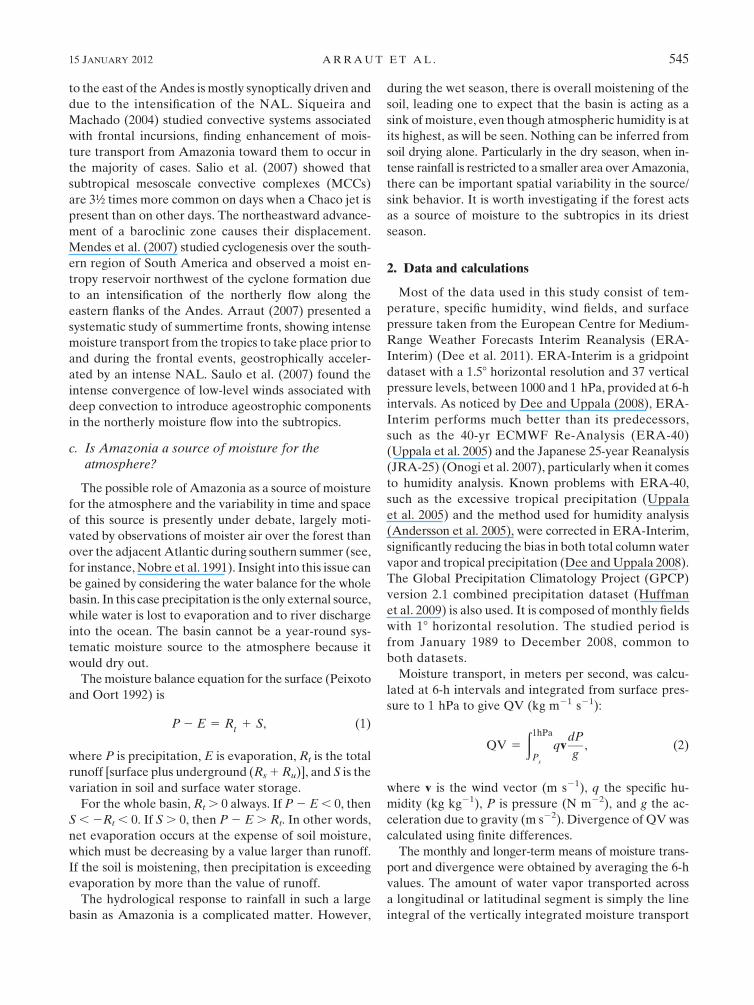
b. Aerial rivers and lakes
Applying the aerial river concept to the situation over
South America, it can be said that the trade winds flowing
into Amazonia form an aerial river, as does the moisture
that flows east of the Andes, toward the subtropics.
Figure 2 shows the magnitude of the vertically in-
tegrated moisture transport in shades of gray. Precip-
itable water is shown in contours. It can be seen that the
moisture transport decreases inland, downstream of the
trade wind confluence. This decrease is, at least in part,
due to diffluence. The pattern is very similar to that of
a liquid flowing into a wider channel. It can also be seen
in Fig. 1 that there is generally broadening of the mois-
ture pathway when advecting from the ocean into Am-
azonia. Precipitable water increases inland from 508 to
658W and the equator to 108S, so the decrease in trans-
port must be due to diminishing wind speed in low levels.
These are the reasons for referring to the atmosphere
over Amazonia as an aerial lake of moisture. The aerial
lake over Amazonia is deeper in the west, but flow speed
diminishes in such a way that discharge is lower. In the
dry season most of the moisture leaving the aerial lake
system is transported toward Central America. In the
wet season most of the outflow is toward the South
American subtropics.
Figure 3 shows a schematic representation of the ae-
rial rivers and lake system over South America during
the wet season.
A comparison between moisture profiles over Ama-
zonia (108–08S, 708–508W) and the adjacent Atlantic
(equator–108N, 508–308W) is shown in Fig. 4 for the
seasons defined here. Data from four different sources
are used: Aqua AIRS (2003–09), ERA-40 (1980–2001),
ERA-Interim (1989–2008), and NCEP (1980–2001).
From September to June the atmosphere over Amazonia
is more moist up to 700 hPa. From November to March
it is more moist over the whole column, up to 300 hPa. In
July to August there is a discrepancy between the data-
sets: NCEP and ERA-Interim showing more moisture
over the forest between 900 and 650 hPa, Aqua AIRS
showing the opposite, and almost no difference to be
seen in ERA-40.
FIG. 3. Schematic representation of the aerial rivers and lake system
over South America in the wet season.
548 J O U R N A L O F C L I M A T E VOLUME 25
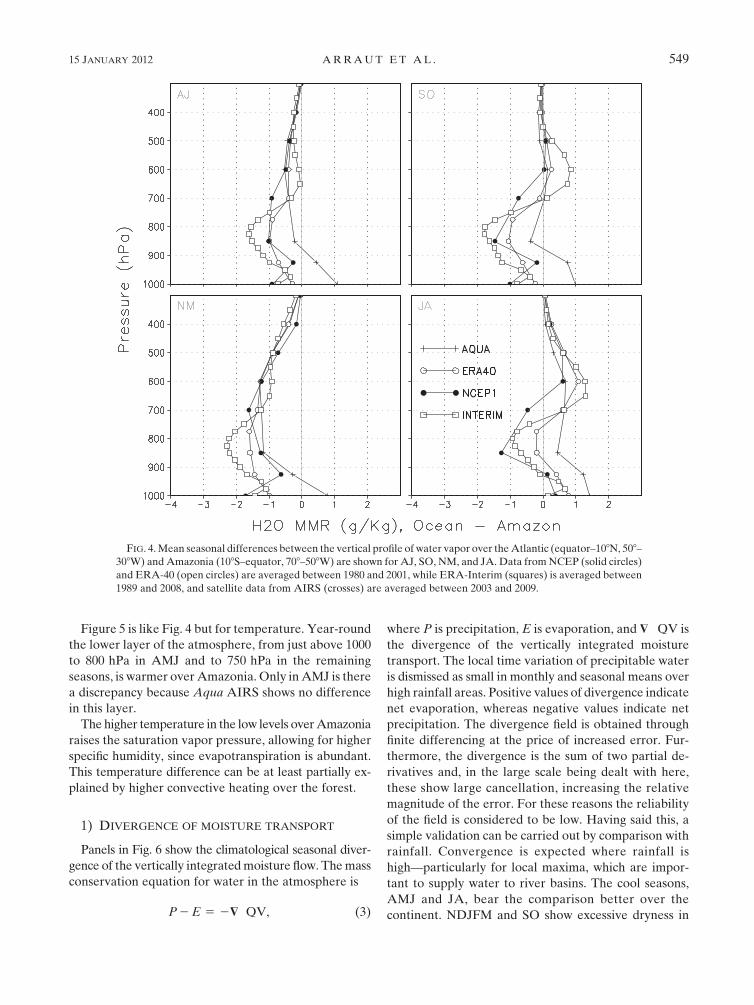
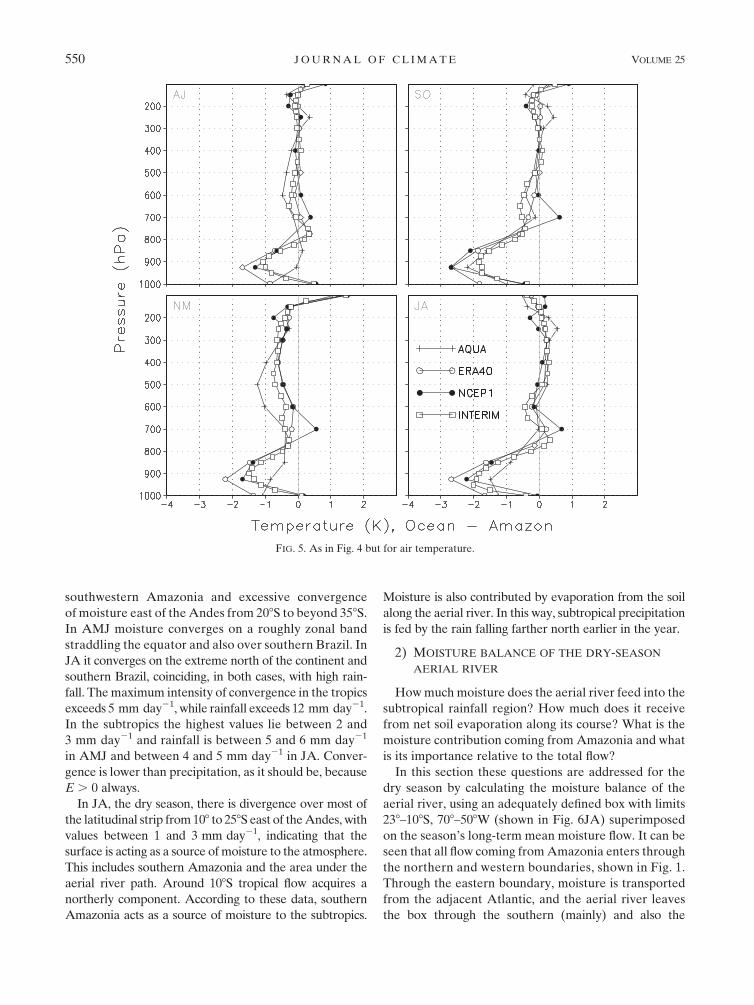
Figure 5 is like Fig. 4 but for temperature. Year-round
the lower layer of the atmosphere, from just above 1000
to 800 hPa in AMJ and to 750 hPa in the remaining
seasons, is warmer over Amazonia. Only in AMJ is there
a discrepancy because Aqua AIRS shows no difference
in this layer.
The higher temperature in the low levels over Amazonia
raises the saturation vapor pressure, allowing for higher
specific humidity, since evapotranspiration is abundant.
This temperature difference can be at least partially ex-
plained by higher convective heating over the forest.
1) DIVERGENCE OF MOISTURE TRANSPORT
Panels in Fig. 6 show the climatological seasonal diver-
gence of the vertically integrated moisture flow. The mass
conservation equation for water in the atmosphere is
P 2 E 5 2$ �QV, (3)
where P is precipitation, E is evaporation, and $ �QV is
the divergence of the vertically integrated moisture
transport. The local time variation of precipitable water
is dismissed as small in monthly and seasonal means over
high rainfall areas. Positive values of divergence indicate
net evaporation, whereas negative values indicate net
precipitation. The divergence field is obtained through
finite differencing at the price of increased error. Fur-
thermore, the divergence is the sum of two partial de-
rivatives and, in the large scale being dealt with here,
these show large cancellation, increasing the relative
magnitude of the error. For these reasons the reliability
of the field is considered to be low. Having said this, a
simple validation can be carried out by comparison with
rainfall. Convergence is expected where rainfall is
high—particularly for local maxima, which are impor-
tant to supply water to river basins. The cool seasons,
AMJ and JA, bear the comparison better over the
continent. NDJFM and SO show excessive dryness in
FIG. 4. Mean seasonal differences between the vertical profile of water vapor over the Atlantic (equator–108N, 508–
308W) and Amazonia (108S–equator, 708–508W) are shown for AJ, SO, NM, and JA. Data from NCEP (solid circles)
and ERA-40 (open circles) are averaged between 1980 and 2001, while ERA-Interim (squares) is averaged between
1989 and 2008, and satellite data from AIRS (crosses) are averaged between 2003 and 2009.
15 JANUARY 2012 A R R A U T E T A L . 549
southwestern Amazonia and excessive convergence
of moisture east of the Andes from 208S to beyond 358S.
In AMJ moisture converges on a roughly zonal band
straddling the equator and also over southern Brazil. In
JA it converges on the extreme north of the continent and
southern Brazil, coinciding, in both cases, with high rain-
fall. The maximum intensity of convergence in the tropics
exceeds 5 mm day21, while rainfall exceeds 12 mm day21.
In the subtropics the highest values lie between 2 and
3 mm day21 and rainfall is between 5 and 6 mm day21
in AMJ and between 4 and 5 mm day21 in JA. Conver-
gence is lower than precipitation, as it should be, because
E . 0 always.
In JA, the dry season, there is divergence over most of
the latitudinal strip from 108 to 258S east of the Andes, with
values between 1 and 3 mm day21, indicating that the
surface is acting as a source of moisture to the atmosphere.
This includes southern Amazonia and the area under the
aerial river path. Around 108S tropical flow acquires a
northerly component. According to these data, southern
Amazonia acts as a source of moisture to the subtropics.
Moisture is also contributed by evaporation from the soil
along the aerial river. In this way, subtropical precipitation
is fed by the rain falling farther north earlier in the year.
2) MOISTURE BALANCE OF THE DRY-SEASON
AERIAL RIVER
How much moisture does the aerial river feed into the
subtropical rainfall region? How much does it receive
from net soil evaporation along its course? What is the
moisture contribution coming from Amazonia and what
is its importance relative to the total flow?
In this section these questions are addressed for the
dry season by calculating the moisture balance of the
aerial river, using an adequately defined box with limits
238–108S, 708–508W (shown in Fig. 6JA) superimposed
on the season’s long-term mean moisture flow. It can be
seen that all flow coming from Amazonia enters through
the northern and western boundaries, shown in Fig. 1.
Through the eastern boundary, moisture is transported
from the adjacent Atlantic, and the aerial river leaves
the box through the southern (mainly) and also the
FIG. 5. As in Fig. 4 but for air temperature.
550 J O U R N A L O F C L I M A T E VOLUME 25

eastern boundaries. The flow across the eastern boundary
was plotted versus latitude for each of the months in the
20 dry seasons, a total of 40 months (not shown). The
aim was to determine if the incoming and outgoing flow
could be easily separated. In all months but one, it showed
only one sign change. That is to say, for all months but
one, there is a characteristic latitude separating the in-
coming transport and the outflowing aerial river, making
it simple to distinguish between them. The box is built so
as to exclude completely the region of long-term mean
moisture convergence. In this way the contribution of
net soil evaporation to the aerial river can be calculated
FIG. 6. Mean seasonal vertically integrated moisture transport (arrows) and its divergence (colors, mm day21) are shown for
NM, AJ, JA, and SO.
15 JANUARY 2012 A R R A U T E T A L . 551

as residual. Also, the discharge represents the total
amount of moisture delivered to the continental rainfall
region.
Discharge of the aerial river is plotted in Fig. 7. It
mostly varies between 10 and 23 Gt day21. This is com-
parable to the discharge of the Amazon River. The amount
of moisture from Amazonia and from the Atlantic are
similar in their mean values. However, the Amazonia
discharge shows a larger spread and thus a greater effect
on discharge variability. Net evaporation from the sur-
face follows closely the other two terms in quantitative
importance. It is relevant to note that it increases the
moisture flow by raising specific humidity, so that more
moist air, and not more air, is transported to the sub-
tropics.
Moisture transport and rainfall
It is now asked, how does the amount of moisture
leaving Amazonia correlate to subtropical rainfall in
each season? The moisture leaving Amazonia was rep-
resented by the meridional component of moisture trans-
port across 128S from 758 to 558W. It was correlated to
rainfall at each point, and the results are displayed in
Fig. 8. A Student’s t test was applied, and only values
above the 95% significance level are displayed. These
correlations are only of interest where there is abundant
rainfall. For reference, long-term seasonal mean rainfall
is shown in contours. In all seasons, areas with moderate
correlations, up to 0.5, are found within regions of intense
rainfall. These areas are larger in NDJFM and JA. Our
main interest, however, is in the dry season. When rainfall
is infrequent, the forest’s elaborate root system plays an
essential role in retaining and accessing soil moisture.
For this reason, dry season evapotranspiration is most
likely to be affected in a scenario of deforestation.
The plain line (no markers) in Fig. 7 shows rainfall
over the region 348–238S, 578–488W, which is depicted in
the JA panel of Fig. 1. This was compared to moisture
from Amazonia and also to the aerial river discharge.
The aim was to look for months when all three were
strong and when all three were weak. These are situa-
tions when the amount of moisture coming from Ama-
zonia has an important effect on discharge. That this
may cause the corresponding alteration in rainfall is an
important possibility. To gain qualitative understand-
ing of these situations, composites were built for the full
fields and for their anomalies. These are shown in Fig. 9.
The ‘‘strong’’ situations show anomalous transport all the
way from the northern Atlantic to the area of increased
rainfall in the subtropics. It also shows a strengthened
South Atlantic high. This situation constitutes an inten-
sification of climatology, so there is, in fact, more mois-
ture traveling from the deep tropics to the subtropics and
the rainfall region. The ‘‘weak’’ composite shows the
opposite situation, with anomalous flow heading north-
westward from the area with decreased rainfall to the
tropics and veering northeastward toward the tropical
ocean. This pattern represents a weakening of clima-
tology, so there is, in fact, less flow from the deep tropics
into the subtropics. There is also a weakening of the
South Atlantic high.
The tropical and subtropical parts of the large-scale
moisture flow over South America are generally under
quite different dynamical influences. For this reason it is
interesting to observe organized anomaly patterns with
such large latitudinal extension, and it will be important
to investigate their cause in the future.
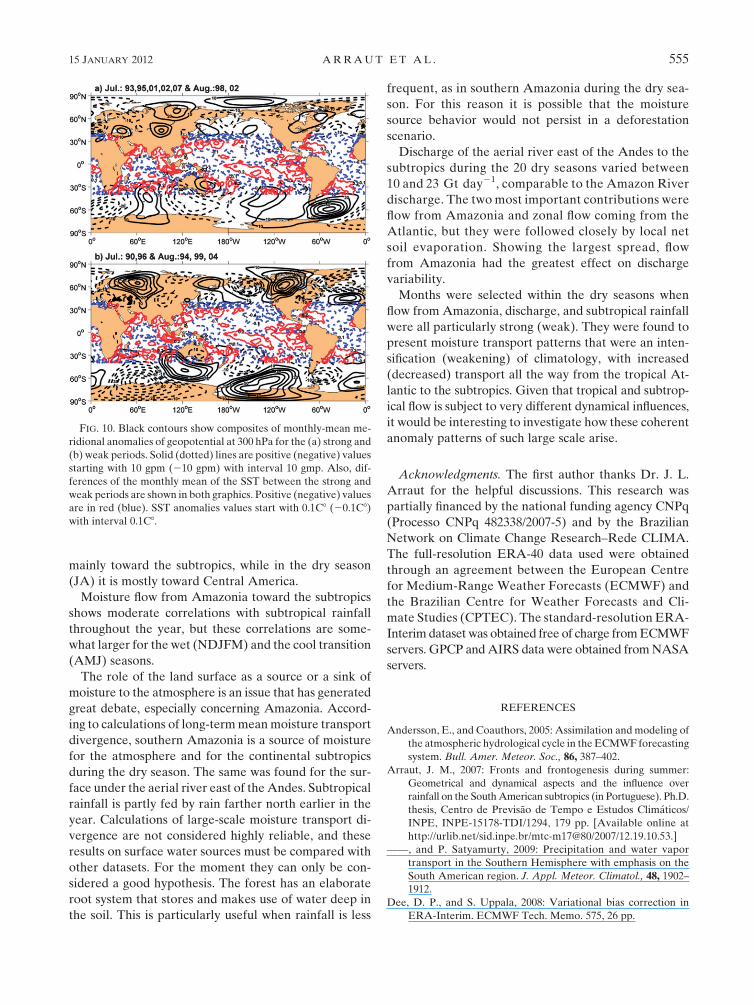
The spatial distribution of the monthly-mean SST
difference between periods of intense and weak mois-
ture fluxes present three areas of positive SST located in
the west tropical Atlantic (0.58C), adjacent to the south-
eastern and southern regions of Brazil and to Uruguay
(1.08C), and over the eastern tropical Pacific (1.08C),
shown in Fig. 10. This last one seems to be associated
with a mature positive phase of the El Nino–Southern
Oscillation phenomenon.
The spatial structures of the mean meridinonal anom-
alies of geopotential height at 300 hPa for the two pe-
riods show contrasting characteristics in low latitudes,
both north and south. The strong situation appears re-
lated to a positive North Atlantic Oscillation (NAO)
pattern, and a weak wave-3 trend in the subtropics and
midlatitudes of the Southern Hemisphere (308S, 608S),
with an apparent blocking in the South Atlantic (608S,
458W). In contrast, the weak situations are characterized
by a strong positive phase of the Pacific–North Atlantic
pattern and a strong negative phase of the NAO. In the
Southern Hemisphere, a strong wave-3 trend (308–608S)
FIG. 7. Water balance (Gt day21) for the area depicted in Fig. 6
(238–108S, 708–508W) for the dry months between 1989 and 2008.
Inflow is divided into two contributions: Amazonia (open circle)
and Atlantic Ocean (filled circle). Discharge (1) is the outflow
from this region into the subtropics, and the residue (squares) is the
difference between inflows and outflows. The line without symbols
is the precipitation averaged over 348–238S, 578–488W.
552 J O U R N A L O F C L I M A T E VOLUME 25

appears—related to a strong blocking structure at low
latitudes (608S, 1208W), which are all part of the Ant-
arctic Oscillation pattern.
4. Discussion and conclusions
This was an observational study of the large-scale
moisture transport over South America, with some initial
analyses on its relation to subtropical rainfall. The con-
cepts of an aerial river and aerial lake are proposed and
used as a framework for considering large-scale moisture
transport. They consist of a symmetry/analogy between
the main pathways of moisture flow in the atmosphere
and surface rivers and lakes. Aerial rivers and lakes lose
(gain) water through precipitation (evaporation), while
the opposite takes place in their surface counterparts.
FIG. 8. Colors show correlations between the meridional moisture transport across 128S between 758 and 558W
(indicated by the grayscale horizontal line) and rainfall at each grid point. Values below the 95% significance level are
masked out. Contours show the long-term mean seasonal rainfall, for reference (kg m22).
15 JANUARY 2012 A R R A U T E T A L . 553

The magnitude of the vertically integrated moisture
transport is the discharge at each point, and precipitable
water is like the mass of a liquid column (which is directly
proportional to its height) multiplied by an equivalent
speed, it gives the discharge.
Trade wind flow into Amazonia forms an aerial river,
as does the moisture flow east of the Andes, which
heads toward the subtropics. Both are present year-
round. Aerial lakes are the sections of a moisture path-
way in which the flow slows down and broadens, because
of diffluence, and becomes ‘‘deeper,’’ with high amounts
of precipitable water. This is the case over Amazonia
downstream of the trade wind confluence. In the wet
season (NDJFM) flow from the aerial lake is transported
FIG. 9. (left) Anomaly and (right) full field composites for months when enhanced (diminished) rainfall was ac-
companied by an intensification (weakening) of the climatological moisture transport (vectors) pattern are shown in
the top (bottom) panels.
554 J O U R N A L O F C L I M A T E VOLUME 25
mainly toward the subtropics, while in the dry season
(JA) it is mostly toward Central America.
Moisture flow from Amazonia toward the subtropics
shows moderate correlations with subtropical rainfall
throughout the year, but these correlations are some-
what larger for the wet (NDJFM) and the cool transition
(AMJ) seasons.
The role of the land surface as a source or a sink of
moisture to the atmosphere is an issue that has generated
great debate, especially concerning Amazonia. Accord-
ing to calculations of long-term mean moisture transport
divergence, southern Amazonia is a source of moisture
for the atmosphere and for the continental subtropics
during the dry season. The same was found for the sur-
face under the aerial river east of the Andes. Subtropical
rainfall is partly fed by rain farther north earlier in the
year. Calculations of large-scale moisture transport di-
vergence are not considered highly reliable, and these
results on surface water sources must be compared with
other datasets. For the moment they can only be con-
sidered a good hypothesis. The forest has an elaborate
root system that stores and makes use of water deep in
the soil. This is particularly useful when rainfall is less
frequent, as in southern Amazonia during the dry sea-
son. For this reason it is possible that the moisture
source behavior would not persist in a deforestation
scenario.
Discharge of the aerial river east of the Andes to the
subtropics during the 20 dry seasons varied between
10 and 23 Gt day21, comparable to the Amazon River
discharge. The two most important contributions were
flow from Amazonia and zonal flow coming from the
Atlantic, but they were followed closely by local net
soil evaporation. Showing the largest spread, flow
from Amazonia had the greatest effect on discharge
variability.
Months were selected within the dry seasons when
flow from Amazonia, discharge, and subtropical rainfall
were all particularly strong (weak). They were found to
present moisture transport patterns that were an inten-
sification (weakening) of climatology, with increased
(decreased) transport all the way from the tropical At-
lantic to the subtropics. Given that tropical and subtrop-
ical flow is subject to very different dynamical influences,
it would be interesting to investigate how these coherent
anomaly patterns of such large scale arise.
Acknowledgments. The first author thanks Dr. J. L.
Arraut for the helpful discussions. This research was
partially financed by the national funding agency CNPq
(Processo CNPq 482338/2007-5) and by the Brazilian
Network on Climate Change Research–Rede CLIMA.
The full-resolution ERA-40 data used were obtained
through an agreement between the European Centre
for Medium-Range Weather Forecasts (ECMWF) and
the Brazilian Centre for Weather Forecasts and Cli-
mate Studies (CPTEC). The standard-resolution ERA-
Interim dataset was obtained free of charge from ECMWF
servers. GPCP and AIRS data were obtained from NASA
servers.
REFERENCES
Andersson, E., and Coauthors, 2005: Assimilation and modeling of
the atmospheric hydrological cycle in the ECMWF forecasting
system. Bull. Amer. Meteor. Soc., 86, 387–402.
Arraut, J. M., 2007: Fronts and frontogenesis during summer:
Geometrical and dynamical aspects and the influence over
rainfall on the South American subtropics (in Portuguese). Ph.D.
thesis, Centro de Previsao de Tempo e Estudos Climaticos/
INPE, INPE-15178-TDI/1294, 179 pp. [Available online at
http://urlib.net/sid.inpe.br/mtc-m17@80/2007/12.19.10.53.]
——, and P. Satyamurty, 2009: Precipitation and water vapor
transport in the Southern Hemisphere with emphasis on the
South American region. J. Appl. Meteor. Climatol., 48, 1902–
1912.
Dee, D. P., and S. Uppala, 2008: Variational bias correction in
ERA-Interim. ECMWF Tech. Memo. 575, 26 pp.
FIG. 10. Black contours show composites of monthly-mean me-
ridional anomalies of geopotential at 300 hPa for the (a) strong and
(b) weak periods. Solid (dotted) lines are positive (negative) values
starting with 10 gpm (210 gpm) with interval 10 gmp. Also, dif-
ferences of the monthly mean of the SST between the strong and
weak periods are shown in both graphics. Positive (negative) values
are in red (blue). SST anomalies values start with 0.1C8 (20.1C8)
with interval 0.1C8.
15 JANUARY 2012 A R R A U T E T A L . 555

——, and Coauthors, 2011: The ERA-Interim reanalysis: Config-
uration and performance of the data assimilation system.
Quart. J. Roy. Meteor. Soc., 137, 553–597.
Garreaud, R. D., and J. M. Wallace, 1998: Summertime incursions of
midlatitude air into subtropical and tropical South America.
Mon. Wea. Rev., 126, 2713–2733.
Huffman, G. J., R. F. Adler, D. T. Bolvin, and G. Gu, 2009: Im-
proving the global precipitation record: GPCP version 2.1.
Geophys. Res. Lett., 36, L17808, doi:10.1029/2009GL040000.
Kalnay, E., and Coauthors, 1996: The NCEP/NCAR 40-Year Re-
analysis Project. Bull. Amer. Meteor. Soc., 77, 437–471.
Kodama, Y., 1992: Large-scale common features of subtropical
precipitation zones (the baiu frontal zone, the SPCZ, and the
SACZ). Part I: Characteristics of subtropical frontal zones.
J. Meteor. Soc. Japan, 70, 813–835.
Le Marshall, J., and Coauthors, 2006: Improving global analysis and
forecasting with AIRS. Bull. Amer. Meteor. Soc., 87, 891–894.
Mendes, D., E. P. Souza, I. F. Trigo, and P. M. A. Miranda, 2007: On
precursors of South American cyclogenesis. Tellus, 59A, 114–121.
Newell, R. E., and Y. Zhu, 1994: Tropospheric rivers: A one-year
record and a possible application to ice core data. Geophys.
Res. Lett., 21, 113–116.
——, N. E. Newell, Y. Zhu, and C. Scott, 1992: Tropospheric rivers?—
A pilot study. Geophys. Res. Lett., 19, 2401–2404.
Nobre, C. A., P. Sellers, and J. Shukla, 1991: Amazonian defor-
estation and regional climate change. J. Climate, 4, 957–988.
Onogi, K., and Coauthors, 2007: The JRA-25 Reanalysis. J. Meteor.
Soc. Japan, 85, 369–432.
Peixoto, J. P., and A. H. Oort, 1992: Physics of Climate. American
Institute of Physics, 520 pp.
Salio, P., M. Nicolini, and A. C. Saulo, 2002: Chaco low-level jet
events characterization during the austral summer season.
J. Geophys. Res., 107, 4816, doi:10.1029/2001JD001315.
——, ——, and E. Zipser, 2007: Mesoscale convective systems
over southeastern South America and their relationship with
the South American low-level jet. Mon. Wea. Rev., 135, 1290–
1310.
Saulo, C., M. E. Seluchi, and M. Nicolini, 2004: A case study of
a Chaco low-level jet event. Mon. Wea. Rev., 132, 2669–2683.
——, J. Ruiz, and Y. G. Skabar, 2007: Synergism between the low-
level jet and organized convection in its exit region. Mon. Wea.
Rev., 135, 1310–1326.
Seluchi, M. E., A. C. Saulo, M. Nicolini, and P. Satyamurty, 2003:
The northwestern Argentinean low: A study of two typical
events. Mon. Wea. Rev., 131, 2361–2378.
Siqueira, J. R., and L. A. T. Machado, 2004: Influence of the frontal
systems on the day-to-day convection variability over South
America. J. Climate, 17, 1754–1766.
Uppala, S., and Coauthors, 2005: The ERA-40 Re-Analysis. Quart.
J. Roy. Meteor. Soc., 131, 2961–3012.
Zhu, Y., and R. E. Newell, 1998: A proposed algorithm for moisture
fluxes from atmospheric rivers. Mon. Wea. Rev., 126, 725–735.
556 J O U R N A L O F C L I M A T E VOLUME 25

Copyright of Journal of Climate is the property of American Meteorological Society and its content may not be
copied or emailed to multiple sites or posted to a listserv without the copyright holder's express written
permission. However, users may print, download, or email articles for individual use.