Best practices and lessons learned in humanitarian settings ...

CONCEPTS, REVIEWS AND SYNTHESES
Jean Pierre H. B. Ometto Æ Antonio D. Nobre
Humberto R. Rocha Æ Paulo Artaxo Æ Luiz A. Martinelli
Amazonia and the modern carbon cycle: lessons learned
Received: 2 July 2004 / Accepted: 28 January 2005� Springer-Verlag 2005
Abstract In this paper, we review some critical issuesregarding carbon cycling in Amazonia, as revealed byseveral studies conducted in the Large Scale BiosphereAtmosphere Experiment in Amazonia (LBA). We eval-uate both the contribution of this magnificent biome forthe global net primary productivity/net ecosystem ex-change (NPP/NEE) and the feedbacks of climate changeon the dynamics of Amazonia. In order to placeAmazonia in a global perspective and make the carbonflux obtained through the LBA project comparable withglobal carbon budgets, we extrapolated NPP/NEE val-ues found by LBA studies to the entire area of theBrazilian Amazon covered by rainforest. The carbonemissions due to land use changes for the tropical re-gions of the world produced values from 0.96 to2.4 Pg C year�1, while atmospheric CO2 inversionmodels have recently indicated that tropical landsin the Americas could be exchanging a net0.62±1.15 Pg C year�1 with the atmosphere. The dif-
ference calculated from these two methods would implya local sink of approximately 1.6–1.7 Pg C year�1, or asource of 0.85 ton C ha�1 year�1. Using our crudeextrapolation of LBA values for the Amazon forests(5 million km2) we estimate a range for the C flux in theregion of �3.0 to 0.75 Pg C year�1. The exercise heredoes not account for environmental variability acrossthe region, but it is an important driver for present andfuture studies linking local process (i.e. nutrient avail-ability, photosynthetic capacity, and so forth) to globaland regional dynamic approaches.
Keywords Amazonia Æ Carbon cycle Æ Deforestation ÆClimate changes
Introduction
The sources and magnitudes of the major drivers of theglobal carbon cycle have changed since the beginning oflast century, when the atmospheric carbon dioxideconcentration started to rise consistently due to globalemissions from fossil fuel and biomass burning (Schimel1995). In the last few decades, a series of studies startedto lay out the processes that could account for the fate ofthis additional carbon introduced into the atmosphere.However, the sum of fossil fuel and biomass burningemissions is higher than the balance of the carbondioxide accumulated in the atmosphere and absorbed bythe ocean and terrestrial biomes (Houghton et al. 1998).This budget mismatch between global sources and sinks,initially called ‘‘the missing carbon sink’’, led to years ofarguments about where the unaccounted sink could lie.Some hypotheses considered that the oceans could takemore carbon dioxide than originally thought (Bousquetet al. 2000; Tans et al. 1990; Conway et al. 1994; Ciaiset al. 1995). Others considered that the missing carbonwas taken up by terrestrial ecosystems, via photo-synthesis, but there were considerable difficulties incalculating precisely how much (Fan et al. 1998).
Communicated by Jim Ehleringer
J. P. H. B. Ometto (&) Æ L. A. MartinelliLaboratorio de Ecologia Isotopica—CENA/USP,Av. Centenario, 303, 13416-000 Piracicaba,SP, BrazilE-mail: [email protected]: [email protected]
A. D. NobreINPA escritorio de representacao no INPE,Instituto Nacional de Pesquisas da Amazonia,Av. dos Astronautas, 1758 Sao Jose dos Campos,SP, 12227-010 BrazilE-mail: [email protected]
H. R. RochaDepartamento de Ciencias Atmosfericas, Instituto Astronomico,Geofısico e de Ciencias Atmosfericas, Universidade de Sao Paulo,Rua do Matao 1226, 05508-900, Sao Paulo, SP, BrazilE-mail: [email protected]
P. ArtaxoInstituto de Fısica, Universidade de Sao Paulo, Rua do Matao,Travessa R, 187 05508-900, Sao Paulo, SP, BrazilE-mail: [email protected]
Oecologia (2005)DOI 10.1007/s00442-005-0034-3

Additionally, global modeling studies have also calcu-lated an increase in the rate of atmospheric CO2 accu-mulation throughout the past century (Cox et al. 2000;Itoand Oikawa 2000; White et al. 2000).
The tropical rain forest biome plays an importantrole in the global carbon budget (Melillo et al. 1993;Dixon et al. 1994; Field et al. 1998), but there is greatuncertainty about the ecosystem’s current and futureimpact on atmospheric CO2 accumulation (Tian et al.2000; Schimel et al. 2001; Cox et al. 2000). There is noclear understanding of how the carbon balance oftropical forests responds to rapid, on-going changes inclimate and atmospheric composition (Gash et al. 2004).In addition, more studies relating the role of nutrientlimitation, such as nitrogen and phosphorus, to ecosys-tem carbon uptake (Vitousek 1984; Vitousek et al. 1986;Chadwick et al. 1999) are needed. Based on the recordsof atmospheric CO2 concentrations and carbon isotoperatios (13CO2), Townsend et al. (2002) suggested a siz-able terrestrial carbon sink in tropical latitudes for aperiod from 1991 to 2000.
Climate forcing, such as changes in precipitation(Marengo et al. 2001) and radiation (Procopio et al. 2004)also play a key role on future carbon exchange scenarios.With continuing global warming, significant changes inwater regimes could influence carbon budget in tropicalforests (Victoria et al. 1998; Malhi and Wright 2004). Abetter understanding of the nonlinear and complex inte-grated effects of nutrients, climate, and hydrology oncarbon cycling is needed to improve global processmodelsbeing used to project future atmospheric CO2 levels andclimate (Prentice et al. 2001; Cox et al. 2000).
Since the 1980s, there was a large increase in tropicaldeforestation followed by biomass burning. The carbondioxide released from this burning has become critical forthe global carbon balance equation. The role of theAmazon region, the largest continuous area of tropicalforest in the world, came to the foreground in the globalcarbon quest. Several studies began estimating the areaand rate of deforestation. The use of different remotesensing techniques to calculate the extent of the defor-ested areas produced heated controversy (Fearnside1996), but considerably improved our understanding ofthe magnitude and rates of this process in this region(Fearnside 1997; Houghton et al. 2000). The averagedeforestation rate for the nineties was 17,000 km2Æyear�1,increasing to approximately 25,000 km2 in 2002 and 2003(INPE 2004). By 2004, an estimated of 16.32% of thetotal Brazilian Amazon area (5.8 million km2) will bedeforested (INPE 2004). Most of this process is concen-trated in the southern and eastern part of Amazonia,while the central, less accessible areas, are relativelyprotected. However, recent government plans for pavingroads and developing infrastructure (Laurance et al.2001), associated with increasing presence of highlycapitalized agribusiness companies, threat central areasin a very near future (Soares-Filho et al. 2004).
Our understanding of the probable fate of the‘‘missing’’ carbon had progressed considerably towards
the end of the 1990s, with evidence indicating that sec-ondary forest regrowth in temperate forests was con-tributing to the terrestrial C sink. Also, extensive fieldstudies, mainly in temperate terrestrial ecosystems, andlarge scale atmospheric surveys, associated with model-ing efforts, indicated that the actual atmospheric carbondioxide concentration, combined with excess nitrogendeposition, could be fertilizing ecosystems and increas-ing the carbon uptake through photosynthesis (Schimel1995; Tans et al. 1998). However, the precise locationand magnitude of these sinks remained unknown. Thisled to several studies focusing on the potential distri-bution of terrestrial sinks (Friedlingstein et al. 1995;Melillo et al. 1996; Thompson et al. 1996; McGuire et al.1997). Due to their high biomass density, tropical forestswere a natural candidate for a large sink component.Several modeling studies clearly supported this hypoth-esis (Friedlingstein et al. 1995; Melillo et al. 1996;Thompson et al.1996; McGuire et al.1997). Therefore,Amazonia was considered to be a potentially significantplayer in the global carbon cycle as either a sink orsource, mainly due to the large amount of carbon storedin its biomass and large annual fluxes from photosyn-thesis, respiration, decomposition and fire.
The Brazilian scientific community realized that itwas time to develop a large integrated program devotedto studying ecological functioning of the Amazon re-gion, especially considering its role in the modern car-bon cycle. This was promptly supported by Americanand European colleagues. In 1997, the Large ScaleBiosphere–Atmosphere Experiment in Amazonia(LBA), a Brazilian-led, multinational study of theinteractions between the Amazonian region and theglobal climate system, was officially launched. Twomajor questions drove LBA investigations: (1) how doesAmazonia currently function as a regional entity? (2)how will changes in land use and climate affect thebiological, chemical, and physical functions of Amazo-nia, including the sustainability of development in theregion and the influence of Amazonia on Global cli-mate? (http://lba.inpa.gov.br/lba)
The long-lasting ecological paradigm, that maturetropical forests should be at climax, i.e. over time the netgain of carbon should near zero, presumed the existenceof a dynamic mass balance in old growth forests.However, the first conclusive direct measurements ofecosystem CO2 exchange conducted in Amazonia usingeddy covariance technique (Grace et al. 1995a, b; 1996;Malhi et al. 1998), suggested a large net carbon uptakeof 1–6 t C ha�1 year�1. Therefore, the presumption ofmass balance in primary forests was under question.These first measurements led to the speculation ofwhether pristine Amazon forests could be functioning asa giant carbon sink. An unforeseen sink in the tropicalforests of the world, and in Amazonia in particular,could resolve the geographical mystery of the missingcarbon sink. However, many researchers were skepticalabout the magnitude of the sink predicted by these earlyeddy flux data. As a result, an intense review of the eddy
covariance method, including the applicability of scalingfrom the measuring site to the region, was initiated. Thisongoing review has already pointed to difficulties inmeasuring CO2 emissions in the very stable atmospherethat develops in tropical forests (Kruijt et al. 2004;Baldocchi et al. 2000), and shown large local heteroge-neity of ecosystems (Araujo et al. 2002; Saleska et al.2003). In parallel, a large effort in compiling long-termbiomass changes in forest stands across the Amazon andaround the tropical world sought to ascertain the sink orsource status of carbon in primary forest vegetation(Phillips et al. 1998). These efforts were not yet clarifiedbeyond doubt the overall role of Amazonia as a sink orsource.
The main objective of this paper is to provide acritical overview of facts and uncertainties, and raisepotential implications of what we have learned so farregarding the role of Amazonia in the modern carboncycle. We will start with a review of the extent ofdeforestation in Amazonia, including estimates of howmuch carbon was released into the atmosphere throughland use changes. This will be followed by a review ofmethods used to estimate the net ecosystem exchange(NEE) in the region, and ecological implications of theestimates found thus far.
Amazonia: the modern carbon budget and deforestation
One of the most recent equations for the global carbonbudget proposed by House et al. (2003) during the 1990sshowed the following numbers.
– Emissions mainly from fossil fuel burning:+6.3±0.4 Pg C year�1
– Emissions due to land-use change: +1.4–3.0 Pg C year�1
– Atmospheric increase: +3.2±0.1 Pg C year�1
– Ocean–atmosphere flux: �2.1±0.7 Pg C year�1
– Land–atmosphere flux: �1.0±0.8 Pg C year�1
– Residual terrestrial sink: �1.6 Pg to�4.8 Pg C year�1
As mentioned earlier, tropical forests are probablythe only major biome that may play an important role inboth sides of the global carbon balance budget shownabove. For instance, the Amazon forest vegetation inBrazil alone contains about 70 Pg of carbon, whichamounts to between 10% and 15% of global terrestrialbiomass (Houghton et al. 2001). Overall, causes fordeforestation in tropical areas are numerous and com-plex, most of them linked to economical and social
Amazonia deforestation in km² per year 1977-2003Landsat image analysis INPE-IBAMA
21050
17770
13730
11130
1378614896
29059
18161
13227
1738317259 18226 18166
23266 23750
0
5000
10000
15000
20000
25000
30000
35000
77/88
*
88/89
89/90
90/91
91/92
92/94
94/95
95/96
96/97
97/98
98/99
99/00
00/01
01/02
02/03
Def
ore
stat
ion
rate
inK
m²
per
year
Forest fires in Amazonia 1999 - 2003NOAA12 21:00 GMT - INPE - IBAMA
0
50000
100000
150000
200000
250000
1999 2000 2001 2002 2003
Nu
mb
ero
fho
tsp
ots
per
year
(a)
(b)
Fig. 1 a Deforestation rate inthe Brazilian Amazonia inKm2Æyear�1. Analysis usingLandsat images by INPE/IBAMA (http://www.inpe.br).b Number of hot spots inAmazonia, from 1999 to 2003.Data obtained by INPE/IBAMA using the satelliteNOAA 12, passing overAmazonia at 21:00 GMT

processes (see Hecht 1993; Margulis 2003; Nepstad et al.2002; Walker and Moran 2000; Andersen et al. 2002).Road construction in pristine areas, cattle ranching,logging and agriculture are the main economic activitiesleading to deforestation (Nepstad et al. 2001). Recently,Hirsch et al. (2004) proposed the carbon and land-usechange (CARLUC) model and calculated a cumulativecarbon release to the atmosphere due to deforestation of�7 Pg C for the period from 1970 to 1998 in the Bra-zilian Amazon. This expansion of deforested areas re-flected a large population increase in the region, fromabout 100,000 in 1840 to 1.5 million in 1940, up to about18 million nowadays (Instituto Brasilieiro de Geografiae Estatıstica, IBGE; http://www.ibge.gov.br, Brazil),with more than 50% of people living in villages andcities (Browder and Godfrey 1997).
According to measurements based on satellites ima-ges (http://www.inpe.br) the deforested area in theBrazilian Amazon was approximately 600,000 km2 inAugust 2002. The Instituto Nacional de Pesquisas Es-paciais (INPE) defines deforestation as ‘‘the conversionof primary forest areas by human activities for thedevelopment of agriculture and/or cattle ranchingactivities, as detected by orbiting satellites’’. Anotherway to measure the deforested area is through ground-based land surveys done by IBGE Agricultural Censusin Brazil. Andersen et al. (2002) presented an interestingcomparison between these two methods. Estimations ofdeforested areas were generally larger based on surveysthan when estimated by satellite data, probably becausesatellites detect gross deforestation and whereas surveysrecord the net deforestation, taking into account the re-growth of secondary forests (Andersen et al. 2002;Margulis 2003). Most of the deforestation occurs inprimary forests, with grasses as the main replacingvegetation. Margulis (2003) suggested that planted pas-tures covered approximately 70% of the deforested areain Amazonia. Considering that fallow areas are usedalso for pasture, this estimate increase to almost 90%. Itis also a consensus that most of the deforestation occursalong roads (Nepstad et al. 2001; Carvalho et al. 2001).Chomovitz and Thomas (2001) have calculated that
75% of all deforestation occurred within a 25 km-wideswath along the roads.
The first deforestation survey was carried out byINPE in 1977, and the second 10 years later (1988), afterwhich annual surveys were performed. For the period1977–1988, the average deforestation rate was close to21,000 km2 year�1 (Fig. 1). In the subsequent years, thisrate dropped to a minimum of 11,000 km2 year�1,increasing again and reaching a record of almost30,000 km2 year�1 in 1994/1995. For several yearsthereafter the rates decreased and stayed relativelyconstant, at around 17,000–18,000 km2 year�1, increas-ing again to 25,000 km2 year�1 in the 2001–2003 period(Fig. 1b).
Four States of the so-called Brazilian Legal Amazonwere responsible for more than 80% of deforestation(Fig. 2). One of the explanations for this trend lies in thegreater exposure of the forest in its eastern and southernfringes to access from northeastern and southern regionsof Brazil. Policies for occupation and developmentestablished by the military government in the 1970s and1980s generated several destructive actions in the forest.Nowadays, the State of Mato Grosso has the biggestgross agricultural production in Brazil. In Para andMaranhao States the expansion of soy bean agricultureis pushing cattle ranching still further into the forests.Road construction and paving have also allowed a fastexpansion of deforestation in Rondonia and Acre.
Satellite observations of local regions of heat, or ’hotspots’, created by the burning of cleared vegetation, areused as a proxy for deforestation in the region (Fig. 3)(http://www.inpe.gov.br). Maranhao State showed thelowest deforestation rates (Fig. 4), most likely becausethe bulk of deforestation in this State occurred prior tothe start of monitoring in 1977. The highest rates ofdeforestation were observed in Mato Grosso State,mainly after 1990/1991 (Fig. 4), although the largestdeforested area is located in Para State. During the1994/1995 burning season, the largest deforestation ratewas observed indicating that, whatever caused this peak,it was a phenomenon observed all over the region(Fig. 4) (http://www.inpe.gov.br.).
0
5
10
15
20
25
30
35
Pará
Mat
oGro
sso
Mar
anhão
Rondôn
ia
Amaz
onas
Tocan
tins
Acre
Roraim
a
Amap
á
Per
cen
tual
con
trib
uti
on
of
each
Sta
teto
tota
ld
efo
rest
atio
nin
2001
Fig. 2 Percentage contributionof each State to totaldeforestation in the BrazilianLegal Amazonia region in 2001(http://www.inpe.br)

Estimates of deforestation provide only one com-ponent to assess carbon emissions. One also needs toknow the standing biomass and the fraction of bio-mass released through burning immediately and alsoslowly over time. The difficulties and uncertainties ofbiomass estimates in tropical forests will be discussedin a later section of this article. Here, we will onlysummarize the available information in order toillustrate our lack of knowledge on quantifying thisparameter, and how it affects estimates of carbonemissions.
Houghton et al. (2001) summarized 44 sites inAmazonia where biomass was measured. They found arange of above-ground live biomass from 95 ton ha�1
to 413 ton ha�1. One year later, Chambers et al.(2001b) made one of the most popular allometricequation available for the Amazon basin. This equa-tion was obtained in central Amazonia, near the city ofManaus by harvesting 315 trees distributed in five plotsof 0.04 ha each. This equation and others were used by
Baker et al. (2004a, b) to estimate the above-groundbiomass in 59 forest sites. They found values varyingfrom 124 ton ha�1 to 320 ton ha�1 across severaltransects. Houghton et al. (2001) summarized datafrom seven different biomass estimates for the BrazilianAmazonian forest and showed an average of269±86 ton ha�1. The original biomass estimateby Baker et al. (2004a, b) found 282±57 ton ha�1,approximately 4% lower than the average valuedetermined for measurements conducted 7–10 yearslater, at the same plots (294± 55 ton ha�1). Poolingboth data sets together, the average of abovegroundbiomass in Amazonia can be estimated as283±66 ton ha�1. The frequency distribution of theaboveground biomass estimates can be seen in Fig. 5.Houghton et al. (2001) also summarized estimates foraboveground dead biomass and below ground biomass(live and dead not distinguished), representing 9% and21% respectively of the total forest above ground livebiomass. Therefore, adding 30% (accounting for dead
Fig. 3 Lower panel a satelliteimage of Brazilian LegalAmazonia with focus of heat inthe 1998 burning season (http://www.ibama.gov.br). The starsmarkers indicate eddycovariance towers sites. Upperpanel map of Brazil with Statedivisions. In gray the four stateswhere deforestation is moreintense
0
2000
4000
6000
8000
10000
1200077
/88
88/8
9
89/9
0
90/9
1
91/9
2
92/9
4
94/9
5
95/9
6
96/9
7
97/9
8
98/9
9
99/0
0
00/0
1
MA
MT
PA
RO
Fig. 4 Deforestation rates inthe four main States of theBrazilian Amazonia region.These four States contributeswith more than 80% ofdeforestation in the region(http://www.inpe.br)

and bellow ground biomass) to the living abovegroundbiomass the estimated average for the total ecosystembiomass would yield from 126 ton ha�1 to537 ton ha�1 in the Amazonian forests.
Considering the rates of deforestation between 1988and 1998, the total biomass of Brazilian Amazonianforest, and the amount of carbon stored in the re-growing vegetation, it was possible to estimate the an-nual emission of carbon to the atmosphere. The averageflux for this period was 0.18±0.08 Pg C year�1
(Houghton et al. 2000). If one accounts for loggingactivities and natural fires, the range of emissions can becalculated as 0.10–0.40 Pg C year�1 (Houghton et al.2000). This range would account for approximately 15–65% of the higher estimates of carbon emission forTropical Latin America in the 1990s (0.62 Pg C year�1),and for 7–30% of the upper estimates of carbon emis-sion for tropical areas globally (1.62 Pg C year�1) forthe same period (DeFries et al. 2002). The global emis-sions due to land-use changes varies from1.4 Pg C year�1 to 3.0 Pg C year�1, considering the lastestimate of 2.18 Pg C year�1 made by Houghton (2003),the land-use change in Amazonia would be responsiblefor approximately 5–20% of global emissions. TheAmazon region (�7.0 million km2) covers an areaequivalent to 4.7% of the terrestrial area of the planet(150 million km2). Assuming that deforestation has al-ready burned approximately 9% (0.6 million km2) ofthe region implies that an area equivalent to approxi-mately 0.40% of the planet should be responsible for asignificant share of the global carbon emissions due toland-use changes.
Indirect effects of Amazonian deforestationon atmosphere composition and land–atmospherecarbon exchange
Changes in atmospheric composition—radiationand precipitation
Deforestation affects the atmosphere in several ways.First, there is a change in the energy and water balancewhen forest is replaced by pasture and this change hasthe potential to alter the atmospheric water content andprecipitation patterns (Silva Dias et al. 2002). Second,when forests are cut and burned, large amount of par-ticles and reactive trace gases are released into theatmosphere. This can lead to profound changes in theatmospheric composition (Andreae et al. 2002).
Most global circulation models simulated a decreasein the precipitation over Amazonia as a result ofdeforestation (Marengo and Nobre 2001), but thesemodels have a very coarse resolution, and local pro-cesses and interaction between the land and atmospheredue to heterogeneity of the landscape cannot be properlyassessed. New high-resolution mesoscale models wereused to investigate the impact of land use change inAmazonia (Avissar et al. 2002), and they also simulateda decrease in precipitation due to deforestation. How-ever, one recent study suggested that deforestation inportions of the region can lead to locally increasedprecipitation (Baidya Roy and Avissar 2002). This raisesthe hypothesis that there is a threshold of extent anddistribution deforestation that leads to a precipitationdecline (Avissar et al. 2002).
In addition to changes in the overall amount of pre-cipitation, models have demonstrated that the patternsof precipitation over Amazonia are changing due todeforestation. Under forested conditions, low concen-trations of aerosol particles prevail in Amazonia and amaritime-type cloud regime is formed in the region(Williams et al. 2002). This phenomena inspired atmo-spheric scientists to nickname Amazonia as the ‘greenocean’ (Andreae et al. 2004). Due to biomass burning,the aerosol concentration increased abruptly in someregions of Amazonia (Artaxo et al. 2002).
It is becoming clear that the Amazonian ecosystem isvery sensitive to global climate forcing agents such as ElNino, regional changes in precipitation patterns andglobal warming (Marengo and Nobre 2001). Fire risk isamong those sensitive to climate, but fire is also affectedby management (Nepstad et al. 2001). The potential forfire to spread from deforested areas into fragmentedforests represents a threat to long-term ecosystem healthand sustainability (Cochrane et al. 1999; Cochrane andLaurance 2002). Logging thins the canopy, increasessunlight penetration to the understory and facilitatesburning of the forest floor. After an Amazonian foreststand burns once, the reduced canopy cover and in-creased penetration of solar radiation increases theprobability that fire will be able to spread through the
0
10
20
30
40
50
60
100 150 200 250 300 350 400 More
AGLB (ton/ha)
Fre
qu
ency
0%
20%
40%
60%
80%
100%
120%
Cu
mu
lativ
ep
erce
nta
ge
Fig. 5 Frequency (left axis) and cumulative percentage distributionof aboveground live biomass. Date included 44 sites summarized byHoughton et al. (2001) and 59 sites summarized by Baker et al.(2004). The date from Baker et al. (2004) included the originalmeasurement made 7–10 years ago and also the most recentbiomass measurement

stand again (Cochrane et al. 1999). The interactions ofclimate, management and fire susceptibility produceseveral mechanisms of positive feedback that may leadto further forest degradation, fire risk, and negativeeconomic and human health consequences (Nepstadet al. 2001).
Emissions of volatile organic carbon
Tropical forests release substantial quantities of biogenicvolatile organic compounds (VOCs) to the atmosphere(Guenther et al. 1995). VOC release is important to theecosystem carbon balance (Crutzen et al. 1999; Kes-selmeier et al. 2002a). A full accounting of the influenceof VOCs on ecosystem carbon budgets must considerboth sources and sinks for these compounds and thereaction products of VOCs including atmospheric par-ticulates. One of the key issues here is the large biodi-versity of Amazonia, because VOC emissions (such asisoprene and a-pinene emissions) are specie-dependent(Guenther et al. 1995). Greenberg et al. (2004) andHarley et al. (2004) employed tethered balloon and leafmeasurements approach to study the distribution ofVOCs in Amazonia. Similar to the threefold variationthat Malhi et al. (2004) reported for woody biomassproduction across the basin, these authors found athreefold variation in emission rates of VOCs acrossdifferent regions, and they attributed this variation todiverse species composition. Also significant seasonalvariability is found, with Kuhn et al. (2002, 2004)reporting up to a twofold difference in isoprene emis-sions between wet and dry seasons in Rondonia. Due todiversity of environments and species richness, we canexpect to find similar variability in other regions inAmazonia.
Canopy emissions of VOCs amount to a few percentof net primary productivity (Guenther 2002; Kesselme-ier et al. 2002a; Wiedinmyer et al. 2004), but their effectson atmospheric chemical processes and physical climateprocesses far exceed their modest contribution to the Ccycle. Recently, Clayes et al. (2004) showed that isopreneemissions in Amazonia could make up a significantfraction of cloud condensation nuclei and thus have arole in precipitation patterns. Biogenic hydrocarbons arecritically important in the regulation of concentrationsof ozone, hydroxyl radical and other important tracegases and radicals in tropical atmospheric chemistry(Andreae et al. 2001). Terpenes are precursors of radi-ation forcing aerosol particles, which also act as cloudcondensation nuclei, but terpene concentrations amountto only a few parts per billion in several sites inAmazonia (Kesselmeier et al. 2002b). Still, part of theprecipitation formation mechanism could be controlledby the vegetation itself through isoprene and terpeneemissions (Artaxo et al. 2002; Clayes et al. 2004). Hence,links between the biosphere and the atmosphere appearto be extremely complex, with climate affecting VOCemissions and vice versa in a highly non linear process
(Kesselmeier et al. 2000, 2002a, b; Wiedinmyer et al.2004).
Measurements of carbon exchange at the ecosystem level
Eddy covariance studies
The accurate measurement of trace gas exchange at theEarth’s surface is important in order to evaluate eco-system functioning and to show environmental andprocess changes such as CO2 fluxes, climate fluctuation,atmospheric chemistry, or nutrient cycling. Amongseveral techniques the eddy correlation, or eddycovariance, is one of the most direct and useful. Eddycorrelation can be used to validate surface vegetation–atmosphere transfer schemes, and thus improve climateand ecosystem predictability. The exchange rate of CO2
across the interface between the atmosphere and a forestcanopy is determined through measuring the covariancebetween fluctuations in vertical wind velocity and CO2
mixing ratio (Baldocchi 2001, 2003). These exchangesmeasured by flux towers have taught a few remarkablelessons:
– Atmospheric CO2 fluxes showed seasonal variability,linked to basin scale spatial variability of climate andlocal scale biogeochemistry.
– Surface energy partition and evapotranspiration areoften tied to the CO2 flux variability.
– Structural differences between the tropical forests andCerrado (savanna) physiognomies, or pasturelands,were corroborated by measured fluxes.
– Wetlands function substantially different from drylands. Wetland contribution might be related to thecarbon budget of the entire basin, and dependent onthe flood-pulse variability.
– Site-specific characteristics (e.g. geomorphology, pastdisturbances) constrain the measured CO2 flux vari-ability.
– The combination of annual accumulation of CO2
fluxes with biometric measurements can help infer thesink or source role of a plant community, regardless ofits transient daily character.
Although eddy covariance technique has providedreliable measurements of bulk photosynthesis and res-piration of temperate forest sites (Baldocchi et al. 1997;Jarvis et al. 1997), there are situations where its capacityto provide accurate integrated measurements of netcarbon exchange is uncertain. The uncertainties stem-med from difficulties related to (1) night time fluxes,when respired CO2 tend to accumulate within the forestcanopy and intermittent updraft events transfer it to theatmosphere in a complex spatial pattern not consistentlycaught by the flux tower sensors (Staebler and Fitzjarr-ald 2004), and (2) an irregular topography, where lateralCO2 advection to lower positions on the landscape, canresult in CO2 draining out from the eddy covariancetower footprint (Araujo et al. 2002).

Since last decade, the continuous use of eddycovariance technique and microclimate measurementshas amassed an impressive body of information on theCO2 and water vapor cycle within Amazonian bound-aries (Fig. 3). Variability in seasonal CO2 flux of terrafirme forests was noticed among sites of eastern (Caxi-uana, Tapajos), central (Cuieiras) and southern (Jaru)regions of the Amazon basin. At Tapajos and Caxiuana,there was no evidence of drought stress during the dryseason as evapotranspiration peaked concurrently withdecreasing cloud cover and increasing surface net radi-ation (Carswell et al. 2002; Rocha et al. 2004). MinimumNEE peaked before the wet season (nearly October) atthe eastern sites, where carbon was taken up in the dryseason and released in the wet season, based on 3 yearsof observation (2000–2003) (Saleska et al. 2003; Carswellet al. 2002; Goulden et al. 2004)). This pattern was ex-plained by an increase in soil respiration (and woodbiomass) in the wet season, and a substantial reductionin the dry season, while gross ecosystem productivity(GEP) responded weakly on a seasonal basis. GEP waslowest in July, when the incoming solar radiation is alsolowest. The net carbon uptake peak late in the dry sea-son and the minimum GEP are partly explained by theflushing of new leaves and the innate seasonal rhythmsof the vegetation (Goulden et al. 2004). Events like thereduction of precipitation due to ENSO warm episodes,can cause a reduction in net primary productivity (NPP)as evidences shown by Townsend et al. (2002), enhanc-ing the seasonality on CO2 fluxes in Amazonia.
Among the sites previously mentioned, at Cuieirasthe average NEE shows a weak seasonal variability,suggesting a lower average carbon uptake in the dryseason (�17 lmol CO2 m�2 s�1) relative to the wetseason (�21 lmol CO2 m�2 s�1) (Malhi et al. 1998;Araujo et al. 2002). As opposed to Tapajos, at Cuieiras,there appeared to be limited reduction of soil respirationin the dry season. This could be related to the shorterdry season length in the Manaus region (� July–Octo-ber) than in Tapajos (�July–December). Given that,observations at Cuieiras were taken partly over poorlydrained valleys (contrasting to the observations overflatter and well-drained plateaus at Tapajos), where soilssaturate more often (Chambers et al. 2004), a shortestdry season could prevent large moisture depletion(Davidson et al. 2000). This combined with small butsignificant increases in air and soil temperatures, couldprevent a large soil respiration reduction. Possibly alsorelated to different dry season lengths, the seasonalamplitude of NEE appeared larger in Tapajos(�700 kg C ha�1 month�1) than in Cuieiras(�150 kg C ha�1 month�1) (Saleska et al. 2003; Araujoet al. 2002).
At Jaru site, net carbon uptake is reduced continu-ously throughout the dry season (June–August), as op-posed to Tapajos, and with larger seasonal amplitudethan Cuieiras (Kruijt et al. 2004; von Randow et al.2001). This pattern, observed at Jaru transitional tropi-cal forest, is influenced by recurrent cooler temperatures
(�13�C) in the winter, and responds similarly to semi-deciduous forests, where leaf senescence is pronouncedin the dry season. Culf et al. (1996) reports increasingsolar albedo during May–August at the Jaru site, con-current with soil moisture depletion, which partly ex-plains the changes in phenology and the CO2 fluxes. Theauthors observed a similar variation in albedo in theManaus region (Reserva Ducke forest), although sea-sonality in CO2 fluxes was less evident in Cuieiras so far.
Over the Cerrado sites (savannas to the South), a netcarbon uptake clearly occurs during the wet season,whereas strong positive NEE occurs in the late dryseason. This pattern is markedly shown in the transi-tional mature forest (Cerradao) (11.5�S) (Vourlitis et al.2001) and over a Cerrado restrito site in Brasilia (16�S)(Miranda et al. 1996). Vourlitis et al. (2004) stress theremarkable reduction in evapotranspiration during thedry season over Cerradao. Vourlitis et al. (2001) showedthat the NEE of Cerradao was similar to that of tropicalrainforest during the wet season (a net sink between�0.6 lmol and �1.2 lmol CO2 m
�2 s�1, during Feb-ruary and April), but during the dry season it was moresimilar to that reported for tropical savanna, being inbalance during August–September, and a net source of0.6 lmol and 1.7 lmol CO2 m
�2 s�1 during October–November. A comparable variability was observed overa Cerrado restrito site down in southeast Brazil (18�S)(Rocha et al. 2002). This is very suggestive that despitethe latitudinal and climate differences among sites,adaptive mechanisms of these species can exert a largeand common control on the carbon exchanges for theCerrado biome.
Over dry forests, plant gross primary productivity(GPP) increases during the wet season, as seasonaldrought results in a negative water balance in the treesand a reduction in stem growth. In seasonally floodedforests, however, tree growth occurs during the terres-trial (dry) phase (Dezzeo et al. 2003; Schongart et al.2002), as flooding causes leaf shedding. It is predictedthat GPP starts to increase at the end of the aquaticphase, when the leaves flush. Interannual variability alsoincreases plant GPP, in these forests, as a reduction inprecipitation by ENSO warm episodes in eastern andcentral Amazonia reduce the period of inundation(Schongart et al. 2004). Atmospheric NEE observationsin the Bananal Island (characterized by a seasonallyflooded ecotone Cerradao-Cerrado-campo) show areduction in ecosystem nocturnal respiration during theaquatic phase (February–April) and consequentlyincreasing ecosystem carbon uptake (H. Rocha inpreparation).
Conversion of tropical forests to pasturelands inAmazonia reduces evapotranspiration, mostly in the dryseason (Wright et al. 1992), and the moisture status inthe root zone (Hodnett et al. 1995). The control ofcarbon exchanges become variable and largely depen-dent of the crop physiology and management. Sakaiet al. (2004) measured the turbulent CO2 fluxes overagricultural fields in Santarem, in a succession of pas-

ture, plowed bare soil and a rice plantation. They ob-served a larger average carbon uptake over the riceplantation (non-irrigated) (�7.0±0.5 lmol CO2 m
�2
s�1) compared to the pasture (�2.3±0.5 lmolCO2 m
�2 s�1 in the wet season and �1.6±0.2 lmolCO2 m
�2 s�1 in the dry season). Plowed bare soil inbetween these two plantations showed an average loss of1.8±0.5 lmol CO2 m
�2 s�1.While it seems unlikely that as large a carbon uptake
as 6 Mg C ha�1 year�1 reflects a steady ecosystem state(Chambers et al. 2001b), it is also not obvious that thesum of instantaneous CO2 fluxes always provides arealistic estimate of average net ecosystem production.Lack of air turbulence and insufficient mixing of CO2
from canopy respiration during the night often is cor-rected with the measurement of a storage term. Thesecorrected fluxes are intended to achieve better accuracyin estimating the amplitude of diurnal and seasonal cy-cles and the variability among sites in Amazonia.
However, the generally presumed conditions of flatand drainage-free surfaces along the tower fetch arerarely found. Thus, local topography and air-mass cir-culation are crucial (Araujo et al. 2002). Accounting forthese site-specific problems is not trivial (Staebler andFitzjarrald 2004). The hypothesis that low turbulenceduring nighttime is correlated proportionally to drain-age losses, suggests that the use of thresholds based onturbulence scales (such as u* used in deciduous forests;Goulden et al. 1996) may be effective for some sites inAmazonia. This would allow the replacement of night-time low-turbulent events with well-mixed ones (Milleret al. 2004; Araujo et al. 2002; Saleska et al. 2003). Thismay improve the realism of the NEE annual sum(Saleska et al. 2003). However, the accurate applicationof turbulence filters to a given site’s data requiresparameters from other studies, such as using radon asproxy for CO2 transport within the canopy (Martenset al. 2004) or from direct measurement of in-canopyadvection (Staebler and Fitzjarrald 2004). Until theproblem of topography-related CO2 loss is properly re-solved, with the development of widely accepted eddy-flux correction methodology, site-dependent estimates ofNEE annual sums for Amazonian forests remainuncertain.
Biometry studies
The annual allocation of photosynthetic products towood growth is estimated from the annual biomassincrement in a forest stand. This is achieved eitherthrough repeated surveys of trees (Baker et al. 2004a, b)or through the use of dendrometer bands assigned torepresentative trees within the stand (Rice et al. 2004;Vieira et al. 2004). Such forest inventory plots were usedto infer average net storage in live biomass of undis-turbed tropical forests. However, these measurementsonly account for inter-annual and stand level variationsover a relatively short time scales and limited spatial
coverage. The evaluation of residence time for carbon invegetation is critical for carbon storage calculations,thus growth rates, stand and vegetation ages are essen-tial measurements for carbon dynamic studies. Hough-ton et al. (2000) observed that the previous biomass ofdeforested areas was the major uncertainty in the esti-mation of carbon flux to the atmosphere. The uncer-tainties in biomass estimates have several causes. Maybeone of the most important and difficult to solve is thenatural heterogeneity of tropical forests. According toThomaz (2000) there may be up to 35,000 species ofangiosperms in the Amazon basin. But the extent of thepotential diversity still to be found is unknown (Tuom-isto et al. 1995), and may render this last estimate aconservative one. Still, this number represents almost14% of all known angiosperms species in the globe,encompassed in an area equivalent to 4.7% of the landarea on Earth. While on one hand, such high biodiver-sity is a joy of life, on the other hand, it makes allometricbiomass measurement a logistical nightmare. As thereare hundreds of different individuals and species perhectare, it is expected high variability on form, height,wood density and structure within a site (Clark 2004).Besides this in-site variability there is also importantvariability among different regions due to differences insoil composition and climatic differences (Malhi et al.1999; Marengo and Nobre 2001).
Thus, the mega complexity of this ecosystem engen-dered several questions related to above ground biomassestimation (Keller et al. 2001; Brown et al. 1995). Themost common methods to tackle these questions are: (1)direct estimates by cutting and weighting all trees above10 cm diameter at breast height (DBH) over a relativelysmall area, generally smaller than 0.5 ha (Phillips et al.2004) or (2) indirect estimates by using allometricequations (Chambers 2001; Gerwing and Farias 2000;Brown et al. 1995). These equations are obtained bycutting and weighting a determined number of trees andrelating their biomass with DBH and height. Estimatesof biomass in Amazonia may involve scattered mea-surements of DBH and height over large areas, like themeasurements made by the RADAMBRASIL project orover small areas (generally smaller than 5 ha) (Hough-ton et al. 2001). Although it seems simple, measurementof parameters like DBH can be difficult in tropical for-ests, resulting in large errors in biomass estimation(Clark 2002). In addition, it seems that the choice of theright allometric equation is of fundamental importanceto reduce those errors (Chave et al. 2004). Most of thelive biomass, growth, mortality and recruitment mea-surements are taken on permanent forest transects, lo-cated in more representative parts of the studied forest.Normally, longer transects aims to incorporate spatialheterogeneity avoiding bias associated with small-scat-tered plots that can be disproportionately influenced byemergent trees (Rice et al. 2004). Brown et al. (1995)support the general idea that in tropical forests, theaboveground biomass is dominated by few large trees,showing as example a forest in western Amazonia where

trees with DBH above 60 cm account for 50% of thebiomass. In this transect, trees are identified and dend-rometers are placed in a random sub-sample within theplot, but distributed across taxonomic families and sizes.The dendrometers normally used are stainless-steelbands (Rice et al. 2004; Vieira et al. 2004) or automatedsystems (Miranda 2002; Silva et al. 2002). Baker et al.(2004a, b) produced three estimates based on above-ground measurements in plots. Their results were clus-tered in three groups: east and central plots; westernplots and floodplain plots. The east and central plotsshowed the smallest carbon gain(�0.37 ton C ha�1 year�1) and the floodplain forestplots the largest carbon gain (�1.2 ton C ha�1 year�1).
In recent study, Vieira et al. (2004) has illustrated ahigh diversity among three study plots located in terra-firme forests near Manaus, Rio Branco and Santarem(Table 1). The range in number of species per hectare inthese plots was similar to that in other 16 other plotssummarized by Oliveira and Nelson (2001) that show arange from 90 up to 285 species per hectare in Amazo-nian terra-firme forests.
An important aspect of aboveground biomass, espe-cially wood, is the residence time of carbon in this pool.This is related to functional group, forest stand, nutrientavailability and environmental conditions. Condit et al.(1995) have shown large increases in tree mortalityassociated with extremely dry conditions in tropicalforests. The difference in adaptation to extreme condi-
tions potentially leads to changes in how biomass isdistributed among different functional types (Philips andGentry 1994). Also, the accumulation of C in livingwood may be offset by tree mortality; hence the degreeto which a forest is acting as a source or sink of C to theatmosphere is not solely dependent on the growth rate ofliving wood. Understanding mortality, its spatial andtemporal distribution, and its relationship to climate anddisturbance (such as fire, for instance) are critical pointsto be considered when attributing mean life time fortrees on global models of climatic change. Chamberset al. (1998) found that the ages of emergent trees (DBHvarying from 80 cm to 240 cm) sampled near Manaus,central Amazonia, varied from 200 years to 1,400 years,although such millenary trees were not documentedby other investigations anywhere else in the tropics(Worbes 2002).
Besides the high variability in tree age reported for asingle site, radiocarbon ages determined in several treesin Manaus, Rio Branco and Santarem showed also alarge within site variability, as well as a high variabilityamong sites (Vieira et al. 2004). For instance, the meanradiocarbon age in Manaus was 306 years, while inSantarem the mean radiocarbon age was much younger,approximately 160 years (Simone Vieira and PlınioCamargo, personal communication). Overall, the fewresults shown so far indicate that mean tree age inAmazonia appears to be higher than 42 years as used insome models.
NEE of Amazonia
Several papers based on modeling terrestrial NPP(Friedlingstein et al. 1995; Mellilo et al. 1996; Thompsonet al. 1996; McGuire et al. 1997) have shown thattropical forests could be one of the key biomes in themodern global carbon cycle. Nevertheless, the first esti-mate of tropical NEE produced by atmospheric inversemodel calculations showed a high degree of variability,revealing no CO2 emission pulse created by tropicaldeforestation (Schimel et al. 2001). This was taken asindirect evidence that the tropics could be acting as animportant carbon sink, as deforestation was widespreadin this region. Several basin-wide estimates, proposedsince the beginning of the 1990s for Amazonia, aresummarized in Fig. 6. The first local measurement madeby Grace et al. (1995a), using eddy covariance technique,
Table 1 Number of individuals with diameter at breast heighthigher than 10 cm/ha followed by the number of botanical familiesand species in Manaus, Rio Branco and Santarem (Vieira et al.2004)
Manaus Rio Branco Santarem
Individuals 626 466 450Family 52 40 50Species 232 164 265
Fig. 6 Estimates of net ecosystem exchange (NEE) obtained byeddy covariance technique (open bars) and by abovegroundbiomass estimates (black bars). NEE values are plotted accordingto the year of publication. Grace et al. (1995a)—eddy covariancetechnique, Ji-Parana; Malhi et al. (1998)—eddy covariance tech-nique, Manaus; Phillips et al. (1998)—biomass inventory, severalsites; Araujo et al. (2002)—eddy covariance technique Manaus;Carswell et al. (2002)—Reserva Caixuana; Miller et al. (inpress)—biomass inventory, Santarem; Saleska et al. (2003)—bio-mass inventory, Santarem; Saleska et al. (2003)—eddy covariancetechnique; Baker et al. (2004)—biomass inventory, eastern andcentral plots, western plots and floodplain plots, respectively

found a net carbon gain of approximately1 ton C ha�1 year�1. This net gain lead to a lively de-bate about the role of the Amazonia forests as animportant sink for carbon. Few years later, a secondsimilar eddy covariance study, comprised of an entireyear of observations in central Amazonia, found a netcarbon gain almost sixfold larger than that of the firststudy (Malhi et al. 1998). Tropical forests are one of thelargest carbon reservoirs among terrestrial systems(Field et al. 1998), thus changes of this magnitude inthese ecosystems would affect planetary scale processes.In the same year, the first large compilation of standbiomass growth data in several tropical sites corrobo-rated the eddy covariance findings of net gain, butpointed to a sink magnitude closer to the figure of thefirst eddy covariance study (Philips et al. 1998). The ideathat primary forests could be large sinks of C directlychallenged the ecological assumption of mature forestsas being in ‘‘a long term climax’’. Grace and colleaguesattributed this uptake to a CO2 fertilization effect. Aseries of measurements have tested the CO2 fertilizationclaim (see Fig. 6 and item 4.1) (Laurance et al. 2004;Phillips et al. 2002a; Johnson et al. 2001; Lloyd et al.2001; Malhi et al. 1999; Nelson et al. 1999), but to ourknowledge no research result has yet demonstrated aclear causal relationship between Amazonian rainforestgrowth and an increased atmospheric CO2 concentra-tion.
As most of the early estimates of NEE pointed to-wards a carbon gain by the forest, several studies at-tempted to locate the potential extra carbon storage inthe Amazonian ecosystems. Some claimed upfront thatvery large uptake by these forests was ecologicallyunrealistic (Keller et al. 2001), mainly because therewould be nowhere to store the implied large amount ofcarbon. Malhi and Grace (2000) considered thehypothesis that the majority of the extra carbon wasaccumulating in the soil organic matter at a rate of3.5 Mg C ha�1 year�1. However, Telles et al. (2003)have estimated carbon stocks from 102 Mg to 151 MgC ha�1 year�1 with storage rates of 0.09–0.13 Mg C ha�1 year�1 (they considered a 0.5% year�1
increase in ecosystem productivity), and with additionalpotential storage of 0.18–0.27 Mg C ha�1 year�1 insurface litter and roots. These authors have reportedturnover rates in the soil organic matter pool of less than10 years; however, for the last 20 years, a stable carbonstock was identified in primary forests of the Manausregion, suggesting a low possibility of these soils beingpotential carbon sinks for the considered period (Telleset al. 2003). Residence time and fluxes of carbon in orout of the soil and the time of residence of this carbon inthe soil profile are key factors in estimating the impor-tance of this compartment to the carbon balance in aforest system. Studies by Camargo et al. (1999) andBernoux et al. (2002) have shown that the majority ofcarbon stocks in the soil are associated with recalcitrantcompounds (coal, lignin, etc.) that do not turnover onthe timescales of decades or centuries. Thus, production
and decomposition of wood predominates the dynamiccarbon stock of these forests (Chambers et al. 2000;Phillips et al. 1998). Recent data from three sites inAmazonia (Chambers et al. 2004; Viera et al. 2004; Silvaet al. 2002) have shown that tree growth and mortalityrates are too slow to account for the amount of carbonsimilar to that indicated by early eddy covariance stud-ies. Chambers et al. (2004) using stochastic-empiricmodeling of carbon dynamics of live and dead trees forone site central Amazonia indicated that the forest cansupport only a 0.5% increase in NPP over a long period.However, these authors warn that their ‘‘...predictionsabout whether or not old-growth tropical forests will actas carbon sources, sinks, or remain in overall balance,depends on assumptions for which reliable field data areoften not available.’’ (Chambers et al. 2004).
The site-specific question was addressed in a recentwork by Saleska et al. (2003). The authors presentededdyflux NEE estimates at Tapajos, with biometricmeasurements suggesting that the site was under theeffects of transient disturbance. These could include re-cent past ENSO warm episodes, which may have causedanomalously large mortality rates and have potentiallyoffset carbon uptake during the recovery. Keller et al.(1996) have shown that the fall of a giant emergent treecan result in a loss of about 750 kg C ha�1 over 13 hawithin a few years. These authors also pointed out thatrecovery from long-term climate stress could otherwiselead to net carbon uptake in the present. These uncer-tainties suggest that there is a large spatial variabilityover terra firme tropical forests in Amazonia, and thataverage annual NEE estimates should combine bio-metric measurements with climate interannual variabil-ity to provide more accurate assessments.
The aquatic systems are another important compo-nent of the Amazonian ecosystem that need to be con-sidered for a regional carbon balance. Richey et al.(2002) estimated that up to 1.2 Mg C ha�1 year�1 couldbe lost to the atmosphere in a large swath of centralAmazonia. Extrapolation across the entire flooded areaof the basin produced an emission of approximately0.5 Pg C year�1, which is of the same magnitude as thecarbon emission caused by land-use changes in TropicalLatin America (DeFries et al. 2002). Contrastingly,Waterloo et al. (in preparation) have recently concluded,from a continuous long-term measurement in a moni-tored black water catchment near Manaus, that typicalterra-firme forest export a significantly smaller load ofdissolved organic compounds (<0.3 Mg C ha�1 year�1)than speculated by Richey et al. (2002). This transfersthe potential source of the estimated riverine emissionsto productive ecosystems within whitewater floodplains(Junk 1997; Piedade et al. 2000). Shedding a little morelight on this controversy, eddyflux measurements werecarried out for a complete seasonal cycle in the Pantanalwetland area, near the border of Brazil and Bolivia, tothe South of Amazonia (Manzi et al. 2002). Thesemeasurements have indicated a marked source duringthe flood period, similar to the estimate of Richey et al.

(2002), but have also shown a strong sink in the ebbseason (Manzi et al. 2002). The reversal in carbon bal-ance is probably due to vigorous revegetation by C4grasses and other floodplain plants (Piedade et al. 2000),confirming the potential importance of productivitywithin the floodplain in balancing the total exchange ofthese biomes with the atmosphere. In addition, radio-carbon measurements (Emilio Mayorga and AnthonyAufdenkampe, personal communication) show thatmost emitted C is relatively recent in origin—aquaticsystems lose C to the atmosphere rapidly enough so thatadjustments to change would be instantaneous. There-fore, the role of aquatic systems in local to regional Cbudgets will depend primarily on the temporal balanceof CO2 sources in the flood season and CO2 sinks in theebb season. However, the origin of the CO2 being lost tothe atmosphere (e.g. in-stream or riparian processes vs.export from uplands) and how long it takes for C totransit to the aquatic system (without significant—e.g.decadal—time lags, there can be no net storage or loss)also need to be considered. The importance of aquaticsystems will also depend on their potential for changewith land use or climate, a matter still under investiga-tion.
More recently, a series of articles called for cautionin interpreting potential gains of carbon by biomass inthe Amazonia (Chambers and Silver 2004; Clark 2004;Korner 2004). In short, the main message of thesestudies may be summarized by two sentences fromChristian Korner works: (1) ‘‘a stimulation of assimi-lation does not necessarily mean that there is moregrowth’’, and (2) ‘‘a stimulation of growth does notnecessarily mean enhanced carbon sequestration’’. Thusthe C storage under a NEE perspective is also depen-dent on changes in the dynamic structure, or regrowth,of forests. A change from emergent trees to lianas andsmall trees (Laurance et al.1997; Phillips et al. 2002b)can reflect a net carbon loss to the atmosphere. An-other key issue, illustrated by LBA project, is that theAmazonian ecosystems have very large capacity forinterannual shifts in C balance (i.e. the interannualvariation in the wood storage term shown by Vieiraet al. 2004).
In order to place Amazonia in a global perspectiveand make the carbon flux obtained through the LBAproject comparable with global carbon budgets, weextrapolated NPP/NEE values found by (several) LBAstudies to the entire area of Brazilian Amazonia coveredby rainforest. We are fully aware of the tremendousvariability across ecosystems of Amazonia, and thisheterogeneity could make invalidate our simple extrap-olation. Nevertheless we feel it is important to make afirst approximation, such as this, in order to compare thecarbon flux measured in the Amazonia plots with globalcarbon estimates (Fig. 7).
An recent comparison of atmospheric CO2 inver-sion models indicated that tropical lands in theAmericas could be a net source of0.62±1.15 Pg C year�1 (Gurney et al. 2002). This
contrasts with estimates by Schimel et al. (2001) wherethe tropics appear as a neutral source or sink forcarbon. Both, Gurney et al. (2002) and Schimel et al.(2001), stressed that uncertainties in the tropical re-gions of the world are much greater than elsewheredue to the lack of an adequate and accurate CO2
concentration measurement network.The four last estimates of carbon flux in the tropics
due to land use changes produced different values.Fearnside (2000) and Houghton (2003) using defores-tation rates from FAO estimated 2.4 Pg and2.2 Pg C year�1, respectively, for the net flux due toland use changes in the tropics. Achard et al. (2002) andDeFries et al. (2002), based on deforestation inferreddirectly from satellite data, produced lower estimates forthe tropics of 0.96 Pg C year�1, respectively. If theestimates of Fearnside (2000) and Houghton (2003) oftropical deforestation are correct, the emission term inthe tropics would be approximately 2.3 Pg C year�1.However, the inversion models are capturing in averagetotal emissions of only 0.62 Pg C year�1. Forgetting fora moment the uncertainty of the inversion models, thiswould imply that there must be a local sink of approx-imately 1.6–1.7 Pg C year�1, which would be equivalentto a net gain of 2.7 ton C ha�1 year�1 in areas of pris-tine rainforest. If the estimates by Achard et al. (2002)and DeFries et al. (2002) are correct, conversion oftropical forests would be releasing to the atmosphere anaverage of 0.93 Pg C year�1. In this scenario, a smallerC sink of approximately 0.31 Pg C year�1 would beneeded then to satisfy the inversion models, resulting ina potential sink strength for pristine forests of0.85 ton C ha�1 year�1. In this case, the tropical forestswould act as source of carbon to the atmosphereequivalent to 0.85 ton C ha�1 year�1. Using our crudeextrapolation of LBA values for the Amazon forests(5 million km2) we come out with a carbon exchangeestimate varying from �3.0 Pg to 0.75 Pg C year�1
(Fig. 7).
Conclusions
There is a large uncertainty in carbon fluxes estimatesfor the tropics as a whole and in Amazonia in partic-ular bring the awareness that we have not enoughinformation to decide whether Amazonia is a carbonsource or sink, or if it is both, depending on climaticvariation and the rates of forest conversion. Theaccumulation of sufficient information for a huge sys-tem such as the Amazon region has to advance step bystep.
The future of the carbon balance, especially in theBrazilian Amazonia, is closely related to the economy.As the Brazilian economy grows, deforestation ratesmay increase if the government does not provide envi-ronmentally sustainable regulation. Increasing defores-tation rates might overwhelm a potential sink byprimary and regrowth forests.

The complex sink/source duality of Amazonia wasdiscussed extensively in the literature and during severalscientificmeetings of the LBAproject; however, no strongconclusions were drawn, other than the ones presented inthis work. The valuable data emerging from the pioneer-ing network of flux towers and forest plots in Amazoniabring, for the first time, the unique chance to compare andunderstand diverse and contrasting ecophysiologicalprocesses. Process models have yet to capture this im-mense complexity in a fine resolution. Certainly, it is animportant and vital question for Brazil and for the worldfrom many perspectives. However, by paying too muchattention to the issue of uniqueness of a sink or sourcecharacter and finding its magnitude, we may loose a greatopportunity to discuss the basic functioning and thecomplexities of the ecosystems in Amazonia.
Acknowledgements Jean Pierre H.B.Ometto, Luiz Martinelli andHumberto Rocha acknowledge FAPESP and NASA, through
LBA, for financial support. Antonio D. Nobre acknowledgessupport from PPG7-FINEP, European Commission and CNPq.Paulo Artaxo acknowledges the Millennium Institute from CNPqand FAPESP for financial support. The authors acknowledgeAdam West, Suzan Trumbore and an anonymous reviewer forgreat and critical contribution that improved the accuracy andclarity of this paper.
References
Achard F, Eva HD, Stibig HJ, Mayaux P, Gallego J, Richards T,Malingreau JP (2002) Determination of deforestation rates ofthe world’s humid tropical forests. Science 297:999–1002
Andersen LE, Granger CWJ, Reis EJ, Weinhold D, Wunder S(2002) The dynamic of deforestation and economic growth inBrazilian Amazonia. Cambridge University Press, UK
Andreae MO, Artaxo P, Fischer H, Freitas SR, Gregoire JM,Hansel A, Hoor P, Kormann R, Krejci R, Lange L, Lelieveld J,Lindinger W, Longo K, Peters W, de Reus M, Scheeren B, DiasMAFS, Strom J, van Velthoven PFJ, Williams J (2001)
-3.5
-2.5
-1.5
-0.5
0.5
1.5
2.5
3.5
4.5
5.5
6.5
Fossil
fuel
(1)
Atmin
crea
se (2)
eanic
uptak
e (3)
Oceanic
uptake
(4)
L/ATM
-W(5
)
L/ATM
-W(6
)
L/ATM
-TR
(7)
L/ATM
-TA
(8)
LUC-W
(9)
LUC-TR
(10)
LUC-TR
(11)
LUC-TR
(12)
LUC-T
R(1
3)
LUC-TA
(14)
LUC-TA
(15)
LUC-AM
(16)
Sales
kaet
al (17
)
Sales
kaet
al(1
8)
Mille
r et al (1
9)
Baker
etal (
20)
Philips et al
(21)
Baker
etal (
22)
Grace
etal
. (23
)
Baker
etal (
24)
Arauj
oet
al (25
)
Carsw
ellet
al (26
)
Arauj
oet
al (27
)
Malh
i etal
. (28
)
Car
bo
n fl
ux
(Pg
C/y
r)
Fig. 7 Carbon flux from several sources. Positive numbers denotesources of carbon to the atmosphere and negative numbers denotean uptake of carbon from the atmosphere. L/ATM denotes a fluxfrom the land to the atmosphere; LUC denotes a flux due to landuse changes.WWorld; TR Tropics; TA Tropical America; and AMAmazonia. (1) Fossil fuel emissions (Schimel et al. 2001); (2)Atmosphere increase in CO2 (Schimel et al. 2001); (3) Estimate ofocean uptake of CO2 (House et al. 2003); (4) Estimate of oceanuptake of CO2 (Houghton 2003); (5) Estimate of terrestrial sink ofcarbon (Houghton 2003); (6) Estimate of terrestrial sink of carbon(House et al. 2003); (7) Source of carbon from total tropical landsto the atmosphere estimated by inversion models (Gurney et al.2002); (8) Source of carbon from tropical lands of the Americas tothe atmosphere estimated by inversion models (Gurney et al. 2002);(9) Source of carbon from lands of the entire world to theatmosphere due to land use changes (Houghton 2003); (10) Sourceof carbon from tropical lands to the atmosphere due to land usechanges (Houghton 2003); (11) Source of carbon from tropicallands to the atmosphere due to land use changes (Fearnside 2000);(12) Source of carbon from tropical lands to the atmosphere due toland use changes (Achard et al. 2002); (13) Source of carbon from
tropical lands to the atmosphere due to land use changes (DeFrieset al. 2002); (14) Source of carbon from tropical lands of Americasto the atmosphere due to land use changes (Houghton 2003); (15)Source of carbon from tropical lands of Americas to theatmosphere due to land use changes (DeFries et al. 2002); (16)Source of carbon from tropical lands of the Amazonia basin to theatmosphere due to land use changes (Houghton et al. 2002).Estimates from number 17–28 are carbon flux estimates made byseveral groups of the LBA project. Originally these fluxes werepresented as tons of C per hectare. We extrapolated them to anarea of 5 million km2 of forest (see text for details). (17) Saleskaet al. (2003)—biomass inventory; (18) Saleska et al. (2003)—eddycovariance technique; (19) Miller et al. (in press)—biomassinventory; (20) Baker et al. (2004)—biomass inventory; (21) Phillipset al. (1998)—biomass inventory; (22) Baker et al. (2004)—biomassinventory; (23) Grace et al. (1995)—eddy covariance technique;(24) Baker et al. (2004)—biomass inventory; (25) Araujo et al.(2002)—eddy covariance technique; (26) Carswell et al.(2002)—eddy covariance technique; (27) Araujo et al. (2002)—eddycovariance technique; (28) Malhi et al. (1998)—eddy covariancetechnique

Transport of biomass burning smoke to the upper troposphereby deep convection in the equatorial region. Geophys Res Lett28(6):951–954
Andreae MO, Almeida SS, Artaxo P, Brandao C, Carswell FE,Ciccioli P, Culf A, Esteves JL, Gash J, Grace J, Kabat P,Lelieveld J, Malhi Y, Manzi AO, Meixner FX, Nobre AD,Nobre C, Lourdes Ruivo MA, Silva-Dias MA, Stefani P, Val-entini R, von Jouanne J, Waterloo M (2002) Biogeochemicalcycling of carbon, water, energy, trace gases and aerosols inAmazonia: the LBA-EUSTACH experiments. J Geophys Res107(D20):8066–8091. DOI 10.1029/2001JD000524
Andreae MO, Rosenfeld D, Artaxo P, Costa AA, Frank GP,Longo KM, Silva-Dias MAF (2004) Smoking rain clouds overthe Amazon. Science 303(5662):1337–1342
Araujo AC, Nobre AD, Kruijt B, Culf AD, Stefani P, Elbers J,Dallarosa R, Randow C, Manzi AO, Valentini R, Gash JHC,Kabat P (2002) Dual tower longterm study of carbon dioxidefluxes for a central Amazonian rain forest: the Manaus LBAsite. J Geophys Res Atmos 107(D20):8090. DOI 10.1029/2001JD000676
Artaxo P, Martins JV, Yamasoe MA, Procopio AS, PauliquevisTM, Andreae MO, Guyon P, Gatti LV, Leal AMC (2002)Physical and chemical properties of aerosols in the wet and dryseasons in Rondonia, Amazonia. J Geophys Res Atmos107(D20):8081
Avissar R, Silva Dias PL, Silva Dias MAF, Nobre C (2002) Thelarge-scale biosphere-atmosphere experiment in amazonia(LBA): insights and future research needs. J Geophys ResSpecial LBA Issue 107. DOI 10.1029/2002JD002704
Baidya Roy S, Avissar R (2002) Impact of land use/land coverchange on regional hydrometeorology in Amazonia. J GeophysRes 107(D20). DOI 10.1029/2000JD000266
Baker TR, Phillips OL, Malhi Y, Almeida S, Arroyo L, Di Fiore A,Killen T, Laurance SG, Laurance WL, Lewis SL, Lloyd J,Monteagudo A, Neill DA, Patino S, Pitman NCA, Silva N,Vasquez MR (2004a) Variation in wood density determinesspatial patterns in Amazonian forest biomass. Global ChangeBiol 10(5):545–562
Baker TR, Phillips OL, Malhi Y, Almeida S, Arroyo L, Di Fiore A,Erwin T, Higuchi N, Killeen TJ, Laurance SG, Laurance WF,Lewis SL, Monteagudo A, Neill DA, Vargas PN, Pitman NCA,Silva JNM, Martınez RV (2004b) Increasing biomass in Ama-zonian forest plots. Phil Trans R Soc Lond B. DOI 10.1098/rstb.2003.1422
Baldocchi DD, Vogel CA, Hall B (1997) Seasonal variation ofenergy and water vapor exchange rates above and below aboreal jack pine forest canopy. J Geophys Res Atmos102(D24):28939–28951
Baldocchi D, Finnigan J, Wilson K, Paw KT (2000) On measuringnet ecosystem carbon exchange over tall vegetation in complexterrain. Bound Layer Meteorol 96:257–291
Baldocchi D, Falge E, Gu LH, Olson R, Hollinger D, Running S,Anthoni P, Bernhofer C, Davis K, Evans R, Fuentes J, Gold-stein A, Katul G, Law B, Lee XH, Malhi Y, Meyers T, MungerW, Oechel W, U KTP, Pilegaard K, Schmid HP, Valentini R,Verma S, Vesala T, Wilson K, Wofsy S (2001) FLUXNET: Anew tool to study the temporal and spatial variability of eco-system-scale carbon dioxide, water vapor, and energy fluxdensities. Bull Am Meteorol Soc 82:2415–2434
Baldocchi DD (2003) Assessing the eddy covariance technique forevaluating carbon dioxide exchange rates of ecosystems: past,present and future. Global Change Biol 9(4):479–492
Bernoux M, Carvalho MDS, Volkoff B, Cerri CC (2002) Brazil’ssoil carbon stocks. Soil Sci Soc Am J 66(3):888–896
Bousquet P, Peylin P, Ciais P, Le Quere C, Friedlingstein P, TansPP (2000) Regional changes in carbon dioxide fluxes of landand oceans since 1980. Science 290:1342–1346
Browder J, Godfrey B (eds) (1997) Rainforest Cities—Urbaniza-tion, Development, and Globalization of the Brazilian Amazon.Columbia University Press, New York
Brown IF, Martinelli LA, Thomas WW, Moreira MZ, FerreiraCAC, Victoria RL (1995) Uncertainty in the biomass ofAmazonian forests—an example from Rondonia, Brazil. ForEcol Manag 75(1–3):175–189
Camargo PB, Trumbore SE, Martinelli LA, Davidson EA, Neps-tad DC, Victoria RL (1999) Soil carbon dynamics in regrowingforest of eastern Amazonia. Global Change Biol 5:693–702
Carswell FE, Costa AL, Palheta M, Malhi Y, Meir PW, Costa J dePR, Ruivo M de L, Leal LSM, Costa JMN, Clement RJ, GraceJ (2002) Seasonality in CO2 and H2O flux at an EasternAmazonian rain forest. J Geophys Res Atmos 107(D20):8076.DOI 10.1029/2000JD000284
Carvalho G, Barros AC, Moutinho P, Nepstad D. (2001) Sensitivedevelopment could protect Amazonia instead of destroying it.Nature 409:13
Chadwick OA, Derry LA, Vitousek PM, Huebert BJ, Hedin LO(1999) Changing sources of nutrients during four million yearsof ecosystem development. Nature 397(6719):491–497
Chambers JQ, Higuchi N, Schimel JP (1998) Ancient trees inAmazonia. Nature 391(6663):135–136
Chambers JQ, Higuchi N, Schimel JP, Ferreira LV, Melack JM(2000) Decomposition and carbon cycling of dead trees intropical forests of the central Amazon. Oecologia 122:380–388
Chambers JQ, Santos J,RibeiroRJ,HiguchiN (2001a)Tree damage,allometric relationships, and above-ground net primary pro-duction in a tropical forest. For Ecol Manag 152:73–84
Chambers JQ, Higuchi N, Tribuzy ES, Trumbore SE (2001b) Sinkfor a century: carbon sequestration in the Amazon. Nature410(6827):429–429
Chambers JQ, Silver WL (2004) Some aspects of ecophysiologicaland biogeochemical responses of tropical forests to atmosphericchange. Philos T Roy Soc B 359(1443):463–476
Chambers JQ, Tribuzy ES, Toledo LC, Crispim BF, Higuchi N,Santos J, Araujo AC, Kruijt B, Nobre AD, Trumbore SE(2004) Respiration from a tropical forest ecosystem: partition-ing of sources and low carbon use efficiency. Ecol Appl Suppl14(4):S72–S88
Chambers JQ, Higuchi N, Teixiera LM, Santos J, Laurance SG,Trumbore SE (2004) Response of tree biomass and wood litter todisturbance in a central Amazon Forest. Oecologia 141:596–614
Chave J, Condit R, Aguilar S, Hernandez A, Lao S, Perez R (2004)Error propagation and scaling for tropical forest biomass esti-mates. Philos T Roy Soc B 359(1443):409–420
Chomovitz KM, Thomas TS (2001) Geographical patterns of landuse and land intensity in the Brazilian Amazon. Policy ResearchWorking Paper 2687, The World Bank
Ciais P, Tans PP, White JWC, Trolier M, Francey RJ, Berry JA,Randall DR, Sellers PJ, Collatz JG, Schimel DS (1995) Parti-tioning of ocean and land uptake of CO2 as inferred by d13Cmeasurements from the NOAA climate monitoring and diag-nostics laboratory global air sampling network. J Geophys Res100:5051–5070
Claeys M, Graham B, Vas G, Wang W, Vermeylen R, PashynskaV, Cafmeyer J, Guyon P, Andreae MO, Artaxo P, Maenhaut W(2004) Formation of secondary organic aerosols through photo-oxidation of isoprene. Science 303:1173–1176
Clark DA (2004) Sources or sinks? The responses of tropical foreststo current and future climate and atmospheric composition.Phil Trans R Soc Lond B. DOI 10.1098/rstb.2003.1426
Clark DA (2002) Are tropical forests an important carbon sink?Reanalysis of the long-term plot data. Ecol Appl 12:3–7
Cochrane MA, Laurance WF (2002) Fire as a large-scale edge ef-fect in Amazonian forests. J Tropical Ecol 18:1–15
Cochrane MA, Alencar A, Schulze MD, Souza CM Jr, NepstadDC, Lefebvre PA, Davidson EA (1999) Positive feedbacks inthe fire dynamic of closed canopy tropical forests. Science284:1832–1835
Condit R, Hubbell SP, Foster Rb (1995) Mortality-rates of 205neotropical tree and shrub species and the impact of a severedrought. Ecol Monogr 65(4):419–439

Conway TJ, Tans PP, Waterman LS, Thoning KW, Kitzis DR,Masarie KA, Zhang N (1994) Evidence for interannual vari-ability of the carbon cycle from the National Oceanic andAtmospheric Administration/Climate Monitoring and Diag-nostics Laboratory global air sampling network. J Geophys Res99:22831–22855
Cox PM, Betts RA, Jones CD, Spall SA, Totterdell IJ (2000)Acceleration of global warming due to carbon-cycle feedbacksin a coupled climate model. Nature 408:184–187
Crutzen PJ, Fall R, Galbally I, Lindinger W (1999) Parameters forglobal ecosystem models. Nature 399:535–536
Culf AD, Esteves JL, Marques Filho AO, Rocha HR (1996)Radiation, temperature and humidity over forest and pasture inAmazonia. In: Gash JHC, Nobre CA, Roberts JM, Victoria RL(eds) Amazonian climate and deforestation. Wiley, New York,pp 175–192
Davidson EA, Verchot LV, Cattanio JH, Ackerman IL, CarvalhoJEM (2000) Effects of soil water content on soil respiration inforests and cattle pastures of eastern Amazonia. Biogeochem-istry 48:53–69
DeFries RS, Houghton RA, Hansen MC, Field CB, Skole D,Townsend J (2002) Carbon emissions from tropical deforesta-tion and regrowth based on satellite observations for the 1980sand 1990s. PNAS 99:14256–14261
Dezzeo N, Worbes M, Ishii I, Herrera R (2003) Annual tree ringsrevealed by radiocarbon dating in seasonally flooded forest ofMapire river (Orinoco river, Venezuela). Plant Ecol 168:165–175
Dixon RK, Brown S, Houghton RA, Solomon AM, Trexler MC,Wisniewski J (1994) Carbon pools and flux of global forestecosystems. Science 263:185–190
Fan S, Gloor M, Mahlman J, Pacala S, Sarmiento J, Takahashi T,Tans P (1998) A large terrestrial carbon sink in North Americaimplied by atmospheric and oceanic carbon dioxide data andmodels. Science 282:442–446
Fearnside PM (1996) Amazonian deforestation and global warm-ing: carbon stocks in vegetation replacing Brazil’s Amazonforest. For Ecol Manag 80:21–34
Fearnside PM (1997) Greenhouse gases from deforestation inBrazilian Amazonia: net committed emissions. Climatic Change35:321–360
Fearnside PM (2000) Global warming and tropical land usechange: greenhouse gas emissions from biomass burning,decomposition, and soils in forest conversion, shifting cultiva-tion, and secondary vegetation. Climatic Change 46:115–158
Field CB, Behrenfeld MJ, Randerson J, Falkowski (1998) Primaryproduction of the biosphere: integrating terrestrial and oceaniccomponents. Science 281:237–240
Friedlingstein P, Fung I, Holland E, John J, Brasseur G, EricksonD, Schimel D (1995) On the contribution of CO2 fertilization tothe missing biospheric sink. Global Biogeochem Cy 9(4):541–556
Gash JHC, Huntingford C, Marengo JA, Betts RA, Cox PM,Fisch G, Fu R, Gandu AW, Harris PP, Machado LAT, vonRandow C, Silva Dias MA (2004) Amazonian climate: resultsand future research. Theor Appl Climatol (LBA Special Issue)78:187–193
Gerwing JJ, Farias DL (2000) Integrating liana abundance andforest stature into an estimate of total aboveground biomass foran eastern Amazonian forest. J Trop Ecol 16:327–335
Goulden ML, Miller SD, Rocha HR, Menton MC, Freitas HC,Figueira AMS, Sousa CAD (2004) Diel and seasonal patternsof tropical forest CO2 Exchange. Ecol Appl Suppl 14(4):S42–S54
Goulden ML, Munger JW, Fan SM, Daube BC, Wofsy SC (1996)Measurements of carbon sequestration by long-term eddycovariance: methods and a critical evaluation of accuracy.Global Change Biol 2:168–182
Grace J, Lloyd J, McIntyre J, Miranda AC, Meir P, Miranda HS,Nobre C, Moncrieff J, Massheder J, Malhi Y, Wright I, Gash J(1995a) Carbon dioxide uptake by an undisturbed tropical rainforest in Southwest Amazonia, 1992–1993. Science 270:778–780
Grace J, Lloyd J, McIntyre J, Miranda AC, Meir P, MirandaHS, Moncrieff J, Massheder J, Wright I, Gash J (1995b)Fluxes of carbon dioxide and water vapor over an undis-turbed tropical forest in south-west Amazonia. GlobalChange Biol 1:1–12
Grace J, Malhi Y, Lloyd J, McIntyre J, Miranda AC, Meir P,Miranda HS (1996) The use of eddy covariance to infer the netcarbon dioxide uptake of Brazilian rain forest. Global ChangeBiol 2:208–217
Greenberg JP, Guenther AB, Petron G, Wiedinmyer C, Vega O,Gatti L, Tota J, Fisch G (2004) Biogenic VOC emissions fromforested and cleared Amazonian landscapes. Global ChangeBiol 10(5):651–662
Guenther A, Nicholas HC, Erickson D, Fall R, Geron C, Harley T,Graedel P, Klinger L, Pierce T, Taylor J (1995) A global modelof natural volatile organic compound emissions. J Geophys Res100:8873–8892
Guenther A (2002) The contribution of reactive carbon emissionsfrom vegetation to the carbon balance of terrestrial ecosystems.Chemosphere 49:837–844
Gurney KR, Law RM, Denning AS, Rayner PJ, Baker D, Bous-quet P, Bruhwiler L, Chen YH, Ciais P, Fan S, Fung IY, GloorM, Heimann M, Higuchi K, John J, Maki T, Maksyutov S,Masarie K, Peylin P, Prather M, Pak BC, Randerson J, Sar-miento J, Taguchi S, Takahashi T, Yuen CW (2002) Towardsrobust regional estimates of CO2 sources and sinks usingatmospheric transport models. Nature 415(6872):626–630
Harley P, Vasconcelos P, Vierling L, Pinheiro CS, Greenberg J,Guenther A, Klinger L, Almeida S, Neill D, Baker T, Phillips O,Malhi Y (2004) Variation in potential for isoprene emissionsamong Neotropical forest sites. Global Change Biol 10(5):630–650
Hecht Sb (1993) The logic of livestock and deforestation inAmazonia. Bioscience 43(10):687–695
Hirsch AI, Little WS, Houghton RA, Scott NA, White JD (2004)The net carbon flux due to deforestation and forest re-growth inthe Brazilian Amazon: analysis using a process-based model.Global Change Biol 10(5):908–924. DOI 10.1111/j.1529–8817.2003.00765.x
Hodnett MG, da Silva LP, Rocha HR, Cruz Senna RC (1995)Seasonal soil water storage changes beneath central Amazonianrainforest and pasture. J Hydrol 170:233–254
Houghton RA (2003) Revised estimates of the annual net flux ofcarbon to the atmosphere from changes in land use and landmanagement 1850–2000. Tellus 55B:378–390
Houghton RA, Lawrence KT, Hackler JL, Brown S (2001) Thespatial distribution of forest biomass in the Brazilian Amazon:a comparison of estimates. Global Change Biol 7:731–746
Houghton RA, Skole DL, Nobre CA, Hackler JL, Lawrence KT,Chomentowski WH (2000) Annual fluxes of carbon fromdeforestation and regrowth in the Brazilian Amazon. Nature403:301–304
Houghton RA, Davidson EA, Woodwell GM (1998) Missing sinks,feedbacks, and understanding the role of terrestrial ecosystemsin the global carbon balance. Global Biogeochem Cycles12(1):25–34
House JI, Prentice IC, Ramankutty N, Houghton RA, Heimann M(2003) Reconciling apparent inconistencies in estimates of ter-restrial CO2 sources and sinks. Tellus 55B:345–363
INPE (Instituto Nacional de Pesquisas Espaciais) (2004) Desflor-estamento 1998–2004. (http://www.inpe.gov.br) INPE, SaoJose dos Campos, SaoPaulo, Brazil
Ito A, Oikawa T (2000) Amodel analysis of the relationship betweenclimate perturbations and carbon budget anomalies in globalterrestrial ecosystems: 1970 to 1997. Climate Res 15:161–183
Jarvis PG, Massheder JM, Hale SE, Moncrieff JB, Rayment M,Scott SL (1997) Seasonal variation of carbon dioxide, watervapor, and energy exchanges of a boreal black spruce forest. JGeophys Res Atmos 102(D24):28953–28966
Johnson CM, Vieira ICG, Zarin DJ, Frizano J, Johnson AH (2001)Carbon and nutrient storage in primary and secondary forestsin eastern Amazonia. For Ecol Manag 147:245–252

Junk WJ (1997) The central Amazon floodplain: ecology of pulsingsystem. Springer, Berlin Heidelberg, p 525
Keller M, Clark DA, Clark DB, Weitz AM, Veldkamp E (1996) Ifa tree falls in the forest. Science 273(5272):201
Keller M, Palace M, Hurtt G (2001) Biomass estimation in theTapajos National Forest, Brazil. Examination of sampling andallometric uncertainties. For Ecol Manag 154:371–382
Kesselmeier J, Kuhn U, Wolf A, Andreae MO, Ciccioli P, Bran-caleoni E, Frattoni M, Guenther A, Greenberg J, VasconcellosPD, De Oliva ST, Tavares T, Artaxo P (2000) Atmosphericvolatile organic compounds (VOC) at a remote tropical forestsite in central Amazonia. Atmos Environ 34:4063–4072
Kesselmeier J, Ciccioli P, Kuhn U, Stefani P, Biesenthal T, Rot-tenberger S, Wolf A, Vitullo M, Valentini R, Nobre A, KabatP, Andreae MO (2002a) Volatile organic compound emissionsin relation to plant carbon fixation and the terrestrial carbonbudget. Global Biogeochem Cycles 16:1126. DOI 10.1029/2001GB001813
Kesselmeier J, Kuhn U, Rottenberger S, Biesenthal T, Wolf A,Schebeske G, Andreae MO, Ciccioli P, Brancaleoni E, FrattoniM, Oliva ST, Botelho ML, Silva CMA, Tavares TM (2002b)Concentrations and species composition of atmospheric volatileorganic compounds (VOCs) as observed during the wet and dryseason in Rondonia (Amazonia) J Geoph Res Atmos107(D20):8053
Korner C (2004) CO2 enrichment may cause tropical forests tobecome carbon sources. Phil Trans R Soc Lond B. DOI10.1098/rstb.2003.1429
Kruijt B, Elbers JA, von Randow C, Araujo AC, Oliveira PJ, CulfA, Manzi AO, Nobre AD, Kabat P, Moors EJ (2004) Therobustness in eddy correlation fluxes for Amazon rainforestconditions. Ecol Appl 14:S101–S113
Kuhn U, Rottenberger S, Biesenthal T, Wolf A, Schebeske G,Ciccioli P, Branscaleoni E, Frattoni M, Tavares TM, Kes-selmeier J (2004) Seasonal differences in isoprene and light-dependent monoterpene emission by tropical tree species.Global Change Biol 10(5):663–682
Kuhn U, Rottenberger S, Biesenthal T, Wolf A, Schebeske G,Ciccioli P, Brancaleoni E, Frattoni M, Tavares T, Kesselmeier J(2002) Isoprene and monoterpene emission of Amazonian treespecies during the wet season: Direct and indirect investigationsof controlling functions. J Geophys Res Atmos 107. DOI10.1029/2001JD000978
Laurance WF (2004) Forest–climate interactions in fragmentedtropical landscapes. Phil Trans R Soc Lond B. DOI 10.1098/rstb.2003.1430
Laurance WF, Cochrane MA, Bergen S, Fearnside PM, Dela-monica P, Barber C, D’Angelo S, Fernandes T (2001) The fu-ture of the Brazilian Amazon. Science 291(5503):438–439
Laurance WF et al (1997) Biomass collapse in Amazonian forest.Science 278:1117–1118
Lloyd J, Bird MI, Veenendaal EM, Kruijt B (2001) Should phos-phorus availability be constraining moist tropic al forest re-sponses to increasing CO2 concentrations? In: Schulze ED (ed)Global biogeochemical cycles in the climate system. Academic,San Diego, pp 95–114
Malhi Y, Baker T, Phillips OL, Almeida S, Alvarez E, Arroyo L,Chave J, Czimezik CI, DiFiore A, Higuchi N, Killeen TJ,Laurance SG, Laurance WF, Lewis SL, Montoya LMM,Monteagudo A, Neill DA, Vargas PN, Patina S, Pitman NCA,Quesada CA, Silva JNM, Lezama AT, Martinez RV, TerborghJ, Vinceti B, Lloyd J (2004) The above-ground wood produc-tivity and net primary productivity of 100 neotropical forestplots. Global Change Biol 10(5):563–591
Malhi Y, Baldocchi DD, Jarvis PG (1999) The carbon balance oftropical, temperate and boreal forests. Plant Cell Environ22:715–740
Malhi Y, Grace J (2000) Tropical forests and atmospheric carbondioxide. Trends Ecol Evol 15:332–337
Malhi Y, Nobre AD, Grace J, Kruijt B, Pereira MGP, Culf A,Scott S (1998) Carbon dioxide transfer over a central Amazo-nian rain forest. J Geophys Res Atmos 103:31593–31612
Malhi Y, Wright J (2004) Spatial patterns and recent trends in theclimate of tropical rainforest regions. Phil Trans R Soc Lond B.DOI 10.1098/rstb.2003.1433
Manzi AO et al (2002) NEE over a floodable ecosystem in Pant-anal, Brazil, II LBA Scientific Conference, Manaus
Marengo JA, Nobre CA (2001) General characteristics and vari-ability of climate in the Amazon basin and its links to the globalclimate system. In: McClain ME, Victoria RL, Richey JE (eds)The biogeochemistry of the Amazon basin. Oxford UniversityPress, New York
Margulis S (2003) Causes of Deforestation of the Brazilian Ama-zon. World Bank working paper no. 22
McGuire AD, Melillo JM, Kicklighter DW, Pan YD, Xiao XM,Helfrich J, Moore B, Vorosmarty CJ, Schloss AL (1997)Equilibrium responses of global net primary production andcarbon storage to doubled atmospheric carbon dioxide: sensi-tivity to changes in vegetation nitrogen concentration. GlobalBiogeochem Cycles 11(2):173–189
Melillo JM, Houghton RA, Kicklighter DW, McGuire AD (1996)Tropical deforestation and the global carbon budget. Annu RevEnergy Environ 21:293–310
Melillo JM, McGuire AD, Kicklighter DW, Moore B III, Voro-smarty CJ, Schloss AL (1993) Global climate change and ter-restrial net primary production. Nature 363:234–240
Miller SD, Goulden ML, Menton MC, Rocha HR, Freitas HC,Figueira AMS, Sousa CAD (2004) Biometric and micromete-orological measurements of tropical forest carbon balance. EcolAppl Suppl 14(4):S114–S126
Miranda AC, Miranda HS, Lloyd J, Grace J, McIntyre JA, Meir P,Riggan P, Lockwood R, Brass J (1996) Carbon dioxide fluxesover a cerrado sensu stricto in central Brazil. In: Gash JHC,Nobre CA, Roberts JM, Victoria RL (eds) Amazonian climateand deforestation. Wiley, New York, pp 353–364
Miranda EV (2002) Padrao de desenvolvimento radial horario detres especies arboreas da Amazonia utilizando dendrometrosautomaticos. MSc Dissertation, INPA, Manaus
Martens CS, Shay TJ, Mendlovitz HP, Matross DM, Saleska SR,Wofsy SC, Woodward WS, Menton MC, De Moura JMS, CrillPM, De Moraes OLL, Lima RL (2004) Radon fluxes in tropicalforest ecosystems of Brazilian Amazonia: night-time CO2 netecosystem exchange derived from radon and eddy covariancemethods. Global Change Biol 10(5):618. DOI 10.1111/j.1365–2486.2004.00764.x
Nelson BW, Mesquita R, Pereira JLG, de Souza SGA, Batista GT,Couto LB (1999) Allometric regressions for improved estimateof secondary forest biomass in the central Amazon. For EcolManag 117:149–167
Nepstad D, McGrath D, Alencar A, Barros AC, Carvalho G,Santilli M, Diaz M del CV (2002) Frontier governance inAmazonia. Science 295:629–631
Nepstad DC, Carvalho GO, Barros AC, Alencar A, CapobiancoJP, Bishop J, Moutinho P, Lefebvre PA, Silva UL, Prins E(2001) Road paving, fire regime feedbacks, and the future ofAmazon forests. For Ecol Manag 154:395–407
Oliveira AA, Nelson BW (2001) Floristic relationship of terra firmeforests in the Brazilian Amazon. For Ecol Manag 146:169–197
Phillips OL, Gentry AH (1994) Increasing turnover through time intropical forests. Science 263:954–958
Phillips OL, Malhi Y, Higuchi N, Laurance WF, Nunez PV,Vasquez RM, Laurance SG, Ferreira LV, Stern M, Brown S,Grace J (1998) Changes in the carbon balance of tropical for-ests: evidence from long-term plots. Science 282:439–442
Phillips OL, Malhi Y, Vinceti B, Baker T, Lewis SL, Higuchi N,Laurance WF, Vargas PN, Martinez RV, Laurance S, FerreiraLV, Stern M, Brown S, Grace J (2002a) Changes in growth oftropical forests: evaluating potential biases. Ecol Appl 12:576–587
Phillips OL, Martinez RV, Arroyo L, Baker TR, Killeen T, LewisSL, Malhi Y, Mendoza AM, Neill D, Vargas PN, Alexiades M,Ceron C, Di Fiore A, Erwin T, Jardim A, Paiacios W, SaidiasM, Vinceti B (2002b) Increasing dominance of large lianas inAmazonian forests. Nature 418:770–774
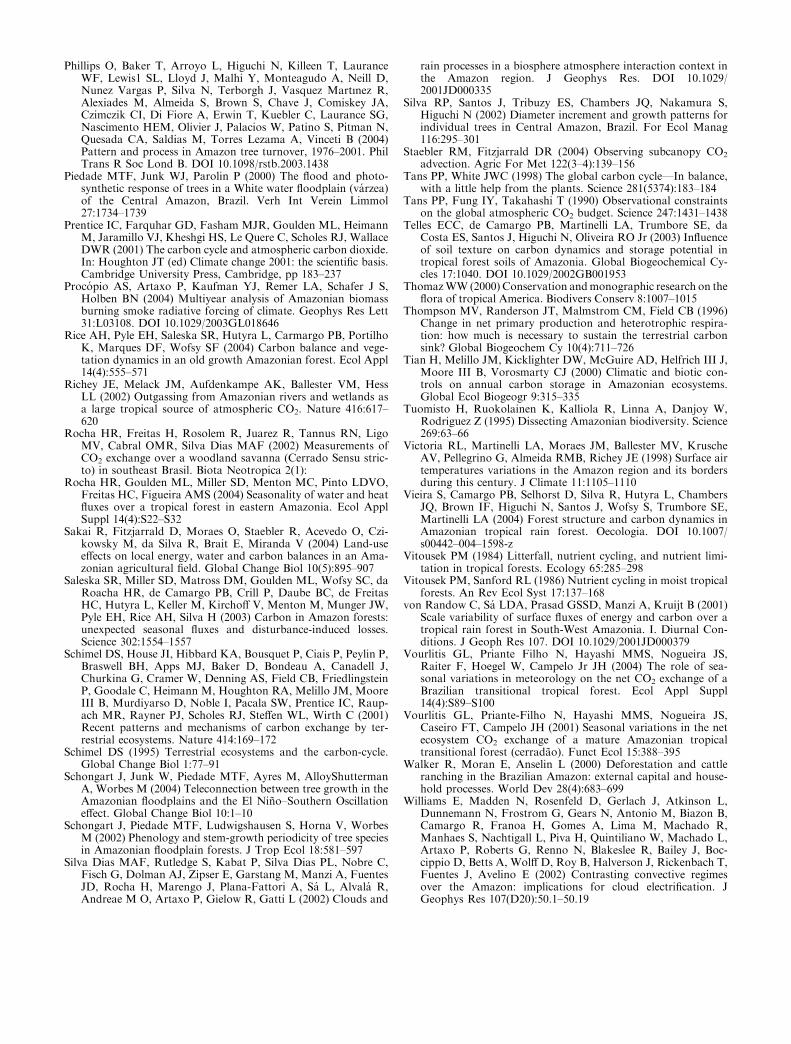
Phillips O, Baker T, Arroyo L, Higuchi N, Killeen T, LauranceWF, Lewis1 SL, Lloyd J, Malhi Y, Monteagudo A, Neill D,Nunez Vargas P, Silva N, Terborgh J, Vasquez Martınez R,Alexiades M, Almeida S, Brown S, Chave J, Comiskey JA,Czimczik CI, Di Fiore A, Erwin T, Kuebler C, Laurance SG,Nascimento HEM, Olivier J, Palacios W, Patino S, Pitman N,Quesada CA, Saldias M, Torres Lezama A, Vinceti B (2004)Pattern and process in Amazon tree turnover, 1976–2001. PhilTrans R Soc Lond B. DOI 10.1098/rstb.2003.1438
Piedade MTF, Junk WJ, Parolin P (2000) The flood and photo-synthetic response of trees in a White water floodplain (varzea)of the Central Amazon, Brazil. Verh Int Verein Limmol27:1734–1739
Prentice IC, Farquhar GD, Fasham MJR, Goulden ML, HeimannM, Jaramillo VJ, Kheshgi HS, Le Quere C, Scholes RJ, WallaceDWR (2001) The carbon cycle and atmospheric carbon dioxide.In: Houghton JT (ed) Climate change 2001: the scientific basis.Cambridge University Press, Cambridge, pp 183–237
Procopio AS, Artaxo P, Kaufman YJ, Remer LA, Schafer J S,Holben BN (2004) Multiyear analysis of Amazonian biomassburning smoke radiative forcing of climate. Geophys Res Lett31:L03108. DOI 10.1029/2003GL018646
Rice AH, Pyle EH, Saleska SR, Hutyra L, Carmargo PB, PortilhoK, Marques DF, Wofsy SF (2004) Carbon balance and vege-tation dynamics in an old growth Amazonian forest. Ecol Appl14(4):555–571
Richey JE, Melack JM, Aufdenkampe AK, Ballester VM, HessLL (2002) Outgassing from Amazonian rivers and wetlands asa large tropical source of atmospheric CO2. Nature 416:617–620
Rocha HR, Freitas H, Rosolem R, Juarez R, Tannus RN, LigoMV, Cabral OMR, Silva Dias MAF (2002) Measurements ofCO2 exchange over a woodland savanna (Cerrado Sensu stric-to) in southeast Brasil. Biota Neotropica 2(1):
Rocha HR, Goulden ML, Miller SD, Menton MC, Pinto LDVO,Freitas HC, Figueira AMS (2004) Seasonality of water and heatfluxes over a tropical forest in eastern Amazonia. Ecol ApplSuppl 14(4):S22–S32
Sakai R, Fitzjarrald D, Moraes O, Staebler R, Acevedo O, Czi-kowsky M, da Silva R, Brait E, Miranda V (2004) Land-useeffects on local energy, water and carbon balances in an Ama-zonian agricultural field. Global Change Biol 10(5):895–907
Saleska SR, Miller SD, Matross DM, Goulden ML, Wofsy SC, daRoacha HR, de Camargo PB, Crill P, Daube BC, de FreitasHC, Hutyra L, Keller M, Kirchoff V, Menton M, Munger JW,Pyle EH, Rice AH, Silva H (2003) Carbon in Amazon forests:unexpected seasonal fluxes and disturbance-induced losses.Science 302:1554–1557
Schimel DS, House JI, Hibbard KA, Bousquet P, Ciais P, Peylin P,Braswell BH, Apps MJ, Baker D, Bondeau A, Canadell J,Churkina G, Cramer W, Denning AS, Field CB, FriedlingsteinP, Goodale C, Heimann M, Houghton RA, Melillo JM, MooreIII B, Murdiyarso D, Noble I, Pacala SW, Prentice IC, Raup-ach MR, Rayner PJ, Scholes RJ, Steffen WL, Wirth C (2001)Recent patterns and mechanisms of carbon exchange by ter-restrial ecosystems. Nature 414:169–172
Schimel DS (1995) Terrestrial ecosystems and the carbon-cycle.Global Change Biol 1:77–91
Schongart J, Junk W, Piedade MTF, Ayres M, AlloyShuttermanA, Worbes M (2004) Teleconnection between tree growth in theAmazonian floodplains and the El Nino–Southern Oscillationeffect. Global Change Biol 10:1–10
Schongart J, Piedade MTF, Ludwigshausen S, Horna V, WorbesM (2002) Phenology and stem-growth periodicity of tree speciesin Amazonian floodplain forests. J Trop Ecol 18:581–597
Silva Dias MAF, Rutledge S, Kabat P, Silva Dias PL, Nobre C,Fisch G, Dolman AJ, Zipser E, Garstang M, Manzi A, FuentesJD, Rocha H, Marengo J, Plana-Fattori A, Sa L, Alvala R,Andreae M O, Artaxo P, Gielow R, Gatti L (2002) Clouds and
rain processes in a biosphere atmosphere interaction context inthe Amazon region. J Geophys Res. DOI 10.1029/2001JD000335
Silva RP, Santos J, Tribuzy ES, Chambers JQ, Nakamura S,Higuchi N (2002) Diameter increment and growth patterns forindividual trees in Central Amazon, Brazil. For Ecol Manag116:295–301
Staebler RM, Fitzjarrald DR (2004) Observing subcanopy CO2
advection. Agric For Met 122(3–4):139–156Tans PP, White JWC (1998) The global carbon cycle—In balance,
with a little help from the plants. Science 281(5374):183–184Tans PP, Fung IY, Takahashi T (1990) Observational constraints
on the global atmospheric CO2 budget. Science 247:1431–1438Telles ECC, de Camargo PB, Martinelli LA, Trumbore SE, da
Costa ES, Santos J, Higuchi N, Oliveira RO Jr (2003) Influenceof soil texture on carbon dynamics and storage potential intropical forest soils of Amazonia. Global Biogeochemical Cy-cles 17:1040. DOI 10.1029/2002GB001953
ThomazWW (2000) Conservation andmonographic research on theflora of tropical America. Biodivers Conserv 8:1007–1015
Thompson MV, Randerson JT, Malmstrom CM, Field CB (1996)Change in net primary production and heterotrophic respira-tion: how much is necessary to sustain the terrestrial carbonsink? Global Biogeochem Cy 10(4):711–726
Tian H, Melillo JM, Kicklighter DW, McGuire AD, Helfrich III J,Moore III B, Vorosmarty CJ (2000) Climatic and biotic con-trols on annual carbon storage in Amazonian ecosystems.Global Ecol Biogeogr 9:315–335
Tuomisto H, Ruokolainen K, Kalliola R, Linna A, Danjoy W,Rodriguez Z (1995) Dissecting Amazonian biodiversity. Science269:63–66
Victoria RL, Martinelli LA, Moraes JM, Ballester MV, KruscheAV, Pellegrino G, Almeida RMB, Richey JE (1998) Surface airtemperatures variations in the Amazon region and its bordersduring this century. J Climate 11:1105–1110
Vieira S, Camargo PB, Selhorst D, Silva R, Hutyra L, ChambersJQ, Brown IF, Higuchi N, Santos J, Wofsy S, Trumbore SE,Martinelli LA (2004) Forest structure and carbon dynamics inAmazonian tropical rain forest. Oecologia. DOI 10.1007/s00442–004–1598-z
Vitousek PM (1984) Litterfall, nutrient cycling, and nutrient limi-tation in tropical forests. Ecology 65:285–298
Vitousek PM, Sanford RL (1986) Nutrient cycling in moist tropicalforests. An Rev Ecol Syst 17:137–168
von Randow C, Sa LDA, Prasad GSSD, Manzi A, Kruijt B (2001)Scale variability of surface fluxes of energy and carbon over atropical rain forest in South-West Amazonia. I. Diurnal Con-ditions. J Geoph Res 107. DOI 10.1029/2001JD000379
Vourlitis GL, Priante Filho N, Hayashi MMS, Nogueira JS,Raiter F, Hoegel W, Campelo Jr JH (2004) The role of sea-sonal variations in meteorology on the net CO2 exchange of aBrazilian transitional tropical forest. Ecol Appl Suppl14(4):S89–S100
Vourlitis GL, Priante-Filho N, Hayashi MMS, Nogueira JS,Caseiro FT, Campelo JH (2001) Seasonal variations in the netecosystem CO2 exchange of a mature Amazonian tropicaltransitional forest (cerradao). Funct Ecol 15:388–395
Walker R, Moran E, Anselin L (2000) Deforestation and cattleranching in the Brazilian Amazon: external capital and house-hold processes. World Dev 28(4):683–699
Williams E, Madden N, Rosenfeld D, Gerlach J, Atkinson L,Dunnemann N, Frostrom G, Gears N, Antonio M, Biazon B,Camargo R, Franoa H, Gomes A, Lima M, Machado R,Manhaes S, Nachtigall L, Piva H, Quintiliano W, Machado L,Artaxo P, Roberts G, Renno N, Blakeslee R, Bailey J, Boc-cippio D, Betts A, Wolff D, Roy B, Halverson J, Rickenbach T,Fuentes J, Avelino E (2002) Contrasting convective regimesover the Amazon: implications for cloud electrification. JGeophys Res 107(D20):50.1–50.19

White A, Cannell MGR, Friend AD (2000) CO2 stabilization, cli-mate change and the terrestrial carbon sink. Global ChangeBiol 6:817–833
Wiedinmyer C, Guenther A, Harley P, Hewitt N, Geron C, ArtaxoP, Steinbrecher R, Rasmussen R (2004) Global organic emis-sions from vegetation. In: Granier C, Artaxo P, Reeves C (eds)Emissions of trace gases and aerosols into the atmosphere.Kluwer, Dordrecht
Worbes M (2002) One hundred years of tree ring research in thetropics. A brief history and an outlook to future challenges.Dendrochronologia 20(1–2):217–231
Wright IR, Gash JHC, da Rocha HR, Shuttleworth WJ, NobreCA, Maitelli GT, Zamparoni CAGP, Carvalho PRA (1992)Dry season micrometeorology of central Amazonian ranchland.Q J Roy Meterol Soc 118:1083–1099
Copyright © 2022 FDOKUMEN