
Tropical and Subtropical Fisheries Technological Conference ...
442
SGR-114 Annual Conference Tropical and Subtropical Fisheries Technological Conference of the Americas in second joint meeting with: Atlantic Fisheries Technology Conference Program and Abstracts August29-September 1, 1993 Williamsburg, Virginia Florida Sea Grant College Program University of Florida Building 803 Gainesville, FL 32611-0409 8'~~ ~~~ COLLEGE PPP jPg~
-
Upload
khangminh22 -
Category
Documents
-
view
0 -
download
0
Transcript of Tropical and Subtropical Fisheries Technological Conference ...

SGR-114
Annual ConferenceTropical and Subtropical Fisheries
Technological Conference of the Americas
in second joint meeting with:
Atlantic Fisheries Technology Conference
Program and Abstracts
August 29-September 1, 1993Williamsburg, Virginia
Florida Sea Grant College ProgramUniversity of Florida
Building 803Gainesville, FL 32611-0409 8'~~ ~~~
COLLEGE PPP jPg~

ANNUAL CONFERENCE
TROPICAL AND SUBTROPICAL FISHEMESTECHNOLOGICAL CONFERENCE OF THE AMERICAS
in second joint meeting with
ATLANTIC FISHEMES TECHNOLOGY CONFERENCE
August 29 - September 1, 1993Williamsburg, Virginia
Conference Chairmen,
'W. Steven Otwell, Ph.D.Food Science and Human Nutrition Department
Florida Sea Grant College ProgramUniversity of FloridaGainesville, Florida
Proceedings compiled by:W. Steven Otwell, Ph.D.
The Tropical and Subtropical Fisheries Technological Society of the Americas is aprofessional, educational association of aquatic food product technologists interested in theapplication of science to the unique problems of production, processing, packaging, distribution, andutilization of tropical and subtropical fishery species be they harvested, cultured or imported. Thesister organization, Atlantic Fisheries Technological Society has maintained the same meetingobjectives in the North through Mid-Atlantic coastal regions of Canada and the U.S. since 1957.
These papers are complied and reproduced with limited editions and without formal reviewby the Florida Sea Grant College Program. Content is the sole responsibility of the author s!. TheConference intent is to compile preliminary results from ongoing research and advisory services tofacilitate communication between regional investigators, industries, and government entities.Reproduction in this proceedings does not preclude supplementation and further publication of workin reviewed journals or similar productions,
Publication Date
October, 1994
NOTE: As of Executive Committee decision, Sept. 1994 the Tropical and Subtropical FisheriesTechnological Society of the Americas will henceforth be known as the Tropical and SubtropicalSeafood Sciences and Technology Society of the Americas acronym: SST Society!.
'George FlickDept. Food Science k Tech.VPI k State UniversityBlacksburg, VA 24061
'Robert ColletteeNational Fisheries Institute1525 Wilson Blvd., Suite 500Arlington, VA 22209

Ordering Conference Proceedings
The PROCEEDINGS is a compilation of papers presented at an Annual Conference of the Tropical and SubtropicalFisheries Society. Joint proceeding have been held with the Atlantic Fisheries Technological Society AFT! and the Gulfand Caribbean Fisheries Institute GCFI!. Some presentations are included only as abstracts based on the authors request.The Societies intent in issuing this PROCEEDINGS is to dissetninate preliminary results from ongoing research and advisoryservices to facilitate communication between regional investigators, indusnies and government entities.
The PROCEEDINGS can be purchased as individual volumes or as a unit of voiuntes. Tbe Florida SeaGrant program will provide tbe 12th-17th volumes for only SSO.OO
Florida Sea Grant ProgratnPO Box 110400
University of FloridaGainesville, FL 32611
Texas Sea Grant ProgramMarine Information ServicePO Box '1675
Galveston, TX 77553-1675
This program and eventual proceedings was complied by the Florida Sea Grant College Program with support IromNOAA OIIice of Sea Grant, U.S. Department of Cotnmerce, grant number NA89AA-D-SG053, functioning as a componentof the Florida Cooperative Extension Service, John T. Woeste, Dean, in conducting Cooperative Extension Work inAgriculture, Home Econotnics, and Marine Sciences, State of Florid, U.S. Department of Commerce, and Boards of CountyCommissioners, cooperating. Printed and distributed in furtherance of the Acts of Congress of May 8 and June 14, 1914.The Florida Sea Grant College is an Equal Employment-AI5nnative Action employer authorized to provide research,educanonal information and other services only to individuals and institutions that function without regard to race, color, sexor national origin.
December 1994
$15.00
1st2nd
3rd4th5th
6th7th
8th
9th
10th incl. 10 year index!11th
12th joint with AFT!13th
14th
15th joint with AFT!16th
17th joint with GCFI18th joint with AFT!
$10.00
$10.00$10.00$10.00$10.00
$10,00
$10.00
$12.00
$15.00
$15.00
$15.00$10.00
$10.00$15.00
$10.00
$15.00
$
Out of PrintTexas Sea Grant~
Texas Sea Grant
Texas Sea GrantTexas Sea GrantTexas Sea Grant
Texas Sea Grant
Texas Sea Grant
Texas Sea GrantFlorida Sea Grant~~
Florida Sea Grant
Florida Sea Grant
Florida Sea Grant
Florida Sea Grant
Florida Sea Grant
Florida Sea Grant
Florida Sea Grant
Florida Sea Grant

TABLE OF CONTENTS
FDA SEAFOOD HACCP INSPECTIONPhilip Spiller, FDA � Washington, DC...,
THE CANADIAN DEPARTMENT OF FISHEIES AND OCEANS'QUALITY MANAGEMENT PROGRAMVance McEachern, Department of Fisheries and Oceans, Canada...
POLYPHOSPHATES: RATIONALE FOR USE AND FUNCTIONALITYIN SEAFOOD AND SEAFOOD PRODUCTSLucina E. Lampila, Albright k Wilson Americas, Virginia...... 13
FUNCTIONALITY OF POLYPHOSPHATESJoe Regenstein, Xiaowen Lu, Denise Weilmeir, Cornell University 21
43
FUNCTIONAL, MICROBIOLOGICAL AND SENSORY CHANGES IN SEASCALLOPS PLACOPECTEN MAGEI.LANICUS! TREATED WITH SODIUMTRIPOLYPHOSPHATKD DURING ICKD STORAGET, Rippen', H. Sutton', P, Lacey', R. Lane', R. Fisher', W. DuPaul''Virginia Polytechnic Institute and State University and'College of WiHiam and Mary
THE APPLICATION OF PHOSPHATES IN THK PROCESSING OFPACIFIC SHRIMP OR WHAT'S SO DIFFERENT ABOUT THK USK?Paul G. Taylor, Evergreen Food Ingredients, Washington 72
USE OF PHOSPHATES WITH SOUTHKRN PENAKID SHRIMP
W. Steven Otwell, University of Florida 78
DETERMINATION OF TRIPOLYPHOSPHATE AND RKLATKD
HYDROLYSIS PRODUCTS IN PROCESSED SHIUMP
Douglas Heitkemper, Lisa Kaine, David Jackson and Karen Wolnik, FDA - Ohio
CONSUMER EVALUATIONS OF PHOSPHATED SHRIMP AND SCALLOPS
LeeAnn Applewhite', W. Steven Otwell' and Laura Garrido', 'Florida Dept. ofAgriculture and Consumer Services, 'University of Florida............... . 101
COMPUTER-BASED PATHOGEN CONTROL
J.W. Boling and R.M. Lane, Virginia Tech. . 107
MOISTURE CONTENT OF SCALLOP MEAT: EFFECT OF SPECIES, TIMEOF SEASON AND METHOD OF DETERMINING "ADDED WATER"J.R. Botta and F.M. Cahill, Department of Fisheries and Oceans, Canada,.......

LISTERIA IN SHELLFISH PLANT ENVIRONMENTS: PREVALENCE ANDCONTROL IN VIRGINIA
A.A. Diallo', D.R. Patel, George R. Flick',R. F. Wittman', K, Skyles',R.E. Croonenberghs', 'Norfolk Department of Public Health, 'Division ofConsolidated Laboratory Services, Department of Food Science 4,Technology, VPI/VSU and 'Division of Shellfish Sanitation, Virginia...,... 117
SURVIVAL OF LISTERA MONOCYTOGENES IN LOBSTER MEATDURING SELECTED HEAT TREATMENT CONDITIONSAurea Cormier, Solange Chiasson and Helen Malouin,Food Research Centre, Canada . 127
LISTERlA MONOCYTOGENES AND SALMONELLA SSP. IN MODIFIEDATMOSPHERK PACKAGED CHANNEL CATFISHJuan Silva, Tess White and Nawarut Sunyavivat, Mississippi State University 136
NON CULTURABLE VIBRlO PARAHAEMOL YTICUSXiuping Jiang and Tuu-Jyi Chai, University of Maryland .. 145
LOW DOSE GAMMA IRRADIATION OF PLESIOMONAS SHIGELLOIDESIN SHRMP PENAEUS SETIFERUS!R.M. Grodner and M.B. Gutierrez de Zubiaurre, Louiaiana State University,.... 161
CONTROL OF LISTERIA MONOCYTOGENES IN BLUE CRAB MEATUSING LACTIC ACID BACTERIA FKRMENTATESAlan J. Degnan', Charles Kaspar', Rendi Murphree, Steve Otwell',Mark Tamplin' and John Luchansky', 'University of Wisconsin,and University of Florida 173
RELATIONSHIP BETAKEN PARALYTIC SHELLFISH TOXIN PRODUCINGDINOFLAGELLATE ALGAE AND ASSOCIATED BACTERIA
W. Dantzer and R.E, Levin, University of Massachusetts................. 180
VIBRlO VULNIFICUS IN SHELLFISH: AN EXAMINATION OF PUBLIC
HEALTH RISKS AND PUBLIC HEALTH POLICY RKCOMMENDATIONS
R.J. Wittman and R.E. Croonenberghs, Virginia Department of Health........ 191
PROPERTIES OF FISH GELATIN
Xiaowen Lu, Denise Weilmeier, Kathryn Chapman and Joe RegensteinCornell University . 203
RAPID TEST KITS FOR DKTECTION OF LISTERIA MONOCYTOGENES: A REVIEWV.M, Garrido and W.S. Otwell, University of Florida .....,................ 110

STORAGE STABILITY OF HYDROGENATED MENHADEN OILSHORTENING IN COOKIES, CRACKERS AND SNACKSKathryn Chapman, Ifat Sagi, Joe Regenstein, Tony Bimbo, Jane Crowtherand Clyde Stauffer, Cornell University
EFFECTS OF SODIUM LACTATE AND POTASSIUM LACTATE ON COLOR,pH, AND BACTERIA COUNTS OF TILAPIA HELD IN OVKRWRAPPING,VACUUM SKIN PACKAGING, AND MODIFIED ATMOSPHERESY.W, Huang and C.Y. Huang, University of Georgia............... . 228
EFFECTS OF TANNIC ACID, GALLIC ACID, AND PROPYL GALLATEON STORAGE LIFE OF CATFISHY.W. Huang', I. Low', K.T. Chung, and C.Y. Huang',University of Georgia . 234
EXTENDING SHKLFLIFK OF SEAFOOD WITH ACETIC ACIDY. Benja-arporn, S, Einarsson and S.M. Constantinides, University of Rhode Island . 240
PRESERVATION OF GURRY HYDROLYSATES WITH THE PROPIONICACID FERMENTATION
M. Mahmoud and R.E. Levin, University of Massachusetts...........,, . . 249
260
PROTEIN HYDROLYZATKS FROM AQUATIC SPECIESFereidoon Shahidi, Xiao-Qing Han, Jozef Synowiecki and Ryszard AmarowiczMemorial University of Newfoundland, Canada . 272
AN ECONOMIC ANALYSIS OF THK SOUTHEAST U.S.SEAFOOD PROCESSING INDUSTRY, 1973-90Walter Keithly, Jr., and Kenneth Roberts, Louisiana State University . . 278
SOME QUALITY CHARACTERISTICS OF FARMED COD, GADUS MORHUA!Fereidoon Shahidi and Edward Dunajski, Memorial Univ. of Newfoundland . 290
MANAGEMENT OF BLUE CRAB PROCESSING WASTES
G.D. Boardman, C.L. Wolfe, T.D. Harrison and G.W. FlickVPI k State University . 296
PREVENTIVE MAINTENANCE AND PARTS INVENTORY
CONTROL PROGRAMS
GeofFrey M. Knobl, VPI k State University , 318
CAPILLARY ZONK ELECTROPHORKSIS OF FRESHWATER WHITEFISH COREGOXUS CLUPEAFORMIS! SACOPLASMIC PROTEINS DURING MODIFIEDATMOSPHERE PACKAGINGEileen LeBlanc, Zenia Hawrysh, H. Joan Turchinsky and Raynald LeBlancUniversity of Alberta, Canada

OXIDATION AND LIPOLYSIS OF LIPIDS IN CHANNEL CATFISH
DURING FROZEN STORAGE
Marilyn Erickson, University of Georgia................ , 329
A SIMPLE, RAPID SOLVENT EXTRACTION METHOD FORDETERMINATION OF TOTAL LIPIDS IN FISH TISSUE
C.M. Lee, B. Trevion and M. Chaiyawat, University of Rhode Island , 337
MOISTURE CONTENT OF NORTH CAROLINA BAY, CALICO ANDSKA SCALLOP MEATS AT HARVEST, PROCESSING AND RETAILDavid Green and Relno Korhonen, North Carolina State University , 344
KXOPEPTIDASKS AS BY-PRODUCTS FROM SHELLFISH VISCERA
N.F. Haard, F.L. Carcia-Carreno and N. Dimes, University of California.... 352
OXIDATIVE STABILITY OF VARIOUS OILS AS DETERMINED
BY RANCUMIT METHOD
Victor Nwosu and Leon Boyd, North Carolina State University...... , 368
CORRELATION OF SENSORY DECISIONS WITH CHEMICAL
INDICATORS OF SEAFOOD ACCEPTABILITY
W.F. Staruszkiewicz, FDA - Washington, DC . 374
. 388
QUANTITATIVE DECRIPTIVK ANALYSIS OF AMPHIPOD BROTHSClaire Martin, Joel de la Noue and Lucien Adambounou, Universite Laval andUniversite du Quebec - 398
U.S. DEPARTMENT OF AGRICULTURK PROGRAMS SUPPORTINGAQUACULTURAL PRODUCTS SAFETY AND QUALITYGary Jensen, USDA - Washington, DC...........,........, 408
EFFECT OF DIFFERENT LIPID LEVELS ON THK UPTAKE AND
DEPURATION OF PKTROLKUM HYDROCARBONS BY ATLANTIC SALMON
R.G. Ackman, S. Zhou and H. Heras, University of Nova Scotia, Canada.........

ABSTRACTS
FDA CERTIFICATION PROGRAM FOR SEAFOOD EXPORTED TO THE ECRichard Dees, FDA -Washington, DC.......,....,....,,..... . 416
STATUS OF THE U.S. DEPARTMENT OF COMMERCE INSPECTION PROGRAMTimHansen, NMFS - Silver Springs.......,.....,....
. 416
USDC CERTIFICATION PROGRAM FOR SEAFOOD EXPORTED TO THE ECRobert Nordstrom, NMFS........,....,.....,....,,....
416
MANDATORY NUTRITION I.ABELING UPDATEJanet Walraven, FDA - Washington, DC.......
. 417
OVERVIEW OF PHOSPHATE USE IN SEA SCALLOP PROCESSINGRobert A, Fisher, Virginia Institute of Marine Sciences........... . 418
REGULATORY PERSPECTIVE ON THE USE OF PHOSPHATES IN THE SEAFOODINDUSTRY WITH EMPHASIS ON SCALLOPSJeS.ey W. Bier and Millie Benjamin, FDA - Washington, DC . 418
DETECTION OF ADDED PHOSPHATES IN SEAFOODSJudith Krzynowek and Laurie J. Pannunzio, NMFS - Gloucester . 419
FOOD SAFETY AND SAMTATION IN THE SEAFOOD INDUSTRYDale L. Fredell, Klenzade, Minnesota
. 419
A NEW LOOK AT REGULATORY MICROBIOLOGICAL STANDARDS,SPECIFICATIONS AND GUIDELINES FOR SEAFOOD PRODUCTSE. Spencer Garrett, NMFS - Pascagoula...........,....... , 420
HACCP FOR MICROBIOLOGICAL HAZARD CONTROL IN SEAFOODPROCESSING PLANTS
Barbara J. Jackson, VICAM, Massachusetts . 420
THE REVISED FISH LIST
Spring Randolph and Mary Snyder, FDA - Washington, DC . 421
HACCP CURRICULUM IN A COLLEGE PROGRAM
Laxman Kanduri' and Martha Hudak-Roos, Kingsborough Community College'and MHR Consultants'............,............- , 422
These abstracts represent presentations provided during the conference, yet the authors didnot submit a formal paper.

viii
TEMPERATURE MEDIATED MULTIPLICATION OF VlBR10 VUl'Nll lCUSIN SHELLSTOCK OYSTERS
David Cook, FDA � Dauphin Island . 422
IMPROVED ENRICHMENT BROTH FOR RECOVERY OF VlBMO VUl.NIFICUSW, Y. Hsu, C.I. Wei, R.L. Murphree and M.L. Tamplin, University of Florida 423
PREPARATION OF MONOCLONAL ANTIBODIES TO SANITOXIN USINGRECOMBIANT PHAGE ANTIBODY SYSTEM
Stephen May6eld, NMFS - Gloucester,,... . 423
BIOCHEMICAL, SEROLOGICAL AND MOLECULAR CHARACTERISTICOF ENVIRONMENTAL AND CLINICAL VIBRIO VULNIFICUS STRAINSV.V. Gangar', R.L. Murphree', C. Buchrieser', C.W. Kaspar, V. Garrido',J. Simonson', R.J. Siebeling' and M.L. Tamplin', University of Florida',University of Wisconsin,and Lousiana State University'...,,........ . 424
DETECTION OF CIGUATERA TOXINS IN FINFISH USING CIGUATECT TEST KITSDouglas Park, Hawaii Chemtect International/University of Arizona.... 424
AN INTERMEDIATE MOISTURE PRODUCT FROM MACKEREL USING SALTING,FERMENTAT1ON AND DRYING
Kolli Punna Reddy and T.M.R. Setty, Univ. of Agricultural Sciences............ . 425
RHEOLOGY OF FISH GELS
Tyre Lanier and Donald Hamann, North Carolina State University . 425
426
PHYSICAL PROPERTIES OF ATLANTIC MACKEREL SURIM
Jin Kim', Stephen Kelleher and Herbert Hultin, Mississippi State Umversityand University of Massachusetts'....................... . 426
IMPORTANT CONSIDERATIONS IN DEVELOPMENT OF VALUE-ADDED
FISH MINCE-BASED PRODUCTS
Chong Lee, University of Rhode Island..................,..., . 427
PACIFIC WHITING PRODUCT DEVELOPMENT
Michael Morrissey, Oregon State University,.... , 427
EFFECT OF EXPOSURE TO LOW PH ON THE SOLUBILITY OF FISH MYOFIBRILLAPROTEINS IN WATER
Stephen Kelleher, Michella Ferrante and Herbert Hultin, University of Massachusetts.

THE EFFECTS OF FROZEN STORAGE TEMPERATURE ON THE HIGH QUALITYSHELFLIFE OF SELECTED SEAFOODSRobert Learson and Kurt Wilhelm, NMFS, Gloucester .. . 427
USE OF ELECTtuCAL STIMULATION TO CONTROL SEAFOOD QUALITYJ.R. Botta and J.W. Kiceniuk, Canadian Dept. Fisheries and Oceans , 428
HANDLING FRESH TUNA IN DISTRIBUTIONMary Losikoff FDA - Washington, DC . 428
BIOLOGICAL PROCESSING OF SARDINE PLANT WASTEWATER ANDAPPLICATION OF AGRICULTURE
Georgia Wilson and Patricia Oliver, Instituto Tecnologic y de EstudiosSuperiores de Monterrey........................,... . 429
ANTIMICROBIAL ACTIVITY OF CHITOSAN
G. Trachy, J. Goulet et G. Picard, Universite Laval, Canada , 430
SENSORY ANALYSIS APPLICATIONS TO HARMONIZE EXPERT ASSESSORSOF FISH PRODUCTS
Roberta York and Terriann I. Reilly, Canadian Department of Fisheriesand NMFS - Gloucester . 430
DEVELOPMENT OF OFF-FLAVOR IN HYBRID STRIPED BASS GROWNIN RECIRCULATING AQUACULTURE SYSTEMSGeorge Flick', Gail Marshall', Joe Boling', Janet Webster' and George Libey',Virginia Tech.' and Brown Ferman Beverage Co.' . 431
MODELLED INTERACTIONS WITH FISH MUSCLE
Joe Regenstein, Cornell University.........,,, . 431
USE OF GRAS COMPOUNDS TO ELIMINATE VIBRIO VULNIFICUS FROM OYSTERS
James Oliver, University North Carolina - Charlotte 431
PILOT PLANT PRODUCTION OF MACKEREL SIJRlM
Herbert Hultin, University of Massachusetts . 431
FATTY ACID AND PROXIMATE COMPOSITIONS OF WILD AND CULTURED GULF OFMEXICO STURGEON, ACIPENSER OXYTHYNCHUS DESTOTOII.C. Chen, Frank Chapman, and Sean O'Keefe, University of Florida............... 429

FDA SEAFOOD HACCP INSPECTION
Philip SpillerFood and Drug Administration
OfBce of Seafood, HFS-40IWashington, DC
Text based on actual oral presentation!
Thank you, I appreciate the opportunity to talk to you today about the application of HACCP toseafood. Last march, Commissioner Kessler announced an intention on the part of FDA to requiresomething called HACCP of the seafood industry. This requirement is to be initiated through theissuance of a federal regulation, first as a proposal for public comment, then as a final document,Neither of these documents has published yet, although we hope the proposal will shortly, so myremarks will intentionally be long on general policy considerations and short on detail.
Dr. Kessler's announcement of last March has been commonly characterized'as involving "HACCPinspection" of seafood. That is true in part. Actually, HACCP is something that the industry woulddo, while FDA would examine how well these establishments were doing it, among other things,during the course of FDA's inspections of seafood processors and establishments.
As an aside, it is Sir to say that Dr. Kessler's speech generated a considerable amount of interest. Wein the FDA of6ce of seafood immediately found ourselves in great demand by the media, and if it istrue that we all have been allotted 15 minutes of fame in this life, we quickly ran through ourallotment thanks to HACCP.
One morning, for example, I found myself with less than 30 seconds at my disposal to try to explainover the radio to the morning commuters in Tampa, Florida, what HACCP is all about and why theyshould be pleased that it was coming. I'm still not quite sure what I said.
But I remember what the commissioner said last March. The essence of it is worth reiterating todaybecause it forms the basis for our emerging policy in this area. He said the following:
~ First, food safety will be a major issue that will occupy federal policymakers over thenext several years.
~ Second, that while the public does not expect absolute assurances that food isperfectly safe, they do expect that a system is in place to ensure that food is as safeas we can possibly make it.

~ Third, that the current system of food safety regulation is too reactive and places toomuch of the burden on the taxpayer to 6nd problems, What is needed is a system thatis built on preventing problems in the food supply and that gives regulatory agenciesthe tools to know that the system is working.
~ Fourth, that the best way to do that is to institutionalize basic preventive controls toensure safety. And the best way to do that is by companies developing and followingstate-of-the-art quality assurance plans and by the government verifying that the plansare being successfully carried out.
The commissioner then used seafood as an example of both how and why such a preventive systemcould and should be applied.
As I am sure we all know by now, HACCP, or hazard analysis critical control point, is a system ofpreventive controls that can be applied by a food producer to ensure, to the maximum extent possible,the safety of the food being produced.
HACCP was 6rst applied to food by pillsbury in the late 1950's during that company's eSort todevelop food for astronauts, after it occurred to them that the amount of end-product testingnecessary to ensure safety would use up most of the food. So they tried an opposite approach thatwas designed to prevent hazards Rom occurring in the 6rst place rather than to catch hazards at theend through testing. The result is a system that has become recognized throughout the developedworld.
Briefly, a processor operating a HACCP system develops and implements a HACCP plan that
~ ID's likely hazards that could cause the product to be unsafe to consumers;
~ ID's what have been termed critical control points in the process where a failurewould likely cause the hazard to occur;
~ ID's critical limits, or proper operating parameters, for each critical control point;
~ Includes monitoring procedures for tracking the performance of critical control pointsand recordkeeping procedures for recording the results of that monitoring.
As envisioned by Pillsbury, HACCP could be applied to hazards that could occur in the plant andthose that could occur before a processor takes possession of raw materials. The latter types ofhazards could include those with an Environmental origin, such as toxins in seafood. For these typesof hazards, the receiving dock becomes 6guratively, and in many cases literally, the 6rst criticalcontrol point in a HACCP system.
To the extent that it is reasonable and appropriate for the federal government to mandate HACCPcontrols within the food industry, seafood is, in our view, a good place to start, For the reasons that

I will discuss. Although, as an aside, FDA first applied HACCP principles to the regulation of lowacid canned foods in the 1970's to control botulism, so seafood would really be number two.!
The philosophical underpinning for government-mandated HACCP is the view that the industryshould be responsible for the safety of the food it produces. This responsibility should be exercisedby design and not by happenstance. And for those who appreciate an alliteration, that design mustbe demonstrable. The role of the government should be that of verifier that the industry is meetingits responsibility.
Now lets apply that philosophy to seafood.
~ Since seafood is still predominantly wild-caught, it is at least potentially exposed toa wide range of natural hazards and hazards &om human pollution.
~ It is the most perishable of all flesh foods.
~ It is consumed raw much more than any terrestrial flesh food.
~ It consists of literally hundreds of species &om all over the globe, many having littlein common other than an aquatic origin.
~ No other flesh food is imported in such quantity or &om so many places � over 135countries. Some of these countries have advanced regulatory structures for seafoodsafety, but many do not.
~ It has a far flung distribution system that can afFect both safety and shelf life.
~ Some recreational activity finds its way into commercial channels,
~ The seasonal nature of the business, sometimes at very remote locations, presents theindustry with special challenges in terms of training and facility upkeep.
Given these realities, it is imperative that those who handle and process seafood for commerce knowthe potential likely hazards and demonstrate that the likely hazards are being controlled to the extentpossible.
It is not unusual, however, for FDA to receive inquiries about safety requirements and related mattersfrom individuals who wish to process or import seafood, or who already do, that indicate a lack ofawareness of hazards specific to their products,
For the most part, such knowledge is not a legal prerequisite to doing business. HACCP would goa long way toward making it so.
HACCP is not a zero risk system, but it is a system for preventing problems that are preventable, orat least significantly reducing the likelihood of their occurrence. Moreover, its use, in our view,

constitutes an appropriate alignment of industry and government responsibilities for food safety. Putanother way, HACCP provides an opportunity to link the food industry's system for producing safefood with the government's system of regulatory oversight.
The adequacy of the government's system of regulatory oversight of seafood has been seriouslyquestioned in recent years, as many of you probably know. Seafood, and the regulatory program forseafood, have been the target of considerable media scrutiny as well as congressional attention sincethe late 1980's. Both the number of bills relating to seafood regulation and the number of hearingsheld in the congress on the adequacy of the federal program are cumulatively in double figures overthe past three congresses. That is truly staggering. Seafood sales stopped growing around the sametime. There are many probable reasons why; consumer concern over safety probably contributes tosome degree. The industry itself went to the congress looking for additional legislation in order toregain consumer confidence. incidently, the overwhelming majority of seafood safety billsintroduced over the past several years would have authorized HACCP, either explicitly or implicitly,!
These in and of themselves are not reasons to institute HACCP, but they are not irrelevant either.
FDA's inspection program for seafood is mandatory, but it is far &om continuous, In the absence ofcause, FDA inspects at most once a year for products that it considers relatively high risk and at alesser &equency for relatively low risk products. To significantly increase the &equency of inspectionwould require resources that may well not exist any time soon.
These inspections provide us with a "snapshot" of conditions at the moment that the inspector is inthe plant. Assumptions have to be made about conditions during the bulk of the time that the plantis operating. The reliability of these assumptions over the intervals between inspections raisesquestions about the adequacy of the system.
Moreover, current federal inspection and surveillance strategies place a heavy burden on thegovernment to prove that a problem exists rather than on the firm to establish for itself, for theregulator, and for consumers, that adequate controls exist to ensure safety by design.
A similar situation exists for imports. Nearly 60 percent of the seafood consumed in the U.S, isimported. The number of U.S. customs entries for seafood is approaching 200,000 annually.FDA is committed to ending that imported seafood products meet the same standards that arerequired of domestic products.
Just as the adequacy of our domestic inspection fi equencies have been questioned, we have beenfrequently asked whether we physically ermine enough import entries. While our importexaminations are highly targeted and there are a number of other mitigating factors, the fact remainsthat most imported seafood is not physically sampled or examined by a federal health ofBcial.Incremng the physical sampling and analysis of seafood to statistically significant levels would costsubstantial additional health resources.
FDA is pursuing two ways of increasing the scope of coverage for imports and they are highlyinterrelated. The first involves the development of memoranda of understanding, commonly referred

to as 'MOVs," with countries that export seafood to the united states and have inspection programswe can rely on. The'purpose of a MOU would be to establish that the regulatory system of anexporting country and the regulatory system in the U.S. are equivalent in their ability to ensuresafety. An mou would provide for regular verification by both countries. Products &om a MOUcountry would not require as much examination by FDA as those from other countries.
The second approach is HACCP. HACCP should provide the basis for MOU's. MOU's based onHACCP could ensure that foreign processors are applying systems of preventive controls equivalentto those being required of domestic processors. But even in the absence of a MOU, we havetentatively concluded that all seafood, both domestic and imported, should be subject to HACCPcontrols, and we contemplate that our regulatory proposal will reflect that tentative conclusion.
The rest of the developed world appears to be heading in that direction. In some respects, we' replaying catch up.
There are a several additional points I would like to make about HACCP and our HACCP initiativefor seafood.
First, HACCP is a system that can "go with the fiow" in terms of technology. We do not expectprocessors to implement controls that are not technologically feasible, but we do expect processorsto be aware of what is reasonable and feasible and to integrate such measures into their HACCPcontrols. For example, there is no rapid test yet available for ciguatera so the controls that can bereasonably put in place to prevent the presence of ciguatoxin are limited in that respect, However,if and when an inecpmsive, rapid test does become available, it should constitute a HACCP controlwhere appropriate.
Second, we do not want HACCP to constitute an undue regulatory burden on the industry. In ourview, HACCP is really the systematic application of common sense measures to ensure safety, andthus should be an extension of what most people are or should be doing now. It does involve acertain amount of paperwork and plan development, but FDA is working to mitigate the burdenthrough the development of extensive guidelines on hazards and controls that will be made availableto the industty and through the development of fill-in-the-blank type plans to get people started.FDA cannot do that sort of thing alone. We look forward to working with and through tradeasscx~ons, sea grant colleges and others to help develop and provide as much technical assistanceas possible to the industry to facilitate the transition to HACCP.
One important aspect of this technical assistance involves basic training to the industry in HACCPprinciples and how to apply them. The National Academy of Sciences concluded in 1985 the successof our regulatory approach for low acid canned foods, which, as I indicated earlier is based on theapplication of HACCP principles, has been due to the training requirement in those regulations foreach processor. We are contemplating extending the low acid canned food approach to training forHACCP. Under that approach, training is conducted by the private sector after being approved byFDA. We are pleased that trade asmxiations and academia have both shown an interest in conductingHACCP training for the seafood industry.

Third, I am aware that there is some nervousness within the consumer community that HACCP isderegulatory in nature because inspections under a HACCP-based system would involve little morethat a quick look at industry-generated records of the history of critical control points. We do notexpect that to be the case. While we do expect that inspections under HACCP will be more efFectiveand efficient, they should provide the legitimate basis for increased, not decreased consumerconfidence, HACCP will build upon the existing system. It will be an additional tool for both theregulator and the industry, and will not simply be a wholesale replacement for of the current system.
Fourth, we hope that HACCP will provide the basis for additional federaUstate cooperative activity.We continue to believe that the states have a crucial role to play in seafood safety. The federalgovernment cannot even begin to do that job alone. Ideally, to the extent that states adopt HACCPprograms of their own, a federaVstate team approach to inspection can be greatly enhanced. We urgethe states to join with us in our HACCP initiative.
Fifth, after saying all that I have, I do not want to suggest that we believe that HACCP is the end-alland be-all of seafood safety. It isn't and we know it. It only works in conjunction with many otherthings, such as a strong research base, public education, a reasonable resource commitment, adequatetraining of federal and state oScials, and so on, But it can and should be an important part of thecore of the food safety system.
Finally, we are truly looking forward to the public input part of the regulatory process. We urgepeople to read the proposal carefully and we promise that we will read the public's comments backto us just as carefully.

THE CANADIAN DEPART1VIEBJT OF HSHERIES AND OCEANS'QUALITY MANAGHVKNT PROGRAM
Vance McEachern
Department of Fisheries and Oceans200 Kent Street, Station 906
Ottawa, Ontario, CANADA, K1A OE6
During the past 5 years the Department of Fisheries and Oceans and the Canadian fishprocessing industry have worked together to develop the Quality Management Program QMP! andon February 1, 1992, it became mandatory and is now a condition of federal registration for 6shprocessing plants.
Th In ion B ch Man te
The Inspection Branch of the Department of Fisheries and Oceans DFO! is mandated throughfederal legislation to inspect all fish and 6sh products intended for export &om Canada or for inter-provincial trade, and all fish and fish products imported into Canada. Through this mandate DFOprovides assurance that both domestic production and imported products meet Canadian and/orforeign country standards for grade, handling, identity, process, quality and safety.
For fish and 6sh products produced in Canada, DFO has a dual concern, the health and safetyof Canadian consumers and the overall quality of Canadian fish and 6sh products and theiracceptability in international markets.
Canada is a major exporter of fish products and exports 84'/o of its fish products. TheInspection Branch plays an important role in facilitating the trade of these Canadian fishery productsthrough its product inspection and certification programs.
To achieve its mandate the Inspection Branch has developed over the years a multi-facetedprogram that focuses on the strategic steps of the fish processing industry to ensure safe andacceptable fish products. This involves a variety of inspection activities which include the inspectionof:
domestically produced fish products to determine the acceptability of these productsfor sale in Canada or on foreign markets;
domestic fish processing establishments to determine the degree of compliance withconstruction, equipment and operating regulatory requirements;

domestic fishing vessels, unloading sites and transport vehicles to determinecompliance with the applicableconstruction and operating requirements;
imported product and the offshore processing operations to determine theacceptability of these products for sale in Canada; and
the monitoring of shellfish growing waters through the Canadian Shellfish SanitationProgram.
Approximately 100,000 fishermen and plant workers earn their living directly &om 6shing andfish processing and Canada is one of the world's largest exporters of fish.
There are approximately 1,300 fish processing plants operating in Canada and 40,000 fishingvessels.
In 1991 6sh landings amounted to 1.2 million metric tonnes of fish worth approximately 1,4billion dollars. The production of this fish amounted to approximately 3 billion doHars worth of finalproduct.
The Canadian Fish Inspection Program is a federal program delivered in 6 regions acrossCanada. They are as foHows:
Newfoundland, Scotia-Fundy, Gulf; Quebec, Central k Arctic, and Paci6c. Regional of6cesare responsible for the delivery of the inspection program and direction of the resources.
The Inspection Branch employs approximately 500 individuals.
320 Inspectors
80 Laboratory personnel
Across Canada there are 14 fish inspection laboratories and 120 Inspection of6ces.
In the 1980s it became apparent that present DFO resources dedicated to the InspectionProgram were stressed and unable to deliver effectively all of the elements of the program, DFO wasbeing forced to direct its resources at the activities of final product inspection and certification. Theother areas of the program were being neglected and the Department was not able to respond to newchallenges.
One of the key challenges will be to endure the scrutiny of the informed consumer and publicmedia. Because of the increase in contaminants, pollution and threats to the environment, there has

been an increase in media and public concern regarding the safety of the food supply in general andfish products in particular.
Cummt trends lead us to believe that there will be no let up in media attention in the 1990s.Today's consumers are better educated, better informed and concerned about the safety of the foodthey eat. In all probability the workload of all food inspection agencies will continue to increase.
The rapid pace of changing technologies is also presenting an additional challenge to industryand food inspection agencies. As the Canadian fish processing industry develops new products andprocesses the Fish Inspection Program must adapt its inspection methods to continue to meet itsmandate.
Another major challenge for the 90s will be responding to trade issues. The movementtowards Hazard Analysis Critical Control Point systems HACCP! in the United States and thedevelopments in the European Commuiiity are already indicating additional demands on the Canadianfish processors and the Fish Inspection Program. These countries and others are requiring moreassurances &om the Canadian Government that standards are being met.
The above fiictors are all external factors that will affect both the Inspection Branch and theCanadian fish processing industry; but there is also another key factor internal to government thatwill have an impact on all of the Canadian Food Inspection Agencies. That is the question ofresources.
The Canadian Government, as well as other western governments, are under constant pressureto limit spending and inspection programs such as the Department of Fisheries and Oceans andAgriculture Canada's cannot expect to have ever increasing resources to meet the challenges of thefuture. %e must find smarter and more cost effective ways to carry out our mandate.
The challenges of the 90s make it neces!iary for government and the food processing industriesto find, develop and implement innovative and cost effective approaches to food inspection. Thesenew approaches must be flexible and sensitive to the needs of the industry and permit industry toadapt and remain competitive in the changing markets.
The Department of Fisheries and Oceans' Quality Management Program QMP! is a keycomponent of our strategy for responding to the demands of the fiiture marketplace and addressingboth consumer and industry concerns. The Program has been jointly developed by the Canadian fishprocessing industry and the Department of Fisheries and Oceans and became mandatory February 1,1992. The QMP is based on the HACCP philosophy. QMP is, as HACCP is, a system designed toprevent instances of public health significance. However, QMP has been designed to also preventinstances of unacceptable quality and economic &aud &om occurring.
This is a fiindamental difference with the QMP and a pure HACCP Program.
QMP is closely linked to the Canadian Fish Inspection Regulations and the application of aQMP by a processing plant will assist the processor in operating within the regulatory requirements

which mean the fish produced wiH be safe, of acceptable quality and they will be marketed fairly. Byimplementing the Quality Management Program the fish processing industry will be able todemonstrate that they are operating on a day to day basis with controls that ensure compliance withthe regulations. The development of an individual Quality Management Program for a fish processingoperation incorporates aH of the basic steps involved in developing a HACCP system for a specificfood product, A hazard assessment of the process operation is performed. Critical control pointsare identified. Defect de6nitions and tolerances, monitoring procedures, record keeping criteria,corrective action systems, and company verification measures are established for each critical controlpoint.
As of February 1, 1992 each Fish Processing Plant is required by regulation to have in placeand be operating under a QMP specific to it's 6sh processing operations. The Department hasdeveloped the QMP Submission Guide to assist the industry in developing their programs. The Guidehelps the processor identify the Critical Control Points in the process and the associated hazards andsets out for the fish processing industry the minimum requirements for a plant's Quality ManagementProgram. Under QMP a fish processing plant is required to address 12 elements that are applicableto their operation. Potential hazards wiH be prevented through the application of controls at each ofthe elements in the process operation: .
"Critical Control Point" is de6ned as a point in tune or a physical location in the process atwhich failure of preventive measures wiH expose the customer to unacceptable risks related to tainted,decomposed, or unwholesome fish or to economic &aud.
At each Critical Control Point the fish plant must:
1.
2.
3.
4,
5.
6.
7.
8.
9.
10.
11.
12.
Incoming FishOther IngredientsPackaging MaterialLabellingChemicals cleaning agents, sanitizers, lubricants, and pesticides!Construction and EquipmentOperation and SanitationProcess Control
StorageFinal ProductRecall Procedures
Employee Qualifications
identify the standard that is being applied to ensure compliance with regulatoryrequirements;
identify the monitoring procedures and inspection &equencies that wiH be foHowedto ensure that the standard is being met during production;

identify the reporting mechanism that will be used at each Critical Control Point todocument the results of the inspections; and
the fish plant will be re:tuired to develop contingency plans or corrective action plansthat will be followed if and when the monitoring procedures identify an instancewhere the standard is not being met.
The fish processing plant wiH be required to have available for inspection their documentedQMP that provides a written description of the program being implemented in the processing plant.The plant will also be required to retain records of all inspections performed as part of their QMP for3 years. These records must be made available to DFO Inspectors when requested.
The Department of Fisheries and Oceans inspects the fish processing plant against the QualityManagement Program requirements. Individual Inspectors perform QMP Inspections that entail:
the verification of the written QMP to ensure the documented standards, monitoringprocedures, record keeping systems and guidelines for corrective action meet theminimum requirements as set by the Department of Fisheries and Oceans;
the confinmition that the written QMP is being followed in the plant. This will requirethe inspector to observe the processor's QMP activities at each critical control pointin the plant; and
the verification that the processor's records are accurate. This will require theinspector to withdraw and inspect parallel samples of the processor's products andcompare the results with those of the company's.
The completion of the QMP Inspection will result in the process operation being rated aseither Excellent, Good, Satisfactory, or Fail. These QMP ratings represent the degree of confidencethat DFO has in the company's ability to operate within compliance of the regulations and willdetermine the inspection coverage to be directed at the operation in subsequent weeks. Fail ratedplants will be asked to voluntanly correct the deficiencies and improve their rating to at least a"Satisfactory". Refusal to deal with the problems voluntarily will jeopardize the federal certificateof registration and therefore the ability of the processing plant to export its products. Plants whichreceive a "Satisfactory" rating will be inspected on a Sequent basis until they gain greater control overtheir process and obtain a higher rating.
Processing operations that are successful in meeting all but a few of the QMP requirementswill receive an "Excellent" or "Good" rating. These plants will be qualifie to apply for the use ofthe "CANADA INSPECTED" logo on their product labels. Also the product certification processwill be streamlined and provided without delay, and the company will have more autonomy in theirday to day processing operation.

The u i M mnPr R 1
The major change for industry under QMP is that they must accept more responsibility andaccountability in monitoring their own performance. The processing plants will be required toperform inspections of the plant and products and initiate corrective actions when they identify aproblem and records of all these QMP activities must be maintained so that they are able todemonstrate that they consistently operating in compliance with the regulations.
Th R l ofGov rnm n inR I in n er MP
The Inspection Branch of DFO is confident that the Quality Management Program willprovide the Canadian fish processing industry and the Department of Fisheries and Oceans with aneffective mechanism to ensure the protection and assurance needed in today's demanding markets,The price of this assurance is change.
DFO will have to change. Industry will have to change. But this approach should realizemore impact &om each inspection. The number of inspections we do in total may be somewhatreduced for some plants, but each inspection will count for more. We will be able to focus our efforton areas of higher risk and apply our resources in a more cost effective manner.
In summary, the Department of Fisheries and Oceans' new approach to quality managementis a joint industry/government system which is aimed at preventing problems before they occur,Working together, through the Quality Management Program the Canadian Fish Processing industryand the Federal Government will be able to provide Canadian consumers and our internationalcustomers even better a!wmnce than in the past that the high standards Canadian fish products havebeen known for will be met in the future.
The implementation of the Quahty Management Program will mean a change in therelationship between the fish processing industry and the Department. Under QMP the Departmentof Fisheries and Oceans' role wiH shift from solely an inspection function to include an auditingfunction. The Inspector will continue to perform random inspections of the process operation andproducts but the focus will not be on individual lots of product or on a day of plant operation as nowis the case, but rather on the overall QMP system. The Inspector's decisions will be based upon acompilation of inter-related inspection results gathered over time by both the Inspector and theprocessor.

POLYPHOSPHATES: RATIONALE FOR USE AND FUNCTIONALITY INSEAFOOD AND SEAFOOD PRODUCTS
Lucina E. LampilaAlbright k Vinson Americas
P.O. Box 26229
Richmond, VA 23260-6229
Among the legitimate functional goals for the use of phosphates in seafoods are retention ofnatural moisture and Qavor, inhibiting Quid losses during shipment and prior to sale, emulsification,inhibiting oxidation of favors and lipids by chelation of heavy metals and cryoprotection, thereby;extending shelf-life. Properly used, phosphates impart no Savor.
Recently, the use of phosphates in some segments of the seafood industry has been subjectto government scrutiny. When improperly used, excessive absorption of moisture may lead tocharges of economic fiaud by the U.S. Food and Drug Administration. It is important to note,however, that seafood myofibrillar proteins readily denature at reNgeration temperatures �'C! andmay lose up to 80/o of their water-binding capacity within five days �0! while similar changes to beefmuscle take in excess of 45 days at >20 C 8!. Failure to protect these delicate proteins leads tosignificant overpack to meet net stated weight and negative economic consequences to seafoodprocessors.
Phosphates are refined &0m calcium phosphate which is mined. Through varying degrees ofneutralization of phosphoric acid with either alkali metal ions i.e., sodium or potassium! or alkalineearth metah i.e., calcium!, two gener@ classes of phosphates simple and condensed! are formed �!.Simple phosphates consist of a phosphorous atom surrounded by four oxygens and valences that canbe Sled by metal ions or hydrogen. Condensed or combined phosphates are short to long chains orrings, the latter forms have the broadest applications in the seafood industry.
A li ti n fPh hat
Phosphates are generally applied by dipping in, spraying with or tumbling in a phosphatesolution. Injector needle systems may also be used with and without added tumbling. Dry additionis used in comminuted meat systems, e.g., surimi and sausage formulations.

The most predictable way to apply phosphates is through vacuum tumbling, if done properlyand the structure of the Qesh can withstand mechanical action. Contrary to some practices, tumblingin an excess of solution results in protein extraction rather than absorption of solution. This uniformand rapid means of treating the muscle offsets the inef6ciency of protracted holding in phosphate-based solutions soaking!.
It has been demonstrated that treating finfish prior to smoking requires different phosphatecoexntrations depending on the dimensions of the 611ets and/or pieces. For example, with the samesize pieces of flesh within selected species!, a 5/o phosphate dip requires 24 hours treatment timewhile a 254/o phosphate dip requires only two seconds �6! to reach equal processing effects, i.e.,inhibition of surface curd formation and reduced cook-cool losses. This is especially valuable whendelicate muscle structure eliminates tumbling as an option. Caution should be exercised whenapplying phosphates to fish of different muscle thickness, muscle types e.g., interspecies variation!and initial moisture content spawning!.
Methods to D rmine Phos hate A li i n
Some methods to monitor phosphate use are based upon total moisture content of the muscle.One example would be the French HP 9! method which is used to monitor the ratio of protein towater within muscle. In scallops, the ratio is considered to be between 4.0 and 4.9: 1.0 water:protein!. The moisture content of commercially harvested seafood muscle is 80/o or greater inspecies including, but not limited to, soft-shell blue crab, some mollusks and post-spawned fin6sh.Webb et al., �1! determined that the moistute content ofbay scallop meats was significantly differentat the 54/o level between harvest years, sounds, locations within the sounds and among months andwithin locations. These researchers �1! also determined that the moisture content monthlysampling! of land-shucked bay and Calico scallops ranged between 74.15 to 83.66 and 76.12 to81.86/o, respectively.
The HP ratio then would not be realistic for many species or at certain times of year. Thisvalue is based upon Kjeldahl protein to moisture overnight drying at 100 to 105'C!.
In theory, determination of total phosphorous in seafoods might be a useful marker ofphosphate treatment; however, it is not necessarily accurate. For example, Crawford �! determinedthat the natural level of phosphorous in fiesh shrimp ggndulus ~re! ranged &om 537 to 727mg/100 gm, Shrimp of the same history showed increases of 81+39 and base not given! +110 mgof phosphorous, respectively after treatment with either 1.5 or 6'/o phosphate solutions for 6veminutes. In shrimp Qm~httus~ordani, the naturai vmiation in phosphorous exceeded that added byresponsible treatment.
Total natural phosphorous has also been reported to vary in lobster, blue mussels, squid,anchovies, carp, capelin, catfish, Atlantic cod, eel, hake, herring, yellow leatherjacket, Europeanpilchard and albacore tuna �3!. Penetration of phosphate, and therefore phosphorous content, willalso vary according to concentration of solution used, variations in muscle thickness, subsequentprocessing, etc.

Other methods to screen for added phosphates include high pressure hquid chromatography HPLC!, ion chromatography and thin layer chromatography, Wood and Clark �2! have reviewedthe dif5culties associated with these phosphate determinations.
Biochemical decomposition of condensed phosphates necessitates assaying immediately akertreatment of the seafood species. Hydrolysis of condensed phosphates occurs due to muscle alkalinephosphatase activity during the post-treatment lag! time prior to cooking. Sutton �5! determinedthai sodium tripolyphosphate is rapidly hydrolyzed to pyrophosphate phosphate dimer! andorthophosphate phosphate monomer! in cod muscle at either zero or 25'C.
It has also been determined that after two weeks of &ozen storage -26'C!, only 12% of thetotal phosphorous in raw shrimp muscle corresponded to the originally added sodiumtripolyphosphate. By ten weeks, phosphorous levels corresponded to 45% orthophosphate �7!.Clearly, in treated seafood muscle, the condensed phosphates were unstable over time.
M h 'm fActin
OfFer and Trinick �1! determined that pyrophosphate [�0 mM!, &om beef myofibrils!] incombination with reduced levels of sodium chloride, extracted the A-band completely beginning atboth ends. This effect was confirmed by Voyle et al. �984! with pork. In the absence ofpyrophosphate, however, only the center of the A-band was extracted. Lewis et al. �986!determined from 5 gm pork, beef, chicken and cod samples that an A/I overlap composed ofdenatured actomyosin and connectin was formed while unassociated myosin and actin were probablydispersed sol! through the meat structure in the form of a water-holding gel post heat treatment!,
Trout and Schmidt �8! concluded that at high ionic strengths W.25!, pyrophosphateaffected hydrophobic interactions which stabilize the protein structure, and thus, the thermal stabilityof the protein. Elevating pH �M NaOH!, in combination with pyrophosphate, increased thetemperature from 70 to 87'C! for, and the extent of, protein aggregation. Yagi et al. �5! confirmedthat inorganic polyphosphate ofFered a high degree of protection to carp myofibrils! from thermaldenaturation.
Water retention is correlated with increased pH and normally associated with the use ofalkafine polyphosphates such as sodium tripolyphosphate. Orthophosphates have virtually no effecton water-binding �2!. Pyrophosphates are associated with improved protein solubility myosin! andwater binding. Consequently, water binding is dependent upon the type of phosphate used andspecific physicochemical reactions may require the use of blends.
Ph Proc in 'd
This area will be given only a cursory mention since it is a topic of a later presentation.Crawford �! was instrumental in developing a protocol for the treatment of Pacific shrimp ~an ggs~rggi! to be mechanically cooked and peeled. By the responsible use of phosphates in treatingPacific shrimp to be mechanically cooked and peeled, meat yield increased an average of 12%. Therewas no significant uptake of moisture, and there was an added ex-plant income in Oregon alone! ofgreater than 65 million dollars in the first eight years of use I!.

Pr rvati n fFr hn s
A process for using low concentrations � to 2/o! of sodium tripolyphosphate in either fakedor crushed ice was patented by Stone �4!. Use of this ice increased the yield of shrimp andeffectively reduced moisture and nutrient loss. Shrimp stored in phosphated ice could be over-exposed to polyphosphates if treated again during fiirther in-plant processing which could cause eitheroff-fiavor, W.5/o residual phosphate or both.
Among products for extending the shelf-life of fish fillets, Crawford �, 3! developed apatented blend consisting of sodium tripolyphosphate, sodium hexametaphosphate, citric acid andpotassium sorbate RSH-PLUS", BK Ladeiiburg Corporation!. Fish fillets were dipped into eitherdistilled water or ca.! 124/o treatment solutions. The shelf-life aerobic plate count < 1 x 10~ CFU/g!for treated samples was 12.4 days and that of the control water-dipped! was 6.8 days. Both controland treated fillets increased in weight by 4'/o after 60 seconds of immersion. Those dipped in thepatented blend remained at their stated package weight throughout the 14 days of storage at 5'C,while the controls, dipped in water, dropped below the initial weight within four days of chill storage.Shelf-life extension would most likely be increised due to, first, the antimicrobial activity contributedby the sorbic acid, and second, the sequestration by phosphates of enzyme metal! co-factors.
Researchers at Texas A8cM University reported that sodium tripolyphosphate dissolvedslowly in seawater �!. In addition, &esh, shell-on and peeled shrimp Gulf of Mexico! becametranslucent and slippery to the touch after dipping in solutions of phosphate-sea water. This led tosubsequent treatments which included five minute dips in water and 2, 4 or 5/o condensedphosphates. Using a blend of sodium tripolyphosphate and hexametaphosphate BRIFfSOL~ 512,BK Ladenburg Corporation! resulted in rapid solubilization of the condensed phosphate, and moredesirable sensory touch! properties. The dipped shrimp were &ozen and stored at -26'C for twoweeks. Upon thawing and cooking four mins!, those shrimp dipped in the 4'/o blend for five minuteslost 0.8'/o weight after &ozen storage control, 2.0'/o loss! and 19.8/o after cooking control, 25.3/oloss!. It was concluded that addition of these phosphate blends imparted a cryoprotective effect.
%oyewoda and Bligh �4! dipped Atlantic cod fillets into 12/o solutions of sodiumtripolyphosphate, sodium metaphosphate blends or no solution BKEZ-GARD' FP-19, FP-65[Rhone-Poulencj and a control, respectively! for 45 seconds and stored each treatment at either-12 C or -30'C for up to 26 weeks. Phosphate-treated cod showed decreased thaw, and cookeddrip loss and resulted in higher inoisture content in both raw and cooked product. After 26 weeks at -30 C!, all phosphate treated fillets were judged the most tender and highly acceptable by sensoryevaluation. The use of tripolyphosphate significantly reduced expressible water after holding at-30'C up to 26 weeks and up to 24 days at -12'C.

Seaf dTh 1 Pr
Struvite, or magnesium ammonium phosphate, may be formed in therinally processed seafoods e.g., canned tuna and crab!. Sodium acid pyrophosphate can be used to sequester magnesium ionsand thus, inhibit struvite crystals, which resemble broken glass.
Salmon may develop a surface curd denatured protein! if either held on ice for a protractedlength of time and/or &ozen prior to canning. The curd may constitute up to four percent of thepack, by weight, and may be considered questionable by many consumers.
Curd was signi6cantly P<0.05! reduced by dipping sockeye salmon steaks for 2 to 120seconds in 15 to 20/o solutions of condensed phosphate BRIFISOL~ 512 [sodium tripolyphosphateand sodium hexametaphosphate], BK Ladenlxirg Corporation! and by dipping for 30 to 120 secondsin 5 to 10/a solutions �9!. To avoid dipping, Wekell and Teeny �9! veri6ed that there was a 68/oreduction in curd formation by dry addition of the phosphate blend prior to sealing the can. Althoughit was estimated that 1.0/o polyphosphate would be needed to completely inhibit curd formation,this would exceed the legal limits for phosphate in canned salmon.
Domesticaliy, phosphate is not uniformly allowed in canned salmon except for a temporaryallowance granted to several processors. Its use in canned salmon has, however, been givenprovisional approval by the Canadian government.
Phosphates provide signi6cant bene6t to the seafood industry when there is a large harvestwithin close proximity, and conversely, there are limited quotas i.e., &eezing 6llets to extendwholesale/retail availability!. Spawning salmonids may represent one of the most importantapplications since the muscle has been physi~emically altered. Such 6n6sh contain reduced levelsof myo6brillar proteins which lead to impaired muscle water holding capacity. This is parallel withelevated levels of sarcoplasmic proteins and total moisture, a combination conducive to curddevelopment.
Often when phosphates are added in excess, a glassine look develops. This is particularlynoticeable on shrimp. There are regulatory constraints to the use of polyphosphates along withorganoleptic problems a soapy taste! if the phosphates are used in excess. The glassine appearanceprobably occurs more in error than through intentional overuse of phosphates since there are nostandard or de6ned procedures for their application. Most industrial protocols have been developedby trial and error and/or have been based upon far more resilient terrestrial muscle.
Combining sodium tripolyphosphate with sea water will &equently promote the formation ofa "6oc" on the surface of certain species. Mineral content and pH of the muscle will exacerbate theformation of this crystalline precipitate.

Polyphosphate insolubility is related to water quality and to the individual type of condensedphosphate. Minerals in hard water wiH compete with some types of polyphosphate for solubility. Inaddition, not aH forms of polyphosphate are readily soluble in water.
Erratic functionality of phosphates also may be caused by either heating phosphates topromote solubility or using old solutions, Many of the polyphosphates are prone to hydrolysis, andthe monomeric forms will not perform the same as the polymers.
The maximum permitted legal level in processed meat and poultry is 0.5 fo by weight of thefinal product and serves as the current guideline where their use is permitted. Polyphosphates are notallowed in breaded shrimp and in certain other species �!. They are, however, self-limiting. If muchmore than 0.5'/o of the high pH phosphates, such as sodium tripolyphosphate, is used, Qavor andappearance will be adversely dFected.
Sunnnary and Conclusions
Phosphates are valuable to maintenance of the functional properties of seafood myofibriHarproteins which preserve the natural muscle juices. Inhibiting drip loss in the &esh state, while thawingand in cooking is important to prevent economic logs. Phosphates increase the thermal stability ofproteins which, in seafoods, are normally lower than that of terrestrial muscles. Improper use ofphosphates leads to sensory defects and the potential for charges of economic fraud,
Literature Cited
1. CRAWFORD, D,L. 1988. Personal Communication,
2. CRAWFORD, D.L. 1985. U.S. Patent 4,517,208.
3. CRAWFORD,D.L. 1984, U.S. Patent4,431,679.
4. CRAWFORD, D.L. 1980. Meat yield and sheH removal functions of shrimp processing.Oregon State University Extension Marine Advisory Program. Special Report 597.6p.
5. CODE OF FEDEKQ. REGULATIONS. 1991. 21 CFR 161.30 to 161.190.
6. DUXBURY, D. 1986. Phosphate blends in shrimp, fish reduce thaw shmk, cook loss...research evaluates cryoprotection. Food Processing. 47:18.
7. DZIEZAK, J.D. 1990. Phosphates improve many foods. Food Technology. 44:79.
8, LAMPILA, L.E. Comparative microstructure of red meat poultry and fish muscle. Journalof Muscle Foods. 1:247.

9. LEWIS, D.F., K.H.M. GROVES and J.H. HOLGATE. 1986, Action of polyphosphates inMeat Products. Food Microstructure. 5:53.
10. LOREAL, H. and ETIENNE, M. 1990. Added waterin &ozen scallop muscles: Frenchspecifications and methodology. 20~ WEFTA Meeting. Reykjavik, Iceland.
11. MOREY, K.S., L.D. SATTERLEE and W.D. BROWN. 1982.Protein quality of fish inmodified atmospheres as predicted by the C-PER assay. Journal of Food Science.47:1399.
12. OFFER, G. and TRINICK, J. 1983. A unifying hypothesis for the mechanism of changes inthe water-holding capacity of meat. Journal of the Science and Food and Agriculture.34:1018,
13. REGENSTEIN, J.M. 1984. Protein-Water interactions in muscle foods. Reciprocal MeatConference Proceedings. 37:44.
14. SIDV~L, V.D. 1981. Chemical and Nutritional Composition of Finfishes, Whales,Crustaceans, Mollusks, and Their Products. NOAA Technical Memorandum NMFSF/SEC-11, U.S. Department of Commerce, National Oceanic and AtmosphericAdministration, National Marine Fisheries Service,
15, STONE. 1981. U.S. Patent 4,293,578.
16. SUTTON, A.H. 1973. The hydrolysis of sodium triphosphate in cod and beef muscle. J. FoodTechnology, 8:185.
17, TAYLOR, P. 1990. Personal Communication.
18. TENHET, V., G. FINNE, R. NICKELSON, and D, TOLODAY, 1981. Phosphorous levelsin peeled and deveined shrimp treated with sodium tripolyphosphate. Journal of FoodScience. 46:350.
19. TROUT, G.R. and SCHMIDT, G.R. 1987. The e6ect of cooking temperature on thefunctional properties of beef proteins: The role of ionic strength, pH, andpyrophosphate. Meat Science. 20:129.
20. VOYLE, C.A., P.D. JOLLEY and G.W. OFFER. 1984. The efFect of salt and pyrophosphateon the structure of meat. Food Microstructure, 3;113.
21, WEBB, N.B., F.B. THOMAS, F.F. BUSTA and R J. MONROE.1969. Variations inproximate composition of North Carolina scallop meats. Journal of Food Science.34:471.

20
22. WEKELL, J.C. and TEENY, F.M. 1988. Canned salmon curd reduced by use ofpolyphosphates. J. Food Sci. 53:1009.
23. WOOD, H.G. and CLARK, J.E. 1988. Biological aspects of inorganic polyphosphates. Ann.Rev. Biochem. 57:235.
24, WOYEWODA, A.D. and BLIGH, E,G, 1986. Effect of phosphate blends on stabiTity of codfillets in &ozen storage. J. Food Sci. 51:932.
25. YAGI, H., SAKAMOTO, M, WAKAMEDA, A., and ARAI, K.1985. Effect of inorganicpolyphosphate on thermal denaturation of carp myofibrillar protein at low ionicstrength. Bulletin of the Japanese Society of Scientific Fisheries. 51:667.

FUNCTIONALITY OF POLYPHOSPHATES
Joe Regenstein, Xiaowen Lu, Denise WeilmeierDepartment of Food Science
112 Rice Hali, Cornell University, Ithaca, NY 14S53-5601
Polyphosphates are used'extensively in food processing. Many studieshave shown the benefits of polyphosphates in beef, pork, poultry, andseafood. It was found that these compounds have a profound effect on thefunctional properties of the food products of which they become a part Deman, 1970!, The first patent on the use of polyphosphates to inhibit thawdrip and cook losses in frozen fish were issued in the United States to John H.Mahon in 1962. In recent years, polyphosphates have gained widespreadacceptance as additives in the fish and seafood industry. The functional goalswhen applying polyphosphate to seafood are to retain moisture and fiavor, toprevent oxidation and to extend shelf-life. Appropriate applications ofpolyphosphates result in the retention of natural juices which in turn slowdown normal fish deterioration. Excessive or abusive! use ofpolyphosphates, however, is linked to excessive water uptake i.e., economicfraud!, which has given rise to tensions between the seafood industries andregulatory agencies like the FDA. The FDA fears that polyphosphates mightbe used to improve the quality of damaged food products and/or would beused to "add" water to foods. However, if excessive polyphosphates areadded, the fish develops a soapy taste and a glassine look which are obviouslynot desirable. This probably occurs more in error than through intentionaloveruse of polyphosphates. The problem exists because there are notreatment standards. Standards are difficult to develop since many variablesinfluence polyphosphate uptake in the fish musde, among these variablesare: thickness of the muscle, musde type, type of polyphosphate used,concentration of the polyphosphate solution, dipping time, post-mortem age,etc. The purpose of this study is to determine the relationship betweenpolyphosphate uptake and water retention in fish in different seafood modelsas a function of type of polyphosphate including blend of polyphosphates in

22
concert with microbial inhibitors!, concentration of the polyphosphatesolution, and time of dipping. The water retention properties after thedifferent treatments were evaluated by water uptake ability WUA! andexpressible moisture EM! in order to determine the interaction betweenprotein and polyphosphate.
Traditionally, a number of different methods were used to measure thewater retention properties in muscle food systems. According to Regenstein�984!, two of the major types of the water retention methods, WUA and EM,respond to different properties of flesh. WUA refers to the ability of amaterial to hold added water while under the influence of an external centrifugal! force. Therefore, WUA represents the maximum waterretention of insoluble material in the presence of excess moisture at aparticular force Qauregui, 1981 k Regenstein, 1984!. EM refers to the amountof water squeezed out of a material by the application of a force Centrifugal!.Both EM and WUA should be measured at the same centrifugal force whenthey are to be compared. The results of these studies showed that for WUA,the different cations gave similar results while the anions gave very differentresults. WUA is then found to be a anion-distinguishing technique. The EM,however, is a cation-dependent effect. It divides the salts into two classes ofbehaviors: with and without changes, e.g., EM of Mg changes with the saltconcentration while with Ca it doesn't change.
MATERIALS AND METHODS
Sodium tripolyphosphate STPP! FMC Corp., Industrial ChemicalGroups, Philadelphia, PA!, sodium hexametaphosphate SHMP! Sophadex,FMC Corp., Industrial Chemical Groups, Philadelphia, PA! and FishPlus. BK Ladenberg Corp., CresskiQ, NJ! were used to prepare the dip solutions.STPP is the most popular polyphosphate used as a food additive, SHMP isprobably the second most popular polyphosphate used commercially withflesh foods. It is broken down to orthophosphate more slowly than STPP.FishPlusa' contains a blend of generaQy-recognized as safe GRAS!ingredients: sodium, phosphates, citric acid and potassium sorbate TechnicalBulletin, 1982!.
Commercial cod and mackerel of 3 to 5 days age were used as seafoodmodels. Fresh cod fillets and whole mackerel were obtained from the PkCsupermarket Ithaca, NY! as soon as they arrived. After gutting the mackerel,they were cut into fillets. These fiQets were skinned and the white musclewas cut into 4 to 8 pieces which were usually between 4 cm x 2 cm x �.7 to 1.5!cm. Cod skinless fish fillets were cut into pieces � cm x 3 cm x 2 cm!. Groundsamples of cod musde were prepared by grinding the fiQet in a HC20Handychopper" Mincer/Chopper Black k Decker Inc., Shelton, CT!. Themusde pieces were then dipped in the polyphosphate solutions at specifiedconcentrations for specific length of times. In the case of mackerel, the

23
muscle pieces were dipped in 0, 1, 3, or 6% w/v! SUPP for 0.5, 1.5, or 3.0 min.The cod blocks were dipped in 0, 1, 2, S, 10% w/v! polyphosphate solution for0.5, 1, 2, 3, 5 min. The polyphosphate added to the minced sample were 0, G.l,0.3, 0.5 and 0.7%. The treated samples were packed and stored on ice fordifferent length of time. In the case of cod, treated samples fillets andpolyphosphate added minced cod! were stored for 1, 4, 7, 10, 1S days. Waterretention properties were measured at certain storage periods.
Four different methods were used to measure the water retentionproperties: EM, WUA, thaw drip ! loss and cook loss. Polyphosphate uptakeand, in the case of mackerel, thiobarbituric acid TBA! were also measured.
Ex ressible moisture
To determine EM, 3 pieces of Whatman Whatman International Ltd.,Maidstone, England! ¹3 filter paper, 5.5 cm in diameter, and I piece ofWhatman ¹50, 7.0 cm in diameter were folded into a thimble shape over theoutside of an inverted 16 x 150 mm test tube with the ¹50 filter paper as theinternal surface. The filter paper was weighed on a Mettler H20T balance Mettler Instrument Corp., Hightstown, Nj! before and after addition of I.S 20.3 g sample of treated ground fish. The sample in the thimble was thencentrifuged in a 5G mL polycarbonate centrifuge tube Nalgene Co., Rochester,NY! at 16,000 rpm �0,900 x g, measured at the bottom of the tube! in arefrigerated centrifuge Sorvall RC2b, SS34 rotor! at about 2'C for 15 min. Thefilter paper and sample were then removed from the tube with tweezers, thefish cake was removed from the filter paper, and the paper was reweighed.EM was reported as the percent weight lost of the original sample jauregui,1981!.
According to the method of jauregui �981!, 30 mL of water was pipetedinto 50 mL polycarbonate centrifuge tubes. The tubes were placed in ice whilethe treated samples were grounded and 1.7 g was weighed on a piece of waxpaper using a Mettler H2GT balance. The samples were added to the waterand the mixture was blended in an Omni-mixer Sorvall Omni-mixer Model17105, Dupont Co., New Town, CT! for 30 sec at the midpoint setting �!. Theblades of the Omni-Mixer were then rinsed with 4 more mL of water, to makethe ratio of fish to solution 1:20. The tubes were stored in ice for 3G minbefore centrifugation. The samples were centrifuged in a refrigeratedcentrif'uge at 16,000 rpm for 15 min at 2'C. After centrifugation, thesupernatants were decanted and their volume determined. The pellets wereplaced in aluminum pans, weighed and dried overnight at 105'C in an airoven. The protein concentration of the supernatant and the original samplewere determined by the Lowry method �951!.
WUA was calculated by dividing the mg of water in the pellet by themg of protein in the same pellet. The protein content of the pellet wascalculated by difference: total initial protein minus total protein in the

24
supernatant. The WUA can also be expressed as a percent of the WUA of thecontrol which was run at the same time. In addition, the total bound waterbased on the original sample weight can be calculated. This can be used tocompare WUA values since the amount of insoluble protein in differentsamples were different.
In addition, the effect of the pH on the WUA was examined. Theactual pH of the solution was measured immediately after centrifugation.NaOH and HC1 were used to adjust the pH of the system.
Thaw dri and cook lossThe thaw loss determination method was modified from Santos �990!.
Frozen samples kept at -10'C! were weighed and placed in a glass funnel ontop of a flask, wrapped tightly with a plastic bag and incubated in a cold room� to 4'C! for 24 hr. The thawed samples were weighed and the percent ofthaw drip was expressed as the percent of weight loss during thawing.
The drip loss of fresh treated samples were measured using the thawloss method after different storage time.
After the thaw loss and drip loss determination, the samples wereplaced in a covered microwaveable baking dish and cooked in a microwaveoven at its maximum energy �50 Watt! for 1 min Amana Touchmatic IIRadarange. microwave oven, Amana Refrigeration, Inc., Amana, IW!, andair-cooled. The cooked fish blocks were weighed while the liquid remainedin the dish. Cook loss was expressed as the percentage of weight loss aftercooking Santos, 1990!.
Phos hate determinationThe Quimociac method was used to measure total phosphate uptake by
measuring the concentration of phosphorus or phosphorus pentoxide! in thetreated samples Anonymous, 1977 & Jauregui, 1981!!. The sample is digestedin nitric acid to solubilize the orthophosphate and to hydrolyze condensedphosphates to the orthophosphate form. The orthophosphate is precipitatedas quinolium phosphomolybdate which contains 3.207% P20p.
Small amounts of dipped sample were added into 300 or 150 mLErlenmeyer flasks containing 50 or 25 mL concentrated HNO3 respectively,and boiling chips. The flasks were heated on a hot plate until all the sampleswere dissolved and the solutions were clear. The flasks were left on the hotplate for 4 hr just below boiling. After this, 100 or 50 mL water was added toeach flask and the solution was allowed to boil for about 45 min. Afterdiluting the solution to about 100 or 50 mL 50 or 25 mL of the QuimociacReagent, respectively, was transferred to the hot solution while stirring andwas allowed to boil for two or three min before cooling. The bright yellowprecipitate obtained was filtered through a dried pre-weighed Gooch crucible Coors No 3, Coors Porcelain Co., Golden, CO! containing a glass fiber filter Reeve Angel No 934AH, 2.1 cm, Whatman Inc., Chifton, NJ! and washed 5times with 25 mL distilled water, allowing each portion to pass through thefilter completely before another was added. The crucible and contents were

25
dried in an oven for 30 min at 250'C, cooled in a desiccator and weighed. Theweight of precipitate was calculated by subtracting the weight of the emptycrucible from the weight of the crucible and precipitate. The amount ofphosphorus pentoxide Pp05! in mg was calculated by multiplying the driedweight of the precipitate g! times a 32.07 factor.
Thiobarbituric acid TBA valueThe TBA determination was adapted from Hwang �988!. A 1.9 to 2.0 g
portion of ground sample was weighed, added to a 50 mL centrifuge tube andblended with 25 mL of extracting solution for 30 sec in an Omni-mixer at alow setting �!. The mixture was filtered through Whatman ¹1 filter paper.Five mL of the extract was mixed with 5 mL of the TBA reagent and addedinto a 20 mL screw cap test tube. The test tube was capped tightly and heatedin boiling water for 40 min. The test tubes were cooled under running tapwater. The absorbance of the samples were measured and the pmoles ofmalonaldehyde MA! were calculated from the standard curve of 1, 2, 3, 3-tetraethoxypropane, which is quantitatively hydrolyzed to MA when heated,and multiplying this value by the dilution factor �.0!. The TBA value wasexpressed as pmol MA/g of sample.
RESULTS AND DISCUSSION
60~O
50
I
300
Dip 05 minDip 1 minDip 2 minDip 3 minDip 5 min
2 4 6 8 10 12
STPP Concentration %!
Fig. 1 Effect of STPP concentration and dippingtime on EM
Increasing the STPP or FishPlus. concentration and the dipping timedecreased EM. Compare to STPP, FishPlus. was not as effective. Thedifferences might be due to the different polyphosphate content and pH of thedipping solutions. At the same total concentration level, polyphosphate
Measurem nt of EM:
The effect of STPP and FishPlus. on cod fillets were studied by dippingin different concentration of polyphosphate solutions for different timeperiods Fig. 1 & 2!.

26
content is higher in the STPP solution than in the FishPlus. solution. Inaddition, the pH of the STPP solutions were around 9 while the pH of theFishPlus. solutions were around 6. From Fig. 1, we found that dip timesover 1 min had a minimal effect. For those samples dipped in FishPlus.,there was little change in the EM when the concentration was above 5% anddip time had no effect.
~O60
I 50
300
Dip 00 minDip 1 minDip 2 minDip 3 minDip5min
2 4 6 8 10 12
FishPlus. Concentration %!
Fig. 2 Effect of FishPlus. concentration anddipping time on EM
Measurement of W A:
The effect of STPP concentration and dip time on WUA is shown inFig. 3. Longer dipping times led to increased WUA. Fig, 4 shows the effect ofSTPP concentration and dip time on the total amount of soluble protein inthe supernatant. With the increase of the STPP concentration, the amount ofprotein in the supernatant increased although the trend is not apparent atlow concentration. Since the protein content in the pellets were differentwith different dip concentrations and dip times, we also calculated the percentwater absorbed based on the original sample weight as shown in Fig. 5.Compared to Fig. 3, the total amount of water absorbed in the sampledecreased, especially for the sample dipped for 5 min, because the proteincontent in the pellet decreased with dipping.
Ground cod was used to measure the effect of dip solution pH on theWUA. The pH of the homogenized cod was adjusted after blending.However, since the pH of the solution was not stable the pH of the solutionbefore and after centrifugation were different!, the actual pH of the solutionwas measured immediately after centrifugation. The sample with the lowestWUA, i.e., at pH 5.5 was used as the control. Fig. 6a show the effect of pH oncod from pH 3 to 11. Since the WUA change was largest at the extreme pHs

27
150
g 9
I RV uo
~ nn 'HOl ~o ~
140
130Dip 03 minDip 1 minDip 2 minDip 3 minDip 5 min
120
110
100
90 0 2 4 6 8 10 12STPP Concentration %!
Fig, 4 Effect of STPP concentration and dipping timeon the amount of soluble protein in the supernatant
and we are more interested in the middle pH range, we replotted the data forpH 4 to pH 9 Fig. 6b!, and from pH 5 to 7 Fig. 6c!. From these results, i.e., alarge pH dependence, we would expect that STPP and FishPlus. would havedifferent effects on WUA since their solutions have different pHs. pH changehad an important effect on fish WUA. Around pH 5.5, WUA is at its lowestpoint. And at this pH, there is the least amount of soluble protein in thesupernatant and the least amount of water absorbed in the pellets.
30
~ nn
20 Dip 0.5 minOP Dip 1 min
15 Dip 2 minDip 3 min
10Dip 5 min
0 2 4 6 8 10 12tOSTPP Concentration %!
Fig. 3 Effect of STPP concentration and dipping timeon WUA

Fig. 5 Effect of STPP concentration and dipping timeon the water absorbed based on the originalsample weight
15000
$ 10000'B
5000
02 4 6 8 10 12
pH2 4 6 8 10 12
pH
a-2 Protein in supernatant asa function of pH
~ -1 WBP: pH effect
160140
120
n 100
4 5 6 7 8 9 10
pH
b-2 Protein in supernatant asa function of pH
5 6 7 8 9 10 5 6 7 8 9 10
pHM Water remaining in pellet
ss a function of pH
pH
b-1 WBP: pH effect
4 S.S 6.0 65 7.OpH
0 SZ 6,O 65 7.O
pHc-2 Protein insupertnatant as
a function of pH
55 6.0 65 7.0
pHo-5 Water remainin8 in pellet:
as a function of pHc-l WBP: pH Effect
500
~ 5~ 200
1000
1 0 2 4 6 8 10 12STPP Concentration %!
150
130
110
5.
Fig. 6 Effect of pH on WUA
Dip 05 minDip 1 minDip 2 minDip 3 minDip 5 min
6 2 10 2 4 6 8 10 12
pHa3 Water remaining in pellet
as a function of pH4
4 5E8
2
1e
0

29
5
I
p 0
I
0 day4 day
~ eday P12 day
0 day4 day
~ s~12 day
-50 2 4 6 8 10 12
STPP Conc. %!
a-1 Effect of concentration of SIMP on thaw loss
-100 2 4 6 8 10 12
FnhPLns Conc. %!b-I Effect of concentration of FtshPlus on thaw loss
0 day4 dayS day
0 day4 dayS day12 day12 day
0 2 4 6 8 10 12STPP Conc. %!
a-2 Effect of concentration of STPP on thaw loss
0 2 4 6 8 10 12FlahPIna Conc, %!
b-2 Effect of concentration of FlshPlus on cook loss
Oday4 dayS day12 day
0 day4 days day12 day
0 2 4 6 8 10 12 0 2 4 6 8 10 2STPP conc. %! FishPlus Conc. %!
~ Effect of concentration of STPP on combined b8 Effect of concentration of FishPlus on combinedcook and thaw loss
Fig. 7 Effect of STPP and FishPlus on thaw and cook loss
Phos hate determination:
Increasing dip time and polyphosphate concentration increased theabsorption of polyphosphate in fresh cod Fig. 8!. Since the sample size wassmall, the amount of polyphosphate picked up in the cod blocks was higherthan expected. According to the observed changes in phosphate levels, we
Tha and cook 1
The effect of STPP and FishPlus. on the thaw and cook loss are shownin Fig. 7a and Fig. 7b respectively. The period of storage had a greater effect onthaw drip than the dip concentration. STPP and FishPlus. concentrationwere more effective in preventing cook loss than in preventing thaw loss.STPP was more effective over intermediate storage times in preventing totalmoisture loss.

30
0.0 0 2 4 6 8 10 12STPP Concentration %!
Fig. 8 Effect of dip time and STPP concentration on the% of phosphorus pentoxide pick-up in cod blocks
The effect of stora e time on the EM of So hadex treated fresh cod filletsFig. 9a -9e show the EM as a function of dipping time and
concentration. Each figure represents a different storage time. On day 1 afterdipping Fig. 9a!, the EM did not change much with different dipping timesand concentrations. The samples dipped in water showed an increase in theEM with dipping time. This is probably due to the increased water uptake.However, in all cases with Sophadex, the EM decreased. The decrease in EMof the samples dipped in 2% and 5% solutions was slight with increaseddipping time; the EM decreased about only 1% from 0.5 min to 5 min. At10%, dipping time had a greater effect, the EM decreased about 3% from 0.5min to 5 min. The EM increased with Sophadex concentration when thedipping time was the same and concentration had a greater effect as timewent on. On day 4, notable changes occurred Fig. 9b!. The EM of the samplesdipped in water showed large increases with dipping time �.5%!, while thesamples dipped in different concentrations of Sophadex showed similardecreasing water loss with dip time. Higher concentrations gave lower EM.The difference of the samples dipped in Sophadex versus that in water wassignificant. On day 7, 10 and 15, the difference continued and the EM changeswere similar to day 4 although the curves all shifted upward without a slopechange Fig. 9c-9e!. On the other hand, the EM of the samples dipped inSophadex kept on increasing. The lowest EM sample dipped 5 min in 10%solution! changed from 42.4% to 47.0% over 15 days. Sophadex was helpful inlowering EM.
expect to be able to control the phosphate uptake by changing dip time and dipsolution concentration.
1.0
6 0.8
F4 0.6 Dip 0.5 minDip i min
m 04 Dip 2 min0.2 Dip 5 min
Dip 5 min0~O

0%0% ch5%10%
0 1 2 3 4 5 6Dipping Time ndn!
0 1 2 3 4 5 6Dipping Time min!
a. Effect of Sophadex concentration and dipping timean EM Day 1!
b. Effect of Saphadex concentration and dipping timeon EM Day 4!
0 1 2 3 4 5 6Dipping Time min!
0 1 2 3 4 5 6Dipping Time min!
d. Effect af Saphdehc cchncehhthattan and dipping timeon EM 93ay 10!
c, Effect af Saphdahc concentration and dipping timeon Ehf Day y!
0%2%5%10%
0 1 2 3 4 5 6Dipping Time min!
e. EHaCt af Saphdehh Cahhaehhtratiohh and dipping timeon EM Day 15!
Fig. 9 Effect of storage time on the EM of Sophadex treated cod fillets
The effect of stora e time on the WUA of So hadex treated fresh cod filletsFig. 10a-10e show the WUA with the same conditions as for EM. In
Fig. 10a, WUA of the fillets dipped only in water did not change with diptime, whereas the WUA of the fillets dipped in Sophadex increased from 0.5min to 2 min and then showed no change from 2 min to 5 min. The higherthe dipping concentration, the higher the WUA. On day 4 Fig. 10b!, thewater dipped and the 10% Sophadex had similar WUA as day 1. The other 2

32
samples were different, especially the 5% solution, where WUA decreasedafter 2 min dipping, and was lower overall than day 1. From day 7, the WUAdecreased in all cases Fig. 10c! and on day 10 Fig. 10d! the decrease of the 10%dipping sample was notable, By day 1S Fig. 10e!, the WUA of all samples waslower and more similar. This might be caused by the spoilage of the fish.
0 1 2 3 4 5 6Dipping Time min!
L Effect of Sophadea cancelation and dipping timeon WUA Day 4!
firn 0
0%2%5%10%
1 2 3 4 5 6Dipping Time min!
d, EHect of Sophadex concentration and dipping titnean WUA Day 10!
c, Kffect of Saphadex concentration and dipping timeon WVA Nay 7!
g ia 0 1 2 3 4 5 6Dipping Time min!
e, Effect of Sophadex concentration and dipping timeon WUA Day 1S!
Fig. 10 Effect of storage time on the WUA of Sophadex treated cod fillets
The effect of stora e time on the dri loss of So hadex treated fresh cod fillets
0 1 2 3 4 5 6Dipping Time min!
a. Effect of Sophadea concentration and dipping timeon WUA Day 1!
k4~p31
K.g 0 1 2 3 4 5 6Dipping Time min!
C
3FR.E

33
The drip loss after different treatments is shown as the effect of storagetime Fig. 11!. The values of the drip loss were very dose at the beginning ofthe storage day 1!, from 2.0% to 2.2%. With the increase of the storage time,the differences became greater. On day 15, the values had a range of 10.0% to12.5%. The lower the Sophadex concentration, the higher the drip loss; theshorter the dipping time, the higher the drip loss. However, the drip loss wasmostly affected by the storage time.
14
12
10
@08
0
C4~ lg 4
2
160
0 2 4 6 8 10 12 14
Days
The effect of stora e time on the cook loss of So hadex treated fresh cod filletsFig. 12 shows the change of the cook loss as the effect of storage time.
Although there was no similar pattern, the cook loss, generally decreasedwith the addition of Sophadex, and there was a trend that increasedconcentrations and dipping times, decreased cook loss.
The effect of stora e time on the EM of STPP treated fresh minced codThe effect of STPP concentration and storage time on EM of minced cod
is shown in Fig. 13. The EM decreased with increased STPP. The decrease wasgreatest on day 1 with more than a 10% decrease. The changes on day 4 andday 8 were less, around 4-5%. Increase storage time increased the EM.However, on day 15, an unusual change occurred, the EM dropped again. Thevalues of every sample with different STPP concentrations were lower thanthose of day 4 and day 8, and closer to day 1. The change was unexpected andmight be due to the spoilage of the fish.
Fig. 11 Effect of storage time on drip loss of fresh cod filletwhich dipped in Sophadex
0% 0.5 min
0% 2 min
0% 3 min
0% 5 min
2% 03 min
2% 2 min
2% 3 min
2% 5 min
5% 0.5 min
5% 2 min
5% 3 min
5% 5 min
10% 08 min
10% 2 min
10% 3 min
10% 5 min

34
~O
ajy 30
0 0
~o 50
45
Day 1Day 4Day 8Day 15
0.8
Fig. 13 Effect of storage time on EM of minced fresh codwith the addition of STPP
The effect of stora time n A f TPP tr a e fr sh minced cod
The effect of STPP concentration and storage time on WUA of mincedcod is shown in Fig. 14. On day I the WUA decreased slightly and smoothlywith the increase of the STPP concentration, from 22 to 18 mg water/mgprotein in pellet!. On day 4, the WUA increased for all the samples withdifferent STPP concentration with the exception of the samples that had noSTPP added. The decrease of the samples with no STPP added was 0.8 mgwater/mg protein in pellet!. For the other samples, the values increased,especially for the one with the highest STPP concentration from 18 to 27 mg
20 0 2 4 6 8 10 12 14 16 18 20Days
Fig. 12 Effect of storage time on cook loss of fresh cod fiHetdipped in different Sophadex
0 M2 35r5 30 0.0 0.2 0.4 0.6
STPP Concentration %!
0% 0.5 min
0% 2 min
0% 3 min
0% 5 min
2% 0.5 min
2% 2 min
2% 3 min
2% 5 min
5% 0.5 min
5% 2 min
5% 3 min
5% 5 min
10% 05 min
10% 2 min
10% 3 min
10% 5 min

water/mg protein in pellet!!. On day 8, the values decreased again and wereall close to the values on day 1. On day 15, the values decreased. The value ofthe sample with no STPP added dropped to ll mg water/mg protein inpellet!.
Other changes observed during the WUA test were in the protein inthe supernatant and the water absorbed as a function of total sample weight Fig. 15 & 16!. The protein content in the supernatant increased with storage.The effect of STPP on protein solubility was modest, storage time had agreater effect. The increase on day 15 was greater with the highest point at141.3 mg protein/1.7 g sample!. This might again be caused by the spoilage ofthe samples. It was interesting that the protein content in the supernatantdropped with the increased STPP concentration on day 1 and increased on day4 and day 8. For the water absorbed by the samples, the notable changes alsooccurred on day 15.
4P
~ ~
+ QP
6
30
20
Day 1Day 4Day 8Day 18
15
10
50.0 0.2 0.4 0.6 0.8
STPP Concentration %!
Fig. 14 Effect of storage period on WUA of mincedfresh cod with the addition of STPP
Since pH had a larger effect on WUA than the concentration ofpolyphosphates, the pH of the homogenized samples was monitored beforecentrifugation Fig. 17!. The pH of all the samples increased with storage timeand FZPP. However, the pH of the samples with the same STPPconcentration did not change much from day 1 to day 4, whereas the changefrom day 4 to day 8 is large. Again, the change on day 15 was unexpected andmay be due to the spoilage of the fish. The WUA of the sample increasedwith the increase of pH in the range of 7 to 9 as suggested.

36
150
140
130
120Day 1Day 4Day 8Day 15
110
100
Day 1Day 4Day 8Day 15
Fig.
D
tà bO
6 bO
OV
~ H
Fig. 15
90 0.0 0.2 0.4 0.6 0.8STPP Concentration %!
Effect of storage time on the amount of soluble proteinin the supernatant with the addition of STPP
0 0.0 0.2 0.4 0.6 0.8STPP Concentration %!
16 Effect of storage time on WUA expressed aswater g!/sample g!! of minced fresh codwith the addition of STPP

37
8.8
8.6
Day 1Day 4Day 8Day 157.8
7.6 0.0 0.2 0.4 0.6 0.8STPP Concentration %!
Fig. 17 Effect of storage time on pH of 5% solution of mincedfresh sample with the addition of STPP
The effect of stora e time on the dri loss of STPP treated fresh minced codFig. 18 shows the drip loss for different storage period. The drip loss
increased with storage time. For the samples without STPP treatment, thedrip change was large, from 3.5% to 11.9%. STPP prevented the drip lossalthough the concentration did not affect drip loss. In addition, the STPP hadsome effect on drip loss with longer storage periods. Day 4 and 8 had similardrip loss, while day 15 showed higher values. This again might be due tospoilage.
14
12
10
Day 1Day 4Day 8Day 15
20.0 0.2 0.4 0.6 0.8
STPP Concentration %!
Fig. 18 Effect of storage time on drip loss of minced fresh codwith the addition SII'P
The effect of stora e time on the cook loss of STPP treated fresh minced cod
@0
0 9
8.4
8.2
8.0

38
Cook loss is shown in Fig. 19. The concentration of STPP did not havea big effect on cook loss compared to the storage time. There was also no bigdifference between the samples with STPP and the samples without STPP.
50
Fig. 19 Effect of storage time on cook loss of minced fresh codwith the addition STPP
~o 40
~o 30
O 0 20
10 0.0 Oa2 0.4 0.6 0.8STPP Concentration %!
Day IDay 4Day 8Day 15

39
Mackerel studies:
Preliminary results on the effect of different concentrations of STPPand dipping time in mackerel samples are shown in figures 20-24. EMdecreased with storage time. Both concentration and dipping time especiallythe latter! showed an increase in the EM of the samples see Fig. 20!.
As expected then, WUA increased with time, i.e., the older the fishpost-mortem, the greater the ability to take up water, The effect of theconcentration of STPP was not clearly defined. The highest values for WUAwere observed in samples dipped in water �%! but the lowest were notobserved in higher concentrations of the STPP, as we would have expected,but in fact were obtained among the middle concentration levels. Theincrease in WUA with time, however, seemed to be less in the samplesdipped in higher concentrations of the STPP solution. Dipping time appearedto slightly decrease WUA see Fig. 21!.
Expressible Moisture80
2 7 13@O
~~ 60.IO
0 1 3 6 0 1 3 6 0 1 3 6
Concentration %!
1.5 3.0Dip time min!
0.5
Fig. 20 Effect of STPP concentration and dippingtime on EM of mackerel white muscle ondays 2, 7 and 13.

40
Water Uptake Ability
~ 40
8
~ 30
8
w 20
Cl
103
Le
e 0
0 1 3 6 0 1 3 6 0 I 3 6
Concentration %!
~ Day 2g Day 9g Day 14
1.5 3.0Dip time min!
0.5
Fig. 21 Effect of STPP concentration anddipping time on WUA of mackerelwhite muscle on days 2, 9 and 14.
Both the concentration of STPP and the dipping time had the expectedeffect of increasing the phosphate content of the sample measured as % P205 see Fig. 22!. These results, however, were not checked against a no-treatmentsample which means that the final phosphate uptake of the different sampleswas not possible to quantify.
Finally, to compare the polyphosphate uptake with the oxidation offatty acids i.e., rancidity!, a TBA test was performed see Fig. 23!. At higherconcentrations of polyphosphate, the TBA values were lower. This effect wasalso observed with regard to dipping time i.e., the longer the dipping time,the lower the TBA values!.

41
Phosphate Content
0.8
Dip time: 0.5 minDip time: 1.5minDip tune: 3.0 mm
Fig. 22 Effect of STPP concentration and dippingtime on the phosphate content of mackerelwhite muscle.
TBA value
0.15
Dip time: 0.5 minDip time: 1.5 min
ip time: 3.0 min
0.00
0 2 4 6Concentration %!
Fig. 25 Effect of STPP concentration and dippingtime on the TBA value of mackerel whitemuscle
REFERENCES
0.7P4g 0.6
4' 0.5C0
0.4
a. 0.3
0 0.20 1
O.t 0
0.05
Cl
2 3 4 5 6 7
Concentration %!

42
ANONYMOUS. 1977. Determination of the phosphorus pentoxide content ofpoultry and seafood products Quimociac Method! In: Analyticalprocedures. Stauffer Chemical Company, Westport, CT
DEMAN, J. M., P. MELNYCHYN. 1970. Symposium: Phosphates in FoodProcessing. AVI Publishing Co., Inc. Westport, CT
HWANG, K. T. 1988. Protection of menhaden mince lipids from rancidityduring frozen storage. Master Thesis, Cornell University. pp 42-44.
JAUREGUI, C. A. 1981 Effect of polyphosphates on the water bindingproperties of musde proteins. Ph. D. Thesis, Cornell University
JAUREGUI, C. A., J. M. REGENSTEIN and R. C. BAKER. 1980. Expressiblemoisture, a simple centrifugal method for measuring water bindingproperties of musde foods. J. Food Sci. 46: 1271-1273
LOWRY, O. H., J. ROSEBROUGH, A. L. FARR and J. RANDALL 1951. Proteinmeasurement with folin phenol reagent. J. Biol. Chem. 193:265-275
MAHON, J. H. 1962. Preservation of fish. U. S. Patent 3,036,923
REGENSTEIN, J. M. 1984. Protein-water interactions in muscle foods.Reciprocal Meat Conference Proceedings. 37: 44-51
SANTOS, E. E. M. and J. M. REGENSTEIN. 1990. Effects of vacuum packaging,glazing, and erythorbic acid on the shelf-life of frozen white hake andmackerel. J. Food Sci. 55: 64-70

43
MOISTURE CONTENT OF SCALLOP MEAT: EFFECT OF SPECIES, TIME OF SEASONAND METHOD OF DETERMBHNG "ADDED WATER"
J.R. Botta' and F.M. Cahill'
'Inspection Branch ' Science Branch!,Canada Department of Fisheries and Oceans,
P.O. Box 5667, St.John' s, NF, Canada, Alc SX1
INTRODUCTION
Canadian regulations do not allow scallop processors to use phosphate additives. However,depending upon the manner by which scallop meats are handled, water may be added to the meatsby their exposure to &esh water. In addition a large portion of scallops, processed within Canada,are exported to the United States and thus will be subjected to the FDA proposed regulationconcerning scallop meats that contain greater than 8P/o moisture content being labelled as containingadded water. Therefore the Seafood Quafity Investigations Division was asked to investigate moisturecontent of both Icelandic scallops Chlarnys islandica! and sea scallops Placopecten magellanicus!,which occur in water adjacent of Newfoundland.
MATERIALS AND METHODS
During each of April 1991 and September 1992 both wild Iceland scallops and wild seascallops were caught on the northern half of St. Pierre Bank NAFO Division 3Ps!. In order tominimize both damage and stress, the scallops were caught at the end of a trip, using tows of shortduration. All tows were made with an unlined 12ft �.66m! New Bedford ofFshore dredge equippedwith 3" rings, which were interconnected with three and four links on the top and belly, respectively.Towing speed as approximately three knots with a warp to depth ratio of 3:1. Once each set wascompleted, live scallops were removed &om the catch, sorted according to species, undamagedscallops placed in cabbage bags and stored in sea water. During April scallops were stored in runningambient sea water, whereas during September the increased ambient temperature necessitated thatthe scallops be stored in chilled � C! but aerated sea water.
Upon returning to St. John' s, all scallops were immediately transferred to a chilled �'C! seawater system at the Northwest Atlantic Fisheries Centre. One group of Icelandic scallops and onegroup of sea scallops were removed &om the chilled sea water «nd processed immediately. Processingconsisted of: removing and brieQy rinsing the adductor muscle; allowing it to drain to remove excesswater; vacuum packaging the larger striated portion of the muscle, and &eezing/storing them in achest freezer at -60'C.

44
During the Autumn of 1982, sea scallops, of the 1981 year class, were collected as one-yearold spat Rom Garden Cove, Placentia Bay, transported to Spencer's Cove, Planctia Bay, and placedin scallop aquaculture cages, for growth studies. During each of early July and late November, 1985live cultured sea scallops were collected Rom these cages. Once collected, live sea scallops weretransported to St. John's and stored in an ambient sea water system at the Northwest AtlanticFisheries Centre. Detailed biological sampling of each sample took place shortly after the samplesarrived at the laboratory.
D ermination of m i ture d rotein content
Vacuuin packed scaHop meats, Rom each of I~ scallops and sea scallops procured duringeach of April and September, were thawed in water kept at 20'C. A Total of 48 Iceland and seascallops caught during April and September were: 6nely chopped by hand; placed in preweighedaluminum containers; weighed; dried to constant weight using an air oven operating at 102 C; cooledin a desiccator; weighed; ground and stored in tightly sealed sample jars. The moisture content of atotal of 51 giant scallops collected during July and November was determined, immediately after livescallops were shucked, using similar procedures. Crude protein content of the Icelandic scallopscaught durmg April and September was determined, by Kjeldahl, using methods described by AOAC�!
sm nt fm h susedt rmin " W
The nmimum amount of water that could be added to 100g of scallop meat, without the meatcontaining 80,0/o moisture Proposed U.S. FDA regulation! or having a moisture:protein ratio of 5.0�! was calculated. AH such calculations were based upon observed protein and/or moisture values,of a variety of scallop meats, harvested during April and September.
RESULTS
E~fff
Within each of the two diFerent seasons, the moisture content of meats &om sea scallops didnot appear to diFer 6om those of meats &om Icelandic scallops Table 1!. The frequencydistributions of moisture content, of both species, were very similar, even though sea scallopsgeneraHy spawn during Autumn and Iceland scallops generally spawn during Spring. The moisturecontent of sea scallops ranged between 74.63/o and 80.20/o whereas that of Iceland scaHops wereobserved to be between 75.28'/o and 81.25o/o. Although there was very little diFerence between themoisture content of these two species, this does not necessarily mean that the moisture content ofeither sea scallops or Iceland scaHops is similar to that of any of the other eight species harvestedthroughout the world Table 2!.
The &equency distribution of moisture:protein ratio of meats &om sea scallops appeared tobe quite similar to the moisture:protein ratio of meats Rom Iceland scallops Table 3!.

E~ffF ~
Within each of the two species, moisture content was dramatically a8ected by the seasonduring which they were harvested Table 1!.
Table 1, Moisture content of wild Iceland scallop Chlamys is1andica! meats and wild seascallop PIacopecten magellicus! meats harvested during both April andSeptember.
bserved Fr uencie
~Sea scalloMoisture
Content %!September September
n= 15 n=9 n= 15 n=9
>74<75
> 75 <76
>76<77
>77<78
>78<79
>79<80
>80<81
>81<82
28.6 13.3
7.1 26,7
50,0 46.7
7.1 13.3
77.8
22.2 77.8
Likewise, almost all 86.7%! of Iceland scallop meats harvested during April contained lessthan 78.0% moisture whereas when harvested during September aB of the meats contained at least80.0% moisture, with 22.2% of these having a moisture content of at least 81.0'/o.
When halve~ted during April, 92.8% of the sea scallop meats were observed to contain lessthan 78.0/o moisture with 35.7% of the meats harvested during April containing less than 76.0%moisture Table 1!. However, all of the sea scallops meats harvested during September were observedto contain at least 79.0% moisture with 22.2% of them containing at least 80.0% moisture Table 1!.

46
Although the meats harvested during Spring were obtained during 1991 and those harvestedduring Autumn were obtained during 1992, it is strongly suspected the large efFect of season wasprimarily a result of high food supply which normally occurs during March to May �, 5!, Observedmoisture content of cage cultured sea scallops harvested during both early July and late Novembersubstantiated this suspicion. Although all scallops sampled were of the same year class, the time ofseason during which the scallops were harvested appeared to greatly affect the observed moisturecontent Table 4!. When harvested during early July 83.3/o of the scallop meats contained less than77.0'/o moisture, with 63.3/o of the meats containing less than 76.0/o moisture, but when harvestedduring late November 95.1/o of the meats contained at least 77.0/o moisture, with 66.6/o of themcontaining at least 78.0/o moisture Table 4!.
Regardless of the reason, the observed moisture content of scallops harvested during earlyJuly �985!, late November �985!, late April �991! and early September �992! cleariy indicatedthat, moisture content of sea and Iceland scallops was seriously afFected by the time of season duringwhich the scallops were harvested.
Eff ct of Method f D erminin "A ded Water"
The amount of water that could be added to scallop meat depended upon the natural moisturecontent and the method of determination, which in turn, was affected by protein content. In general,when scallop meat contained less than 78'/o moisture the 80o/o moisture limit allowed more water tobe added Table 5!. This degree of difFerence increased as the natural water content decreased addedwithout the moisture:protein ratio reaching a value of 5.0 Table 5!. In contrast, 20.7g to 26,0g ofwater could be added to 100g of the same scallop meat without the moisture content reaching theproposed 80.0o/o limit, This is because, the addition of water Table 5!. For example, with scallopmeats containing 74.6/o - 75.8/o causes both the numerator and the denominator used to calculated"new" percentage! to change. Alternatively when a moisture:protein ratio is used, the addition ofwater causes only the numerator, not the denominator, to change. However with scallops thatcontained 78.6/o - 79.7/o moisture �6,65 -17.5/o protein!, slightly more water �.6g vs 2.4g, 3.7gvs 1,2g and 8,8g vs 6.8! could be added to 100g of scallop meat if the limit was a moisture:proteinratio of 5.0.
Thus using a moisture:protein ratio of 5.0 rather than a moisture content of 80'/o to determinethe presence of "added water" has some important characterisics. Firstly, it appears to be much morelikely to detect the presence of water that had been added to scallops that naturally contained a lowermoisture content. Secondly, it appears to be more tolerant of water that had been added to scallopswhich naturally contain a moisture close to 80o/o. For example, if a moisture limit of 80o/o wasenforced all of the Iceland scallops harvested during September would have to be classified as havingwater added, but if the limit was a moisture:protein ratio of 5.0 none of these scallops would haveto be classified as having water added.

Di6erent scallops that are harvested, commercially, throughout the world.Table 2.
Name
70/90 5,000-8,0GO
150/200 150,000-200,000
United Kingdom, 40/60France
Common scallop Pectin maximus!
35,000
North Atlantic & 60/100Barents Sea
Iceland scallop Chlamys islandica!
50,000
10/30Japanese scallop Pecten yessoensis!
Japan, Korea 222,000
Paimmanian scallop Argopectencircularis!
Central America 80/120 40,000 est.!
Peruvian scallop Argopectenpurpuratus!
80/120 10,000 est.!
60/100 12,00G
Newfoundland to 20/30
North Carolina
130,000
Weathervane/Giant
Pacific scallop Pecten caurinus!
20/40 4,000
'From Seafood Leader Buyer's Guide, 1988, p. 266'Also called giant scallop.
Bay scallop Argopectenirradians!
Calico scallop Argopectengibbus!
Queen scallop Chlamysopercularis!
Sea scallop' Placopectenmagellanicus!
Location of
Catching
New England toNorth Carolina
North Carolinato Brazil
Peru, northernChile
Faeroe Islands,United Kingdom
Alaska to
Oregon
Average AverageCount/lb. Yearly
Landings MT!

Moisture:protein ratio' of wild Iceland scallop Chkunys islandica! meats and wildsea scallop Placopecren nsagellicus! meats harvested during both April andSeptember.
Table 3.
Observed Frequencies %!Moisture:
proteinratio April September
n= 15 n=9
April Septembern=15 n=9
' Moisture: protein ratio = g moisture/g protein
Moisture content of cage cultured sea scallop P/acopecIen magellicus! meatsharvested during each of early July and late November'.
Table 4.
Observed Frequencies %!Moisture
Content %! Harvested
early Julyn=30
Harvested
late November
n=21
4.7
28.5
38.1
19,0
9.5
'All scallops were of the 1981 year class and were harvested during 1985,
Table 5!, For example, with scallop meats containing 74.6% - 75.8% moisture �6.81 - 18,03%protein!, 8.8g to 14.3g of water could be
> 4.3 - <4.4
>4,4- <4.5
>4.5-<4,6
>4.6- <4.7
>4.7-<4.8
>4,8- <4,9
>4.9- < 5,0
> 5.0 - < 5. 1
>73-<74
>74-<75
>75-<76
>76-<77
> 77- <78
>78-<79
>79-<80
>80-<81
>81-<82
14.3
28.6
7.1
28.6
21.4 22.2
22.2
33.3
22.2
3.3
20,0
40.0
20.0
6.6
3.3
3.3
3.3
20.0
13.3
33.3
26.7
6.7 11.1
55.5
33.3

EfFect of method of determining "added water" upon the ma:umum amount of waterthat may be legally added,
Table 5,
MAX. G WATER THAT MAY BE
ADDED TO A 100 G SAMPLE
%M M/P
OBSERVED
VALUES OF
%M %P
26.0 10.4
N/A 0.5
N/A11.3
20.7 14.3
10.4
23.9 8.8
12.6 5.4
7.5 5.1
2.4 3.6
1,2 3.7
N/A
N/A 0.5
13,5
75.84 18.03
77.34 17.51
78.63 17.49
20.7 14.3
13.2 10,2
6.8 8,8
M = % Moisture P =% Protein M/P = Grams moisture/grams protein
Lowest % M.
Hiighest % M.
Lowest % P,
Hiighest % P
74.63 17.02
81.25 16.35
77.72 14.95
75.84 18.03
Samples Containing 16.51% - 17.02% Protein74.63 17.02 26.0
75.21 16,81
77.41 16.57
78.49 16,75
79,51 16.65
79.74 16.70
80.62 16.65
81.25 16.35
Samples Containing 17.49% - 18,03% Protein75.28 17.76 23.5

50
CONCLUSIONS
Moisture content of sea scallop meats and Iceland scallop meats was notaffected by the species being analyzed, but the moisture content of meats from bothspecies was vividly afFected by the time of season during which they were harvested.The consistent large efFect of season combined with inability of a 80% moisture limitto detect water added to scallops that naturally contain lower levels of moisturegreatly reduces the practicality of such a limit.
Although the Inspection Branch, Canada DelNutment of Fisheries and Oceans,agrees with the concept of having a limit concerning the addition of water to scallopmeats, it disagrees with the proposal to use a limit of 80% moisture, regardless ofspecies location of catching and season of catching.
REFERENCES
1. AOAC, "OKcial Methods of Analyses," 15 ed., Association of Of5cialAnalytical Chemists, Arlington, VA, 1990
2. LOREAL, H. AND M. ETlENB E. 1990. Addeded water in &ozen scallopmuscles, French speci6cations and methodology, XXth WEFTAMeeting, Reykjavik, Iceland, 1990.
3, PERKINS, C. ed.!. 1992. The Advanced Seafood Handbook, SeafoodBusiness, Rockland, Maine, 1992, 136p.
4. THOMPSON, R.J, 19T7. Blood chemistry, biochemical composition, andannual reproductive cycle in the giant scallop, Placopecienmagellanicus, &om southwest Newfoundland. 3. Fish, Res. BoardCan. 34: 2104-2116.
THOMPSON, RJ. AND B.A. MACDONALD. 1990. The role ofenvironmental conditions in the seasonal synthesis and utilization ofbiochemical energy reserves in the giant scallop, Placopectinmagellanicus, Can. J. Zool. 68: 750-756.

51
FUNCTIONAL, MICROBIOLOGICAL AND SENSORY CHANGES IN SEA SCALLOPS P/acopecten mage/lani cus! TREATED WITH SODIUM TRIPOLYPHOSPHATE
DURING ICED STORAGE
T. Rippen', H. Sutton', P, Lacey', R. Lane', R. Fisher', W. DuPaul''Virginia Polytechnic Institute and State UniversityVirginia Seafood Research and Extension Center
102 South King StreetHampton, Virginia 23669
BIld
College of William and MaryVirginia Institute of Marine ScienceGloucester Point, Virginia 23062
Sea scallops are traditionally washed, bagged, ice chilled in summer! and stowed surroundedwith ice in bins onboard harvest boats, then washed or held in chilled sodium tripolyphosphatesolutions at processing plants prior to paclung. The U.S. Food and Drug Administration identifiedthe practice of soaking scallops for extended periods of time as incompatible with policies prohibitingthe uptake of water. To answer questions related to expected weight gains and shelflife propertiesassociated with various processing procedures involving water contact, the International FoodAdditives Council and the American Scallop Association funded a project which included the workdescribed here. For a copy of the complete project final report entitled "An Evaluation of ProcessedAtlantic Sea Scallops P/acopecten mage//anicus!" contact Sea Grant Mrine Advisory ProgramPublications at the Virginia Institute of Marine Science address above!.
The purpose of this study was to evaluate the effect of selected wash and phosphateapplication treatments on scallop quality parameters and moisture retention during iced storage.Alkaline polyphosphates are most frequently used in seafood and meat systems to improve waterbinding, texture and other functional properties, However, shelflife extension is a benefit occasionallyattributed to their use �4, 16!, This effect may be primarily related to metal ion chelation. Molins 9! reported that tripolyphosphates form complexes with alkali and earth metals which are more stablethan those formed by pyrophosphates which, in turn, are more stable than those formed byorthophosphates.
In a previous study at Virginia Tech, scallops held in 3 percent and 5 percent solutions ofsodium tripolyphosphate for 20 hours maintained higher sensory quality during subsequent icedstorage than did either an unprocessed control or scallops held in water prior to storage T. Rippen,1990, presented at 50th annual meeting of the Institute of Food Technologists, Anaheim!. Results

52 of this study were also reported at the AFT-TSFT conference in Williamsburg, and a data summarycan be obtained from author Rippen. It is not included in this proceedings paper,
MATERIAL AND METHODS
Scallops used in this study were harvested approximately seven days prior to the vessel'sreturn to port; mid-point of an average 14-15 day trip. They were taken &om a single resource offCape Cod, Massachusetts on September 2-3, 1992 and were of a small uniform size �7 meats perpound, average!. The shucking, chilling and bagging operations were supervised to assure thathandling and temperature control procedures were consistently applied, were representative ofindustry practice and minimized unnecessary water gains.
At a commercial shore-side facility, six processing treatments were conducted. Five bags approximately 200 pounds! of scallops were used for each treatment using standard processingequipment. Three 70 pound batches were prepared of each treatment to minimize the effects ofbatch-wise variability. The six processing methods evaluated in this study were as follows:
PW = scallops washed 20 minutes in &esh waterSTP = scallops washed 20 minutes in a solution of 4/o sodium tripolyphosphate+ 1/o NaClDIP = FW scallops dipped for 1 minute in a 10/o solution of sodium tripolyphosphate + 1/o NaClS82, S84 and S86 = scallops exposed to a solution of 2.5/o sodium tripolyphosphate+ 1/o NaCl forsufhcient time to approximately achieve moisture content targets of 82/o, 84'/o and 86'/o, respectively,
All solutions were pre-chilled to approximately 48'F in volumes suf6cient to produce 2:1solution:scallop ratios. Scallops treated as described each treatment variable and washed control!were packed into one pound plastic containers immediately following processing using sanitaryprocedures. They were labeled, packed in ice and transported the same day to the Virginia TechSeafood Extension and Research Center in Hampton, V~ They were held in ice until evaluated.
On days 1, 4, 6, 8, 11, 15, 18 and 20 containers of each treatment including the wash control!were removed &om ice for triplicate analysis three containers sampled per analysis! for aerobic platecount, moisture and pH. Percents of drip loss and cook loss were determined on days 1, 4, 6, 8, 11and 15, also in triplicate. An exception was the S86 treatment which was not available for evaluationon day 1.
Aerobic psychrotrophic! plate counts were determined by standard AOAC methods. TwentySve gram scallop composites were removed aseptically &om each container immediately after theywere opened. They were diluted 1:10 with 0.1 percent peptone and macerated by stomaching.Subsequent dilutions were made in Butterfield phosphate buffer. One ml portions of appropriatedilutes were plated on PetriI6hn APC plates �M! in duplicate. Plates were incubated at 20 C for 72hours. Colonies &om appropriate plates were enumerated, and results reported as colony formingunits per gram cfu/g!.

53
Moisture was determined by the AOAC oven dry method. Duplicate subsamples of eachreplicate! were accuiaely weighed, dried at 100'C to constant weight approximately 16 hours! andresults reported as percent moisture by weight. pH was mea!ured directly &om the opened containerswith a standardized Orion pH meter and probe.
Containers of scallops were opened, weighed, spread on a sieve, drained for one minute andreweighed. Results were reported as percent drip loss, by weight. Cook losses were determined byaccurately weighing approximately 300g! scallops, broiling them under an electric coil to an internaltemperature of 7 H-2'C approximately 6'A minutes!, aHowing them to cool for 1 to 2 minutes, thendraining and reweighing. Internal scallop temperatures were monitored with a multichanneldatalogger Science Electronics, calibration traceable to a NIST standard! equipped with nude endcopper-constantan thermocouples.
n P lPr r s
On days 4, 6, 8, 11, 15, 18 and 20, each treatment and control were presented to sensorypanelists trained in scallop evaluation. Of 15 prospective panelists, 10 were selected based on theircommitment and procedural comprehension or acuity. Scallops were evaluated raw for appearanceand odor, and cooked for appeirance, odor, flavor and texture. Unstructured linear scales, anchoredby the terms "fresh" and "not &esh" were used for evaluating each of these parameters appendix!.The purpose here was to simult!Neously assess aH of the various attributes for each parameter whichaffect the perceived degree of &eshness. This differs &om descriptive analysis procedures employingspecific category scales, for example, degree of rubberiness as a texture measure. Since any onedescriptive term may not fully correlate with &eshness or shelf-life, training centered on familiarizingpanelists with charactistics indicative of &esh eg. recently harvested! scaHops, those that are not ataH fresh ie. spoiled! and those in between.
Panelists were informed of &eshness descriptors commonly used for scaHops, such as degreeof staleness, bitterness, and off-odors and off-flavors �!. They evaluated scallops of various stagesof freshness, compared results and were encouraged to discuss other terms and phrases whichdescribe relative freshness. This process established a coinmon basis for evaluation, however, thedescriptors were used only for training. Panelists were instructed that samples should be evaluatedindependently and that preference or degree of liking hedonics! was not a test criterion: only degreeof freshness.
Recognized sensory panel procedures were followed, including random number generationof sample codes, mixed order of sample presentation, proper lighting and other environmental factors,panel station set-up and care to avoid controllable biases �, 8!, The order of sample parameterevaluation was: raw appearance, raw odor, cooked appearance, cooked odor, cooked flavor, andcooked texture. That is, aH samples were evaluated 6rst for raw appearance, secondly for raw odor,and so on. Cooked scaHops were held in covered glass containers in a moist heat environment priorto serving to panelists usuaHy within 10 minutes!. They were evaluated warm.

ti tical
Raw data were analyzed by Analysis of Variance ANOVA! and, where indicated, meanscompared by Duncan's multiple range procedure alpha = .05!.
RESULTS AND DISCUSSION
Moisture contents on day 4, the first day that all treatments were available, ranged &om 80.4percent for the STP treatment to 85 percent for the S$6 treatment. The intended targets of 82, 84and 86 percent moisture contents for the S82, S84 and S86 treatments were not achieved initially.However, moisture determinations varied during storage and values close to these targets wererealized by day 11, Figure 1, Use of sodium tripolyphosphate in STP and DIP treatments did notincrease moisture levels compared to FW.
gH
Phosphate treatments generally raised scallop pH as expected �7! compared to FW, withovendl reductions in pH during storage, Figure 2, Production of acidic microbial metabolites is likelyto be the primary cause of acidification. The release of bases is also expected due to deeninationprocesses. Consequently, the pH values indicate the net release and decomposition of acids and basesin a buffered system; not the specific mechanisms involved. Scallop pH may have some value inquality assessment when processing methods are known.
A i Plte nt
Aerobic plate counts were quite low and generally did not change during storage, Figure 3,Shifts in predominant microfiora are possible during this time, however, microbiological populationswere not characterized in the study. On days 4, 15 and 1$ the DIP treatment APC's were significantlylower than FW APC's.
orwell-Mmer et al. �! reported an APC of 7.35 log cfu/g after scallops were held on icefor 14 days. Lower values were reported by Power et al. �1!: 5.7 log cfu/g after 18 days on icebeginning with high quality scallops. The microQora was predominately Pseudomonas spp. in thatstudy. This compares to APCs of 4.5 DIP! to 5.5 FW! log cfu/g for treatments in this study after18 days of storage. The psychrotrophic incubation procedure used in this study usually produce platecounts higher than those expected &om standard APC �5'C! procedures. Mukerji �0! obtainedpsychrotrophic plate counts of 2.7 to 5,2 log cfu/g for sea scallops cryogenically &ozen at sea, and5 to 6.2 log cfij/g for &esh sea scallops at off-loading.
Antimicrobial properties of polyphosphates have been previously reported, primally in poultry�, 4, 12, 15!. Vyncke �6! attributed observed shelflife extension of ray meat treated with sodiumtripolyphosphate to urease inhibition but not to control of microbial growth.

55
The release of free liquid increased during iced storage, with amount of drip and time ofrelease dependant on treatment, Figure 4. The FW scallops exhibited significantly greater drip lossesthan the phosphate treated scallops, with most of this loss occurring during the first four days ofstorage. The S86 treatment was significantly less effective at retaining liquid than were the otherphosphate treatments, This was probably due to a moisture content in these scallops greater than thewater binding capacity of the tripolyphosphate. The least drip loss was achieved by the DIPtreatment, with visible weepage occurring only on days 11 and 15. Partial protein denaturation andconcomitant loss of water holding capacity during storage was expected, and probably accounts forthe overall trends. In a previous study, scaHops exposed for two hours to a two percent sodiumtripolyphosphate solution experienced no net weight change after subsequent &eezing and thawingcompared to pretreatremt weight T. Rippen, 1990, presented at 50th annual meeting of the Instituteof Food Technologists, Anaheim!.
~CD L~o'.1
As with drip loss, cooking losses increased over time, Figure 5. The DIP treatment lostsignificantly less weight than did FW when cooked during the first six days of iced storage. Most ofthe apparent differences in cook losses between FW and the other phosphate treatments were notsignificant, except for S84 on day 4 and S86 on day 11 when less cook loss was recorded for thesetreatments.
Water may be unbound or bound to various degrees within muscle tissue, and the conditionsfor its release dependant on changes in protein conformation brought about by chemical, ~vaticand physical effects, including heat induced coagulation. The combined percent weight lossesassociated with iced storage and cooking are shown in Figure 6. Phosphate treatments generallyresulted in less total shrinkage than FW, with DIP producing the least loss of all treatments on days4 and 6, p<.05. Treatments producing significantly less loss than FW were: STP on days 4, 6 and8;DIP ondays1,4,6,8 and 11; S82ondays1,4and6; S84ondays4and8; and S86ondays6,8 and 11.
The increased water binding properties of meat systems containing phosphates has been welldocumented �2, 13, 18, 19!.
Anal is
Appearance and odor scores of raw scallops during iced storage are sunumrrized in Figures7 and 8, respectively. On day 4, FW was judged to have an appearance that was significantly more&esh than S86 and S84 appearance. Odors of FW, S82 and S84 were judged to be significantly more&esh than STP odor on day 4. No significant differences were identified during the remainder of thestorage period.
Cooked sensory scores are summarized in Figures 9, 10, 11 and 12. Cooked appearance ofFW was judged to be significantly less &esh than S84, S82, DIP and STP on day 6, and less &esh than

56
O Ol
Q.
Q Q CDCO
Co CoQ OQ!U!65
CV0
Z
QCO
Co Co
CD
~ ~
V!
U C3
g ~o-co a~e
D
U!
0 g!> m
O
Q
Oh lD 0! W C9 Ol ~ O00 00 0O 00 Co 00 00 CO
I ccccC~vCO
D
co c=p4
CP Qccc
cc3ccl
~ g II ~
4I

57
o CV
IO>o
v+ a
0!CDCU
CV L-0
�
o
Co p cpCO CO
OLO LO LO CD LO LOh CD CVCD CD LO
X CL
D»O C
oClC0»Igl '
e +CR0
0 Qg
0$e %e63»OQ»~ O

58
o OJ
X
CL
~ V 0Q!
Q U!cu- a
�O ~~ 0

8 a!Q
0
co
0
CL
0 OCO
cou co
IO
c9 cv ~ 0
g Q~ � CL UOICO
0 XlC
Cg 0!
p v-CO
C
p COv I054! CO
CO CO
CO
g 0!

60
Q.
CI
0 �CO
cO �
O m
CO00
0
CL
0 V�
0
S
D UU! Q!
UO
OO CV
COQCOCO
0 0 0
Ooo~ >orna
DlO
>oOD vQ.
lg ~< cCO ~
Il8Q vD ~
sjDL cO.Cf4l
4ICo.
COeCO ~4lCl m
4P

0 0
CL
CI
Q. �CQ
cO cO
0
C OCO
� lODO
vQ.�
Ul
cOLI CO
C!0 0 0 0 0 0LO W C9 CV
8 I- O~ cd- g O- ac~ a O cd cd
o ~0!G5
�
0
D wO CcoC edd vco '
~ 'CcdD
C7cd s
cd
Ccd 47e v
O

62
C1 p0
I4 4I � I-V! CO
Q U!CV g
0
o '00
LLICI
4 4I- I-CO CO
o oLL
O2:
CL
0 U!C
~ oCC ~ G!
O
gp CDC
~ ~
U!
~C5O 00 CO C C4 O
OlCaaoo~mevo eoo~e o
LL
O'g vo ao v-C= cP e
e o ~'g o
C D.o o
oC g 0
00
o ~Clo ~~ o

63
DUl
N g
0
�
0
COco
Cl
CO
u co
CllS1LL
0Z
U!
~ ~
CI
CO6!
0 V
L
0
0Q.
0 lgV
U!
0 4 CD 4 CV
QD O s CQ O O L Cl
� lOD g
va 0
D ee CEdC
l5 '
ill+ 'C
C%Ie
C7 4!g ~
lit
e elCill ~Cle ~
Q

64
O
DOCc5
Q CLCh
CL g!QOI
0. QI- I-� CO
Q U!65
0
S 0C5Co
CL 0I- I-� V!
O
eco ooze e
LI0Z
Q!CD
a. C0 ~
0
o.CO ~ D
OQ�
0 0 C5CO
Q!
~KO CG CQ C CV O
eeU Caaeca~ecoe
LOO
.= aD
~cCk
e 4!Veee vccaW
e,D~ Ol
CO
r I
C|I
eme
o
eI


66
0O
COCX g!O
IQ QI- I-CO CO
0 !05
U
t0co
Q Q' I- I-
CO CO
lO~o
vm cxg OI
u CO
COILL
gy lOC ~C ~IQ v~ 4l
OX
Q.0
G$O
03 E UlCU
O
0 0 gV m
~ Q!
U!
~ ~
U!
~CO aa CD W Al O
Q!U!
CV g
0
o '0
0 �eo
D

67
CICV0 O
� CL
Co
CL 0t- I-CO CO
Q
I-coQ
Gl g!
0
Q co
ICL 0I- l-CO CO
CO
u CO
l54LL
02:
CL
0 C O f! g!
CD
8 a0$
~ 00 ~
CU
V!s
~ ~
CD
U O
I ok~~a I COOO<O
EOOv
O 0,
D ~O C
C C CS v-lO~ Xl
e +OICO
O O0
55Cl
C ~lO vvO v

68
DIP, S86, S82 and STP on day 15, Figure 9. These results are a partial reversal &om raw appearancescores. When raw, the appearance of FW scallops is relatively indicative of &esh scallops but, whencooked, they may appear less &esh than phosphate-treated scallops.
Cooked odor, Qavor and texture scores were ~ over time, with no significant differencesuntil day 20 when FW and DIP scallops rated odor, flavor and texture scores that were significantlymore &esh than S86 scallops. The S82 cooked texture was also significantly more fresh than S86scallop texture on day 20.
In a previous study, scallop sensory quality was maintained longer during iced storage by useof sodium tripolyphosphate T. Rippen, 1990, presented at 50th annual meeting of the Institute ofFood Technologists, Anaheim!. In that study, higher APC's were encountered and phosphateextended shelflife up to four days. Lyon and Magee �! determined that poultry meat held in threepercent polyphosphate overnight produced products that were judged to be lighter in color, moretender and less ofF-Qavored than products presoaked in water or two percent sodium chloride only.
Long shewife is a known characteristic of properly handled sea scallops. As previously noted,APC's did not increase appreciably during iced storage. However, during preparation of sensorypanel sessions, researchers observed that scallop odor intensity and, to a lesser extent, Qavor intensitydiminished rapidly after containers were opened and the scallops prepared. This also is a recognizedcharacteristic of scallops which should be considered when interpreting sensory data, The efFect mayaccount, in part, for the very long apparent shelQife of scallops used in this study.
CONCLUSION
The 80 percent moisture content interim regulatory target inay not be routinely achievable inproperly handled scallops since water contact occurs during chilling, iced storage and washingprocedures which are &equently necessary steps. The lowest initial mean moisture value determinedin this study was 81.0 percent for the STP wash treatment STP!. The 10 percent STP dip treatment DIP! generaQy produced the least drip and cook losses and lowest aerobic plate counts durmg icedstorage compared to &eshwater washed scallops FW!.
Sensory sheMife was long for all treatments, Few significant sensory differences wereidentified among treatments during most of the storage period, The appearance of raw FW scallopswas initially perceived to be inore like fresh scallops than were the high moisture phosphate-treatedscallops S84 and S86!, and the appearance of cooked FW scallops was perceived to be less like &eshscallops than were phosphate-treated scallops, except for the highest moisture phosphate treatment S86!, which was not significantly different.
From this study, the use of sodium tripolyphosphate on &esh scallops appears to have mostvalue in controlling drip losses, cook losses and aerobic plate counts. No additional benefit wasapparent by very long exposure to solutions of sodium tripolyphosphate. Shorter exposures tosom~ greater concentrations of STP produced the desired functional effects, generally withoutexceeding 83 percent moisture.

69
Appendix. Example Sensory scoresheet used by panels
NAME:DATE: September 23, 1992
COOKED SCALLOP EVALUATIONINSTRUCTIONS: Please evalnate the scaHop samples with a vertical mark on the
horizontal scale based on the characteristic indicated in each block

70
REFERENCES
1. CFR. 1986. United States standards for grades of &ozen raw scallops. Code of FederalRegulations, Title 50; 266,111.
2. ELLIOT, R., R. STRAKA and J. GARIBALDI, 1964, Polyphosphate inhibition of growthof pseudomonads &om poultry meat. Appl. Microbiol. 12:517.
3. HRSTENBERG-EDEN, R., D. ROWLEY and E. SHATTUCK. 1981. Inhibition ofMoraxella-Acinetobacter cells by sodium phosphate and sodium chloride. J, Food Sci.46:579.
4, FOSTER, R. and G. MEAD. 1976, Effect of temperature and added polyphosphate on thesurvival of salmonellae in poultry meat during cold storage. J. Appl. Bacteriol.41:505.
5. LARMOND, E. 1977. Laboratory methods for sensory evaluation of food. Pub. 1637,Agriculture Canada, Ottawa.
6. LYON, B., and J. MAGEE. 1984. sects of sodium chloride and polyphosphatepretreatments on fowl meat processed in Qexible pouches. Poult. Sci. 63:1958.
AIAAWNIDANOIAR, O, A IOAAPIHON. A. APINDUH, D. HOILOWAP-IHOHAI,M. AVERY and C. PHLEGER. 1982. Chilled �'C! and &ozen -18'C! storagestability of the purple-hinge rock scallop, Hinnites mulfirugosus Gale. J, Food Sci.47�!; 1654.
8. MEILGWQU3, M, G, CIVIiLLE AND B, CARR 1991. Controls for test room, product, andpanel. p. 23-42. In: Sensory evaluation techniques. CRC Press, Boca Raton.
9, MOLINS, R.A, 1991. Phosphates in food. CRC Press, Boca Raton.
10. MUKERJI, J. 1992. Quality of on-board cryogenically &ozen sea scallops Placopectenmagelhmicus!. M.S. Thesis, Dept. of Food Sci, and Techn., Va. Poly. Inst. and St.Univ., Blacksburg.
11. POWER, H., K, FRASER, W, NEAL, W, DYER, C. CASTELL, H. FREEMANand D.IDLER. 1964. Use of gamna radiation for the preservation of scallop meat, J. FishRes. Bd. Can. 21�!:813.
12. REGENSTEIN, J., and J. STAMM, 1979, A comparison of the water holding capacity ofpre- and post-rigor chicken, trout and lobster muscle in the presence ofpolyphosphates and divalent cations, J, of Food Biochem. 3:223.

13. SHULTS, G., D. RUSSELL and E. WIERBICKI. 1972. Effect of condensed phosphates onpH, swelling and water-holding capacity of beef. J. of Food Sci, 37;860.
14. SPENCER, J. and S. SMITH. 1962. The effect of chilling chicken fryers in a solution ofpolyphosphates upon moisture uptake, microbial spoilage, tenderness, juiciness andflavor. Poult. Sci. 41:1685.
15. STEINHAUER, J. and G. BANWART. 1964, The effect of food grade polyphosphates onthe microbiol population of chicken meat. Poult. Sci. 43:618.
16. VYNCKE, W. 1978. InQuence of sodium tripolyphosphate and citric acid on the shelf life ofThornback Ray Raj a clavata I !. Z. Lebensm, Unters.-Forsch. 166:284.
17. WAGNER, M. 1986. Phosphates as antibotulinal agents in cured meats: a review. J. of FoodProt. 49�!:482.
18. YOUNG, L., C. PAPA, C. LYON and R. WILSON, 1992. Moisture retention and texturalproperties of ground chicken meat as affected by sodium tripolyphosphate, ionicstrength and pH. J. of Food Sci. 57�!:1291.
19, YOUNG, L., and B. LYON. 1986. Effect of sodium tripolyphosphate in the presence andabsence of calcium chloride and sodium chloride on water retention properties andshear resistance of chicken breast meat, Poult. Sci. 65: 898.

THE APPLICATION OF PHOSPHATES IN THE PROCESSING OF PACIFIC SHRIMP,OR WHAT'S SO DIFFERENT ABOUT THIS USE?
Paul G. TaylorEvergreen Food Ingredients
Oympia, WashingtonAnd Representing BK-Ladenburg Corporation
Simi Valley, California
On October 21, 1992, the Seattle office of the U.S. Food and Drug Administration issued anindustry advisory that directed that Pacific shrimp processors would have to begin to label theaddition of phosphate to their product. This directive changed a practice that had existed for overten years, since these processors first used phosphates on their shrimp. The processors, with theguidance of various professionals, both academic and otherwise, believed that this application wasclassed as a "processing aid",
As most of us know, significant quantities of phosphates are used for shrimp processing.Processors on the East and Gulf Coasts use condensed phosphates to retain moisture in the shrimp.If they did not, there would be a significant loss of moisture and protein! in the freezer, duringthawing, and during heat processing. This would create economic losses and customerdissatisfaction. The direct addition of a phosphate solution by processors in the Southeast adds aspecific amount of phosphate to the product, and Food and Drug Administration regulations requirelabelling that declares the presence of phosphate. This is a proper application of the law.
gl I ' IP~! hi d.Hf* ' k ph hand I am here to explain that difference to you, As stated, Pacific Coast shrimp processors, alongwith numerous knowledgable people including the authors noted above, believe that their applicationof phosphates is covered by 21 CFR Ch, 1, Part 101.100, Section ii, paragraphs b! and c!, part ofwhat is commonly called the "Processing aid regulation".My presentation today will address thereasons that the previously-named authors, and many others, firmly believe that this use of phosphatesis definitely a processing aid, rather than a food ingredient.
First, let us look at two of the paragraphs in the processing aid regulation. Paragraph P!states that processing aids are "Substances that are added to a food during processing, are convertedinto constituents normally present in the food, and do not significantly increase the amount of theconstituents naturally present in the food." Paragraph c! says that processing aids may also be"Substances that are added to a food for their technical or functional effect in the processing but are

73
present in the finished food at insignificant levels and do not have any technical or functional efFectin that food." Later in this presentation, we will refer back to these two paragraphs. Now, let us look
U P U f~dd ' '.M h hl b d U' p l fb' p UOregon State University Seafoods Laboratory at Astoria, Oregon.
As many of you already know, this shrimp is much smaller than that which is typicaHyprocessed by Eastern and Gulf processors, or by those who import green headless shrimp Romoverseas. Counts may run anywhere from 100 to 350 per pound, in the shell, although harvesting andproceuing of the smaller sizes, perhaps smaller than 170 per pound, is discouraged, and sometimeseven prohibited. This shrimp may be landed at ports from Eureka, California to Westport,Washington, and sometimes even in British Columbia.
Immediately after landing, the shrimp does not process well. Processors determined long agothat allowing P j~rm to age, in ice, for three or four days after catch would improve the ability ofthe mechamcal peelers to remove the shell from the meat. This aHows enzymatic action to degradethe connective tissue {coHagens! that occur between the musculature and the sheH. This action,however, solubiHzes some of these tissues, meaning that upon separation, the solubleswiH then be lost during the intense washing that occurs in a shrimp peeler.
Let's describe the peeling process. Shrimp are delivered to the peeler area in tote bins, withice still usually present. They are then dumped into the feed hopper on the peeler, where they mayremain for several minutes. They then move out of the hopper area on an inclined mesh belt, in anearly single-thickness layer. The shrimp pass through the cooking area, where they are steamed at100 degrees centigrade for a period of about 90 to 110 seconds.
After cooking, they immediately faH onto a number of counter- rotating, osciHating roHers thatslope down and away from the cooking area. Streams of water under pressure are focused uponthese roHers. The loosened shell, along with legs, antennae, and viscera are pinched by the roHers anddischarged below. The shrimp flesh, being somewhat soft, slippery and flexible, travels down theroHers and falls into a flume. The shrimp then are flumed into a separator, where any last pieces ofsheH are removed, then onto an inspection belt prior to freezing.
The industry estimates that up to four gallons of water per pound of shrimp are used afterphosphate treatment and cooking, and during the mechanical part of the peeling process.
In the late 1970's Dr. David Crawford, with Dr. Jerry Babbitt, at the Oregon State UniversitySeafoods Laboratory, began to study ways to retain the soluble and insoluble protein lost in thepeeling process. The idea was to promote gelatinization of the soluble proteins during cooking. Itwas noted that considerable amounts of connective tissue were retained in the peeled shell. If thesoluble proteins could be gelatinized, this would allow much of the remaining tissue to be pulled fromthe shell when peeled. Condensed phosphates were selected as the means of performing this action�!
Initial studies were done with a commercial mixture of mostly sodium tripolyphosphate withsome sodium hexa-meta phosphate, caHed Brifisol" D-510, Rom BK Ladenburg Corporation. Work

began in the lab, and then progressed to plants where phosphate solutions were apphed to the shrimpin the peeler's feed hopper. Results were impressive. It required a couple of years for acceptance,but the industry eventually turned 100% to processing with phosphate.
Concurrent further research by the Seafoods Lab found that a solution of up to 6% phosphatecould be used, and that very cold treatment temperatures were necessary for best results. TheLaitram PC-A peelers at first allowed the hot condensate &om the cooking area to flow back intothe feed hopper where phosphates were being applied. It was not long until all of the processors hadmade modifications to the peelers to reduce temperatures in the feed hopper to as close to 0 degreesCentigrade as possible.
A typical operation utilized a recirculating system with a mixing and holding tank for thephosphate solution, a means of re&igeration to mah~n cold tenperatures, and screens to keep largerparticles of shrimp residue out of the system. After these changes were in place, it was notuncommon for processors to increase recovery of meat by as much as ten percentage points, i.e., &omperhaps 21% without phosphate to 31% with phosphate. At the price of peeled shrimp, thiswas a significant savings,
One other change occurred. Due to the softness of the water on the Oregon Coast, and dueto the fact that it is very dif6cult in plant operations to perform precise recovery analysis due to thewuiability of Pacific shrimp &om tote-to-tote, hour-to-hour, week-to-week or whatever time &arneis chosen, most processors changed over to straight sodium tripolyphosphate for the cost savings.It was vay dificult in this case to achieve truly accurate recovay information that would have shownthe difFerence that could have been achieved with a more sophisticated phosphate, as can be done ina hard water area or with a difFerent product being treated.
At this time, it should be emphasized that phosphate is applied to the shrimp only beforecooking, peeling and washing. Contrary to what some believe, there is no phosphate whatsoeverapplied afterwards, as will be noted later.
Now, let us address the determination that this is a "processing aid". There is a considerableamount of research that justifies this, in the opinion of the referenced authors and myself, and hereis some of this information:
In a 1980 paper �!, Dr. Crawford reported that he had determined that phosphorus contentof treated shrimp as P,O,! can vary &om 537 to 727 mg/100g wet weight, a variation of 190 mg,He also found that pretreatment solutions as high as 6% produced added phosphorus levels of lessthan 110 mg/100g wet weight over control samples. His conclusion was that the quantity ofphosphorus added to cooked shrimp meat...is somewhat less than the range of phosphorus levelsnaturally occurring in shrimp.
In 1981, Tenhet and others used radiolabelled phosphorus on both Besh and previously &ozenraw, pggled shrimp. STP concentration had to be 5% to 10% with a contact time of g lea~t20~minut to achieve uniform distribution throughout the muscle. Note that we are discussing the useof phosphate on unpeeled Pacific shrimp, and for a contact time of approximately 5 to 10 minutes,

75
using 64/o-usually le.n-concentration. It is very likely that phosphate treatment is acting only on thesurface of the flesh in our case with Pacific shrimp.
An incorrect idea was recently presented that Pacific shrimp were being treated withphosphate aAer cooking, causing additional water binding. First, you should know that sodiumtripolyphosphate is unstable at elevated temperatures such as in steam cooking. It is quickly andefficiently hydrolyzed to the orthophosphate form, a form naturally occurring in muscle. Thismolecular form is not active in protein modification, water binding, or sequestration.
A note here, for those who use phosphates, especially those that are more difHcult to dissolve,one should never dissolve phosphates in hot water. In fact, you should not even dissolve them inwarm water. A good instantized phosphate can be dissolved in cold water,
To point out this hydrolysis efFect with scientific studies, Sutton, in 1973 �!, showed thattripolyphosphate was rapidly hydrolyzed to pyrophosphate, then to orthophosphate in cod muscle dueto the action of alkaline phosphatases at both GC and 25C. In 1981, Tenhet and others �! showedthat after two weeks &ozen storage, only 12/o of total phosphorus in uncooked shrimp musclecorresponded to the originally added STP. By ten weeks, of &ozen storage, phosphorus levelcorresponded to 45/o orthophosphate. No heat was applied to facilitate the hydrolysis of thecondensed phosphate. It should be very apparent that there is no action whatsoever by the phosphateaAer cooking, and it is a known fact that there is no phosphate application to the shrimp aftercooking. Such application would be a total waste of phosphate and an economic loss.
Another concern has been expressed for the amount of residual phosphate that might remainin cooked shrimp, and the activity of this phosphate. In 1980 Crawford reported �! that there wasan upper limit of 0.258/o PP,uptake in processed shrimp, and as noted above, only 124/o of the totalphosphorous corresponds to added STP, so it is reasonable to conclude that the amount remainingis insignificant. STP averages 58'/o P,O� therefore there would be only 0.018~/o remaining. This isa level too low to provide any residual humectant or sequestrant efFects, even if this was an activeform of phosphate.
There have also been concerns expressed that the use of condensed phosphates prior tocooking and peeling results in increased muscle hydration, or a "humectant" eff'ect, Data &omOregon State University shows that there is no significant difFerence in moisture content betweentreated and untreated Pacific shrimp. In 1981, Chu �! compared treated and untreated shrimp,processed at 3, 4, and 7 days post-catch, held in ice before processing. Untreated, the moisturecontents were 79.30, 80.39, and 82.044/o respectively. Phosphate treated shrimp, however, showedmoisture contents of 80.20, 80.88, and 81.30/o respectively; not significantly difFerent. It wouldappear &om this data that the treatment resulted in a more consistent final moisture content. It istherefore very apparent that there is no increased muscle hydration nor is there a humectant effect.
In 1979, Nouchpramool �! showed that the older the Pacific shrimp time post-harvest andprior to processing!, the greater the moisture content, whether phosphate was used or not. %ith theuse of a 6/o solution of condensed phosphate on 2-day old shrimp, moisture content increased only0.30 to 0.58/e, with a mean of 0.44/o. Two day old untreated shrimp moisture content varied by

76
1,84/o, Any increase in moisture after treatment with condensed phosphate would be within naturalvariation. Additional work by Nouchpramool showed that use of phosphate increases the meat yieldand not the percentage moisture content,
Also, in 1984, Regenstein �! evaluated the efFect of difFerent phosphates on the water bindingpotential of seafood muscle, At concentrations of up to 6mM, or about 0.6'lo orthophosphate, therewas no net increase in the muscle's water binding potential. Once again, there is no increased musclehydration nor is there a humectant efFect with the presence of orthophosphates, Our conclusion herecan only be that, rather than promote water uptake, the use of phosphates results in a more consistentfinal moisture content and more predictable process yield. Therefore, there is no significant difFerencein moisture content between treated and untreated cooked Pacific shrimp.
Again, concerning sequestration of ions, sodium tripolyphosphate is considered to be only avery weak sequestrant. Orthophosphate is not a sequestrant and contributes very little, if at all, towater binding. Therefore, it is aye very apparent that there is no increased muscle hydration, noris there any humectant efFect. It is also axiomatic that the addition of water to cooked muscleproteins cannot be afFected by polyphosphates!
From all of this, we may conclude that phosphates are used in the mechanical peeling ofPacific shrimp to: i! EfFect dissolution of the connective tissue between the muscle tissue and theshell, and, ii! To facilitate surface protein gelation and increase peeling recovery. This results inefficient separation of the mesh from the shell and has no further efFect after deshelling. Neithermoisture content nor phosphate content is significantly increased. This application therefore meetsthe requirements of the P.D.A. "Processing Aid Regulations".
Now, let us look once more at these regulations. I will again show you the two applicableparagraphs, b! and c!. and enibellish them with my comments: Paragraph b! states that processingaids are: "Substances that are added to a food during processing, are converted into constituentsnormally present in the food, and do not significantly inixease the amount of the constituents naturallypresent in the food". Please note that I have underlined the word "significantly". It is quite obvious,that if you consider the data that the authors and I have presented, and especially in light of the useof the underlined word, this paragraph has been satisfied.
Furthermore, paragraph c! says that processing aids may also be "Substances that are addedto a food for their technical or functional efFect in the processing but are present in the finished foodat ugi~i~figg levels and do not have any figrth~er technical or functional effect in that food." Here,we again find that significance is to be considered. I have also added the word "further" that may notbe in the reggation, but can be assumed to exist there. Obviously, if a processing aid had no technicalefFect wlntsoever in the food at any time, there would be no reason to use it at all! Common sensetells us that the concern here is for any further efFect in the finished product, Therefore, it is also veryapparent that paragraph c! has also been satisfied.
One other note can be added to the above research work: the OSU Seafood Laboratory hasjust completed another test of treated and untreiited shrimp, and I understand that the results confirmall of the previous information. Dr. Morrissey can provide you with more details on this. The find

77
conclusion is that this application of phosphates can de6nitely be considered to be aprocessing aid, and does not require listing in the product's ingredient statement.
Literature Cited
1. CRAWFORD, D. L 1980. Meat yield and shell removal functions of shrimp processing.Oregon State University Extension Marine Advisory Program. Land Grant/SeaGrant Cooperative Special Report 597. 6 p,
2. TENHET, V., FINNE, G., NICKELSON, R. AND TOLODAY, D. 1981a. Penetration ofsodium tripolyphosphate into &esh and pre&ozen peeled and deveined shrimp.Journal of Food Science. 46:344-349.
3. SUTTON, A. H. 1973. The hydrolysis of sodium triphosphate in cod and beef muscle.Journal of Food Technology. 8:185-193
4, TENHET, V,, FINNE, G., NICKELSON, R. AND TOLODAY, D. 198 lb. Phosphoruslevels in peeled and deveined shrimp treated with sodium tripolyphosphate. Journalof Food Science. 46;350-355.
5. CHU, T. 1981 Frozen shelf-life characteristics of condensed phosphate-treated Paci6ck'M ~. M.s.tb . kW S U e.oeof Food Science and Technology, Corvallis, OR.
6. NOUCHPROMOOL, K. 1979. EfFect of condensed phosphates and steam precooking timeon the yield and quality of cooked shrimp Pnn~ ~ord pug meat. M. S, Thesis.Oregon State University, Department of Food Science and Technology, Corvallis,OR.
7. REGENSTEIN,J.M. 1984. Protein-waterinteractionsinmusclefoods. ReciprocalMeatConferenceProceedings. 37: 44-51.
AND THE FOLLOWING CONTIUBUTORS:Jerry K. Babbitt, Ph.D,National Marine Fisheries ServiceKodiak, Alaska formerly faculty, Oregon State University!
David L. Crawford, Ph.D.Professor Emeritus, Oregon State UniversityAstoria, Oregon
Claire EgtvedtWards Cove Packing CompanySeattle, Washington
Lucina Lampila, Ph.D., R.D.Albright 4 Wilson AmericasRichmond, Virginia formerly faculty, Oregon State University!
Michael Momssey, Ph,D.Professor, Oregon State UniversityAstoria, Oregon
Joe M. Regenstein, Ph.D.Professor, Cornell UniversityIthaca, New York

78
USE OF PHOSPHATES WITH PENAEID SHRIMP
W. Steven Otwell
Food Science 4 Human Nutrition DepartmentUniversity of Florida
Gainesville, FL 32611
Water is the largest portion, in both volume and weight, in all edible shrimp products. As themain food component, it has a dominant influence on the sensory attributes, shelf-life and value ofthe shrimp. Mindful of these concerns, commercial practices have evolved to control, add and retainmoisture during shrimp harvest, processing, distribution, storage and preparation. How well thesecurrent procedures reflect 'good manufacturing practices,' denoted as federal GMP's �1 CFR Part110! is in question. Excessive water addition could be deemed adulteration resulting in economicfraud for the buyer, while limited water and water loss can compromise the quality, shelf-life andconsumer acceptance of the shrimp products,
COMMERCIAL SITUATION
The current growing concerns for moisture levels in shrimp Food Chem News, 30 Nov 92!coincides with the most significant period of transition for the nation's penaeid shrimp industry. Thedomestic fisheries have reached steady-state production in terms of available wild resources and theymust compete in a market with an increasing amount of cultured penaeid species from internationalsources. Since 1980 the total annual U.S. commercial shrimp landings have averaged about 200million pounds whereas the annual imported poundage has increased from 300 million to over 650million pounds Source: Heads-ofF weight equivalents in USDC/NMFS Fisheries of the U.S., 1991!.Domestic processors and food service establishments have grown dependent of foreign aquaculturedproduction. Cultured sources are evolving into foreign processing competition with finished andvalue-added products. As noted for many domestic industries, competitiveness with an internationalcommodity will require more attention to product quality and good manufacturing practices.Likewise, the new emphasis on seafood safety and nutrition must be incorporated in planning forfuture shrimp commerce in the U.S. The composition of the shrimp products, particularly inoisturecontent, warrant further consideration relative to GMP's from harvest to consumption.
fph
Use of phosphate agents to influence the moisture content in shrimp was a technologyborrowed &om the red meat and poultry industries. For penaeid shrimp, the initial intent was to helpreduce moisture or drip loss during frozen storage and thawing. This intent, although commonlycommunicated for well over 25 years, was never formally declared or incorporated by a firm, tradeassociation or regulation. U.S. FDA compliance policy guides i.e., no. 7303.842!, product seizuresand letters have referred to sodium tripolyphospahte STP! to control "drip loss", yet there is noformal regulatory position stated for the for the use of phosphates with penaeid shrimp. From acommercial prespective, controlling drip loss is a function that is considered necessary for raw orcooked, shell-on, peeled or breaded shrimp. In time additional product benefits were noted through

79
consumer expectations and retention of cook yield. Similarly, Crawford �980! introduced phosphateapplications for cold water shrimp, ~P~gi+rggj. The work focused on phosphates as processingaids to asist peeling and retain protein. His intent reflected distinct and unique processing conditionsand product characteristics for a different shrimp genus, Possibly the intended use for phosphateapplications on shrimp would require declared functionality and possible distinction by differingprocesses and various shrimp genera.
Through commercial practice, shrimp firms have learned of the consequences in productquality and yield due to changes and movements in moisture content. This experience is not welldocumented in peer reviewed literature or regulatory documents. Noting the simplicity of themoisture analysis, it is surprising that there are not previous studies to document the consequencesof handling on the water content in penaeid shrimp production, processing and storage. Mostprevious studies and reviews have focused on biochemical, microbial and sensory consequences Green, 1949; Campbell and Williams, 1952; Carroll et al, 1968; Pedraja, 1970; Flick and Lovell,1972; Cobb et al, 1973; Cobb et al, 1977; Bottino et al, 1979; Chung and Lain, 1979; McCoid et al,1984; Chamberlain and Lawrence, 1983; Chang et al, 1983; Krzynowek, 1988; and Chen et al, 1990!.Limited work has noted the loss of water holding capacity and hydration capacity during temporaryre&igeration for shrimp Shelef and Jay, 1971 and Chen et al, 1990!. Patents have introduced the useof phosphates to reduce moisture losses during processes, freezing and cooking of shrimp Stone,1981 and Shimp et al, 1983!. These former reports are limited to the segments of processing studiedand are dated by recent changes in processing.
Handling procedures for many domestic products have changed, There is a growingdependence on cultured penaeid species and some initial processing in international settings. Forexample, much of the breaded products rely on peeling shell removal! by separate firms, domesticand international, designed to afford this operation. Multi-firm handling requires additional bulkstorage and reprocessing. Traditional 'packing houses' for &esh and &ozen shrimp and some domesticbreading operations using more regional wild harvest expect different consequences in productmoisture. Their products are still considered 'penaeid shrimp' in U, S, commerce with all other shrimpsources and forms,
Previous work by Gates et al �985!, Williams et al �981! and Rao et al, �975!demonstrated moisture migration in breaded shrimp during frozen retail storage. Inability to retainmoisture in the edible muscle during the retail case thaw cycles resulted in breading weight in excessof the allowed 'standards of identity'. Eventual decisions concerning the standards for the U.S.breaded shrimp industry will require additional information on product moisture consequences vs.GMP's. The economic implications of any decisions may represent the most immediate andsignificant impact on the nation's most valued and established sector of seafood processing.
n n
The reported moisture contents for penaeid shrimp have varied from 71.8% to 87.0% Table1!. This range results from natural variations by species, season, product size, molting stage andmethod of production wild vs, cultured!; differences in handling, processing and product forms; and

80
Table I. Reported moisture content in raw penaeid shrimp chronological order!.
Moisture Content '/o! ReferenceSample Description and Location
76.8
78.2Thompson �964!
Thompson, et al �971!70.6-78.2
74,46
71.78
72,51Krishnamoorthy, et al �979!
Sidwell �981!75.6-81.4
depending on species
white shrimp, two 5 lbs, boxesTX 4 MS, winter
82.6 Dudek, et al �982!
Penaeid and Pandalus USDA Handbook No. 8 �987!75.9
brown shrimp, 5 lbs. retailLouisiana
TexasKtzynowek and Murphy �987!81.63
84.28
pink shrimp, 5 lbs. retailFlorida
Honduras82.97
80.10Krzynowek and Murphy �987!
Krzynowek and Murphy �987!84.12
82.03
81.90
P. ~s, Brazil 80.48
P. zgmgtat;i, Ecuador 79.64
p. ~ized, ~, xaaaamt;i,~, duaotntm and ~
80.0 - 84,0
depending on species
P- ~, indium, a~t'atalh,ttumi, Matitti,
aaiifa~, and duaraaauThese analysis lrom 10-16 composite samples per species
Garrido, et al �992!78.2 - 82.3
depending on species
78-870/0 Personal Communications �993!unreported results &m processing firms trained in the use of rapidmoisture analysis
sp
brown shrimpwhite shritnp1 sample/speciesPascagoula, MS
brown shrimp, Pascagoula, MS6 bimonthly samples pooled over one year
brown shrimpwhite shrimppink shrimpApprox. 11 individual shrimpavg./speciesOcean Springs, MS
P. mtaam, agua. mttadm, ittuaaima,~rttrum, iadiam, Miami!!i and mtiXt'm
white shrimpN. Carolina
GeorgiaTexas
Krzynowek and Murphy �987!
Krzynowek and Murphy �987!
Krzynowek and Panunzio�989!

analytical error due to different procedures, misidentification of samples, poor sampling schemes andassumptions. As the data becomes more current the reported moisture contents tend to increase Table 1!. Each report may have satisfied the question of concern for their respective study, but noneof these previous studies compared the consequences of moisture relative to GMP's from productionthrough processing and storage. Most studies simply reflect data per one species, most oftenmisidentified or grouped as "penaeid sp,", sampled at one stage of handling, In most instances theproduct was frozen and held under variable conditions, temperatures and thawing procedures priorto moisture analysis. Simply stated, they are the best data we have to date for penaeid shrimp. Eventhe most recent data for eight penaeid shrimp species offers limited interpretation relative to GMP's Garrido et al, 1992!. These samples were all obtained prefrozen with 'faith' in the supplierconfirmations that they were not processed with any water addition and they were less then 6 monthsin storage. Any additional history for product handling is unknown. Similarly, the most recent databeing reported by current processing firms reflects a very broad range �8 to 87'lo moisture! that hasnot been verified in conjunction with current commercial practice,
Also, freezing and cooking can decrease the moisture content in shrimp so as to adverselyafFect consumer acceptance Ahmed et al, 1972 and 1973; Webb et al, 1975 and Applewhite et al1993!. Studies have demonstrated that consumers prefer cooked shrimp with a higher moisturecontent Webb et al, 1975 and Applewhite et al, 1993!. When challenged with boiled pink shrimpO~~gs glggDLrgoi! pre-treated with phosphates for water additions vs. untreated samples, a groupof prescreened consumer panelists n=125! significantly preferred all treated products over theuntreated controls Applewhite et al, 1992 and 1993!. Their response rated a significantly higherperceived 'value' or 'fair market price' for the treated shriinp. This recent study demonstrates theaddition of moisture to shrimp is not necessarily adulteration relative to consumer expectations. Thisstudy lacks a comparison of moisture content as a result of GMP's per current commercial practicesand products, Cooking consequences per GMP's and related consumer expectations warrants furtherassessments.
REGULATORY SITUATION
Phosphates are multi-purpose GRAS substances " generally recognized as safe"; 21 CFR182.1810!, when used in accordance with good manufacturing practices GMP's!. The GRAS statusis based on previous commercial practice and these ingredients do not require a formal, food additivestatus. As 'GRAS' substances their use relative to methods for applications and amounts are basedon the functional effects. There are gg approved limits for the amount of phosphating agents that canbe used in shrimp. A previous proposal to establish a "... 0.5'lo level �. as served ..." limit on sodiumtripolysphosphates STP! "... in I to be &ozen] fishery products ..." was never approved FederalRegister 18 Dec 1979: 74845!. This proposed regulation stated limits as established for phosphatingagents used with poultry and red meats 9 CFR 381.147 and 9 CFR 318.7!. These USDA regulationsspecifically state the purposes for use of phosphates are to "decrease the amount of cooked outjuices" and "help protect flavor", These USDA regulations and current commercial practice attemptsto comply with a guideline of 0.5'/0 phosphates as added to the products, This guideline assumes thatall of the premeasured phosphate treatment as added or pumped into the product is completelyincorporated, A similar assumption is not directly applicable to shrimp and other seafood musclesystems.

82
Despite these distinctions for seafoods and related phosphate applications, internationalstandards have adopted the 0.5'/o �g/kg! guideline for phosphate use Codex AlimentariusCommission 1976 and 1992!, Likewise, the recent unified standards for European Union Councilon Foods �994! specify a Sg/kg maximum added phosphate level for frozen seafoods. Theseinternational guidelines do not offer methodology for distinguishing added from indigenous phosphatecontent.
The actual phosphate constituent for which the 0.5'/o limited refers to has confusedinterpretation and analysis. Researchers Tenhet et al, 1981! and the Codex AlimentariusCommission �976! imply the specified STP limit is for residual phosphates expressed as 'P,O,'. Thisconstituent is a calculated entity based on the of6cial analytical procedures for phosphorus AOAC,1990!, A more direct interpretation for the total phosphorus level in untreated or non-phosphatedpenaeid shrimp Table 2! nearly equals the proposed 0.5'fo �00rng/100g! limit when expressed as'P,O,'. This statement is based on the fact that the phosphate content expressed as P,O, mg/100gedible shrimp is equivalent to 2.286 times the corresponding phosphorus content. Realizing thissituation the recent Codex Alimentarius Conunission's revision of the International Standard forQuick-Frozen Shrimp and Prawns �992! 'doubled' their previous 1976 recommended allowance forphosphates. Likewise, for the most probable interpretation that the FDA proposed 0.5'fo level wasstrictly for the complete STP compound, this structure is rapidly degraded in all treated seafoods andoffers no guideline for assessing the amount of phosphates used Tenhet et al, 1981; Sturno 1987;Sturno et al 1987; Krynowek and Panunzio, 1993 and Heitkemper et al, 1993!.
To fitrther confuse the issue there are no reports published that relate moisture content to theamount or type of phosphates used to treat shrimp. Phosphate suppliers have learned that phosphateblends can be more effective than the traditional use of tripolyphosphates alone, Blend pH alkaline!is the effective feature in terms of moisture retention. The components in these blends i.e.,hexametaphosphates, pyrophosphate! have not been studied to determine the mode and degree ofbreakdown in treated products to the pyro-and orthophosphate phosphorus! forms. This informationis necessary to guide commercial and regulatory practice.
The total phosphorus P! levels in penaeid shrimp offer a simple, direct measure by which tojudge previous exposure to a phosphating agent Table 2!. Products with no previous history ofphosphate exposure appear to have phosphorus contents less than 250 mg/100g. Higher phosphoruslevels suggest previous treatments, but the amount of treatment would still require analysis formoisture content and visual inspections i.e, glassy appearance, especially when cooked, soapy feeland detectable tastes!. Unfortunately, these subjective indicators have not been aligned withphosphorus and moisture contents per phosphate treatments, and they would most likely differ byspecies.
Confusion for the use of phosphating agents in seafoods has lead to the current commercialand regulatory concerns for added water. This issue was initiated by regulatory positions issued tolimit the moisture content of sea scallops FDA, 1991!. Realizing attempts to monitor for phosphateresiduals offer only evidence for the use rather than the amount used, FDA opted to focus on theprimary adulterant of concern, water, Pressured for an interim policy, the FDA and commercialdecisions agreed on moisture guidelines that are proving to be inconsistent with natural moisturelevels in various scallops and do not refiect current GMP's. This situation has alienated the respective

83
Table 2. R orted pho horus levels m 100g! in the edible ortion of raw enaeid shrim
' Pho horus ContentSam le Descri tion References
Range Average
' Sidwell �981!235-291210-397
169-170
235-345
187-332
207-258 235P. azhxmPascagoul a, MSbimonthly samplesfor one year
Thompson and Farragut �971!
179-332P. aztec5 samples
249 Tenhet, et al �981!
Penaeid and Pandalus Exler �987!,USDA Handbook No. 8
Garrido, et al �992!
205
149-247
depending on species217
' The phosphate content expressed as P, 0, mg/1 00g edible shrimp is equivalent to 2.286 times thecorresponding phosphorus content. A 218mgP/100g shrimp equals 500mg P, 0, mg/1 00g shrimp.
' Details for sampling, prior product handling, analytical procedures and proper species identificationare lacking in this reference as well as the cited references
P, lxteilimiaP- aztecP. indies
P, gylikrmP. mtttttltltttt
P iautittimuP dumzttmP- ~ittiP- sditt:re
P.. uzLcma, indicestlute~, mtalia,~vttggj, ~htttittimtifam, and duuratutuThree analysis fi om one10 lb composite sampleper species
229258
295170325
340215278206

84
parties, complicated commerce, devalued some shipments and compromised consumer confidence TSFT Symposium, 1993!. A similar consequence is possible for penaeid shrimp unless acomprehensive study of moisture content is conducted prior to establishing meaningful and usefulguidelines, The moisture content of untreated, raw penaeid shrimp has been reported to exceed the
blih*d Ch igiI d* dip,Fl g
FDA must also consider the nutritional inferiority of phosphate treated products due topossible water 'dilution' of essential nutrients. As a matter of policy, FDA has adopted an 80'/o rulefor purposes of determining nutrition equivalency �1 CFR 101.9, e, 4!. This concern is linked tonutrition labeling and possible determination for imitation foods. It is not clear how nutritionalequivalence would apply to raw shrimp when they are not fabricated from new technology. Since rawshrimp is not a 'new food' fabricated from new technology �8 Fed, Register 2138 - 1/19/73 and20702 � 8/2/73! the primary concern would be total percent indigenous protein, This concern islinked to requirements for nutrition labeling. Data reflecting on the protein consequences due tophosphate treatments for penaeid shrimp are lacking, especially for cooked shrimp.
Another questionable regulation used to control the composition of shrimp products is thestandard of identity for breaded shrimp �1 CFR 161.175 and 161.176!. The first notice fordevelopment of this standard was initiated by the National Shrimp Breaders Association with theNational Fisheries Institute in 1961 Fed. Register 3/3 1/61, page 2723!. These dated regulations differfrom similar standards of identity for foods in that they do not declare or emphasis things oringredients that may be used or included in the shrimp. For example, the standard of identity forcanned shrimp �1 CFR 161.173! specifies optional ingredients that may be used with this productform. FDA responses to comments on the standard of identity for canned shrimp specifically statedsodium tripolyphosphate was not a suitable ingredient. In contrast, these breaded shrimp standardsare concerned with breading, breading ingredients that are suitable, related product nomenclature andanalytical methodology to determine percent breading. This FDA opinion and soine industryinterpretations have assumed these standards exclude the use of phosphating agents, FDA's opinionwas specifically stated in their first draft of the Fish and Fishery Products Hazards and ControlsGuide PDA, 1994! which accompanied their proposed HACCP regulations Fed. Register59/19:4142, 1/28/94!. These assumptions may lie in previous negotiations and understandings, butit is not evident in the language of the standard of identity,
'Shrimp' as defined in the standards of identity for breaded shrimp, 21 CFR 161,175 and161.176, is the "tail portion of properly prepared shrimp of commercial species". 'Properly prepared'is not defined except for reference sections c! to the optional product forms [cuts] and the breadingand batter. Section 'd' infers the suitable ingredients for the batter and breading by listing non-suitableingredients i.e., artificial flavorings, artificial sweeteners, artificial colors and chemical preservatives!.In the same section d! chemical preservatives that are suitable are: 1! ascorbic acid and antioxidantpreservatives. Listing ascorbic acid as a suitable ingredient to prevent 'blackspot' melanosis! on theshrimp is completely inconsistent with commercial practice for penaeid shrimp about the world.Ascorbic acid, either as a breading ingredient or previous shrimp processing aid, does not provideeffective prevention of melanosis on penaeid shrimp. As included on the suitable ingredients list inthe standard of identity for canned shrimp �1 CFR 161.173!, sodium bisulfite and related sulfitingagents are the primary GRAS ingredients used to retard shrimp melanosis. Sulfites are not includedin the standards of identity for breaded shrimp despite their prolific use. Although the standards do

85
not specifically provide for the use of phosphates, they also do not provide for the use of sulfites, Thetext in section d! indicates the listed ingredients all relate to the batter and breading. There is nomention of ingredients that may be used or are non-suitable for use with the 'properly processed'shrimp. There is no mention, inference or exclusion of phosphates either as ingredients in batter,breading or properly processed shrimp. According to current GMP's and GRAS status, phosphateshave historically been used in processing of shrimp. Likewise, the non-suitable ingredients listed insection 'd' i,e., artificial flavorings, artificial sweeteners, artificial colors and chemical preservatives!do not refer to phosphates. FDA's proposal rule on the use of phosphates FR 44/244;74845,12/8/79! defined phosphates as antioxidants, flavor enhancers, humectents, pH control agents,sequestrants, stabilizers, thickeners and texturizers. Phosphates are not defined or used aspreservatives. Current 21 CFR 182, Subpart D, does not include phosphates in the list of chemicalpreservatives. Phosphates are not used as artificial flavors, sweeteners or colorants. Simply stated,the dated standard of identity for breaded shrimp does not appear to address the use of phosphatesand is inconsistent with current domestic and worldwide practice with penaeid and breaded shrimp,
Mindful of potential product abuse or adulteration due to "excessive" moisture additionthrough the use of phosphates, FDA has recently attempted to discourage use of any substance"added to, or mixed with the product [seafood] to increase its bulk or weight or to reduce its quality,or make it appear of better or greater value than it is i.e., through adding water to a product bychemical or other means!." This statement is part of FDA's initial seafood HACCP hazard analysisand critical control point! inspection proposal Fed. Register 59/19:4142, 1/28/94!. Likewise, thisconcern was reemphasized in FDA's �994! proposed HACCP regulations and accompanying Fishand Fishery Products Hazards and Controls Guide. Interestingly, this guide, which was not subjectto external review with comments, includes the statement p. 167! that "Sodium tripolyphosphate isnot permitted in breaded shrimp or canned shrimp according to FDA's reference to the respectivestandards of identity �1 CFR 161.175, 161.176 and 161.173!," Although based on confusedregulations, current and future regulatory concerns appear to be for the elimination of indiscriminateand possibly any use of phosphate agents with shrimp.
RECOMMENDATIONS
The continued use of phosphates to treat penaeid shrimp remains in question. Documentedabuse has rightfully stirred regulatory and commercial attention. Proper use has not beenappropriately defined in commercial practice or regulation. The responsibility to resolve this situationin the best interest of commerce and consumers will rely on industry action. Recommendations;
1! Establish baseline data for the composition of raw penaeid shrimp in attempt to betterdefine the moisture and protein content in raw penaeid shrimp.
Published data offers a good start Table 1!, but most of the results can be suspect dueto previous handling which may have included exposure to phosphates or other agents.Additional work with 'authentic samples' will be required to account for diQ'erences byspecies, harvest conditions, and post-harvest handling. Mindful of the current trends inshrimp production, authenticity of samples would require international liaison. A specificproject to address this issue was rejected by the Saltonstall-Kennedy NMFS! Grant funds inearly 1994.

86
2! Demonstrate the changes in moisture and protein content in penaeid shrimp as aconsequence of frozen storage, processing and cooking.
Published data is limited and often does not account for the influence of phosphatingagents. Additional work beginning with authentic, untreated samples must follow throughtypical processing, storage and cooking regimes. The intent is to demonstrate the need forand influence of water controlling agents in terms of product composition, yield and quality,
3! Declare an intended use and/or function for phosphates in treating penaeid shrimp.
Based on the results from steps 1 and 2, industry must declare functions and relatedlevels or guidelines for use of the phosphating agents. The functions should include concernsfor; a! product protection from frozen storage and thaw drip loss, b! moisture, protein andother nutrient retention during cooking, c! reduced cook loss and product dehydration, andd! maintain product quality attributes i,e. texture and mouthfeel!, All of these functions mustbe demonstrated with actual product through customary processing and handling.
Likewise, this work should include a demonstration of consumer response to actualtreated product. Properly designed consumer evaluation studies offer a real measure ofquality consequences and value perception. Since FDA's mission is to protect consumerinterest, studies are warrented to assess this interest.
4! Declare appropriate guidelines i.e. moisture and protein levels! to accompany theintended functions and applications.
Industry should attempt to control their own situation through reasonable guidelinesrecommended for commercial standards and regulation. A raw product weight gain between5 to 10 percent could be reasonable Tables 3!, but it must be justified by steps 1-3. Thecorresponding protein changes and influence of cooking must be determined, For example,the ham industry bases phosphate water additions based on a protein fat-free PFF! measure Table 4!.
Table 4. Product labels for ham as determined by PFF standards.
Source: USDA, Food Safety Inspection Service, "Introduction to PFFProtein Fat-Free Cured Pork Products" Technical Publication Bulletin,Meat and Poultry Inspection Technical Services, Program TrainingDivision, Washington, DC.
Ham
Ham, w/Natural JuicesHam, Water AddedHam and Water Product,X'/0 of Weight isAdded Ingredients
20,5
18. 5
17.0
Less than 17.0

87
C dJo
C4
V
O
O O
o>o>O
o>
CV
go
~O
00O
ydI
.a m EOCd
pQ 9js>QO 9 os
Q vChO
Op
tO + Cd
O ~
O Ooccrc
OV!
O
g4O Cd ~O
O
~~ MCd
Q~w~
C8oCd
O
O OCd
OP
Cd
O ~ eVocS QO 00
6 0 O 00 0 C
'CS
C 0 0clg
'CS
0 cd0CS
~cd
aS
o<
aS~ ~
cd 0O
E ecd
co
M CPCS0cd
0cdo g
cd

88
REFERENCES
Ahmed, E.M. Mendenhall, T.T. and Koburger, J.A. 1972. Factors AfFecting The Texture of CocktailShrimp. Journal Texture Studies 3:186,
Ahmed, E.M. Mendenhall, T.T. and Koburger, J.A. 1973. Modification of Cocktail Shrimp Texture.Journal Food Science 38:356.
AOAC 1990. Official Methods of Analysis. 13th Ed. Association of Official Analytical Chemists,Washington, D.C.
Applewhite, L.D., Otwell, W.S., and Garrido, L.R. 1992, Initial Studies To Measure ConsumerPerception of Water Added to Shrimp with Phosphate Treatments. Proceedings SeventeenthAnnual Tropical and Subtropical Fisheries Technological Conference of the Americas,Merida, Yucatan, Mexico. Florida Sea Grant Publication 113, p. 86-88.
Applewhite, L,D., Otwell, W.S., and Garrido, L.R. 1993. Consumer Perceptions For PhosphateTreated Shrimp and Scallops. Proceedings Third Joint Conference Atlantic FisheriesTechnology Society and Tropical And Subtropical Fisheries Technology Society,Williamsburg, Virginia. Sea Grant Pubhcation - in press,
Bottino, N,R, Lilly, M.L. and Finne,G, 1979. Fatty Acid Stability of Gulf of Mexico Brown Shrimpggg~ ~i~! held on Ice and in Frozen Storage, Journal Food Science 44�979778.
Campbell, L,L. and Williams, O,B, 1952. Bacteriology of Gulf Coast Shrimp IV. Bacteriology,Chemical and Organoleptic Changes With Ice Storage. Food Technology 4;125-126.
Carroll, B.J., Reese, G.B. and Ward, B.Q. 1968. Microbiological Study of Iced Shrimp: ExcerptsFrom the 1965 Iced Shrimp Symposium. U.S. Dept Interior Circular No. 284, p. 17
Chamberlain, G.W. and A.L. Lawrence. 1983. Reproductive activity and biochemical compositionof pi~ncgs ~~if ~ and pggaeg<1 ~~ in the Gulf of Mexico. Texas Sea Grant Reportno. 84-203, p. 35.
Chang, O., W,L. Cheuk, R. Nickelson, R, Martin and G. Finne. 1983. Indole in Shrimp: EfFect ofFresh Storage Temperature, Freezing and Boiling. Journal of Food Science 48�!813-816.
Chanmugan, P., Donovan, J., Wheeler, C.J., and Hwang, D.H. 1983. DifFerences in the LipidComposition of Fresh Water Prawn Macrobrachium rosenbergii! and Marine Shrimp.Journal of Food Science 48:1440-1441, 1462.
Chen, H,, M, Moody and S. Jiang. 1990, Changes in Biochemical and Bacterial Quality of GrassPrawn During Transportation by Icing and Oxygenation. Journal of Food Science 55��70.
Chung,C.Y. and Lain,J.L.1979. Studies on The Decomposition of Frozen Shrimp II, DeteriorationDuring Icing and Refrigerated Storage, National Science Council monthly R.O.C.! 7:1136.

89
Cobb, B.F., Vanderzant, C.A., Thompson,C, and Custer, C.S. 1973. Chemical Characteristics,Bacterial Counts and Potential Shelf-life of Shrimp From Various Locations on theNortheastern Gulf of Mexico. Journal Milk and Food Technology 36:463.
Cobb, B.F., Yeh,S., Christopher,F. and Vanderzant, C. 1977. Organoleptic, Bacterial and ChemicalCharacteristics of Penaeid Shrimp Subjected to Short Term High-Temperature Holding.Journal Food Protection 40:256,
Codex Alimentarius Commission, 1976 Recommended International Standards For Quick-FrozenShrimps and Prawns. FAO United Nations, World Health Organization, Rome, Italy, IssueCACIRS92-1976, p. 15.
Codex Alimentarius Commission, 1992 Revised Codex Standard For Quick-Frozen Shrimps andPrawns, Pending Approval as of September 1992.
Crawford, D.L. 198o. Meat yield and shell removal functions ofshrimp processing. Oregon StateState University. Extension Marine Advisory Program. Special Report No. 597. 6p.
Dudek, J.A., Behl, B.A., Elkins, E.R., Hagan, R,E,, Chin, H.B. 1981, Determination of EfFects ofProcessing and Cooking on the Nutrient Composition of Selected Seafoods. Final Report ofthe National Food Processors Association Research Foundation prepared for NMF S. 542 pp.
Dudek, J.A., Berman, S.C., Behl, B.A., Eltuns, E,R,, Chin, H.B,, and Farrow, R.P. 1982.Determination of EfFects of Processing and Cooking on the Nutrient Composition of SelectedSeafoods. Report of the National Food Processors Association Research Foundationprepared for NMFS. p, 570.
European Union. 1994. The Council on Foods, Additives and other Colours and Sweeteners,European Parliment and the Council on Food, 4552/84 Brussels �2 Feb 94!.
Exler, J, 1987. Composition of Foods: Finfish and shellfish Products - Raw, Processed, Prepared.U.S. Department of Agriculture Handbook No. 8-15. 192 pp.
FDA 1992. Interim Policy to Establish Guidelines for Moisture Levels Permitted in Scallops. Issuedby the FDA of5ce of Seafoods, September, 1992.
FDA 1994. Fish and Fishery Products Hazards Controls Guide, FDA Once of Seafoods,Washington, DC. 228 pp,
Flick, G.J. and Lovell, R.T. 1972. Post-mortem Biochemical Changes in the Muscle of Gulf Shrimp,~Pn gg~g~. Journal Food Science 37�972�09-611.
Garrido, L.R., Applewhite, L.D. and Otweil, W.S. 1991. Use of Compositional Ratios for theDetermination of Phosphate-Treated Shrimp, Proceedings Sixteenth Annual Conference,Raleigh, North Carolina, Florida Sea Grant Publication 110. p.170-174.

90
Gates, K.W., Eudaly, J.G., Parker, A,H, and Pittman, L.A. 1985, Quality and Nutritional Changesin Frozen Breaded Shrimp Stored in Wholesale and Retail Freezers. Journal Food Science50�985! 853-858,
Green, M. 1949, Bacteriology of Shrimp H. Quantitative Studies on Freshly Caught and Iced Shrimp.Food Research 14,372,
Heitkemper, D.T. Kaine, L.A. and Jackson D.S. 1993. Determination of Tripolyphosphate andRelated Hydrolysis Products in Processed Shrimp. Proceedings Third Joint ConferenceAtlantic Fisheries Technology Society and Tropical And Subtropical Fisheries TechnologySociety, Williamsburg, Virginia, Sea Grant Publication in press!.
Krishnamoorthy, R.V., Venkataramiah, A., Lakshrni, G.J., and Biesiot, P. 1979. Effects of Cookingand of Frozen Storage on the Cholesterol Content of Selected Shellfish. Journal Food Science44�!:314-315.
Krzynowek, J. and Murphy, J. 1987 Proximate Composition, Energy, Fatty Acid, Sodium andCholesterol Content of Finfish, Shellfish and Their Products, U.S Dept. of Comm. NOAATech Rep. NMFS 55, p 53.
Krzynowek, J, 1988. Effects of Handling, Processing and Storage of Fish and Shellfish in NutritionalEvaluation of Food Processing. E. Karmas and R. Harris, Eds. Von Nostrand Reinhold Co.,New York, p. 245-265.
Krzynowek, J. and Panunzio, L.J. 1989. Cholestrol and Fatty Acids in Several Species of Shrimp, J.Food Science 54�37-239.
Krzynowek, J. and Panunzio, L.J. 1993. Detection of Added Phosphates in Seafoods. ProceedingsThird Joint Conference Atlantic Fisheries Technology Society and Tropical And SubtropicalFisheries Technology Society, Williainsburg, Virginia. Sea Grant Publication in press!.
McCoid, V., Miget, R. and Finne, G. 1984. Effect of Environmental Salinity on the Free Amino AcidComposition and Concentration in Penaeid Shrimp. Journal of Food Science 49�984�27.
Pedraja, R.R. 1970. Change of Composition of Shrimp and Other Marine Animals During Processing.Food Technology 24:37-42.
Rao, R.M., Novak, A.F. and Grodner R.M, 1975. Causes and Prevention of Moisture Migration andDehydration of Moisture Migration and Dehydration in Stored Frozen Breaded Shrimp. AContribution of The National Shrimp Processors Association nd National Shrimp ProcessorsAssociation and National Fisheries Institute, Arlington, VA.
Shelef, L.A. and J,M. Jay. 1971. Hydration Capacity as an Index of Shrimp Microbial Quality.Journal of Food Science 36�971!994-997.
Shimp, L.A. and Steinhauer. 1983. Shrimp Processing, U. S, Patent 4, 394, 396 issued 19 July 1983.

Sidwell, V,D, 1981. Chemical and Nutritional Composition of Finfishes, Whales, Crustaceans,Mollusks, and Their Products. NOAA/National Marine Fisheries Service TechnicalMemorandum NMFS F/Sec-11.
Stone, E.W. 1981. Method of Treating Fresh Shrimp to Reduce Moisture and Nutrient Loss. U.S.Patent 4, 293,578 issued 6 October 1981.
Sturno, M., Marshall, M.R, and Otwell, W.S. 1987. Development of a Rapid High PerformanceLiquid Chromatography Technique For Detecting Phosphate Treatment in Shrimp. M.S.Thesis, University of Florida, Gainesville, Florida,
Sturno, M., Marshall, M.R. and Otwell, W.S. 1987. Polyphosphate Determination in Shrimp UsingHigh Performance Liquid Chromatography. Proceedings Twelfth Annual Conference of theTropical and Subtropical Fisheries Technology Society of the Americas, Florida Sea GrantPublication-92, p.343.
Tenhet, V., G. Finne, R. Nickelson, II, and D. Toloday. 1981, Phosphorus levels in peeled anddeveined shrimp treated with sodium tripolyphosphate. J. Food Science 46:350.
Thompson, M.H. 1964. Determination of Sodium and Potassium in Fish and Other Marine Products.J. AOAC,47�!:701-707.
Thompson, M.W. and Farragut, R.N. 1971. Unpublished Data. The Composition of Brown Shrimp,2ggacm m~. NMFS Fishery Products Technology Lab, Pascagoula.
TSFT 1993, Symposium on Use of Phosphates with Seafoods. Proceedings Third Joint ConferenceAtlantic Fisheries Technology Society and Tropical And Subtropical Fisheries TechnologySociety, Williamsburg, Virginia. Sea Grant Publication in press!,
Webb, N.B., Howell, A.J., Barbour, B,C., Monroe, R.J. and Hamana, D.D.. 1975. Effect ofAdditives, Processing Techniques and Frozen Storage on The Texture of Shrimp. Journal ofFood Science 40�975�22-326.
Williams, S.K., Martin, R., Brown, W.L. and Bacus, J.N. 1981. Moisture migration in Frozen RawBreaded Shrimp During Nine Months Storage, Journal of Food Science 46:1577,
ACKNOWLEDGEMENT S
Funds to support this work were provided by the National Fisheries Institute's Scholarship Fund andtheir Education k, Research Foundation, the Gulf and South Atlantic Fisheries DevelopmentFoundation, and the Florida Sea Grant College Program, Their thoughtful contributions were madein the best interest of the nation's consumers and seafood industry.

DETHGQNATION OF TRIPOLYPHOSPHATE AND RELATED HYDROLYSIS
PRODUCTS IN PROCESSED SHRIMP
Douglas T. Heitkemper, Lisa A. Kaine, David S. Jackson, and Karen A, WolnikNational Forensic Chemistry CenterU.S. Food and Drug Administration
Cincinnati, Ohio
The Food and Drug Administration is responsible for regulating the use of polyphosphatesin seafood. Sodium tripolyphosphate is the most commonly used polyphosphate in the processedshrimp industry; and current regulations limit its use in accordance with Good ManufacturingPractice. The potential exists for economic fraud through mislabeling or excessive use oftripolyphosphate. At this point; the Agency is more concerned with excessive water uptake in treatedsamples than the amount of phosphate found in the product. However, there is a need formethodology which can 1! provide con6rmation of the presence of tripolyphosphate in shrimp and2! correlate the results obtained for added water with the use and/or abuse of tripolyphosphate.
The determination of total phosphorus by ICP-AES or some other suitable technique will notallow for an accurate and reliable means of regulating polyphosphate use in shrimp because of thewidely varying amounts of P found in shrimp naturedly [7]. Therefore, it is necessary to analyze forindividual polyphosphate species such as tripolyphosphate and pyrophosphate. There are a numberof reports deahng with the determination of polyphosphates in detergents by high performance liquidchromatography and ion chromatography [1-4]; however, thin layer paper chromatography oftenhas been used in investigations involving polyphosphates in seafoods [6,8].
The regulation of polyphosphate use is complicated by the fact that polyphosphates are knownto undergo hydrolysis. Unfortunately, polyphosphate hydrolysis is catalyzed in shrimp as well asin other meats! due to the action of tissue phosphatases [5,6,8]. One mole of tripolyphosphatehydrolyzes to one mole of orthophosphate and one mole of pyrophosphate, while one mole ofpyrophosphate hydrolyzes to two moles of orthophosphate [5,6,8].
The development of a successful regulatory method for tripolyphosphate in seafood willdepend on a number of factors. Of primary concern, is minimizing the amount of hydrolysis whichfakes place during sample treatment, storage, and analysis. In the case where a signi6cant amountof orthophosphate is formed due to hydrolysis, development of an efFective method may beimpomble because of high naturedly occumng orthophosphate levels. Additionally, it must be shownthat higher concentrations of tripolyphosphate and pyrophosphate found in shrimp correhte withgreater water retention. Tehnet and co-workers investigated the stability of STP in treated shrimpduring frozen storage using P32 labeled tripolyphosphate and thin layer chromatography[8]. This

93
study showed that some breakdown occurs during treatment; however, the tripolyphosphateconcentration remained essentially constant over the period studied � - 10 weeks &ozen storage!,Pyrophosphate and orthophosphate concentrations were not found to stay constant during the sameperiod of &ozen storage.
In another study, Reddy found that tripolyphosphate and pyrophosphate concentrations werestable over a 10 month period when stored at -25<C [6]. This study also utilized thin layerchromatography to show that the rate of hydrolysis increased with increasing temperature �,10, 25,and 350 C!. Additionally, the tissue enzymes responsible for catalyzing hydrolysis in uncookedshrimp were characterized.
Progress towards the development of an ion chromatographic method for the determinationof tripolyphosphate and pyrophosphate in processed shrimp will be discussed in this communication.
MATHthV. AND METHODS
The ion chromatograph used in this work consisted of a Dionex Automated Sampler Module,Gradient Pump Module, Liquid Chromatography Module-3, Reagent Delivery Module and VariableWavelength Detector Module-H. Data collection and reduction were accomplished using a DionexAdvanced Computer Interface and 386/25 microcomputer equipped with AI-450 chromatographysoftware. A Dionex IonPac AS7 anion separator column � X 250 mm! and IonPac NG1 guardcolumn � X 50 mm! were used.
n nitin
The chromatographic mobile phase was 70 mM nitric acid [HNO,] at a flow rate of 0.5mUmin, Detection of the phosphate species utilized post-column reaction with 1 g/L feme nitrate Fe NO,!,'9 H,O! in 2 % V/V! perchloric acid [HClO,] at a flow rate of 0.5 mL/min. The post-column reagent was mixed with the enluent &om the IC column using a mixing tee and a Dionex 500pL packed reaction coil. Ultraviolet detection of the reaction products was made at 330 nm. Theinjection volume was 100 pL
Food grade sodium tripolyphosphate [NaAO�] was obtained Bom Monsanto St. Louis,MO!. Sodium pyrophosphate decahydrate [N~P20, 10 H,O] was obtained Rom Aldrich Milwaukee, WI!; and sodium phosphate monobasic [NaH2PO4'H20] was obtained &om EMScience Gibbstown, NJ!.
Individual stock standards containing either 1,000 or 10,000 pg/g of analyte were preparedin distilled deionized water DDW! and stored in HDPE bottles. When stored at room temperature,these stock standards were not found to be signi6cantly afFected by hydrolysis for at least 30 days.Working standards were prepared daily in the concentration range 5 - 100 pg/g.

94
Sam l Pr aration
Samples used in this work were various commercially treated products from a single shrimpprocessor. The samples obtained were packaged and ready for sale.
Frozen samples were placed in zip-lock plastic bags and thawed in cool water. Tails andshells were removed when necessary!, A representative sample generaHy 15-20 shrimp! was thencomposited using a Cuisinart Food Processor Greenwich, CT!. Accurately weighed 0.5 g portionsof the composite were then placed in 60 mL HDPE bottles and diluted by a factor of 100 w/w! withDDW, After thoroughly shaking for approximately 30 minutes on a mechanical shaker, the sampleswere centrifuged to separate the heavier particulate the centrifugation step was skipped in lateranalyses!. The analytical sample was then prepared by passing a portion of the extract through a 0.2or 0.45 pm Nylon 66 syringe Ster Alltech, Waukegan, IL! and an activated 300 mg C-18 samplepreparation cartridge Alltech! in series. The 6rst 2 mL's of sample through the Ster series wasdiscarded. The C-18 sample preparation cartridges were activated by passing approximately 10 mLof methanol followed by 10 mL of DDW.
RESULTS AND DISCUSSION
Chromato h d antitati n
The ion chromatographic method used in this work has been described elsewhere for theanalysis of sequestering agents in detergents [3]. The method is weH suited for the determination oftripolyphosphate and pyrophosphate; however, orthophosphate elutes very near the void. This limitsthe linear working range of orthophosphate and makes it susceptible to interferences from unretainedsample components. Non-linearity is commonly encountered in ion chromatography when a peak iseluted in the water dip.
It is dif5cult to obtain sodium tripolyphosphate in a relatively pure form. Generally a smallamount of pyrophosphate is present. Because of this, it is best to calibrate the system using singlecomponent standards. For quantitative work it is necessary to assay the tripolyphosphate standard.This was done by Srst determining the concentration of pyrophosphate in a -500 p,g/gtripolyphosphate standard. The total amount of phosphorus in the tripolyphosphate standard is thendetermined using inductively coupled plasma atomic emission spectroscopy ICP-AES!. Finally, theassay is completed by calculating the amount of P due to tripolyphosphate by subtracting the amountof P coming from pyrophosphate as determined by IC! from the total amount of P as determinedby ICP-AES!. Using this method it was determined that ow food grade tripolyphosphate standardcontained 92 /o w/w! tripolyphosphate. It should be noted that orthophosphate was not detectedabove the detection limit in either pyrophosphate or tripolyphosphate 500 pg/g standards.
Peak area responses were used in quantitating the phosphate species. The RSD of peak arearesponse for 12 replicate injections of a mixed standard containing 10 pg/g pyrophosphate and 25pg/g STP were found to be 0.9'/o and 1.24/o, respectively. A linear working range of 0.5 to 50 pg/g

95
pyrophosphate was established. While for tripolyphosphate, the linear range was 10 to 500 pg/g andfor orthophosphate a linear range of 10 to 100 pg/g was established. Table 1 summarizes the figuresof merit obtained for this separation.
Results for k Product
Figure 1 shows the chromatogram obtained for a commercial sample of cooked shrimp whichwas treLted with tripolyphosphate by the processor, Ortho-, pyro-, and tripolyphosphate were foundin this particular sample. In addition, an unidentifie peak at a retention time of 6.1 minutes is presentin most shrimp samples analyzed. To date, we have not identifled this
peak. We have demonstrated that the peak is not sulfate based on a sulfate spike. In addition,preliminary results obtained using an inductively coupled plasma atomic emission spectrometer as asecond IC detector in series with the UV detector!, indicate that the unknown peak also does notcontain P. No peak was detected at 6.1 minutes when monitoring the 214.9 nm P line.
As a practical note, tripolyphosphate is less strongly retained as the number of shrimp sampleinjections increases. After the peak moves out of an acceptable window of integration, the columncan often be cleaned up by running several column voluines of 200 mM nitric acid, Also, it was foundthat a 5 mL DDW rinse of the injector after every sample significantly n~mized sample carryoverproblems.

0 6 8 io 12 14
Time min!
Figure i. Chromatogram obtained for a cooked processed shrimp sample.Peaks: i! orthophosphate; �! pyrophosphate; �! unknown; �! tripolyphosphate.

97
The method was evaluated for cooked shrimp initially because of fewer problems withhydrolysis. The action of cooking the product apparently slows enzymatic hydrolysis signiQcantly,as will be discussed later. The reproducibility of peak area response for 10 replicate injections ofuntried shrimp spiked to contain 25 pg/g pyrophosphate and 50 p,g/g tripolyphosphate was foundto be 1,0 /o and 1.7 /o RSD, respectively, Spike recoveries for untreated cooked shrimp weremeasured by weighing out a sample of homogenized shrimp and spiking with an aliquot of a 10,000pg/g stock standard. Recoveries for both pyrophosphate and tripolyphosphate were generaHyacceptable Range 88 /o - 106 /o!, The data is summarized in Table 2.
The results obtained for four cooked processed shrimp samples are shown in Table 3. Foreach sample, both tripolyphosphate and pyrophosphate were detected. The RSD's for 5 replicateweighings were approximately 6 /o for each of the composited samples. In addition, a second sampleof medium sized shrimp was prepared and the sample extract was analyzed in triplicate for threeconsecutive days. The extract was reeigerated.between analyses. The results of this study showedlittle day-~y variation in concentration of pyrophosphate and tripolyphosphate, Averages of 1195kg/g pyrophosphate and 3195 pg/g tripolyphosphate were obtained over the three day period withRSD's of 9.1 /o and 12.1 /o, respectively. The same sample was then stored &ozen for two weeksand reanalyzed. Seventy-seven percent of the initial pyrophosphate concentration and 92 '/o of thetripolyphosphate were recovered.
The samples used in Table 3 were reanalyzed approximately 11 months later. The results ofthis experiment are shown in Table 4. The last column in Table 4 presents the sum of theconcentrations of pyrophosphate and tripolyphosphate expressed in terms of '/o P,O,, For samplesA, B, and C the Total /o P~O~ found after 1 1 months of &ozen storage was 87 /o, 89 /o, and 103 /oof the initial values, respectively. This indicates that very little hydrolysis occurs in &ozen storage.Also, it is not known how long these samples were out of &ozen storage during the initial analysis.

98
It is of particular interest that in samples B and C there was very little dHFerence in tripolyphosphateconcentration over the 11 month period.
A significant amount of hydrolysis was noted in sample D as indicated by the drop in Total4/o P~O, &om

99
0.18 fo to 0.09 /o. However, for this sample the appeiwmce and odor indicated significantdecomposition had taken place. It is not known whether this decomposition occurred during &ozenstorage or if the sample was not promptly &oxen after initial analysis. The presence of pyrophosphatein all of the samples treated with tripolyphosphate indicates the need to include pyrophosphate in anyquantitative evaluation of tripolyphosphate use. It is not known if the majority of pyrophosphateencountered in these samples originates &om the use of tripolyphosphate which contains largeamounts of pyrophosphate or if a significant amount of hydrolysis has taken place during treatmentand storage. However, the preliminary results obtained for Total /o P~O~ as described above, warrantfurther study. It is acknowledged here that any hydrolysis which has occurred producesorthophosphate. The inability to distinguish between the additional orthophosphate and naturallyoccurring orthophosphate induces a certain amount of error in the determination of how muchtripolyphosphate was used.
R its for Un k Product
Hydrolysis effects are even more of a concern for uncooked product due to enzymatichydrolysis. This was especially evident when performing spiked recoveries on untreated uncookedshrimp samples. Recoveries of 2700 pg/g pyrophosphate spikes in two difFerent uncooked sampleswere 112 /o and 84 '/o. However, recoveries of 5000 pg/g tripolyphosphate spikes resulted inrecoveries of 84 /o and 46 /o. In the latter sample a significant amount of pyrophosphate was found.Ifboth pyrophosphate and tripolyphosphate were determined in the latter sample and the sum of thetwo species is used to calculate recovery in terms of /o P or '/o P,O,!, the calculated recoveryincreases &om 46 /o to 96 /o.
In a separate experiment the hydrolysis of tripolyphosphate was followed in prepared samplesover a period of 3 to 4 days. The same prepared samples were analyzed on successive days andrefrigerated between analysis. For two uncooked samples the tripolyphosphate concentrationdropped from approximately 2500 pg/g to less than the detection limit in 3 days, While in fourcooked samples the tripolyphosphate concentration averaged 94 '/o of the starting concentration after4 days.
If it could be shown that tripolyphosphate and pyrophosphate concentrations are stable in&ozen storage, it should be possible to evaluate tripolyphosphate use in uncooked product.Obviously the amount of time between sample preparation and analysis would need to be minimized.The major concern then would be how much hydrolysis has taken place during treatment and priorto &eezing and how much variation there is in the amount of hydrolysis.
CONCLUSIONS
A method for the determination of pyrophosphate and tripolyphosphate in processed shrimphas been described. The method is generally capable of confirming the use of tripolyphosphate.Recoveries for a 40 pg/g spike of pyrophosphate and tripolyphosphate in cooked shrimp sampleswere 100 /o and 94 /o, respectively. An RSD of approximately 6 '/o was obtained for five replicateweighings of commercially treated cooked shrimp samples.

100
Quantitative results should preferrably be reported in terms of a total concentration ofpyrophosphate + tripolyphosphate expressed as % P,O, or % P!. Hydrolysis efFects on cookedshrimp during frozen storage were found to be relatively small or non-existent. Whether or not hightripolyphosphate concentrations can be correlated with the amaze of added moisture in shrimp needsto be established.
For uncooked processed shrimp the analysis is more dd5cult because of enzymatic hydrolysis.The same approach as used with cooked shrimp, determining pyrophosphate+ tripolyphosphate as% P,O~, may prove useful if the amount of hydrolysis occuring during processing and storage isminimal.
REFK~CES
1. CHESTER, T,L., C.A,SMITH, AND S. CULSHAW. 1984. Determination of inorganicphosphates in detergents by high-performance liquid chromatography on PRP-1 withphosphorus-selective detection. J. Chrornatogr., 287: 447-451.
2. FITCHETT, A.W., A. WOODRUFF. 1983, Determination of polyvalent anions by ionchromatography. LC Magazine, 1: 48-49.
3. Determination of sequestering agents. 1984,Application Note 44R, Dionex Corporation,Sunnyvale, CA.
4. MACMILLAN, W.D. 1984. The determination of sodium pyrophosphate and sodiumtripolyphosphate in detergent granules by nonsuppressed ion chromnatography, J.High Res. Chrom. Comm., 7: 102-3.
5. MOLINS, R.A., A.A. IQLWT, and D.G. OLSON. 1985. Adaptation of a method for thedetermination of soluble orthophosphates in cooked and uncooked pork containingacid labile poly- and pyrophophates. J, Food Sci., 50: 1482-1483.
6, REDDY, B.R. 1986. Hydrolytic and enzymatic breakdown of food grade condensedphosphates in white shrimp Penaeus Setiferus!. Ph.D. Dissertation, Texas A k MUniversity, UMI Dissertation Services, Ann Arbor, Michigan.
SID%%LL, V.D., D.H. BUZZELL, P.R. FONCANNON, and A.L. SMITH. 1977.Composition of the edible portion of raw fresh or frozen! crustaceans, Gnash, andmollusks. II. macroelements: sodium, potassium, chlorine, calcium, phosphorus, andmagnesium, Marme Fisheries Review, 39: 1-11.
TK!6KT, V., G. FINNE, R. NICKELSON, and D. TOLODAY. 1981, Phosphorous levelsin peeled and deveined shrimp treated with sodium tripolyphosphate. J, Food Sci., 46;350-352.

101
CONSUMER EVALUATIONS OF PHOSPHATED SHIUMP AND SCALLOPS
'LeeAnn Applewhite, 'W. Steve Otwell and 'Laura Gamdo'FL Dept. of Agriculture and Consumer Services,
Bureau of Seafood and AquacultureUniversity of Florida,
Food Science and Human Nutrition DepartmentGainesville, Florida
Phosphates are used in the seafood industry primarily to reduce freezer'thaw drip loses thatoccur during proces~sng and storage. Proper use of phosphates to influence the moisture content inshrimp and scallops is currently in debate relative to regulatory concerns for adulteration vs.commercial concerns for "good manufacturing practices". The objective of the study was to recordconsumer ratings for various sensory attributes perceived when exposed to phosphated and non-phosphated shrimp and scaUops.
Experienced panelist and consumers rated various sensory attributes perceived duringencounters with boiled shrimp and broiled scallops previously treated with phosphates. Increasingamounts of water were added to the meats by varying the concentrations of phosphate treatmentsolutions and exposure times. Initial triangle comparison test for difFerences in the treatmentsindicated that over half of the panelist could detect the phosphate treated samples and their ability todistinguish the treatid products increased as the moisture content increased. Consumer judgmentsindicated a preference for the treated product and higher ratings for the phosphated shrimp andscallops were consistent for general appearance, flavor, purchase value and overall quality. Thefollowing condensed description of work is based on two papers submitted to Journal of FoodScience Otwell et al. 1993!.
METHODS
Pink shrimp |Pgn~ga 4gggggg! harvey about Key West, Honda, were headed, peeled andd 'M~ . ~ ~phyll% lagauu0along the New England coast and processed aboard the vessel by researchers &om the VirginiaInstitute of Marine Sciences. Both pmtucts were exposed to various phosphate treatments to obtainincreasing amounts of water added. The shrimp were boiled using a standard cook procedure thewater was brought to a boil, the shrimp added, the water returned to boil and the shrimp boiled 1minute. The scallops were placed on broiler pans and the temperature monitored until the internaltemperatures reached 16 PF.
The product evaluations occurred in two stages. The first stage was a discriminative testinvolving experienced paneiists in a more analytical setting FSHN labs, Univ. Florida!. The panelistwere food scientists and students familiar with discriminative product and testing and seafood. Thistest focused on panelists ability to detect difFerences between treatment variables. Judgements werebased on appearance and taste of cooked samples. The procedure was triangle testing where thepanelist were asked to distinguish the odd or difFerent sample amongst three cooked samples.

102
The second stage in organoleptic testing involved 100-125 consumers randomly recruited byphone and prescreened for age, sex, level of income and Suniliarity with eating boiled shrimp andbroiled scallops. The consumers were assembled and briefed before, during and after the productevaluations to assure their understanding of the questions and rating system. Ratings were based onactual product observations and consumption. The consumers were unaware of the test variables anda 1 to 7 point rating scale was used. The ratings were analyzed for mean dHFerences and variancewith significance %.05! based on the Walker-Duncan k-ratio test SAS, 1992!.
, RESULTS AND DISCUSSION
In general, increasing STP concentration and soak time increased the moisture content in theraw and cooked meats Tables 1 & 2!. In the shrimp, the soaking procedure at 2.0% STP did notimpart or retain as much moisture uptake as the tumbling procedures. In tumbling, the higherphosphate treatments increased moisture uptake and retention in the cooked products. In thescallops, the most significant influence was a 6.0 percent change in raw moisture content Rom the&eshwater treated control to the 2.5% STP wash for 24 hours. In both cases, the control sampleslost the most water when thawed and cooked while the samples treated with the highestconcentrations of phosphates lost the least.
Based on percent correct judgements in the series of triangle comparison tests, the majorityof panelist were able to distinguish each phosphated treatment &om the controls in both the shrimpand scallops. Product distinction was more obvious for products more heavily phosphated Tables3 &4!,
For the consumer evaluations, the participants were asked to rate product appearance andaroma before tasting the product. In all cases, the phosphated product was rated higher than theuntreated controls Tables 5 & 6!.
CONCLUSIONS
Consumer evaluations have demonstrated a distinct preference for phosphated shrimp andscallops. The addition of moisture and ability to hold water in cooked product can provide aconsumer benefit in terms of flavor and moist mouthfeel. There was no distinct objection tophosphated product appearance, aroma of aftertaste, and additional salt taste was desired. In bothcases, the consumers generally felt the phosphated shrimp and scallops meet their expectations andthey liked and judged the products to be of high quality and valued more than non-phosphatedproduct.

Table 1,
Weigh changes in pink shrimp, 2ggaZ tht00!tttgt as a cnnstsp»tice Of the phosphateueaunents and thc standard cooking boiling! pmcedums for d» discriminadve triangle»sts.
PmductTreatments
%Cook !oss' Boi!ed!
-28.0 -33,90.0Conuol
-33 95.0
-26.S10.0
-11.015.0
- 5.7 -9317.0
' % uptake and % cook loss are measures in weight change per U» original weight of theshrimp befom nesting with phosphates and before btnTbtg. mspectively The original moistmecontent in the pink shrimp ranged from 7&,S to &0%. The weight changes primarily tcfelectchanges in the water content.
t All STP sodium tripolyphosphate! ueatments contained l.0% sodium chloride. The symbo!sSmoak and Tumbles
Table 2. Resulting moisture contents in sea scaUops, Qggtggglgtt gtaggbttttgtta assampled from selected commercial handling and processing procedures, thenfrozen -2F!, thawed raw! and broiled �1' btternal!.
Product TreatmentsAfter Hand-Shucking
PercentChangeRaw, Thawed
79.5aControl,freshwaterwash
75.6
81.0 bc 78.0Phosphated Dip,10% STP, 1 min
-3.7
80. la c 76,9
80.9 bc %.0
83.4 d
84.3 d2.5% STP, 24 hr.
All STP sodiuni tripolyphosphatc! treatments contained 1.0% sodium chloride.
Average moisture contents AOAC. 1990! werc based on triplicate analyses for subsamplesfollowing standard thaw and broil procedures.
Stadisiical significant diffcrcnces «W.OS! are denoted by means labeled with different knacrcase lcncts according to Bartlett test for homogeneity and Scbeffe test for mean comparisons.
2.0% STP, 30 min.S
1.5% STP, 15 min.T
4.0% STP, 15 min.T
6.0% STP, 30 min T
4% STP, 20 min.
2.5% STP, 5 hr.
2.5% STP, 13 hr.
%Uptake DiscrimLtest Consumers

104
Table 3. Discrimination test results for 24 panelists attempting to idendify or judge anynodceable diffemnce between cooked samples of control vs. phosphate treatedshriinp.
TfeatlilclltsTrial 2Trial 1
Control
2.0% STP, 30 min S 58 58
79
8363
88
' A recorded "correct judgement tequimd proper product identification in both replicates ofthc conuol vs. phospble samples in triangle paired comparisons per each trial.
' All STP sodium tripolyphcsphate! ueaunents con~ 1.0% sodium chloride The symbolsSmoak and Tables
Somce: OtweH et aL 1993
Table 4. Discrimition test testdts for 24 panelists attempting to identify or judge anynoticeable difference between cooked samples of control vs. phosphate ueatedscallops.
Product Compatedto Contmls Trial 1 Trial 2 Cooked
75.6Control
STP - Sodium ttipolyphosphate, plus 1% sodium chloride.
' A recorded "cottect judgement required proper product identification in both ieplicatesof the control vs, phosphate samples in triangle paired comparisons per each trial
Source: Otwell et aL 1993
1 5% STP, 15 min T
4 0% SIP, 15 min T
60% SIP,30min T
10% STP/1 inin4% STP/20 min.
2.5% STP/5 hr.2,5% STP/13 hr.2.5% STP/24 hr.
5869736677
5266718385
78.076977.779.5&0.6

105
Table 5, Consumer perception radngs for overall shrimp product 'likableness, qualityand value' based on previous evaluations of boiled samples. Value judgementswere based on a stated raw product cost of $4.99 per pound.
ProductTreatments Mean %bargain
3' 2.TR 5ControlZttcsnhatnStts'2.0% 5TP, 30 oiio 515% $TP, 15 mio T4.0% STP. '15 mio T6.0% STP, 30 min T
62657159
42b 3Ab 194Ab 35b 144Ab 3A c 2544b 35b 19
4.7b4.$b5,0b4.7b
' All STP sodium tripolyphosphate! ueatments codtained 1.0% sodium chloride. Xse symbolsSmoak and T=tumbles.
Likableness scale: L<islike very much; 4-neither likeAQhke; 7-like very much; % blate isratings g 5.
Quality scale: I-very low quality; 4-neither low/high; 7-very high quality; % high quality isratings p 5.
Value scale: 1-paid too much; 4-'fair price', 7-got a bargain; % bargain is taungs z 5.
Statistical significant differences « = 0.05! are denoted by any two means hbeled withdifferent lower case letters.
Source: Otwell et aL 1993
Table 6..Consumer perception ratings for overall scaHop product Mrableness, quality andvalue' based on previous evaluations of broiled samples. Value judgements wercbased on a provided raw product cost of $6.99 per pounrL
Treatments Mean % like Mean % high quaL Mean % bargain % fair price
4.9a 64 4 4a 47 3' 22 31
5. lab 71 4.7ab 59 375.3ab 74 4.gab 60 335.4ab 79 5.0 b 65 345.3 b 75 5.0 b 66 375.5 b 83 2.2 b 66 37
STP - sodium tripolyphosphate, plus 1% sodium chloride.
Likableness scale: 1-dislike very much to 7-like very much; % like is mdngs Z 5.
Quality scale: 1-very low quality to 7-very high quahty; % high quality is mtings 2 5.
Value scale: 1-paid too much, 4-'fair price' to 7-got a bargain: % bargain is ratings Z 5.
Statistical significant differences « = 0.05! are denoted by any two means labeled withdifferent lower case letters.
Source: Otwell et al. 1993
Control
10/1 min.4/20 min2.5/5 hr,2,5/13 hr2.5/25 hr
3.7ab 2039ab 273,9ab 304.0 b 294.0 b 30

106
SAS, 1992. Statistical Analysis Systems, User's Guide. SAS Institute, Inc. Corey, NC.
O'FAVELL, W.S., APPLEWHITE, L.D. AND GARRIIM, LR. 1993. Consumer Discrimination andAcceptance for Phosphated Shrimp. Submitted for publication to J Food Sci, 1993.
OTWELL, W.S., APPLEWHITE, L.D. AND GA1GUDO, LR. 1993. Consumer Discrimination andAcceptance for Phosphated Scallops. Submitted for publication to J Food Sci, 1993.

107
COMPUTER-BASED PATHOGEN CONTROL
J.W. Holing and R.M Lane
Department of Food Science 6 TechnologyVirginia Tech
Blacksburg, Virginia 24061
The use of computers to monitor and control factors affectingthe incidence and proliferation of pathogenic organisms can be aneffective tool in safe food production. Pathogen control systemsmay vary from simple hand held instruments that can periodicallymonitor storage areas, processes, etc. to state-of-the-artcomputer designs that provide real-time monitoring of theprocessing and storage of food products. Factors that affectmicrobiological growth such as thermal application, pH, salinity,moisture, ionic activity, and employee traffic control can becontinuously monitored to ensure that food safety standards aresatisfied at all times. As a result, these types of controlsystems provide the processor with an automated and comprehensiveapproach to minimizing the occurrence of pathogen producingbacteria.
RESULTS AND DISCUSSION
The proper monitoring of temperature during the process andstorage of raw and finished product is perhaps the most criticalcontrol parameter fo» pathogenic bacteria. Proper selection anduse of temperature sensors are important elements in this controlarea. The four types of temperature transducers or sensors usedin measuring temperature are thermocouples, resistance temperaturedetectors RTDs!, thermistors, and integrated circuits ICs!.
Thermocouples are the most common thermal measuring devicesused because of their relative simplicity and wide support. Twothermocouple wires of different material when soldered togetherform a thermocouple junction. The measurable potential across thejunction corresponds to a temperature. Because of their widetemperature range and available sizes, they are used extensivelyin many areas for temperature measurement. Thermocouples arepoint monitoring devices and are not easily affected by conductionor convection temperature sources other than at the junctionpoint. The accuracy of the thermocouple is limited to plus orminus a degree or two. Of concern is the thermocouple relativelow voltage which can be affected by electrical noise at differentlocations. This problem can be eliminated through isolatedcircuits and shielding. Thermocouples can be mounted in mostoperations but are usually limited to stationary processes due tothe inability of wires to follow the food product through allprocesses.
RTD's or Resistance Temperature Detectors are more accuratedue to a more linear output signal, but more expensive thanthermocouples. Since they are more fragile than thermocouples and

108
require a voltage source for their operation, they are usuallymounted in a permanent and protected location. A variety of sizesare available, however because of the larger mass of RTDs self-heating errors may occur.
Thermistors are used where very accurate temperaturemeasurements are required. The thermistor has a fast responsetime so it can be used to measure very small increments oftemperature change over short time intervals. Thermistors need apower source to establish a temperature reading and are limited tocertain temperature ranges. Thermistors are also extremelyfragile. A good example of thermistor use would be in alaboratory setting for research purposes.
IC's, or integrated circuits are excellent sensors becausethey are relatively inexpensive and easy to mass produce. Thevoltage versus temperature algorithm is linear so temperatures canbe calculated with accuracy. Some drawbacks of the IC areslowness to measure change in temperature or poor reaction time,constant need for a power source, and limited temperature ranges.
Remote Sensors are self-contained, power supplied microcircuitry, including memory for storing collected data. Theycontain one or more of the previous mentioned sensors and can beplaced in with the product being measured. The sensor can be usedto monitor product or process environment temperature as well astemperature abuse during shipping and handling. With remotesensors the complete picture of time versus temperature can berecorded. The stored data can be down-loaded to a personalcomputer and translated into a usable form with appropriatesoftware.
Infrared imaging is another method of remote temperaturemeasurement. An infrared monitor measures surface temperatures ofvarious products from a distance. The temperature is measured onthe emissivity of product surface and therefore is limited toaverage temperatures as might be found when scanning foodproduction lines. Changes in moisture on the product surface andair volume movement around the product will make minor changes inthe temperature readings found in infrared temperature monitoring.
Traditional methods of measuring temperature in microwaveovens are obsolete due to the heating of metal by microwaveexcitation. Fiber optic measurement allows for the monitoring oftemperature when microwaves are used for the cooking process. Thefiber optic cable is expensive and is fragile under shock andshear conditions. The datalogger used to interpret temperaturedata is the heart of the microwave sensing device and that aloneis the leading cost factor when comparing other temperaturemeasurement sensors and systems. However this is the only type ofsystem developed for use in microwaves. Due to consumer demandfor convenience in cooking, manufacturers are rapidly developingnewer measurement devices for microwave cooking.
Presently there are many systems to choose from whendesigning a complete pathogen control program to monitortemperature, pH, salinity, moisture, and traffic control. Theycan range from simple hand-held instruments to state-of-the-artcomputer systems that continuously monitor all phases ofmanufacturing. These areas would include process control andmonitoring, data logging, quality control, and lab automation.Hand-held instruments and dataloggers provide an economical andefficient method when monitoring food processing and storageareas. They can be easily programmed and moved to various

109
Through the proper selection of sensors and controllers, anautomated and comprehensive computer system can be implemented inorder to monitor and control those factors that affect theincidence and proliferation of pathogenic organisms in foodprocessing operations.
REFERENCES
Omega, 1993. The Temperature Handbook. Omega Engineering,Inc., Stamford, CT.
2. National Instruments, 1994. IEEE 488 and Control, DataAcquisition, and Analysis. National Instruments,Austin, TX.
3. YSI, 1993. Temperature Sensors & Probes. YSI, Inc., YellowSprings, OH.
locations to monitor potential problem areas. Due to thepopularity and versatility of personal computers, they haveevolved into a cost effective and powerful solution for dataacquisition and control on the plant floor. In addition, theevolution of control software has made it easy for the averageuser to integrate measurement and control instrumentation into asystem. Under current technology the user has a choice of fourinstrument interfacing techniques. They are IEEE 488, also knownas the GPIB or HB-1B, data acquisition plug-in boards, RS-232 orserial interface, and the VXI bus. The GPIB bus is available formany sophisticated analytical instruments such as chromatographsand other multiple signal devices. It provides high-speed datatransfer � Mbytes/sec! and can be used with a variety of computerplatforms such as IBN, Apple, and Sun. Plug-in data acquisitionboards are rapidly becoming the method of choice due to the lowcost and variety of functions. Transducers installed throughoutthe processing area are connected to the board through signalconditioners. Data collected can be analysed and displayed astext or graphics, providing the user with a real-time informationwindow of plant floor operations. The RS-232 interface can befound on most simple measurement instruments such as balances andpH meters. It usually is standard on most computer systems and iswidely supported by most software programs. VXI was firstintroduced in 1987 and is regarded as a high performance andrugged interface for industry applications. It combines highspeed with a modular design that provides for easy control ofadvanced measurement systems. All of the above interfaces may becombined on a single system in order to take advantage ofinstrumentation that will satisfy your cost and performancespecifications.

110
RAPID TEST KITS FOR DETECTION OF LISTERlA MONOCYTOGENES: A REVIEW
V,M. Garrido and W,S. Otwell,
Food Science and Human Nutrition DepartmentUniversity of Florida
Gainesville, FL 32611
p I g* g h I * IGhumans, some of which can be fatal. Estimates suggest that in the United States L.
f pp» *I I * f ' III* II, h frate of 25 'lo Pinner, et, al,, 1992!, This pathogen usually affects consumers with a weak immunesystem, including children, pregnant women, elderly and immunocomprornised individuals,causing spontaneous abortion and death Farber, et. al., 1991!. Due to the severity of these cases,
.g. d d d ''«I 5 hllhd '** I 'f in all
cooked ready-to-eat food product. Any product found to be contaminated has to be recalled anddestroyed, Several million dollars in product loss has resulted due to destruction of contaminatedfood products.
Ready-to-eat seafoods i.e., smoked fish, crab meat, cooked shrimp, lobster meat! have shown asignificant degree of contamination incidents, according to State and FDA routine plantinspections. Ideally, before these products are released into commerce they should be tested or
df h.~.fi I I fig dpi hdlk» d % h p * I* fl . This period makes
it impossible for routine monitoring when working with highly perishable goods. Seafoodproduct, with a shelf-life of less than 14 days on the average, can not be held awaiting prolongedanalytical results, Faster methodologies are needed to better address this concern. Rapid test kitsfor the detection of Listeria have been developed which offer the industry reliable results in ashorter period of time, 1 to 3 days. Some of these methods do not require extensive training,
Th I«I * idl 'I hl*f h*d** flseafoods. Four of the most popular tests are: VIDAS ImmunoDiagnostic Assay System bioMerieuxVitex, Inc,!, GENE-TRAK Listeria DNA Hybridization Test GENE-TWM!, LISTERIA-TEKELISA Test System ORGANON TEIL HKA! and LISTERTEST Immuno-beads Test VICAM!.A comparison of these methodologies is provided to help direct judgements for use. Subsequent trialswill be necessary to verify their use in respective commercial settings.
G-Tgdgf*i~i h fi« lfif .~dip don a DNA hybridization test followed by a colorimetric detection. The procedure requires sampleenrichment and an overall average testing time of 2 I/2 days. Samples are mixed with modifiedUniversity of Vermont Medium mUVM-2! for 24 hrs and then spread onto modified Lithiumchloride - ceftazidime agar mLCA! and incubated for another 24 hrs Appendix 1A!. With an sterileswab, growth from mLCA is suspend in 1 mL of Phosphate Buffered Saline PBS!, The suspensionis then heated, lysed and washed. The actual GENE-TK'W assay is preformed on a 5 ml aliquot of

111
+CV
8
+
p gO ~O
gaa
O O
Pi'.4~ 8og~g ~ 3g4
gO bQ
R 0g~ ~g
8O y
5
v�
!gK
CLC4Cl
'a C CP
O 8 OPC
e5
Ct
C 4P
'a O 6 OPCl
0K
~
s$
i f
R~C4O
J
X g
E

112
APPENDIX 1 coat!
D! Listeria-TekC! LISTERTEST
24+/- 2 hrs i 30'C
0.1 ml into 10 ml of BLEB
24 +/- 2 hrs N 30'C
2 hrs @Room Temp,
Place vial onmagnetic rack
22 hrs@37 C
Membrane colony lift
EIA Assay
25 g of Sample is mixed with20 mL of Stomaching Buffer
massage for 30 sec!
Filter 3 mL of
solution ~2mL 1 mL
Add 100 micro Liters Saveof Immunobeads
Liqmi 1
Discard Wash 2 times
!with buffer
Spread beads ontoListertest media plate
Biochemical tests Rhamnose fermentation and blood degradation!
on ccstfirnted Listeria
Mix 25 g of sample + 225 ml of mFraser broth
1 ml aliquot into a clear glass tube and boil for 20 min
Cool to ambient temperatureI
Transfer 100 microliters into a 96 well plateand preform ELISA procedure

h H p Ill~ is present a colored solution will be obtained GENE-TRAKh h h d fd Ig .~dh», d
the analytical time Appendix 2! Rodriguez, 1993!. It is labor intensive and requires high level oftraining for the person performing the test. Strict controls for the lysis and heating steps arenecessary.
Mini-VIDAS ImmunoDiagnostic Assay System BioMerieux Vitex! is an automated system ofanalysis that will detect Listeria spp. from a previously enriched sample. Seafood is enriched for 24hrs in Frazer broth base plus supplement, then the sample is transferred to frazer broth to be incubatedfor an additional 24 hrs Appendix 18!. The enriched sample is heated . 100 'C for 15 min to lysethe cells, exposing the antigen in the cell for better analytical results and reducing the risk of thetechnician to infection. An aliquot �.5 mL! of the enriched sample is placed in a VIDAS LIS reagentstrip before positioning in the equipment Tek Talk, 1993!. Results are obtain within an hour. Thisprocedure utilizes Enzyme-Linked Fluorescent Immunoassay ELFA! as a detection technique andthe developed fluorescent product is read by a computer scanner and transformed into positive ornegative results HoHoway, J, 1993!. This test is not quantitative and takes approximately 2 1/2 daysto preform Appendix 2!. With automation one technician could easily preform numerous testsimultaneously. The test results are objectives, not depending on worker's interpretation. The onlydraw-back is that this assay requires high initial investment for necessary equipment and initialreagents.
VICAM Listertest was developed based on the immunomagnetic capture of viable Listeria spp. cells.Magnetic beads coated with Listeria spp. antibodies are mixed with the sample to be analyze and thenseparated with the aid of a magnet Appendix 1C!. This mechanical procedure suppresses the needof using an initial selective enrichment. CeHs bound to the magnetic beads are washed and plated ontosolid selective media for overnight incubation. If growth is present, the colonies are most likelyListeria. Further confirmation is based on Enzyme immunolinked assay EIA! on a membrane imprintof the plate. Colonies can be picked after been confirined to be Listeria and determine if any I .
fgg" "p' ' "The advantage of this test is that confirmed, quantitative result appendix 2! can be obtained within24 hrs. This test has been found to be equally sensitive to FDA's official method when analyzingListeria in shellfish and environmental samples Jackson, B. J., et.al., 1993!. Due to the specificityof the antibody, this testing procedure performs well for detecting Listeria in high bio-burden samples,A disadvantage is labor intensity but this is compensated by the ease of use.
LISTERIA-TEK ELISA Test System ORGANON TEKNIKA! relays on the specificity of themonoclonoal antibodies directed to the Listeria spp. antigen, Enzyme-Linked Immunoassay Appendix 1D!. It is labor intensive Appendix 2!, but several samples can be run at the same timeby utilizing the 96 well plate format. This format has the disadvantage of requiring a higher level oftrainning by the operator Appendix 2!. Samples are enriched for 48 hrs, then ceHs are lysed to exposethe targetted antigens. EIA procedure is then preformed to determine presence or absence of Listeriadphil h 'M«h p I' *df d d hp** * fl

114
Appendix 2: Advantages and disadvantages of rapid test kit assays compared
A.- GENE-M&K
DisadvantagesAdvantages
B.- LISTERIA-TEK
Disadvantage
C.- mini-VIDAS
DisadvantagesAdvantages
- High initial investment- Not AOAC approved
D.- LISTERTEST
Advantages
- Sensitivity is 1 x 10' cfu / ml- Assay will work on high bio-burden- High specificity- Results ready in 3 hrs alter enrichment- Low false positive rate
- USDA Accepted- Very specific EIA procedure!- False positive rate �.9%!
- Specific EIA procedure!- USDA accepted- Low false positive �.5%!- Easy to tLa:- Low level of involvement
- Speci6c EIA procedure!- Results can be obtained within 24 hrs
- Quantitative analysis- Low false positive
- non AOAC Approved- Needs close control on incubation temperatures andpfocedlife- Positive results will need 48 hrs to
be ccn6rmed.
- High level of training is required- Easy cross-contamination during assay- False negative rate of 8.7%
- High level of involvonent- Not AOAC approved- Recovery rate of 30- 85% depending on the sample

The Food and Drug Administration official procedure FDA BAM manual, 1984!, as can be seenbelow, will take 4 days to confirm a negative result and 7 to 10 days for a positive.
Homogenized 25g of final meat samplein 225 mL of Listeria Enrichment Broth LEB!
Streak onto LPM and mMcbride agar
incubate for 24 and 48 hr
. 35'C
Identi6cation of presumptivecolonies using biochemical tests
such as blood hernolysis, fermentation of esculm, etc.!
New and better methods are continuously being develop in order to obtain rapid and accurate resultswhich should be comparable to the official FDA testing procedures. Food manufacturers areconstantly seeking for faster and more economical ways of ensuring the required level of safety intheir product.As shown in this paper, rapid test kits are bene6cial to the seafood industry, reducing the analysistime, miiking potable to ensure good quality and product safety at all times, Since seafood is highlyperishable processors can not hold the product for more than 2 - 3 days before distribution.

REFERENCE
FARBER, J,M. AND PETERKIN, P.I. 1991. Liberia rnonocyiogenes, a Food-Borne Pathogen.Microbiological Reviews, September 1991, p, 476 - 511.
GENE-TRAK Systems, February 1993. Gene-Trak Listeria monocytogenes Assay, DNAHybridization Test for detection of Liberia monocyrogenes, Promotional literature No. 8010-01!.
HOLLOWAY, J., July 1993, Personal communication, technical support bioMerieux Vitek, Inc,
JACKSON, B, J,, ET. AL. 1993. Detection of Listeria in Food and Environmental Samples byImmunomagnetic Bead Capture and by Cultural Methods. J. of Rapids methods and Automation inMicrobiology, September 1993, p.39 - 54.
ORGANON TECHNIKA, 1993. Promotional literature and personal communication with technicalsupport personnel.
PINNER, R. W., MD, ET. AL 1992. Role of Foods in Sporadic Listeriosis, II. Microbiologic andEpidemiologic Investigation, Journal of the American Medical Association, April 15, 1992 - Vol 267,No. 15, p. 2046 -2050.
RODRIGUE, D,, June 1993. Personal communication, Regional sales representative, GENE-TRAKSystems.
TEK TALK. Meat and Poultry Update, January 1993. Promotional literature bioMbrieux Vitek, Inc.
U. S. FOOD AND DRUG ADhKCNSTRATION. 1984. Bacteriological Analytical Manual, 6thedition, Chapter 29 as m~ 1988 and 1990. Asseciation of OScial Analytical Chemists, Arlington,Virginia. p.29.01 - 29.14.

117
LISTERIA IN SHELLFISH PLANT ENVIRONMENTS:PREVALENCE AND CONTROL IN VIRGINIA
A.A. Diallo', D.R, Patel', George R. Flick',R, F. Wittman, K. Skyles, R,E. Croonenberghs'
'Norfolk Dept of Public Health, Norfolk VA 23507'Division of Consolidated Laboratory Services
Richmond, VA 23219'Department of Food Science & Technology
VPI/VSU Blacksburg VA 24061'Division of Shellfish Sanitation, Virginia Dept of Health
Richmond, VA 23219
In is a pathogen of concern to the crab meat industry. Its pesistentpresence in plant environments may lead to contamination of finished product thereby becoming apotential health risk. This is particularly significant since crab meat is one the many products ofVirginia's shellfish industry. A preliminary investigation was carried out to determine the presence of
pl B» 8». * I b 1 'U» 1fdifh t d .1% *dl&q ~ f~ s in the plants.
Incidence during plant operations and after plant cleaning and sanitizing were 6,56/o and 4.34'rorespectively.
A follow up monitoring of 10 plants looking at finished product contact surfaces and non foodcontact surfaces was conducted during the 1990-91, 1991-92 and 1992-1993 crabbing seasons,Results of 1847 swabs showed overall listeria incidence of 4.0/o, 8.5/o and 9,0/o respectively.
The results obtained from season to season in different plants indicate that control is afunction of how keen and persistent particicular operators are in setting up a HACCP program in theirrespective plants. It did not matter that the plant was a small operation or that it is a large operation.The floor, the scrap cans, crab carts, foot stools were the most likely places to recover Listeriamono cytogenes,
is a gram positive, catalase postive short bacillus found in theenvironment which earned renewed interest as a public health concern after the Jalisco cheeseoutbreak in 1985, Since then epidemiologic investigations have shownthat Listeria is indeed afoodborne pathogen �, 5, 6, 10, 11, 12!.

118
Listeriosis in humans occurs more often in immunocomprpomized individuals, in pregnancycausing stillbirths, and a neonatal listeriosis which is often confused with group B streptococcalinfection. It is characterized by a central nervous system CNS! infection with a primary bacteremia
d I Id** cll . !.All * IL~However most reported cases are caused by serovars 1/2a, 1/2b, and 4b �!.
In animals it causes abortions, meningoencephalitis and in addition it can be carried in theg I«I I f ' I II h . Lig ' ~h b I dlalmost all livestock species including cattle goats birds and other species �, 8, 9, 14!. In humans 4
hb*hb*dbhd CI'ddl *g * Cdit is also carried in urogenital tract of healthy females.
Listeria species have also been isolated from the environment and from foods withoutnecessarily a direct relation to human disease, Large scale investigations carried out by difFerentcenters have demonstrated that listeriosis is a foodborne disease with the suggestion that an infectingdose and the presence of underlying conditions such as extreme age, pregnancy,immunocompromized status, and other infections could be factors in developing listeriosis �8!.
d Ig h f n in seafood has been investigated by Lovett etal.�7! who found the organism surviving and capable of five log growth in fish, shrimp, lobster and
I ~ k d d d.W g l. »!f AL~ in 15 of 57 samples of frozenseafood which included shrimp, crabmeat, lobster tail, fish and surimi based seafood.
yh p fL~i plkd b d p * bil h&hh dfor infants, persons with compromized immune systems, and others with underlying diseases. Becauseof this FDA has adopted a zero tolerance level for all processed ready to eat seafood items.
In light of the importance of the seafood mdustry to Virginia's economy and the lack of strictcritical controls points win most establishments we investigated the presence of listeria in crabmeatplant environments.
This object of this investigation was: i! to determine the incidence and foci of L.b pl *, ! d *h I I p fll
during the crabbing season, and to study the movement of listeria in the crab plants during operations; iii! to evaluate standard cleaning procedures and develop a manual for cleaning crab plants,MATERIALS AND METHODS
The survey protocol was as follows:
In Phase I of the study, six of the sixty plants operating during the crabbing season wereselected. The owners and operators of the plants were consulted and participation was voluntary. Itwas estimated that isolation rates obtained from these plants would then serve as indicators of mostIlk �' ~ f h*pl .A!pl h ' g ' I AL~during this preliminary phase would be notified and a regiment of cleaning and sanitizing andadherence to Health Department guidelines would be instituted. The two plants serving as controlswere also going to be notified by the third swabbing of any potential listeria contamination.

Swabbing was carried out after the plant had finished a day's operation and cleaned andsanitized. This set of swabs was labelled "Post Op". The process was repeated again the next dayearly morning before the plant resumed its operation. Swabs were labelled "Pre Op". Finallyenvironmental swabbing of designated sites continued during the day at regular intervals. Swabs werelabelled "During".
When a cleaning protocole was instituted, swabbing was performed after proper cleaning andsanitization. If L. monocytogenes persisted the process was repeated.
Table A. Plant Areas Selected For Swabbin
A. Receiving Dock E. Picking Room floor kContact surfaces
F. Scrap Cans, Chutes etc...
G. Packing Room
B. Retort Storage
C. Cooling Room
H, Sinks, Dips etc...I. Pickin Room Sera
D. Picking Roomtables ans a rons
In the follow up study, Phase II, ten plants were identified. Selection was again on the basisof size, locality and operating procedures. Except for two plants which were selected as control plantsduring the preliminary study and which continued to serve as controls.
Swabs were taken of food contact surfaces and of non food contact surfaces as oulined intable A! above. These were kept in 2ml UVM BBL! and transported to the laboratory where theywere then transferred to 18mL UVM broth and incubated 18 to 24 hours at 30'C. After incubationthe enrichment was plated on LPM agar BBL! and modified oxford agar MOM! Oxoid!. Plateswere then incubated at 37'C for 48 hours and obrserved for growth of typical bluish colonies ofListeria on LPM with the oblique light, MOM plates yielded black creamy to grayish colonies witha black ha1o, Colonies picked were then identified using conventional biochemical and Listeria ID kits Organon Teknica!,
Laboratory results were reported to the Division of Shellfish Sanitation which then workedwith the plant operator on cleaning procedures and steps to take in order to reduce the risk ofcontaminating freshly picked crabmeat and thus risk a recall action.

RESULTS
Results of the study are summarized in tables 1 through 7.
h»h d fh ~ . '/, '/. d '/. p*f dd:d'g l,d*' fh I f hlwas isolated in all parts of the plants. An over all incidence of 5.13/o was reported.
The receiving docks, floors from the packing room and picking room, scrap cans and scrapchutes, floor drains, green crab containers were the most likely places to recover Listeria. Anextensive analysis of the isolation sites suggests that Listeria is being carried into the plant by workersin the so1es of their feet as they enter the plant in the morning, The scrap cans become contaminatedand through the hauling and cleaning of these cans other surfaces of the plant become contaminated,
L inn~@was occuring at a higher rate as shown in Tables 1 and 3, however since the studydd *d ~g lg Ill p Ilp h g,h.l 'll h*g *dl
this report,
Table 1. Recovery of Listeria in Six Crab Plants During Phase I
Time No, Sam les L. mono '/o L innocua /0
Pre Op
Post Op
Durin
38 �.8!
47 �.9!
72 6.56
1,000 151 �5.1!
133 �3.8!
138 12.6
960
1 097
D ' gyh II, Id fh,~i h I *I* *d '*dhto 46/o as shown in Table 4. below. Some of these plants are the same. Further more environmentalincidence did not allow any prediction of the outcome based on redults obtained in Phase I. Plant IIis an appropriate example where less than one percent �.99'/o! and 22,64/o were observed
p I.P d gg I I hlh p fh,~ pldan unstable work force are factors in the recovery rates observed.
Incidence in individual plants is recorded in Table 2. It varied from 0.99'/o to 1.59'/o.Considering the small number of plants it was estimated that the differences were not significantenough, Incidence rates at the the two control plants however were significantly different from thoseobserved in the four plants. This also indicated what was supsected all along: maily that the institutionof a strict quality control program helps reduce the incidence of L. monocytogenes in plantenvironment. This was further demonstrated in the case of Plant I see Table 3,! which wasundergoing a rigorous quality assurance and critical control points hazard analysis HACCP! at thetime of the survey, It was also interesting to note that both control plants were moderate to largeprocessors and that both purchased raw crab &om smaller supliers.

121
Plant No Sites Pre Op Post Op During Cummulative
1.25 2.5 1.09 1,59
1.25 1.25 0,55 0.99
188 25 0 1.41
1.00 1.88
1.25 0
1.06 1.27
0.54 0.59
16.87 21.25 36.06 25,25
3,8 4.9 6.56 5.13
The 1993 season's results are summarized in Table 4. Incidence varies from 0% to 46.7%.dd'd««d*dddd.ddd*dd*f n
whereas it is being consistently recovered in plant V, Differences in plant practices and work flowmay account for the persistence in one and reduction in the other three plants. A summary ofincidences is presented in Table 5 to illustrate the point above.
Table 3. Recove of Listeria in Crab Plants Environments Durin Follow U Swabbing in 1992
Plant No. Sites Pos, Sites % Listeria % L. mono
30
0.3 22.630
30
32.2535.5IV 31
22,6 6.4V 31
16.131
12.945.21431
6.76,730
26.730IX
3.297X 31
8.559 19.3Total 305
I 503
II 502
III 497
IV 548
V 504
VI 503
Total 3 057
n in Crab Plant Environments During Phase I �989-91!

122
Table 4. Recove of Listeria in Crab Plants Environments Durin FoHow U Swabbing in 1993
Plant No. Sites Pos. % Listeria % I..monocytogenesSites
30
6.8 2.344
30
IV 50 46,730 15
16.736
8.336
VII 35 31.4 2.8
6.7 3.330
29,0IX 31 13
3.3 3.3X 30
54Total 332 9.016.3
d L,~ h dhf . '/! Idf . '/! f IIisolates.
l * * I ~ I ' I d ' I din Table 6. Other species such as L. mali ri,+, ~~ rii were found but at frequencies less than1.0%. L.innocua was the main competitor of L. monocytogenes in isolation rates as shown in Tables1 and 3. The frequencies of all listeria species in the different plants and the overall rates are shown
dl d fh I* *d I I ~ ~ ~ I * IListeria isolates is presented in Table 6.

l23
Table 5. Incidence of I., n ggg C b I Cp
Plant 1992b
'ja!1992a
i!1993
'/o!
Total 4.0 8,5 9.0
a: regular season; b: follow up
bI* . Id Il ~i C b I g ' ggl C btlgSeasons
IncidenceYear Prevalence
1991
1992a
1992b
1993
5.13
4.0
8.5
9,0
NA
20.9
43,3
50.8
mSCVS SION
dp I * b I I ~I p* I b penvironments, Other species isolated included L.innocua from all surfaces examined, ~ingvii fromscrap cans, chutes, picking room floors, J,~~from the receiving docks, cooling rooms, pickingroom floors, scrap cans and chutes, and~, ~~@~from picking room floors, packing room,scrap.
The question of thermal tolerance �, 10, 11! of listeria does not arise here since what weobserved was a pattern of recontamination of the 6nished product from the soiled waste baskets tothe picking tables via the hand trucks and eventually to the picked crabmeat.
I
II
III
IV
V
VI
VII
VIII
IX
X
2.3
2.5
0
5.0
5.0
2,5
2.5
5.0
12.5
2.5
0
22.6
0
32.2
6,4
0
12.9
6.7
0
3,2
0
2.3
0
46.5
11.1
0
2.8
3.3
29,0
3.3

124
The method of isolation used a combination of FDA and USDA in that swabs were kept incold enrichement for two weeks and replated before final results were reported.
The incidence rates for different plants cannot be used as predictors for incidence from seasonto season. Rather the institution of a rigorous cleaning and sanitizing program and strict adherenceto it are most important factors in controlling the incidence in plant environments thereby reducing
'k f d « ' i I ~ is suceptible to range of disinfectants andsanitizers which are readily available to plant operators. Rossmoore and Drenzek �8! and Chermack�! have shown that ef5cacy differences existed among biocides approved for use in the food industryand the seafood industry in particular. These products are usually adversely affected by the organicload present at the the time of their application.
Farber and Peterkin �! have summarized a series of listerioses in which listeria wasimplicated. This table reaffirms the general statement that Listeria is a potential food borne pathogenin the elderly, the young, and the immunocompromized hosts. The association of listeria withfoodborne outbreaks in which seafood was implicated was described by Lenon et al, �5! in NewZealand.
While a a zero tolerance for Listeria in shellfish plants is a goal of FDA's Office of SeafoodSafety, it might be argued that the &equency rates reported here show the difficulty in eliminating L.
from seafood plant environments without pushing the cost of the product beyondaffordable levels. This was noted in other studies presented at the Listeria Conference of Baltimoresponsored by the National Sea Grant, Virginia Sea Grant and the National Blue Crab IndustryAssociation in 1992.
Finally a manual ofblue crab operation was developed. It is available through the UniversityExtension Service and the Department of Health's Division of Shellfish. Even in instances whereHACCP could be effective the size of the plant did not make a difference in the outcome of seasonalswabbings. What was most important was the commitment of the owners and operators and theirperceived risk of economic loss.
REFERENCES
AUDUMER,A., R, CHATELAIN, F, CHALONS, AND M. PEICHAUD.1979. Lysotypiede 823 souches de L monocytogenes isolees en France de 1958 a 1978, Ann.Microbiol Paris!. 130B:179-189.
BILLE, J. 1990. Epidemilogy of human in Europe, with special reference to the Swissoutbreak, p. 71-74. in A. J, Miller, J. L. Smith, and G. A. Somkuti ed.!, Foodbornelisteriosis, Elsevier, Amsterdam.
3. BORTULUSSI, R., A. ISSEKUTZ, AND G, FAULKNER. 1986. Opsonization of Listeriamonocytogenes type 4b by human adult and newborn sera. Infect. Immun, 52:493-498.

125
4. BOUCHER, M., AND M. L. YONEKURA, 1984, Listeria meningitis during pregnancy,Am.J. Perinatol. 1:312-318.
5. BRADSHAW, J.G., T.J. PEELER, J.J. CORWIN, J.M. HUNT, J,T, TIERNEY, E.P.LARIGN, AND R.M. TWEDT, 1985. Thermal resistance of Li steria monocytogenesin milk. J. Food Prot. 48:743-745
6. CHERMACKM.T. 1992, Listeriamonocytogenesin Shellfish Processing Plants; The Effectof Biofilm on Biocide EScacy. M S Thesis VA Commonwealth Univ. Richmond, VA
7, FARBER, J.M., P.I, PETERKIN, 1991, Listeria monocytogenes, a Food-Borne Pathogen.Microbiol. Reviews 55:476-511
FILICE, G. A., H. F. CANTRELL, A. B, SMITH, P. S. HAYES, J.C. FEELY, AND D.W,FRASER, 1978. Listeria monocytogenes infection in neonates; investigation of anepidemic. J.Infect. Dis. 138;17-23.
FLEMING, D. W., S. L. COCHI, K. L. MACDONALD, J. BRONDUM, P,S. HAYES, B.D. PLIKAYTIS, M. B. HOLMES, A. AUDURIER. C. V. BROOME, AND A, L.REINGOLD. 1985. Pasteurized milk as a vehicle of infection in an outbreak oflisteriosis. N. Engl, J, Med. 312:404-407.
10. GARAYZABAL, J,F.F., L.D. RODRIGUEZ, J.A.V. BOLAND, E,F,R. FERtu, V.B.DIESTE, J.L.B. CANCELO, AND G.S. FERNANDEZ. 1987. Survival of Listeriamonocytogenesin raw milk treated in a pilot plant size pasteurizer. J. Appl. Bacteriol.63;533-537,
11, HARRISON, M.A., AND Y.W. HUANG. 1990, Thermal death times for Listeriamonocytogenes Scott A! in crabmeat. J. Food Prot, 53;878-880.
12. IGQvIPELMACHER, E. H., W. T. HUYSINGA, AND L, M, VAN NOORLE JANSEN.1972. The presence of Listeria monocytogenes in feces of pregnant women andneonates. Zentralbl. Bakteriol. Mikrobiol. Hyg, Abt, 1 Orig. Reihe A 222:258-262.
13. KAMPELMACHER, E, H., AND L. M. VAN NOORLE JANSEN. 1969. Isolation ofListeria monocytogenes from feces of clinically healthy humans and animals.Zentralbl. Bakteriol. Microbiol. Hyg. Abt. 1 211:353-359.
14. KAlMELMACHER, E. H., AND L M. VAN NOORLE JANSEN. 1972. Further studieson the isolation of Listeria monocytogenes in clinically healthy individuals. Zentralbl.Bakteriol, Microbiol. Hyg, Abt 1 Orig. Reihe A 221:70-77.
15. LENNON, D,, B. LEWIS, C. hSQlTELL, D. BECROFT, B. DOVE, K. FARMER, S.TONKIN, N. YEATES, R. STAMP, AND K. MICKLESON. 1984. Epidemicperinatal listeriosis, Pediatr. Infect. Dis. 3:30-34.

126
16. LINNAN, M. J., L. MASCOLA, X, D. LOU, V. GOULET, S. MAY, C. SALMINEN, D.W. HIRD, L. YONEKURA, P. HAYES, R. WEAVER, A. AUDURIER, B.D.PLIKAYTIS, S. L. FANNIN, A. KLEKS, AND C. V. BROOME. 1988. Epidemiclisteriosis associated with Mexican-style cheese. N. Engl. J. Med. 319:823-828.
17. LOVETT, J. 1988. Isolation and identification of Listeria monocytogenes in dairy products,J. Assoc. off. Anal. Chem. 71;658-660,
18. ROSSMOORE, K., AND C, DRENZEK, 1990, Control of Listeria monocytogenes bybiocide in the food industry environment. p.211-219. In A.J Miller, J.L. Smith, andG.A. Somkuti edit!. Foodborne listeriosis, Society for Industrial Microbiology.Elsiever Science Publishing Inc. New York.
19. SCHLECH, W. F., P.M. LAVIGNE, R. A. BORTOLUSSI, A. C. ALLEN, E. V.HALDANE, A. J, WORT, A, W. HIGHTOWER, S. E. JOHNSON, S.H. KING,E. S. NICHOLLS, AND C. V. BROOME. 19S3. Epidemic listeriosis-evidence fortransmission by food. N. Engl. J. Med. 308:203-206.
20. SCHWARTZ, B., C. A CIESIELSKI, C. V. BROOME, S. GAVENTA, G. R.BROWN, B.G. GELLIN,. A. W. HIGHTOWER, L. MASCOLA, AND THE LISTERIOSISSTUDY GROUP. 1988. Association of sporadic listeriosis with consumption ofuncooked hotdogs and undercooked chicken. Lancet ii:779-782.
21. SEELIGER, H. P. R., AND D. JONES, 19S6, Listeria, p, 1235-1245. In P. H. Sneath et al, ed.!, Bergey's manual of systematic bacteriology, vol, 2, The Williams k WilkinsCo., Baltimore.
22, WEAGANT, S,D., P,N, SADO, K.G. COLBURN; J.D. TORKELSON, F.A.STANLEY,M.H. KRANE, S.C. SHIELDS, AND C.F. THAYER. 1988. Incidence of Listeriaspecies in frozen seafood products, J.Food Prot. 51;655-657
23. WELSHHVKR, H. J. 1960. Survival ofListeria ntonocytogenes in soil, J. bacteriol. 80::316-320.
24, U,S, FOOD AND DRUG ADMINISTRATION, 19SS, Bacteriological analytical manual,Chapter 29-Listeria isolation; revised method of analysis: notice. Fed, Regist.53:44147-44153.

SURVIVAL OF LIS?ZRIA MONO' OGEAK'S IN LOBSTER MEATDURING SELECTED HEAT TREATIVKNT CONDITIONS
Aurea Cormier, Solange Chiasson and Helene MalouinFood Research Centre, Universite de Moncton
Moncton, N.B., Canada E1A 3E9
The occurrence of Listeria monocytogenes LM! in crustaceans is a cause of concern forconsumers, processors and regulatory agencies. Researchers have reported the presence of LM inlobster 8, 9!. The thermal death time for LM in lobster meat has been studied by Budu-Amoakoet al �!. The Department of Fisheries and Oceans Canada DFO! has published heat tables todestroy LM in establishments where environment samples have tested positive. In-plant heattreatment of contaminated lobster is often caned out at 80'C or higher. Given that elevatedtemperatures considerably reduce drained weight and quality of lobster, the present studyattempted to determine if LM would survive less harsh heat treatments, yet still be LM-Bee. Theobjectives were: �! To verify if, in the 60 to 80'C range, the partial or fidl heating times proposedin DFO table A are adequate to completely destroy LM cells inoculated in 320g cans of lobstermeat; �! To evaluate the efFect of such heating exposures on processed meat yields.
MATERIALS AND METHODS
' n f n
Five strains of LM were provided by Health and We16m Canada Sir Frederic G.Banting Research Centre, Tunney's Pasture, Ottawa, Canada!: HPB P4 milk!; Scott A patient!;HPB 4563 ground meat!; HPB 4395 Ker Noella brie! and HPB 4397 aifimifa!. The strains werekept at 4'C on Triticase soy agar TSA!. The preparation of the inocula was done according tothe procedure recommended by Brown for thermal studies �!. Prior to each thermal study, thefive strains were transferred twice on Triticase soy broth BBL! with 0.5% yeast extract BBL!and incubated at 35'C for 24 hours. Two mL of each strain were mixed, centrifuged at 2900 rpm,and the cells were suspended in 10 mL of 0.1% peptone water. The average number of LM cellswas 6.4 x 10'/mL
Pr
Pr tin fl st m t
Forty eight hours before each thermal study, live lobster was purchased Rom a localprocessor Paturd's Seafood Ltd, Shediac!. It was cooked 15 min in boiling water and immediatelycooled in cold water for 5 min. The meat was shucked and kept overnight at 4'C. Each metal can�04 x 206! was fitted with a thetmocouple T-type! placed in the geometric centre. A port of entryfor inocul16on was also screwed in the can. Each can was filled with 320g of lobster meat, and 140g

128 of a brine solution containing 1,5/o NaCl and 1.5'/o sodium tripolyphosphate. A lobster tail was fixedon the tip of the thermocouple with fine polyester thread and the can was hermeticaUy sealed Seamermodel HO, American Can Canada Inc!. For each trial, two non-inoculated cans were immediatelyset aside at 4 C to determine initial aerobic count. For each of the experimental cans, the screw ofthe inoculation port was opened and 1 mL of inoculuin was injected in the geometric centre of thecan, within the tail fixed on the thermocouple, Nine additional milliliters of brine were added soas to adjust the amount of liquid to 150g. The inoculated cans were kept overnight at 4'C since ithas been suggested that LM cells may need time to adjust to their environment in order tomultiply �!. Given that &eezing at -18 C can inactivate LM cells �!, the lobster cans were not&ozen but kept at 4'C.
H at tr ment oflobst r
Table 1 summarizes the temperatures and time exposures of lobster. Each treatment wasrepeated six times,
In order to reduce come-up time and better simulate in-plant processing conditions, theexperimental lobster cans were submerged in a circulating water bath Blue M, Electric Co.! whichwas set at 10'C higher than the projected temperature of exposure. All thermocouples utilized tofollow heat penetration were connected to a data logger Beckman Industrial, model 245!. Assoon as the central internal temperature of the cans reached 10'C less than the projected studytemperature, they were transferred to another circulating water bath Tecator, model 1024! preciselyset at the desired temperature of exposure. When the htter temperature was reached, the cans wereremoved at the exact exposure time appearing in table 1, and they were cooled in a 7'C water bathuntil they reached an internal temperature of 30'C, They were kept overnight at 4'C prior tomicrobiological analyses.
Each can subjected to heat treatinent was opened and drained for 90 sec according to thetechnique used by DFO A.B. Dewar, 1980, DFO-Halifax, personal communication!. The meat wasweighed in order to calculate changes in yield attributable to treatment.
Aerobic plate count was determined on two non-inoculated cans for ail treatmenttemperatures studied. The of6cial DFO method �! was used to enumerate the aerobic organismspresent prior to heat treatment. Appropriate dilutions were made and the Petri plates were incubatedat 25 + 0.5'C for 72+ 3 hours. All dilutions were done in duplicate.
The LM count in lobster meat was determined after inoculation according to the followingmethod: the lobster can content was macerated in a Waring blender; a 1:10 dilution was made withsterile 0.1/o peptone water and subsequent dilutions were made with the same medium; TSA platescontaining 5/o yeast extract were prepared in duplicate to obtain LM counts. The Petri plates wereincubated at 35'C for 72 hours. The microbiological analysis system devised by VITEI< BiomerieuxVitek Inc, Hazelwood Missouri! was used to identify LM A modified method devised by Health andWel6m Canada which utilizes the Fraser broth �! was used to confimi the presence of surviving LMcells at the level of less than 1 cell/100g.

129
Table l. Temperature and time of heat exposure of lobster samples
Exposure timemin: sec
TemperatureoC
Percent of exposure timere uestedb DFO
60
68
72 0:27 100
76 0:07 100
80 0:02
s~The STATVIEW 4' program �! was utiHzed to compute statistical analyses on the raw
data. Analyses of variance were done and Fisher's least significant difference was calculated tocompare means. The level of statistical significance was set at 0.05%,
RESULTS AND DISCUSSION
Micr iol ' nts rior h t trea m
The number of aerobic organisms present in non-inoculated lobster meat prior to heattreatment is presented in Table 2. The mean number of colony forming units CFU's! was 3.6 X10'/g.
0:00
5:52
1 l;44
17:36
23:28
0:00
1:34
3:09
6:18
0;00
0:50
1:15
1:41
0
25
50
75
100
0
25
50
75
100
0
50
75
100

130
Table 2. Microbiological data on non-inoculated and inoculated lobster samples prior to heattreatment
Planned temp.of exposure
oC
Aerobic count
CFU/g!'Listeria monocytogenes in
inoculated lobsterCFUi '
60
64
68
72
76
80
Mean
' n = 2 for each temperature
e-u im h tin curve
Figure 1 illustrates the come-up time and heating pattern for each of the six replicates Ato F! at the QPC trial during 23 min; 28 sec, the time which corresponds to the %11 heating exposurerequested by DFO table A. Initial internal temperature of the cans was 5.9 + 0.8'C when they wereintroduced in the 70'C water'bath, When the cans A to F reached an internal temperature of 50'C,they were transferred to the 60'C bath, Total come-up time &om 5.9 to 60'C averaged 21,2+ 1,8min. For the other trials conducted at 60'C, the cans were removed aRer the selected heat exposuretimes presented in Table 1 were reached. A similar procedure was followed for the cans treated at64, 68, 72, 76 and 80'C.
65
SS
30
10
0 2 4 6 6 lO l2 I4 l6 m 20 22 24 26 28 30 32 34 36 30 40 42 44 46 46 20 $2 $4 36 $6 60
Time ain!
Figure 1. Temperature curves in the center of lobster cans takenfrom 5.9'C up to 6VC, held there 23 min : 28 sec and cooled.
4$
P o35
I 30a
2,7X10
1.3 X 10
9,3 X 10
2.9 X 10'2.9 X 10'
2.9 X 10
3.6 X 10'
6,6 X 10'5.0 X 10'8.8 X 1063,8X 10'3.8 X 10'
3.8 X 10
6.4 X 10'

131
Mean come-up times to arrive at the targeted temperatures of exposure were between 21and 25 minutes Fig. 2!. This must kept in mind when interpreting the data on LM inactivation sincepartial destruction of LM cells can occur during the come-up time.
35
33
31
29~ ti
27
P25
IJ
23II0 19
17
15 60 64 68 72 76 BOSet teeperature of eater bath 'C!
Figure 2. Mean and standard deviation of come-up time for 320g of lobster meat heated at selectedtemperatures between 60'C and 80'C.
Micro iol c data a&er heat ea menTable 3 summari2es the microbiological data on the occurrence of LM cells in 320g samples
of lobster meat subjected to selected heating treatments.
It was found that at 60'C, unless heat exposure was longer than 11 min; 44 sec, LMcolonies were found on TSA plates, Howard, with a heat treatment of 17 min: 36 sec, LM coloniesno longer occurred on TSA plates but, in 5 out of 6 samples, there was a darkening of the Fraserbroth and the VITEX system confirmed the presence of LM. A heat treatment of 23 min: 28 sec at6PC, as requested by DFO, prevented colony growth on TSA but some LM survived in four out ofsix trials. The four LM positive Fraser broth samples were submitted to the VZZEK analytical systemand indeed, LM was identified in each case. This finding indicates that a contamination level of 6.6X 10' with LM requires a longer heat treatment at 60'C than the 23 min: 28 sec requested in TableA issued by DFO.

132
Table 3. Survival of Liberia mo o enes sub'ected to various heatin rocesses.
Temperature 'C!
60
3
68
0:2772
76 0:07
80 0:02
'N = 6 for each treatment
'Darkening of Fraser broth and confirmation of LM'No growth on TSA
At 64'C, no LM growth occurred on TSA when the lobster was held for either 0 sec, 1 min: 34 sec, 3 min: 9 sec, 4 min: 44 sec, and 6 min: 18 sec. However, at zero sec, when the lobster justreached an internal temperature of 64'C, three of the six samples gave a positive response in theFraser broth and all three were later con6rmed positive for LM.
When the lobster samples reached 68'C and beyond, all samples were devoid of LM, evenif they were not held at those temperatures for any length of time. This signi6es that in-plant heattreatment could safely be camed out at 68'C and beyond, as there is a total inhibition of thispathogenic organism in lobster meat with such heat exposures.
Time of
exposure
min: sec
0:00
5:52
11:44
17;36
23:28
0:00
1;34
3:09
4:44
6:18
0:00
0:50
1:41
Listeria
monocytogenesCFUI
2.0 X 10'
47X10
4.0 X 10'
4 of+
in Fraser
broth'2

133
Relation hi betwe nlo rm t 'eld h trea n
Table 4 presents the percent weight changes observed in lobster meat aker subjecting it toselected heat treatments.
Table 4. Percent weight changes observed in 320g of lobster meat subjected. to selected heattreatments
Exposure time min: sec!
Weight change %!
Temperature oftreatment
oC
-0.06 + 0.87
0.00 + 1.95
-0.37 + 1.58
68 0:00
0:50
1:41
-0,24 + 0.43~72 0:27
-1.13 + 0.15'
-3.33 + 1.48'
76 0:07
80 0:02
Means associated with the same letter are not signifirsrntly difFerent accorrhng to Fisher's least significantdifFerence pc0.05!
Very little weight changes occurred between 60 and 72'C at the specific heating times tested. Evenat the 76'C exposure for 7 sec, the 1.13% weight loss observed did not difFer significantly &om someof the samples heated between 60 to 72'C. However, at 80'C, there was a 3.33% weight loss andthis value was significantly difFerent from all of the other temperatures tested. It must be kept in mindhowever, that the canned lobster used in this study was not &ozen prior to measuring the drainedweight, a procedure which departs Rom current industrial practices. Nevertheless, it can be statedthat heat treatment of lobster meat at 80'C is detrimental to yield. Extensive protein denaturation isconducive to a loss in water holding capacity.
0:00
5:52
11:44
17:36
23:28
0:00
1:34
3:09
4:44
6:18
+0.52' + 0,99+0.14 + 1.31
-0.38 + 0.97
-0.28 + 1.11
+0.17 + 0.64
+0.58 + 1.03"+0.81 + 0.90
-0.43 + 0.43"-0.27 ~ 0.84
+0.14 + 0,81

134
CONCLUSION
The results obtained in the course of this study indicate the following:
At 60'C, heat treatment for 23 min: 28 sec is not sufficient to completely destroy Listeriamonoeytogenes.
At 64'C, a short heat exposure is required to completely inactivate Listeria monocytogenes.With a 1 min: 34 sec exposure, complete destruction has occurred. Given that very little lossin yield is observed at 64'C, contamination risks are reduced by heat treating the lobster for 6min: 18 sec which is the exposure time recommended in DFO table A.
At 68'C, Listeriamonocytogenes is completely destroyed. Treatment at a higher temperatureis not necessary for lobster meat,
Short time heat exposures between 60 and 72'C have minitnal effects on the drained weight oflobster meat.
Optimal heat treatment for 320g of canned lobster lies between 68 and 76'C when come-uptime is between 21 and 25 min.
REFERENCES
1. BROWN, W.L. 1991. Designing Listeria monocytogenes thermal inactivation studies forextended shelf-life refiigerated foods. Food Technology 45�!: 152-153.
2. BUDU-AMOAKO, E,, WALTON, C., ABLETT, R.F. and SMrI'H, J. 1991. Thermal deathtime for Listeria monocytogenes in lobster meat. J. Food Prot. 55: 221-213.
3. EL-KEST, S., YOUSEF, A.E, and MARTH, E.H. 1991. Fate of Listeria monocytogenes during&eezing and frozen storage. J, Food Sci. 56: 1068-1071.
4. FARBER, J.M., SANDERS, G.W., SPEERS, J.I., DAOUST, J.Y., EMMONS, D.B. andMCKELLAR, R. 1988. Thermal resistance of Listeria monocytogenes in inoculated andnaturally contaminated raw milk. Int. J. of Food Microbiol. 7: 277-286.
5, FELDMAN, D.S., HOFMAN, R., GAGNON, J. and SIMPSON, J. 1987. Statview SE': TheSolution for Data Analysis and Presentation Graphics. Abacus Concepts Inc., Berkeley,CA.
6. HEALTH AND WELFARE CANADA. 1992. Isolation of Listeria monocytogenes from allfood and environmental samples �4iFHPB-30!. In Compendium of Analytical'Methods,Polysciences Publication, Ottawa.

7. MINISTERE DES PECHES ET OCEANS CANADA. 1988. Marche a suivre pour lanumeration sur plaques des bacthies aerobics. In Procedures pour analysesmicrobiologiques 3ieme 6htion. Direction generale des services d'inspection, Ottawa.
8. RYSER, T.E. and MARTH, E.K 1990. Incidence and behaviour of Listeria monocytogenesin fish and seafood. In Listerla, Lt'stert'osis and Food Safety, 123-456. Marcel Dekker Inc.,New York.
9. WEAGANT, S.D., SADO, P.N., COLBURN, K.G., TORKELSON, J.D., STANLEY, F.A.,KRANE, M.H., SHIELDS, S.C. and THAYER, C.F. 1988. The incidence of Listeriaspecies in &ozen seafood products. J. Food Prot. 51: 655-657.

136
LIS?ZRlA MONOCYTOGEVE'S AND SALMOAKLLA SSP.IN MODIFIED ATMOSPHHK, PACKAGED CEBQAWL CATFISH
Juan L. Silva, Tess D. White and Nawarut SunyavivatDepartment of Food Science and Technology
Mississippi State UniversityMississippi State, MS
Fish consumption has been on the rise, especially fresh fish products, However, fish arevery susceptible to spoilage and losses may be as high as 50'/o �0!, Spoilage of fresh fishis caused mainly by microbial action. Fish are usually in cold waters and thus the predominantgram negative bacteria are able to grow well in re&igeration. One promising technology toextend shelf-life of fresh fish is modified atmosphere packaging, MAP �!. This technology isusually used in combination with re&igeration. This has proven to extend the shelf-life ofhybrid bass strips �! and channel catfish strips �6!. Some pathogens may be able to grow inMAP products due to lack of competitive spoilage bacteria and anaerobic conditions created.Salmonella spp. �! and Listeria monocytogenes �! have been found in fish. Salmonella spp.have been isolated f'rom channel catfish CC! fillets �7! and L monocytogenes has been found inCC visceras and fish flesh 9, 17!. Some of these pathogens are able to grow at low temperaturesand under microenvironments. The objectives of this work were to study the growth of Salmonellahapp. and L manorytogenes at various temperatures under MAP and look at the eBect of a mluinadeon pathogenic growth inhibition.
MATERIALS AND METHODS
Fresh channel catfish fillets were packaged in 3,0 mil polyethy-lene bags, packed on iceand within 2 h, cut into strips weighing approximately 10 g. Strips were packaged under thecorresponding environment after being dipped in 200 ppm chlorine �:10 fish/chlorine solutionv/w! for 2 min, inoculated with 10' CFU/mL of the appropriate bacteria L. monocytogenes andSalmonella ~p.!, and stored at O'C or 10'C. Evaluations were performed for 28 d.
P~k;~nStrips were packaged either under air AIR! or under 90'/o carbon dioxide balanced with
air MAP!. Sixteen strips were placed in 2.7 mil polyethylene bags Dow Chemical Co., Indianapolis,IN! � AIR, or in preformed 21,5 x 25 cm' 8700 barrier bags Cryovac Division, W. R, Grace Co,,Duncan, SC! � MAP. The MAP bags were evacuated and backflushed with CO, using a Multivac"AGW" Koch, Kansas City, MO! packaging machine.

137
an m rements
A Servomex 1450 Oxygen and Carbon Dioxide Analyzer Norwood, MA! was used tomeasure the percentage of CO2 and 02 of individual packaged samples. The packages weresampled by drawing 30 mL of headspace gas into a 50 mL gas-fight syringe which was then injectedinto the analyzer.
Pr aration f in culum
One mL inoculum each of 10' CFU/mL of L. monocytogenes and Salmonella spp. wasprepared by incubating a 1 mL &ozen cell concentrate in 250 mL of Tryptic Soy Broth and BrainHeart Infusion Broth Difco, Detroit, MI! respectively, for 24 h at 35'C, Aseptically, 13 mL ofeach bacterial enriched broth were dispensed in four pre-sterilized centrifuge tubes and centrifugedat 3400 RPM for 5 min using a Centrific Model 228 Centrifuge Fisher Scientific!. The supernatantfrom each of four tubes was decanted and the pellets were combined and homogenized togive a final volume of 1 mL
The cell homogenates were dispensed in 9 mL of 0.1/4 sterilized peptone solution. A seconddilution was made when 3 mL of the previous dilution was suspended in 9 mL of 0.1/4 sterilizedpeptone solution. The Optical Density OD! of the second dilution was measured using a Bauschand Lomb Spectronic 20D spectrophotometer Milton Roy Co., Rochester, NY!. The instrumentwas calibrated using 0.14/4 sterilized peptone to measure the absorbance at 540 nm. The OD~ of thesamples was recorded and labeled as the original dilution. This step was repeated until the samplesgave an absorbance of approximately 1.00.
From the original dilution serial dilutions were made with 9 mL of 0.14/4 steriTized peptonesolution. Aseptically, 1 mL &om each dilution was pour plated in duplicate, using Standard PlateCount Agar Difco, Detroit, MI! as the nutrient for the microorganisms. The enumeration of colonyforming units per gram of sample CFU/g! was performed after 48 h incubation at 35 C in an aerobicgrowth chamber. The corresponding OD values and decimal dilutions were labeled upon eachplate. Linear regression was used to correlate OD with values obtained &om plate counts.
Micr bi l ' al ation
Bacterial counts were performed by methods described by Benson �!. After asepticallyweighing 25 g, sample was homogenized in 225 mL of 0.1'/4 steriTized peptone solution in a blenderfor 1 min on low speed. Appropriate decimal dilutions were prepared in 0.14/4 sterilized peptonesolution.
Enuineration of presumptive L. monocytogenes and Salmonelkr spp. were done by the pourphte method on selective media using 1 mL of the appropriate dilution. McBride Listeria Agar andMacConkey Agar Difco, Detroit, MI! were used as the selective media for L monocyfogenesand Salmonelkr ~., respectively. Enumeration of colony forming units per g sample CFU/g! wasperformed after 48 h incubation at 35'C.

138
A~dCh fA second experiment was devised to study synergistic effect of MAP and a seasoning mix on
flsh pathogens, Channel catfish flllets were prepared and inoculated as discussed earlier and treatedwith 10/o tartar mix TM! Sa6'ron International, Tupelo, MS! and without tartar mix CT!. Theywere then packed in 2.7 mil polyethylene bags Dow Chemical Co.! Air or in 8700 Cryovac! bagsand backflushed with 90/o CO,, They were stored at 10 C and analyzed every 4 d for 16 d. Sampleswere analyzed for CO~, O~ and enumeration of Salmonella qrp. and L. monocytogenes as describedearlier.
RESULTS AND DISCUSSION
Carbon dioxide conceatration in inoculated samples without marinade Quctuated between 84and 92/o while oxygen ranged between 1,5 and 3,5'/o data not shown!. This range was the resultof the lack of tighter control by the packaging machine.
Preemptive I monocytogenes counts on non-marinated CC are shown in Figure 1. Countsfor CC packed in AIR at 10 C increased &om log 6 CFU/g to over log 8 CFU/g in 4 d while countsfor CC stored at O'C reached over log 8 CFU/g after 6 d. Thus, low temperature had little effecton growth of L. monocytogenes in CC strips stored in AIR bags. Harrison et al. 8! reported nogrowth of L martocytogenes on iced fish and shrimp for as long as 21 d. However, Glass and Doyle�! observed growth of L. monocytogenes at 4'C, in various meat products. Listeria are known togrow over a wide temperature range in many fish products �!. Growth os monocytogenes in MAPat 10'C was similar to that in AIR at O'C. However, when stored at O'C, the lag phase wasextended for over 8 d and counts did not reach log 7 CFU/g until 28 d.
Salmonella spp. growth was not inhibited in AIR packed samples at 0 or 10'C Figure 2!.However, growth was inhibited at 10 C in MAP products, and at 0 C there was some bactericidaleffect. Silliker and Wolfe �5! stated that CO, will slow growth of Salmonella under mildtemperature abuse. Even though it is a facultative anaerobe, it does not grow weil at lowtemperatures and under high CO, concentrations.
Addition of a marinade containing mustard, garlic, citric acid, and some spice extracts wasused to study its effect on L monocytogenes and Salmonella spp. growth in MAP and AIR packedCC fillets held at an abuse temperature, 10'C. L. monocytogenes growth was not inhibited in AIRpacks treated or not with a fish marinade, tartar mix TM! Figure 3!. Growth was enhanced in MAPpacked products between 6 and 12 d of storage. This might be the result of less competitivebacteria in the MAP product after 6 d. Rorvik et al. �2! reported Biter growth of L monocytogenesin vacuum-packed salmon with low initial counts. Addition of tartar mix marinade! to MAP filletsshowed bacteriostatic effect for 4 d but did not lower growth rate atter 4 d.
Some of the aromatic compounds in spices are bacteriostatic �3!. Shelef et al. �4! reportedthat rosenmry was bacteriostatic at 0.34/o and bactericidal at 0.5o/o, At 2o/o, rosemary has been shownto be more effective against gram positive bacteria. Mustard contains allyl-isothiocyanate, acompound known to be bacteriostatic to S. aureus and other pathogens �1!. Garlic contains adiallyl-thiosulfate called allicin which is bacteriostatic to yeasts �!.

139
Q!
h.
O O!
0 12 16 20 2428
Storage time days!
Presumptive Liberia mormcytogenes in channel cat6sh 611ets stored in air AIR! and904/o CO2 ~! at 0 and 10'C.

140
U
V O!0
12 16 20 24 28
Storage Time days!
Figure 2. Presumptive Salmonella spp. in channel cat6sh 611ets stored in air AIR! and 90'/oCO, MAP! at 0 and 10'C.

141
>/HAD 003! 0'183lSI l
CU
U
O
LJJ
oo<CCtOl�
ce g
$
~Q«0 ~
Q oe O>C4 Ph

142
>/ll30 90 l! V113NOPI IVS

143
Salmonella spp. lag phase was extended in CC fillets with tartar mix packed under AIRfigure 4!, Growth was inhibited for 8 d at 10 C. In combination with MAP, tartar mix wasbacteriostatic to Salmonella spp. for 16 d in fish held at 10'C,
CONCLUSIONS
It is necessary to combine MAP with very low refiigeration temperatures -O'C! to bedl 'ddgbfL~CCSI .Npurate of growth of L. monocytogenes in CC fillets under MAP. Salmonella spp. growth is inhibitedby MAP even at 10'C but some growth may still occur. Addition of a fish marinade containingspices, essential oils and organic acids will extend lag phase of L monocytogenes in MAP CC filletat 10'C, Thus, the use of a marinade with antimicrobials may inhibit the growth of L monocytogenesin CC fillets re&igerated at low temperatures.
ACKNOWLEDGMENTS
This work was partially funded by USDA Food Safety Grant 458-6202-0-001. Thanks to Ms.Donna Bland for her patience and work in the manuscript.
1, BENSON, H. J. 1985. Microbiological Applications: ALaboratory Manual in GeneralMicrobiology. 4th ed. Wm. C. Brown Pub,, Dubuque, IA.
2. BRODY, A. L 1989. Controllecbkfodiged Atmosphere Vacuum Packaging of Foods.Food and Nutrition Press, Trumbull, CT.
3. BUTTAIOX, R. 1962. Salmonella problems in the sea. In: Borgstrom, G. ed.!, Fish asFood, Vol. 2, p, 503. Academic Press, NY.
4. CONNER, D. E. and L. R BEAUCHAT. 1984. ESects of essential oils from plantson growth of food spoilage yeasts. J. Food Sci. 49:429-434.
5. FARBER, J, M. 1991. Listeria mmaxytogenes in fish products, J. Food Prot. 54:922-924,934.
6. GLASS, K. A. and M P. DOYLE. 1989, Fate of Listeria monocytogenes in processed meatproducts during renigerated storage. Appl. Environ. Microbiol, 55:1565-1569.
7. HANDUMRONGKUL, C. and J. L. SILVA. 1993, Aerobic counts, color and adeninenucleotide changes in CO, packed re&igerated striped bass strips. J. Food Sci. Inpress.

144
8, HARRISON, M. A., Y. W. HUANG, C. H. CHAO and T. SHIPMAN. 1991. Fateof Listeria monocytogenes on packaged, re&igerated and &ozen seafood. 54:524-527.
9. LEUNG, C. K., Y, W, HUANG and O. C. PANCORBO. 1992. Bacterial pathogensand indicators in catfish and environments. J. Food Prot, 55;424-427.
10. PEDROSA-MENABRITO, A. and J. M. REGENSTEIN, 1988, Shelf-life extensionof &esh fish - A review. Part I - Spoilage of fish. J. Food Qual. 11:117-127.
11. PRUTRI, J. S. 1980. SpicesandCondiments: Chem~,Microbiology, Technology. AVI,Westport, CT.
12, RORVIK, L, M., M. YNDESTAD and E. SKJERVE. 1991. Growth of Listeriamonacytogenes in vacuum-packed, smoked salmon during storage at 4'C, Intl. J.Food Microbiol. 14:111-118.
13. SHELEF, L. A. l983. Antimicrobial efFects of spices. J. Food Safety. 6:29-44,
14. SHELEF, L. A., O. A. NAGLIK and D. W, BOGEN. 1980. Sensitivity of some commonfoodborne bacteria to the spices sage, rosemary and allspice. J. Food Sci. 45:1042-1044,
15. SILLIKER, J, H. and S. K. WOLFE. 1980. Microbiological safety considerationsin controlled atmosphere storage of meats. Pood Technol, 34�!:59-62.
16, SILVA, J, L, E. HARIDKSS and T. D. WHITE. 1993. Residual eFect of CO~ onbacterial counts and surface pH of channel catfish. J. Food Prot. In press,
17. WHITE, T. D. 1993. The e6'ects of modified atmosphere packaging and storagetemperature on total microbial counts, pH, color and some pathogens of re&igeratedcatfish strips. M. S. Thesis. Miss, State Univ.

145
NONCULTURABLE VIBRIO P>lRAHAEMOLYTICUS
Xiuping Jiang and Tuu-jyi ChaiHorn Point Environmental Lab
University of MarylandCambridge, MD 21613
Nutrient insuf6ciency is the most common environmental stress whichmicroorganisms routinely encounter. As nature exerts strong selectivepressures in the course of evolution, microorganisms have evolvedmechanisms to accommodate those adverse environments 9! ~ Numerousstudies have been done on the starvation response of marine microorganisms�, 7, 11, 15, 18, 20!. Many marine bacteria can survive for a long period oftime by reorganizing their cellular macromolecules and decreasing theendogenous metabolism and respiration rates �5!. Several human pathogens,such as Escherichia coli, Vibrio choice, Sabnorm.l/a enteritidis, Vibrio vulnigcus,Shigella sonnei, Aeromonas sabnonicida and Campylobacter jejuni, have beenfound to enter into a viable but nonculturable stage rather than to die-offwhen exposed to low nutrient environment �, 17, 19, 22, 29!. Since there arenumerous factors affecting bacterial survival, it is important to understandhow these food pathogens survive under the stresses of low nutrient and lowtemperature.
Vibrio parahaemolyticus is an estuarine bacterium widely distributedin the natural aquatic environment around the world. It has been found thatthe distribution of this organism is highly seasonable �, 6!. During thesummer, the frequency and concentration of the isolates are much higher thanthese in the winter months. Does the organism enter into the viable but non-culturable state during winter? Over 95% strains of V. pariahaemolyticus fromclinical samples are Kanagawa positive K+!, producing hemolysis onWagatsuma blood agar, but the majority of isolates from enviromnentalsamples are Kanagawa negative K! �6!. This phenomena is not yetunderstood.

146
In this study presented here, we examined various factors which couldaffect the culturability of the organism in low nutrient and low temperatureconditions. The difference between K+ and K strains was compared. Wealso examined the method to resuscitate those nonculturable cells.
MATERIAL AND METHODS
Two environmental isolates, Vibrio parahaemokyticus strains 38C1 and38C6, were used in this study. Strain 38C1 is K+ and 38C6 is K, bothdonated by Rita Colwell. Overnight cultures were inoculated 1 to 1000 intofresh Proteose Peptone Beef Extract PPBE; Difco Laboratories, Detroit,Mich.! containing 1% NaC1 �!. The cultures were incubated at 35 C withshaking. The cells were grown to an early log phase ODD~0 of 0.15-0.25!and harvested by centrifugation at 50GG x g for 15 min. The pellets werewashed once with s~ation medium. The 6nal pellets were suspendeduniformly into an equal volume of starvation medium.
Two starvation media were used in this study. The composition ofMorita minimal salt medium MM! per L of deionized water was: 26.0 gNaC1, 0.8 g KC1, 7.6 g MgCI>.6H20, 5.6 g MgSO4.7H20, 5.0 g of Tris buffer pH 7.8!, 0.1 g CaC12, an8 0.1 g Na2HPO4 and nine salt solution NSS!consisted of 17.6 g NaC1; 1.47 g Na2SO4, 0.08 g NaHCO~', 0.25 g KC1; 0.04g KBr; 1.87 g MgClg.6H20; 0.41 g CaC12.2H20; 0.01 g SrC12.6H20; 0.01 gH>BO> per L of deionized water.
Acid-washed 1 L screw-capped bottles were used as containers for theexperiment. The cultures in starvation media were stored at differenttemperatures for the temperature experiments. All the cultures were kept instatic state.
Cell culturability was determined by using nonselective PPBE agarplates. Highly selective medium agar, thiosulfate-citrate-bile-sucrose TCBS!,was used to verify the cultures. The starvation media were used to dilutesamples. During sampling, all samples exposed to low temperatures were keptin ice to avoid any temperature abuse. The plates were incubated at 35 C for2 days.
Total cell counts were determined by the acridine orange stainingmethod under epiQuorescene microscope. Direct viable counts weremeasured according to Kogure et al., �3!. Samples. were incubated at 35oCwith 0.05% filtered sterile yeast extract and G.GG2% nalidixic acid for 6 hrs.Only those elongated and swollen cells were counted as viable cells. For thetotal counts and direct viable counts, a total of at least 10 fields with cells inthe range of 30 to 300 were counted for each sample.

147
~fAbout 2 ml of cultures were aseptically removed from entire
microcosm at low temperature to a 10 ml test tube. The tube was left atroom temperature for 3 days without shaking. The resuscitated cultures werespread on PPBE plates.
Most probable number MPN! determination was performed by thethree tube series test using PPBE broth as medium prior to temperatureupshift.
1 n
Both log phase young cells in PPBE broth and the cells exposed forvarious intervals in starvation medium at 3.5 C were harvested bycentrifugation., The cell peHets were washed 3 x with sterile Millonig buf'fer pH 7.4, 374 mOSM/kg! �0!. Bacteria cells were 6xed with 2% vol/vol!glutaraldehyde in Millonig buffer at room temperature for 1 h. The sampleswere passed through 13-mm, 0.2-pm pore size Nuclepore polycarbonate Qltersand then post6xed in 1% osmium tetroxide at room temperature for 1 h,dehydrated in graded ethanol �5%, 95% and 100%!, critical point dried inCO2 in a DCPl-CPD apparatus, and coated with AuPd in a vacuumevaporator coating apparatus Denton DV503. The coated samples wereexamined in an Amray 1820 D scanning electron microscope.
RESULTS AND DISCUSSION
The cell morphological change occurred immediately after the cellswere suspended in mineral media Before starvation, log-phase cells of V.parahaemolyticus were normally rod-like shape with an average dimension ofca. 0.6-0.9 x 1.6-3.1 ym. Within a couple of days in starvation medium, rodcells started to demonstrate irregular shapes and f'nally became coccoid orspheroid . The rate for the cell morphological change was dependent on thestrains and the temperatures at which the cells were kept. It was found thatat a low temperature, the cells became spheroid quicker and the spheres werebigger than ceHs at room temperature. In this study, it took about 1 to 2weeks for strain 38C1 to be sphere at 3.5 C, whereas 38C6 needed at least3 weeks under the same condition. The spheroid cells had an averagediameter of 0.83-1.28 imam for both strains at 3.5~C as compared with anaverage diameter of 0.6-0.7 p,m at 25~C. After cells became spheroid, littlefurther size reduction continued at low temperature. The cell morphologicalchange under starvation has been well documented for many marineorganisms and pathogenic bacteria �, 11, 15, 22!. It has been proposed thatcell size reduction at low temperature is a survival strategy for minimizing cellmaintenance requirement and enhancing substrate uptake due to high surfaceto volume ratio �8, 24!
Scanning electron micrographs Figs. la and lb! showed that log-phase

i48
Fig. 1. Scanning electron micrographs of V. parahaemolyticus strain 38Cl. a!. top, log-phase young cells; b!. riiddl, 2-wk starved cells at3.5 C; c!. bottom, 6-wk starved cells at 3.5 C. Bar = 1 pm.
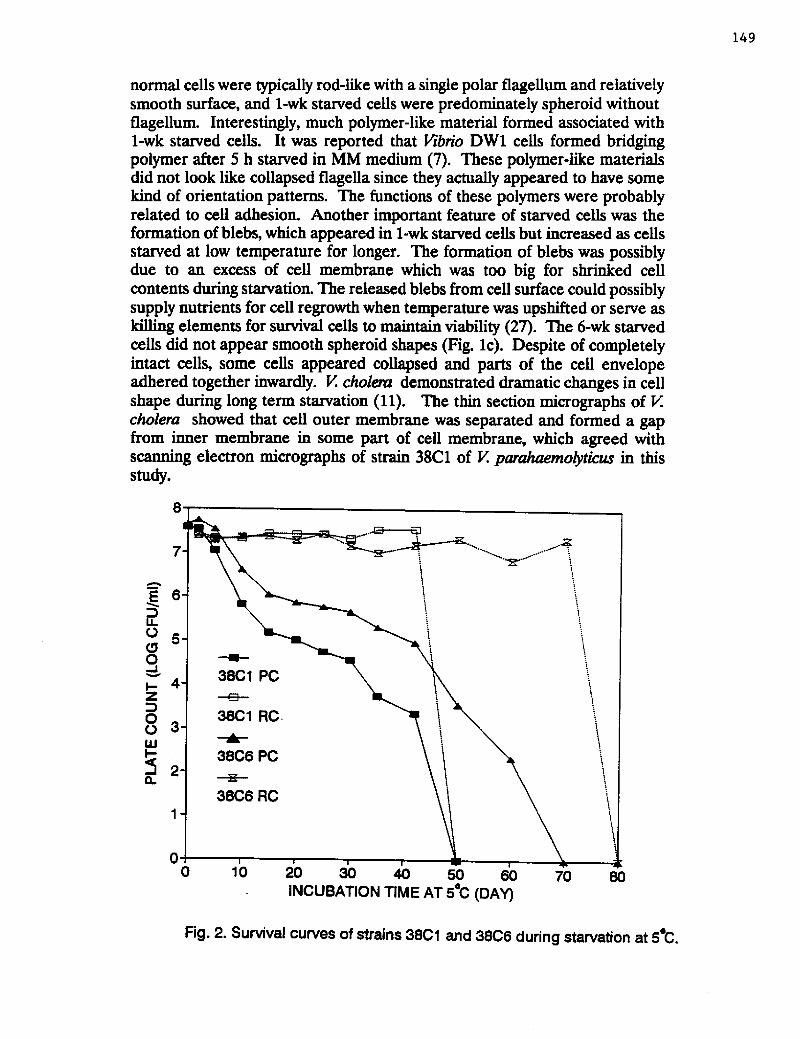
149
normal cells were typically rod-like with a single polar flageHum and relativelysmooth surface, and 1-wk starved ceHs were predominately spheroid withoutflageHum. Interestingly, much polymer-like material formed associated with1-wk starved cells. It was reported that Vibrio DW1 cells formed bridgingpolymer af'ter 5 h starved in MM medium �!. These polymer-like materialsdid not look like collapsed flagella since they actuaHy appeared to have somekind of orientation patterns. The functions of these polymers were probablyrelated to ceH adhesion. Another important feature of starved ceHs was theformation of blebs, which appeared in 1-wk starved ceHs but increased as ceHsstarved at low temperature for longer. The formation of blebs was possiblydue to an excess of cell membrane which was too big for shrinked cellcontents during starvation. The released blebs from cell surface could possiblysupply nutrients for cell regrowth when temperature was upshifted or serve askilling elements for survival cells to maintain viability �7!. The 6-wk starvedceHs did not appear smooth spheroid shapes Fig. 1c!. Despite of completelyintact ceHs, some cells appeared collapsed and parts of the ceH envelopeadhered together inwardly. V. cholera demonstrated dramatic changes in cellshape during long term starvation �1!. The thin section micrographs of V.cholera showed that ceH outer membrane was separated and formed a gapfrom inner membrane in some part of cell membrane, which agreed withscanning electron micrographs of strain 38C1 of V. parahaemolyticus in thisstudy.
6
O 50
4Z
0 20 30 40 50 60 70 80INCUBATION TIME AT 5 C DAY!
Fig. 2. Survival curves of strains 38C1 and 38C6 during starvation at 5 C.

Fig. 2 showed typical survival curves for both strains 38C1 and 38C6at 3.5 C in MM medium. The survival curves fell into 3 stages. At beginningof starvation, cells lost culturability rapidly within 2-3 wk, which correspondedto the period of dramatic morphological changes in those cells. Then, a slowdecline of culturability persisted for a long time, followed by a quick drop ofplate counts to zero.
Many factors could af'feet the survival of V. parahaemolyticus cells.Temperature, medium, physiological age of the cells and the strain differencewere among those factors.
Seven temperatures were used to store the starved cultures. They were0, 2, 3.5, 5, 10, 25 and 35 C. At 10 and 25 C, both 38C1 and 38C6 cellsincreased their ceH numbers at on set of starvation and decreased their cellsizes by more than 50% Following initial reductive division, the culturabilitydropped about 1 log cycle quickly within 2 weeks and, then kept constant fora long period of time. Not much difference between survival curves wasfound for cells stored in 10 and 25 C. Strain 38C1 lost culturability muchslower than 38C6 at 25 C Fig. 3!. When temperature was lowered below5 C, the culturabiHty declined veryquickly forboth strains. Little differencein culturability was observed at a temperature between 0 and 35oC. At35 C, they became nonculturable in 50-80 days. But, at 5 C they survivedslightly longer. At an overall low temperature, 38C1 lost culturability muchquicker than 38C6. This agreed with the morphological changes.
3 4 5 6
INCUBATION TIME WEElq
Fig. 3. Effect of temperature on the culturability of V. parahaemoiyticus
10
ED 9
0 8
G 0 LLI
0 Z 0 Z 0 V 2I~ CL
0
strains 38C1 and 38C6 in starvation medium.

In addition to strains 38C1 and 38C6, 8 other strains were tested. AHK+ strains lost culturability quicker than aH K strains within 50 days instarvation medium at 3.5 C Figs. 4 and 5!. Most strains reachednonculturability within 75 days except P26 and P68. ColweH et al. and otherworkers reported that V. parahaemolyticus occurred in summer months anddisappeared in winter. K+ strains were rarely isolated from aquaticenvironment �, 6!. The minimal growth temperature for V. parahaemolyticuswas reported as 5 C �!. The results presented here clearly demonstrate thatpathogenic strains are more sensitive to low temperature than nonpathogenicstrains of V. parahaemolyticus. It has been reported that V. vulnificus wastemperature dependent, only at 5.0 C could it become viable butnonculturable �4, 28!. Unlike V. parahaemolyticus and V. vu1nipcus, C. j ejuniand Legionella pneurnophila survived longer at low temperature and becameviable but non-culturable only at high temperature �7 C! �2, 22!.Therefore, different organisms require different temperatures in the survivalstrategy.
Medium difference had different effect on 2 strains of V.
parahaemoly6cus At beginxdng, log-phase normal ceHs of both strains in thePPBE broth increased their cell numbers when they were exposed to 5 C Fig. 6!. The ceH number increase was not due to reductive division sinceceHs were in rich medium. It was possible that ceHs in divided form prior toexposure to lower temperature produced their daughter cells. %ithin 2 to 3weeks, these cells in rich medium lost culturability slower than cells instarvation medium. After that period of time, both strains lost culturabilityvery quickly at a linear rate. Cells suspended in starvation medium survived2 to 3 times longer than in rich medium. It appeared that ceHs in starvationmedium developed some kinds of resistance after initial quick decline inculturability. It was reported that during starvation cells reorganize theircellular macromolecules and decrease respiration rate and endogenousmetabolism, such as degrading some growth relating proteins and synthesizingstarvation resistant proteins �5!.
The dif'ference between MM and NSS media became clear only afterceHs were kept in these media for more than one month at 5 C. The NSSmedium contains more species of inorganic salts and divalent ions than MMmedium but without any phosphate ions. Phosphate ion is a major anion inthe bacterial cells participating in many cellular metabolic reactions. It hasbeen reported that phosphate ions enhanced the culturability of E.coli cellsin seawater 8!. The absence of phosphate ions in NSS medium probablyresulted in the quick drop of culturability of V. parahaernolyticus.
Fig. 7 showed the survival curves of both 38C1 and 38C6 at 5 C.Through out the experiment, total cell counts remained at the initial numbers.The ceHs stained with acridine orange dye exhibited red-orange fluorescenceunder epifluorescence microscope. The longer the cells were kept at low

152
8.0
7.0
0.00 10 70
8.0
7.0
0.70
E
O 0
I X 0 O UJI-
Q.
C
O C9
O I Z 0 O
6.0
5.0
4.0
3.0
2.0
6.0
5.0
4.0
3.0
2.0
20 30 40 50 60
INCUBATION TIME AT 3.5M DAY!
Fig. 4. Survivai of 4 Kanagawa positive P strains of V. parahaemoiyticusduring starvation at 3.5 C.
10 20 30 40 50 60
INCUBATION TIME AT 3.5 0 OAY!
Rg. 5. Survival of 4 Kanagawa negative Q strains of V. parahaernolyticusduring starvation at 3.50.

153
8
E7
O
60
5
X 0 4
U I- 3 2 10 15 20 25 30 35 40 45 50INCUBATION TIME AT 5 C DAY!
Fig. 6. Survivai of strain 38C1 and 38C6 in MM and PPBE media.
11.0
10.0
9.0
LL. 8.0
O g! 7.00
6.0I-z 50
0 0 403.0
2.0
1.0
0. 10 15 20 25 30 35INCUBATION TIME AT 5't DAY!
Fig. 7. Survival curves of strain 38C1 and 38C6 of V. parahaemolyticus
in starvation medium at 5 t.

154
temperature, the less the density of observed red-orange Quorescence. It wasreported that the cells of Salmonella in soil labeled with Quorescent antibody FA! became duller with time during starvation �6!. This may indicate thatthose cells could go further toward dormancy as they were exposed to adverseconditions. The difference between total counts and culturable counts wasabout 3 log cycles. Direct viable counts DVC! were always at least 1 logcycle higher than plate counts. Among those elongated cells detected by DVCmethod, less than 10% were culturable by plate count therefore a significantportion was in the viable but nonculturable stage. Zscherichia coNdemonstrated the same pattern when the culture was tested in salt water �.5-2.5%! microcosm �9!. Unlike V. parahaemolyticus and E. coli, V. choleraelost the culturability very quickly within 1 day and DVC remained constant�!. Other strains, such as V. vulnigcus, S. entenMdis, and Campylobacter spp.reached nonculturability quite rapidly �9, 22, 25!. This indicated that therewere some differences in response to cold and starvation stresses amongdif'ferent species although they shared almost the same principles for survival.
Several reports have discussed methods for recovery of these viable butnonculturable cells. L. pneumophila, V. cholerae, E. coli and Campylobacterspp. �, 12, 22! have been recovered only through animal passage when theyfailed to form colonies on agar plates or turbidity in rich or diluted nutrientMPN tubes. For V. vulnificus, which became viable but nonculturable cells atlow temperature, room temperature resuscitation for 3 days recovered almostall viable but nonculturable cells �9!
Resuscitation process was ef'fective for 38C1, 38C6 and other 8 V.parahaemolyficus strains. Following upshift to room temperature for 3 days,both 38C1 and 38C6 cultures kept at 3.5 C could be resuscitated up to 50%of original inocula Throughout the entire experiment, resuscitated cellnumbers remained constant. When direct plate counts dropped to zero, thetemperature upshift resuscitation process failed to recover those nonculturableceHs Fig. 2!. Under the microscope, after full resuscitation, about 50% of thetotal cells were rod and the rest were sphere. Within 24 h of resuscitation,it was observed that some rod cells were in divided forms. But after 24 h, nocell division was observed. The total counts were almost constant duringresuscitation.
The starvation medium, such as MM medium, is free of nutrients. Thecells were washed before resuspension in MM medium. Theoretically, theremaining culturable cells can not multiply during temperature upshiftresuscitation. It was originally speculated that all those recovered culturablecells could be resuscitated from those viable but non-culturable cells and fewsurvival cells. In contrast, MPN results demonstrated that cell multiplicationcould occur during temperature upshift. Cold-storaged cultures were dilutedinto the MPN tubes before temperature upshift. The results of MPN tubeswith PPBE medium at room temperature for 3 days were correlated to direct

155
plate counts before temperature upshift rather than after temperature upshift.The results of MPN tubes with MM medium indicated even fewer bacterialcount than direct plate counts Table 1!. LogicaHy, at the highest dilutedtube, any growth results f'rom single ceH multiplication. If no multiplicationoccurred during temperature upshift, the MPN results should be closer to theresuscitated plate counts from the original culture than direct plate countbefore temperature upshift.
Table 1. Comparison of culturable cell numbers between MPN method andplate count method.
BEFORE RESUS. AFrER RESUS.
STRAIN Storage Time Plate Count MPN PPBE! Plate Count D!
1.8x10
2.5x10
2.4x10
4.6x10
38C1
38C6
3.8x10
2.5x10⁷
2.4x10
2.2x10
7.5x10
2.4x10⁴
38C1 40
38C6
1.0xl0
6.1x10
4.9x10⁷
2.5xl07
9.3x10
1.lxlG
38C1 45
4538C6
"-": not determined.
The ef'fects of cell clumps, cell debris or culturable cell metabolites onthe difference between MPN counts and resuscitated plate counts wereinvestigated. Autoclaved ceil cultures, ultra-Gltered autoclaved cell cultures,and UV-treated cultures were tested but all failed to reach increased MPN
counts. Since the nalidixic acid is a DNA synthesis inhibitor, it can inhibitthe multiplication of cells without interfering with protein synthesis. Nalidixicacid at 20 pg/ml, 100 yg/ml or 200 pg/ml was added to the culture prior toresuscitation and left at room temperature for 3 days. After resuscitation,samples with 20 and 100 pg/ml nalidixic acid had the same number of rodcells as the control sample, but 200 pg/ml nalidixic acid totally inhibited cellmultiplication Table 2!. From above results, it was certain that the roomtemperature resuscitation represented regrowth of the few surviving cells inthe starved culture. Some reports have demonstrated the possibility of fewsurvival cell regrowth during temperature upshift. �1, 23, 27!

156
Table 2. Effect of nalidixic acid on the resuscitation of V. parahaemolyticusstrain 38C6 .
AODC
NALIDIXIC ACID
pg/ml!After Resus.
% rod cells!Before Resus.
% sphere cells!
12.6%1G0%
13.2%
12.2%
100%2G
100%
100%%uo 0%
Strain 38C6 culture was stored at 35 C for 52 days in starvationmedium bay water!. The plate count was 4.6xlG before resuscitation.After 3-day resuscitation at room temperature, the plate count reached2.2x10 jml, which accounted about 11% of original inoculum�.1x10 /ml!.
STORAGE TIME DAYS!
G 15 21 26 31
38C1 5.2x10⁷ 4.0x10 5.9x10 4.0x10 5.2xlG
38C1 �0x! 3.8x10 4.4x10 3.8x10 1.2xlG 0
38C6 6.1x10 23x10 2.2x10 3.0x10 4.1x10
38C6 �0x! 8.9x10 12x1G 2.6x10 2.2x10 1.9x10
"10x" means to dilute 10 times of original culture by fresh MM mediumat day 0..
The sources for cell regrowth were investigated in this study. Table 3revealed that cultures with higher cell densities were always resuscitated tohigher cell numbers during room temperature upshift. As seen in Fig. 2, theresuscitated plate counts remained relatively constant throughout the entireexperiment. In aH experiments, strain 38C1 always reached higher plate countnumbers than strain 38C6 during 3-day room temperature upshift. Our results
Table 3. Effect of initial ceH density on the regrowth of strains 38C1 and 38C6in MMM.

157
demonstrated that the numbers of resuscitated plate counts depended on celldensities and strain difference but not numbers of survived plate counts. Theamount of released nutrients was determined by initial cell densities andphysiological stage of cultures. This conclusion was proved by the observationthat the resuscitated cell numbers were always lower than original inoculum.Therefore the amount of nutrients in the medium was a key factor indetermining how many cells will be resulted regardless of how many survivalcells existed. Nilsson et al reported that the cryptic growth was impossibleduring temperature upshift because about 50 dead cells need to support thegrowth of one cell �9!. Their calculations were probably based on thegrowth requirement of log phase young cells rather than starved cells. As forstarved cells, they are in stressed conditions and adopt more ef6cient nutrientuptake metabolism and respiration systems. They can grow and multiply withlimited nutrients at an extraordinary rate and cell number.
CONCLUSION
The results reported here have demonstrated that V. parahaemolyticuscould enter into a nonculturable stage when exposed to low temperature andlow nutrient environment. The DVC method showed there was a significantnumber of viable but nonculturable cells in the culture. The roomtemperature resuscitation could not recover those viable but nonculturablecells. Therefore, besides temperature upshift and nutrient addition, thosedormant cells.may need special growth conditions for resuscitation.
REFERENCES
1. ALBERTSON, N. H., T. NYSTROM, and S. KJELLEBERG. 1990.Macromolecular synthesis during recovery of the marine Vibriosp. S14 from starvation. J. Gen. MicrobioL 136:2201-2207.
2. BEUCHAT, L R. 1975. Environmental factors affecting survival andgrowth of Vibrio para/uzemolyticus. A Review. J. Milk FoodTechnol. 38:476<80.
3. CHAI, T., and J. FOULD. 1974. Demonstration of a missing outermembrane protein in tolG mutants of Escherichia coli. J. Mol.BioL 85:465-474.
4. OHOWOHORY, M. A. R., H. YAMAHAKA S. MIYOSHI. I S.SHINODA. 1990. Ecology and seasonal distribution of Vibrioparahaemoiyticus in aquatic environments of a temperate region.FEMS Microb. Ecol. 74:1-10.
5. COLWELI R. R., P. R. RAYTON, D. J. GRIMES, D. B. ROSZAK,S. A. HUG, and L M. PALMER. 1985. Viable but non-

culturable Vibno cholerae and related pathogens in theenvironment: implications for release of genetically engineeredmicroorganisms. Bio/Technology. 3:817-820.
COLWELI R. R. 1979. Human pathogens in the aquaticenvironment, p. 337-344. In Colwell, R. R., and J. Foster ed!,Aquatic microbial ecology. University of Maryland Sea Grant,College Park.
6.
DAWSON, M. P., B. A. HUMPHREY, and K. C. MARSHALL 1981.Adhesion: a tactic in the survival strategy of a marine Vibnoduring starvation. Curr. Microbiol. 6:195-199.
7.
GAUTHIER, M. J., G. N. FLATAU, R. L CLEMENT, and P. M.MUNRO. 1993. The loss of culturability by Escherchia coli cellsin seawater depends on availability of phosphate ions andphosphate transport systems. Microb. EcoL 26:29-35.
8.
KVU3ER, W., and L DIJIGiUIZEN. 1983. Physiological responsesto nutrient limitation. Ann. Rev. Microbiol. 37:1-23.
9.
11 HOOD, M. A., J. B. GUCKERT, D. C. WHITE, and F. DECK. 1986.Ef'feet of nutrient deprivation on lipid, carbohydrate, DNA,RNA, and protein levels in Vibrio cholerae. Appl. Environ.Microbiol. 52:788-793.
12. HUSSONG, D., R. R. COLWELL, M. O' BRIEN, E. WEISS, A. D.PEARSON, R. M. WEINER, and W.D. BURGE. 1987. ViableLegionella pneumophila not detectable by culture on agarmedia. Biotechnology. 5:947-950.
13. KOGURE, K., U. SIMIDA, and N. TAGA. 1979. A tentative directmicroscopic method for counting living marine bacteria. Can. J.Microbiol. 25:415-420.
14. LINDER, K., and J. D. OLIVER. 1989. Membrane fatty acid andvirulence changes in the viable but nonculturable state of Vibnovulnificus. Appl. Environ. Microbiol. 55:2837-2842.
15. MARDEN, P., A. TUNLID, K. MALMCRONA-FRIBERG, G.ODHAM, and S. KJELLEBERG. 1985. Physiological andmorphological changes during short term starvation of marinebacterial isolates. Arch. Microbiol. 142:326-332.
10. HAYAT, M. A. ed!. 1989. Principles and techniques of electronmicroscopy: biological applications. Macmillan Press, London.

159
16. MIYAMOTO, Y., T. KATO, Y. OBARA, S. AKIYAMA, K.TAKZZAWA, and S. YAMAI. 1969. In vitro hemolyticcharacteristic of Vibrio parahaernolyticus: its close correlationwith human pathogenicity. J. Bacteriol. 100:1147-1149.
17. MORGAN, J. A., G. RHODES, and R. W. PICKUP. 1993. Survival ofnonculturable Aeromonas salmonicida in lake water. Appl.Environ. Microbiol. 59:874-880.
18. MORITA, R. Y. 1985. Starvation and miniaturisation of heterotrophs,with special emphasis on maintenance of the starved viablestate, p.111-130. In Fletcher, M., and G. D. Floodgate ed!,Bacteria in their natural environments. Academic Press,London.
19. NILSSON, L, J. D. OLIVER, and S. KJELLEBERG. 1991.Resuscitation of Vibrio vulnificus from the viable butnonculturable state. J. Bacteriol. 173:5054-5059.
20. NOVITSKY, J. A., and R. Y. MORITA. 1977. Survival ofpsychrophilic marine Vibrio. Appl. Environ. Microbiol. 32:635-641.
21. RAVEI J., R. T. HILL, I. T. KNIGHT, C. R. DUBOIS, and R. R.COLWELL 1993. Recovery of Vibrio cholerae f'rom the viablebut nondurable state. Abstr. Q-6, P.347. Abstr. 93rd Gen.Meet. Am. Soc. Microbiol.
22. ROLLINS, D. M., and R. R. COLWELL 1986. Viable butnonculturable stage of Carnpylobacter jejuni and its role insurvival in the natural aquatic environment. Appl. Environ.Microbiol. 52:531-538.
23. ROSE, A. S., A. E. ELLIS, and A. L S. MUNRO. 1990. Evidenceagainst dormancy in the bacterial fish pathogen Aeromonassabnonicida subsp. Salmonicida. FEMS Microbiol. Lett. 68:105-108.
24. ROSZAK, D. B., and R. R. COLWELL. 1987. Survival strategies ofbacteria in the natural environment. Microbiol. Rev. 51:365-379.
25. ROSZAK, D. B., D. J. GRIMES, and R. R. COLWELL 1983. Viablebut nonculturable stage of Salmone11a enteritidis in aquaticsystems. Can. J. Microbiol. 30:334-338.
26. TURPIN, P. E., K A. MAYCROFT, C. L ROVM&JDS, and E. M.

160
H. WELLINGTON. 1993. Viable but non-cultur ableSalmonellas in soil. J. Applied. BacterioL 74:421-427.
27. WEICHART, D., J. D. OLIVER, and S. KJELLEBERG. 1992. Lowtemperature induced nonculturability and killing of Vibriovulnigcus. FEMS Microbiol. Lett. 100:205-210.
28. WOLF, P., and J. D. OLIVER. 1992. Temperature effects on theviable but nonculturable state of Vibrio vulnificus. FEMSMicrobiol. EcoL 101:33-39.
29. XU, H., N. ROBERTS, F. I SINGLETON, R. W. ATWELI D. J.GRIMES, and R. R. COLWELL 1982. Survival and viability ofnonculturable Escherichia coli and Vibrio cholerae in theestuarine and marine environment. Microb. EcoL 8:313-323.

LOW DOSE GAMMA IRRADIATION OF PLESIOMONAS SHIGELLOIDESIN SHRIMP PENAEUS SETIFERUS!
R.M. Qrodner and M.B. Gutierrez de Zubiaurre
Department of Food ScienceLouisiana Agricultural Experiment Station
Louisiana State University Agricultural CenterBaton Rouge, LA 70803
Food irradiation is a process in which foodproducts are subjected to ionizing radiation in order toeliminate spoilage and pathogenic microorganisms and addincreased shelf-life. Research involving gammairradiation of fish and shellfish has focused mainly onlow doses to achieve pasteurization of thesecommodities. Some specific examples are: haddock fillets�!, cod fillets 9!, oysters �2!, and shrimp 8!.Fresh fish treated with gamma irrad3.ation doses up to 3kGy have resulted in an increase in shelf life ofapproximately 7 to 15 days when compared with theirnormal shelf life �1!. Gamma radiation is considered a"cold" process versus thermal processing �!, with theadvantage of reduction and/or elimination of manypathogenic bacteria as well as spoilage microorganismsresulting in an increase in the shelf-life of seafoodwith little or no change in their sensorycharacteristics �1!.
The pathogens of main concern in seafood productsare bacteria that are naturally occurring in theenvironment i.e., Vibrios, Aeromonas, and Clostridiumbotulinum type E. Another microorganism that is widelydistributed in the environment, Plesiomonasshi elloides, has been recognized as a pathogen �, 10!.P. shi elloides has been suspected to be the causativeagent in food and waterborne outbreaks ofgastroenteritis and many opportunistic infections suchas septicemia �3, 7!. This bacterium has been linked to

162
several outbreaks of gastroenteritis due to theconsumption of raw oysters and because it has beenisolated from other seafoods such as shrimp, clams andfish, its presence in seafood products can be considereda health hazard �, 7!.
The primary objectives of this study were to: �!determine the effect of low doses of gamma irradiationon Plesiomonas shi elloides in sterile and non sterileshrimp; �! determine the effect of irradiation on thesurvival of this bacterium in shrimp samples stored at0+2 'C ice! for a period of 21 days and, �! toevaluate the recovery of this microorganism in bothselective Plesiomonas agar! and nutrient-rich, non-selective Brain Heart Infusion agar! media.
MATERIALS AND METHODS
Organism:Plesiomonas shi elloides strain 7-1 isolated from
Blue crab Callinectes ~sa idus! was obtained from theculture collection of the Department of Food Science,Louisiana State University. The bacterium was stored atrefrigeration temperature � 'C! in Brain Heart InfusionBroth BHIB!, Difco Laboratories, Detroit, MI!, and wastransferred once a week to fresh media BHIB!. Toprepare the inoculum, the bacterium was transferred tofresh BHIB and incubated at 35 'C for 14 hours to obtainan approximate concentration of 1x10⁹ cfu/ml of cells inthe stationary phase. A 0.1 ml/g of the working culturewas added to the shrimp samples in order to achieve anapproximate concentration of 108 P. shi elloides pergram of sample. Inoculated samples were then transferredto the Nuclear Science Center at Louisiana StateUniversity in a cooler containing ice for treatment withlow dose Cobalt-60 gamma irradiation �-4 kGy!.
Preparation of the Samples:Fresh iced shrimp were purchased whole from a local
supermarket. The whole shrimp were de-headed, packed inpolyethylene plastic bags and were frozen at -20 'Cuntil needed. Samples were thawed at room temperature�5 'C! prior their use in the experiments. Afterthawing, shrimp samples were prepared as follows. Shrimpwere peeled and the tail meat was ground in a KitchenAidR mixer with a food grinder attachment model FG-A! Hobart Corporation, Troy, OH! to provide a homogeneousshrimp paste sample.
Two treatments were performed using Cobalt,-60 gammairradiation. One set of samples was sterilized byautoclaving at 121 'C for 15 minutes prior toinoculation and irradiation; the second set consisted of

163
non-sterile raw! samples which were inoculated and thenirradiated. Control samples non-irradiated/inoculated!,were also prepared for both treatments. Samples of 10 gwere placed into 60 ml nalgene containers. Triplicatesamples were prepared for each radiation dose,treatments, and controls.
Irradiation Procedure:
Samples packed in ice were placed into a watersecure diving bell and lowered into a source pit forirradiation from a Cobalt-60 source emitting 0.02 kGyper minute. Samples were exposed to doses of 0, 1, 2, 3and 4 kGy. Samples were then removed and placed on icefor transfer and storage in the Food Science Departmentfor microbiological enumeration over a period of 21days ~
Microbiological Enumeration:Shrimp samples were examined for the presence of
Y II0+2 C. Two different media were used for detection ofthe bacterium in the inoculated samples. Brain HeartInfusion agar BHI! Difco Laboratories, Detroit, NI!was used for plate counts, and a selective medium,Plesiomonas agar PL!, developed by Miller and Koburger,1985, was also used for the selective isolation andcounting of this bacterium. Samples were diluted in a1:10 dilution in a Stomacher sample bag Seward MedicalStomacher> '400' bags! using sterile alkaline peptonewater and blended for 1 minute using a Stomacher Lab-Blender 400 Tekmar Company, Cincinnati, OH!.Appropriate serial dilutions �0 2 to 10 8! of samplesin alkaline peptone water were prepared with duplicatealiquots of 0.1 ml being plated, by surface plating, onboth media BHI agar and PI agar! and incubated at 35 'Cfor 48 hours' The plates were counted in accordance tothe Bacteriological Analytical Manual �!. A DarkfieldQuebecR Colony Counter American Optical, Buffalo, NY!was used as a background light to obtain the colonycount. The lowest limit of detection of this methodologywas 102 cfu/g. The number of survivors in sterile andnon-sterile samples with or without irradiation wascalculated by averaging the number of colonies recoveredfrom the plating of triplicate samples at each radiationdose and time of storage respectively.
Statistical Analyses:To study the effects of low gamma irradiation on
for repeated measures was applied using a SAS-GLMprogram �4!. Pair-wise comparisons to determinesignificant differences among the different meanradiation levels was performed using the Tukey test �!.

164
Significant differences were found when the p value wasless than 0.05 p < 0.05!.
RESULTS AND DISCUSSION
In the non sterile shrimp samples inoculated withan approximate concentration of 10 cfu/g of P.
107 total microorganisms/g. After irradiation the totalnumber of microorganisms was reduced with doses of 1 to4 kGy Figure 1!. Results show that there was a 3-5 logreduction of the total number of microorganisms on day 0on BHI agar. However, beginning with the first week ofstorage there was an increase in the number of coloniesrecovered throughout the 21 days of storage for alltreatments. When comparing gamma irradiation doses, theTukey test showed that inoculated non-irradiated samples control! and those treated with irradiation weresignificantly different p < 0.05!. The effects of low
'Iare shown in Figure 2. With an irradiation dose of 4kGy, counts were below detectable levels throughout theentire 21 days of storage period. A reduction of atleast 5 log cycles was achieved using a 3 kGy dose, buton day 21 a 2 log cycle increase in numbers was seen.Thus, it appears that some Plesiomonas colonies wereable to survive. Counts were below the limit ofdetection for both 1 and 2 kGy on days 0 and 7; however,
of storage increased with both 1 and 2 kGy. The Tukeytest showed that non-irradiated inoculated control!samples were significantly different p < 0.05! fram thetreated samples. A 4 kGy dose was also significantlydifferent p < 0.05! when compared to any of the lowerirradiation doses. No significant differences p >0.05!were found for 1 and 3 kGy; however, there was asignificant difference p < 0.05! between 1 and 2 kGy.
Sterile shrimp samples were inoculated with anapproximate concentration of 108 cfu/g P. shi elloides.Figures 3 and 4 show the effects of low dose gammairradiation on the recovery of this bacterium on BHIagar and PL agar, respectively. In Figure 3 doses of 3and 4 kGy on day 0 reduced the original population ofP shi elloides by at least 6 log cycles. On day 21,counts were still at the limit of detection. On day 0 adose of 2 kGy reduced the original population of thisorganism by approximately 6 log cycles, while 1 kGyreduced it by 4 log cycles. However, the number ofcolonies recovered for these two doses graduallyincreased after 7 and 14 days of storage. This increase


166
0 CQ
Ch CQ W 'LO Ih W Pl OI
>/QJD! SZXNO'IOD ONIAIAHllS OTOO'I
l3
w 00 ~
S
0U ~
N
0
0
0 g!
0 0
4 g
l54
4
4
$ w004 g
W E
U!
U ~S g,
W g0

~ ~ ~ � ~
V
lh CO t 14! IA W Pl H rf D
~/no~! szxmo~oa oez~xmas oToo~
0
w ~0
0"08 .~" v!Q W
065
lJ4
l5
4 g'~ 0
f et5
II4-I C40
C4o < p
U!
S'4

168
+ICD
A
U
Ch tO > LO LA W Pl
l5
w~S
N
Q,o ~
CG
0
V!
V!
0~ 6
V!S
JJ C4
O gW 0hl

l69
may have been due to recovery from the effects ofradiation. On day 21 the numbers recovered for 1 kGywere lower than for 2 kGy. This may have been due to anincrease in the rate of mortality of the cells or to aslower growth rate. The Tukey test applied to these datashowed that non-irradiated inoculated control! sampleswere significantly different p < 0.05! from the samplestreated with irradiation. Applied doses of 1 and 2 kGyand 3 and 4 kGy were not significantly different p >0.05! between themselves, but they were different p <0.05! when 1 and 2 kGy were compared with 3 and 4 kGy.Samples plated on the selective Plesiomonas agar areshown in Figure 4. For samples treated with 3 and 4 kGyno observable counts were found at the limit ofdetection for the entire storage period of 21 days. P.
P Pwith 1 and 2 kGy were reduced by 5 and at least, 6 logcycles respectively, on day 0, but the numbers increasedin the first 14 days of storage and then decreased onday 21. The Tukey test showed the same significantdifferences for the different irradiation doses as thesamples plated on the nutrient,-rich non-selective agar.
Statistical analysis of the data for both sterileand non sterile samples plated on selective and non-selective media showed that there was an interaction p
0.05! between radiation levels and storage times. Theresults indicated that the gamma irradiation treatment
shrimp stored at 0+2 'C since it reduced the numbers ofthis bacterium in the treated samples.
From the results of the present study, it wasapparent that low dose gamma irradiation had an effect
colony forming units recovered after irradiationindicated that there was some inactivation of theoriginal cells. Cells that. survived were thosepresumably only injured or unaffected by gammairradiation. Surviving injured colonies were found to bemuch smaller in size than colonies that were notsubjected to the irradiation treatment, due probably toa slower growth rate. When comparing the number ofcolonies recovered from sterile and non-sterile shrimpsamples, it appeared that recovery was greater forsterile samples. This suggests a possible competition of
Pnon-sterile samples making it more difficult for thePlesiomonas to survive.
When comparing the number of colonies recovered inthe two media, it appears that the number of coloniesrecovered was lower for the selective medium than forthe nutrient-rich non-selective medium. Thus, thisreduction in colonies recovered can be related to theinhibitory properties of the selective agar. The same

reduction in recovery was found by other researchers inexperiments involving other microorganisms treated withirradiation �5!. The growth of injured cells was muchslower in the selective agar. The greatest recovery ofinjured cells was in the non-selective agar BHI!. Thiswas to be expected since the non-selective agar does notcontain inhibitory compounds thus allowing for a betterrecovery.
Another interesting result from the present studywas that the Plesiomonas strain used was capable tomaintain growth at a temperature of 0+2 'C. Thiscontradicts findings from other researchers who foundthat the minimum growth temperature for other strains ofPlesiomonas is 5 to 8 'C �, 10!. The capability of P.shi elloides of maintaining growth at low temperaturecould pose a health hazard in refrigerated foods sincethis bacterium has been classified as a food and waterborne pathogen.
CONCLUSION
Food irradiat.ion has been useful for reducingmicrobial spoilage and as a means to reduce the threatof food borne illnesses. Use of gamma irradiation dosesfrom 1 to 3 kGy have been useful in the reduction ofseveral spoilage organisms in seafood, i.e. Pseudomonasand Achromobacter, resulting in enhanced refrigeratedshelf-life �1!. However, depending on the type ofseafood, gamma irradiation doses above 2 kGy haveresulted in adverse sensory effects �2!.
The results of the present study have shown thatirradiation dosages of 1-4 kGy were effective againstthe food and water borne pathogen P. shi elloides at anproximate concentration of 108 cfu/g, which represents a"worst case scenario". Although lower gamma irradiationdosages reduced the number of P. shi elloides initially,the bacterium was capable of recovering and multiplyingat 0+2 4C.In conclusion, the present study has providedinformation on the effects of law dose gamma irradiationon P. shi elloides in shrimp.
REFERENCES
1. Ampola, V.G. and Ronsivalli, L.J. 1969. Effect ofPreirradiation Quality of Eviscerated Haddock ofPostirradiation Shelflife of Fillets. J. Food Sci.34: 27

2. Arai, T., Ikejima, N., Itoh, T., Sakai, S., Shimada,T. Sakazaki, R. �980!. A Survey of Plesiomonasshi elloides from Aquatic Environments, DomesticAnimals, Pets, and Humans. J. Hyg., Camb. 84: 203 '
3. Council for Agricultural Science and Technology CAST!. 1989. Ionizing Energy in Food Processingand Pest Control: II. Apllications. Task ForceReport No. 115. Council for Agricultural Scienceand Technology, Ames, Iowa.
4. Food and Drug Administration. 1984. BacteriologicalAnalytical Manual. 6th edition. AmericanAssociation of Analytical Chemists. Arlington,Virginia.
5. Freund, R.J. and Wilson, W.J. 1993. StatisticalMethods. Academic Press, Inc. San Diego,California.
6. Koburger, J.A. and Miller, M.L. 1984. Plesiomonas
Industry2 Proc. 9th Ann. Trop. Subtrop. Fish. Conf.Am.: 337.
In "Foodborne Bacterial Pathogens". M.P. Doyle Ed.! p.311. Marcel Dekker, Inc., New York, NewYork.
8. Kumta, U.S., Mavinkurve, S.S., Gore, M.S., Savant,P.L., Gangal, S.V. and Sreenivasan, A. 1970.Radiation Pasteurization of Fresh and BlanchedTropical Shrimps. J. Food Sci. 35: 360 '
9. Licciardello, J.J., Ravesi, E.M., Tuhkunen, B.E. andRacicot, L.D. 1984. Effect of Some PotentiallySynergistic Treatments in Combination with 100 KradIrradiation on the Iced Shelf Life of Cod Fillets.J. Food Sci. 49: 1341.
10. Miller, M.L. and Koburger, J.A. 1985. Plesiomonasshi elloides: An Opportunistic Food and WaterbornePathogen. J. Food Prot. 48�!: 449.

172
11. Nickerson, J.T.R., Licciardello, J.J. andRonsavalli, L.J. 1983. Radurization andRadicidation: Fish and Shellfish. Ch. 2. In"Preservation of Food by Ionizing Radiation" E.S.Josephson and M.S. Peterson Ed.!, vol. 2, p. 13.CRC Press, Boca Raton, Florida.
12. Novak, A.F., Liuzzo, J.A., Grodner, R.M. and Lovell,R.T. 1966. Radiation Pasteurization of Gulf CoastOysters. Food Technol. 20�!: 103.
13. Rutala, W.A., F.A. Sarubbi, J., Finch, C.S.,MacCormack, J.N. and Steinkraus, G.E. 1982. Oyster-associated Outbreak of Diarrhoeal Disease PossiblyCaused by Plesiomonas shi elloides. Lancet March27: 739.
14. SAS Institute, Inc. 1990. SAS User's Guide:Statistics Vol.II. Version 6 edition. Cary, NC SASInstitute.
15. Tiwari, N.P. and Maxcy., R.B. 1972. Post-IrradiationEvaluation of Pathogens and Indicator Bacteria.J. Food Sci. 37: 485.

173
CONTROL OF LISTERlA MONOCYTOGENES IN BLUE CRAB MEAT USING LACTICACID BACTERIA FERMENTATES
Alan J. Degnan', Charles W. Kaspar', Rendi L, Murphree', Steve Otwell', Mark L. Tamplin~',and John B. Luchansky" '
'Food Microbiology & Toxicology and 'Food Science, University of Wisconsin, Madison, WIand
'Food Science & Human Nutrition and 'Home Economics, University of Florida, Gainesville, FL
Ld ' ~ibb*l I d 'hy hb* ~ d-seafood products and epidemiologically implicated in a limited number of seafood-related
d f. !. Th* "" fL ~ with seafood incidence from 12to 26'/o! has also resulted in several product recalls �2!, Moreover, the organism is difficult tocontrol in seafood, because this pathogen can grow at refrigeration temperatures, survive in brinesolutions, and tolerate extremes in heat and pH �2!.
Pl bhL~ii I dfl d' d dl h dsurvival properties warrant the investigation of additional barriers to supplement traditionalcontrol practices. The purpose of the present study was to evaluate lactic acid bacteria LAB!f in crab meat. Blue crab meat was selected as the test
b b I P I fb.~i bdh I I P ~ P *d hseafoods �!, and the orgamsm grows better on crab meat than on certain other seafoods �!.
MATERIALS k METHODS
L~i~
L.~«M! yp b; I I*!. CC - f yp*human isolate; hypo-hemolytic variant of NCTC 5105!, and V7 serotype 1/2a; raw milk isolate!were grown at 37 C in Tryptose Phosphate Difco Laboratories, Detroit, MI! broth andmaintained as previously described �1!.

174 Mi r i 1 'cal sam lin fcrabmFresh blue crab Ctdt~matgs ~sa idus meat was obtained irom retail markets in Florida and
sampled immediately upon arrival in Madison, WI for total bacterial load by direct-plating on PlateC Ad ghf 2 df L~byd' -ph' ~ LI*' 2 'b tnl:Sd 2agar and by enrichment using the FDA procedure �0!.
Fresh blue crab meat ca. 2 kg! was sterilized in a 4 L glass beaker by autoclaving. The meatwas cooled to 4'C in an ice bath and then inoculated with 1 L of the listeriae cocktail to levels of 5x 10' CFU/g. The beaker was inverted 3 times to distribute the inoculum throughout the meat andthen held at 4 C for 5 min, The crab:listeriae slurry was then poured asepticaHy! into a large funnelcontaining a sterile stainless steel sieve that drained into a 1 L graduated cylinder. Crab meat waspressed using a large sterile pestle until 1 L of fluid original volume of inoculum! was recovered.L sggysgwgl d g ~S b d dbyh g E2dg plof meat with 180 ml of 0.1/o peptone, spread-plating dilutions onto LE agar, and incubating plates
h» C. »~! IL.~' d 'ldd' ~ dg g 'd IIthe crab meat were also determined by spread-plating appropriate dilutions on LE-agar plates asabove.
Wa hin crab m t with anti 'crobials
The LAB fermentates tested included Alta 2341 Quest International, Sarasota, FL!,Enterocin 1083 �!, and Nisin Sigma Chemical Coda St. Louis, MO!. Each of the fermentates weretested at levels of 0 control; deionized water!, 2,000, 10,000, and 20,000 arbitrary units AU!/ml.Antilisterial agents were adjusted to equivalent arbitrary units using the spot-on-lawn assay �!.
Cb ISSL.~AIASd2SLgl f"washing" with antiTisterial agents. Each wash solution �00 ml! was separately added to individuallots of crab meat in a 600 ml beaker. The beakers were inverted 3 times to distribute the
antimicrobials before the meat was drained using a sterile funnel and sieve as described above. Theentire washng procedure required 30-60 s for each antimicrobial. Treated crab meat was divided into20-g aliquots and placed into sterile petri dishes. Duplicate samples were monitored for viablelisteriae during storage at 4'C as described above.
The pH of crab meat was monitored both before and after washing with antimicrobials usinga sanitized electrode. In a second set of experiments, the pH of inoculated crab meat in the absenceof antimicrobials! was adjusted with 1 N HCl or 5 N NaOH to pH values ranging from 2-12. A 100-gsample of inoculated crab meat ca. 10 CFU/g! plus 200 ml dH~O were combined in a 500 ml beaker.The crab:listeriae slurry was then adjusted to a target pH while gently stirring with the aid of amagnetic stir bar. Excess fluid �00 ml! was drained from the crab meat as described above and thepH of the crab meat was recorded. Counts of the pathogen in the crab meat were determined justprior to adjusting the pH of the meat and 60 min after pH adjustment.

175
AAdidhlThe data reported are average values 6'om duplicate samples and two separate trials. Data
were analyzed statistically with the SAS program SAS Institute, Inc., Cary, NC!, wherein analysisof valiance and separation tests of the least significant difFerence of the means were used to compareantimicrobials based upon log» CFU unit counts of Listeria. All analyses were done at the 95/pconfidence level.
RESULTS
Oc rr ce of L. mon en s in crab meatL~ f d' f I«*Nb'I d I bfd'
plating at levels of 75 CFU/g Table 1!. In comparison, the total bacterial load of fi'esh crab meatranged &om 4.8 to 5.3 log«CFU/g mean of 5,1; 4 samples!.
I Id fL.~ II hTable 1.
Tri Direct Platin Enrichm n
1 75 CFU/g meat2
3
4
'- Listeria spp. not detected
EfF f H nL.mn oen in r t
Experiments were also conducted to delineate between the antilisterial activity of theantimicrobials used to wash crab meat and any pH efFects contributed by these same antimicrobials.The pH of the crab meat as received was pH 8.1 average of 12 samples!, whereas the pH of theindividual wash solutions at 20,000 AU/ml was 5,1 Alta!, 5.8 Enterocin!, and 3.8 Nisin!. The pHof crab meat immediately after washing with antimicrobials was 7.4 Alta!, 7.5 Enterocin!, and 5.2 Nisin!. In general, the pH of crab meat pH 8.1! decreased somewhat after washing with LABfermentates.
LAB f rmenta 'li eriala en incrabm!bhd ' IL.~ 'a M 2 f fd
of LAB fermentates Figure 1!. Counts of the pathogen remained relatively constant and were notsignificantly diferent p<0.05! &om the control in samples washed with each of the fermentates used
Lmbbl&. I I f .~d d .2!AI !, . Al !. d2.6 Nisin! log» units/g within 0.04 d in crab meat washed with 10,000 AU/ml. Thereafter, countsof the pathogen increased somewhat over 6 d, but did not return to initial inoculum levels. An initial2-3 log,p unit decrease was also observed with wash solutions containing levels of 20,000 AU/ml.More important, the recovery/resurgence of Listeria was lessened over the 6 d sampling period whentreated with 20,000 AU/ml ca. 0.5-1.1 log,p units! compared to 10,000 AU/ml ca. 0.8-1.6 log»units!.

176
2,000 AU
10,000 AU
20,000 AU
fL~'phd�'dFdO'C for 6 days. Data showa are an average of 2 trials.
Figure l.

177
0 O 8 g0 g
he
8 4PCM ~cf
ol~
CV
mUj 6> neo ~~

178
A&bbk'ggbkpdkdd»h' I IL.~euunined in crab meat within 60 min of adjusting the pH to values ranging &om pH 2-12 to ascertainthe effect of pH on pathogen survival in the absence of any antimicrobials Figure 2!. Pathogennumbers remained relatively constant + 0.2 log«units/g! compared to the control over the range ofpH 4.4-10. As depicted in Figure 2, Alta, Enterocin, and Nisin did not alter the pH of crab meat toinhibitory levels.
DISCUSSION
A!k gb L. ~ is inactivajted by proper thermal processing of crab meat 9!, theresults herein and those reported by other investigators �! revealed the pathogen is present in retailproduct. With the exceptions of listeriosis episodes in New Zealand in 1980 and 1992 and one inConnecticut in 1989, as well as a few sporadic cases, seafoods are not a common vehicle of listeriosiscompared to other food vectors see references 2, 8, 12!. However, the link of listeriosis with the
P f f d Ip dkdy IL.MMMMMMM g I dmeat represents a potential threat to the consumer and, as such, prompted us to evaluate LABfermentates as interventions.
To our knowledge, there have been few, if any, reports detailing the use of LAB fermentatesIL.MUM&kg b . A d 'kdh ' jpdj ' ''dd
pathogen numbers was observed after washing with Alta, Enterocin, or Nisin at levels of 10,000 or2& OOO AC!M d fL. MMUIOMP ' ~ dy kgbgy dt P d 'C. Mlistericidal activity was not due solely to pH. Additional studies are warranted to characterize the
b ftby I'hUM'MbtdMML.UPPUPPMMRegardless, the results of the present study agree with and expand upon our previous efforts, andh * f I bgd gg k M fLA&b ' ' k U &L.mmamhUgm'
foods.
CONCLUSION
Washing crab meat with LAB fermentates may serve as an additional hurdle to decrease thelikelihood of listeric inness.
ACKNOWLEDGMENTS
This project was supported by contributions to the Food Research Institute and by contributions tothe University of Florida Research Foundation,
REFERENCES
Arihara, K., R. G, Cassens, and J. B. Luchansky. 1993. Characterization of bacteriocinspdkb Uk! 'U'yg'Lt
. I . I. P dMI tt I. I .'123-13 .

179
2. Baker, M, M. Brett, P, Short, L. Calder, and R, Thornton. 1993. Listeriosis and mussels.Comm. Dis. New Zealand. 93�!:13-14.
3, Buchanan, R. L, H. 6, Stahl, M. M. Bencivengo, and F. del Corral. 1989, Comparison oflithium chloride-phenylethanol-moxalactam and modified Vogel-Johnson agars fordetection of L~itjiia spp. in retail-level meats, poultry, and seafood. Appl. Environ,Microbiol. 55:599-603.
4. Degnan, A. J., A. E. Yousef, and J. B. Luchansky. 1992. Use of Pediococ s ~aci ilacti i toILI ' Mggggpg ' d d -9 bg d
J. Food Prot. 55:98-103.
5. Dillon, R. M, and T. R. Patel. 1992. Listeria in seafoods: a review. J. Food Prot. 55:1009-1015.
6. Estella, L. A., J. N. Sofos, and B. B. Flores. 1992. Bacteriophage typing of ~Li t riadp M d. IF dP .551515.
I' b .J M. JMI L~i ' MB59HDB ' gdpM . JP d .5 922925,934.
FM,J.M., d ..P b 99. .U ' ~ f db pg gMicrobiol Rev. 55:476-511.
IH M.A,~Y.-W.H M. 1995. Yh I d h ' f L~i Scott A! in crab meat. J, Food Prot. 53:878-880.
19. M I' A D. 1992 LI ~ I FDAB ' 92 HMMMM BM7th Ed. AOAC International, Arhngton, VA.
11. Luchansky, J. B., K. A. Glass, K. D. Harsono, A. J, Degnan, N. G. Faith, B. Cauvin, G.Baccus-Taylor, K. Arihara, B. Bater, A. J. Maurer, and R. G. Cassens. 1992.Genomic analysis of P diococcus starter cultures used to control L~i~ria
bMW m . APPI.P ' . hg bl 1.%:
12. Eyser, E. T., and E. H. Marth eds.!. 1991. ~Li teri listeriosisand food s,afety. MarcelDekker, New York.
13. You~ A. E., J. B. Luchansky, A. J. Degnan, and M. P, Doyle, 1991, Behavior of L~i~eri 19 9 fPI II I H
pediocin AcH during storage at 4 or 25'C. Appl. Environ. Microbiol. 57:1461-1465.

RELATIONSHIP BE~Eg PARALYTIC SHELLF ISH TOXINPRODUCING DINOFLAGELLATE ALGAE AND ASSOCIATED BACTERIA
W. Dantzer and R. E. Levin
Department of Food Science, Agricultural ExperimentStation, University of Massachusetts, Amherst, MA 01002
In 1988, Kodama et al.�! published the first of aseries of five papers �-5! documenting observationsthat paralytic shellfish toxins PSTs! i .e. derivativesof saxitoxin STX! were produced by intracellualrbacteria harbored by toxic dinoflagellate algal membersof the genus Gonyaulax, later ammended to the genusProtogonyaulax, and more recently to the genusAlexazdri um. Kodama et al . �! purified the algalcultures to an axenic state i.e. free of external
bacteria by culturing them in the presence of 1 ppmgentamycin sulfate, 15 ppm ampicillin, and 15 ppmcloxacillin. Following purif ication, they thendisrupted the algal cells, plated the resultingpreparations onto Marine Agar and isolated bacteria fromresulting colonies that were allocated to the generaNoraxella �,4! and Bacillus �!. Mouse lethality dataand high performance liquid chromatograms werepresented, documenting that these pure cultures ofbacteria produced toxic derivatives of STX. Weundertook to repeat these studies with toxic strains ofthe genus Alexaadrium and Gymnodinium obtained fromBigelow Laboratories, representative of .North Americanisolates.
We found initially that the mixture of antibioticsused by Kodama et al . �! were lethal to ourdinoflagelllate cultures. This approach was thereforeabandoned. Dinoflagellate cells are about 30m indiameter and appear as small dots to the naked eyeunless in chains. With the use of an inverted
microscope we employed the single cell isolationtechnique to dinoflagellate culture A. tamarense 1312.This involved capturing single cells with glass micro

pipets drawn out to an inside diameter of about 50/.andthen releasing the single cell into a drop of sea waterand repeating this process six times to thoroughly washthe cell free of exracellular microbial contaminants.We were able to purifiy cells of culture 1312 in thisway so that they were completely free of extracellularbacteria. However, a pink yeast always accompanied theseindividually manipulated dinoflagellate cells. Thepeptide yeast inhibitor Delvocide Sigma! was thenincorporated into several agar media to document itsability to inhibit colony formation by this pink yeast.When agar plates were incubated at 32~C, 50 ppm Delvocidwas found to be completely inhibitory to the pink yeastwhen incorporaed into Marine Agar and Tryptone YeastExtract Agar Table 1!. However, Brain Heart InfusionAgar was significantly less inhibitory with thisconcentration of Delvocid. When parallel plates wereincubated at 20~C, Delvocid at a concentration of 10 ppmin all three plating media completely inhibited thisyeast Table 2!. Delvocid at a concentration of 50 ppmwas found to be non inhibitory to Hozaxella and Bacillus Table 3! obtained from Kodama �, 4, a 5!. Theincorporation of Delvocid at 50 ppm into these agarmedia therefore allowed us to plate disrupted cellpreparations of culture 1312 in attempting to isolateintracellular bacteria from dinoflagellate cells. Wewere eventually able to purify additional strains oftoxic dinoflagellae cultures by adding 1,000 ppmpenicillin G directly to algal cultures followed byincubation for 3 � 4 weeks. The dinoflagellate culturespurified to an axenic state are given in Table 4.Toxicity levels as determined with the mouse bioassaywere similar for non-axenic and axenic cultures Tables5, 6,7, and 8!. When the cells of all four toxic axeniccultures were disrupted in a micro blendor with glassbeads so as to physically rupture 50% to 90% of thedinoflagellate cells Figs. 1, 2, 3, and 4! no colonieswere ever found to develop on the above plating media,indicating the complete absence of intracellularbacteria in toxic cells. The similar blending ofpresumably toxic bacterial cells from cultures receivedfrom Kodama �, 4, & 5 ! was found not to reduce thenumber of colony forming units in the cell suspensions Fig. 5!. In 1992, Sako et. al. �! published on the
Mendelian inheritance of PSTs in both A. catanella andA. tamarense. In this work, the authors specificallycited the 1988 paper of Kodama and et al.�! ~ Theygenetically crossed two opposite mating type strains.One strain produced gonyautoxins 4 and C4 and the otherstrain produced neosaxitoxin and saxitoxin. The Flprogeny were found to produce only one parental toxinprofile which segregated independantly from the matingtypes' The authors concluded that PST production is

Table 1. Delvocid inhibition of pink yeast isolatedfrom A. tamarense strain CCMP-1312. ~
LOG CFU/ML
7.77.77.6
7.68.0 7.6
6.5 7.1 1.310
3.350
2.7100
500
Plates were incubated for 14 days at 32 C.
Table 2. Delvocid inhibition of pink yeastisolated from A. tamarense strain CCMP-1312.a
LOG CFU/ML
7.87.67.3
7.37.0 7.8
10
50
Plates were incubated for 14 days at 20~C.
Delvocid
ppm!
Delvocid
ppm!
Marine
Agar
Marine
Agar
Brain Heart
infusion Agar
Brain Heart
infusion Agar
TryptoneY. Ex. Agar
TryptoneY. Ex. Agar

Table 3. Delvocid resistance of Moraxella A andBacillus intracellular isolates of Kodama et al. �.4!
and Ogata et al. �! .a
LOG CFU/ML
Delvocid
ppm!Marine
AgarT. Y. Ex.
AgarBHI
AgarIsolate
8.988. 92
9.18 9.15
8.75 8.82
8.768. 64
+Plates were incubated for 14 days at 20~C.
Table 4. Toxic dinoflagellate algal cuLturespurified of Extracellular Microorganisms.
CULTURE STRAIN
Al exandzi um tamarense
catanella
Gymnodinium catenatum
Horaxella A 0
11 II 5Q
Baci l l us spp. 0
11 Il 5Q
9.04
8.80
8.85
CCMP-1312
CCMP-117
CCMP-1493
CCMP-412

AXENICNON-AXEN1CPAFV&ETER
129.0Algal culture age days!
Algal cell count/ml x 10 !
CFU/ml x 10~!
MU/750 ml
MU/104 algal cells
2.411.9
1.6 None
60
0.25
114
0.10
Table 6. Toxicity levels of axenic and non-axenicdinoflagellate A. tamarense strain CCMP-117.
NON-AXENICPARAMETER AXENIC
Algal culture age days!
Algal cell count/ml x 103!
CFU/ml x 106!
MU/750 ml
MU/104 algal cells
1817
10.8 4.5
5.1 None
88
0.13 0.19
Table 7. Toxicity levels of axenic and non-axenicdinoflagellate G. catanella strain CCMP-1493.
NON-AXEN1CPARAMETER AXENIC
17Algal culture age days!
Algal cell count/ml x 10 !
CFU/ml x 105!
MU/750 ml
MU/104 algal cells
15
3.0 9.8
1.0 None
6.8 17
0.020.02
Table 5. Toxicity levels of axenic and non-axenicdinoflagellate A.tamarense strain CCMP-1312.

185
5.0
2 3 4 5
BLENDING TIbkZ min!Fig. 1. Resistance of Horazella A and 3 Rod Baci l2Usisolates to disruption by blending with glass beads.
5.0
4.8
4.6
1 2 3
BLENDING TIRE nein!
Fig. 2. Rates of cellular disruption of A. tamazensestrain CCMP-1312 by blending with glass beads.Duplicate destruction plots presented,
O QQ
O
R O O
QO
4.8
4.6

186 5.0
4.9
O
w 4.8
O 4.73 4
BLENDING TIME min!Fig. 3. Rates of cellular disruption of A. tamarensestrain CCMP-ll7 by blending with glass beads. Duplicatedestruction plots presented.
O~ 3U
QO
BLENDING TIME min!Fig. 4. Rates of cellular disruption of A. catanellastrain CCMP-1493 by blending with glass beads.Duplicate destruciton plots presented.

l8710
0 2 4 6 10
BLENDiNG TIME min!Fig. 5. Rates of cellular disruption of G. catenatumstrain CCNP-4l2 by blending with glass beads. Duplicatedestruciton plots presented.
3.5
2 4 6 8 10
INCUBATION TIERCE .'days!Fig. 6. increase in microscopic cell counts of G .catenatum strain CCMP-412 in axenic and non-axeniccultures. Axenic and non � axenic algal cultures weregrown at 20OC in f/2 �4 ppt NaC1! algal mediumsupplemented with soil extract. Error bars representstandard deviations of duplicate studies.
he
hl
| U O
0
O VU QO
3.0
2.5

188
4
O 0
hlV
H 3
Q O
102 4 6 8
INCUBATION TIME days!
0
Table 8. Toxicity levels of axenic and non-axenicdinoflagellate culture G. catenatum CCMP- 412.
AXENICNON-AXENICPARAMETER
129.0Algal culture age days!
Algal cell count/ml x 10>!
CFU/ml x 105!
11.9
1.6 None
60
0.25
114
0.10
MU/750 ml
MU/104 algal cells
Fixg. . Increase xn microscope.c cell counts ofcatenella strain CCMp-1493 in axenic and non-axeniccultures. Axenic and non-axenic algal cultures weregrown at 20 C in f/2 �2 ppt NaCl! algal medium. Errorbars represent standard deviations of duplicate studies.

LZTERMURE CZTED
Kodama, M., T. Ogata, and S. Sato, 1988.Bacterial production of saxitoxin. Agric.Biol. Chem. 52: 1075-1077.
2. Kodama, M., T. Ogata, S. Sato, T. Honda, and T.Miwatani. 1989. Production of paralyticshellfish toxins by a bacterium Moraxellasp. isolated from Prot ogonyavlax tamarensi s.Toxicon. 28: 707-714 .
Kodama, M., Ogata, T. and S. Sato. 1989.Saxitoxin producing bacteria isolated fromProtoganyavlaz tamarensi s. In, T. Okaichi,D. Anderson, T. Nemoto, Eds. Red Tides:Biology, Environmental Science andToxicology. Proc. 1st. Intl. Symp. onRed Tides. 1987. pp. 363-366. Elsevier.
3.
Kodama, M. 1990. Possible links betweenbacteria and toxin production in algalblooms. In, E. Graneli, B. Sundstrom, L.Edler, and D. Anderson Eds. Toxic MarinePhytoplankton. Proc. 4th Intl. Conf. onToxic Marine Phytoplankton 1989. pp.52-61.Elsevier.
Ogata, T., Kodama, M., Komaru, K., Sakamoto,S.Sato and U. Simidu, 1990. Production ofparalytic shellfish toxins. In, E. Graneli,B. Sundstrom, L. Edler, and D. Anderson Eds.
5.
inherent in nuclear genes of the dinoflagellate.If intracellular bacteria were involved in toxin
production, one would expect a mixing of bacteria in thezygote and the F1 progeny resulting in hybrid profilesoccurring in the Fl generation cells. No hybrid profilesoccurred. In addition, no studies have come forth onthe nutritional and environmental factors that influencetoxin production by such Morazella and Bacillus isolatesnor have confirning studies emerged from otherlaboratories.
In addition to the studies above, we followed therates of dinoflagellate cell development in non-axenicand axenic cultures. No signficant difference wasobserved in the rate at which cell densities increased Figs. 5 6 7! .
We have therefore concluded that: �! extracellularcontaminating microorganisms exert no influence eitheron toxin production or on the rate at which the densityof dinoflagellate cells increase and �! that thecultures we examined were devoid of intracellularbacteria.

190
Toxic Marine Phytoplankton. Proc. 4th Intl.Conf. on Toxic Marine Phytoplankton. 1989.P. 311-315. Klsevier.
Sako, Y., C. Kim, and Y. Xshida. 1992. Mendelianinheritance of paralytic shellfish poisoningtoxin in the marine dinoflagellateAlexandria um catenella. Biosci., Biotech.,Biochem. 56: 692-694.

VIBRIO VULMI'ICUS IN SHELLFISH:
AN EXAMINATION OF PUBLIC HEALTH RISKS
AND PUBLIC HEALTH POLICY RECOMMENDATIONS
R J. Wittman and R E. CroonenberghsDivision of Shellfish Sanitation
Virginia Department of Health1500 Bast Main St,, Room 109
Richmond, VA 23219
The purpose of the paper is to examine the characteristics and significance of diseaseassociated with the bacteria ~~ vl~lni m in oysters and how this affects public health policy. Itis necessary that we determine the nature of the organism, describe the disease with which it isassociated, determine its environmental distribution, determine the public health risk, discuss thestate's legal liability as well as moral and ethical obligations, and outline the proposed responses andtheir potential impacts upon the public and the industry,
By understanding the nature of the organism we can understand the implications of causingdisease via oysters. Oysters filter the water in their environment to extract their food. Jggjgviiln~ifi s ~. yglm~fi m! is a marine bacterium which is found throughout the marine environmentwithin U. S. coastal waters 9,10,14,19,21,22!. It is also found in brackish water environments �3!.The bacteria are highly motile, &ee living, gram negative, curved, rod-shaped, autochthonousinhabitants of the waters from which molluscan shellfish are harvested �,16!. V. ygllu~fim is ahalophilic, salt-loving! non cholera, marine vibrio which is most frequently isolated from marineenvironments with a temperature greater than 20 C �8 F! and a salinity of 7%0 to 16%0 and isonly rarely found in environments cooler than 17'C �2.6'F! �0!. Oysters harvested from waterswhich exhibit these salinity and temperature regimes have the potential to cause V. ~~lnifi~infections, Since g. ~~~ occurs in Virginia waters which exhibit these specific characteristics,we must address the disease caused by this infection.

192 D cri tion of h r 'smIn order to perceive the public health implications of the presence of V. v~vdnificu in oysters,
we must understand how the infection can occur, what are its manifestations and what is theprevalence rate of the disease. V, yvglnifi~ is a highly virulent and invasive pathogen which isidentified with three different disease syndromes 9,23!. The first syndrome is a progressive infectioncharacterized by a few diarrheal symptoms, primary septicemia and cutaneous lesions, it carries a 50/ocase fiitafity rate �!. The second is a wound infection which results in skin lesions and occasionallysepticemia, with a 13/o case fatality rate �,13,23!. The third is acute diarrhea which is limited andrarely fatal �2!. Infection occurs most often in immunocompromised hosts which include patientswho have neoplasia of the imnune system, a hematopoietic disorder, liver disease or alchoholism,chronic renal failure, or acquired immune-deficiency syndrome, or patients who are recievingpharmacological iimnunosuppression for neoplasia or transplantation of an organ 8!, Additionally,patients with diabetes mellitus, individuals with naturally low levels of gastric acid or those takingprescription or over-the-counter medication to reduce stomach acidity are at increased risk ofinfection �2!, Those persons with hepatic disorders and iron metabolism dysfimction are at muchhigher risk of progressive infection which often results in death �4,18!. Infection with V yLiln~ificomes from exposure of lesions to the marine environment, injuries &om marine animals, or theingestion of raw or partially cooked shell6sh �3,14,18!,
In Virginia the incidence of V. ~ln~i6 gg infections has been low in comparison to the Gulfstates. From 1974 to 1992 there were 29 cases of V. ~lni~fi infections identified by the VirginiaDivision of Consolidated Laboratories and reported to the Oalce of Epidemiology; 3 resulted in death VDH Epidemiology Program 1992!. The average annual incidence for this period in Virginia is 0.53cases per 100,000 population with a mortality rate of 0.05 deaths per 100,000.
In the state of Florida &om 1981 through 1992 there were .124 con6rmed cases of V.vulni6cus infections; 43 resulted in death Horida Department of Health and Rehabilitative ServicesEpidemiology Program 1992!. The average annual incidence for this period in Florida is 1.09 casesper 100,000 population, with a mortality rate of 0.37 deaths per 100,000.
In the state of Louisiana there were 85 confirmed cases of V ygn~ifi «1 infections &om 1981through 1992, of which 25 resulted in death Louisiana Department of Health and Hospitals,Epidemiology Program 1993!, The average annual incidence in Louisiana is 2.01 cases per 100,000population, with a mortality rate of 0.59 deaths per 100,000.
The demonstrated incidence of V. yule%~ infections in a Maryland Chesapeake Baycommunity was 1.6 per 100,000 per year Rom 1974 through 1988 �!. These numbers indicate asignificantly higher incidence rate demonstrated in this clinical study than the reported Virginia annualincidence rate. These clinical studies tend to provide more comprehensive data than the state reports.The state statistics may not be accurate due to underreporting, improper diagnosis and otherconfounding factors. Therefore, the average annual incidence rate in Virginia may be higher than0.53 cases per 100,000 population,

193
Enviromn ntal Distribution
The next step is to uncover why the incidence rates are higher in the Gulf than in Virginia.The key to answering this question is found in determining how the organism is distributed in theenvironment, Concentrations of V. ywlnificus vary widely in the water column, sediment and oysters.The recent cooperative work between the Virginia Department of Health, Division of ShellfishSanitation, and the University of Florida has shown that there is a statistically significant difFerencebetween Gulf of Mexico waters and Chesapeake Bay waters. The concentrations of V. yglnifigg are,on average, somewhat greater in the Gulf waters and persist for longer periods presumably due tohigher temperatures, a more temperate yearly climate and higher salinities.
A number of studies indicate that there is a strong correlation between temperature, salinity,and the presence of V. v~lnifi 111 in seawater and oysters 9,10,11,14,15,17!, As stated earlier, V.vuim~fis has been isolated &om waters with a wide range of temperature and salinity readings, butthe highest concentietions of the organism have been found in waters with temperatures of 17'C to31'C and salinities of 15%0 to 25 ko �7!.
Most oysters harvested in Virginia come &om waters that fall outside the temperature andsalinity ranges preferred by V. vuim~fig. The majority of oysters presently harvested in Virginia arefrom waters with salinities less than 15/00. Harvesting on public oyster grounds is limited to themonths &om October to May, The oyster harvest statistics &om the Virginia Marine ResourcesCommission indicate that the months, in order of number of bushels of oysters caught, for the years1988 to 1992 are January, October, November, December, February, March respectively VirginiaMarine Resources Commission, Fisheries Plans and Statistics, 1993!. The average monthly watertemperatures calculated &om the daily mean! for the months October to May, &om 1947 to 1992,for the Chesapeake Bay watershed as measured at the Virginia Institute of Marine Science pier!range &om a low of 4.12'C in January to a high of 26.61 C in August with the months of Novemberthrough April having average temperatures below 17'C Virginia Institute of Marine Science, 1993!.Therefore, it is less likely that oysters &om Virginia will have concentrations of V. ~lni~fi as greatas those &om the Gulf states. Additionally, the majority of oyster landings in Virginia occur in monthswhen the water salinities are outside of the optimum range for the growth of V. ~gifi~.Consequently, the likelihood of oysters harvested &om Virginia having significant nuinbers of V.v@1m'fight is low whereas for the Gulf oyster it is high. We must address the risks associated withoysters caught &om Virginia and those caught &om the Gulf.
bli H hRi
What are the public health risks posed by V ~vubudcu in oysters that are harvested,distributed and processed in Virginian In order to adequately address this question we must outlinehow the oyster industry in Virginia currently operates, The season of oyster harvesting &om areasopen to harvest by anyone who purcliases the appropriate licenses is October through May. Harvest&om private leases &om the state occurs year round, The major portion of the processing takes place&om October through March. Due to the shortage of Chesapeake Bay oysters, their prices are high.In contrast, due to their abundance, Gulf oysters are, at times, only half the price of Virginia oysters.So, based on price difFerential and availability of the resource, oysters &om other states, particularly

194
Gulf states, are imported into Virginia to be processed. The oysters that come to Virginia &omFlorida, Louisiana and Texas have a warning label. After these oysters are processed, they go outunder the label of a Virginia MTity. Since Virginia does not require a warning label, the informationconcerning the risks associated with these oysters is lost.
Risk is a quantitative assessment of the degree of harm to health that may be anticipated.Safety is a value judgement of how much risk an individual or a community is willing to accept �!.These concepts are crucial in our eumination of this issue.
As noted earlier, the disease and death rates &om V. yglni~ii us infections are much lower inVirginia than in Florida and Louisiana, The results of the 1993 Commonwealth Poll estimate thatthere are 847,554 raw shellfish consumers in the state of Virginia �8.1'/o of the population 18 orolder!. Of this group, 92,882 �0.9/o! have at ~1 one high risk characteristic. These high riskcharacteristics are liver disease, stomach disorders, diabetes, immune system disorder or immunesuppnmmint drug therapy. The 1988 Florida Behavioral Risk Factor Survey estimated the prevalenceof raw oyster consumption and host factors that may facilitate V. ~rglni6~ infections �!.Approximately 2,950,818 adults in Florida are raw ~r eaters �3'/o of the population 18 or older!and 70,820 �.5/o! of these raw ~ost eaters have ~liv r~igggg one of the high risk characteristic!�!.
There appears to be a lower risk of disease and death from eating oysters caught in Virginia.Some of the possible explanations are: t! The concentration of V. satlnnftcus in Virginia oysters islower. 2! The majority of oysters are harvested in the months where the water, temperature is lowerand, therefore, there are fewer organism in the water and in the oyster. 3! The salinities in the areaswhere oysters are harvested do not provide optimum conditions for the proliferation of the organism.4! Consumers are educated and ask for oysters caught in Virginia. 5! The serotype of V. ~lnifigggfound in the Gulf is more virulent that of the serotype found in Virginia waters.
Estiinates indicate that approximately 90/o of the oysters processed in Virginia are &om theGulf. The greater risk of disease and death &om eating oysters caught in Gulf waters may beexplained as follows: 1! The concentrations of V. ~lm~fiu~ in Gulf oysters is higher than Virginiaoysters. 2! During the months in which the public oyster harvest season in Virginia is closed,processors may purchase oysters &om the Gulf. It is during these summer months that the watertemperatures are highest and, therefore, the concentrations of V. vulni~fi> would be highest. 3!Sahnities in the areas of harvest in the Gulf provide the optimum conditions for the proliferation ofthe organism. 4! Shucked oysters are not identified as to the place of harvest, so consumers are notaware that they may be buying Gulf oysters.
Florida has shown through their work that there is a substantial difference in the risk ofdisease and death between nonraw oyster eaters, raw oyster eaters and raw oyster eaters with liverdisease. Of the oysters implicated in V, ~lnificus infections in Horida all were harvested t'rom thewaters of the Gulf or southern Florida. Fla, HRS Epidemiology Program!

195
RELATIVE RI K RATIOS FR MFL RIDADATA
NONRAW OYSTER EATERS
.02 illnesses/1000 adults/35 years; .003 deaths/1000 adults/35 years
RAW OYSTER EATERS
.03 illnesses/1000 adults/35 years; .008 deaths/1000 adults/35 years
RAW OYSTER EATERS WITH LIVER DISEASE2.43 illnesses/1000 adults/35 years; 1.53 deaths/1000 adults/35 years
There is also a risk of V. yglnificus infection via a wound exposed to the marine environment.This risk exists obviously for anyone exposed and increases if they have a liver disorder, areimmunocompronused or exhibit any other factor which may increase their susceptibility. Themortahty rate for a wound infection is significantly smaller than for primary septicemia.
If someone is infected with V. yglnificus &om oyster ingestion and dies, the state's legalliability will be questioned. This issue has arisen in California and Louisiana.
In a recent Cahfornia case, an individual became sick &om ingesting raw oysters &om theHoliday Inn at Fisherman's Wharf in San Francisco Kilpatrick v. Holiday Inns Inc.!. The attendingphysician concluded that the symptoms resulted &om the consumption of raw oysters tainted withVi1ig ~htleng The man sued the Holiday Inn and the companies United Shellfish, Inc., Fisherman' sWharf Seafoods, Inc, and Pearson's Seafood! that supplied and transported the shellfish. The suit wasbased upon causes of action for negligence, negligence per se, strict liabiTity and breach of warranty.This case was settled out of court with the trucking companies that shipped the sheilfish payingdamages to the plaintifK
In Louisiana a Mississippi man became infected with V. vulm~figg &om consumption ofLouisiana oysters WiHiam Winstead v. Ed's Live Catfish k, Seafood Incr s et al. Parish of E. BatonRouge, LA!�7!. The original verdict found that the state was liable for not having adequatelywarned the public of the risks associated with consuming raw oysters. The case was appealed andthe lower court's ruling was overturned. The most important findings are as follows:
The fiuiure of the Department of Health and Human Resources to warn the consumerthat a person with certani underlying risk fiMtors should not consume raw oysters wasnot a cause, in fact, of consumer's illness, The Department was not liable since theconsumer was not aware that he had any of the underlying risk factors.
Since the Department of Health and Human Resources had undertaken studies of~Vibri ~vulnificn bacteria and knew that it posed risk to a smaU segment of thepopulation, it had a duty, once it had sufncient infonnations to issue a warning to thepublic concerning the health hazards possibly associated with ~Vi !~ri ~ln~i6 gy

196
bacteria in raw oysters. However, the Department fulfilled its duty by publishing areport summarizing what the Department knew about bacteria at the time and bystating that physicians should warn patients with any of the underlying risk factors notto eat raw oysters.
It was an error for the trial court to create a duty on the DHHR to warn when no suchduty exists in Louisiana statutory or case law.
3.
It was an error for the trial court to conclude any act or omission of DHHR was acause, in fact, of the plaintiff's injury.
It was an error for the trial court to conclude that the DHHR did not warn the publicabout the ~Vi rig yglni6~ bacteria and its relationship to raw oyster consumption,
The Department of Health and Human Resources DHHR! fulfilled its duty to warnconcerning danger of bacteria in raw oysters by publishing monthly morbidity reportstargeting the warning to health care providers. Since the bacteria most often attacka small percentage of the population, ie. those with liver disease, kidney disease, orother immune-suppressive condition, this method of warning was determined to beadequate.
A newspaper article quoting Department of Health and Human Resources DHHR!officials concerning dangerous bacteria present in raw oysters was ofFered to showthat the public was warned that the dangers in eating raw oysters are relevant, nothearsay.
Statistics from United States Department of Commerce, National Marine andFisheries Service, ofFered to prove extremely low incidence of bacteria infection inoysters and to show it was more prudent to target warnings to health care providers,who would inform those very few who were at risk, were determined to be admissiblein action arising &om the death of restavomt patron.
3.
A similar case was also brought to court in Louisiana Theresa Simeon, et al. v. Big Easy,Inc., M J. Billick Oyster Co., Dept. of Wildlife and Fisheries, La. Dept of Health Civil District CourtNew Orleans, LA!�8!. In this case Floyd Simeon Sr. and his son ate raw oysters at the SweetPepper grill in New Orleans. ThereaRer, Simeon was hospitalized for pain associated with severeblisters on his legs. After attempts to stop the spreading of the blisters failed, Simeon's legs wereamputated. Despite these efforts, Simeon subsequently died. Death resulted from septicemicinfection caused by g. ygttdgcus. Mr. Simeon's daugbter later brougbt suit against the restaurant,suppliers and the Louisiana state agencies that hold responsibility for monitoring the sanitation ofoysters, As with the previous case, the original verdict found that the state was liable for not havingadequately warned the public of the risks associated with consuming raw oysters. The case wasappealed and the lower court's ruling was overturned. The most important findings are as follows:

197
The fact that the DHHR chose not to aggressively disseminate the informationcontained in the Monthly Morbidity Report to the general public does not constitutea breach of the duty to warn. Since the bacteria only attacks a small percentage of thepopulation, i.e., those with liver disease, kidney disease or other immune-suppressivecondition, the DHHR was reasonable in its conclusion that the best way to warn thesepeople was through the medical comnannty. The Monthly Morbidity Report was sentto aery physician in Louisiana and the health departments of several states, includingMississippi. The court held that this satisfied the duty to warn which was incumbenton the DHHR due to its specialized knowledge and position of public trust.
In this case one judge on the Fourth Circuit Court of Appeals of Louisiana held a dissentingopinion. In this minority opinion he writes: "Considering the DHHR's knowledge about the extremedanger of this bacteria and its position of public trust, I find that DHHR owed a duty to the generalpublic to adequately warn of the possibility of contracting a deadly disease by eating raw oysters. Awarning to the medical community absent a concurrent warning to suppliers and retailers of oystersas well as the general public was not suBicient."
The liability of the state as determined by the court indicates that, if the efFort is made toinform and educate about the risks associated with raw oyster consumption, then state liability isminimized. This e6ort is considered valid if it is targeted toward the medical community and thegeneral public via the media, Warning labels on the product are not deemed to be necessary in orderto fulfil the agencies' responsibiTity to warn.
Pr se R n T he I
There is an increased risk of disease &om eating raw oysters. Due to the ubiquitous natureof many bacteria and their opportunistic abilities, they will always pose a risk to those who eat foodwhich has not been subjected to a bactericidal process. There currently is no feasible methodavailable in harvesting, processing or distribution to render the oyster &ee of hmnfid bacteriawithout cooking it. Therefore, disease prevention must focus on educating those at the greatest risk ie. raw oyster eaters with liver disease, stomach disorders, and immune deficiency disorders! aboutthe magnitude of risk associated with this behavior.
The Interstate Shellfish Sanitation Conference ISSC! is a consortium of state agencies,federal agencies and industry that formulates policy for adoption by the United States Food and DrugAdministration FDA! into the National SheQfish Sanitation Program NSSP!, It is this program thatprovides the specific guidelines of sanitation which must be followed by the industry and theoperational rules under which the states must implement their programs. The purpose of the NSSPis to provide uniformity and to assure that shellfish shipped interstate are safe. The ISSC hasaddressed the V. y~lnifi us concerns as follows:
In Issue 92-311, the ISSC adopted: "The Interstate Shellfish Sanitation Conferenceshould formally address the pubhc health significance of naturally occurring pathogensand biotoxms associated with the consumption of raw molluscan shellfish.Specifically, the ISSC should continue to investigate and address harvest, handling,

198
storage, process, distribution, education, and public information activities particularlythose activities targeted toward those at-risk consumers."
2. In Issue 92-117, the ISSC adopted: "ISSC should seek technical assistance Romfederal agencies regarding water temperiLture and naturally occurring pathogen levelsin water and shellstock at different storage temperatures and its public healthsignificance. In addition, an evaluation of commercial feasibility should beconducted."
In Issue 92-304, the ISSC adopted: "The Interstate Shellfish Sanitation Conferenceshould work with FDA and industry through the Education Committee to developeducational programs to reduce health risks associated with consuming raw shellfish.Such programs should be geared to both the general public and at-risk groups. TheConference should develop consumer education brochures targeted to at-risk groupsand the medical/health community, promote Dear Doctor' letters to physicians, anddevelop other methods of educating consumers,"
4. In Issue 92-305 the ISSC adopted: "...as part of the ISSC on-going educationalefforts, if individual States require a point-of-sale message, the following language isrecommended:
CONSUIlbIlER INFORMATION
As is the case with consuming other raw protein products, there is arisk associated with consiiming raw shellfish. If you suffer &omchronic illness of the liver, stomach or blood or have immunedisorders, do not eat these products raw."
The position of the ISSC is that: "Certain individuals with underlying medical problems cirrhotics, diabetics, persons with renal Mure, persons with hemochromatosis, persons who areimmunosuppressed! are at high risk for infection by ~imari ~~fi~. The Conference has statedand continues to emphasize that such individuals must not consume raw molluscan shellfish. TheConference believes that aggressively targeted educational efforts are appropriate means of reducingiHnesses Rom ~Vi ' ~lni~fi !>. Such targeted education will be accomplished by reaching the highrisk popula6on through their various support groups i.e. professional, medical, social, voluntary, andgovernmental organizations!. Further aggressive Conference actions include recommendations tostates and the shellfish industry to take immediate steps to institute harvesting, processing, andhandlnht procehues which will elhuhune illnesses attributable to ~Vi rio tadtd6cu.',. These proceduresshould include appropriate rapid cool-down and continued chilling of shellfish to control growth ofpotentially pathogenic ~Vi imari species. In addition, the ISSC will promote and encourage researchto develop control mechanisms which will effectively reduce these illnesses." ISSC News Release,March 21, 1991!.

199
The position of the FDA is that: 'Reports of illness and death attributable to Vil~riyglni~6cuinfection foHowing the ingestion of raw oysters emphasize the importance of warning certain high-riskpatients against eating raw or lightly partiaHy! cooked seafood. These patients include those with:-liver disease and other diseLses with possible or de6nite hepatic involvement, such as alcoholism,malignancy, hemochromatosis, thalassemia major, -therapeutically induced or naturaHy low gastricacid, -compromised, immune systems including AIDS and AIDS-related complex!. There arepresently no known sanitation or other public health controls that can limit the harvesting of sheH6shto those free of Vibrio vulm~i6 g or control the presence of the organism in raw shell6sh in themarketplace. ~iris are not expected to withstand normal cooking procedures. SheH6sh-borne~Vi rite infections can be prevented by cooking seafoods thoroughly and keeping them from cross-contamination after cooking. Cooked seafood is best stored at 60 degrees C �40 degrees F! orgreater, or 4 degrees C �9.2 degrees Ft or below. ~Vi rio vutm~i6 ts is naturally onnuning in themarine environment, and it is considered to be an opportunistic pathogen in individuals havingcompromised immune systems or medical disorders. The control measure of choice at this time is
P ' a Udll kb dHg d w FDA Drug Bulletin, April 1988, Volume 18, Number 1!,
The FDA has agreed with the ISSC "Issues" 92-311, 92-304, and 92-305 October 9, 1993letter from FDA to the ISSC!.
Both FDA and the ISSC recommend that this issue be investigated and addressed by analyzingand eaunining harvest, handling, storage, process, and distribution of the product. Thisrecommendation is currently being pursued by the ISSC and the VDH. Additionally education andpublic information activities, particularly those activities targeted toward at-risk consumers, shouldbe initiated. The FDA and ISSC feel that consumer education brochures should be targeted towardat-risk groups and the medical/health community by promoting "Dear Doctor" letters to physicians,and by developing other methods of educating consumers.
Educating persons who have liver disease, stomach disorders, or immune de6ciency disordersabout the risk in eating raw oysters is most efFectively accomplished via the physician because 1! thephysician has the most complete knowledge of the patient's state of health and therefore, can assessindividual risk; 2! the patient is more likely to heed a physician's advice as opposed to a generalwarning via a label, notice in eating establishments, news releases etc.; and 3! one-on-onecommunications are more efFective than mass communications.
An informed physician can be the most efFective connnunicator of the risks associated withraw oyster consumption to high risk patients. If we target speci6c physicians, we have a smaller,more informed audience to reach with the information and can more easily repeat the message so thatit is reinforced. If we wish follow up to assure that the message is getting to the physicians and thatthey are relaying it to their high risk patients, we can measure the efFectiveness of our efFort.

200
Optimally, the information should be available in a pamphlet form in the physician's waitingroom as a mechmism to reach more individuals. The gmups that are at highest risk of infection Romeating raw oysters are more likely to be visiting a physician. By placing this information in thewaiting room area, the individual may be stimulated to question the physician concerningconsumption of raw oysters. In addition to educating the physician, this would increase the likelihoodthat the consumer at greatest risk would be informed and that the physician would provide advice onthis matter.
The appropriate agency should also distribute a news release concerning the risks involvedwith the consumption of raw oysters. This release could be provided on a yearly basis to reinforcethe m~. It would also be sent to all other state public health agencies so that they may pass thisinformation on to their citizens as they see fit.
Warning labels on the product are another alternative but warning labels tend not to elicit thepositive response that physician's advice would. According to Dr. Louise McFarland, the directorof the Epidemiology program in Louisiana, warning labels on the product are not entirely efFective.That state has not seen a significant decrease in cases of disease or death as a result of its warninglabel program. She said that a well directed public education campaign which included healthprofessionals was a much more efFective method of reducing risk than warning labels. Warning labelsmay not be taken seriously. In most instances, warning labels rarely reach the intended audiencebemuse, if they are not included at the point of sale ie. usually at the restaurant or retail outlet!, theinformation does not get to the consumer. Indications &om states that have labeling requirements arethat they actually have little effect on reducing the number of cases of V yglnifigus infections viaoyster conaunption. The majority of health professionals that we have surveyed indicate that, in theiropinion, warning labels are the ~l efFective means by which to educate the public concerning therisk of eating raw oysters and that information disseminated to health professionals and the massmedia was most effective. We share this opinion and recommend a comprehensive publiceducation/information campaign be implemented in Virginia.
In order to implement the physician and general public education campaign, it will benecessary to commmicate the me~+ via mailings, distribution of printed information at physiciansorganization meetings, speaking at physician meetings, information printed in professional journals,provision of printed materials to be placed in physicians' oKce waiting rooms, and through newsreleases to both the print and electronic media, It will be necessary to follow up with a mail ortelephone survey to estimate the effectiveness of this campaign.
There are certainly some other more controversial measures that can be taken to minunize thepotential risk of disease. These include restricting harvesting Rom Gulf waters to months whichexMbit lower concentrations of V. yglni~fi~ require an approved irradiation regimen for all shellfish,require thnmal processing of all sheHSsh prior to marketing and restrict the sale of raw shellfish. Arethese measures reasonable in light of the potential risk? Probably not, but they will certainly continueto be proposed as long hunMue continue to contract vibriosis &om ingesting raw shellfish. Aneducated public is the best line of defense against this disease.

201
REFERENCES
1. ARMSTRONG CW, LAKE JL, MILLER GB. 1983. Extraintestinal infection due tohalophilic vibriosis. South Med J;76:571-574.
2. BENARDE MA, 1989, Our Precarious habitat. John Wiley and Sons, New York.
3, BONNER JR, COKER AS, BERRYMAN CR, et al. 1983. Spectrum of Vibrio infections ina Gulf Coast Comnunity. Ann Int Med;99:464-469.
4. DESENCLOS, JC. KLONTZ, KC, WOLFE, LE, HOECHERl, S. 1991. The risk of VibrioIllness in the Florida raw oyster eating population, 1981 - 1988, Am J ofEpidemiol;134�!:290-7.
5. HOFF G, GIEDINGHAGEN DH,AND THOMAS MC, 1990. Vibrio infections in KansasCity, Mo Med 87�2!:881-3.
6. HOGE CW, WATSKY D, PEEI~RN, LIBONATI JP, ISRAEL E, MORRIS JG JR. 1989Epidemiology and spectrum of Vibrio infections in a Chesapeake Bay community. Jof Infect Dis 1989;160�!:985-93.
7. JANDA JM, POWERS C, BRYANT RG, ABOTT SL. 198$. Current perspectives on theepidemiology and pathogenesis of clinically significant Vibrio spp. Clin MicrobiolRev;1:245-67.
8, JOHNSTON 3M, BECKER SF, MCFARLAND LM. 1985. Vibrio vulnigcus: man and sea.JAM A;253-2850-2852.
9. KAYSNER CA, ABEYTA C JR, WEKELL MM, DEPAOLA A, STOTT RF, LEITCH JM.1987. Virulert strains of Vibrio vutlgcus isolated from estuaries of the United Stateswest coast, Appl Environ Microbiol 53:1349-1351.
10. KELLY MT. 1982. E6ect of temperature and salinity on Vibrio vulniPcus occurrence in GulfCoast estuaries. Appl Environ Microbiol 44:820-$24.
11. KELLY, MT AND STROH EM. 1988. Occummce of Vibrionaceae in natural and cultivatedoyster populations in the Pacific Northwest. Diagn. Microbiol. Infect. Dis.9:1-5,
12. KLONTZ KC, SPENCER L, SCHREIBER M, JANOWSKI HT, BALDY LM, GUNN RA.1988. Syndrornes of Vibrio vulni jess infections; clinical and epidemiologic featuresin Florida cases, 1981-1987. Ann Intern Med;109:318-323,
13. MORMS, JG, BLACK RE. 1985, Cholera and other vibriosis in the United States. New EnglJMed;312:343-350,

202 14. OLIVER JD, WARNER RA, CLELAND DC, 1982. Distribution and ecology of Vibriovelnificus and other lactose-fermenting marine vibrios in coastal waters of theSoutheastern United States. Appl Environ Microbiol 44: 1404-1 414.
15. OLIVER JD, WARNER RA AND CLEVELAND DR. 1983. Distribution and ecology ofVibrio vulnificus and other lactose-fermenting marine vibrios in the marineenvironment. Appl. Environ. Microbiol. 45:985-998.
16. O'NEILL KR, JONES SH AND GRIMES DJ. 1990. Incidence of ~Vi rio Mtbd~dns innorthern New England water and shellfish. FEMS Microbiol. Lett.72:163-168.
17. ONEILL KR, JONES SH, AND GRIMES DJ. 1992. Seasonal incidence of ~Vi rio vulnidcusin the Great Bay estuary of New hampshire and Maine. Appl. Environ;58:10 p.3257-3262.
18. TACKET CO, BRENNER F, BLAKE PA. 1984. Clinical features and an epidemiologicalstudy of Vibrio vulnigcus infections. J Infect Dis;149:558-561.
19. TAMPLIN M, RODRICK GE, BLAKE NJ, CUBA T. 1982. Isolation and characterizationof Vibrio vulnificus f'rom two Florida estuaries. Appl Environ Microbiol 44:1466-1470.
20. TEFANY PJ, LEE S AND SHUltdACK, S. 1990. Oysters, iron overload and V~rriovuln~ifi ~ septicemia, Australas. J. Dermatol.31�!:27-31.
21. TILTON RC, RYAN RW. 1987. Clinical and ecological characteristics of Vibrio vulniPcusin Northeastern United States. Diagn Microbiol Infect Dis 2:109-117.
22. TISON DL, KELLY MT. 1986. Virulence of Vibrio vulniPcus strains &om marineenvironments. Appl Environ Microbiol 51:1004-1006.
23. WEST, PA. 1989. The human pathogenic vibrio - a public health update with environmentalperspectives. Epidemiol Infect;103:1-34.
24. Southern Reporter, Second: 602 SO.2D 77
25. Southern Reporter, Second: 554 SO.2D 1237

203
PROPERTIES OF FISH GELATIN
Xiaowen Lu, Denise Weilmeier, Kathryn Chapman, and Joe RegensteinDepartment of Food Science
112 Rice Hall, Cornell University, Ithaca, NY 14853-5601
During the manufacture of gelatin, collagen from connective tissue skin, bone, sinew! is converted into a soluble, gel forming materialwhich can be used as a food component or as a glue. Gelatin, commonlyprocessed from pork and beef, is widely used as a commodity because ofits gel forming and surface active properties. However, theKosher/Halal community does not accept most currently availablegelatin because the processing does not meet their religiousrequirements. Although a few low Bloom Qess than 100 Bloom! fishgelatins have been available to this community, the gelatins were notcomparable to commercial high Bloom gelatins, In order to fill this need,a few companies, including Food Industry Testing, Inc. Miami Beach,FL!, have developed a process currently being patented! to obtain a highBloom fish gelatin from warm-water fish skins. This product, in additionto the great benefit it represents to the Kosher/Halal community, has ahigh value to the fish industry's waste management effort by yielding anadditional income for a by-product. that is commonly wasted. The twomain purposes of this study were to study the properties of these highBloom fish gelatins derived from fish skin and to compare them to theones from a well-known commercial gelatin.
MATERIALS AND METHODS
Seven fish gelatin samples: 300 Bloom fish gelatin lots T5001,T5401, TA30104, and T5104!, 250 Bloom fish gelatin lot T25104!, 210Bloom fish gelatin lot T5113!, and 200 Bloom fish gelatin lot T5502!,were investigated. In addition, a commercial product, Knox. gelatin Englewood Cliffs, NJ, lot 5-35001-08! was studied alone, and mixed 25%,

204 50% and 75% by weight with 300 Bloom fish gelatin T5001! or with 200Bloom fish gelatin T5502!. All these fish gelatin samples were preparedinto 5% w/w! solutions for the study of the effect of dissolving time onsolubility, pH, melting point, and minimum solubility. For thedetermination of the minimum solubility point and the effect ofconcentration on pH, melting point and gel strength, the 300 Bloom fishgelatin T5104! was used.Effect of dissolvin time on fish elatin solubili
Fish gelatins �00 Bloom T5104! and 200 Bloom T5502!! solutionswere prepared with deionized distilled water and kept at 40'C for 0, 1, 2,3,4, 5, and 6 hr. Each sample was centrifuged at 16,000 rpm for 15 min atapproximately 40'C and the protein content of the supernatant wasdetermined by Lowry �951!. The solubility was expressed as the percentof total protein measured prior to centrifugation!.
H' 1 ti
pH was measured using a glass electrode pH meter pH-103Metrohm/Brinkmann, Brinkmann Instruments Inc., Westbury, NY!. Ailsolutions were prepared with deionized distilled water and equilibratedto 40'C in a water bath for at least one hour. The calibration buffer Certified Buffer Solutions, pH 4. NM.01 @25'C, Fisher Scientific Co., FailLawn, NJ, lot 87623-24! was also kept in the water bath.
Eight 30 mL fractions of the 5% solution were prepared and keptat 40'C for at least one hr. The pH was adjusted with 0.1 N HCl or 0.1NNaOH to pH 3.8 to 5.2 �2 pH increments!. These samples werecentrifuged at 16,000 rpm for 15 min at approximately 40'C. A Lowryprotein determination of the supernatant gave the total soluble protein Lowry, 1951!. The pH of the fraction with the lowest protein content inthe supernatant i.e., less soluble protein! was defined as the "minimumsolubility point." After the approximate minimum solubility point wasdetermined, the pH range was reexamined using 0.1 pH increments. Theminimum solubility was calculated as a percent of the total sampleweight and as a percent of the total protein measured prior tocentrifugation!.Mlti ' t
The melting point measurement method described byWainewright �977! was modified. The test determines the temperatureat which gels soften sufficiently to allow drops of chloroform to sinkthrough them. Solutions were prepared with 0.1N NaC1, equilibrated at40'C, and the pH adjusted to 7.0 with 0.1N NaOH. A 5 mL aliquot ofeach sample was transferred to a small glass tube Fisherbrand.borosilicate disposable culture tubes, 12 x 75 mm, Fisher Scientific Co.,Pittsburgh, PA! previously coated with Sigmacote. Sigma ChemicalsCo., St. Louis, MO, lot 23H6097! to prevent sticking. The samples weredegassed in a vacuum desiccator for 5 min. The tubes were then coveredwith Parafilm. Laboratory Film, Greenwhich, CT!. After heating in a

205
water bath at 90 C for 15 min, the gelatin solutions in the glass tubeswere cooled immediately in ice-chilled water to 10'C and matured for 4hr. Five drops of a mixture of chloroform and a reddish brown dye Food color AFO OWS 550, Miles Inc., Elkhart, IN, lot 5-057039! wereplaced on the surface of the gel. The gels were put in a water bath at10'C and the bath was heated at 0.2-0.4'C/min. The temperature of thebath was read from an electronic digital thermometer &.2'C, NBS NIST!, Serial No. 457261!. The temperature at which the chloroformdrops began to freely move down through the gel was taken as themelting point.
This method was modified from the NE-123 Northeast RegionalHatch Protein Functionality Group! gelation method Chong Lee,personal communication!. Solutions from 2% to 12% w/w! wereprepared with 0.1N NaC1 and equilibrated to 40'C. The pH was adjustedto 7.0 with 1N NaOH and the solutions stirred for 30 min. Followinghydration, the samples were transferred to glass tubes �9 x 175 mm!which were previously coated with Sigmacote. and closed on one endwith rubber stoppers Fisherbrand. No. 2, Fisher Scientific Co.,Pittsburgh, PA!. The samples were degassed in a vacuum desiccator for10 min. The other end of each glass tube was closed with a second rubberstopper, to prevent moisture loss and cook sweHing, and the glass tubeswere placed vertically in a 90'C water bath for 15 min. The glass tubeswere then cooled to 10'C immediately in ice-chilled water for 20 min andkept refrigerated �-10'C! overnight The gels were removed from theglass tubes and cut into about 8 cylinders 19 mm long. Each cylinder wasthen compressed on an Instron Universal Testing Machine Canton, MA,Model No. 1101! to determine the failure force. The cross-head CCTload ce11, 200 lb! speed of the Instron, interfaced with an IBM PC-XT, wasset at 12.7 cm/min. The gel strength of each sample was calculated fromthe average failure force of several cylinders.Se al
Cubes with 2.75% gelatin w/w! were made from 300 Bloom T5104 and TA30104! or 250 Bloom fish gelatin and Knox. gelatin, andcranberry juice Ocean Spray Cranberries, Inc., Lakeville-Middleboro,MA! or grape juice Sunny Square grape juice, Commander Foods, Inc.,Syracuse, NY!. One third of the juice was added cold to the fish gelatinand allowed to sit for 1 min. The rest of the juice was heated high! in amicrowave Amana Touchmatic II Radarange. microwave oven, AmanaRefrigeration, Inc., Amana, IW! for 1 minute, added to the cold mixture,and stirred until the gelatin was completely dissolved about 5 min!.Because the color of the fish gelatin was different horn the Knox., a fewdrops of red food color McCormick, Hunt Valley, MD! was added. Themixture was poured into a 9" square pan and kept overnight in arefrigerator, and then cut into 1" cubes. A triangle sensory test Larmond,1987! was used to determine if the panelist could tell the difference

206
between the two products made from fish gelatin and Knox.. Thepanelists were also asked to record how great the difference was andwhich sample s! odd or pair! was preferred. Only correct answers onthe triangle test were kept for further evaluation.
RESULTS AND DISCUSSION
Fig. 1 shows the effect of dissolving time i.e., the time between gelsolution preparation and the solubility test! on the protein solubility %!.The major change i.e., a difference in solubility of about 12%! seemed tooccur during the first hr. After 1 hr, the solubility changed slightly i.e.,an increase in solubility of about 3%! for both samples. Based on theseresults, all the samples that were prepared for the rest of the tests wereallowed to stand for at least 1 hr.
100
95O
90pR0
85
80 g 0 1 2 3 4 5 6 7 8
Dissolving Time hr!
200 Bloom
300 Bloom
Fig. 1 Effec of dissolving time on fish gelatin solubility % of Total Protein!
Table 1 shows pH, melting point, the aunimum solubQity point,and the minimum solubility of all samples. The pH ranged from 4.98 to5.27. The lowest pHs were observed in 210 Bloom T5113! and 300 Bloom T5104! gelatin. The rest ranged from 5.17 to 5.27. The pH values werefound to be significantly different by one way ANOVA statistical analysisfrom Bloom to Bloom and even within a single Bloom �00! p<0.05!.However, the pH range was only of 0.29 pH units. The pH of themixtures of 300 Bloom and Knoxo' were not significantly different fromeither 300 Bloom or Knox.. On the other hand, the pH of the mixtures of

207
200 Bloom and Knox. were significantly different from Knox. p<0.05!but not from 200 Bloom fish gelatin.
Table 1. pH, melting point, minimum solubility point MSP! andminimum solubility MS! of gelatins as 5% w/w! solutions
Samples pH
4.34 83.035.21 24.3 97.29
5.22 24.7 4.35 96.89 82.13
96.334.38 84.19
96.66
4.38 95.95
4.38 96.24 84.93
5.20 95.42 85.55
Knox. Gelatin 4.34 96.34 83.41
96.71 83.07
5.18 27.3 96.19 82.74
5.19 4.36 96.32 82.89
5.21 26.8 95. 74.35 83.74
4.35 95.55
4.36 95.16
The concentration of the solution seemed to affect the pH slightly Fig. 2!,although from 2% to 20% gelatin the shift was only about 0.10 units.
300 Bloom fish gel{TSOOI!300 Bloom fish gel{T5401!300 Bloom fish gel TA30104!300 Bloom fish gel T5104!250 Bloom fish gel T25 104!210 Bloom fish gel{TSII3!200 Bloom fish gel{T5502!
25% 300 Bloom fish gel TSOOI! + 75% Knox.50% 300 Bloom fish gel TSOOI! + 50% Knox.75% 300 Bloom fish gel{TSOOI! + 2S% Knox.25% 200 Bloom fish gel T5502! + 75% Knox.50% 200 Bloom fish gel TSS02! + S0% Knox75% 200 Bloom fish gel T5502! + 2S% Knox.
MeltingPoint C!
5.27 24.7
5.05 24.6
5.27 24.0
4.98 23.7
5.17 29.6
5.20 28.6
5.24 26.3
5.23 25.2
MSP
H!MS % of
Total Pmtein!MS % of
Total Wei ht!
84.23
84.72

208 5.105.G6
5.02
5.00
4.98
4.96 0 4 8 12 16 2G 24Concentration %!
Fig. 2 pH at different concentrationsof 300 Bloom fish gelatin T5104!
Two tests were performed to measure the minimum solubility of5% 300 Bloom T5104! Fig. 3!. Since the lowest solubility was observedat pH 4.38 in both cases, this value was considered the mizumumsolubility point of this fish gelatin sample. The minimum solubility pointof all samples see Table 1! showed a mean of 4.36MG2 pH units. Theminimum solubility was 96.18M02% of the total protein content or83.91&.13% of the total weight. Furthermore, all 200 Bloom to 300 Bloomsamples had a mini>hum solubility of about 96.1M1.39% of total proteincontent which was very close to the minimum solubility of Knox. ofabout 96.34% of total protein content. This was also true when comparedas percent of total weight. The minimum solubility points were also verydose between the fish gelatins �.37M02! and the Knox. gelatin �.34!.
Two of the 300 Bloom fish gelatin and Knox. mixtures �5% and50% fish gelatin! had higher minimum solubilities expressed as percentof total protein content! than either the Knox. or the 300 Bloom fishgelatin whereas the sample of 75% fish gelatin had the lowest minimumsolubility see Fig. 4!. All the mixtures, however, had a higher proteinsolubility than either the Knox. or the 300 Bloom fish gelatin at otherpHs. In the case of the 200 Bloom fish gelatin which had a lowersolubility at all pH values! than Knox. gelatin, the protein solubility ofthe mixtures were between the two see Fig. 5!.

209
87
86A bO
9
pR0~O
0.2 pH increme0.1 pH increme
843.0 3.5 4.0 4.5 5.0 5.5 6.0
pH
Fig. 3 Solubility of 5% 300 Bloom Fish Gelatin TS104!at different pHs
87
824.1 4.2 4.3 4.4 4.5
pH4.6
Fig. 4 Solubility of the mjxtures of 300 Bloom fish gelatin T5104! and Knox. gelatin
86
bO
85
84pHO
83
25% 300 Bloom fish gelatin
50% 300 Bloom fish gelatin
25% 3N Bloom fish gelatin
300 Bloom Fish gelatin

210
87
bO
86
~ 85
84@0
200 Bloom fish gelatin
Knox
25% 200 Bloom fish gelatin
50% 200 Bloom fish gelatin
25% 200 Bloom fish geiatin83
4.1 4.2 4.3 4.4 4.5 4.6
pH
Fig. 5 Solubility of the mixtures of 200 Bloom fish gelatin TSS02! and Knox. gelatin
The gel melting point seems to be concentration dependent Fig. 6!.An increase in the concentration of the gel solution, from 2% to 12%,resulted in an increase in the melting point from 21.4 to 24'C. The meanmelting point of all Bloom fish gelatin samples was around 24.~.5'Cwhich is 5'C lower than that of Knox. gelatin �9.6'C! see Table 1!. Aswith pH, melting point was significantly different, measured by one wayANOVA, from Bloom to Bloom and even within one single Bloom �00!but different lots p<0.05!. The melting point increased with the Bloom infish gelatin samples, and although significant, the difference from thelowest Bloom �00! to the highest Bloom �00! was only 1'C see Fig. 7!,
The effect of mixing Knoxe' gelatin with either 200 Bloom or 300Bloom fish gelatin is seemed in Fig. 8. Since the fish gelatins have lowermelting point than Knox. gelatin, it was expected that the melting pointwould decrease with the addition of the fish gelatin. It is interestingthough that the pattern observed was not a straight line i.e., an additiveeffect! but instead suggested a discontinuity, especially with 0-25% 200Bloom fish gelatin. In addition, a second-order polynomial curve wasfitted to the 300 Bloom data which coincided exactly with theexperimental curve y = 29.614 - 3.8343x10->x - 1.4857e-4x>, R> = 1.000!.
A linear relationship between gel strength lb! and concentration %! can be seen in Fig. 9 R2=0.991!.

24
U g23
Z»bO
22
Yp 21 0 2 4 6 8 10 12 14Concentration %!
Fig. 6 Melting point as a function of concentration using300 Bloom fish gelatin T5104!
24.4
24.2V
24.0
O 23.8
23.6
23.4 180 200 220 240 260 280 300 320Bloom
Fig. 7 The relationship of fish gelatin Bloom andm,elting point

212
30
28
U
26
C4
24300 Bloom
200 Bloom
220 20 40 60 80 100
Fish Gelatin Ratio %!Fig. 8 The relationship between melting point and fish gelatin
ratio in mixtures of 200 Bloom T5113! and 300 Bloom T5001!and Knox. gelatin
30
20
100 2 4 6 8 10 12 14
Concentration %!
Fig. 9 Gel Strength lb! as a Function of Fish Gelatin Concentration�00 Bloom fish gelatin T5104!!
The results of the sensory triangle tests are shown in Table 2. In allcases, panelists were able to distinguish between the Knox. and the fish

2l3

214
gelatin samples p<0.05!. For the 300 Bloom fish gelatin T5104!, of thepanelists, who correctly identified the odd sample, all but one liked theKnox. gelatin better than the fish gelatin. Among the panelists that likedthe Knox. product better, 9 panehsts said that its flavor was better, 6panelists said that both its flavor and texture were better, and 1 said thatits color was better. With the 250 Bloom fish gelatin T25104! sensorytest, 8 preferred the Knox. gelatin, 5 preferred the fish gelatin, and 1thought that neither was more acceptable, even though the fish gelatinwas softer and sweeter." Another panelist agreed that the fish gelatinwas softer, however, the panelist observed that although the flavor wasthe same, the texture was better in the Knox. gelatin.
In a second 300 Bloom fish gelatin TA30104! sensory test, 7preferred the Knox., 6 preferred the fish gelatin and one did not have apreference but dedared that the texture of fish gelatin was better, whilethe flavor of Knox. gelatin was better. Finally, for the 250 Bloom fishgelatin T25104! cubes mixed with grape juice, instead of cranberry, 11preferred the Knox. gelatin while 8 preferred the fish gelatin. Amongthe comments made about the fish gelatin samples were that it wassweeter and had a stronger flavor. A different aftertaste was also notedby some panelists. In summary, although Knox. gelatin was preferredamong the panelists, more than 1/3 of the panelists preferred the fishgelatin cubes. The most common objection to the fish gelatin was theaftertaste which suggests that some process improvement is needed.
CONCLUSION
There is a clear effect of concentration, at least from 2% to 20%solutions of 300 Bloom fish gelatin, in pH, melting point and gel strength.Both melting point and gel strength increase with an increase in theconcentration. The lowest pH was obtained in 10% solutions and thehighest pH was obtained at the two ends of the concentration range thatwas used. Increasing the Bloom resulted in a small increase in themelting point, but all Bloom fish gelatin samples had a lower meltingpoint than Knox. about 5'C lower!. The pH of Knox. �.17! was foundto be in between the pH range of the fish gelatin samples �.98 to 5.27!.There was dearly an effect of the ratio of fish gelatin in the mixtures ofKnox. with 300 and 200 Bloom fish gelatin on all the properties studied i.e., pH, melting point, and minimum solubility!. The effect, however,was not additive and therefore could not be easily predicted. Thembumum solubilities of the fish gelatin samples were similar to the onesobtained for Knox. expressed either as % of total protein or % of totalweight. Sensory analysis showed that most panelists distinguished fishgelatin from Knox. and although there was a dear preference for thelatter, more than one-third of them preferred the fish gelatin. The most

215
common objection to the fish gelatin cubes was the aftertaste whichsuggests that there is still area for improvement.
REFERENCES
JONES,N.R.1977. Usesof gelatin inedible products. p,365-394. In:A. G. Ward and A. Courts ed.!, The Science and Technology ofGelatin. Academic Press Inc., New York
LARMOND, E. 1987. Laboratory methods for sensory evaluation of food,p. 63. Canadian Government Publishing Centre, Ottawa, Canada.
LOWRY, O. H., J. ROSEBROUGH, A. L. FARR and J. RAl%3ALL. 1951.Protein measurement with folin phenol reagent. J. Biol. Chem.193:265
WAINEWRIGHT, F. M. 1977. Physical tests for gelatin and gelatinproducts. p.507-534. In: A. G. Ward and A.Courts ed.!, TheScience and Technology of Gelatin. Academic Press Inc., NewYork.

216
Starage Stability of Hydrcgenated 5Rmha6en OilShcxtes~ In ~es, Crackers, and Snacks
tlatTany Bimbo, Jane B. Crawttmr1, and Clyde E. Stouffer
Deparbnerrt of Food Science, Qarnell UniversityIthaca, New Yark 14853-5601
and
1 Zapata Protein Inc., Bax 175,Reedville, VA 22539
and
2 Technical Foods ConsultantsCincinnati, GH 45231
Fish oil has been a significant sauze of fat far manypeople for cent~ies. It is widely used in Europe, the Far East
9carking and salad oils. Bm U.S. actually cansumN hydrogenatedfish oil fran 1921 - 1951 but this practice eel~ when theCalifarnia sardine fishery failed. In 1988, penh den oilaccounted far 984 of the total U.S. proLhxtian of marine oils�! .
Fish oil contains the sane fatty acids as vegetable oil andanimal fats, plus additianal lang chain polyunsaturated fattyacids Cg0 and C2g! . When hydrogenating this wide range offatty ac~, the oil crystalizes into the beta-prime farm. '%hehydrogenatian gree~ alters the physical characteristics of theoil and gives unique functianal properties. For instance, ithas high crystal stability, unlike most annal and manyvegetable oils. Since them is no crystal growth, it retainsits saeathness and plasticity. It also has kxMer creamingproperties than vegetable oil shartening and it is resistant to"wark softening" during pastry manufacturing �! .
Despite these mivanteym, the seafood industry has beenrelunctant to manufacture fish oil ~mung far
two reasons: 1. the shozterdng might have reversion "fishy"!flavars that might be imparted to the baked product �6!, and 2.the ~ening might be pmne to develop autaxidative rancidity

217
because of the high polyunsaturated fatty acid content of fishoil �8, 7, 10!. However, a specially procesead chaodarized fishoil mayonnaise, whm properly packaged and shred at 2C far 14weel' was organoleptically aca~ble and was not significantlydifferent fnxn say oil ma~xmmse. 5~~ frcxn chemicalanalyses, there were fee signs of axidatian {12! .
Hydnxym ation decreases the tendency to axiom andincxe-mes flavar stability �! . In an unpublished study byStauffer et al. unpublished study, JAOCS!, refined, bl~ed,and dexharized parlia1ly hydrogenated menhaden oil PHRS! wasused to make aa9cies, crackers, and deep fried extruded snacks.Ihe PHR! items were as cxganoleptically acceptable as those madewith partially hydrogenated vegetable oil PHOO! .
Li Hsieh and Regenstein �3! found that the best analyticalte.~~ far early axidatian of fish oil mayannaise are pemacidevalue PVj and thiaibarhituric acid 'IKR!, while far lateraxidatian total carteqyl ccepaund TOC! and anisidine value AV!were better.
'Ihis resea~ is a cxmpmion wark to that of Stauffer et al. unlmblished study, PCS! shelf-life study of cookies,crackers, and deep fried eactruded snacks using seneca analysis.'Ihe objective of mr wark was to determum the cocidativestability of PHND shartenmy in the sama cookies, crackers, anddeep- fried extnx3ed snacks using PT, AV, and Totax.
Menkmhm oil was produced by Zapata Pmtein Inc. It wasextracted fran the fish, then refined, bleached, and deodorizedby standard methods. Hydmpenation, analysis, and blending of
the facilities of POS Pilot Plant Carp~ration Saskatoan,Saslsa~aen!. Table 1 sham the preparaticm of RSC! basastocksand hardstock. Table 2 shorn the productian of the PHR! all-purpose stmrtening that. was used in the cxxikie and crackerbasecakes, PHK! filler fat that was used in the cmmn filling,and P8% fzyiLng fat that was used in de~fried extmRd snaclm.
'Ibe baking, deep frying, and sensory evaluatian tee~ weredane at the American Institute of Baldng AIB, Manhattan, KS!.'Ihe farm&as were standard cams, as used by the AIB farirgredierrt and process testin
~ sets of each type of cookies, crackers, and snacks weresupplied. One set was fanaQated with PHK! as the fat c arponent
e yset scanned as the aantml and was farmulated with a partiallyhydrogenated vegetable oil {HiVO! ~marx~.

2I8
0
175 - 20020
O. 14103
175 � 20020
0.14150
160
40
0.1%99
Gn 0le 2-
All-Pu~ Filler Fat,t
6 A
10430%
1004
'3mperatuze, 4CHq pressure ~ psiNi concentrationT1IBB~ min
21.1OC26.7OC33.3OC40.0oC
Nettler m.p.,oCI
Basestock glBasestock g2H~LstockRBD canola oil
10 OoC21 loC26.70C33.3oC40-00C
Ke.ttler m.p., 4CSmake point, 4CKN hrs.
33.1
20.3
13.5
1.1
. 0
35.876
25.4
19 ' 2
16.5
11.1
3.643.6
248
6
39.5
27.0
21.0
9.60
38.97
39.5
27.0
21.0
9.6
0.0
38.9
240
273
78.2
80.3
82.0
85.8
88 ' 558.2
.6

219
Two gapes of cookies were tested: a rory san9wich cookiewith a cream filling, and a wire cut butter crunch cookie. 'Ihee!gmrimental sandwich ~e and butter crunch ~e basecakewere made with all-purpose MK! sl~ning see Xhhle 2!; thecontrol cookie basecake used partially hydrogenatedsaybean/cottonseed oil sharterdng HLS-C, Capital City Oo.,Karlshamns, Oolwnbus, CH! . 'Ihe experiaer~ samheich cookie~~ filling was made with MC! filler fat and the control wasmade with partially hydvxyeeated co~ oil filler fat PUR~92, Capital City Oo.! .
Snack crackers used all~ose RH3 shartening in theexperimental cracker and were sprayed with all~pose PHK!.Control crackers contained partially hydrogenated
vt / ' a lecanola oil Lotra 70, Capital City Oo.! . 'Ihe spray oil, 12-15%, was applied to the hat crackers as they exited the oven.
Zhyerimmtal mttnxlsd snack pellets were deep f'ried in PHK!frying fat shartening, while the cardmvl snaM were deep friedin all vegetable frying fat XXX Vcr', Bunge Oorp.! ExtrtxIedsnack pellets were fried in a floor myel fryer Filter Magic,Fry Master Carp., Subpart, IA! at 204C far 10 sec.
StcgygeA11 test material were stared at, rocm teaperature. Sires
the ceakies and crackers were packed by the supplier! in clearplastic bags, they were exposed to fluarescent light and stsun light.
Rosary evaluation of the product was conducted using 20untrained panelists. Products were tested using a triangle testat 0, 1, 2, 4, and 6 nenttm after baking. Panelists were askedto tm~~ the samples in the avower indicated and identify the oddsante. 9hey were also asked to indicate the degree ofdiffeeemre baden the samples and the acceptability of each.
Ue
This is the most ~ately used ne.tixxR to ch~zmine the degreeof cam9atian �7! . The primary axidation products af oils and
liberated by its raa~cn with potassium iodide. 'Ihe peraxidecarztent is expmesed in terms of milliequivalents of iodine perkilogram of oil ar fat.
dprocedure of Ke and armada �1! . 'Iha PV far the extracted fat

220
AnisidineAnisidine value measures the later cocidatian of fat by
measuring alpha-beta unsaturated alchbydes of fats and oils.I
eactensively used in European ccmztries �7! .
To neasure anisidine values, the method far fish oil aspublished in the Internatianal As sociatian of Fish MealNanufactLxremr IAFI%f! Fish Oil Bulletin 8! was used.
'I'bragAn m~nsian of these methods is the Totax value, which is a
measure of total ~tive deteriaratim, with an stasis anprimary cocidatian. '3~1 is the sum AV and twice the PV �, 9,17! .
Stat' ical is
'3he general linear model of Rinitab 7.2 Minitab, Inc.,State Oollege, PA! was used to do the analysis of variance,analysis of cevariazme, and ragressian, since it can be used
Far each test, analysis of variance with respect to time,treatment and the inter actian of time and treatm~~t was
fp . !. - 'f pc0.05! between overall mens of treatments, a a~my analysisof variance was dane with time averacjed aut.
RESULTS 5 DISCOSSICN
slight difference, alVxugh not at the 54 significance level.By the 6th @anth, 0 panelists picked the correct add sample.With recpani to prefmeem, the panelists seeaed to slightlyprefer the control saaple, but the split was so small as to becansideL~ rc rdan. Ag.~, results of the triangle testindicated that there was no significant difference be~msandwich cookies made with PHN! as both the basecalm and thefilling and the control cookie.
'es. Far the triangle test, with 20h f
level. This was reM:hed only when the cookies were evaluatedafter 2 months of starage Table Table 3! ~ Qn the other testtime, the selecticns appeared to be randem. Of the panelistswho carrectly identif ied the odd sample, the panelists'prefererxm, also appear to be randan, except far perhaps the 2ndmarrth, where 7 aut of 12 preferred the PHK! cookies. Remits ofthe taste panel tests indicated that there was no significantdifference bellmen the expmiztental butter crunch coakie and thecontrol cookie

221
Table 3 � Sensory analysisa of sanhrich cookiestr' le test
0
G 1
2 4 6a20 urrl~ined panelists: 5t significance, requires11 cotrrect responses.
Table 4 � Sensory analysis of butter crunW cookiesover ' tr ' le
Prefererme
Oarrect5fanI~ F' Oil
a20 untrained panelists: 54 significance requires11 aarT ect responses.
Table 5 � Sermxey analysis of snack crackerstime ' test
CXRrect
a20 untrained panelists: 5t significarxm requiresll corn~ responses.
Table 6 - Sensory analysis of deep-fried extrudedsna e
OcIrrImt
Mmths Oi
a20 urltrained panelists: 54 significance requiresll correct responses.
0 24
G 1
2 4 6
10
10
3 7
6
5
12 5 0
12
14
10
7 4
8
12
9 6

222
detect a significant differeem between the cmgmrimental andtest crackers with a preference tcwavi the control crackers Table 5! . Oaments indicated that scxM. of the panelists cauldpick up a slight fishy taste. As the crackers "aged", thedifferences beb~ the crackers seemed to decL'ease.
If an oil is yrane to autcocidativerancidity and development of reversicn flavors, using it to makea eh~fried extnxLed snack item is a stringent test. 'IhesnaNs were nat coated with any flavaring materials, so thepanelists were experiencing the crurxhy tcmdxxee of the blandsubstrate with the frying oils as the anly smrce of flavar. Asshcwn in ~le 6, the ability of the panelists to detect thecorrect odd sample did not re~ significazme during the entireperiod of the study. At the beginning of the study, thee was aslight preference far the oceztml samples. However, this does
difference between the PHM! and cantxol sables.
Sirxoe Totco|. includes cantributians fran bath AV and PV, anlythe Tother data will be presented.
the cream filling made with PHR! shaebenmp was slightly higherthan the aontrol throughout most of the study Fig. 1!. However,except far the initial period, bath fluctuated at fairly lowlevels as cclnparmi to high~ity crude sogrbe m oils, whichwill gently have a Totax value of less than 3; far crudesaybean sunflower oil, the value is generally less than 5 �5! .The differences in Retax between the eMperinnntal and oontrols-edwich cps were nonsignificant far bath the cookie andcream layers o
W 'es. Totax values far the cnntrolcocikies were Myher than the exparinerrtal cookies at 2 and 8~hs; and lower at 4 and 6 menthe Fig. 2!. 'ihe diffemmcmsin Tatax far butter cnuxh aoaldes were mnsignificant. Tbtozvalues were acceptable, since far the most part, the valueswere under 5.
higher than the cxmtrols with a fair bit of scatter, but thedifferences germra3.ly decreased with time Fig. 3!. By the endof the study the differenaes were slight. Also, except far 0and 6.5 n mths, the Tatax values far PHR! snack crackers showedgood stability, since the values were less than 5.differences in Totax far snack crackers were significant.However, by the end of the study 8.5 marrths! the Tatax valueswere essentially the sane. Also, with the PV test, there was rmsignificant dif fere'.

223
Coolde, control
Coolda, fish oil
Cream, control
Cream, fish oil
0 1 2 3 4 5 6 ? 8 9 $0
Time months!
Fig. 1 - The effect of time on rancidity of sandwich cookies
10 Cooide, controlCoolde, Ssh oil
7 6 4 3 0 0 1 2 3 4 5 6 7 8 9 10Time months!
Fig. 2 - The effect of time on rancidity of butter crunch cookies

224 10 Cookfe, coAlfQICoolie, fish oil
7 6
! 3 0 0 1 2 3 4 5 6 7 8 9 10Time months!
Fig. 3 - The effect of time on rancidity of snack crackers
Cockle, coreol
Cookie, Ash oil
6
4 3
0 0 1 2 3 4 5 6 7 8 9 i0Time months!
Fig. 4- The effect of time on rancidity of exbuded snacks

225
fr 'ed extruded snacks. HRK! deep-fried mctxuded snacks hadhigher initial Totax, but by the 6 ~ 5 @anth, the Tobm was lowerthan the cxmtrol Fig. 4!. %he data far the 2nd mph wasmissixry, ~~fare a dashed line was used to cnmect the 0 marrthand the 4th mph. Both fluctuated at fairly low levels. With~x, AM~ was no significant differeme bedew' PHK! and thecxmtrol extrudaxi snacks.
Data fnm the taste panels indicate that there are nosignificant differermes between PHR! Moztening cookies, snacksand deep fried extruded snaclcs; and theme made with acaxtzol PHOOshortening except far the butter crunch cookies at the 2nd@anth, and snack craclMrs at 0 and the 1st amah.! Far the mostpart, differetmes hebemn the pvxlucM decreased with increasingshelf-life.
No significant difference far Jotax was faund when PHN!kI, . aa
were ~mrai to similar items made with PHVO shca~nirag exceptthe AV and Tabs of snack craclmrs, and ZIotax of sandwichcookies! . Since there was little dif fence between thecacidative stability of the PHC! cookies, craclcers, and deep-
used in cookie, craclMr, and deep-fried extnxled snackformolatians with>Mt cxxxoarns about rancidity.
'HM.se results aha~1 that there was little differeme betweenthe axidative stability of the fish oil cookies and crackers anticontrols, therefare hydrogenated menhaden fish oil may be usedin cookie, cracker, arxi deep-fried extm9ed snack farmlatianswithoUt cancerns about ~mdity.

226
1. MAC. 1980. PeraÃide Value. In "Official Methods oftheABAC," 13th ed. Associatian of Official AnalyticalChemists, Arlingtan, VA.
2. AOCS. 1986. Bromide Value. Official Rettmds of the AOCS, Od8-53, 14th ed., American Oil Chanista' Society,Arlmybm, VA.
3. Bimbo, A.P. 1989. Fish oils: past and pjresent food uses. J.Am. Oil Chah. Soc. 66:1717-1726.
4. Bimbo, A.P., 1990. In the USA. Oils and Fats XotAml. 4:46-49.
5. Bimbo, A.P., and CrevtNm, J.B. 1991. Fish oils: procxmssingh~and crude oil. Znfofish 6:20-25.
6. Bimbo, A.P., and Cm~, J.B. 1992. Marine oils: fishingfor industrial uses. Inform 3:988-1001.
7. Hsieh, T.C., William, S.S., Vej<Lphan, W. and Meyers, S.P.
mehaden fish ' ! oil. J. Am. OilChem. Soc. 66:114-117.
Bulletin, Internatianal Associatian of Fish Meal5hnufaaha~. No. 8. Potters Bar, England.
9. Jahanssan, G. and Persmark, V. 1971. Evaluation andI redictian of palm ail quality. Oil Palm News 3:2-22.
~xmnds cxxrtributing characterizirxy fish flavors infish oils. J. Am. Oil Chem. Sac. 66:953-960.
11. Ke, P.J. and Wayeamda, A.D. 1978. A titrimetricxnethod fardetenaiaatim of free fatty acids in tis:mes and lipidswith ternary aolverrts and i~resol purple indicator.Analytica ~ca Acta 99:387 - 391.
12. Li Hsieh, Y.T. and Begenstein, J.M. 1991. Factor affectingquality of fish oil mayannaise. J. Food Sci. 56:1298-1307.

227
13. Li Hsieh, Y.T. and Re9enstein, J.M. 1992. Storage stabilityof fish oil, soy oil, and aarn oil mayannaises asxmnasurai by varies chenLcal indices. J. Aquatic FoodProd. Sech. 1:97-106.
14. Pigott, G.M. and Tuckisa, B.W. 1987. Science apses newharizcns far marine lipids in human mxtritian. FoodReview International 3:105-138.
SnYderr J.M., >kmnts, T.L. r and Holloway, R.K. 1991. Ananalysis schene far estimation of cruchn oil quality. J.Am. Oil Chan. Soc. 68:285 -288.
16. Stansby, M.E. 1990.Reinhold, New Yark.
17. Swern, D. M.! .1982. l 's Oi Fatducts, 4th ed. 315-324. John Wiley 6 Sans, New York.
18. Yu, T.C-, Day, E.A. and Sinnhuber, R.O. 1961. Alxtcuddaticmof fish oils. I. Xdentificatian of volatile
WJ. Pood Sci. 26:192-197.

228
EFFECTS OF SODIUM LACTATE AND POTASSIUM LACTATE ON COLOR, PH, ANDBACTERIA COUNTS OF TILAPIA HELD IN OVERWRAPPING, VACUUM SKIN
PACKAGING, AND MODIFIED ATMOSPHERES
Y.W. Huang' and C.Y. Huang''Department of Food Science & Technology
University of GeorgiaAthens, GA 30602-7610, USA
and
'Department of Food ProcessingNational I-Lan Institute of Agriculture & Technology
I-Lan, Taiwan, ROC
Sodium or potassium lactate, a salt of lactic acid, is a Generally Regarded As Safe GRAS!chemical. It is often used in bakery products including biscuits, cakes and confectionery to keep themmoist and give them a soft, crumbly texture, and in cheese to enhance the action of antioxidants. Itis also used in jam and marmalade, and margarine to regulate the acidity. In recent years, sodiumhctate has been used in meat products as a fiavor enhancer and an antimicrobial agent �!, However,due to the Sct that consumers have a trend to reduce the sodium intake, potassium lactate has beenused to partially substitute sodium salt.
Previous studies indicated that sodium lactate inhibited microbial growth and prolong the shelflife of meat products, Duxbury �! reported that beef roast injected with sodium lactate resulted inincreased shelf life of the roasts. Bacterial growth was inhibited and the microflora came to bedominated by Lecobm~Hu species. Chirife and Fontan �! stated that sodium lactate has been shownto decrease the water activity sufBciently to inhibit bacterial growth. de Witt and Rombouts �!reported that the antimicrobial efFects of sodium lactate may due to the increased permeability ofcellular membranes for lactate ion at a high pH. However, feedback inhibition by lactate wasp pM h I ' f ' ' r rl r ' p r i I ~r di rrrmd by ~Cl ridium b~~liuum �!
Little information regarding the effect of sodium lactate or potassium lactate on fisheryproducts was available. WiHiams and Rodrick �0! reported that sodium lactate functioned to retardmicrobial growth, and stabilize color and odor characteristics in the skinned catfish fillets. Totalaerobic plate counts of cod fillets were also big reduced when 12/o of sodium lactate solution wasused to immerse the fiilets for 2 min �!. However, no study of sotlium lactate or a mixture of sodiumand potassium lactates on tilipia has been made. In order to extending the shelf life of fiesh productat the retail level, the objectives of this study were to determine the reduction of microbialpopulations on tilapia fillet treated with sodium lactate or a mixture of sodium and potassium lactates

229
held in different packaging system, and to evaluate the dFect of treatments on pH, Torrymeter readingand color changes during re&igerated storage,
MATERIALS AND METHODS
Tilapia Qr~hromis spp.!, purchased &om the Delkab Farmers Market Decatur, GA!. The6sh were headed, gutted and fiileted and then transported on ice to the University of Georgia, Athens,GA. The tilapia fillets were treated with 8O/o sodium lactate or a mixture of 4/o sodium lactate and4/o potassium lactate solutions for 2 min.
Treatments
All treated fillets were packaged by either overwrapping with polyvinylidene films Saranwrap, oxygen transmission rate: 5 cc/m'/24 hr/atm at 20'C and 43'/o RH!, or vacuum-skin packagingwith low density polyethylene 6lms Surlyn, oxygen tnuumission rate: 930 cc/m~/24 hr/atm at 23'Cand 75'/o RH! using a Trigon Intact RM 331 Mark III Mini Intact machine Trigon Packaging Corp.,Redmond, WA!, or modified atmosphere IMLckaging with 70/o CO, and 30/o N~. Packaged 6sh werestored at a 4'C walk-in cooler for 16 days. Three packages of each treatment were randomlyremoved &om cooler at a 4-day interval for determination of pH, color values L, "a", "b"!,Torrymeter readings and microbial counts.
Microbi lo 'c Ev ti n
A 5x5 cm section of fillet was collected by using a sterilized blade. The sections were thenplaced in stomacher bags with 100 ml of 0.1/o peptone buffer solution Bacto! and stomached for2 min by a Stomacher Seward model 400, London, England!. The aliquots of proper dilution wereplated onto plate count agar and incubated at 20 C for 4 days to enumerate a to% psychrotrophicbacterial count 9!. The aliquots were also plated onto trypticase peptone glucose yeast extract agar TPGY! and incubated at 20'C for 4 days to enumerate total anaerobic plate counts 9!. The BBLGasPak anaerobic chamber with BBL GasPak" Co, gas packs Becton Dickinsin MicrobiologySystems, Boston, MA! were used to create an anaerobic environment for incubation.
Surface H Me r nt
Triplicate pH readings were taken &om the surface of each sample fish by using a FisherScientific probe No. 13-620-286! and a Corning pH meter model Y140, Corning Inc., NY, NY!.
The color of fish skin surface was measured prior to removal of the core sample by using aColormeter Minolta CR-200, Osaka, Japan!. Hunter color values of L lightness!, "a" "+":redness;"-":greenness! and "b" "+":yellowness; "-":blueness! were recorded. Triplicate measurements weretaken &om each fish.

230
T eter readin s
Six spots of fillet were measured using a Torrymeter gr Torry Station, Scotland, UK!. Thereading ranges &om 1 to 16.
Statistical analyses �! were performed on pH, color values, Torrymeter readings andmicrobiological data by means of PC SAS. The Duncan's multiple range test was used to determineany significant differences among samples &om fish with different treatments.
RESULTS AND DISCUSSION
treatment and acka 'n stern on hr hic bacterial o h n tila iaEffects f 1
The same growth pattern of anaerobic bacteria as psychrotrophic bacteria was found in tilapia Table2!. Modified atmosphere packaging did not promote the growth of anaerobic bacteria on lactatestreated tilapia.
m t n rfce H f'1 iaasaffEff flact stem
Both lactates treatment significantly reduced the initial pH on tilapia skin surface and thiseffect last till day 8 Table 3!. On day 12, no significant difference on pH among samples was foundexcept the MAP samples. This was because that all the samples were spoiled except the MAP ones.The absorption of carbon dioxide by the fish was another factor to cause the lower pH value.
Effects oflactat s treatment an cka n t m on color oftila ia fil
No clear difference on Hunter color values of all samples was found regardless of sodiumlactate treatment and packaging system Tables 4, 5, and 6!. Results implied that neither lactatestreatment nor packaging system had no effect on Hunter color values of tilapia fillets,
On day 8, control samples and overwrapped samples treated with either 8/o sodium lactateor the mixture of 4/o sodium lactate and 4'fo potassium lactate exhibited obvious spoilage, whilemodified atmospheres packaged ones had significantly lower bacterial counts Table 1!, Vacuum skinpackaged fillets treated either sodium lactate or the mixture exhibited an onset of spoilage. Nosignificant differences between vaannn skin packaged samples or between MAP samples were foundregardless of chemical treatment. Results indicated that 8/o sodium lactate had the same effect as themixture of sodium lactate and potassium lactate. Modified atmosphere packaging significantlyretarded microbial growth on tilapia and prolong the shelf life for two times,

231
Psychrotrophic bacteria count gogCFU/cm'! of tilapia as affected by lactatestreatment and packaging system at 4'C
Table l.
8% sodium lactateDay ofstorage
control
OW VSP MAP OW VSP MAP
a,b,c Means in a column followed by the same letter are not significantly different at level of 0.05
Total anaerobic bacteria count logCFU/cm ! of tilapia as affected by lactatestreatment and packaging system at 4'C
Table 2.
Day ofstorage
8% sodium factatcontrol mixture
OW VSP MAP OW VSP MAP
2.64a 2.64a 2.64a 2.64a
5.18a 4.91ab 4.02c 2.71d
8.82a 8.13b 7.64c 3.25e
10.26a 9.85ab 9.68ab 4.56c
6,06a
a,b,c,d,e,f Means in a column followed by the same letter are not significantly different at levelof 0.05
Table 3. Surface pH of tilapia on skin side as affected by lactates treatment and packagingsystem at 4'C
Day ofstorage
mixturecontrol 8% sodium lactate
OW VSP MAPOW VSP MAP
6.78a 6.43b 6.43b 6.43b
6.60a 6.46ab 6.47ab 6.29b
6.75a 6.44b 6.33b 6.33b
6.95ab 7.11a 6.78abcd 6.50cd
6.27a
a,b,c,d Means in a column followed by the same letter are not significantly different at level of 0.05
0
4 8 1216
0
4 8 1216
0
4 8 1216
2.69a
5.55a
8.82a
9.15a
2.69a 2,69a 2.69a
4.98ab 4.60bc 2.86d
8.13b 7.20c 3.18d
9.09a 8.53b 4.63c
6.24a
2.69a 2.69a 2.69a
4.39bc 3.86c 2.59d
8.00b 6.95c 2.46e
9.26a 8.12b 5.23c
5.93a
2.64a 2.64a 2,64a
4.25bc 3.80c 2.59d
8,10b 7.17d 2.73f
9.37ab 8.81b 4.92c
6.64a
6.46b 6.46b 6.46b
6.39b 6.49ab 6.34b
6.51b 6.42b 6.42b
6.84abc 6.60bcd 6.36d
6,34a

232
Hunter L values of tilapia on skin side as afFected by lactates treatment and packagingsystem at 4'C
Table 4.
control 8/o sodium lactate mixtureDay ofstorage
OW VSP MAP OW VSP MAP
52.72a 53.09a 53.09a 53.09a54.03ab 53.30ab 52.98ab 56,63 a52.98a 55.35a 53.77a 53.14a
55.34abc 58.36a 53.31bc 55.28abc57.74a 57.73a 49,95b 55.40a
a,b,c Means in a column foQowed by the same letter are not significantly diferent at level of 0.05
Hunter "a" values of tilapia on skin side as affected by lactates treatment andpackaging system at 4'C
Table 5.
control 8'/o sodium lactateDay ofstorage
mixture
OW VSP MAP OW VSP MAP
-0.86a
-0.89a
-1.75b
-2.26b
-1.67abc
-1.29a -1.29a -1.29a
-1.38abc -1.23abc -1.53bc-1.86b -1.58ab -1.24a-1.56bc -1.41ab -1.33ab-0.97a -1.09a -1.90c
a,b,c Means in a column followed by the same letter are not significantly difFerent at level of 0.05
Hunter "b" values of tilipia on skin side as a6ected by lactates treatment andpackaging system at 4'C
Table 6,
control 8/o sodium lactateDay ofstorage
mbrture
OW VSP MAPOW VSP MAP
-3,97a
-3.57b
-2.03ab
-0,7Ga
-1.69a
a,b,c Means in a column followed by the same letter are not significantly dHFerent at level of 0.05
0
4 8 1216
0
4 8 1216
0
4 8 1216
-4.95a
-2.20ab
-0.87a
-0.90a
-1.29a
-3.97a
-3,67b
-3.34bc
-2.58a
-2.72a
-3.97a
-1.74a
-2.49abc
-1.91a
-2,08a
50.96b 50.96b 50.95b
52.74b 52.36b 54.45ab52,81a 54.10a 54.54a
56.99ab 52.27c 54.98abc58.27a 51.87b 56.91a
-1.G4a -1.04a -1.04a
-1.25abc -1.00ab -1,67c
-1.67ab -1.62ab -1.54ab-1.71ab -1.17a -1.52ab-1.51abc -1.10ab -1.81bc
-3.97a -3.97a -3.97a
-3.53b -2.83ab -3.35ab
-2.25abc -3.81c -1.80ab
-0.98a -1.82a -1.53a
-1.40a -2.29a -1.42a

233
In summary, at 4'C the overwrapped tilipia fillet had shelf life of 6 days with any lactatetreatment. Significant sects on microbial growth were found for fish treated with the combinationof modified atmosphere packaging and dipping in the 8% sodium lactate solution or in the mbctureof 4% sodium lactate and 4% potassium lactate. Vacuum skin packaging had also shown a reductionfor psychrotrophic bacteria growth, while the overwrapping had only little efFect.
ACKNOWLEDGMENTS
The study was supported, in part, by the Georgia Agriculture Experiment Station, theUniversity of Georgia and the Southern Regional Aquaculture center, USDA.
ANONYMOUS. n.d. Use of PURASAL S sodium lactate! and PURASAL P potassium lactate!in seafood applications. PURAC America, Inc. Lincolnshire, IL.
CHIRIFE, J. AND FONTAN, C.F. 1980. Predication of water activity of aqueous solutions inconnection with intermediate moisture foods: experimental investigation of the a� loweringbehavior of sodium lactate and some related compounds. J. Food Sci. 45:802-804.
DE WIT, J.C. AND ROMBOUTS, F.M. 1990. Antimicrobial activity of sodium lactate. J.Microbial. 7:113-120.
DUXBURY, D.D. 1990. Sodium lactate extends shelf life, improve flavor of cooked beef. FoodProc. 4:46-47.
594%, M,R,, GLASS, K.A., AND DOYLE, M.P. 1989. Sodium lactate delays toxin productionby QI@4gm bghdingn in cook-in-bag turkey products. Applied. and Environ. Microbiol.55:2226-2229.
SAS. 1987. SAS/STAT Guide for Personal Computers, Version 6 ed. SAS Institute, Cary, NC,
AHHLH'.LA AMI YANG G. H91. G I pp I fbi ~911in broth, chicken, and beef. J. Food Prot. 54:283-287.
SIMPSON, S.J., VIMQ A.F., EGAN,F.,ANDROGERS,P.J. 1983. Lactate efHux stimulates ATPN 9 ' HHHHAHHHf HI ~ I H. G .M 91 I. 191»-92 4.
SPECK, ML. 1984. Compendium of the Methods for the Microbiological Examination of Foods,2nd ed. American Public Health Association, Washington, D.C.
WILLIAM, S.K. AND RODRICK, G.E. 1992. The e6'ects of sodium lactate on the naturalmicrofiora and color changes in &esh catfish fi11ets stored under simulated retail conditions.Ab~ IFT Annual Meeting, June 1-4, New Orleans, LA

234
EFFECTS OF TANMC ACID, GALLIC ACID, ANDPROPYL GALLATE ON STORAGE LIFE OF CATFISH
Y.W. Huang', I. Low', K.T. Chung, and C.Y. Huang'Department of Food Science 8|: technology
University of GeorgiaAthens, GA 30602-7610, USA
and
'Department of BiologyMemphis State University
Memphis, TN 38152, USAand
'Department of Food ProcessingNational I-Lan Institute of Agriculture and Technology
I-Lan, Taiwan, ROC
Tannins are p~ in many plant products including strawberries, grapes, apples andtea. The substances are categorized as phenolic compounds and can be divided into two categories:hydrolyzable and condensed tannins, The hydrolyzable tannins can be further divided into twoclasses: gailotannins and ellagitannins. Upon hydrolysis, the gallotannins yield gallic acid and glucosewhile ellagitannin yield ellagic acid and sucrose.
Tannic acid has been used as a clari6er for many years. It is also used to reine fats. Tannicacid is of amorphous powder, glistening scales, spongy masses. It exhibits yellow, white, and browncolors. It is usually odorless but occasionally with an faint odor, and with an astringent taste,
On the antimicrobial activity, tannic acid is inhibitory to many foodborne bacteria includingd ~ hdddhg92 E h ' I gjh, Llg ' ~ ~ gd II~ghl d~l & h'I gdh E d llgl ld Ehtannic acid is hydrolyzed, the ester bond is broken to release gallic acid and/or ellagic acid and theantimicrobial activity is lost �!,
The antimicrobial activities of tannin include inhibition of extracellular microbial enzymes,deprivation of the substrates required for microbial growth or direct action on microbial metabolismthrough inhibition of oxidative phosphorylation �!.
Propyl gallate is the Common name for n-propyl 3,4,5 trihydroxybenzoate. Blending BHAwith propyl gailate shows particularly ef6cacious in preserving flavor of oils and fats. Propyl gallatediscolors when in the presence of iron or copper, unless it is treated with citric acid to form citric acidmetal ion compounds to reduce discoloration.

235
Propyl gaHate is a GRAS antioxidant, white or ofF white powder. It is odorless and hasslightly bitter taste. Legal requirements for antioxidants and oxygen interceptors permitted in meatand poultry processing: to retard rancidity rendered animal fat or a combination of such fat andregular fat: 0.01/o, 0.02/o in combination. For dried Meats, 0.01/o based on total weight aresuggested �!.
The objectives of this study were to determine the efFects of tannic acid, gallic acid, andpropyl galhte on psychrotrophic plane count of overwrapped cat6sh 6Hets, and to evaluate the colorand surface pH changes during re&igerated storage for 12 days.
MATERIALS AND METHODS
~atf~ih
Fresh farmed cat6sh Qcttthttus ~unctatus were purchased t'rom the Dekalb Farmers Market,D~, Georgia. Fish were headed, eviscerated, skinned, and 6Heted at the market's facilities. ThefiHets were transported on ice to the Food Science Department, University of Georgia in Athens andthen the ice chests were placed in the 4'C walk-in cooler.
Tannic acid, gallic acid and propyl gaHate were purchased &om the Sigma Co. St. Louis,MO!. One percent tannic acid TA!, 14/o gallic acid, and 1/o propyl gaHate were used to treat fillets.One hundred pieces of 6Hets were randomly assigned to the treatments. These treatments had usedice to cool the temperature down close to 0 C to minimize fish spoilage. Fillets were dipped in theappropriate treatment solutions for 30 minutes and drained before packaging procedures.
k~kkk
The treated fillets were placed on polystyrene trays � Slet per tray! and overwrapped withSaran" PVDC, polyvinylidene chloride, oxygen transmission rate = 5 cc/m /24hr/atm, at 20'C, 43'/oR H.; Dow Chemical Co,, Indianapolis, IN!. AH packaged 6Hets were stored in a 4'C walk-in cooleruntil sampling days on day 0, 4, 8, and 12. Three packages of each sample were used for aH the tests.Mi r i 1 ' Anal i
A size of 25 cm', Rom the central portion of 6Hets, was obtained and individuallyhomogenized for 30 seconds with 100 ml sterile 0.1/o peptone solution in Fisher polyethylene samplebags using Seward England! Laboratory Blender Stomacher 400. Serial dilutions were Rrther madein 0.1'/o peptone, and suitable dilutions were plated by spreading 0.1 ml onto the surface of PlateCount Agar Difco, Detroit, MI!. Psychrotrophic plate counts were made in duplicate. Plates wereincubated for 48 hours at 20 C. The results were expressed as the log�of cfu/cm'.
Col rM r ments
The Hunter L, "a", "b" were measured by using a Chroma Meter CR200 Minolta CameraLtdka Osaka, Japan!. The value L measures lightness which range Rom 0 to 100; "a" measureschromaticity where positive value indicating redness and negative value indicating greenness; while

236
positive value of "b" indicating yellowness and negative value indicating blueness. Colormeasurements were made with the packaging unremoved to avoid the effect of packaging material.Three random spots were measured and the average data were recorded.
OHHMSurface pH was measured using a Corning M140 pH meter Corning Medical k Scienti6c
In.'i~ents, Halstead Essex, England!. pH was measured on three random spots on each 611et andthe average reading was recorded.
A
Analysis of variance was performed on the data by means of PC SAS. The Duncan's multiplerange test was used to determine if any signi6cant difference among samples as affected by packagingmethod and different additive treatment.
RESULTS AND DISCUSSION
Table 1. Psychrotrophic plate counts log CPU/cm'! of overwrapped cat6sh 611ets as affected bydifferent additives during re&igerated storage
Control Tannic acidDay ofstorage
Gallic acid Propyl gallate
4.45�.10!a 4.23{0.24!a
6.94�.14!a 6.95�.5+a
4.10�.71!a 3.74�.24!a
6.32�.57!a 5.49�.12!b
8.41�.13!a 8.51�.30!a 8.14�.09!a 7.54�,33!b
8.70�.11!a 8.56�.15! la8.79�.21!a 8.65�.37!a12
Means in a row with the same letter are not signi6cantly different at p=0.05 n=3!l
The only signi6cant difference in psychrotrophic plate count on Day 4 was displayed by thesample treated with propyl gallate Table 1!. However, no significant different difference amongsamples were found at the end of 12 days storage. Looking at the pH changes, samples treated withgallic acid and tannic acid were found to have signi6cant lower pH than control and propyl gallatetreated samples Table 2!. There were no signi6cant difference between propyl gallate treatedsamples and control.

237
Table 2. Surface pH of overwrapped cat6sh as affected by different additives during re&igeratedstorage
Tannic acid Gallic acid PropylgaQateDay of Controlstorage
6.56�.16!a 5,66�.25!b 5,05�.20!c 6.70�.25!a
6.83�.08!a 6,39�.14!b 6.02�.12!c 6.45�.12!b
6.82�.08!a 6.89�,77!a 6.41�.11!a 6.60�.16!a
6.97�.14!b 6.79�.04!b 6.70�.26!b 7.75�.14!a12
Means in a row with the same letter are not signiflcantly different at p=0.05 n=3!
Table 3, Hunter L value of overwrapped catflsh as affected by different additives during re&igeratedstorage
Day of Controlstorage
Tannic acid Gallic acid Propyl gallate
55.12�.84!c 56.38�.12!c 69.46�.89!a 62.20�.63!b
56.38�.12!c 65.43�.46!a 61.68�.27!b 59.87�.24!bc
55.42�.56!b 60.38�.51!a 61.27�.47!a 59.62�.00!a
58.45�.89!a 59.85�.49!a 57.80�.73!a 57.27�.20!a12
a,b,cMeans in a row with the same letter are not signiflcantly different at p=0.05 n=3!
The color of the catflsh flllets turned lighter as observed with higher L values! with chemicaladditives treatment Table 3!. The flllets treated with tannic acid exhibited significant lower "a" Table 4! and higher "b" Table 5! values in overlapped samples, indicating that the treated sampleswere of green and yellow tinge as compared to the control samples. On the other hand, samplestreated with propyl gallate showed no signi6cant difference in "a" and "b" values as compared to thecontrols.

238
Table 4, Hunter "a" value of overwrapped catfish as affected by different additives duringre&igerated storage
Tannic acid Gallic acid Propyl gallateDay of Controlstorage
-1.43�.48!a -2.60�.37!b -1.88�.24!a -1.48�.18!a
-1.51�.24!a -2.20�.03!b -1.92�.20!a -1.68�,08!a
-1.49�.49!a -1.99�.57!a -2.16�,18!a -1.75�.18!a
-2.51�.17!a -2.14�.32!a -2.70�.34!a -2.35�.34!a12
a,b Means in a row with the same letter are not significantly different at pW.05 n=3!
Table 5. Hunter "b" value of overwrapped catfish as affected by different additives duringrefrigerated storage
Day of Controlstorage
Tannic acid Gallic acid Propyl gallate
-2.56�,62!b 0.15�.55!a -2.37�.97!b -3.24�.40!b
-2.09�,61!b 4.35�.35!8 -1.49�.73!b -1.74�.41!b
-0.48�.40!b 3.85�.40!a -0.02�.04!b -1.44�,46!b
-0,13�,41!bc 4.17�.74!a 1,60�.57!b -0.71�.57!c12
a,b,cMeans in a row with the same letter are not significantly different at p=0.05 n=3!
The psychrotrophic plate count of the water of the fish tank in Dekalb's Farmer Market! wasfound to be log 5 cfu/g which is higher than normal. Leung et al �! reported an initial psychrotrophicplate count of log 2.45 cfu/cm' on channel catfish harvested Som the Fisheries Research Unit, AuburnUniversity, Auburn, Alabama. Therefore, the initial psychrotrophic plate counts of catfish 611ets forthis study was higher, contributing to a shorter shelf-life, that is about 4 days. Color changes of 61letsas affected by chemical is undesirable for consumers' acceptance of the product. Therefore, propylgallate could be used without affecting the color changes of the 6llets.

239
In summary, fillets treated with propyl gallate had signi6cantly lower psychrotrophic platecounts on day 4 and 8 as compared to the control. pH of 611ets treated with tannic acid and gallicacid was significantly lower than that of control and 611et treated with propyl gallate, All treatedsamples had signifiamtly lighter than control, while samples treated with tannic acid had significantlyhigher "b" value yellowness! and higher "-a" value greenness! than other samples. In general, thepropyl gallate showed the potential to reduce the psychrotrophic bacteria counts on cat6sh fillet.However, Rrther studies on sensory evaluations have to be done in the Rture.
ACKNOWLEDGMENTS
This study was supported, in part, by the Georgia Agriculture Experiment Station, theUniversity of Georgia, and the Southern Regional Aquaculture Center, USDA.
REFERENCES
1, CHUNG, K.T., STEVENS, S.E., LIN, W.F., AND WEI, C.I. 1993, Growth inhibition ofselected food- borne bacteria by tannic acid, propyl gallate and related compounds.Letters in Appl. Micro. in press!
2. HUI, V.H. 1991. Data source book for food scientists and technologists. VCH Publishers,New Yqrk, NY.
3. LEUNG, C.K., HUANG, Y.W., AND EBQUUSON, M.A. 1992. Fate of L~i~riRlugdal ~ggg ggggggg g g gM I I g h%at 4'C. J. Food Prot, 55:728-730.
4. SCALBERT, A. 1991. Antimicrobial properties of tamlins. Phytochem. 30:3875-3883.

240
EXTENDING SHELF LIFE OF SEAFOODWITH ACETIC ACID
Y. Benja-arporn, S. Einarsson,and S.M. ConstantinidesDepartment of Food Science and Nutrition
Food Science and Nutrition Center,University of Rhode IslandWest Kingston, RI, 02892
The seafood producing and exporting nations of the world are continuing toexperience the need to ship by air fresh fish stored in ice. It is well known thatfish stored in that manner have a rather short shelf life depending on a number offactors that ultimately determine the quality and safety of the product. Onedefmition of shelflife is the length of time from the day of capture that freshseafood can safely be in the marketplace Regenstein and Regenstein, 1991!.There are many ways of preserving seafood, such as drying, salting, smoking,and freezing. However, most of those method alter the original fresh seafoodcharacteristics.
Acetic acid has been used for centuries as an acidulant in foods. Therefore,acetic acid is not subjected to many food law restrictions. In the U.S., acetic acidis considered GRAS. It has a more powerful degenerative effect on living cellsthan mineral acids with the same hydrogen ion concentration because of itsability to dissolve lipids. The undissociated form of acetic acid is able topenetrate through the cell membrane and enter the interior of the cell where itacts to denature proteins. Between pH 6 and 5, the action of the acetic acid onlydoubles Woolford, 1975!, whereas, the undissociated portion increases aboutseven fold in this range. A study conducted by Adams and Hall �988! providesconvincing support for the view that the undissociated part of acetic acid is theactive factor. A concentration of 1% and 3% acetic acid can provide a basicprotection against pathogenic microorganisms, especially Clostridia Anderson,1984!. Acetic acid is approved for use as a sanitizer on red meat carcasses Federal Register, 1982!. One logioreduction in count can be obtained fromproper sanitizing with acetic acid Anderson, 1984!. The effect of acetic acidwas studied on vacuum-packaged pork Mendonca, 1989!. Treatmentscontaining 3% acetic acid lowered the aerobic microbial counts and effectivelyinhibited Enterobacteriaceae. Dickson �992! has shown that acetic acid as asanitizing agent on beef tissue was independent of the level of initialcontamination with a consistent reduction in populations, irrespective of cellnumbers.
The object of this study focused on studying the effect of acetic acid on bothfilleted and dressed fish stored at refrigeration temperature for different periodsof time.

241
MATERIALS AND METHODS
All seafood were obtained from local seafood processing plants, SeafreshU.S.A. Inc., Narragansett, RI and Town Dock, Galilee, RI. The fish werebrought in as whole fish except for dogfish which were brought in as fillets orbacks. After the fish had been headed, bled, and gutted, they were washed anddrained and then dipped in various concentrations of acetic acid for a differentperiods of time. The fish were then stored in open plastic bags at refrigerationtemperature. The following analyses were conducted periodically for up to 3weeks.
a! Sample preparation: 11 g of fish were aseptically transferred to a sterileblender jar with 99 ml of 0.1% sterile peptone water and homogenized at a highspeed for 1 minute. This gave a 10 dilution. Serial dilutions of 10->, 10, and10 4 were prepared by using 0.1% peptone water.
b! Total Bacterial Count TBC!: TBC was conducted aerobically by usingplate count agar method according to Post �988!. Plate count agar Difco! wasprepared by homogenizing 23.5 g agar in 1000 ml of deionized water.
Duplicate samples of 1 ml and 0.1 ml of each dilution were-pipetted intosterilized and appropriately labeled petri dish. Twelve to 15 ml of cooled �4-46'C! plate count agar were poured into each plate. The sample and agarmedium were immediately mixed and then allowed to solidify. The petri disheswere inverted and incubated aerobically at 37'C for 48 hours. The total colonycounts were recorded as total bacterial counts or colony forining units per gram cfu/g!.
a! Trimethylamine TMA! was determined according to Woyewoda etal�986!. Twenty five g of comminuted fish and 50 ml of 7.5% Trichloroaceticacid TCA! were added to a small blender jar and blended well. The homogenatewas filtered through Whatman ¹2 filter paper and was kept in the freezer -20OC!before further analysis.
Aliquots � or 2 ml! of samples and water �-3 ml! was added to a cleanscrew-capped tube to bring the total volume to 4.0 ml for both standard andblank. 1.0, 2.0, and 3.0 ml of working standard solutions containing 10.0 ugTMA/ml were used. The blank contained 4.0 ml of water. One ml of 10%formaldehyde, 10 ml of dried toluene and 3 ml of 25% KOH were added to thetube respectively and the mixture was blended in a vortex mixer for 15 seconds.About 7 ml of toluene upper layer! was transferred to another tube containing0.3-0.4 g of anhydrous Na~SO4 and mixed with a vortex mixer again. Four ml ofthis toluene solution was transferred into a test tube containing 4 ml of 0.2%picric acid in toluene. The absorbance was measured in a Perkin Elmer Lamda4B Spectrophotometer at 410 nm. The result was expressed in mg TMA/100 g.

242
b! Total acidity was done in accordance to AOAC �990!. The fish samplewas comminuted and 5 g were weighed into a screwed-capped bottle and 100 mlof distilled water was added. The sample was blended well in a rotator for 30minutes and filtered through Whatman paper ¹4. Ten ml of the mixture was putinto a 250 ml Erlenmeyer flask and 100 ml of distilled water was added. Themixture was then swirled to mix. A few drops of phenolphthalein indicator wasadded, and the mixture was then titrated with 0.1 N NaOH to a persistent pinkcolor. The titer was recorded and calculated as %acidity.
c! pH determination: Twenty g of comminuted fish were measured directlywithout any addition of water according to the procedure of Woyewoda et al�986! by using the Fisher Accumet Model 910 pH meter.
Sensory evaluation were conducted after verifying the safety of the productby microbial counts and TMA. The nine points hedonic test according toMeilgaard et al �991! was used for treated dogfish that had been stored for up to9 days at 3-5'C compared to the control fresh fish!. All samples were deep friedin hot �85'C! corn oil for up to 4 minutes before they were served to the panel.Samples were evaluated for taste, texture, odor, appearance and generalacceptance and statisticaOy analyzed.
RESULTS AND DISCUSSION
The effect of acetic acid was tested on dogfish Squalus acanthias! fillets,dressed whiting Merlangius merlangus!, dressed butterfish Peprilustriuncathus! and squid Loligo vulgaris! mantles.
Table 1. Total bacterial count cfu/g! for acetic acid treated Dogfish fillets dippedfor 2 minutes in different concentrations of acetic acid and stored at 3-5 OC
B
ControlDays 2.5% 5% 10%
NA: Not analyzed*: Deteriorated, very high count
0 2 6 132036
2.5x 1021.7x1031.0x 1042.2x10 '3.0x10 '
NA
l.lxlG24.9xlG28.5x 102
2.5x1021.2x104NA
2.0x10'
3.0xl023.0x lot
1,4x 1021.0x 10223x10~
<104.0x10'
<104.0x10'6.0x 1025.5x102
<101.4x1026.0x10'
9.0xlOi4.0x 10i4.0x10'

243
Table 1 showed the total bacterial count cfu/g! for acetic acid treated dogfishfillets dipped for 2 minutes in different concentrations of acetic acid and stored at3-5'C for different periods of time. The untreated samples control! showed theexpected increased microbial population with time. By dipping the fillets in thedifferent concentrations of acetic acid, a significant decrease in the bacterialcount was brought about with increasing concentration of acetic acid. A 10%solution of acetic acid arrested significantly the growth of the initial bacterialpopulation.
Table 2. TMA mg TMA/100 g.! in acetic acid treated dogfish fillets, dipped for2 minutes in different concentrations of acetic acid and stored at 3-5 'C
Control 2.5%Days 10%
Table 2 shows the corresponding effect of acetic acid on the Trimethylamine TMA! production on the same samples. Although the TMA level of the controlsample rose to about 45 mg per 100 g sample, the treated samples developed avery insignificant level of TMA.
ln Table 3 the pH and the % acetic acid levels of the different treatments areshown. Again there was a rise in the pH for the control group, from pH 6.3 topH 8.2 over a period of 20 days at refrigeration temperature. On the other hand,the treated samples either maintained the pH level at about pH 6.0 or lowered itto about pH 5.0 for the 10% acetic acid treatment. This pH drop may not besubstantial enough to produce dramatic microbial inhibition, yet in conjunctionwith the undissociated portion of acetic acid apparently does induce someinhibition as seen in the previous tables. The absorbed acetic acid was about0.7% in the fillets and did not vary with time.
0 26
132036
0.61.11.93.1
30.445.5
0.80.90.91.11.52.1
0.70.70.70.60.90.9
0.40.80.80.81.41.7

244
Ta.ble 3. pH and acetic acid content %! in treated dogfish fillets, dipped for 2minutes in different concentrations of acetic acid and stored at 3-5 C
%A IDITYIN P ESControl 2.5% 5% 10%
pH %AA pH %AA pH %AA pH %AADays
NA: Not analyzed
It was of interest to examine the treated products organoleptically by a tastepanel. Table 4 shows that for the treated products at the 2 % acetic acidconcentration, there was little difference in the general acceptability score,however, that difference was significant if the 5% acetic acid treatment wascompared to the control fresh sample!. The general negative remark was theslightly sour taste of the heavily treated samples,
Table 4. Sensory evaluation of fresh dogfish fillets and fillets that were dippedin different concentrations of acetic acid and stored for 9 days at 3-5'C
Control� day! 2% 2 min. dip 5% 7 min. dip
7.56a+1.18
8.13a+0.83
7.13+0.64
6.88+2.17
7.69 +1.03
Taste
Texture
Odor
Appearance
Gen Accept.
Average values from 8 judges ~ standard deviations. Different upper case lettersrepresent statistical difference between means within the same row pc0.05!.
Value 1 - Dislike extremelyValue 9 - Like extremely
0 2 6132036
6.3 0.06.4 0.06.5 0.06.8 0.08.2 0.0NA NA
6.0 0.36.0 0.36.0 0.26.1 0.26.1 0.26.2 0.2
5.7 0.65.8 0.65.9 0.66.0 0.66.0 0.66.0 0.6
5.9'3ab+2.15
7.5 Pbg L20
6.31+1.49
6.88+1.64
6.94a+1.32
5.0 0.85.0 0.85.1 0.75.1 0.75.2 0.85.4 0.7
5 63ab+2 39
738ab~l 85
5.88+1.46
7.13+1.89
6.38ab+2.07

245
Dressed whiting was treated with acetic acid and both the bacterialpopulation and the TMA were determined. Table 5 shows the delay of bacterialgrowth as the concentration of acetic acid is increased. The 5% and 10% aceticacid gave the best results, limiting the bacterial population to about 10 and 102respectively in a period of 24 days at refrigeration temperature. The controlgroup deteriorated after six days of the storage. The TMA test Table 6!confirmed the above results.
Table 5. Total bacterial count cfu/g! for acetic acid treated whiting dressedfish! dipped for 3 minutes in different concentrations of acetic acid and stored at3-5 'C
IN AControl 3%Days 5% 10%
NA: Not analyzed~: Deteriorated, very high count
Table 6. TMA mg TMA/100 g.! in acetic acid treated dressed whiting, dippedfor 3 minutes in different concentrations of acetic acid and stared at 3-5 'C
~SOR AM DF TM IN ~ SDays Control 3% 5% 10%
NA: Not analyzed
0 24 6911
15
1924
0
9151924
3.5x 1048.6x104
8.0x 10⁵>6.5x 10⁶ '
>6.5x10 'NANA
NA
NA
0.41.3
38.9NANANA
3.0x10~9.5x10~1.1x10⁴
l. lx1 P
8.0x104.5x107.5x107.2x 106
NA
040.45.61.0.114.0NA
2.6x1 P9.3x1 P6.7x10~6.3x10~
1.0x102.1x1 P1.7x10~
8.0x 1 P7.5x 104
0.31.40.20.30.50.2
0.30.20,20.20.40.3
3.8x10>1.07x10~
<10<10
<10<10<10
3.5x1 P7.0x10~

246
Another species tested was dressed butterfish Table 7!. Table 8 also showsthe inhibitory effect of acetic acid on the bacterial growth and demonstrates thedramatic effect of the acid on squid mantles.
Table 7. Total bacterial count cfu/g! for acetic acid treated dressed butterfishdipped for 3 minutes in 5% of acetic acid and stored at 3-5 'C
~STM RDays Control 5%
IN A PL
NA: Not analyzed~: Deteriorated, very high count
Table 8. Total bacterial count cfu/g! for acetic acid treated on squid mantlesdipped for 3 minutes in 2% and 5% of acetic acid and stored at 3-5 'C
N AControlDays 5%
NA: Not analyzed
It is important to note that besides the inhibitory effect produced on thebacterial growth, the treated samples appeared clean, had less of a fishy odor,were free of blemishes, and no objectionable odor could be detected, However, afaint sour odor could be identified in the samples treated with higherconcentration of acetic acid.
0 814
18
0 61419
26
6.9x1031.6x101.3x107 '
NA
7.0x10>
2.6x10~NANA
NA
3.0x 1 P4.4x 1 P1.2xl045.2x 104
<10
<10<10<10
1.6x10
<10
<10<10<10<10

247
CONCLUSIONS
Low concentrations �-5%! acetic acid appeared to retard microbial growthin fish fillets and dressed fish when dipped in the acetic acid solution for a fewminutes. The TMA values remained very low throughout the storage period atrefrigeration temperature.
The process which can extend shelf life of fish for up to three weeksproduces a clean looking product, free of mucous, blood, etc. Using thistreatment on scombroids might be able to decrease the onset of histamineproduction in scombroid poisoning. The mild tartness which is oftenexperienced can be removed by dipping the fish in water before mealpreparations. Such an inexpensive process should allow temporary storage atrefrigeration temperature before transportation by air or other means.
ACKNOWLEDGMENTS
This research was partly supported by the New England FisheriesDevelopment Association, Inc., through a Saltonstall-Kennedy Grant from theNational Marine Fisheries Service. We are grateful for the fish supplied by SeaFresh U.S.A. Inc., Narragansett, RI; to Mr. Kevin Worthley and Mr. PaulHellund for their assistance in obtaining the fish. We are also thankful to Mr.Noah Clark of Town Dock, Galilee, RI for providing some of the species used.
REFERENCES
1 ADAMS, M.R., and C.J. HALL. 1988. Growth inhibition of food-bornepathogens by lactic and acetic acids and their mixtures. Intern. J. of FoodScience and Technology, 23: 287.
2 ANDERSON, R.E. 1984. Growth and corresponding elevation of tomatojuice pH by Bacillus coagulans, J of Food Science, 49: 647.
3 AOAC 1990. Official Methods of Analysis 15 th ed. Association of officialAnalytical Chemists, Arlington, Virginia.
4 DICKSON, J.S. 1992. Acetic acid action on beef tissue surfacescontamination with Salmonella ryphimurium. J. of Food Science, 57:297-301.
5 FEDERAL REGISTER. 1982. Rules and Regulations, 47: No 123, Part184.
6 MEILGAARD, M., V.C. GAIL, AND B.T. CARR.1991 SensoryEvaluation Techniques, 2 d ed. CRC Press, Inc Florida.

248
7 MENDONCA, A.F., R.A.MOLLINS, A.A. KK~, AND H.W.WALKER. 1989. Microbiological Chemical and Physical Changes in Freshvacuum-packaged pork treated with organic acids and salts. J. of FoodScience, 54: 18-21.
8 POST, F.J. 1988.. A laboratory manual for food microbiology andbiotechnology. Star Publishing Co., Belmont, CA.
9 REGENSTEIN, J. M., AND C. E. REGENSTEIN. 1991. Introduction tofish Technology. Van Nostrand Reinhold, N.Y.
10 WOOLFORD, M.K. 1975. Microbiological screening of the straight chainfatty acids C1-Cyp! as potential silage additives. J. of Food and Agriculture,26: 219-228.
11 WOYEWODA, A.D., S.J. SHAW, P.J. KE, AND B.G.BURNS. 1986.Recommended Laboratory Methods for Assessment of fish quality.Canadian Technical Reportof Fish andAquatic Science, No 1448, 35-40.

249
PRESERVATION OF GURRY HYDROLYSATES WITH THE PROPIONICACID FERMENTATION
M. Mahmoud and R. E. Levin
Department of Food Science, Agricultural ExperimentStation, University of Massachusetts, Amherst, MA 01002
When gurry hydrolysates are used as fertilizers,the reduction of their pH with a mineral acid such asphosphoric acid or sulfuric acid to facilitatepreservation significantly reduces the pH of the soiland therefore greatly restricts repeated application formany crops. Alternatively the use of an organic acidto reduce the pH has the advantage that lactic acid orpropionic acid are completely utilized by soilmicroorganisms with repeated application of thefertilizer to soils. The pH of the soil is therefore notwith the use of organic acids for the reduction of pH ofgurry hydrolysates ~ Propionic acid is a well recognizedmycostatic agent at acidic pH values and if produced byfermentation entails only the cost of glucose andinoculum preparation, and eliminates the handling ofconcentrated acids. Propionic acid bacteria convertglucose to propionic acid along with a smaller quantityof acetic acid according to the following equation �!
Alternatively, the propionic acid bacteria will convertlactic acid as an initial substrate to propionic acidand acetic acid according to the following equation �!:
3 CHSCHOHCOOH + CHSCH2COOH+1.2 CHBCOOH+12CO2+H20lactic acid propionic acid acetic acid
MATERIALS AND ME THDD S
Cod gurry consisting of heads, tails, and frameswas ground and hydrolyzed with 0.05% papain at 710C for15 min. with consant agitation. The temperature wasraised to 90~C for 5 min., the bone chips screened outand the temperature rapidly reduced to 30~C. In all
1.5 CSHy206 >1.8 5CHBCH2COOH+1.10 CH3COOH+0.95 CO2glucose propionic acid acetic acid

250
studies where absorbance at 600 nm was taken as adetermination of relative cell density, hydrolysate wascentrifuged at 10,000 g for 10 min, the pH reduced to4.0 with phosphoric acid, and then filter clarified andsterilized through 0.2m porosity membranes after theaddition of glucose and preservatives unless otherwisestated.
Unc3.arified cod hydrolysate was steam sterilizedin screw capped tubes �0 x 200 mm!. Appropriatevolumes of a sterile glucose stock solution 80g/120 ml,prepared with distilled water! were then added so as toyield glucose concentrations of 2.5%, 3.0%, 3.5%, and4.0% w/v! in a final volume of 20 ml. Cells ofPropionibacterium acidipropi onici ATCC 4875 wereinoculated into tubes containing 10 ml of MRS brothwhich were then incubated for 96 hr. The cell densityof ATCC culture 4875 was then determined with dark-phasemicroscopy with the use of a Petroff-Hausser bacteriacounting chamber. The cell density was then adjusted soas to yield 5 x 10⁶ cells/ml when 0.1 ml of culture wasadded to duplicate tubes containing 20 ml ofhydrolysate. The concentrations of glucose, propionicacid, and acetic acid were determined by highperformance liquid chromatography as previouslydescribed �! . All incubation was at 32~C unlessotherwise stated.
RESULTS AND DXSCUSSlOH
We first screened 15 cultures of Propionibacteri umfor their ability to grow in Lactobacilli MRS broth MRS! and in filter clarified cod gurry hydrolysatecontaining 3.0% glucose. Representative cultures anddata are given in Table 1. Cultures ATCC 4875 and CCM1860 yielded the lowest pH value in MRS broth pH 4.5!after 96 hr of incubation at 32OC Table 1!. With codhydrolysate, a pH of 4.0 was achieved only with cultureATCC 4875 after 96 hr of incubation. Culture ATCC 4875was therefore used in all further studies.
When 2.5% glucose was added to cod hydrolysate, 96hr were required to reduce the pH to 4.5 Fig. 1!. Afinal pH of 4.2 was achieved after 192 hr of incubationwith a propionic acid yield of 1.3%. Glucoseconcentrations of 3.0%, 3.5%, and 4.0% yielded similarferment, ation profiles. With 4.0% glucose an incubationtime of 96 hr was again required to reduce the pH to 4.5 Fig. 2!. The final pH after 192 hr of incubation was4.0 with a yield of 1.75% propionic acid. Although apropionic acid concentration over 1.0% at a pH of 4.0can be considered to result in a high level of

251
Table 1. pH reduction by strains ofPropi oni hacteri um 8 .
FINAL pHbCULTURE FINAL pHc
CCM 1857 P. freudenrei chii
subsp. freudenrei chi5 ' 4 4.8
P95 P. freudenreichii
subsp. shermanii5.0 5.3
P26 P. jensenii
P42 P. aci dipropioni ci
4.7 4.3
4.6
ATCC 4875 P. acidipropionici 4.5 4.0
CCM 1860 P. j ensenii 4.5 4.3
8InCubatiOn waS far 96 hr at 320'C.
MRS broth containing 3.0% glucose initial pH 5.9!.~Cod hydrolysate containing 3.0% glucose initial pH
6.8! .
7 4
Izo2IL'EUIL
zWo2K
0 40 24 48 72 96 120 144 168 192 216
HOURS
0 40 24 48 12 96 120 144 166 192 216
. HOURS
preservation, the prolonged period of incubation requiredto reduce the pH to 4.5 cannot be considered acceptablein terms of allowing the development of contaminantsduring the first 48 hr of incubation in non sterile
Fig. 1. Rates of glucoseutilization, propionicacid formation, aceticacid formation, and pHreduction in hydrolyzedcod gurry containing2.5% glucose
Fig. 2. Rates of glucoseutilization, propionicacid formation, aceticacid formation, and pHreduction in hydrolyzedcod gurry containing4.0% glucose.

252
hydrolysate as would be used by industry. This notablyslow fermentation is due to the well known slow growthof propionic acid bacteria and to the fact that themajority of propionic acid is produced after culturesreach a maximum cell population. The development ofcontaminants under similar conditions of fermentation innon sterile hydrolysate containing 4.0% glucose is shownin Figure 3. When a 20% inoculum v/v! was used so as toresult initially in 1 x 10~ colony forming units per mlof hydrolysate containing 4% glucose the ratio ofpropionibacteria to contaminants increased over 100-fold Fig. 4!. However, the time required to reduce the pH
101I 10e10'
+< 10ee10'
10'
10 10 1040 24 48 72 96 120 144 166 192 0 24 48 72 96
HOURS HOURS
to 4.5 was lowered only to 72 hr Fig. 5! . In contrast,the time required for Lactobacillus plantarum to reducethe pH to 4.5 with cod gurry hydrolysate containing 4.5%corn syrup is only 7 hr Fig. 6!.
Our major concern therefore, with respect to thepropionic acid fermenation of hydrolyzed gurry is theselective development of propionic acid resistantmicroorganisms. Recently, a commercial producer ofhydrolyzed gurry for use as fertilizer forwarded asample to us that contained an actively metabolizingyeast that resulted in the development of significantgas pressure inside the plastic container although
Fig. 3. Development ofCFU of P. aci dipropioni ci& contaminant s in codhydrolysate. Hydrolysatecontained 4.0% glucoseand was not sterilized.
Initial CFU/ml of P.propionici were 5 x 10⁶.
10eE
O z Z10e >
I-X 0 O
10'
Fig. 4. Developmentof CFU of P.
a ci di propi oni ci as20% inoculum and
contaminants in codgurry hydrolysate.Hydrolysate contained4.0% glucose.

253
10
8� E5
7 O 66 0
i-
X O2CCUJ
ZCL O.
30 6 12 18 24 72
HOURS
0 40 12 24 36 48 60 72 84 96
HOURS
Fig. 5. Rates of propionicacid and acetic acid
formation and pH reductionwith the use of a 20%
inoculum of P. acidi lacti ci .
Hydrolysate contained4.0% glucose and was notsterilized. An inoculumvolume of 20% v/v! was used.
Fig. 6. Lactic acidfermentation of
hydrolyzed gurrycontaining 4.5% cornsyrup by I. plantarum.
organoleptic spoilage did not occur. The commercialprocess involved the use of entrails at room temperaturefor proteolysis over a number of days followingacidification with phosphoric acid to a pH of 3.5 andthe addition of 0.2% propionic acid. The lack ofpasteurization apparently resulted in the selectivedevelopment and eventual dominance of a contaminatingyeast resistant to the level of propionic acid used. Wewere able to readily isolate this organism which wedesignated isolate PR-1 and found it to be ratherunique. Small well defined colonies 3 to 5 mm indiameter were produced on Orange Serum Agar plates Fig.7! whereas on Mycological agar and Tryptic Soy Agar containing 0.5% dextrose! giant colonies developedwhich completely filled the plate after 24 to 48 hr Fig. 8!. Static growth of isolate PR-1 in mediacontaining glucose results in extensive surface filmformation which characteristically rises about 1 cmabove the culture broth along the walls of the vessel.The organism is primariy oxidative but does producedetectable amounts of ethanol. Its morphologicalcharacteristics are quite unique in that it producescells with bipolar budding with multiple polar buds,particularly on acetate agar Fig. 9!. Ascospores arenot formed nor are pseudomycelium observed. The

254
yeast like organisms were assessed for their relativeresistance to various concentrations of propionicacid. Representative isolates and data are given inTable 3. Isolate PR-1 was clearly the most resistant Table 3!. It is of interest that S. cerevisiae
Table 3. Static growth of yeasts in filter clarifiedcod hydrolysate containing 4.0% glucose and varying
concentrations of propionic acid at pH 4.0.~ b
PERCENT PROPIONIC ACID
0.0% 0.1% 0.2% 0.3% 0.4% 0.5%Culture
8.6 9.1 2.7PR-1 0.50 0.38 0.00
Scerevisiae 8 0 6.6 4.1 0.31 0.00 0.00
D. hansenii 7.5 0.86 0.08 0.00 0.00 0.00
C. li pol yti ca 5 . 3
Z. priorianus 3.3
0.79 0.06 0.00 0.00 0.00
0.00 0.00 0.00
0.00 0.00 0.00
0.00 0.00 0.00
2.2 1.0
Z. fibuli ger 1. 3 0.22 0.00
H. saturni s 0. 44 0. 00 0.00
Incubation was at 320C for 72 hr..
bNumerical values are absorbance readings at 600 nm.
exhibited the next highest level of tolerance topropionic acid Table 3!. When 50 ml volumes of filterclarified and sterilized hydrolysate in tubes with noglucose added! containing increasing concentrations ofpropionic acid from 0 to 0.5% at a pH of 4.0 wereinoculated with isolate PR-1 and incubated statically, aconcentration of 0.5% propionic acid was required toinhibit the organism Fig. 10!. When this study wasrepeated with the addition of 4.0% glucose to tubes ofhydrolysate, growth was more rapid and 0.5% propionicacid was again required to inhibit growth Fig. 11! ~When isolate PR-1 was incubated with rotary agitation�00 rpm! in 200 ml baffled flasks containing 100 ml offilter clarified and sterilized hydrolysate to which4.0% glucose was added at a pH of 4.0, both 0.1% sodiumbenzoate and 0.1% potassium sorbate were notablyinhibitory Fig. 12! . With static incubation of isolate

255
Fig. 7. Colonies of yeast isolate PR-1 on Orange SerumAgar. Incubation was for 48 hr at 32~C.
Fig. 8. Giant colony of isolate PR-1 on Tryptic SoyAgar containing 0.5% glucose. Center of plate � mm! wasinoculated. Incubation was for 48 hr at 32 C.

256 Fig. 9. Dark-phase photomicrographs of isolate PR-1grown on acetate agar. x 1,400.
organism grows from 15 C to 450C which is an unusuallywide temperature range for a yeast. Among 36 carbonsources tested using the auxanographic plate techniqueonly glucose,. fructose, mannose, succinic acid, andglycerol were utilized. Neither disaccharides norpentose sugars were used, and the organism is neitherlipolytic nor proteolytic. Although nitrate is notutilized as a sole nitrogen source the organism is ableto readily utilize urea. The characteristics of theorganism are given in Table 2. A number of yeasts and
Table 2. Characterist,ics of yeast, isolate PR-1
Colony morphology: Small colonies on orange serumagar. Giant colonies on Mycological Agar and TrypticSoy Agar.
Film formation at surface of static growth media:Positive
Metabolism: Primarily oxidative with weak fermentation.
Morphology: Bipolar budding with multiple polar buds.No pseudomycelium.
Temperature range for growth: 15~C � 45 C .
Ascospore formation: Negative.
Carbon sources utilized of 36 tested: Glucose,fructose, mannose, succinic acid, & glycerol.Disaccharides and pentoses not utilized.
Nitrate utilized as a sole N source: Negative
Urea utilized as a sole N source: positive.
Lipase: Negat.ive
Protease: Negative

257
PR-1, in filter sterilized hydrolysate with no glucose!at pH 4.0, 0.1% K sorbate was notably inhibitory while0.1% Na benzoate was significantly less inhibitory Fig.13! .
10
E 1.0I 1.0a
8 LUO
0.01 0.010 48 86 144 182 240 288 0 24 48 72 86 120 144 168
HOURS HOURS
When L. plantarum was inoculated into tubes ofsteam sterilized whole hydrolysate containing 4.0%glucose neither 0.1% Na benzoate nor 0.1% K sorbateexerted an inhibitory effect on the resulting rate of pHdecline Fig. 14!. When the same study was performedwith P. aci di propi oni ci ATCC 4875, 0. 1% K sorbate hadno effect, whereas 0.1% Na benzoate significantlyincreased the rate of pH decline so as to yield a pH of4.5 in 48 hr compared to 77 hr for the control Fig.15!.
CONCLUSIONS
The propionic acid fermentation by itself is tooslow to prevent significant numbers of contaminants fromdeveloping when non sterile hydrolysates are inoculatedwith propionic acid bacteria. The lactic acidfermentation is rapid and can result in a pH of 4.5
Fig. 10. Growth of isolatePR-1 in filter clarifiedand sterilized cod gurryhydrolysate containingincreasing levels ofpropionic acid. Hydrolysate pH 4.0, 50 ml! contained
no added glucose, and wasincubated statically intubes.
Fig. 11. Growth ofisolate PR-1 in filter
clarified & sterilizedhydrolysate containingincreasing levels ofpropionic acid.Hydrolysate pH 4.0,50 ml! contained 4.0%glucose, and wasincubated staticallyin tubes.

258
10
Ec 1.08
O~ 0.1
30 10 18
10C
8
O 1.0
K0
m~ 0,1
0.01 0 12 24 36 48HOURS
Fig. 12. Growth of isolatePR-1 in filter clarified& sterilized cod gurryhydrolysate containing 0.1%Na benzoate or K sorbate.Hydrolysate �00 ml!, pH 4.0!contained 4.0% glucose & wasin 250 ml baffled flaskswhich were incuabted withrotary agitation �00 rpm!.
Fig. 14. Rates of pHreduction by L. plantarumin hydrolyzed cod gurrycontaining 4.0% glucose &0.1% Na benzoate or K
sorbate. Hydrolysate�0 ml in tubes! was steamsterilized. Inc.was static.
0.01 0 48 88 144 182 240 288HOURS
Fig. 13. Growth ofisolate PR-1 infilter clarified &sterilized cod gurryhydrolysate containing0.1% Na benzoate or0.1% K sorbate.Hydrolysate �0 mlin tubes, pH 4.0!contained no glucose.Incubation was static.
3 0 24 48 72 86 120HOURS
Fig. 15. Rates of pHreduction byP. aci di propf onici inhydrolyzed cod gurrycontaining 4.0% glucose
0.1% Na benzoate or K
sorbate. Hydrolysate�0 ml in tubes! wassteam sterilized. Inc.
was static.

259
LXTERATURE CITED
van Niel, C.B. 1928. The Propionic AcidBacteria. Haarlem, J. W. Boissevain andCo., 187 pp.
2. Douglas, H.C. and S.E. Gunter. 1946. Thetaxonomic position of Corynebacterium acne.J. Bacteriol. 52: 15-23.
Giurca, R. and R.E. Levin. 1993 ' Optimizationof the lactic acid fermentation ofhydrolyzed cod Gadus morhua ! gurry withcorn syrup as carbohydrate source. J. FoodBiochem.16: 277-289.
3.
being reached in 7 hr. If both a lactic acid bacteriumsuch as I. plantarum and a propionic acid bacteriumsuch as P. aci dipropi oni ci are used as inoculum plus3.0% to 4.0% glucose along with 0.1% K sorbate, a rapidreduction of pH will occur with preservation resultingfrom the presence of K sorbate at reduced pH!. Aslactic acid is formed, it will be slowly converted topropionic acid. At the end of the fermentation, about1.0% propionic acid will result so as to achieve anextremely high level of preservation in combination withthe 0.1% K sorbate.

260
CAPILLARY ZONE ELECTROPHORESIS OF FRESHWATER WHITEFISH
COREGOMJS CLUPEAFORMIS! SARCOPLASMIC PROTEINS DURINGMODIFIED ATMOSPHERE PACKAGING
Eileen L, LeBlanc, Zenia J. Hawrysh, N. Joan Turchinskyand Raynald J, LeBlanc'
Department of Food Science and NutritionUniversity of Alberta, Edmonton, AB CANADA T6G 2M8
and
HBT AGRA Limited
4810-93 Street, Edmonton, AB CANADA T6E 5M4
Demand for seafood �4! has increased primarily because of today's consumer interest in&eshness, convenience, taste, nutritional value, and potential health benefits related to the presenceof ~-3 fatty acids. The present trend in exports of either fresh or saltwater fish is toward increasedhigh quality, chilled product. Current industrial competitiveness can be improved with the applicationof advanced technology �! to help the congruent development of both fresh and saltwater fisheryresources. Of these advanced technologies, modified atmosphere packaging MAP! �! and shelf-lifeextension have been ranked as top Canadian priorities; of the Western Canadian freshwater fishspecies, industry has identified whitefish Coregonus clupeaformis! due to its abundance, quality, andsales value. It is widely accepted that if the high quality of this labile product could be extended, thenboth whitefish delivery to local markets, as well as exports to the United States, Europe and Asiacould be better developed, Conversely, a longer shelf-life might permit fish products to be sea orroad &eighted to closer markets thus saving the high cost of air freight. These considerations haveled to research on extension of the shelf-life of packaged fresh fish using MAP �, 4, 8, 23, 25, 27!or controlled atmosphere packaging technology CAP-TECH! �, 22!, the latter having beenoriginally developed for packaging of red meats �0, 11!. However, minimal work has been donewith these packaging technologies to assess improvement in the shelf-life of freshwater fish species�!, particularly those such as whitefish with a moderate-high fat content. To date, researchers �,4, 8, 25! have reported that MAP of fish results in a significant increase in shelf-life but its maximumstorage life may not have been attained because of insuflicient CO,. Under optimal conditions for redmeat �0!, a recent study �2! using CAP-TECH for medium microbiological quality snapper Chrysophyrs auratus! fillets gave a storage life of ca. four weeks at -1.0'C. Studies �0! of CAPof red meat at -1.5'C+0.5'C gave a storage life of >24 weeks due to the superior microbiologicalquality of the red meat. Moreover, other investigations 9, 20, 26! on the efficacy of MAP of fish,under variable packaging and storage conditions, have focused on spoilage microflora; however,important nonbacterial changes which influence resultant fish quality also occur during extendedstorage �3!. Some studies 8, 25! on sensory properties of MAP of stored fish have been flawed by
261
inappropriate sensory evaluation techniques �3, 29!; hence data on color, odor, flavor and texturemay not give a true indication of this most important quality index. There is a paucity of publishedreports on the composite sensory, physical, biochemical and microstructural attributes of stored, freshfish processed via MAP or CAP-TECH systems. Indeed, a systematic investigation of this type seemswarranted to identify which is the preferable system for commercial application.
Conventional electrophoresis and high performance liquid chromatography HPLC! methodsbased on sarcoplasmic protein SAR! profiles of raw and/ or cooked 6sh are limited in theirefFectiveness for routine quality control and storage change tests. However, capillary electrophoresis CE! �7! is now becoming an important technique for fast and efBcient separation, characterization,and quantitation of proteins. It ofFers a gentle, non-denaturing environment, making it a techniquethat is well suited to explore subtle difFerences in protein structures in their native state �2, 14!.Recent work by Chen et aL �! established potential capillary zone electrophoresis CZE! conditionsfor analysis of model proteins, serum, and complex milk proteins. LeBlanc et aI. �6! optimized aCZE method to analyze SAR for fish species identification and to detect changes in product duringfrozen storage. The purpose of the present work, a component of a major project that encompassessensory, physical, biochemical, microbiological, and microstructural assessments, was to apply theCZE method �6! to monitor changes in freshwater whitefish SAR during Aligal or CO, modifiedatmosphere packaging storage at -2 C for 21 days.
MATERIALS AND METHODS
R~For the study, whole white6sh Coregonus clupeafonnis! was obtained through Billingsgate Fish
Co. Limited, Head Office, Calgary, AB. Same day, landed, gutted, bled, iced whitefish from LakeWabamun were butterfly-filleted, packed appropriately to maintain premium grade quality andtransported from the Billingsgate plant in Edmonton to the Alberta Agriculture Food ProcessingDevelopment Centre, Leduc, AB. A Multivac packaijng machine Model M855E PC, KnudSimonsen Industries Limited, Rexdale, ON! with Winpak high barrier top and bottom 6hns ESXE1250 S - composition 0.48 mil PVDC coated polyester/2 mil EVA copolymer, APETXE-37550 S-15.0 mil polyester/PVDC/2.0 mil polyethylene, Winpak Ltd,, Winnipeg, MN! was used at the latterlocation for packaging the filiets. The respective forming and seal temperatures were 120'C and13 PC. The gas fiush time after evacuation was 7 s with i! Aligal certified mature �0.1% O~ 40.5%Ar, 49.4/o CO2! or ii! CO~ Canadian Liquid Air, Edmonton, AB! from individual cylinders. Thetop and bottom films had the following gas transmission rates: O~ 7.2 cm'/m /24 h, dry, 23'C andwater vapor, 6.0 g/m'/24 h, 90% RH, 37.8'C; O~ 5.5 cm'/m'/24 h, dry, 23'C and water vapor, 2.9g/m /24 h, 90'/o RH, 37.8'C. A Mocon Oxytran Model DL 200! was used to measure the O~transmission rate on empty but intact formed packages and gave average readings of 0.232cc/pkg/day under atmospheric conditions �0/o 02!, ambient temperature �2.5'C!, and 20/o RH.
Prior to p~jng, all fillet were prescreened using a portable pH meter with a surface electrodeand weighed on a Mettler balance to ensure an initial pH range of 6.8-7.0 and weights between 450-500 g. A total of 384 kg butterflied, skin-on whitefish fillets were randomly allocated into 2 groupsof 192 kg - Group 1 for MAP with the Aligal gas mixture with argon �1! and Group 2 for CO~modified CAP-TECH �0, 1 1! processing, White6sh fillets designated to each treatment Group were

262 randomly assigned to each of four different, evenly spaced storage intervals �, 7, 14, 21 days! with48 kg of whitefish fillets assigned to each of six rephcations per gas mixture X storage intervalcombination. Fillets ca, 500 g! were packed using the appropriate gas Aligal or CO/ treatmentwith an infiation volume of 1.5 L of gas mixture/0,5 kg �1! of whitefish fillets to give a residual 0,concentration of <0.5/o. All samples for each of the six replications were stored in a Ballywalk-in cooler Model 4884-11! at -2'C for the specified storage interval. Temperatures weremonitored in the cooler with two Delphi model 861 temperature loggers. Head space analysis wascamed out on each sampling day on four packages of each gas treatment/replication using a HewlettPackard gas chromatograph Model 5890A! equipped with a 6' Porapak Q column 80/100 mesh CO,air separation! and a 10' molecular sieve 13X column 45/60 mesh O~ N, separation!. Oventemperature was 40'C, helium carrier gas flow rate was 24 cc/min and the detector was thermalconductivity. The area under the peaks was measured using a Hewlett Packard Model 3390Aintegrator cahbrated with a Scotty I analyzed gas mix 4237 �.0032/o CO, 14.9992/o CO~, 4.5039/omethane, 7.000 O> + 2/o!.
Upon completion of these analyses at each specified storage interval Days 0, 7, 14, 21!, thepackages &om the various replications were transported in coolers to the Department of FoodScience and Nutrition, University of Alberta. Packages &om each replication were randomly assignedto the various sensory, physical, biochemical, microbiological, and microstructural analyses that wereto be done within the overall study of which this component was part of the protein assessment byCE.
pH was determined on dupficate samples of fish muscle &om each of the six replications of bothgas treatments at each storage interval according to the procedure of Woyewoda et al. �8!.Representative samples were cut into 2 cm' cubes &om each side of the fillet and 60 g of muscle washomogenized for 1 min in a Cuisinart Model RC1!. The walls of the food processor were scrapeddown after 30 s and the sample was placed into a 25 mL glass beaker. A Fisher Accumet pH meter Model 815MP! with a combination electrode standardized at pH 6.0 and 7.0 was inserted into thecenter of the sample and the pH value obtained.
Pr tion f AR for CE
Duplicate samples of fish fillets &om each of the six replications of both gas treatments at eachstorage interval were cut into 1 cm' pieces, mixed, and 50 g samples were homogenized in 50 mLcold double-distilled, deionized water using a Virtis S23 homogenizer. The samples were blendedat high speed for four 15-sec intervals with a 30-sec cooling interval between each 15-sec run. Thehomogenization container was continually cooled in an ice bath. The homogenates were kept coolon ice and weighed immediately into pre-chilled centrifuge tubes. The latter were ultracentrifugedat 45,000 X g for 30 min in a Beckman Model L-2 preparative ultracentrifuge with an SW 27 rotorat -5'C. The supernatant was used immediately for protein profile separation by CE.
Phosphate buffer of pH 7.4 was prepared by mixing appropriate amounts of 0.5M mono-, di-,and/or trisod'ajm phosphate. All builders were made with double-distilled, deionized water and Milli-Qtreated prior to filtering through a 0.22 pm disposable filter before use. Protein standards were

263
obtained &om Sigma Biochemicals as lyophilized powders. Protein standards were dissolved insample diluent bufFer containing 75 mM sodium chloride, 20 mM potassium phosphate, 0,01/osodium azide, pH 7.0 PBS!. Each protein concentration was between 0.3-1.0 mg/mL All fish SARsamples were diluted 1:10 in PBS, CZE was performed with a Beckman P/ACE System 2100controlled with a DELL 316 SX expanded computer and post-run data analysis was caned outwith Beckman System Gold Version 7.1 sofbvare Beckman Insttuments, Fullerton, CA!. A standarduntreated, fused siTica capillary of 27 cm length �0 cm to detector window! X 20 pm i.d. Bechnanpart no. 338475! was used with on-column UV absorbance detection with the P/ACE system set at200 nm with a 50 X 200 pm aperture in the P/ACE cartridge Beckman part no. 338462!. Thetemperature of the capillary during electrophoresis was programmed and maintained at 20'C. Theinlet was held at 10 kV and the samples were introduced by pressure injection for 30 s. Betweenruns, the capillary was sequentially ~lashed with two column volumes of 1.0 N sodium hydroxide andwater �.3 min high prem' rinsing each!, followed by reconditioning with 5-10 column volumes ofrun bufFer �.5-2,0 min high pressure rinsing!.
Pr t in nt tof SAR
Protein concentration of the extracted SAR was determined by the Lowry ef al. �8! method withBSA as a standard.
RESULTS AND DISCUSSION
IHHfl hFigure 1 shows that the pH of the fillets ranged &om 6.40+0.13 for the CO, treatment Day 7! to
6.66+0.17 for the Aligal Day 7!. The Aligal packaged fillets exhibited a significantly p<0.05! highermean pH during storage than that found for the CO, packaged fillets. This difference may reflect thelower per cent of CO, in the Aligal gas mature �9.5'/o!. In addition, the CO, treatment had asignificantly p<0.05! lower pH on Day 21 compared to that found on Day 7. These valuesdemonstrate the solubility of CO, and its concentration in this packaging treatment. Otherresearchers found similar pH ranges during storage for snapper �2!, sahnon �!, and swordfish steaks�5, 19! packaged in modified atmospheres that contained gases with 100/o, 90/o 70/o or 40/o CO2,The extent to which pH decreases is proportional to the concentration of CO, in the package, thebufFering capacity of the muscle, and the composition of the microbial flora �9!. An increase in pHindicates bacterial growth which results &om microbial deainination and the formation of basic aminecompounds such as ammonia and total volatile base nitrogen.
Electropherograrns of SAR extracts of replicate whitefish fillets &orn Day 0 are presented inFigure 2. The profiles of four representative extracts show the reproducibiTity of the optimized CZEmethod �6! in that all replicates give similar electropherograms and the ratios among the peaks arecomparable. The relative standard deviation R S.D.! of the migration time for each of the samplesanalyzed is <1 /o. Washing of the capillary between runs enhanced the reproducibility in conjunctionwith the other CZE operating variables used. It is noteworthy that the SAR profiles were obtamedusing an injection volume of ca. 2.5 nL and a imucimum abso*ance of 0.02 units at 200 nm. Peakelution occurred in ca. 5 minutes within a run time of <10 minutes. The electropherograms Fig. 2!

264
oO C!
CD
CVLA
CO
CDC9 OJ
CD CD

265
Fillet BFillet A R e produ cib ility
Fillet 0Fillet C
Minutes
Figure 2,
ID
CV
CO
Electropherogram pro61e reproducibiTity of four replicate whitefish Gllet sarcoplasmicprotein extracts at Day 0.

266
contain >15 well resolved peaks under these CZE conditions. As well, the use of a high NaClconcentration in the phosphate bufFer did not result in either a noisy electropherogram or poor UVdetection,
Figure 3 shows the SAR profiles of Atigal or CO, packaged white6sh fillets during modifiedatmosphere storage at -2'C for 21 days. Whitefish 611ets were of comparable initial quality as shownby the SAR profiles on Day 0. The Aligal packaged whitefish fillets show a decrease in the SARbetween 6 and 8 min. migration time for Days 7, 14, and 21. Conversely, the CO, packagedwhitefish fillets exhibit an increase in the SAR between 4.8 and 5.6 min. migration time for Days 14and 21. The electropherograms also show three peaks having similar ratios at ca. 4.8 min. migrationtime; a fourth peak becomes apparent at 6 min. migration time in the electropherograms for Days 14and 21. The major peak at 7,2 min. migration time is absent only in the Day 21 Aligalelectropherogram. It is of interest to note that the SAR profiles do not change substantially until Day14 for Aligal and Day 21 for CO,; however, there is a notable decrease by Day 21 in the number ofSAR peaks with either gas treatment. It seems likely that any of the degradative changes apparentare associated with bacterial activity and hydrolysis by the naturally occurring proteolytic enzymesof the muscle. These are retarded more efFectively by the CO, packaging treatment because of itsgreater effect on pH. The electropherograms Fig. 3! support the fact that fewer changesoumrred in the SAR profiles of the CO~ packaged fillets during storage thereby resulting in a higherquality product at Day 21.
Protein ntent of AR r
Figure 4 shows that there was no significant p<0.05! difference in protein content of the SARextracts &om the Aligal or CO, packaged whitefish 6llets during storage at -2'C for 21 days.Therefore, no apparent relationship can be made with the changes observed in the SARelectrophoregrams Fig. 3!,
CONCLUSION
The CZE method optimized for SAR profile analysis for species identification and determinationof changes in 6sh products during &oxen storage by LeBlanc et aL �6! was effectively used tomonitor changes in &esh Ahgal or CO, modified atmosphere packaged whitefish fillets during storageat -2'C for 21 days. The present results show that CZE gives very reproducible data and that changesin SAR were monitored quickly by this technique using nL of SAR extract and pL of buffer.Differences in the SAR pro61es of either the Aligal or CO, packaged whitefish fillets during storagewere detectable by CZE even though there was no significant p<0.05! difference in the proteincontent of the extracts determined by the Lowry �8! analysis. Fewer changes occurred in the SARprofiles of the CO, modified atmosphere packaged white6sh 611ets during storage and these findingsare supported by the decrease in pH found in the muscle for this treatment. CO~ packaging appearsto result in better quality product as shown by the CZE data, This advantageous CZE method maypotentially be used to monitor SAR pro61es for quality assessment of fiesh fish and the applicationof this approach is presently under investigation.

267
Day 0
Day 14
Day 21
4.0 4.8 5.6 6.4 7.2 8.0 4.0 4.8 5.6 6.4 7.2 8.0
Minutes
Electropherograms of sarcoplasmic protein profiles of Aligal or CO, modifiedatmosphere packaged whitefish fillets during storage at -2 C for 21 days.
Figure 3.
Aligal
Day 7
CO2

268
C!C!
C!
O Oo
O O
Q O OO CO N
/Ill/6LU! U1840ld
08
0 ~
0 ~CV
c8~ ~0Q 'v
ch0 es
c= '8
o. 5pg
a'ca t4
O QO
O gasC4
SeC
rh0
0as

269
REFERENCES
1. BARNETT, H.J., STONE, F.E., ROBERTS, G.C., Hunter, P.J., Nelson, R.W. and Kwok,J. 1982. A study on the use of a high concentration of CO, in a modified atmosphereto preserve &esh sahnon. Mar. Fish. Rev. 42�!: 7-11.
2. BOYLE, J.L., LINDSAY, R.C. and STUIBER, D,A. 1991. Adenine nucleotide degradationin modified atmosphere chill-stored &esh fish. J. Food Sci. 56: 1267-1270,
3. BREMNER, H.A. and STATHAM, J.A. 1987. Packaging in CO~ extends shelf-life ofscallops, Food Technol. Aust. 39: 177-179.
4. BRODY, A.L. 1989. Modified atmosphere packaging of seafoods. p. 59-65. In A.L. Brody ed.!, Controlled/modified atmosphere/vacuum packaging of foods. Food 4 NutritionPress,Inc., Trumbull, CT.
5. CHEN, F.A., KELLY, L., PALlVIIERI, R., BIEHLER, R. and SCHWARTZ, H. 1992. Useof high ionic strength burrs for the separation of proteins and peptides with capillaryelectrophoresis. J. Liq. Chromatogr. 15; 1143-1161.
6. DONNAN, D,C. and SIMPSON, K.E. 1991. Advanced technology for cost, quality andservice improvement in the Canadian fishing industry. Fisheries Council of Canada,Peat M«rwick Stevenson and Kellogg. Industry, Science and Technology of Canada,Ottawa ON K1A OH5, Technical Report T8, April 15, 1991.
7, ELWORTHY, L., NEW, E. and TORRIE, K. 1989. Emballage a atmosphere modifee.Direction des produits alimentaires. Industry, Science and Technology of Canada,Ottawa, ON K1A OH5, Technology Series No. 3, March 1989.
8. FEY, M.S. and REGENSTEIN, J.M. 1982. Extending shelf-life of &esh red hake andsalmon using CO,-O, modified atmosphere and potassium so*ate at 1'C. J. FoodSci. 47: 1048-1054.
9, GENIGEORGIS, C. 1985. Microbial and safety implications of the use of modifiedatmospheres to extend the storage life of mesh meat and fish. Int. J. Food Microbiol.1: 237-251.
10, GILL, C.O. 1986. The contol of microbial spoilage in mesh meats. In A.M. Pearson andT.R. Dutson eds.!, Adv. Meat Res. 2: 48-88, AVI Publishing Co. Inc., Westport,CT.
11. GILL, C.O., HARRISON, J.C.L. and PENNY, N. 1990. The storage life of chickencarcasses packaged under carbon dioxide. Int. J. Food Microbiol. 11: 151-157.

270
12. GROSSMAN, P.D., COLBURN, J.C., LAUER, H.H., NIELSEN, R.G., RIGGIN, R.M,,SITTAMPALAM, G.S. and RICIGWD, E,C. 1989. Application of free-solutioncapillary electrophoresis to the analytical scale separation of proteins and peptides.Anal. Chem. 61: 1186-1194.
13. IFT, 1981. Sensory evaluation guide for testing food and beverage products. SensoryEvaluation Division. Food Technol. 35: 50-59.
14. KARGER, B.L., COHEN, A.S. and GUTTMAN, A. 1989. Kgh performance capillaryelectrophoresis in the biological sciences. J. Chromatogr. 492: 585-614.
15. LANNELONGUE, M., FINNE, G., HANNA, M,O,, NICKEL SON H, R. andVANDERZANT, C. 19&2, Microbiological and chemical changes during storage ofswordfish Xiphias gladius! steaks in retail packages containing CO,-enrichedatmospheres. J. Food Prot. 45: 1197-1203.
16. LEBLANC, E.L., SINGH, S. and LEBLANC, R.J. 1993. Capillary zone electrophoresisof fish musde sarcoplasmic proteins. Paper ¹56, Session 8 Chemical Composition ofFoods, Institute of Food Technologists' Conference, 9-15 July 1993, Chicago, IL.
17. LI, S.F.Y. 1992, Capillary electrophoresis - principles, practices and applications, J,Chromatogr. Library Series, 23, Elsevier Scientific Pubhshers, Amsterdam.
18. LOWRY, O.H., ROSEBROUGH, N.J., PARR, A.L. and RANDALL, R.J. 1951. Proteinmeasurement with the folin phenol reagent. J. Biol. Chem. 193: 265-275.
19. OBERLI'.NDER, V., KANA, M.O., MIGET, R., VANDERZANT, C., and FINNE, G.1983. Storage characteristics of fresh swordfish steaks stored in carbon dioxide-enriched controlled fiow-through! atmospheres, J. Food Prot. 46: 434-440.
20. POST, L.S., LEE, D.A., SOLBERG, M., FURGANG, D., SPECCHIO, J. and G14QiAlVI,C. 1985. Development of botulinal toxin and sensory deterioration during storageof vacuum and modified atmosphere packaged fish fillet. J. Food Sci. 50: 990-996,
21. SCHVESTER, P. 1990. MAP of seafood: a new and critical analysis to evaluate itspotential. Conference Proceedings, Session A-3, Pack Alimentaire '90, InnovativeExpositions, Inc., Princeton, NJ.
22. SCOTT, D.N., FLETCHER, G.C. and HOGG, M.G. 1986. Storage of snapper fillets inmodified atmospheres at -1'C. Food Technol. Aust. 38:234-238.
23. STAMMEN, K., GERDES, D. and CAPORASO, F. 1990. Modified atmosphere packagingof seafood. CRC Crit. Rev. Food Sci. Nutr. 29:301-331.

271
24. STATISTICS CANADA. 1989. Catalogue 32-229, Annual, Supply k Services Canada,Ottawa, Ontario.
25. VILLEMUIK, G,, SIMARD, R.E. and PICARD, G. 1986. Bulk storage of cod fillets Gad'us morhtca! under carbon dioxide atmosphere. J. Food Sci. 51: 317-320,
26. WANG, M.Y. and OGRYDZIAK, D.M. 1986. Residual efFect of storage in an elevatedcarbon dioxide atmosphere on the microbial flora of rock cod Sebastes spp.!. Appl.Environ. Microbiol 4: 727-737.
27, WOYEWODA, A.D., BLIGH, E.G. and SHAW, S.J. 1984. Controlled and modifiedatmosphere storage of cod fillets. Can, Inst. Food Sci. Technol. J. 17: 24-27.
28. WOYEWODA, A.D., SHAW, S.J., KE, P.J. and BURNS, B.G. 1986. Recommendedlaboratory methods for assessment of fish quality. Canadian Technical Report ofFisheries and Aquatic Sciences No. 1448, Ministry of Supply and Services, Ottawa,ON,
29. YORK, R.K. 1989. Canadian fishey products - fish inspection and sensory evaluation. Can.Inst. Food Sci. Technol. J, 22: AT/441-444.

272
PROTEIN HYDROLYZATES FROM AQUATIC SPECIES
Fereidoon Shahid&, Xiao-Qing Han', Josef Synowiecki'and Ryssard Amarowics'
Departments of Biochemistry' and Chemistry'Memorial University of Newfoundland
St ~ John' s, NF Canada hlB 3X9
Enzymatic hydrolysis is carried out for improving nutritionaland/or functional properties of protein ingredients as well as toretard quality deterioration and off-flavour development. Theseproducts may be prepared from a variety of protein sourcesoriginating from plant, animal and fungi. Underutilized aquaticspecies as well as processing discards of muscle foods may also serveas raw materials for production of hydrolyzates Shahidi, 1993!.
Protein hydrolyzates may be used in a variety of foodformulations intended for hypoallergenic and immune-compromisedindividuals since peptides are involved in the initiation of theimmune response and in the process by which the body is able todifferentiate self from non-self Mills ~ +a ., 1992!. Their use ininfant foods and for patients with digestive tract' complications isalso commonplace. In fact short peptides are among the most potentpharmacologically active agents known. Furthermore, proteinhydrolyzates may be used as growth enhancing components for juvenilefish in aquaculture operations.
Amongst the aquatic species common to Newfoundland waters arecapelin MaIlotus villosus! and harp seal Phoca groenlsndica!.Capelin is a small silvery fish related to smelt which is foundabundantly in the offshore and inshore beaches of Newfoundland andLabrador in months of June and July. Spawning stocks consist of 3to 4 years old capelin. Female roe capelin is an important productin the Japanese market, referred to as "shishamo". However, male andspent capelin are generally dumped or are reduced to silage and meal.Small amounts of capelin is also used for production of cornedproducts, fish sauce and pet food. Harp seal carcasses are alsogenerally dumped or reduced to silage, although research from ourlaboratories has demonstrated that seal meat is superior to othertypes of meat with respect to its protein content, amino acidprofile, omega-3 fatty acid constituents as well as mineral andvitamin contents.
As part of an on-going research program in our laboratories forpreparation of value-added products from processing discards andunderutilized aquatic species Shahidi ~ ~,, 1990, 1991a; Shahidiand Synowiecki, 1991!, we have investigated production of proteinhydrolyzates from capelin and seal meat. Some characteristics of the

273
resultant protein hydrolyzates referred to as Biocapelin and Biosea-Lhave been studied and their potential applications in a variety offood formulations is being, evaluated.
PRODUCTION OF HYDROLYEATES
Production of protein hydrolyzates involves comminution of rawmaterial followed by their dissolution or suspension in water.Enzyme is added to the slurry and the reaction proceeds for 2 hoursto 1 week, depending on the activity of the enzymes employed as wellas other factors. After separation of solids, the aqueous layer isclarified and dehydrated Figure 1!. The process may includesterilization at different stages, if necessary.
Table 1 summarizes typical processing conditions forpreparation of hydrolyzates from processing discards andunderutilized species using selected enzymes. Typical yield ofprotein and proximate composition of Biocapelin and Biosea-L aregiven in Table 2. Although many factors affect the yield ofhydrolysis, the type of enzyme employed has a marked effect on thisand also on the characteristics of the final product.
A close scrutiny of the results presented in Table 2 indicatesthat hydrolyzates generally have a much lower lipid content thantheir original protein source, on a dry weight, basis. As hydrolysisproceeds, elaborate membrane system of the muscle cells tend to roundup and form insoluble vesicles, thus allowing the removal of membranestructural lipids. Therefore, based on highly unsaturated nature oflipid fatty acids from marine species, the resultant products areconsiderably more stable towards oxidative deterioration.
SOME CHAIACTERISTZCS OF HYDROLYZATES
The amino acid composition of Biocapelin produced by Alcalase-assisted hydrolysis was determined and compared with that of theoriginal capelin. Although sensitive amino acids such as methionineand tryptophan were affected, in general the nutritional value ofproteins in the hydrolyzate were reasonably well preserved. This iswell demonstrated by using an amino acid scoring procedure tocalculate protein efficiency ratio PER! values of the resultantproducts Lee ~ +., 1978!. Thus, the PER values of thehydrolyzates were 2.61-3.11 as compared with 2.86-3.25 for thestarting material. A similar observation was made when the resultsfor mechanically separated seal meat and Biosea-L were compared.Furthermore, all protein preparations so obtained had an ivory-whitecolour with Hunter L values ranging from 74.2 to 84.6.
The hydrolyzates so prepared had excellent fat absorption,water solubility and moisture absorption and whippabilitycharacteristics Shahidi ~ +., 1991b!. In addition, whenBiocapelin was added to meat model systems, a large reduction in theamount of drip water was noticed. Furthermore, Biocapelin hadexcellent ability in preventing cooking loss and development of

274
Figure 1. Scheme for preparation of protein hydrolysate fromaquatic species.

275
Table 1. Processing conditions for preparation of proteinhydrolyzates from aquatic species.
Typical protein recovery and composition ofhydrolyzates from capelin Biocapelin! and harp seal Biosea-L!.
Table 2.
Table 3. Selected amino acids and calculated PER valuesof capelin and Biocapelin.
'Anson units/100g protein for Alcalase and Neutrase and as 0 ofraw' material for papain.

276
Inhibitory effect % IE! of Biocapelin andBiosea-L against bleaching of JL-carotene inmodel systems.'
Table 5.
'Calculated as 100 B-A!/ C-A! where A - absorption of thecontrol sample, B - absorption of the sample containinghydrolyzate, and C absorption of the control sample priorto incubation.
Table 4. Effect of Biocapelin on cook yield enhancement andinhibition of oxidation over a 5-day refrigeratedstorage period �!.

277
rancuhty in meat model systems as summarized in Table 4. However, a study of the inhibitoryeffects of Biocapelin and Biosea-L against bleaching of 5-carotene in a Gcarotene/linoleate Miller, 1971! sysbm demonstrated that while the former always exhibited an inhibitory effect,the latter had oxidant activity when used at higher concentrations Table 5!.Chromatographic separation of the hydrolyzates indicated that while their antioxidant activitywas due to ninhydrin-positive components, proxidant components were ninhydrin-negative.Further studies towards structural identification of the biologically active components of thehydrolyzates are in progress.
ACKNOWLEDGEMENT S
We are grateful to the Department of Fisheries «nd Oceans and the Natural Sciencesand Engineering Research Gmncil of Canada for the award of a Subvention grant in support ofthe present work
REFERENCES
1. LEE, Y.B., J.G. ELLIOT, D.A. RICKANSRUD, and E.C. HAGBERG. 1978.Predicting protein efiiciency ratio by the chemical detetmuiation of connectivetissue content in meat. J. Food Sci, 43: 1359-1362.
2. MILLER, EE. 1971. A simplified method for the evaluation of antioxidants. J. Am.Oil Chem. Soc. 45: 91.
3. MILLS, E.N.C., MJ.C. ALCOCER, and M.R.A. MORGAN. 1992. Biochemicalinteractions of food-derived peptides. Trends Food Sci. Technol. 3: 64-68.
4. SHAHIDI, F. and J. SYNOWIECKI. 1991. Isolation and ctuu3cterization of nutrientsand value-added products &om snow crab Chinoecetes opilio! and shrimp Pandalus borealis! processing discards. J. Agric. Food Chem. 39: 1527-1532.
5. SHAHIDI, F., X.Q. HAN, J. SYNOWIECKI, and J. BALEKO. 199lb. Enzymaticmodification of marine proteins: l. Male and spent capelin. Presented at the1991 Atlantic Fisheries Technological Conference. Perch, Quebec.
6. SHAHIDI, F., M. NACZK, R.B. PEGG, and J. SYNOWIECKI. 1991a. Chemicalcomposition and nutritional value of processing discards of cod Gadustnorhua! Food Chem. 42: 145-153.
7. SHAHIDI, F,, J. SYNOWIECKI, and M. NACZK. 1990. Seal meat - A potentialsource of muse& food: Osmical ompositusi, essential amino acids and colourcharacteristics. Can. Inst. Food Sci. Technol. J. 23: 137-139,
8. SEVBIIDI, F. 1993. Proteins &m seafood processing discards. In Seafood Proteins.ed. Sikorski, Z.E., Pan, B.S. and Shahidi, F. Chapman and Hall, New YorkIn press.

278
AN ECONOMIC ANALYSIS OF THE
SOUTHEAST U.S. SEAFOOD PROCESSING INDUSTRY, 1973-90'
Walter R. Keithly, Jr. and Kenneth J. Roberts*Coastal Fisheries Institute
Louisiana State UniversityBaton Rouge, Louisiana
and
Office of Sea Grant Development andLouisiana Agricultural Center
A variety of species are harvested in the Southeast UnitedStates, i.e., the coastal states of North Carolina through Texas.These regional catches, together with domestic and foreignimports, provide the raw material product needed to support aprocessing sector valued at $1.4 billion includes only theproduction of edible products! in 1990. This equates to about 20Xof the $7.0 billion national industry edible.!.
Despite the size of the Southeast processing industry andits importance to many of the local communities, economicinformation concerning its structure, conduct, and performance isnot readily available. The purpose of this paper is to provide abrief economic analysis of the Southeast edible seafood processingsector. The analysis covers the 1973-90 period and is based oninformation collected and maintained by the National MarineFisheries Service, Fisheries Statistics Division. The informationpresented is derived from a final report by Keithly et al. �!,and the reader is referred to that report for a more detailedanalysis which examines processing, at a much more disaggregatedand area specific level.
In order to achieve the stated objective, the paper proceedsas follows. First, some general industry characteristics arepresented followed by a presentation of issues related to thestructure, conduct, and performance within the industry. Then,historical Southeast edible seafood landings are briefly reviewed.The paper concludes with an examination of processing activitiesin relation to landings.

279
RESULTS
GENERAL INDUSTRY CHARACTERISTICS
As indicated in Table 1, the reported number of Southeast,edible seafood processors clearly increased when evaluated inthree-year intervals. In 1973-75, for example, about 500 firmswere engaged in seafood processing on an annual basis and thisnumber increased to 623 during 1988-90. These 623 firms, whilerepresenting a 25X increase above the number reported during theinitial three-year period, represented a decrease of more thantwenty from 1982-84, when a maximum 646 firms were reported. Asindicated, the 1979-81 period was one of particularly pronouncedgrowth in firm numbers.
Production of processed edible seafood, expressed on aproduct weight basis, averaged 400 million pounds annually in1988-90 compared to 273 million pounds in 1973-75, an annualizedgrowth rate of about three percent. Overall, production increasedduring each three-year interval of analysis except for the mostrecent when production fell slightly, i.e., less than two percent.Observed changes in aggregate seafood processing activities, byand large, represented changes in shrimp processing activities.As will be shown shortly, this reflects the dominance of thissingle species in the aggregate.
For purposes of analysis, the product weight poundage wasalso converted to an equivalent edible-meat-weight basis and live-weight basis and the conversions are presented in Table l. Asindicated, the estimated edible-,meat-weight poundage consistentlyaveraged from about 75Z-85X of the product weight poundage, thedifference reflecting shell and additional ingredients that areincluded in the calculation of product weight. The estimatedlive-weight poundage, on the other hand, traditionally exceededthe product weight poundage by BOX-90X.
The value of Southeast U.S. seafood processing activitiesincreased by a factor of two during the period of analysis, whenexamined in three-year intervals, from $459 million annually in1973-75 to $1.37 billion annually in 1988-90 Table 1!. Most ofthis increase, however, was inflationary based. After removingthe effects of inflation, the value of Southeast seafoodprocessing activities has remained relatively stable since 1976-78with the exception of about a 10X decline during the most recentthree-year period. An increasing production in conjunction with astable deflated value indicates a declining deflated processedprice. This decline is clearly identified in Table 1. Theaverage annual deflated price in 1988-90, $3.63 per product-weightpound expressed in 1990 dollars! ,was less than BOX of the 1973-75 a~erage price of $4.50 per pound and, less than 70X of the peakprice of $5.62 per pound which occurred during the 1976-78 period.

280
OIh N
ICCO 4II1
C!
Fl
O
Id
4fI I I
~ Pt
co r
ChN
Ch N
NChIll %0
'0 0 0W af4l
oc N
CV
'Cf
4f 4lo b00 ef
4l
W 4f0
f 4f0 4I
uO 4f
4l'Cf0 A
CCI
Che ICl
CI NI
C0r
I
'Cf
O
CVN N
cgl
Ch
N N
OI
Qccl Pl4l O
C Chu ~
g 0
M
qf guCll 4f
m4l I4
4lo A4l u
4f 0CO tll
OCV Fl
%0IO Ch
CCIO Ch
O gOM~ fce
ChO IA
CV Ch
bff bO
cff 4f
a OM
OCf C0I I
ChICl
Ch gh
OC! ChI I
U1 cx!CCI Cgl
U1 OCII I
r lCh
c4
0~ AC ~
I44l4l
g
u4l 4l
u m4f
4f'Cf ~
m o mfcI
m 'Cf4l g
qf c4 ~qf4f
o O" Cm O 0
uO gg Ch
0o
4f 4f
4f
V g f. .�D 4f
O '4
4l4f 4l f
4f g m 0m
WM0~ ~~O a.a4fQg mC
4l ~AM "u
4l c4g o
5 0 4f0 0
~ g4~ Cll CI!

281
The composition of aggregate Southeast processingactivities, expressed as a percent of total value by key species or groups!, is presented in Table 2. As indicated, shellfishconsistently represented in excess of 90X of aggregate Southeastprocessing activities edible! when measured by value and, inearlier years, exceeded 95X. Shrimp represented, by far, thelargest component of aggregate activities, from about 70'X to 80X.Much of the remaining shellfish processing activities wereattributable to blue crabs and oysters. The contribution to thetotal by finfish species, while relatively small, increased from4.2X during 1973-75 to 7.8X during 1988-90, or by 85X.
Table 2. Contribution to the Total Value of Southeast U.S.
Seafood Processing Activities, Expressed on aPercentage Basis, 1973-90.
TIME
PERIOD
BLUE OTHER
SHRIMP CRAB OYSTER SHELLFISH
TOTAL
SHELLFISH
TOTAL
FINFISH
-X of Total-
1973-75 76.5 8.6 5.4 5.3 95.8 4.2
1976-78
1979-81
80.7 6.4 5.1 4.2 96.4
94.8
3.6
77.6 6.1 4.0 7.1 5.2
1982-84 74.1 6.8 4.9 7.8 93.6 6.4
1985-87 73.9 7.9 4.7 5.6 92.1 7.8
1988-90 73.7 7 ' 9 3.6 7.0 92.2 7.8
ECONOMIC STRUCTURE, CONDUCT, AND PERFORMANCE
Several aspects of the economic structure, conduct, andperformance of the Southeast processing industry are presentedbelow. They include i! productivity within the Southeastprocessing industry and changes therein, ii! the sizedistribution of firms within the industry and changes therein, and iii! industry concentration and changes therein.
Productivity of the Southeast Processing Industry
Productivity within the Southeast seafood processingindustry was evaluated using two methods. The first was theestimation of production per firm. The second was the estimationof production per worker.
ource: npu s e ata prove e y t e at ona r ne s er esService, Fisheries Statistics Division.

n Production per firm among Southeasternseafood processors is given in Table 3 for the 1973-90 period.Production per firm over the 18- year period of analysis averaged590,4 thousand pounds, when evaluated on a product weight basis.Production averaging 639.7 thousand pounds annually during 1987-90exceeded the comparable statistic for the 1973-75 period by almost100 thousand pounds �8X! but was below peak production of 661.2thousand pounds per firm �985-87 avg.! by about three percent.
Table 3. Per Firm Production of Edible Processed Seafood in theSoutheastern United States, 1973-90 three-yearaverages!.
VALUE PER FIRM
Deflated~POUNDS/FIRM'TINE PERIOD Current
1 000s$
2,445.0
3,120.8
2,622.4
2,575.9582.7
661.2
639.7
2,667.1
2,319.3ven on a pro uct we t as s.
b The deflated values are expressed in 1990 dollars and are basedon the Consumer Price Index.Source: Unpublished data provided by the National MarineFisheries Service, Fisheries Statistics Division..
Evaluated on a deflated value basis �990 base year!,production per firm averaged $2.63 million during the 18-yearperiod of analysis. Production peaked during 1976-78 at $3.12million which exceeded the low production of $2.32 million byabout 35X. The low production occurred during the most recentthree-year period and, in general, the deflated value ofproduction per firm has been declining since 1976-78.
In general, there was an increase in production per firmsince the mid 1980s, when evaluated on a poundage basis, comparedto earlier years. Because of the decline in the deflated perpound price of the processed product, however, a concurrentincrease in the deflated value of processing activities per firmwas not identified.
oductio z Wo ke . As indicated by the information containedin Table 4 the average Southeast seafood processing firm employed28 workers on an annual basisl during 1973-75. Each of theseworkers produced an average of 19.7 thousand pounds of seafood
1975-75 avg.
1976-78 avg.
1979-81 avg.
1982-84 avg.
1985-87 avg.
1988-90 avg.
1,000s
543.0
596.2
519,9
911.8
l,459.2
1,634.9
1,971.8
2,251.2
2,205.3

283
product wei.ght! valued at $88.6 thousand when expressed in 1990dollars.
Estimated Productivi.ty per Worker in the SoutheasternUnited States Edible Processed Seafood Industry, 1973-90 three-year averages!.
Table 4.
VALUE PER WORKER
AVERAGE/TIME PERIOD EMPLOYEE
POUNDS/WORKER'
1,000s
Current Deflated'
$1 000s
88.619.7 33.1281975-75 avg.
1976-78 avg.
1979-81 avg.
1982-84 avg.
1985-87 avg.
1988-90 avg.
27 54.1 115.722.0
72.823 23.1 116.7
106.024 24.0 81.2
100.527 24. 9 84.9
25 88.7 93.325.7
ven on a pro uct we t as s.The deflated values are expressed in 1990 dollars and are based.
on the 1990 Consumer Price Index.
Source: Unpublished data provided by the National MarineFisheries Service, Fisheries Statistics Division.
When examined on a deflated value basis, production perworker grew from $88.6 thousand annually during l973-75 to $116.7thousand during 1979-81. This growth reflects increased poundsprocessed per worker and an increasing deflated price of theprocessed product. Since the 1979-81 period, however, productionper worker, expressed in terms of the deflated value of processedproduct, has fallen sharply. Overall, the estimated per workerproduction of $93.3 thousand annually in 19SS-90 was only aboutBOX of that estimated during 1979-81.
To evaluate production per worker in the Southeast seafoodprocessing industry in greater detail, Southeast seafoodprocessing establishments were separated into four mutuallyexclusive size categories: i! those with annual deflatedprocessed sales of <$250 thousand, ii! those with annual deflatedprocessed sales from $250 thousand to $1.0 million, iii! thosewith annual deflated processed sales from $1.0 million to $10.0million, and iv! those with annual processed sales of $10.0
As suggested by the information contained in Table 4,production per worker, expressed on a product weight basis,increased throughout the 18-year period of analysis when evaluatedin three-year intervals. Overall, production of 25.7 thousandpounds per worker during 1988-90 exceeded 1973-75 average annualproduction per worker by slightly more than 30X.

284
million or more. Selected information pertaining to new workerproductivity among firms in each of these four groupings ispresented in Table 5.
As indicated, employment per firm with annual deflated salesless than $250 thousand generally averaged from about six to eightworkers annually. The number increased in relation to firm sizewith the largest firms, i.e., those with annual processed sales inexcess of $10 million, generally reporting in excess of 150workers annually.
An examination of the information contained in Table 5
indicates that production per worker, expressed in terms of eitherpounds or value, increased rapidly with firm size. For example,production per worker in 1988-90 averaged 4.8 thousand poundsamong the smallest firms, 7.4 thousand pounds among firms withannual sales from $250 thousand to $1.0 million, 22.5 thousandpounds among firms with annual sales from $1.0 million to $10.0million, and 43.7 thousand pounds among firms, with annual sales10.0 million or more.
Four hypotheses can be offered to explain the differences inproductivity per worker in relation to firm size. First, workersin the smaller firms may function in more than one role. Forexample, they may carry administrative duties in addition to timespent actually involved in processing. Second, many of the largercompanies tend to be shrimp oriented which tend to be moremechanized see Keithly et al., 1!. Third, larger firms arelikely to have a steady supply of raw product and, hence, workerstend to be more full-time oriented and may in some instances workmore overtime hours. Finally, there may be some economies toscale in relation to firm size.
Overall, there was a clear increase in production per worker measured in pounds! during the 1973-90 period among the twolarger classification of firms. Among firms in the $1.0 to $10.0million processed sales range, production per worker increasedone-third, from 16.6 thousand pounds annually during 1973-75 to22.5 thousand pounds during 1988-90. Among firms with annualsales greater or equal to $10.0 million, production per workerrose 40X, from 32.2 thousand pounds to 43.7 thousand pounds.Because of a decline in the per pound processed price, however,the deflated value of processed sales per employee has fallensharply since the 1979-81 period.
Size Distribution
To examine the size distribution of seafood processing firmsin the Southeast, and changes therein through time, firm's weregrouped into four categories based upon deflated value ofprocessed sales: i! firms with annual sales <$250 thousand, ii!firms with annual sales from $250 thousand to $1.0 million,

285
Estimated Productivity per Worker in the SoutheastU.S. Processed Seafood Industry Edible!, by Size ofFirm, 1973-90 three-year averages!.
Table 5.
OUTPUT VALUE PER WORKER
Deflated
$1,000s!POUNDS/WORKER
�,000s!Current
$1,000s!TIME PERIOD WORKERS/FiRM
< $250,000
14.45.43.7
6.93.7 14.7
10.3 16.54.1
9.6 12.53.3
3.9 10.9 13.0
14.013.44.5
$250,000 - $1.0 Million
8.117 12.2 32.1
13.96.517 29.8
16 32.720.57.9
18 7.9 29.822.8
20 28.17.4
28.918 30.57.4
28.942 76.716.6
85.039.637 16.7
95.760.220.633
90.269.021.636
75.136 88.921.5
84.480.036 22.5
! $10.0 Million-
141.452.5186 31.2
204.295.637.9
205.438.5155
194.1161 42.1
179.044. 4163
164 154.943.7
expresse on a pro uct we g t as sSource: Unpublished data provided, by the National MarineFisheries Service, Fisheries Statistics Division.
1973-75 avg.
1976-78 avg.
1979-81 avg.
1982-84 avg.
19S5-87 avg.
1988-90 avg.
1973-75 avg.
1976-7S avg.
1979-81 avg.
1928-84 avg.
1985-87 avg.
1988-90 avg.
1973-75 avg.
1976-78 avg.
1979-81 avg.
1982-84 avg.
19S5-87 avg.
19SS-90 avg.
1973-75 avg.
1976-78 avg.
1979-Sl avg,
1982-84 avg.
1985-87 avg.
1988-90 avg.
$1.0 Million to $10.0 Million
127.6
148.6
151.0
147.5

286
iii! firms with annual deflated sales of $1.0 million to $10.0million, and iv! firms with annual deflated processed sales of$10.0 million or more.
Size Distribution Among Firms in the Southeastern U.S.Seafood Processing Industry, 1973-90 three-yearaverages!.
Table 6.
OF 0 SE S
$250,000 $250,000- $1.0 Million-$1.0 Million $10.0 Million
> $10.0Million
TIME
PERIOD
X
1973-75
avg .
43 28 23
1976-78
avg.
39 32 21
1979-81
avg.
44 30 20
1982-84
avg.
27 21
1985-87
avg.
28 23
1988-90
avg.
46 28 21
ource: npu s e ta prov e y e at ona r neFisheries Service, Fisheries Statistics Division.
It is noteworthy that size distribution of firms within theindustry remained relatively constant during 1973-90, despite asharp increase in the number of firms. This suggests that rawproduct may not have been a limiting factor in industry growthduring 1973-90. If it were, one would expect to find that alarger percentage of firms would fall into the smaller sizeclasses through time as the total number of firms expanded.
Industry Concentration
Concentration among firms in the Southeast seafoodprocessing industry during 1973-90 and changes therein can beevaluated using several alternative methods. One method commonly
As indicated from the information contained in Table 6,little change occurred in the size distribution of the Southeastseafood processing sector during 1973-90 when evaluated on thebasis of the deflated value of processed sales. From about 40X to46X of the establishments consistently exhibited sales of lessthan $250 thousand when examined in three-year intervals. Another27X to 32X exhibited sales in the $250 thousand to $1.0 millionrange. From 20X to 23X of the firms consistently reported salesin the $1.0 to $10.0 million range. The remaining 5X to 8X of theestablishments reported sales of $10.0 million or more.

287
employed in applied research is the market share approach in whichthe market shares accumulated by the largest x firms are analyzed x e N; N is the total number of firms comprising the industry!.Starting with the firm with the largest market share, measured invalue of processed seafood sales, and adding the shares of thenext largest firms in succession, produces an estimate ofaccumulated market shares in the Southeast seafood processingindustry. These shares, evaluated in terms of the largest five,ten, and twenty establishments for the 1973-90 period are given inTable 7.
Table 7. Market Shares of Largest Seafood Processing Firms inthe Southeastern U.S, Ranked by Value of Sales, 1973-90 three-year averages!.
TIME PERIOD
of Industry ValueX
24 37 53
23 38 55
24 5638
5337
22 36 52
22 5035
ource: np s e ta prov e y t e at ona ar neFisheries Service, Fisheries Statistics Division.
As indicated, the largest five Southeast seafood processingestablishments consistently represented from 22X to 24X of totalSoutheast activities when measured by value, while the largest tenfirms represented from 35X to 38X of the total. The largest 20firms consistently accounted for more than one-half of the totalvalue of seafood processing activities in the Southeast.
In general, the information contained in Table 7 suggeststhat industry concentration on the southeast seafood processingindustry was relatively stable during 1973-90 despite about a 25Xincrease in firm numbers.' This finding is intuitively appealingwhen consideration is given to the fact that the industry sizedistributions was also relatively constant during 1973-90 seeTable 6!.
SOUTHEAST LANDINGS
Southeast landings of fish and shellfish, excludingmenhaden, are presented on an annual basis for 1973-90 in Table 8.An indicated, pounds landed increased throughout the 18-yearperiod of analysis when examined in three-year intervals, with theexception of a slight decline �X! during the most recent three-year period. Overall, average annual production of 673.2 millionpounds in 1988-90 exceeded average annual production of 631.8
1973-75 avg.
1976-78 avg.
1979-81 avg.
1982-84 avg.
1985-87 avg,
1988-90 avg.
LARGEST FIVE LARGEST TEN MRGEST Tt62lTY
FIRMS FIRMS FIRMS

288
million pounds in 1979-Sl by about 7X and exceeded 1973-75 averageannual production of 524.0 million pounds by 28Z.
Table S. Southeast Seafood Landings less menhaden!, 1973-90 three-year averages!.
>MLJFi
Deflated~TIME PERIOD POUNDS'
1 000s
524,028
5S5,583
631,787
634,284
690,540
673,161
Current
$1,000s
1973-75 avg.
1976-78 avg.
1979-81 avg.
1982-84 avg.
1985-87 avg.
19SS-90 avg.
699,885
942,354
975,923
925,364
968,959
875,153
286,444
439,706
607,856
705,111
848,825
812,653xpresse on a ve-we g t as s
b The deflated values are expressed in 1990 dollars and are basedon the 1990 Consumer Price Index.Source: Unpublished data provided by the National MarineFisheries Service.
The current value of Southeast fish and shellfish landings excluding menhaden! increased from $286.4 million annually in1973-75 to $812.7 million annually in 1988-90 Table 8!. Afterad]usting for inflation, however, the value of Southeast landingshas remained relatively stable in the $925 million to $975 millionrange since 1976-78 with the exception of a decline in 1988-90 to$875 million. This decline reflects both a decline in harvest anda decline in deflated price.
PROCESSING ACTIVITIES IN RELATION TO LANDINGS
Southeast edible seafood processing activities, expressed ona line-weight basis, were presented in Table 1 while Southeastedible seafood landings, also expressed on a live-weight basis,were given in Table 8. A comparison of the relevant informationin the two tables indicates that processed quantity averaged f'rom90X to 95X of Southeast landings less menhaden! through 1979-81.Since 1982-84, however, processed quantity has exceeded landingsand the margin has been increasing. While difficult to documentwith the limited available data, the information suggests thatmost ~re orred domestio landings in the earlier ties periods wentinto processing activities. With increased imports throughout, thedecade of the 1980's, particularly shrimp, processing activitiesadvanced in relation to landings, i.e., a portion of the increasedimports were used in Southeast processing activities. Thisincreased usage in shrimp processing activities was documented byRoberts et al �! and the reader is referred to Keithly et al. �!for additional insight as to the relationship between processingactivities and landings of individual species processed in theSoutheastern United States.

289
REFERENCES
ROBERTS, K. J., W. R. KEITHLY, AND C. ADAMS. 1992.Determinants of imported shrimp and their role in thesoutheast shrimp processing sector. NMFS Technical,Memorandum NMFS/SEFC-305!. 33pp.
ENDNOTES
The authors acknowledge support from the National MarineFisheries Service, Saltonstall-Kennedy Project $$ NA90AA-H-SK053.
Farm-raised catfish was excluded from the analysis.2.
3. Administrative employees are not included in this estimate.Rather, the estimated number includes only those workers whocome in contact with the product during processingoperations, i.e., the production workers. The number ofworkers used in calculations reflects the yearly averagewhich tends to be below the maximum number of workers
employed by firms during peak production months.
4. More advanced techniques to measure concentration were alsopresented by Keithly et al. �993!. In general, they allagreed with the findings associated with the market shareapproach.
1. KEITHLY, W. R., JR., K. J. ROBERTS, AND H. E. KEAENEY.1993. The southeastern seafood processing industry:An economic assessment for private and publicmanagement decision making. Final Report to NationalMarine Fisheries Service contract no. NA90AA-H-SK-53!. 900+ pages.

290
SOME QUALITY CHARACTERISTICS OFFAR1VIED COD GADUS MORYUA!
Fereidoon Shahidi" and Edward Dunajski'Departments of 'Biochemistry and Chemistry
Memorial University of NewfoundlandSt. John' s, Newfoundland, AIB 3X9, Canada
Atlantic cod Gadus morhua! is an important source of income for the fishermen andprocessors in Maritimes and Newfoundland. Depletion of cod stocks, particularly in the GrandBanks, has prompted the Federal Government to introduce a two-year moratorium in certain areas.Sea Forest Plantation has initiated a cod-farming operation in several locations in Newfoundland.Undersized cod fiom inshore trap fishery during June-August are transported to holding pens by boat.They are then fed intensively on live or frozen capelin or on pelleted feed formulations.
The intensively fed cod generauy grow at a much faster rate than wild cod. The high growthrates obtainable in holding pens are due to higher temperature in the shallow waters and the feedingregimes. Although cod may be relatively easily bred and grown to a marketable size in approximatelytwo years, the high cost of raising fish up to approximately 500 g size makes the operationuneconomical at current prices,
Harvesting of farmed cod generally begins in December and may continue until January-February. They may be sold as prime fish fillets in the U.S. and Canadian markets or could be frozenin special custom-designed packages, The present paper reports on changes in the chemicalcomposition and characteristics of pen-held cod over a 20-week period during intensive feeding.
MATERJALS AND MKTHODS
All fish used in this study were obtained fiom the Expenmental Offshore Cod Farm of the SeaForest Plantation, Bay Bulls, NF. They were held in pens located near the shore where the depth ofwater was approximately 30-50 m. They were fed on formulated diets with a typical ingredientcomposition given in Table 1. For sampling, fish were caught using a "dip net", stunned by a blowto their head and bled by severing gills. They were then eviscerated. The length and weight of fishas weu as the weight of the liver was recorded. However, for growth measurement, tagged fish werecaught in a similar manner and weight in a dip net and their length was quickly measured using ameasuring tape.

291
Proximate composition of fish fillet and liver was determined using the AOAC �984!protocols, except for total lipids which were extracted into a chloroform/methanol/water amrtureaccording to the procedure outlined by Bligh and Dyer �959!. Moisture was determined by ovendrying at 102'C until a constant weight was reached, The crude protein content was determined andrecorded as N x 6.25. The ash content of samples was determined after charring of samples over aBunsen burner followed by ashing in a muNe furnace at 550'C AOAC, 1984!.
The hepatosomatic index of fish, defined as percentage weight ratio of liver to whole fish afterslaughtering and eviscerating, was recorded. The content of glycogen in samples was determinedaccording to the method descxibed by Carroll et al. �956!, A 5 g sample tissue was placed in a vialcontaining 10 mL of 30'fo w/v! KOH for determinations, as described by Ang and Haard �985!.
The total lipids extracted according to the method of Bligh and Dyer �959! were drieddirectly. For fatty acid analysis, the lipid extracts were subjected to transmethylation in acidifiedmethanol Hitchcock and Hammond, 1978!. Methyl heptadecanoate was used as an internal standard.The methyl esters were separated on a 30 m x 0.25 nm capillary SP2337 column Supelco Inc.,Bellefonta, PA! using a Perkin Elmer 8500 gas chromatograph. Oven temperature was 180 C andthe injection port and flame ionization detector oven temperatures were 230'C. Quantification wasaccomplished with the data handling system and the control unit of the instrument Shahidi andSynowiecki, 1991!.
RESULTS AND DISCUSSION
Table 1 summarizes the typical ingredient composition of formulated pellets used for feedingpen-held cod to satiation. A number of fish in each pen � to 6! were tagged. The pen growth datafor length and weight of 6 to 23 fish were recorded in difFerent time intervals over a 20-week period.Results summarize in Table 2 indicate that percent monthly growth of fish as reflected in their lengthand weight was 3.8 - 4.9 and 18.1 - 29.8'/o, respectively. Based on this data, a 3.5 to 5.5 monthsperiod is required for doubling up the weight of pen-held cod.
Proximate composition of fillet and liver tissues of pen-held cod are given in Table 3. Thecontent of protein in cod muscles increased &om 16.90 to 18.30/e while in the liver a decrease &om7.50 to 3.05/o was noted. The content of lipid in the muscles increased &om 0.74 to 0.94'/o andcorresponding values for liver were 58.90 and 75.92/o, respectively. The moisture content in themuscles showed little change, &om 81.90 to 80.70/o, however, for liver tissues a decrease &om 32.60to 18,60'io was evident. Meanwhile, the weight of liver of pen-held cod increased &om 45.8 to 211.0g and hepatosomatic index increased &orn 4.41 to 12.70'/I Table 4!. The increase in the content ofliver glycogen over the same period was insignificant.
Tables 5 and 6 summarize the Omega-3 fatty acid composition in the muscle and liver tissueof wild and pen-held cod. There was a modest increase in the content of omega-3 PUFA in themuscle tissues, &om 52,13 to 55.824/o. The corresponding change in the omega-3 PUFA in the livertissues of cod was &om 17.94 to 26.12'/o.

292
Table l.
Table 2.
Typical Feed Formulations for Pen-Held Atlantic Cod Gadus
Comparison of mean growth in diQerent pens over a 20-week

293
Proximate composition '/o! of muscles and hvers of wild and pen-Table 3.
Changes in liver weight, hepatosomatic index and glycogenTable 4.
'Mean values of triplicate determination Rom mix fish liver + standard deviation,
'Results are mean values of triplicate determinations for a dozen fish upon harvestor fed for 18-20 weeks in pen on formulated diets.

294 Table 5. Omega-3 fatty acid composition of 611et lipids of pen-held and
Table 6. Omega-3 fatty acid composition of liver lipids of pen-held and

295
CONCLUSIONS
Based on the results presented in this work, it is apparent that cod farming is a viablealternative to production of cod. The composition of fish and fatty acid composition of muscle andliver tissues may be modified by using appropriate feed formulations. Further work on post-mortemphysiological changes in muscle tissues and quality of fillet has been carried out. Results will becomminuted elsewhere,
ACKNOWLEDGEMENT
We are grateful to the Department of Fisheries and Oceans and the Natural Sciences andEngineering Research Council of Canada for financial support in the form of a subvention grant.
1, ANG,J.F. andN,F, HA@K!. 1985. ChemicalCornpositionandPost-mortemchangesinsoft-textured muscle from intensely feeding Atlantic cod Gadus morhua, I !. J.Food Biochem. 9: 49,
2. AOAC. 1984. MicialMethodsofAnalysis. 14thedition. AssociationofOKcialAnalyticalChemists. Washington, DC.
BLIGH, E.G. and W.J. DYER. 1959. A rapid method of total lipid extraction andpurification. Can. J. Biochem. Physiol. 37: 911,
4, CARROLL, N.W., R.W. LONGLEY, and J.H. ROE. 1956. The determination of glycogenin fiver and musde by use of anthrone reagent. J. Biol. Chem. 220: 583.
HITCHCOCK, C. and E.W. &QCMOND. 1978. The determination of lipids in foods. InDevelopments in Food Analysis Techmques - 2. Ed. R. King. Applied SciencePublishers, London. P. 185.
SKtQK!I, F. and J. SYNOWIECKI. 1991. Cholesterol and lipid fatty acid composition ofprocessed seal meat. Can. Inst. Food Sci. Technol. J. 24:269.

296
MANAGEMENT OF BLUE CRAB PROCESSING WASTES
G, D, Boardman', C. L. Wolfe', T. D. Harrison' and G, W. Flick''Department of Civil Engineering and
Department of Food Science and TechnologyVPIkSU
Blacksburg, Virginia 24061
As environmental legislation becomes more stringent, the blue crab QgJggg~ ~i~! industryis being challenged to develop technically and economically feasible methods to manage their liquidand solid wastes. The blue crab industry is one of the largest seafood processing industries inVirginia. More than 50 blue crab processing firms are. presently certified by the Division of ShellfishSanitation, Virginia Department of Health Croonenberghs, 1991!.
The industry is economically vital to many communities of the Chesapeake Bay and its tributaries.In 1989, there was a total landing of 206.7 million pounds of blue crab in the United States valuedat 81 million dollars. The Chesapeake region produced 89 milhon pounds of this total U.S.Department of Commerce, 1990!.
In the 1970's, the United States Environmental Protection Agency EPA! developed documentswhich de6ned effluent limits for segments of the seafood processing industry. The regulations werethen adopted by the states. Compliance with these hmits was obtained, in most cases, with minorplant modifications that did not require large capital investments and operating costs. During the lastdecade, citizen and environmental groups have encouraged more stringent legislation in an effort toachieve a cleaner environment. Individual states have established waste disposal standards that exceedcurrent U.S, EPA requirements.
The restoration of water quality in the Chesapeake Bay has become a goal of states which borderthe Bay and its tributaries, In Virginia, the Department of Environmental Quality DEQ! has initiateda vigorous program to remove pollutants from the Bay. As a result, new standards for the disposalof liquid and solid wastes have been established. The new standards, many of which substantiallyexceed previous standards, have resulted in; the loss of public landfills; highly regulated wastetransportation regulations; the inability of municipal systems to accept industrial wastes; wastedisposal surcharges; and perhaps most importantly, new liquid eftluent standards for discharge intoreceiving waters. Many blue crab processors have reported serious waste disposal problems as theyare unable to consistently comply with their current allowable pollutant discharge limits.

297
Waste management is difiicult for blue crab proces!mg Grms for several reasons. In general, crabfirms are less capitalized and do not have the economics of scale when compared to some otherseafood industries. Treatment systems with the ability to produce the desired e6luent quality maynot be economically feasible. Chemical, biological and physical treatment may be required to reducethe strength of procesehig plant eRuents Geiger et al., 1985; Wheaton et al., 1984!. These treatmentprocesses will be expensive and require adequate planning to avoid unfavorable economic impact.
Secondly, the location of processing plants also creates problems. Most blue crab processingfacilities are located in rural areas on bodies of water. These facilities usually do not have access tomunicipal waste treatment plants. Land application and lagoon treatment are often not viabletreatment options due to the high water table and wetland limitations. Some larger crab plants arelocated in cities with access to municipal treatment systems. However, these plants are often assessedsubstantial surcharges unless the concentration of their waste is reduced. There is also a possibilitythat municipal treatment systems may be forced to reject crab wastes due to the rapid population andindustrial growth that is pushing municipal waste treatment systems to maximum operating capacity.Furthermore, plants located in metropolitan areas often lack the space needed for treatment systems.The plants are usually tightly bordered by water, parking lots and/or neighboring industries,
Finally, in Virginia, as the DEQ is in a period of transition in implementing new standards, thewastewaters from difFerent crab processing firms are often inonitored for difFerent eQluentconstituents. This discrepancy can even appear in two adjacent crab plants. The inconsistency of theregulations makes it difficult for the industry as a group to address its waste disposal alternatives.
The blue crab processing industry faces serious solid and liquid waste disposal problems.Approximately 14/o of the live crab results in food for human consumption with the remainder as by-products or waste EPA, 1974!. Consequently, processing firms will need to develop in-plantprograms that wN include: water conservation and recovery processes, improved by-productrecovey systems and the development of industrial products Rom wastes including foods, feeds, orbiologics!. Solutions to the waste maimigement problems are essential for the future of many bluecrab processing facilities. Some of the solutions will rixluire the application of innovative technology,while others will result in substantially increased production costs. The achievement of such a goalpresents substantial economic and technical obstacles and may be one of the greatest challenges inthe future.
The objectives of this project were to evaluate the use of an anaerobic, biological process and airstripping as ineans of treating crab processing waters. In a previous paper, the authors presentedinformation about the chariicterization of crab processing waters and the use of various othertreatment methods Hamson gt g 1992!.

298
MATERIALS AND METHODS
o i Tr m tE eriment
The reactor vessel was made Rom a 4 hter L! high density polyethylene HDPE! bottle. Thereactor top was plugged with a size 13 rubber stopper, through which two 0.5 inch in.! glass tubeswere fitted. This allowed feeding, capture of biogas, and sampling of efHuent, while maintaining anamum%ic environment in the reactor. The eEuent/feeding tube was connected to a 1 foot 8..! lengthof 0.5 in. Tygon. tubing which was clamped ofF at all times except during feeding and sampling. Thebiogas was passed though Tygon. tubing to the collection system, This consisted of a calibrated 4L HDPE bottle which was filled with water and inverted in a water bath. The biogas tubing waspassed into this bottle, and its volume was measured via water displacement. Figure 1 shows aschematic of the reactor setup.
Retort wastewater was collected in a 5 gallon gal.!. HDPE bucket held under the outlet of aretort. The wastewaters &om the Hams Claw reel wash, brine bath, and conveyor wash operationswere collected in similar manners. Once obtained, the feeds were stored at 4 C in HDPE containersuntil used. Total chemical oxygen demand COD! of the feed was monitored during storage to checkfor degradation,
Four reactors were operated over the course of the study. Reactors A and B treated watersderived Som cooking crabs retort water! retort water and were maintained at food to microorganism F/M! ratios, stated in units of lb COD/lb MLVSS/day, of 0.35 and 0.25, respectively. Reactor A wasoperated at an F/M ratio of 0.40 Som day 1 through day 4G, but the ratio was decreased to 0.35 afterreduced treatment was observed. Reactors C and D, meanwhile, were fed a mixed wastewater, thecomposition of which was based on daily production flows determined for the processing faciTity.These reactors were maintained at F/M ratios of 0.10 and 0.07, respectively. The wastewaters fromthe Harris Claw reel wash, brine bath, and conveyor wash operations were combined with the retortprocess water in a 2.0:4.9:8.6:3.4 ratio to make this mixed wasbymger. Reactor A had been operatedat F/M ratios of 0.15 and G.25 over a total of 55 days prior to the beginning of this study. Similarly,reactor C was operated at an F/M ratio of 0.05 for a period of 55 days prior to the beginning of thisstudy. Data on reactor performance during this earlier period is presented in the interim report byHarrison P Q. �992!. For these reactors, day 1 is the first day on which the F/M ratio was increasedto the levels tested in this study. In the case of reactors B and D, day 1 is the day on which thereactors were started.
In an attempt to achieve a start-up mixed liquor volatile suspended solids MLVSS! level ofbetween 3,000 and 4,000 mg/1, each reactor was seeded with 0.4 L of anaerobically stabilizedmunicipal sludge. This was obtained Rom the Peppers Ferry Sewage Authority treatment plant. Thiswas added to 1.6 L of warm tap water, which had been purged with pure nitrogen in order to removeany dissolved oxygen, for a total reactor volume of 2.0 L Calcium carbonate, in the amount of 4.0grams, was added to each reactor to guard against upset during start-up.

299

300
In order to maintain a relatively constant temperature, the reactors were kept in an incubatingcabinet at approximately 35 C, This temperature was chosen in order to maintain the reactors in themesophilic range recommended for anaerobic digestion McCarty, 1964!. The reactors weremaintained in a continuously-mixed state through the use of magnetic stirrers. These stirrers wereturned ofF only for a period of 45 mnutes to an hour prior to the daily wasting and feeding of thereactors to minimize the loss of MLVSS. This settling period was increased to 1 hour for reactorsC and D after the MLVSS concentrations in each began to decrease.
Due to changes in the MLVSS concentrations of the reactors and in the strength of thewastewater used as feed, the hydraulic retention times HRT! of the reactors varied considerably overthe course of their operation. Average HRTs for reactors A, B, C, and D were found to be 12.2,18.7, 36.3, and 32.4 days, respectively.
Reactor performance was tracked by monitoring temperature, biogas production volume, pH,alkalinity, and MLVSS. In addition, concentration levels of the following factors were determinedfor both the feeds and the reactor efnuents at intervals necessary to define reactor health andtreatment efFectiveness: total and soluble biochemical oxygen demand BOD,!, total and solubleCOD, total and volatile suspended solids TSS and VSS, respectively!, Total Kjeldahl and AmmoniaNitrogen TKN-N and NH,-N, respectively!, Total Phosphorus TP!, and the cations, calcium,magnesium, potassium, and sodium.
With the following exceptions and clarifications, all of the aforementioned tests were performedin accordance with Standard Methods for the Examination of Water and Wastewater �992!:
Alkalinity titrations utilized 0.02 N H,SO, solution as a titrant.
TKN-N detonations were performed using Semi-Macro Kjeldahl method with 0.02 N H,SO,titration.
NH3 N tests utiTized distillation into boric acid indicating solution followed by titration with0.02 N ISO,.
COD determinations were performed utilizing dichromate reflux digestion at 150 C for twohours followed by ferroin addition and titration with 0.05 N ferrous ammonium sulfate.
Initial and final dissolved oxygen DO! levels for BOD, tests were determined using a YSI DOmeter.
Samples for soluble COD and soluble BOD, were filtered using 1.05 micron glass microfiberfilters.
TP was tested by the ascorbic acid method with persulfate digestion.
pH was determined with a glass electrode probe.

301
All cation concentrations were determined through ion chromatography using a Dionex 2010ichromatograph at a Qow rate of 1.0 ml/min with a CS-12 column with a self regeneratingsuppressor utilizing 20 mM methane sulfonic acid as a carrier liquid,
Air Stri in Ex eriment
Figure 2 shows a schematic of the air stripping tower design.
The tower was constructed &om three sections of 0.625 in. thick PVC pipe with an insidediameter of 18 in. PVC piping was chosen for its heat and chemical resistance properties. The baseof the tower was constructed &om a 2.5 ft. section of the pipe which was secured to a 20 in. squarePlexighLs base with a thickness of 0.625 in. The joint was sealed with a silicone-based caulk toprevent leakage. A shelf of 1 in. chicken wire was inserted into a 6.5 ft. pipe section and was heldin place with a PVC support ring, By using this type of packing support, adequate strength wassupplied, while back premise was kept to a minimum. The 6.5 ft. section was then inserted into theQanged top of the first section and filled to a 6 Q. depth with 2.3 in. LANPAC. packing material.A 1 ft, section of the pipe was then attached to the top of the tower in order to prevent splashingwhen the blowers were in operation.
The wastewater was pumped &om a HDPE holding basin by a centrifugal pump resistant totemperatures up to 93OC and pH levels up to 11. In order to prevent damage &om higher pH levels,the pump was Qushed with tap water after use. This pump was powered by a 0.04 hp motor. Acombination of high temperature 0.75 in. diameter PVC piping and Tygon. tubing was used totransport the water &om the basin to the high temperature PVC distribution system at the top of the6.5 ft. section.
The tower was of a countercurrent design with the air supplied by two two-speed blowers whichwere both operated at their high speed setting and generated a combined air flow-rate ofapproximately 500 cfin. These were attached to the base of the tower via 4.25 in. by 8.5 in.galvmized steel ducts inserted into ports in the side of the bottom section. The treated wastewaterleft the tower via two 0.75 in. ports located in the side of the base section.
The wastewater used in the testing of the tower was collected in a 5 gal. HDPE bucket held underthe retort process waste outlet. Although every attempt was made to recover the entire retort wastestream, a small percentage was lost. It is believed, however, that a representative sampling of thestream was recovered.
This water was then transferred to the holding basin where pH adjustments necessary for thedifFerent tests were done using 50'/o NaOH w/w weight ratio!. The pH of the waste was checkedusing a Fisher Model 160, portable pH meter with a glass electrode probe. After the pH of the wastein the basin was adjusted, the basin was covered in order to minimize ammonia loss before treatment.
After the waste was brought to the appropriate pH level, ranging &om 10 to 12.2 depending onthe trial, the pump was primed and the tower was allowed to operate until a consistent effluent flow-rate was observed approx, 10 minutes!.

302
Figure 2. Air stripping tower schematic.
LAMP AC
QE3 ChickenI'
influentDistribution
System

303
Once a constant flow rate was observed, grab samples of both influent and efBuent were takenat 5 minute intervals, Infiuent and efHuent temperature readings were also taken at these intervals inorder to determine any cooling benefits of the air stripping process. In order to track the towerperformance over the course of each trial, individual effluent samples were taken within 30 secondsof the corresponding influent sample. In addition, samples of the retort e61uent were taken prior topH adjustment to ensure that the tower infiuent ammonia levels were consistent with the retorteQluent levels. All samples were taken and stored in 500 mL HDPE bottles and were acidified to pH< 2 through the addition of 15'/o sulfuric fuining acid. The samples were transported to Virginia TechEnvironmental Engineering Laboratory where ammonia levels were determined according to the~ddM l992!p M «R' I p
The efficacy of the treatment scheme was determined through the comparison of the towereNuent and influent retort wastewater after pH adjustment!. To ensure that the main portion of theammonia removal occurred as a result of the air stripping process and not the pH adjustment itself,occasional samples were also taken of the retort process waste prior to the pH adjustment andcompared to the tower efBuent.
In order to the exanune the potential benefits of operating two towers in series, two trials wereconducted. In the first, conducted at pH 12.2, the tower e8luent &om one test was collected,combined in a 3:1 ratio with a portion of that test's influent, and used as the influent for the tower.This combination was attempted in order to test the potential benefits of increasing the temperatureof the effluent before recycling it through the tower. In the second, performed at pH 11.0, thee8tuent was collected and run back through the tower without any mixing. Samples Rom these testswere taken, preserved, and analyzed, as described above.
The trials were geared toward determining the effects that changes in three variables would haveon the tower performance. These factors were influent temperature, pH, and the air-to-water ratioat which the tower was operated. This last parameter was adjusted by varying the input liquid flowrate. The values of the operating parameters for each test are summarized in Table 1. The trials arepresented in the order in which they were performed.
In all tests the air Qow rate wM held steady at approximately 495 - 500 CFM. This flow-rate wascalculated by multiplying the average air speed through the tower, measured across the tower 'diameter, by the area of the tower opening. The average air speed was measured with a TSI Model1650, air velocity meter,

304
RESULTS AND DISCUSSION
r i Tr ment E riment
The Grst two of the four reactors A and 8! were fed,retort process wastewater and wereoperated for 216 and 94 days, respectively. Reactor A was fed at a 0.40 F/M ratio from day 1through day 40, but after decreased treatment was observed, the reactor's F/M ratio was reduced to0.35. Reactor B operated at a 0.25 F/M ratio over the course of its operation. Both reactors wereable to achieve substantial reductions in the level of oqpnics in the treated waste, but each eventuallyexhibited signs of failure and was shut down.
From day 48 through day 161, reactor A achieved COD removal rates ranging between 85'/o to91/o with an average of 87/o. This removal translates to an efHuent with a soluble COD largely inthe range of 1550 to 2520 mg/L with an average of 2103 mg/L Similarly, the reactor exhibitedBOD, removal resulting in soluble efHuent concentrations ranging between 1365 and 1497 mg/L overthis time with an average removal of 88o/o, translating to an average efHuent soluble BOD, of 1405mg/L Data on EfHuent COD and BOD, concentrations are presented in Figure 3. Soluble materialaccounted for an average of 87o/o of the COD and 95o/o of the BOD, observed in reactor A efHuent,These levels imply that the efHuent solids contained a higher portion of inorganic material than wouldbe suggested by the ratio found in solids from the secondary efHuent of activated sludge systems�.65 mg BODgmg TSS!. During this period of operation, the reactor produced biogas at an averagerate of 1430 mL/day which is somewhat higher than the 1061 mL/day level that would correspond

305
5000
4500
4000
E 3500
O
3000
I 2500
2000
1500
1000 20 40 60 80 100 120 140 160 180 200 220DAY
~ SOLUBLE COD ~ COD MOV AVG ~ SOLUBLE BOD
Figure 3. Effluent BOD> and COD levels for Reactor A.

306
to the aforementioned removal rates �7.049 g/L COD ~ 0.180 L of feed/day ~ 8$/o removal * 0.393L of gas produced/g of COD digested!. Over this same period, effluent total suspended sohds TSS!varied between 400 and 520 mg/1 with an average of 473 mg/L whde MLVSS ranged &om 3600 to4800 mg/L with an average of 4042 mg/L, Solids retention time SRT! varied between 96 and 248days over the life of the reactor with an average value of 154.6 days. Hydraulic retention time HRT!was maintained at an average of 12.2 days over the life of the reactor. Beginning on day 167, CODand BOD, levels steadily increased while biogas production decreased until the reactor was shutdown on day 216. By this time the effluent COD had reached a level of over 930G mg/L
Reactor B similarly obtained substantial reduction in COD and BOD, levels &om day 26 throughday 67 of operation. Over this period of time, the reactor achieved COD removal rates of between89/o and 93/o with an average of 91 /o and BOD> removal at rates that remained between 93 /o and94/o. These removal rates translate to effluent COD levels ranging &om 1120 to 1875 mg/L withan average of 1461 mg/I. and BOD, concentrations that varied &om 558 to 603 mg/L with an averageof 578 mg/L. Soluble material in reactor B ealuent accounted for an average of 87 Jo of all observedCOD and BOD,. As with those found for reactor A, these levels imply that the effluent solidscontained a higher portion of inorganic material than the 0.65 mg BOD J'mg TSS suggested by theratio found in solids &om the secondary effluent of activated sludge systems.
Over the course of the previously mentioned time, effluent TSS levels were maintained in therange of 240 to 500 mg/L with an average of 408 mg/L, and the reactor's MLVSS concentrationincreased &om just under 3000 mg/L on day 33 to over 3500 mg/L by day 64. SRT ranged between215 and 448 days over the course of reactor operation and had an average value. of 263.4 days. HRTwas maintained at an average of 18.7 days over the life of the reactor, Shortly after day 67 thisreactor began to exhibit a decreased efFectiveness in the removal of organics, This decrease ischaracterized by the steady increase in both COD and BOD, levels shown in Figure 4. Together withthe rise in COD and BOD, came a decrease in the reactor's biogas production. This deteriorationcontinued until the reactor was shut down on day 94 of operation.
In an attempt to determine a cause for the failure of these reactors, various operating parameterswere studied. At the time of failure, both alladhnty and MLVSS in reactor A were found to be atlevels �560 mg/L and 4740 mg/L, respectively! which were consistent with those found in earliertests conducted when the reactor had been achieving the previously mentioned removal rates.Similarly, neither alkalinity nor MLVSS levels �25$ mg/L and 3340 mg/L respectively! in reactorB were found to be abnormally low at the time of the reactors failure. Tests for total effluentphosphorus of both reactors showed concentrations �0 mg/L in A and 31 mg/L in B! which indicatelevels suf6cient to meet the nutrient needs of each reactor.
Ammonia toxicity has also been cited as a possible cause for disruption in anaerobic digestionprceesses and was therefore investigated. Ammonia nitrogen concentrations in reactor A at the timeof Mure remained in the 1680 to 1780 mg/L range through day 177. While ammonia levels between1500 and 3GGG mg/L have been shown to be inhibitory at pH levels above 7.4 to 7.6 McCarty,1964!, the fact that the reactor was operating at a pH of 7.50 and that no decrease in pH, usuallyfound during reactor failure McCarty, 1964!, was observed would tend to suggest that ammoniatoxicity was not the primuy cause of the failure. While reactor B operated in a higher pH range of

307
3000
2500
2000E 0 I f 500O 0
O 1000
500 20 30 40 50 60 70 80 90 f00DAY
~ SOLUBLE COD ~ COD MOV AVG ~ SOLUBLE BOD
Figure 4. Effluent BOD> and COD levels for Reactor B.

308
7.62 to 7.75 during failure, the ammonia concentration never reached the inhibitory 1500 mg/L levelduring operation,
Finally, cation toxicity was explored as a possible cause for the Mure of the reactors. At the timeof failure, sodium, potassium, magnesium, and calcium levels within reactor A had reached 5080mg/L, 526 mg/L, 224 mg/I., and 162 mg/L, respectively. Tests on effluent taken &orn reactor Bduring failure also revealed these four cations to be present in concentrations of 4175 mg/L, 495mgfL, 210 mg/L, and 177 mg/L, respectively. In each case, sodium is present in levels which havebeen found to be moderately inhibitory McCarty, 1964!. Inhibition observed in these reactors mayhave been mitigated through the presence of cations potassium, calcium, and magnesium! which areoften seen as antagonists in situations of sodium toxicity Kugelman and Chin, 1971!. Even with theantagonistic efFects of these additional cations, high sodium levels together with the high ammoniaconcentrations present are believed to be the cause for the unstable manner in which these reactorsoperated and the eventual cause of their failure.
The last two reactors C and D! were operated at F/M ratios of 0.10 and 0.07, respectively.These two reactors were both fed a wastewater mix representative of the processing facility's overallwastewater output and were operated for periods of 287 and 94 days, respectively. As with the retortfed reactors described previously, these reactors showed signs of failure, and were subsequently shutdown, after having earlier exhibited reductions in COD and BOD, levels of the waste.
For the period of time &orn day 22 through day 247, effluent soluble COD levels in reactor Cremained between 1250 and 3310 mg/L with an average effluent COD of 2290 mg/L These levelscorrespond to removal rates ranging &om 55/4 to 83/o with an average of 69/o. This reactor alsoexhibited BOD, removal rates, over the same period, varying between 72'/4 and 84/o with an averageof 79/o, These rates translate to effluent soluble BOD, concentrations between 893 and 1596 mg/Lwith an average of 1180 mg/L Also over this period of time it was observed that MLVSS of thereactor declined &om 3240 mg/L on day 28 of operation to 1340 mg/L by day 235. Effluent TSSlevels for this reactor ranged from 700 to 2180 mg/L over this same time with an average of 1577mg/L. Solids retention time varied between 41 and 183 days over the life of the reactor with anaverage value of 98.6 days. HRT was maintained at an average of 36.3 days over the life of thereactor. The period &om day 248 through day 276 was marked by an increase in average CODconcentration to 2730 mg/L, and was followed by substantial increases in both soluble COD andBOD, levels. As a result, the reactor was shut down on day 287 af}er eNuent COD had reached4100 mg/L, and biogas production had fallen to less than 100 ml/day. Soluble material accountedfor an average of 854/o of all COD and 944/o of all BOD, observed in reactor C effluent. As with thosefound for the retort water reactors, these levels imply that the effluent solids contained a higherportion of inorganic material than that suggested by the ratio found in solids &om the secondaryeffluent of activated sludge systems �.65 mg BODJmg TSS!.
Reactor D operated with effluent soluble COD levels between 985 and 1445 mg/L &om day 26through day 46 with an average COD of 1281 mg/L. This translates to COD removal rates ranging&om 79/o to 86'/4 with an average of 84/o. Over this period, the biogas production &om the reactorproceeded at the rate of 195 ml/day, but this rate decreased during failure to a level of less than 100mUday. During the observed reactor failure, efBuent COD levels steadily increased after day 48 to

309
over 4200 mg/L by shut down on day 94. Soluble BOD, levels remained between 833 and 891 mg/L&om day 26 through day 65 with an average of $70 mg/L for a BOD, removal rate of 83/o. Afterday 65, BOD, concentrations also began a rise, which continued until reactor shut down. Solublematerial accounted for an average of 84~/o of all COD and 99/o of all BOD, observed in reactor Deffhent over the course of reactor operation, As with the preceding reactors, these levels imply thatthe effluent solids contained a higher portion of inoqpnic material than what could be expected giventhe ratio found in solids &om the secondary effluent of activated sludge systems �.65 mg BODgmgTSS!. ESuent TSS increased over the course of the reactor operation &om 240 mg/L on day 26 to2320 mg/L on day 83, and while MLVSS remained between 2780 and 2960 mg/L &om day 26 to day46, their levels fell to 2460 mg/L by day 85. After an initial reading of 686 days, solids retention timefor the reactor decreased rapidly until it stabilized in the 102 - 112 day range. The average value ofthe SRT over the hfe of the reactor was 138.6 days. HRT was maintained at an average of 32.4 daysover the life of the reactor.
As with the retort-fed reactors, an attempt was made to discover the cause of failure in these tworeactors. Allcalinity and pH were not seen to be problems for either reactor, because alkalinity was3828 mg/L in a pH range of 7.50 to 7,65 for reactor C, and 3000 mg/L in a pH range of 7.45 to 7,55for reactor D, consistent with those values observed during the aforementioned period of organicsremovaL Loss of MLVSS was, as mentioned earlier, a problem for both mixed wastewater reactors;however, since failure of each occurred during periods of stability in this parameter and not duringperiods of decline, this loss is not seen as a primary cause of reactor failure in either reactor C or D.EfBuent phosphorus concentrations found during operation and failure in each reactor �0 to 120mg/L for reactor C and 55 to 120 mg/L for reactor D! indicate that it was present in sufhcientquantities as not to be a limiting factor for either reactor.
Ammonia levels in the reactors, @+ging &om 748 to 949 mg/L in reactor C and &om 592 to 787mg/L in reactor D, were not seen to be problems for either reactor as they never reached thepreviously mentioned inhibitory range of 1500 to 3000 mg/L
Cation toxicity, and specifically sodium toxicity, is seen as the primally cause of failure in bothreactors. As sodium has been found to be strongly inhibitory at a concentration of 8000 mg/L Kugehnan and McCarty, 1965; McCarty and McKinney, 1961!, the fiLct that the sodium level in eachreactor far exceeded this amount clearly suggests sodium toxicity. The question of how thesereactors performed as long as they did, albeit at a somewlet lower than hoped-for removal eKciency,given this sodium toxicity, can be answered via the phenomena of cation toxicity antagonism,Potassium concentrations found in both reactor C and D were consistent with those needed to act as
an antagonist for sodium toxicity Kugehnan and Chin, 1971!. Additionally, the presence ofsignificant conccmtnttions of calcium and magnesium, which are often found to be stimulatory in thepresence of another antagonist McCarty, 1964!, suggests that a multiple antagonistic efFect Kugelman and Chin, 197l; Kugelman and McCarty, 1965! may have been responsible for theextended performance exhibited while in a state of sodium toxicity,
Cation toxicity problems in any treatment system for either of these wastewaters must beaddressed in order for such a system to operate successfully. Such provisions may include an

elutriation step where the reactor sludge is periodically "washed" with &esh water which has beenpurged of dissolved oxygen, After a settling period, this water would then be Gushed out of thesystem in the same manner in which reactor efHuent is removed, thereby removing excess sodium.The reactor would then be refflled with &esh, purged water and treatment could continue.Alternatively, a periodic dumping and restarting of the reactor with new biomass could be employedwhen toxicity efFects are observed; however, this method may lead to excessive start-up times.
Based on the results of this experiment, it is suggested that processing facilities which fall underthe "existing" dassKcation, which does not have BOD, discharge limits, do not employ an anaerobicsystem for the treatment of their wastewaters unless they are prevented, in some other manner, &omdischarging directly to the environment. In this case anaerobic treatment could be used as apretreatment for disposal to the sewers. This recommendation is due to the high efBuent ammoniaconcentrations �92 - 1780 mg/L! resulting &om the anaerobic deaminization of proteins. In lightof the projected ammonia discharge limits, these levels would make direct discharge of wastewatersvery difficult even if the waters were subsequently treated for ammonia removal, and would eliminatethe possibiTity of direct discharge without such ammonia removal treatment.
In the case of facilities which fall under the "new" facilities classiffcation, and are subsequentlysubject to BOD, discharge limits, the data &om these experiments suggest that anaerobic treatmentwould be an efFective tool for the treatment of wastewaters prior to discharge to a sewer system oran aerobic, biological treatment step. It is further suggested that, if only retort process waters areto be anaerobicaHy treated, this system should be operated at an F/M ratio of 0.35 or less withimpmved removal rates to be balanced against larger required reactor volumes at lower F/M ratios!.It is also recommended that the anaerobic system include a settling chamber to increase the solidsretention time of the reactor, and thereby improve the reactor's performance. A reactor of the typestated could be expected to provide approximately 884/o removal of soluble BOD,, and result in anefBuent soluble BOD, concentration of approximately 1400 mg/L
If it is decided that the total plant wastewater stream, such as the mixed wastewater studied here,is to be anaerobically treated, the above system should then be operated at an F/M ratio between G.07and 0.10, In this treatment scheme, soluble BOD, removal rates of between 79'lo and 83/o can beexpected, resulting in efHuent concentrations behveen 870 and 118G mg/L
As stated previously, any anaerobic treatment system used to treat these processing waters mustbe monitored for cation and ammonia toxicity problems. AdditionaHy, provisions, such as theelutriation step mentioned previously, should be made to counteract any such toxicity problems that
Air tri in E crim t
Although the retort processing and sample collection methods remained the same throughout thetesting period, a great variability was found in the ammonia levels of the retort event; i.e., the towerinffuent. With the exception of one test, which had an ammonia level of about 50 mg/L, the rangeof tower influent ammonia concentrations was approximately 80 to 160 mg/L These levels areconsistent with those found in previous research involving this waste Hamson g g,, 1992!. As a

result of this variability, percent reduction in the ammonia levels was the main criteria used in thecomparison of tower performance at the various operating parameter combinations.
In the testing of the ammonia concentrations of the retort process efftuent, it was found that therewas no significant difference in the levels found in the pH adjusted tower influent as compared tothose found in the unadjusted retort process efftuent. For this reason, it is believed that the ammoniaremoval achieved in these tests can be attributed to the air stripping process alone,
Figure 5 shows the impact of varying the influent liquid Qow rate, and thereby the air to waterratio, for the tower on the treatment efficiency of the air stripping process. The graph shows that atpH 11, decreasing the liquid flow-rate from 2.2 GPM to 1.2 GPM led to an approximate doublingin removal eKciency, but a further decrease in Qow-rate to 0.6 GPM did not provide any increase inammonia removal. In tests performed at a pH of 10, however, a 74/o increase in treatment wasobserved when the flowrate was decreased from 1.2 GPM to 0.6 GPM. All tests were performed ataverage influent temperatures of approximately 56 C to 58 C. As a result of these findings, it issuggested that while the lower Bow-rate of 0.6 GPM may not improve treatment efficiency at higherpH levels �1 and above!, the higher air-to-water ratio may offset, to some extent, the deleteriousefFects of the lower pH levels �0 and below!, This may allow a choice of treatment schemes whichwould permit chemical costs to be balanced against the problems associated with lower processingrates.
Figure 6 disphys the efFect of temperature variation on ammonia removal efFectiveness at pH11.0 and pH 12.2. From this data it can be seen that an increase in inQuent temperature can beexpected to bring about some increase in treatment efficiency. This would suggest that any systemof this type be operated in such a manner that the retort e61uent be processed through the tower withthe minimum possible cooling time allowed. One cautionary point that must be stated is the fact thatthe LANPAC. packing material used in the study is not recommended for use at liquid temperaturesabove 71'C S. Joyce, LANTEC Products, personal communication, 1993!.
Figure 7 compares the treatment achieved by the tower as the pH of the inQuent stream wasvaried. It shows a small improvement from 61/o to 63/o! in removal efficiency as the inffuent pHwas raised from 10 to 11, while temperature and air-to-water ratio were held constant. A further testconducted at pH 12.2 and the same temperature and air-to-water ratio showed an increase to a 71'/oremoval efficiency.
Finally, tests performed to establish the added treatment achieved by recycling the tower effluentback through the system showed 32/o treatment for the tower dBuent recycled without mixing and51/o removal of the ammonia in the mix of tower and retort efftuent. These figures translate toeBluent ammonia concentrations of 23.8 mg/L and 30.4 mg/L, respectively. These levels of treatmentwere achieved even though the treated liquid entering the tower had an average temperature of 20'C.
An additional benefit of the air stripping process was found in the cooling effect that it impartsupon the wastewater. In the tests conducted, while the influent average temperatures ranged from50'C to 65'C, the tower efBuent was cooled to essentially the ambient air temperature �3 C-20'C!. The majority of this reduction is attributed to the cooling efFects of the tower because influenttemperature changed very little� C-4 C! over the course ofeach test.

312 e 550
E~e 50~O
45
cc 40
35
30 .S 1 3.2 I.4 t.6 1.8 2 2.2Liquid Flow Rate GPM!
Figure 5. Air stripping ammonia removal rates as afunction of liquid flow-rate; + = pH 11.0,
c3 = pH 10.0.

313
70
0 60
cc 55<o
50
I 45
40
30 20 25 30 35 40 45 50 55 60Temperature Deg. C!
Figure 6. Air stripping ammonia removal rates as afunction of influent temperature;+ = pH 12.2, 0 = pH 11.0.

314
72
70
o 66
cc 64~O
62
e 60
58
5410 10.5 11.5 12 12.5
Figure 7. Air stripping ammonia removal rates asa function of influent pH level.

315
With the exception of the trial performed at an air-to-water ratio of 225 ft'/gal, the air strippingtower produced an effluent with ammonia concentrations between 19.5 mg/L and 58.3 mg/L.
While these tests showed significant reductions in wastewater ammonia levels as a result of theair stripping process, the reductions were not as great as those stated in literature sources Kuhn,1956; Slechta and Culp, 1967; Culp and Culp, 1971!. While this reduced d5ciency could beattributed to the higher ammonia concentrations dealt with in this study, it is more likely due to ashortcoming in one or more aspects of the tower design employed here.
Speci6cally, it is believed that a liquid distribution system that is capable of introducing thewastewater into the tower as 6ne droplets could improve system performance. Spraying the wasteover the top of the tower would increase the surface area of water that would come in contact withthe air at a point before the bene6ts of the high waste temperature have been lost.
Additionally, while the blower system utilized in these tests was able to maintain a sufBcientlyhigh average volumetric air Qow, it was observed that the air flow rate varied greatly across thediameter of the tower. This may have caused a certain portion of the waste to channel through "deadzones" where a lower gas to liquid loading ratio may have resulted in less than optimal treatment.It is beheved that the use of an in-hne blower system, in which a fan, located at the top of the tower,would draw air up from the bottom of the tower, should remedy this problem and lead to higherremoval rates.
Another possible design modi6cation which could be employed in order to improve removalef5ciencies is an increase in the effective tower packing depth. This could be accomplished throughthe use of either one tower of a greater packing depth or two towers operated in series.
A concern whch must be addressed before the implementation of any ammonia stripping processis the potential for air pollution problems. The odor threshold for ammonia is approximately 35mg/m' Culp, 1978!. Care should be taken to ensure that levels present in the stripper discharge donot erceed this concentration. At an air-to-water ratio of 500 ft'/gal �.7 m'/L!, up to 129 mg/L canbe stripped without exceeding this threkold. At the 825 k'/gal �.9 m'/L! ratio tested here, it wouldbe possible to achieve removals of up to 207 mg/L of ammonia before the odor threshold became aproblmn. Removals of concentrations greater than these would most likely require the capture andtreatment of the tower ofr-gas. Odor was not a problem in any of the trials performed here.
Based on the data obtained in these experiments, it is suggested that an air stripping could be usedto reduce retort efHuent ammonia concentrations to a level where direct discharge would be possible.This tower would need to be operated at an air-to-water ratio greater than 400 ft'/gal in order toensure sufhcient ammonia removal, while minimizing the potential for air pollution problems. In theevent that direct discharge is not possible, the tower could still be used as a pretreatment to reducesewer charges.

316
CONCLUSIONS
The anaerobic reactors used in the treatment of crab retort process waters have shown significantlevels of organics removal, as shown by high removal rates observed in reactors A and B. Similarly,the performance of reactors C and D suggest that anaerobic digestion may present an alternative forpreliminaiy treatment of the total waste stream from a mechanized plant. Any use of this technologyin the treatment of either wastewater must, however, include provisions to diminish the effect of thesodium toxicity found in this study, Additional thought must also be given to the implications of thehigh concentration of ammonia found in the efBuent fmm each reactor. Finally, while the retort waterreactors produced an effluent with TSS levels in the 200 to 650 mg/L range, which may beacceptable, the reactors which were fed the mixed wastewater produced d8uent TSS levels rangingon average &om 1391 to 1587 rng/L. These levels could be reduced through the extension of thesettling period beyond the one hour allowed in these experiments. It should also be noted that thesesolids contributed a relatively small �/o to 15/o! portion of the total BOD, and COD found in thereactor e8luent.
The air stripping eqmriments showed that substantial reductions in the ammonia concentrationsfound in the retort process wastewater are possible through the use of this technology, and that thehigh temperature of the retort process wastewater aids in the accomphshment of this reduction.Consequently, it is suggested that the wastewater be treated as quickly as possible after the retortprocess in order to miminize temperature loss. Additionally, while the tests performed showed higherremoval rates were obtained as the pH of the wastewater was increased, this benefit must be weighedagainst the costs of chemicals needed to achieve this increase together with those needed to returnthe pH of the treated waste to a level that may be discharged directly to the environment. Whiledesign modifications are needed for the development of a full-scale air stripper, it is believed that thesystem considered in this work demonstrated that air stripping of ammonia is a possible treatmentalternative for the crab industry.
ACKNOWLEDGEMENT
This work is a result of research sponsored by NOAA, OKce of Sea Grant, US Department ofCommerce, under Federal Grant No. NApoAA-D-SGO45 to the Virginia Graduate Marine ScienceConsortium and the Virginia Sea Grant College Program.
REFERENCES
APHA, AWWA, WPCF. 1992. Standard Methods for the Exaniination of Water and Wastewater,18th Edition, American Public Health Association, Washington, D.C.
CROONENBERGHS, R. E. 1991. Virginia Department ofHealthinformationbulletin, VirginiaDepartment of Health, Bureau of Shellfish Sanitation, Richmond, VA
CULP, G.L. 1978. Air stripping for nitrogen removal. In Nitrogen Control and PhosphorousRemoval, D.J.De Renzo, ed.!, Noyes Data Corp., Park Ridge, NJ.

317
CULP, R.L., and G. L. CULP, 1971, Advanced Wastewater Treatment, Van Nostrand Reinhold,New York.
EMMOMCENTAL PROTECTION AGENCY. 1974. Development document for the effluentlimitations guidelines and new source performance standards of the cat6sh, crab, shrimp, and tunasegment of the canned and preserved seafood processing. OfBce of Water and HazardousMaterials. EPA-440/1-74-010-a.pp. 36-50.
GEIGER, E. L., F, W. WHEATON, R. B. BRINSFIELD, and J. E. ALLEMAN. 1985. Biologicaltreatment of crab processing wastewater. Jour. Water Poll. Con. Fed, 57�2!:1128.
EBQUUSON, T.D., G. D. BOARDMAN, and G. J. FLICK. 1992. Characterization and treatmentof wastes &om blue crab processing SciTities. Proc. of the Purdue Indus. Waste Conf., 47th, pp.775-788.
KUGELh6&t, I.J., and K. K. CHIN. 1971. Toxicity, synergism, and antagonism in anaerobic wastetreatment proces!res, in Anaerobic Biological Treatment Processes, R.F. Gould, ed.!, Advancesin Chemistry Series, Amer. Chem. Soc., 105:55-90.
KUGELMAN, I.J., and P. L. MCCARTY. 1965. Cation toxicity and stimulation in anaerobic wastetreatment. I. Slug Feed Studies, Jour. Water Poll. Con. Fed. 37:97-115.
KUGEL14GQ4, I.J., and P. L. MCCARTY. 1965. Cation toxicity and stimulation in anaerobic wastetreatment, H. Daily Feed Studies. Proc. of the Purdue Indus. Waste Conf. 19th, pp.667-686.
KUHN, P.A. 1956. Removal of Ammonium Nitrogen Rom Sewage Eff1uent, Unpublished M.S.Thesis, University of Wisconsin, Madison, WI.
MCCARTY, P.L, 1964. Anaerobic waste treatment fundamentals - Part Two: Environmentalrequirements and control. Public Works 95:123-126.
MCCARTY, P.L., and R E. MCKINNEY. 1961. Salt toxicity in anaerobic digestion. Jour. WaterPoll. Con. Fed. 33:399-415.
SLECHTA, A.F., and G. L. CULP. 1967. Water reclamation studies at the South Tahoe PublicUtility District. Jour. Water Poll, Con. Fed. 39:787-814.
U. S. DEPARTIVIENT OF COMIVKRCE FISHERIES STATISTICS DIVISION. 1990. Fisheriesof the United States 1989. U. S. Department of Commerce, National Oceanic and AtmosphericAdministration, National Fisheries Marine Service, Silver Springs, MD.
WHEATON, F.W., R.N. BRINSFIELD, K. M. LOMAX, and E. L. GEIGER. 1981. Wastewatercharacterization and treatment system development for a blue crab processing plant. Completionreport for the Office of Water Research and Technology.

318
PREVEHTXVE BAIHTjBQiRCE AHD PARTS IHVEHTORY COHTROL PROGRAMS
Geoffrey M. Knoh3.Virginia Sea Grant
Department of Food Science C Technology, Virginia PolytechnicInstitute C State University
As the title states, this paper deals with what a preventivemaintenance and parts inventory control program is and whatqualities a good program contains. . Therefore I start. with a fewdefinitions. Looking up and combining the definitions ofpreventive maintenance and parts inventory control in the NewCollege Edition of the American Heritage Dictionary, I found thatpreventive maintenance is to thwart or ward off illness by keepinga system in proper condition. For my purposes, this means using acomputer to facilitate checking a machine to keep it workingwithin set conditions so it will not fail. Paxts inventorycontxol means to use a computer to regulate the periodic survey ofall goods and materials used by or for the above mentionedmachines in stock. It's important to remember that partsinventory control refers to the inventory of parts for yourmachines not the inventory you produce.
Preventive maintenance programs are usually combined withparts inventory control programs since it is useful to keep aninventory of the parts needed for maintenance then update theinventory. Typically, a preventive maintenance 6 parts inventorycontrol program covers: Work Orders, Parts Inventory, Equipment,Purchasing and Personnel.
The work oxdez area or preventive maintenance area as it issometimes called includes a work order form that you fill outusing the keyboard. Just as with a normal preventive maintenanceplan, the work order includes the item needing work, what needs tobe done, how long it should take to do and how long it actuallytakes, equipment needed and who's available to work on the order.The computer's advantage is to allow you to look up informationabout a work order in the program's database. For example, youcould select an appropriate part from a list of parts in amachine. The computer would then fill in the appropriate area onthe form for you.
The work order area should also contain a section onperiodic or regularly performed maintenance. This area allows youto record a normal maintenance schedule. The computer thenautomatically prints work orders for you when periodic maintenanceis due on a machine. Some programs allow hook-up of sensors fordetecting when a machine is working improperly then print workorders based on that information. All programs should allowprintout of emergency work orders.

319
Sdlting work Order [Alt-PI]-help, [P3]-vendor labor, [P4]-eaployee labor,[PI 0] -menu, [P2] -done.
I Xspl oyee ' lied'1IR 4L anamea'-" ' +'a A rS+48hfls a6!lI hraII
.Nyr"-':I
I -Vendor» � Performed byII
+»press [FI]-lookup table, [CtrlpgDn]-next record, [CtrlpgQp]~rev record
factor
I
I II
I I
hra
� � -Date � � � � � Reg - � � Ot � � Mt � -----Rate- � -- Ibra hra f actor
Figure l: Work Order Screen from MP2 by Datastream Systems demo
Figure 1 above shows a work order placed for heating rods ina boiler. The screen after this shows approximate times forrepairing the boiler. After entering a time estimate, the workozder is printed and given to maintenance personnel. Aftercompleting the repair job, the maintenance personnel give the workorder sheet or a copy back to their manager with remarks andcompletion time/date. The manager enters the new information intothe PM system. Later, the manager could access this informationfor more accurate estimates or to check on the amount of overtime OT! used.
The parts inventory section keeps track of the amount instock of a particular part such as a ball beazing, how much thepart costs, the storage location of the part, the part number,possible suppliers of parts and work orders currently "out" usingthat part ~ When you close a work order which used a part, theprogram reduces the stock of the part. Similarly, if you withdrewa part from inventory during maintenance but returned it when youclosed the work order, the inventory section temporarily reducesthe number of available parts then returns the inventory to itsoriginal level when the part is returned. Of course, the stockincreases automatically when you purchase new parts.

320
Issue/Return Stock [Alt-Fl] -help, [P3] -retusn stock, [P4] -issue stock, [P2] -done.
+-Inventory---[ Item I: 28-0900-02 Type: » SAPHTY
Description: SAYXTY PLKX-yYLCE SHIHIDS H/ HEADHAHDI Order point: 6 Default order cgty: 10
Sin[[le soura ~ [y/n]: n Account code: » SATETY<:.:',"ep'N "' ~l»',"��:",;*�'.;,:,',.;:p'"4 'Wi»'+%'%»LiW
!~HxkwnL'i':.':~Xei'~r-':,:-:';.'.::,:.-',:..'.'.;,":,' : '"-,"",-".',"'.:::.:'"=;: '�'-,',";'.- -':
+:NF4%@t'dN:IÃN-Noai@[L'@@,;4%4;�,, ku+~~ gs~,,u~~W
Stock item [y/n]: y
ICHoR
>jk
5 hj
Unit ofManufe
measure: EACHcturer 8:» AH
Figure 2: Parts Inventory Screen from MP2 by Datastream Systemsdemo
Figure 2 shows the. location of safety masks for use in therepair job in Figure l. You can see by the re-order quantity thatit is almost time to order more. When the total quantity reachessix, the program automatically orders more from the vendor list which is partially obscured by the demo instructions!.
Equipment is similar to parts inventory in that it too keepstrack of parts, but instead of checking a part's stock it tracks aspecific part's date of purchase, company of purchase, the cost ofa part, and the status of the equipment. Some PM & PIC computerprograms also include a section for the part's warrantee, suitablealternate replacement parts, and generation of reports includinggraphs! based on price, company or repair history showing thefrequency of repairs.
Figure 3 next page! shows an Equipment screen where theuser searches for all equipment with the word "cartoner" in thedescription. This avoids looking for a specific part in a list ofmany but rather lists only those associated with a cartoner. Ifhe had known the exact part number he could have entered thatnumber and found the exact part he needed.
The purchasing section processes orders for new parts. Mostprograms alert you if your stock is low on a part, some evenautomatically generate a purchase request if you wish.
Figure 4 next page! shows a typical Purchase Order screenwith the parts to be ordered, their equipment number, location andcomments. Other available information is easily accessed byusing the cursor keys or a mouse to activate the scroll bars onthe right and bottom of the parts list. When hilighted, each itemdisplays all available information in the area below the partslist.

Z17215 A BLOCK BEARING PRIMARY TIMKEN SPECIAL CARTONER Ig
321
form 7able Field Nextl Prevlousl database ~Ottons persons Bun tielpCARTONER HEARING ORDER
?."Location. Cast Jester.
Rem a rks'.
Quantity'.
Order Unll
ODIFYAbc
Figure 4: Purchasing Screen from a MAXIMO demo by Project SoftwareDevelopment Inc.
Converslan.'
Unit Cost
Une Cost:
creen from a MPZIMO demo by Project SoftwareDevelopment Inc.
Medal ¹:
Catalog ¹:
Hack OrderI'
Taxed?: N

322
The pexsonnel section covers information on maintenanceworkers usually found in a payroll system. This section includesnames, address, pay rate, annual and sick leave total and used.Additionally, a PM a PIC system includes information on theirareas of expertise and how much time they have scheduled oravailable for working on preventive maintenance. This allowsprevents overworking someone or choosing the wrong person for ajob. Usually, the program accesses this information automaticallythen requests you to choose a worker and change their schedule.
In addition to the those five areas, many programs alsoinclude simple gzaphics capabilities, job plans, networkingcapability, bar code capability and data conversion. Two examplesof graphics are the ability to draw graphs from a history of partpurchases or schematics of machines. Job plans show how to zunmaintenance on a machine and what you' ll need to do the job. Anetwox'ked version of a program is one that allows multiple peopleto use the program at the same time but prevents people fromgiving conflicting orders to the program. For example, no twopeople could withdraw the same part from inventory, so when onepex'son is requesting a part on the computer another would not haveaccess to it. Bar code reading and printing allows quick accessto parts, work orders or any area of the program by using a lightpen. This helps to quickly enter most or all of the importantinformation on a part oi job without having to type it into thecomputer. Data conversion facilities allow the user to accessinformation from a variety of commercially available databases.
Areas of Concern with Computerized Maintenance & Parts InventoryControl Programs
All of these capabilities won't help you in the least if youdon't find a program that fits your needs. There are severalqualities you should look for to find a good program. They are:Cost, Ease of Installation, Ease of Use, Ability to produceoutput, Accounting Needs a Program Support. Even though the listisn'0 in any special order, the most important featuze of any PM 6PIC computer program is Cost.
Cast: Costs range free $145 for General Enercnias
EDS/Scicon's Teroman. Because of the wide range in costs, it iscrucial to know how much money you can spend on a system beforeyou go shopping. However, the price tag does not always reflectthe true cost of a system. There are a few hidden costs that youmust consider before purchasing a program. If your company isjust starting to use computers, check the computer requirements ofthe PM package you' re considering. You may have to buy morememory for your computer, a laxger hard disk and possibly you' llneed a different that is faster or more recent! computer. Makesure the programs you look at run on the operating system you use.Many systems run only on DOS or only under Windows. Both of thoseoperating environments run on IBM compatibles. A few PM programsexpect a UNIX environment. Most of these will not run on IBMcompatibles. Of course, any programs written for Macintosh

323
Apple! computers will not run on IBM's. The manufacturer ofthese programs most likely has an IBM version.
If you run a moderate to large sized company you may wantthe program to operate on a network. The main advantage ofrunning a networked PM program is many people from differentlocations in the plant can access the program at the same time.If this is an advantage you need, you may need to pay forinstalling wires for a computer network. You' ll also need aseparate computer to act as a file server. This is where the PMprogram will reside. Some companies charge extra for a networkcapable PM program or may charge for the number of computers youhooked up to the network. The number of computers connected in anetwork is the number of nodes on the network. Don't forget toinclude a way to back up all that new informat'ion you' ll beentering into the PM program � tape backups are a necessity!
Ease of Installation: This is actually a hidden cost as howlong it takes to install and enter information into the PM programdirectly effects your office's productivity. The actualinstallation time for the PM program shouldn't take more than aweek including working any bugs out of the new installation andbasic training. If a program takes longer to install than this,look for a different program.
Installation of a networked version of a PM program usuallymonopolizes the file server. Other computers on the network maybe unusable during the installation depending on the network or PMprograms implementation. Entering information into the PM systemwill take longer than this. You' ll lose the services of asecretary or two for a week, a month, or if you' re a big companyor have much information to enter, half a year or more! That' sbecause they' re entering all the item numbers, warranteeinformation, costs, all the information the preventive maintenanceprogram needs. This virtually monopolizes the computer beingused. It's a good idea to hire a temp at this time. Possibly,the software company you bought the PM program from will havesomeone to handle this. Alternately, if you don't mind taking along time to get all your information onto the system, enter yourdata for a few hours each day. This frees you to use thecomputers normally during the rest of the time but, as I said,will take longer to get ail the information into the system.
Ease of Use or User Friendliness: Once your system is up,it will take you a while to get use to running it properly; toenter work orders quickly, to find a substitute part on thecomputer, to get printouts when and how you want them. The more"user friendly" a program is, that is the more intuitive theprogram is to use, the faster you' ll learn to use it well. Beforeyou buy a PM program, test is out. Have the people you expect touse it play with a demonstration version. I feel it's a good ideato hold a meeting and discuss their thoughts on the program. Ifthe program is difficult for them to use, if they can't get thedemo to run through some simple commands after a few hours ofplaying around, it will take a long time for them to run theprogram efficiently. If this is the case I'd seriously think ofbuying your PM program from a different company.

324
If the future users of the PM program are at all familiarwith Windows, I'd use a PM program made for Windows simply becausethe user interface will be familiar to them easy to understand.With Dos programs, every new program had a different look to it,there was no standard way of doing things. Since there is astandard for the "user interface" in Windows, you know the basicsof any Windows program. This makes learning to use a new programmuch easier. Several companies make versions of their programsfor Windows, Project Software 6 Development Inc. for example. Anequally good alternative to this is to have a PM program customdesigned for your company because there you can work with thedesigners to produce an interface you like. There are companiesthat do this, C.K. Systems being one.
Occasionally, you' ll need help using the PM program. Whenyou do, you' ll want good documentation. All companies shouldprovide you with documentation as part of the cost. Documentationshould include the installation procedure, basic instructions onhow to use the program, descriptions on how to use each area indetail, a tutorial, an index with many entries and extensive crosslisting, a glossary of terms and phrases, some dos and don'ts andhow to get ahold of company for support. Instructions in thedocumentation should be concise with any explanatory notes easilydifferentiated from the instruction. This makes it easy toperform the task without having to search through severalparagraphs to find the instructions. Each area should have usableexamples to illustrate procedures listed in the text. Theexamples should be practicle; you should be able to do the exampleyourself. The tutorial does not have to be a complete course onthe software package but should at least run through all basicprocedures you' re likely to perform. Many companies provide an on-line tutorial: a computer program that runs through exercisesprompting you to make the appropriate entries and telling you whenyou make a mistake. I prefer on-line tutozials since theyactually demonstrate proper usage of the program avoiding anyambiguities from confusing printed documentation. As a whole, thedocumentation should be logically organized. That is the glossaryshould either be all the way in the back oz the front,installation instructions should be in the front of the book afterthe table of contents and/or glossary, the areas of the programyou are most likely to use should follow and be in the order ofuse � that is, an example should start in the first section andbuild upon itself in each succesive section. For example, youwouldn't remove a new type of pressure gauge from inventory whenyou haven't ordered it yet.
Lastly, many programs now have extensive on-line help. Someare even context sensitive. If the PM programs run via Windows,the help is most likely context sensitive. This means that whenyou press the help key, the first thing that appears on the screenis related to where you are in the program. For example, if I wasentering a work order and pressed the help key, I'd get a screenlisting the procedures for processing work orders. If this is notwhat, I wanted help on, I should be able to get help on anothersubject by running through a computerized index. On-line help isvery useful. The time spent on help drops when you don't have tograb a book but can access the same information through a few

325
keystrokes or mouse clicks. The help system should be quick torespond. Response time will depend on your computer's processorspeed but if you meet the program's suggested requirements youshouldn't wait more than 5 seconds.
Output: A good PM & PIC program supports a wide variety ofprinters A good networked PM program has no problems printing totwo different types of printers from two separate locations. Allgood PM & PIC programs print work orders, purchase requests andperiodic reports of inventory. In addition, most programs allowyou to print any screen in any area you have access to within theprogram. Any output from the program should be very close to itsfinal form requiring only a signature or the entry of informationnot already in the computer. Though effected by the type ofcomputer, printer and network your system is on, 10 seconds shouldbe the longest you have to wait for one page of text. Graphics,such as a parts diagram, take longer to print, ranging from 30seconds to 2 minutes depending on the complexity of the drawing.Many PM programs now include provisions to allow bar codeprinting. Bar codes typically print on label size stickers andtake few seconds to print. If the program supports bar codeprinting, it should support bar code reading also. This isusually accomplished with a light pen attatched to either aportable hand held unit or a stationary computer.
Accounting Support: This is the area I'd rate as the secondmost important in a PM & PIC program. A good PM programsautomatically updates account balances everytime you purchase apart. It also warns you of negative balances before they occur.A good PM program tracks other maintenance and labor costsallowing you to print this information in periodic reports periodic meaning weekly, monthly, quarterly, etc!. The programshould contain some facility for projecting future costs and helpyou locate areas where improvements may be made whether that's inchanging maintenance schedules or switching to another vendor fora part. This is the meat and potatoes of a PM & PIC program.Without good accounting support, the program is worthless. Afterall, the idea behing a PM & PIC program is to save you money. Ifyou have to keep track of all the costs associated with partsinventory control or preventive maintenance by hand instead ofusing a computer, most of the time you save is lost. Therefore,you should look for a program with as many automatic accountingcapabilities as possible and as many facilities to display costand labor information as you can get.
Program Support: All good PM & PIC programs will have phonesupport available. Some companies provide toll free 800 numbersfor such calls, some provide 24 hour service, some both. Allshould provide an address for user support. If they can't fixyour problem over the phone, they should send a person out to yourcompany to help. Support and service should be available from 90days to 1 year, on site, far free. Any less than this and you' regetting a raw deal! Some software companies sell use a thirdparty to provide support. This usually works out fine but thereare occasions when they will not be able to answer your questions.When this occurs, they should provide you with a telephone numberand address of someone in the software company who can help.

326
The company you buy your PM program should notify you whennew versions of their program come out. They should discount theprice of these new versions. Your warantee on the program shouldbe at least one year if not longer due to the time it takes toinstall and enter in all the data.
When you buy a PM a PIC program, the company you bought theprogram from or an authorized third party should provide aninstructional class. These usually cost around $500 if they areprovided by a third party but could be free if offered by thesoftware company. These programs may seem expensive but are worththe price in a shorter learning period for the eventual users.Sometimes the classes are offered on-site or off with the on-sitecosting a more expensive set fee as opposed to a cost perindividual for off-site classes. With enough people, the on-siteclasses are actually less expensive and save you travel time too.
There are so many Preventive Maintenance and Parts InventoryControl systems available, with a little effort, you should beable to find one that suits your needs. About the only thing agood PM 6 PIC program will not do for you is enter basicinformation into your system. With the price of CD ROM drivesdropping, lists of companies stocks may take care of equipmententering for you!
Included is Chilton's Industrial Maintenance 6 Plant
December 1992.

MAINTENANCE MANAGEMENT SOFTVYARE327
.Det.ember 1992For more information from the developers fisted, ctrcte tlte appropriate number on the IMPO Reader Service Card,
Oporoi08 00;prOorOm 100ioroo:
e
lnove 5 ome nnelcnka MN 5530510 000 $4'7
inl rated Solffmre Des inc. Maned MA 0KHS
IR0 Mec A arc. Ccsnrdnn OH 43229
JS 5 lorna lnc. WcccNand HINs CA 01387~ ~ n ~ ~ ~
JSH Seffwara Inc. Tcaado OH 43508~ $1 050 081~ ~ ~ ~~ ~
JosaIN Inc Enka NC 20720
M Umasd, MO 20079
E OR orat l
Mkrawaal savor Satnrana S InC San ' CA~ ~
M ~ Soltnero I Rceevoe MH 581 13
Ine Msm PA 18001~ ~ ~ ~ ~
OSHA. Inc
PWI ar 0 W 00057~ ~ ~
$1 450 9$1~ ~ ~ ~ ~PA I5237
~ ~ ~PMS
~ ~ ~ ~ ~ ~ ~ ~ ~ ~ ~ ~ ~~ ~ ~
Fareo ~ o ~ v ~~ ~Pnxaea 0 Inc. Herr raaemw PA 15044
Scoware SeriesPh 15205
~ ~ ~ ~ ~ ~
12 000 $10~ ~~ ~ ~ ~ ~
~ ~~ ~~ ~ ~OSIC SI S Inc
~ ~ ~ ~IJT 04157
~ ~Recancnd WA 00052
5 AsoocWes. Inc HrnsdsN IL 80521~ $7a ~ ~ ~
R Noaml PI. 33178~ ~~ ~
~ ~~ ~ ~ ~ ~ ~ ~IIMS S PA 10113
10 000~ ~ ~ ~ ~ ~ ~ ~~ 92 ~
~ ~
I ~ 100 omt
I 405 501
92 ~~ ~~ ~ ~ ~Inc., Red NJ 07701Teens 1445
~ ~~ ~Tffowaa M ~ Center New Ycrlc HY 10001
~ ~
~ ~ ~~ ~
5I1 905~ ~ ~~ ~ ~ ~~ ~ ~ ~ ~
~ $0 000 805
~ $50 MM 807
~ ~~ ~ ~ ~ ~ o~ ~ ~02$C PA 10101
~ ~ ~~ ~~ ~ ~ ~ ~ ~ ~ ~ ~~ ~WNon Areomadre are MWWad OleaeC
~ ~~ ~~ ~ 92Ie scram Soffwsre Oatvaans OR 07223
15Wlnvrasas Derv Rcnlm WA MM58
Orectrn I 5 ~ ~
Compsoy d prooromH50 Re0409 Taco
: Mero Mavev
Tosn Soovnne Covaewvas pA 15145. TMS later aNasnancw
TMA 5, Ine T OK74135
C~vr
mnTs
450
$1 750
&4'

MAINTENANCE MANAGEMENT SOFTWARE
PI0$75M l00tttt05; 00019I05 oR:
QO~,
g' KCSMS0tc7 4 SIQSISMAO'C Solutions Los Akoa CA04024
~ e ~ ~ ~ ~ ~ ~ ~ ~ ~Amencan Senrlcee Resources, Lake F CA 02020~ ~ u~ ~ ~ ~ ~ ~AHAWAH Services ~ MA 02709
iad CIM Tec ~ Inc. M MN 55447~ ~ ~sa ceneol ~ co. wcaMe OH 44092
~ ~ ~ ~ ~ ~ ~SCD S lorna Co Cock MD 21030. Raelcme Mwntenwtm
8enchnare 5 Inc. Behewew WA IM000 ~ ~~ ~ ~ ~u ~ ~ ~ ~ ~ ~ ~ ~ 4 ~~ ~ ~ ~ ~ ~ ~ ~ ~ ~ ~ ~ ~ ~Smear 6 Moore Associates. mc. Hmmon Tx 77015
~ ~ ~~ ndtewacd Services Haw Ferhekl CT 06812
~ ~ ~ ~ ~~ ~ ~ ~
510Cmdinal Natwerk Idchmond VA 32326~ ~ u d11Inc San ' CA $2071
~ ~ ~ $1 QQQ~ ~ ~ 512~ ~ ~ ~ ~~ ~ ~ ~ ~ ~ ~ $15~ ~ ~ ~ ~ ~CHUM CO dl 621
WOPM � Work Order revenave aHMnance ~ u 414~ ~ ~ ~CK Aim IVbor Ml 40100~ ndmimv Vlcskm 4 0 ~ ~ ~ ~ ~~ ~ ~ ~ 4144 Asaacmles SL Laoa MD 02142
: Outm Shet 0 ~ ~ ~ ~ ~ ~ ~ u $10 IXM~ ~ ~ ~ 4 ~ ~ 51 ~~ ~ ~Camel F MA 01701EASE Evlnl Adhated Oi ~ ~ ~ ~ ~ ~ ~ 5M~ ~ ~ ~ ~ ~ 817~ ~ ~ ~ ~ ~WA 00204
~ ~ ~ $10~ ~ ~ ~ 4 ~ ~~ ~
~ ~ ~ ~ ~ 410~ ~ ~ ~ ~ ~~ ~ ~ ~ ~ u ~~ ~ ~ ~Curanl doth»me E Kv 4'101 7
RTA nlanence ~ ~ ~ ~ ~ ~ ~ ~ ~ e ~ ~Dele Hewtoks Inc. DE 10009~ ~ ~ 57~ ~ ~ uDeenviee SC 29007
$4 995~ ~ ~ ~ ~~ ~
524u ~ ~ ~ ~ ~ ~~ ~~ ~ ~ ~ ~~ ~ ~ ~ ~ ~ u ~ ~~ ~ ~ ~ ~ ~ ~ ~ ~ 4NC 274IM
47~ ~ ~ ~ ~ ~ ~ ~ ~ ~ 4 ~E ' ~ PHnner
IVnblar PA 10002
Hmdlcn TX 77606
~ ~ ~~ ~ ~ ~ ~ ~ ~ ~ ~~ ~ECTA~ ~ ~ ~ ~ 515 000e ~~ ~
574 tXO~ ~ ~~ ~ ~ ~ ~ ~ u ~ ~ ~ ~ ~
~ ~ ~ $1 IXXI~ ~ ~ ~ ~ ~ ~~ ~ ~ ~ ~ ~ ~ ~ ~ ~LIH 65447' 55ra wlVTradref wrw 10000~ ~ ~ ~ u ~ ~ ~ e ~ ~ ~E Louis»de KY 4IR05' Tha FacRkler ~ ~
Advisor 2 I
$7 %XI~ ~ 4 ~ ~ ~ ~~ ~ ~ ~7 Inc. MH S5441
~ ~ 4~ ~ 4 u~ ~ ~ ~ ~ ~ ~ ~ u~ ~ ~ ~ ~ ~
~ ~ ~ ~ ~ ~Ftuor Oenmi lns ieenvtda SC 29001CMMS Plus ~ ~ ~ ~ ~ ~ ~~ ~ ~ ~ ~ ~ ~ ~Sensual Tech tes Co . Ccal CA 02427
~ ~ ~ ~ ~ ~~ ~ ~ ~ ~ ~ ~ ~ ~ ~WA 902074 Control S ~ ~ ~ ~ ~ ~ u ~~ ~ ~ ~ ~ ~ ~ ~ ~OP
~ ~ ~ ~ 4 e ~ ~ ~~ ~ ~ ~ ~Frank 6 Asmcielen K 80440
I tob~ 4 ~
December 1992This Buyer's Guide to Softwareis based upon survey responses from developers.
For more information from those listed, circle the appropriate number on the ifMPO Reader Service Card.
~luL-'rrwQ Q
vv'o
ge.S%>Q4
c»4
rv
~v»

329
OXIDATION AND LIPOLYSIS OF LIPIDS IN CHANNEL CATFISHDURING FROZEN STORAGE
Marilyii C. EricksonCenter for Food Safety and Quality Enhancement
Department of Food Science and TechnologyUniversity of Georgia Agricultural Experiment Station
Griffin, GA
With sales of frozen channel catfish making up about 57% of total salesdomestically, it is essential to ensure that quality of the frozen product bemaintained throughout storage. Untreated channel catfish, however, have alimited shelf-life �-6 months! due to oxidation of lipids and development ofrancid off-flavors. Consequently, to combat this problem commercially, thecatfish processing industry routinely applies an ascorbic acid-based antioxidantto their product.
Efforts to further promote stability in catfish muscle tissue have centeredon defining the contributions of individual lipid classes to oxidation. WhileSilva �0! and Freeman et al. �! have submitted that the non-polar lipids werethe major site of oxidation in catfish, the study by Erickson �! indicated thatnon-polar lipids served as the primary oxidative substrate in early phases ofstorage only. Acceleration in the rate of oxidation, on the other hand, wasassociated with oxidation of phospholipids. To explore the modifying influenceof lipid hydrolysis and ascorbic acid treatment on contribution of lipid classes tooxidation, analyses for tocopherol, ascorbic acid, headspace volatiles and lipidclass fatty acid composition were conducted in this study on frozen catfishfillets.
MATERIALS AND 1VfETHODS
Forty channel catfish, obtained from a local fish farm, were divided intotwo groups, and filleted. One group designated as 'treated' was vacuumtumbled in the presence of ascorbic acid �0 mg/150 ml deionized water! whilethe other group designated as 'control' was left untreated. Fillets werepackaged and sealed in polyethylene bags Product No. Curlon 550; CryovacCo., Duncan, SC! under atmospheric conditions before subjecting to varyingperiods �, 1.5, 3, 4.5 and 6 months! of frozen storage -6'C!. A second batchof fish, obtained one week later, were handled similarly for the secondreplication of the study.

330 ~hMuscle tissue �.0 g! was saponiflied and extracted for tocopherols
according to the procedure of Erickson �!. Quantification of alpha- andgamma-tocopherol was achieved with reverse-phase high performance liquidchromatography HPLC! and fluorescence detection �!. Gamma-tocopherolwas converted into alpha-tocopherol equivalents using a conversion factor of0.31 �!.
Extraction of ascorbic acid from muscle tissue and subsequent ion-pairing HPLC was performed as described by Thed and Erickson �2!.
Minced tissue �.5 g! was heated at 95 C for 15 min in a vial sealedwith a teflon-lined rubber septum. Gas chromatography of headspace �.5 ml!,using conditions described by Young and Hovis �3!, were used to quantifypropanal and hexanal volatiles.
Chloroform:methanol �:1, v/v! extraction of muscle tissue was used forisolation of a lipid extract �!. Phospholipid, triacylglycerol and free fatty acid FFA! fractions were obtained following thin layer chromatography of the lipidextract in 80:20:1 hexane:ethyl ether:acetic acid. The isolated fractions wereesteriflied with H2SO4 in methanol and fatty acid methyl esters were separatedby gas chromatography �!.
Microwave drying was used to measure moisture content in samples.Oxidative measurements were then expressed on a dry weight basis tocompensate for introduction of water into treated samples.
RESULTS AND DISCUSSION
No significant differences between treatments or between storage timeswere found in triacylglycerol levels of channel catfish �35.2 + 19.6 mg/g drywt! due to the large variability in triacylglycerol levels which occurred betweenfish. This measurement was therefore unable to detect lipolysis oftriacylglycerols.
Lipolysis of lipid, however, was supported by the increase in free fattyacids during frozen storage Fig. 1! ~ Initially accounting for 0.5-0.6% of totallipids, FFA's increased throughout storage such that by the end of storage, 3 to5 fold higher levels were found. The high temperature used for frozen storage -6'C! would account for the extensive hydrolysis observed in these samples,higher temperatures having been associated with increased lipolysis rates 8!. Incontrast to the fairly steady increase in FFAs during storage, over 50% ofphospholipid fatty acid losses were observed during the first 1.5 months.Decreased extractability of phospholipids and/or phospholipase activity couldaccount for these losses. Net losses of phospholipid fatty acids, however, couldnot account for the major portion of FFA generated, except at 1.5 months.These results would therefore provide indirect support for the lipolysis oftriacylglycerols in catfish muscle.
Lipid oxidation, as measured by the formation of hexanal and propanal,exhibited only slight increases during the first 3 months of storage for bothcontrol and treated samples Fig. 3!. In later stages of storage, greater increases

331
W 30NI2
~ 10
~20
Q0«C
~ 8
G
E10
2
0 0 1.5 3 4.5 6TIME MONTHS!
0 15 3 45 6
TIME MONTHS!
1,40
+1,20CLO1,00
C3
~ 80
~ eO0
40!
20
3 4.5
TIME MONTHS!1.5
Fig. 2. Hexanal and propanal content of channel catfish muscle tissuefollowing frozen storage.
Fig.l. Fatty acid content in phospholipid A! and FFA B! fractions ofchannel catfish muscle tissue following frozen storage. Stripedbar = control; Empty bar = treated.

332 in propanal than hexanal were noted, which is consistent with the lowerapparent activation energies associated with propanal formation from w3 PUFAthan with hexanal formation from w6 PUFA �!. Differences in the volatileprofile of control and treated samples were also evident after 3 months. Whilethe control sample remained stable for up to 4.5 months, thereafter the oxidativerate was much greater than the treated sample which began acceleratedformation of volatiles after 3 months of storage. Thus, the prooxidant characterof ascorbic acid in effect altered the mechanism by which lipid oxidation wasoccurring.
Examination of the tocopherol and ascorbic acid levels during storagesupported the idea that oxidative mechanisms differed between samples. In thecontrol sample, tocopherol losses were observed up to 4.5 months, whereastocopherol losses in treated samples did not occur until after 3 months of storage Fig. 3!. A reverse trend occurred for ascorbic acid, with losses observed intreated samples occurring over the first 4.5 months and losses in control samplesnot occurring until after 3 months of storage Fig. 4!. A possible explanationfor these results would be the regeneration of tocopherol by ascorbic acid intreated samples. Levels of ascorbic acid in control samples, however, appearedto have been insufficient to regenerate tocopherol, in which case, membranefatty acids would be expected to degrade soon after tocopherol reached a criticallevel �, 9, 11!.
10
BI�
C3CL4I 6
CL 1.53 4.5
TIME MONTWS!
Fig. 3. Tocopherol content of frozen channel catfish in relation to initial�-month! values.

333
~ 8
I�
6
LJC3 4CL
CL 1.54,5
TIME MONTHS!
Fig. 4. Ascorbic acid content of frozen channel catfish in rehtion toinitial �-month! values.
In line with total fatty acid changes, changes in phospholipid and FFApalmitic acid �6:0! were similar for control and treated samples Fig. 5!. Incontrast, lower concentrations of arachidonic acid �0:4 w6! in both FFA andphospholipid fractions were seen for control samples compared to treatedsamples at 4.5 months Fig. 6!. Similarly, a lower concentration ofdocosahexaenoic acid �2:6 w3! was seen in the phospholipid fraction of controlsamples than treated samples at 4.5 months Fig. 7!. Such results contrast tothe lower hexanal and propanal concentrations observed in control samples thantreated samples Fig. 2! implying that the triacylglycerol fraction was theprincipal substrate of oxidation in ascorbic acid treated samples. The reducedlevels of 20:4 w6 and 22:6 w3 in the control FFA and phospholipid fractions,on the other hand, may account for the acceleration in generation of oxidativeproducts at 6 months.
CONCLUSION
By monitoring the lipid and antioxidant levels in frozen channel catfish,the role of tocopherol in protecting membrane phospholipids and free fatty acidsfrom oxidation was supported. Ascorbic acid treated samples protectedmembrane fatty acids through regeneration of tocopherol. Simultaneously,ascorbic acid acted as a prooxidant toward triacylglycerols. Consequently, thesignificance of treating channel catfish with ascorbic acid was to shift theprimary oxidative substrate from phospholipids to triacylglycerols.

334
Fig. 5. Palmitic acid content of lipid fractions in frozen channel catfish.
0
o 1.5
Fig. 6. Arachidonic acid content of lipid fractions in frozen channelcatfish.
CLC!
3 4,5
TIME MONTHS!
3 4.5
TIME MONTHS!

335
p.Ch p 1.54.5
TIME MONTHS!
Fig. 7. Docosahexaenoic acid content of lipid fractions in frozen channelcatfish.
REFERENCES
DILLARD, C.J., V.C. GAVINO and A.L. TAPPEL. 1983. Relativeantioxidant effectiveness of alpha-tocopherol and gamma-tocopherol in iron-loaded rats. J. Nutr. 113:2266-2273.
ERICKSON, M.C. 1991. Extraction and quantitation of tocopherol inraw and cooked channel cfish. J. Food Sci. 56:1113-1114.
ERICKSON, M.C. 1992. Variation of lipid and tocopherol compositionin three strains of channel catfish �cralurus punctatus!. J. Sci.Food Agric. 59:529-536.
ERICKSON, M.C. 1993. Compositional parameters and theirrelationship to oxidative stability of channel catfish. J. Agric.Food Chem. 41: 1213-1218.
FRANKEL, E.N. 1993. Formation of headspace volatiles by thermaldecomposition of oxidized fish oils vs. oxidized vegetable oils. J.Am. Oil Chem. Soc. 70:767-772.
FREEMAN, D.W., C.W. SHANNON and J.O. HEARNSBERGER.1991. Rancidity-related aldehydes in selected catfish tissue asaffected by Lem-0-Fos injection and frozen storage. p. 20-27.4: Proceedings of the 19th Annual Catfish ProcessorsWorkshop. Information Bulletin 209, Mississippi StateUniversity, Mississippi.

336
FUKUZAWA, K., S. TAKASE and H. TSUKATANI. 1985. The effectof concentration on the antioxidant effectiveness of u-tocopherolin lipid peroxidation induced by superoxide free radicals. Arch.Biochem. Biophys. 240:117-120.
7.
LOVERN, J.A. 1962. The lipids of fish and changes occurring in themduring processing and storage. p. 86-111. In: E. Heen and R.Kreuzer eds!, Fish in Nutrition. Fishing News Books! Ltd.,London. pp. 86-111.
MIKI, M., H. TAMAI, M. MINO, Y. YAMAMOTO and E. NIKI.1987. Free-radical chain oxidation of rat blood cells by molecularoxygen and its inhibition by a-tocopherol. Arch. Biochem.Biophys. 258:373-380.
9.
10. SILVA, P.L. 1991. Effect of dietary vitamin E and proteinsupplementation on the storage stability and yield of channelcatfish Ictalurus punctatus!. M.S. thesis, Mississippi StateUniversity, Mississippi.
11. TAKENAKA, Y., M. MIKI, H. YASUDA and M. MINO. 1991. Theeffect of e-tocopherol as an antioxidant on the oxidation ofmembrane protein thiols induced by free radicals generated indifferent sites. Arch. Biochein. Biophys. 285:344-350.
12. THED, S.T. and M.C. ERICKSON. 1992. Absorption of dissolvedascorbate by live channel catfish Ictalurus punctatus!. J. FoodProc. Preserv. 16:185-192.
13. YOUNG, C.T. and A.R. HOVIS. 1990. A method for the rapid analysisof headspace volatiles of raw and roasted peanuts. J. Food Sci.55:279-280.

337
A SIMPLE, RAPID SOLVENT EXTRACTION METHODFOR DETERMINATION OF TOTAL LIPIDS IN FISH TISSUE
C.M. Lee, B. Trevino and M. Chaiyawat
Department of Food Science and NutritionUniversity of Rhode Island, Kingston, RI 02881
Several solvent extraction methods have been available for fish lipidextraction. Some of them are as follows. i!2Hgggdgg: 2 I I 4.442 dICHCH- Id*OH ' I glg '
was blended with 760ml and 400ml solvent in two steps; Later, Bligh and Dyer�! used 1 CHC13-1 MeOH in a two-step extraction where 100g tissue was blendedwith 200ml MeOH and 100ml CHCb, followed by 100ml CHCb, and the residueblended with 100ml CHC13 and rinsed with 50ml CHCI3; Hubbard et al. �! used2 CHCb-1 MeOH at a 20 solvent - 1 tissue ratio by weight as a streamlinedversion for simplicity and rapidity; ii! 1: Hara andRadin �! used 3 hexane-2 isopropanol where lg tissue was blended 18ml solventand nonlipid fraction was removed with 12ml 6.25% sodium sulfate. However,incomplete extraction of proteolipid protein and gangliosides was noted; and iii!
was tried by Swaczyna and Montag �! wheremethylene chloride replaced chloroform to reduce toxicity. Nevertheless,methylene chloride poses a problem because of its low boiling point �9.7C!compared to chloroform �1C!. Such a low boiling point may result in solventlosses due to rapid evaporation during blending and filtering leading to somewhaterroneously increased yield.
Recently, Erickson �! compaxed 9 different solvent systems on catfish tissuelipid extraction using a screw-cap test tube �6 x 125mm! and a vortex with about20 volume of solvent. The size of the test tube used limits the sample size to lgbased on a solvent to tissue ratio of 20. She concluded that CHC13-MeOH waspreferred to other solvent systems hexane: isopropanol and CHCb: isopropanol!which required longer evaporation time. She also noted that exposure of the tissueto methanol prior to chlroform was necessary for the methanol-chloroform solventextraction system. Although this method offers low volume solvent usage,simplicity and rapidity, it has some drawbacks, namely, limited sample size notmore than 1 g! will require extremely uniform sample to minimize variability, andpiessure build-up inside the tube and two-minute holding during vortexing couldaccompany safety hazards. Also the vortexing may well result in inadequatedisintegration of tissue compared to mixing in the blade-equipped blendor. Such aninadequate breakup of sample tissue may prevent complete extraction of lipid fromthe tissue.
Since one way or another all previous methods appear to have somedrawbacks, either lack of reproducibility and precision or laborious and time andsolvent-consuming nature, we decided to develop a simple, rapid extraction

338
method with a high reproducibility and precision based on the CHCb-MeOHsolvent system through a thorough exainination of various procedural variables.
MATERIAL AND METHODS
Sample Preparation
Cod Gadus morhua! and mackerel Scomber scombrus! were chosen forlean and fatty species. Fish was filleted, cut into small pieces and homogenized in akitchen Waring blender. The resulting paste free of bones, skins and scales wasused as sample for solvent extraction.
Procedural variables
A single extraction with the CHCb-MeOH mixture was employed for lipidextraction throughout the study. The following procedural variables were examinedto determine the optimum conditions for maximum allowable extraction of lipids.The solvent volume to sample weight ratio was varied from 2 to 14. The CHC13 toMeOH ratio was varied from 1 to 16 plus 100% CHC13. Phase separation time wasvaried from 30 min to 6 hrs.
Lipid extraction procedure
The paste weighing approximately 5 g was placed into the 250 ml capactyEberbach homogenizer which has a narrow stem and a wide upper body andopening. Such geometry allows efticient blending with a smail amount of solventand large headspace which prevents solvent spilling. The varying amounts ofsolvent were added to vary the solvent to sample ratios at the varying ratios ofCHCb to MeOH. The mixture was blended for 1.5 min at a moderate speed usinga rheostat to maintain constant speed. The high speed resulted in solventvaporization and temperature rise. The homogenate was filtered through a coarse,fast speed filter paper �2.5 min diameter! and funneled into 100 ml glass stopperedgraduated cylinder. The wet cake was pressed with a round tip of spatula tosqueeze out the remaining solvent The final volume of filtrate varied with the batchof sample and species. The losses of solvent in the form of residue left in thehomogenizer after blending-pouring out and soaked into the filter paper afterfiltering were taken into account in yield determination.
To separate the filtrate into two phases, namely, methanol and chloroform,20 ml 0.5% NaCl solution was added and gently shaken by tilting the graduatecylinder four times, and the mixture was let stand for 30 min or until a clearseparation is visible. The NaCl solution was added to prevent the formation of astable emulsion. At this point the volume of the chloroform layer should be equal tothe theoretical value minus the losses that occurred during blending and filtering.The theoretical volume of chloroform for 2 CHCb:1MeOH is 50 x 2l3 = 33 ml.
For the determination of the yield of lipid extracted, 5 ml of chloroform layerwas removed with a 10 ml pipet and transferred into a preweighed to one mg! 10ml beaker, and evaporated off on a Corning hot plate PC-35! at the setting betweenlow - 2, avoiding excessive heating and drying.

339
Calculation of yield determination
Lipid content %!
sainple weight g!r+ n
5ml
* The combined volume should be close to the theoretical calculated value.
Performance analysis
The analysis of variance was employed to determine the significance ofvariations due to treatments, namely, solvent ratio and sample size. Theperformance of the proposed method was evaluated for its reproducibility, precisionand rapidity. Standard deviation and % variability from the mean were used todetermine the degrees of reproducibility and precision, respectively.
RESULTS AND DISCUSSION
Table 1 shows how phase separation time after addition of 0.5% NaClsolution affected the amount of fat measured.
Table 1. Effect of phase separation time on the amount of lipid measured
TIME hour! CLARITY LIPID measured %!
1/2 opaque, 16.50but visible separation
slightly clear 16.84
16.28
very clear 16.34
The amount of lipid measured remained constant regardless of the time ofsampling as long as a visible separation had occurred. This indicates that there isno added advantage of lengthy waiting for clear separation. Although the opacitywas a result of emulsion which contained some level of protenaceous substances,based on the above result no significant impact of such protenaceous matter was ~noted on the amount of hpid measured. Therefore, for time saving it is advisableto take sample out as soon as a visible separation occurs.
Table 2 and 3 present the differences in lipid extraction behavior between ldan cod! and fatty mackerel! in relation to solvent ratio and sample size. For leanfish, the more polar solvent extraction system � MeOH: 1 CHCb! was moreeffective than less polar solvent extraction system � MeOH: 2 CHCb! especiallyas the sample size got larger. Compared to lean fish, fatty fish reacted sharply tothe solvent ratio and sample size. As the polarity of the solvent increased withincreased sample size, the efficiency of lipid extraction dropped drastically. Forinstance, at 1 MeOH: 2 CHCb the lipid extracted from mackerel ranged from11.1% to 9.96% while at 2 MeOH: 1 CHCb it dropped from 10.6% to 1.90%.

340
This was clearly supported by much greater F values for effects of solvent ratio andsample size as well as their interaction for fatty fish than lean fish.
Table 2. Variations in lipid extraction for cod lean fish! as affected by solvent ratioand sample size
SAMPLE SIZE gm/50 rnl solvent!1 3 5 7 9 F4,is
1.2G a 1.12 ab 1.05 b 1.04 b 1.03 b 4.23
1.12 a 0.94 b 0.93 b 0.93 b 0.90 b 32.79
1.34 a 1.G4 b 0.86 c 0.74 d 0.72 d 36.43
SOLVENT RATIO MeOH:CHCb!
2:1
1:2
Effect of solvent ratio F2,is!: 30.12Effect of sample size F4, is!: 51.28interaction Fs,is!: 10.94~ Different letters in the same row are significantly different P < 0.05!
Table 3. Variations in lipid extraction for mackerel fatty fish! as affected bysolvent ratio and sample size
SOLVENT RATIO SAMPLE SIZE gm/50 ml solvent! MeOH:CHCb! 1 3 5 7 9 F4,is
2:1 10.6 a 10.1 a 4.42 b 2.53 c 1.90 d 901.4
10.8 a 10.2 b 10.1 b 6.59 c 5.65 d 432.1
1:2 11.1 a 10.3 b 10.1 b 10.0 b 9.96 b 12.8
Effect of solvent ratio F2,is!: 1021Effect of sample size F4,is!: 827interaction Fs,is!: 284~ Different letters in the same row ase significantly different P 0.05!
LIPID CLASS COD �! MACKEREL~ 9o DISTRIBUTION!
POLAR phospholipids!NON-POLAR triacylglycerol!
13.286.8
88.111.8
~ B. Trevino, 1991, Univ. of Rhode Island, unpublished data
The observation of lean fish favoring a polar solvent � MeOH:1 CHCb! isexplained by the foilwing lipid class analysis where lean fish lipid is mostlycomposed of membrane-bound phospholipids whereas the fatty fish is composed oftriacylglycerols.

341
Our earlier study 8! showed that maximum lipid extraction was achieved in thesolvent ratio range from 2 CHCb:1 MeOH to 5 CHCb:1 MeOH and the solvent tosample ratio of equal to or above 10. No significant increase in hpid extraction wasnoted beyond 10 up to 17, but at the ratio of 50 �0 ml solvent to 1 g sample!,sigmficant increases in lipid extraction Tables 2 and 3! was observed at mostsolvent ratios. However, the use of such a small sample will run into anunacceptable level of variability unless the homogeneity of the sample is assured.
Based on the above results, it was decided to use 2 CHC13:1 MeOH as anoptimum solvent ratio for fatty fish such as mackerel whose lipid content is higherthan 6% and composed of largely triacylglycerols, and 1 CHCb:2 MeOH for leanfish such as cod whose lipid content runs less than 2% and composed of mostlyphospholipids; and to use 10 �0 ml solvent to 5 g sample! as an optimum solventto sample ratio for both lean and fatty fish. It is possible to see incompleteextraction at this ratio when the lipid content is very high > 20%!, the portion notincluded in the measurement is likely insignificant.
The level of reproducibility and precision of the proposed method whenmackerel was tested is shown in Table 4.
Table 4. The degree of reproducibility and precision of the proposed solventextraction method.
SAMPLE WT g! CHCb LAYER ml! LIPID extracted mg! LIPID content %!+ CHCb lost
blending and filtering*
5.01 141.68 18.66
5.01 141.32 18.67
5.02 18.74
5.00 18.57
18.66 + 0.069
VAR5&ILITY RANGE 2 0.37%
Mackerel was tested using 2 CHCb:1 MeOH at 50 ml solvent to 5 g tissue.~ 1 ml left in the homogemzer and 3 ml soaked into the filter paper during filtering
The average value of actual volume of CHCb came out to be quite close to thetheoretical volume, 33 ml, which is obtained from calculation. 'Ms suggests that ifall procedural steps are taken carefully under the precise control, one can use thetheoretical volume on a routine basis without getting the precise volume of CHCbby hard squeezing every drop out of the wet homogenate. However, a closefollow-up of the procedure is advised for the good monitoring purpose.
29+4
29+4
29+4
28.8+ 4
142.56 .
141.57
MEAN + S.D.

342
CUT THE SAMPLE INTO SMALL PIECES or GRIND IF LARGE.
HOMOGENIZE or CHOP! IN A WARING BLENDER.
WEIGH OUT THE PASTE �.0 - 5.1g; RECORD THE EXACT AMOUNT! andPLACE IT INIO AN 8580!�50 ml capacity;FISHER 14-509-25!.
3.
4. ADD 50 ml SOLVENT: 1 MeOH - 2 CHCI3 for HIGH FAT FISH > 6%',LIPID COMPOSED OF MOSTLY TIUACYLGLYCEROLS!2 MeOH - 1 CHCla for LOW FAT FISH 2%;LIPID COMPOSED OF MOSTLY PHOSPHOLIPIDS!
5. BLEND FOR 1.5 MIN AT A MODERATE SPEED USE A RHEOSTAT TOCONTROL THE SPEED!
6. FILTER THE HOMOGENATE THROUGH A COARSE FILTER PAPER FAST SPEED!, AND FUNNEL INTO AN 100 ML GLASS STOPPEREDGRADUATED CYLINDER FISHER 08-5650! TOWARD THE END OFDRAINING, PRESS THE CAKE WITH THE ROUND TIP OF SPATULA TO SQUEEZEOUT THE REIVGVNING SOLVENT; BE SURE TO INCLUDE THE SOLVENT LOSSESDURING BLENDING I ml! AND FILTERING � ml! IN THE FINAL AMOUNT OFFILTRATE FOR CALCULATION!
ADD 20 ml 0.5% NaC1 SOLUTION AND GENTLY SHAKE BY TILTING 4TIMES.
8. STAND UNTIL A VISIBLE SEPARATION OCCURS TAKES 30 MIN ORMORE!
10. EVAPORATE OFF THE SOLVENT ON A CORNING HOT PLATE AT THESETTING BEPA~N LOW - 2, AVOIDING EXCESSIVE HEATING ANDDRYING.
11. WEIGH THE BEAKER TO ONE mg! AND OBTAIN THE WEIGHT GAINAS A WEIGHT OF LIPID EXTRACTED.
Lipid content %!
*x 100sample weight g! 5ml
~ should be close to the theoretical calculated volume.
9. USING A 10 ml PIPET, REMOVE AN ALIQUOT OF MORE THAN 5 ml OFCHLOROFORM LAYER AND TRANSFER AN EXACT 5 ml INTO APREWEIGHED TO ONE mg! 10 rnl BEAKER.

343
REFERENCES
l. ADDISON, R.F., R.G. ACKMAN and J. HINGLEY. 1968. Distribution offatty acids in cod flesh lipids. J. Fish. Res. Bd. Canadian 25: 2083-2090.
2. BLIGH, E.G. and W.J. DYER. 1959. A rapid method of total lipid extractionand purification. Can. J. Biochem. Physiol. 37: 911-917.
3. ERICKSON, M.C. 1993. Lipid extraction from channel catfish muscle:comparison of solvent systems. J. Food Sci. 58: 84-88.
4. FOLCH, J., M. LEES and G.H. SLOANE STANLEY. 1957. A simple methodfor the isolation and purification of total lipids from animal tissues. J. Biol.Chem. 226: 497-509.
5. HARA, A. and N.S. RADIN. 1978. Lipid extraction of tissues with a lowtoxicity solvent. Anal. Biochem. 90: 420-426.
6. HUBBARD, W.D., A.J. SHEPPARD, NEWKIRK, D.R., PROSSER, A.R.and OSGOOD, T. 1977. Comparison of various methods for theextraction of total lipids, fatty acids, cholesterol, and other stero1s from foodproducts. J. Am. oil. Chem. Soc. 54: 81-83.
7. SWACZYNA, H. and A. MONTAG. 1984. Beltrag zur analytischenErfassung der Cholesterylfettaureester in biologischem MaterraL FetteSeifen Anstrichmittel. 86: 436-446.
8. TREVINO,.B. and C.M. LEE. 1990. Factors affecting solvent extractionefficiency in fish lipid analysis. Proc. of Tropical and Subtropical Fish.Technol. and Atlantic Fish. Technol. Conf. p. 134-140, Dec. 2-5,Orlando, FL.
ACKNOWLEDGEMENT
Contribution ¹ 2918 of the College of Resource Development, University of RhodeIsland, with support from Rhode Island Agricultural Experiment Station, the Officeof Sea Grant, NOAA, and National Fisheries Institute.

344
MOISTURE CONTENT OF NORTH CAROLINA BAY, CALICO AND SEASCALLOP MEATS AT HARVEST, PROCESSING AND RETAIL
David P. Green and Relno KorhonenNorth Carolina State University
Department of Food ScienceSeafood Laboratory
PO Box 1137
Morehead City, NC 28557
During the Sdl of 1992, the U.S. Food and Drug Administration FDA! issued an interim labelingpolicy for scaHops treated with sodium tripolyphosphate STP! and water. The policy required thatscallops found to have a moisture content exceeding 80 percent but less than 84 percent water belabeled as an "X Percent Water Added ScaHop Product" in addition to ingredient declarations �!.The new policy was designed to provide consumers with a better indication about the amount ofwater in the scaHop products they purchisoi Shortly after release of the new labeling policy, the U.S.Dept. of Commerce USDC! Voluntary Seafood Inspection Program issued guidelines to its Geldinspectors for compliance with the FDA policy �!. Most major U.S. sea scallop processors weremade aware of this policy and took the appropriate steps to monitor and label their productsaccordingly. A few smaller processors, namely southeastern U.S. bay and calico scallop processors,were less aware of the FDA interim labeling policy.
In March of 1993, a North Carolina scallop processor contacted the N.C, State UniversitySeafood Laboratory for assistance in moisture deteamination of calico and bay scallop meats. Theprocessor had requested USDC lot inspection but was not equipped to perform required moistureanalyses for inspection services. Fortunately for the processor, samples sent to the NCSU SeafoodLaboratory in March were found to contain less than 80 percent water. The product was USDC lotinspected, stamped and shipped to the buyer. Concern was expressed by other NC scallop processorsfor the 80 percent moisture labeling policy, especially for bay scallops whose water content wasknown to fluctuate with season and environmental conditions.
As a result of these concerns, NCSU Seafood Laboratory personnel, supported with a rapidresponse grant &om the UNC Sea Grant College Program, began a study to assess moisture levelsin North Carolina bay, calico and sea scallop meats. The study consisted of two parts: a randomsurvey of scallop meat moisture at harvest, after processing and in retail establishments; and acontrolled study using live bay scallops to determine the influence of salinity at harvest on naturalmeat moisture levels.

345
MATERIALS AND METHODS
BB I a ' B flgBI ~W ~ ~dggglll d fgll3~ pgdd 'gg d IAPB.ABy dl I 3BP
shellstock and commercially shucked meats were obtained when available &om North Carolinadealers and processors. Sea scallop meats were sampled &om retail establishments only. Live bayscallops were purchased &orn a commercial mariculture facihty on Harkers Island, North Carolinain order to study influence of salinity fluctuations e.g., rainfall! on meat moisture at harvest, AHsheHstock was transported live above ice in coolers to the NCSU Seafood Laboratory, MoreheadCity. Scallops were hand-shucked, rinsed lightly with water to remove grit and particulate matter andpatted dry with a paper towel. A minimum of 25 scaHops was shucked for sample preparation,CommerciaHy shucked scaHops purchased at wholesale and retail stores were composites obtained&om one gallon containers of scaHops. AH scallops sampled sheHstock and shucked meats! duringthe random survey and the controlled salinity studies were obtained in duplicate unless otherwisenoted.
-Apl y dy I pgpp ' pg e dlpadductor muscles. Methods using a Waring commercial blender No. 7011!, Waring commercial foodprocessor No. FPC10! and Hobart commercial mixer No. D-300-T! equipped with a grinderattachment and 3 mm perforated plate were compared. Fresh sea scallops were purchased &om alocal market for use in the preHminary study. A composite was made by mixing 3-one galloncontainers of scallops. Scallops were subdivided into four equal portions. Three portions of thescallops were &ozen -23'C! for later use. Each method of preparation was performed in triplicatefor each of the four replicates. Approximately one hundred grams were placed into a blender jar Eberbach Corp., 500 cc capacity! and chopped, using the Waring blender, speed set on low, for 4-five second intervals. Approximately three hundred grams were placed into the Waring foodprocessor and chopped for 20 seconds. Approximately three hundred grams were ground 3consecutive times through the 3mm perforated plate attached to the Hobart mixer operating on aspeed setting of two. AH subsequent samples analyzed during the random survey of North Carolinascallops and the controlled salinity studies were prepared using the Waring blender method.
*-I *dl lygl* ' ' AP l-l.g 3 pl f~ pwere placed in pried, alumimnn pans and weighed on a Mettler No. H51AR! analytical balance.Total moisture was determined using the AOAC procedure with a preheated forced air convectionoven Blue M, Series JT-5747! set at 125'C for 4 hours �!. Dried samples were placed in desiccatorsto cool, then reweighed and the percent moisture calculated. The blender preparation method,aaalydcal bahnce and forced air convection oven were used throughout the remainder of this study.
Random Survey of North Carolina Scallops
g~rv � Bay scallops sheHstock! were obtained &om North Carolina dealers and processorsduring April and May. Additional bay scallops were purchased live &om Carolina Cultured SheHfish,Harkers Island in May and June for use in controlled salinity experiments. Salinities occurring atharvest were recorded when available using an American Optical T/C Re&actometer BufFalo, NY!.Calico scallops sheHstock! were obtained during ofF-loading of tractor trailer shipments &om the

346
west coast of Florida during April and May.All sheHstock was hand-shucked in the laboratory, rinsed with water and patted dry with papertowels. AH meats obtained were counted and weighed to determine the relative size of scallops i.e,,counts per pound! used for moisture determinations.
Parce~sin � CommerciaHy processed bay hand shucking! and calico atmospheric steamshucking! scallops were obtained at the point of packing in one gallon containers. AH samples werekept on ice in whirltop bags for transport. CommerciaHy shucked scallops were treated in the samemanner rinsed with water and blotted dry! as sheHstock in the laboratory. The number of adductormuscles per sample weight was noted for each sample analyzed.
~R' -Random samples of bay, calico and sea scallops were purchased at various retail marketsacross North Carolina. Information concerning the source of scallops i.e., wholesale distributors andprocessors! was obtained when possible. Samples were placed in whirltop bags on ice for' transportand moisture analyses were performed within 36 hours of sample coHection.
Controlled Study of Salinity Effects on Scallop Moisture
Bay scaHops, harvested fiom natural surrounding areas, were placed in concrete racewayssupplied with continuous running seawater at Carolina Cultured Shellfish. Natural salinity of theseawater during the study period was 30 ppt. Salinity conditions were modified by mixing seawaterwith continuous running well water. Live scallops were subjected to reduced salinities for 24 hoursprior to sampling. Modified salinities conditions were 13, 15, 18 and 20 ppt. Scallops exposed for24 hours to reduced salinities of 13 ppt aH! and 15 ppt most! had perished. Only live scallops fi'ommodified salinities of 15, 18, 20 ppt and controls �0 ppt! were used in the study. AH scaHops weretransported above ice in coolers and shucked immediately upon returning to the laboratory. ScaHopswere rinsed with water and patted dry with paper towels. For controHed salinity experiments, enoughscaHops were luuvested to prepare samples in triplicates. During aH other sample coHections, enoughscallops were harvested to prepare duplicate samples.
RESULTS AND DISCUSSION
A summary of results obtained during the preliminary study of sample preparation is given inTable 1. No significant effect between methods of preparation and moisture content determined forscallop meat was found. As a result of these findings, the blender method was selected for use in thisstudy because smaller sample size and less time were needed in sample preparation,
Data obtained during the 1993 random survey of moisture in North Carolina scallops are summarizedin Table 2. The study confirmed previously reported research that showed moisture content in bayscallops routinely exceed the 80 percent moisture level set under the FDA interim labeling policy �!.Mean moisture values for bay and calico scallops were within previously reported ranges for NorthCarolina harvested bay �4.15 - 83.66 percent! and calico �6.12 - 81.86 percent! scallops. Mean

347
values for sea scallops 86.311 percent! collected at retail under the present study were found toexceed the 84 percent mamnum moisture content allowable under the interim labeling policy. Thesedata support FDA's concern for excessive moisture content of sea scallops entering interstatecommerce. The range for moisture in sea scallops previously reported was 74.63 - 80.97 percent �!.
Table 1. Comparison of preparation methods used for moisture analyses.
'Mean+ S.E. 'Mean+ S.E.Method Sample
Waring blender 87.537+ 0.026 87.495 + 0.22287.282 + 0.172
87.720 + 0.201
87.440 + G.160
Waring foodprocessor
87.705 + 0.027 87.774+ 0.17787,835 + 0.105
87.922 + 0.238
87.630+ 0.073
Hobart grinder 87.783 + G.022 87.801 + 0.22087.813 + 0.209
88.07G + 0,076
87.536+ 0.04G
'Values are mean+ standard error of means for 3 replicates.'Values are mean + standard error of means for 12 repbcates.
During the Webb @ g. �969! study at N.C. State University, bay scallops were sampled at monthlyintervals Rom known locations in Bogue and Core sounds, North Carolina. Calico scallops weresampled Rom the Atlantic Ocean, 10-20 miles southelst of Beaufort Inlet. All samples were analyzedfor total moisture, protein, crude lipid, ash and glycogen. Total moisture was determined in a vacuumoven at 65 'C for 16 hours.
The study concluded that proximate composition varied widely among locations and months ofharvesting for the species studied. CoeKcients of variances were low for moisture and protein buthigh for lipid, glycogen and ash. Ranges for components were similar for each species, but thevariation for any selected component e.g., moisture! was large. As a result, variations in proximatecomposition were large enough to prohibit the establistunent of standards for the U.S. scallopindustry, The results supported the hypothesis by the authors that environmental factors contributeto differences in proximate composition.

348
Table 2. Summary of random survey of North Carolina scallop moisture.
Type Value Form
Processed Dry!SheHstock
Bay N 24
X+ S.E. 82.573 + 1.358
80.791 - 84.085
80.324+ 1.274
77.471 - 82.547
83.043+ 0.825
81.815 - 84.294Range
10
X+ S.E. 77.736+ 1.051 79.279+ 1.365 78.620+ 0.142
76.134 - 79.179 77.700 - 81,181Range
Sea N 13
X+ S.E.
Range
86.311 + 1.630
82.883 - 88.133
To test the hypothesis, a series of controlled salinity experiments was conducted to study theinfluence of salinity on scallop meat moisture at harvest. Bay scallops were used for study becauseof pmximity to the naturml resource and documented meat moisture exceeding the minimum labelingrequirement. Results &om this study are summarized in Table 3.
Scallop meat moistures were found to be inversely related to salinity at time of harvest. Acorrelation coefficient of -0.951 was calculated &om a linear plot of water salinities versus meatmoisture Figure 1!. These data support the hypothesis that environmental conditions at harvestsignificantly contribute to differences in proximate composition of scallops. Data also supportindustry observations that bay scallop moisture can vary widely at harvest as a result of severeweather conditions such as heavy rainfall.

349
The study concluded that proximate composition varied widely amonglocations and months of harvesting for the species studied. Coefficients ofvariances were low for moisture and protein but high for lipid, glycogen andash. Ranges for components were similar for each species, but the variationfor any selected component e.g., moisture! was hrge. As a result, variationsin proximate composition were large enough to prohibit the establishment ofstandards for the U.S. scallop industry. The results supported the hypothesisby the authors that environmental factors contribute to differences in proximatecomposition.
To test the hypothesis, a series of controlled salinity experiments wasconducted to study the influence of salinity on scallop meat moisture atharvest. Bay scaHops were used for study because of proximity to the naturalresource and documented meat moisture exceeding the minimum 1'ibelingrequirement. Results from this study are summarimd in Table 3.
Scallop meat moistures were found to be inversely related to salinity attime of harvest. A correlation coeffk~it of -0.951 was calculated from alinear plot of water salinities versus meat moisture Figure 1!. These datasupport the hypothesis that environmental conditions at harvest significantlycontribute to ddferences in proxhnate composition of scaHops. Data alsosupport industry observations that bay scallop moisture can vary widely atharvest as a result of severe weather conditions such as heavy rainfall.
Figure 1. Correlation of Meat Moisture with Water Salinity
>o
8
2 80
70 10 15 20 25 30 35
Water Salinity, ppt

350
Ch
o o +Io
o O +I o +IQ CVQ
Q +I O +I
Q O 00O +I
o NM reoX
ao w M 00 ~ 00m $ e4 w $ wOO OOOO+I +I +I +I +I +I
00
ch K O O O
00 Ch Ch
~OOOOO+I +I +Ie e
00W~ChO O Ch00 00
oo~oOC5C OOO OOOO+I +I +I +I +I +I
O O & vlQ Ch Ch
aot C e4! Ch Ch Ch
2A8~%+Io g
OOQ+I +I +Iao M ChCl Vla %O
Vl
C OV
QCht AQ0000 W O ~ Ch
cu c
o~oeoen X 4 '% W elch ~ ~ao w t ao
~C".Wt ~Ch~Veau~C4 O
Ot ao<ao~% n A A O aoeaawt aoc
Ch Ch Ch O Q Ot C c
c- e- r c r c
8~ 5
6O 8:8
O 0 0 C8
5'
Z
O O O Q O O 00 00 00 O O O

351
Implications &om this study are: meat moisture at harvest for North Carolina bay scallopscontradicts current interim labeling requirements enforced by the FDA and USDC inspectionprograms; handling practices in commercial processing of scallops can signi6cantly increase amountof moisture content without direct soaking of scallops in phosphate solutions; and regulatory policiesbased on moist content must take into account both natural fluctuations in moisture and incidentalwater uptake in processing on a species by species basis.
CONCLUSIONS
This study veri6ed previously reported research on natural Quctuations in moisture contentassociated with North Carolina bay scallops, It correlated the fluctuations in meat moisture to salinityconditions at harvest. The study provides evidence both in favor of and against the current interimlabeling policy issued by the U.S. FDA. Further study of natural and incidental pickup of meatmoisture appears warranted, based on the current regulatory policy and species to species variationdemonstrated in this study.
1. AOAC, 1990. OKcial Methods of Analysis. 15th Edition. Association of OScial AnalyticalChemists, Inc. Arlington, VA.
2. PUTNAM, G.L. 1992. Policy on scallops with added water. USDC, National Marine FisheriesService. Memorandum, October 28.
3, U.S. FDA. 1992, Interim Labeling Policy Established for Scallop. U.S. Food and DrugAdministration. Talk Paper, T92-49. August 31.
4. WEBB, N.B., F.B. THOMAS, F.F. BUSTA AND R.J. MONROE. 1969. Variations inproximate composition of North Carolina scauop meats. J. Food Sci. 34:471-474.
ACKNOWLEDGEMENT S
This study was funded under Grant No. NA90AA-D-SG062 from the UNC Sea Grant CollegeProgram. The authors express appreciation to Homer Smith Seafood, Ellis Yeomans Seafood andCarolina Cultured Shell6sh for cooperation in this eject. We acknowledge the assistance of WayneMobley, N.C. Div.of Environmental Health in the collection of retail scallop samples. The use of tradenames in this publication does not imply endorsement by North Carolina State University, norcriticism of ones not mentioned.

352
EXOPEPTIDASES AS BY-PRODUCTS FROM SHELLFISH VISCERA
N.F. Haard, F.L. Garcia-Carreno*, and N. Dimes
Institute of Narine Resources
Department of Food Science 6 Technology
University of California, Davis
Davis CA 95616
and
*PO Box 128, La Paz, BSC, Mexico 23000
The hepatopancreas tissue from crust'acean andmolluscan processing is a rich source of exopeptidaseenzymes. However, the digestive organ also containsendopeptidases and a relatively low ratio of exo- toendo-peptidase activity with azocasein substrate. Mostof the endopeptidase activity of extracts was inhibitedby serine proteinase inhibitors, especially soy beantrypsin inhibitor. Leucine amino peptidase,carboxypeptidase A and carboxypeptidase B were notretained by a SBTI-agarose gel at pH 7.5. This fractionhad a relatively high DHS/A440 nm and yielded highmolecular weight product with azocasein sustrate. Thesedata show that the ratio of exo- to endo-peptidaseactivities in simple hepatopancreas extracts wasenriched by Agarose-SBTI affinity chromatography.
1NTRODUCTION
Nore than half of all industrial enzymes used todayare proteolytic. Godfrey and Reichelt 1983! Recently,digestive proteases from fish processing wastes have

353
been used as industrial process aids. Liu and Pigott1981; Haard, Feltham et al. 1982; Haard, Shammsuzzamanet al. 1983; Simpson and Haard 1984; Gildberg and Almas1986; Simpson and Haard 1987; Recce 1988; Almas 1990;Olson, Johansen et al. 1990; Raa 1990; Simpson, Smith etal. 1991; Borresen 1992; Haard 1992! Commerciallyavailable proteolytic enzymes typically have a highratio of endo-/exo-peptidase activity. A limitation tousing proteolytic enzymes as food and other industrialprocess aids in some applications is that endopeptidasesmay cause defects like bitter off-flavors and excessivedeterioration of the physical characteristics of theproduct. Chobert et al., 1992! For example, accelerationof Cheddar cheese ripening normally causes qualitydefects in the product. Law and Wigmore, 1983; Fox,1982!. Exopeptidases are also important agents toaccelerate fermentation processes like fish sauce. Vo,Kusakabe et al. 1983; Raksakulthai, Lee et al. 1986;Raksakulthai and Haard 1992; Raksakulthai and Haard1992!
The digestive system of marine invertebratesappears to have a relatively high content ofexopeptidases. For example, protein digestion withextracts from krill hepatopancreas results in release of15% of the amino acids in casein as free residues Osnes1979!, and the hepatopancreas of Atlantic short finnedsquid is a rich source of dipeptidylaminopeptidaseI. Hameed and Haard, 1985! Carboxy- and amino-peptidasesisolated from the hepatopancreas of various crustaceanspecies have recently been reviewed. Haard 1993!
In this study we report the characterization of theexopeptidase activity of hepatopancreas extracts fromtwo decapod species, crayfish and langostilla crab and amethod to enrich exo-peptidase activity.
MATERIALS AND METHODS
Crayfish Pacifi stacus astacus; CF!, harvested inthe wild near Sacramento, were obtained live from theCalifornia Crayfish Marketing Association, Sacramento,CA. Hepatopancreas's were removed from decapitatedanimals, frozen and stored at -70'C prior to enzyme

354 extraction. Langostilla crab Pl euroncodes pl ani pcs; LC!were obtained during an experimental catch by "B/0 Elpuma" vessel in Vizcaino Bay, Baja California Sur,Mexico; 28'40'61'' N and 114 35'54'' in September, 1991,at 125 m depth. The crabs were processed by pressing toobtain a proteolytic enzyme extract. Garcia-Carreno1992! The extract was frozen at -10'C until arrival atLa Paz Harbor BSC, Mexico!.
The preparation of crude proteolytic enzymeextracts was done as described elsewhere. Garcia-Carreno 1992; Garcia-Carreno and Haard 1993! Briefly,the langostilla crab extract LC! was obtained bycentrifuging the press liquid, obtained on board thecollection vessel, at 2500 x g for 15 min. to obtain alipid free supernatant that was stored at -70'C.Crayfish hepatopancreas tissue was homogenized threetimes at 10 sec intervals in a Waring blender andcentrifuged at 2500 x g for 15 min. to obtain a lipidfree supernatant CF! that was stored at -70'C.
The LC and CF extracts were fractionated byaffinity chromatography to obtain exopeptidase enrichedpreparations LC-exo; CF-exo! and endopeptidase enrichedfractions LC-endo; CF-endo!. To a chromatography columncontaining 5 ml Agarose 4%- SBTI T-0637; Sigma ChemicalCo., St. Louis, MO! in 50 mM Tris-HCl, pH 7.5, was added1.5 ml of either LC or CF extract. After 10 min. at25'C, the column was washed with 20 ml of 50 mM Tris-HCland the A280nm of 1.0 ml effluent fractions wasrecorded. The unbound fractions obtained from LC and CFaffinity chromatography with A280nm were pooled anddesignated LC-exo or CF-exo. The bound protein was theneluted from the column by washing with 20 ml of 0.10 NHCl. The fractions with A280nm and pH of 1.5 or higherwere collected, pooled, adjusted to pH 7.5 with solidTrisma base and designated LC-endo and CF-endo,respectively. The column was regenerated by washing with50 mM Tris-HCl, pH 7.5 until the pH was 7.5. Fractionsfrom repeated affinity chromatography runs were pooledand freeze dried prior to assay.
The appropriate conditions of time and enzymeconcentration were selected to give a constant rate ofreaction over the course of the assays.
355
The increase in absorbance of trichloroacetic acid TCA!-soluble material after hydrolysis of azocasein at
pH 7.5 Tris-HCl, 50 mM; 25'C! was measured as describedelsewhere. Garcia-Carreno and Haard 1993! Normally thereaction was stopped 10 min after the addition ofenzyme. One unit of activity was defined as the amountwhich increased the absorbance at 440 nm of TCA solublematerial by 1.0 in 1 min.
Hydrolysis of azocasein was also monitored by pH-stat. The degree of protein hydrolysis DHS! is thepercentage of peptide bonds hydrolyzed during the courseof the reaction and was calculated from the amount ofstandard alkali �.02 N NaOH! required to maintain thepH of the reaction at 8.0. Dong, Hardy et. al. 1993! Thereaction mixture consisted of 62.5 mg azocasein andenzyme in a 13 ml volume adjusted to pH 8.0 with NaOH at12oC.
The increase in absorbance of trichloroacetic acid TCA!-soluble material after hydrolysis of 1.5% caseinat pH 7.5 Tris-HC1, 50 mM; 25'C! was measured at 25'C.The reaction 0.5 ml volume! was normally stopped 10min. after adding the enzyme by addition of 0.5 ml20% TCA. The mixture was centrifuged for 5 min. at 6500x g. One unit of activity was defined as the amountwhich increased the absorbance at 280 nm of TCA solublematerial by 1.0 in 1 min.
The increase in absorbance at 410 nm of a solutionof 1 mM benzoyl-arginine-p-nitroanilide BAPNA! in Tris-HC1 �0 mM, pH 7.5, 20 mM CaC12; 37'C! was measured bythe method of Erlanger et al. Erlanger, Kokowski etal. 1961!. Bovine trypsin � mg/ml! from Sigma ChemicalCo. St. Louis, MO; type IX! was used as a control. Oneunit of amidase activity was defined as the amount ofenzyme which would hydrolyze 1 pH of BAPNA in one min E410 nm of p-nitroaniline = 8.8 cm mmole 1! .Leucineaminopeptidase LAP! activity was evaluated usingfreshly prepared 1.6 mM L-Leu-p-nitroanilide LeuNA! in60 mM sodium phosphate buffer, pH 7.0. The increase inabsorbance at 405 nm was recorded at 25'C. LAP � mg/ml!from Sigma Chemical Co. St. Louis, MO; L-5006! was usedas internal control. One unit of LAP was the amount ofenzyme which would release 1 pN p-nitroaniline in oneIlU.n
Carboxypeptidase A CPA! was evaluated using 1 mMhippuryl-L-Phenylalanine in 50 mM Tris-HC1, pH 7.5containing 0.50 M NaC1. The increase in absorbance at

356
254 nm was recorded at 25'C. CPA � mg/ml! from SigmaChemical Co. St. Louis, MO; C-9762! was used asinternal control. One unit of CPA was the amount ofenzyme which would release 1 prole of hippuric acid inone min.
Carboxypeptidase B CPB! was evaluated using 1 mMhippuryl-L-Arginine in 50 mM Tris-HCl, pH 7.5 containing0.10 M NaCl. The increase in absorbance at 254 nm wasrecorded at 25'C. CPB � mg/ml! from Sigma Chemical Co. St. Louis, MO; C-7261! was used as internal control.One unit of CPB was the amount of enzyme which wouldrelease 1 pmole of hippuric acid in one min.
Chymotrypsin was assayed using 0.02 mM Succinyl-Ala-Ala-Pro-Phe-p-nitroanilide SAPNA! in Tris-HCl, pH7.8 containing 10 mM CaCl2. Bovine chymotrypsin fromSigma Chemical Co. St. Louis, MO; C-4129! was used as acontrol. One unit of chymotrypsin was the amount ofenzyme which caused an increase in A410nm in one rain.
SBTl, N-tosyl-L-Phe chloromethyl ketone TLCK!, N-p-tosyl-L-Lys chloromethyl ketone TPCK!,ethylenediaminetetraacetate disodium salt EDTA! and1,10 phenanthroline PT! Sigma Chemical Co., St. Louis,MO! were used according to Garcia-Carreno. Garcia-Carreno 1992! The inhibitor and enzyme preparation werepreincubated at 25'C for 60 min. prior to measurement ofactivity using one of the above enzyme assay methods.
Electrophoresis and gel activity zymograms forcasein hydrolysis by CF, CF-endo and CF-exo was doneaccording to a previously described method. Garcia-Carreno, Dimes et al. 1993!
Azocasein was assayed by method 2 and at one hintervals, a 20 pL sample was removed from the reactionmixture and chromatogrammed on an Ultrasperogel SEC 2000column �.5 x 300 mm; Beckman, San Ramon, CA!. Theeluant was 100 mM KH2PO4, 100 mM Na2S04 and 0.05% NaN3at a flow rate of 1 ml/min and approximately 1000 PSIusing a BioRad 1330 HPLC system Richmond, CA! .

357
RESULTS AND DISCUSSION
Previously we reported that most of the digestive,protease acitivity in extracts of langostilla andcrayfish was arrested by serine- and metallo- but not byaspartyl- and cysteine-proteinase inhibitors. Garcia-Carreno and Haard 1993! Similar results were obtained inthis study with LC and CF extracts using assay method 3for casein hydrolysis Table 1!.
Table 1: The effect of serine and metallo-proteinaseinhibitors on casein hydrolysis by crude enzyme extracts LC and CF!
Inhibitor Activity %Inhibition!
0
93
90
0
ND
0
25
0
75
ND
Standard enzymes were purchased from Sigma ChemicalCo., St. Louis, MO. All asays were conducted using assaymethod 3. Data are average of 3 determinations.
Casein hydrolysis in both extracts was mostsensitive to trypsin inhibitor indicative of serineproteases, particularly trypsin and/or trypsin-likeenzymes. The activities of both extracts was inhibitedsomewhat less by TICK, a more specific trypsininhibitor, and was not significantly affected by TPCK,an inhibitor specific for the serine proteasechymotrypsin. Part of the casein hydrolytic activity ofthese extracts was also inhibited by the metallo-proteinase inhibitors EDTA and PT.
Assay of LC and CF extracts for specificexopeptidases LAP, CPA, CPB! revealed the presence ofrelatively large amounts of activity. The specificexopeptidases were not inhibited by SBTI Table 2!.
LS
Control 0
SBTI, 10/M 75TLCK,100/M 37TPCK,100pK 1PT, 2 mM 21
EDTA, 1 mM 10
0
69
32
0
14
32
Trypsina Chymotrypsina Thermolysina0
ND
ND
94
93

358
Table 2. The effect of SBTI on the exopeptidaseactivities of crude enzyme extracts LC and CF!.
Activitya Inhibitor LS CF CPA CPB
8 Control!100 100
100 103
100 100
101 93
100 100
108 100
100
100SBTI, 10/M
SBTI, 10/M100
105
100
100
CPA
SBTI, 10'
The specific activities Units/mg protein! of controlenzymes were: LAP LAP standard-0.500; LC- 0.004; CF-0.071!; CPA CPA standard- 0.210; LC- 0.086; CF-0.107!.CPB CPB standard-0.36; LC-0.12; CF-0.15!. Data areaverage of 3 determinations.
The degree of hydrolysis DH%! of azocasein by CFextract was similar to that observed with LAP standard >12% after 4 h reaction! and considerable higher thanthat of trypsin standard �%! Fig. 1!. Using the samereaction conditions, the increase in A440nm of theseenzymes is shown in Fig. 2. Since the dye bound toazocasein is more or less randomly distributed on thepeptide chain, hydrolysis of a given amount of peptidebonds by an endopeptidase like trypsin would be expectedto yield much more dye in the TCA soluble fraction thanwould an exopeptidase like LAP. The ratio of DHS method2! to the activity using A440nm of the TCA solublematerial method 1! was much higher for the exopeptidasestandard LAP >80! than was that for the endopeptidasestandard 34! Fig. 3! . The DH%/A440nm was taken as anindice of the ratio of exopeptidase/endopeptidaseactivities. The CF extract exhibited a relatively lowratio of exopeptidase/endopeptidase based on thiscriterion Fig. 3!. This is not surprising in view ofthe abundance of endopeptidases in hepatopancreas tissueof decapods. Osnes 1979; Galgani and Nagayama 1988;Sakharov and Litvin 1990; Garcia-Carreno 1992; Garcia-Carreno and Haard 1993! The endopeptidases ofhepatopancreas are mainly serine proteases, includingtrypsin, trypsin-like and digestive collagenases andelastases.

359
14g.~- 12
>100
8
X O I 4CS
Cl 0 1 2 3 4Hydrolysis Time, h
Figure 1. Degree of protein hydrolysis DHS! ofazocasein digested with 'leu'cine amino peptidase,crayfish extract, CF-endo fraction, trypsin, and CF-exofraction.
0.6
«o 0.5Ol
a 0.4
Z ~0.3o 0.2IQ
I h 0-1I
Cl 0 1 2 3 4Hydrolysis Time, h
Figure 2. A440 nm of trichloroacetic acid solublefraction of azocasein after digestion with leucine aminopeptidase, crayfish extract, CF-endo fraction, trypsin,and CF-exo fraction.

360 g &0e 70
Z. 600~ 50
>40
~co 0 1 2 3 4Hydrolysis Time, h
Figure 3. Ratio of DH% to A440 nm during course ofhydrolysis of azocasein by leucine amino peptidase,crayfish extract, CF-endo fraction, trypsin, and CF-exofraction.
On the basis of these results, we employed SBTI-affinity chromatography with the aim of reducing theendopeptidase activity of LC and CF extracts. Thematerial which did not bind to the affinity ligand wasenriched 13.7 and 4.8 fold in LAP specific activity and342 and 2.7 fold in CPA specific activity for LC-exo andCF-exo, respectively. On the other hand, the enzymeswhich were bound to SBTI-Agarose were enriched 3.1 and865 fold for chymotrypsin specific activity and 16.5 and41.7 fold for trypsin amidase activity for LC-exo andCF-exo, respectively Table 3!.
To assess the ratio of exopeptidase/endopeptidasewe measured azocasein hydrolysis using the pH stat method 2! and A440nm method 1! for the affinityfractions from CF extract Fig. 3!. The ratio wasincreased from 21-28 for the CF extract to 50-69 for theCF-exo fraction. The CF-endo fraction also had asomewhat higher ratio than the starting material. Thepoor recovery of endoproteinases after affinitychromatography was probably caused by the poor stabilityof trypsin and trypsin-like enzymes at acidic pH

36l
. Simpson and Haard 1984; Simpson and Haard 1985;Simpson and Haard 1987; Garcia-Carreno 1992!
Table 3: Specific act.ivities of exopeptidase andexopeptidase fractions from LC and CF extracts afterSBTI-affinity chromatography.
Activity U/mg!Fraction>
0.54
8.00
0.00
0.26
1.25
0.00
0.03
8.88
0.00
0.07
0.19
0.00
15.9
0.00
50.0
0.37
0.08
320
6.60
0.00
0.40
0.36
0.04
15.0
0. 069
0. 100
0. 100
0.005
0.009
0.144
LC
LCexo
LCendo
CF
CFexo
CFendo
Results are average of 3 determination. Recovery isthe % of total units in the material applied to thecolumn that was recovered in the material not bound tothe column LC-exo; CF-exo! and the bound materialeluted with 0.1 N HCl LC-endo; CF-endo!.
HPLC analysis of the reaction products carried outby method 2 revealed that the CF extract and the CF-endofraction, but not the CF-exo fraction significantlyreduced the molecular weight of the azocasein substrate.Digestion of azocasein with the CF-exo fraction resultedin product with a relatively short retention time �.2
SDS-PAGE analysis of endoproteinase activity of theCF extract revealed several active zones ra~ging inmolecular weight from 12 to 72 KDa Fig. 4! as reportedby us previously. Garcia-Carreno and Haard 1993! BothCF-exo and CF-endo fractions exhibited bands which arepresumably indicative of endoproteinases. Garcia-Carreno, Dimes et al. 1993! The CF-exo fraction retainedactive bands in the low molecular weight range, i.e.,40, 37, 30, 27 and 12 KDa, while the CF-endo fractioncontained active bands of 57, 54, 40, 37, 33, and 30KDa. We were not able to detect exopeptidases as activebands on these zymographs.

362 min.!, indicative of high molecular weight, compared tothe untreated extract CF!. Digestion with the CF-endofraction yielded product with the substrate peak mostlydepleted and containing products with a relatively longretention time �7.5 min.! . These data are consistentwith the conclusion that exo- and endo-peptidases havebeen partitioned in these respective fractions.
80
o 7o60
g 40e 30
g 20
~ 10 0 0 0.2 0.4 0.6 0.8Electrophoretic Mobility
Figure 4. Polyacrylamide gel zymograms for caseinhydrolysis. Molecular weights of active endo-proteinases: crayfish extract, CF-exo fraction, CF- endofraction, and molecular weight standards.
CONCLUSIONS
Crude extracts from langostilla crab and crayfishhepatopancreas contained significant amounts of thespecific exopeptidases assayed, LAP, CPA and CPB.However, the ratio of exopeptidase/ endopeptidase,evaluated by comparing the relative number of peptidebonds hydrolyzed DHS! in azocasein with the A44onm ofTCA soluble product revealed a high percentage ofendopeptidase activity during the course of thereaction. Most of the endopeptidase activity in theseextracts are serine proteinase Garcia-Carreno and Haard1993!, and this observation was confirmed in the presentstudy. We observed that the specific exopeptidasesexamined were not sensitive to the serine proteinaseinhibitor SBTI. Fractionation of extracts by Agarose-SBTI affinity chromatography resulted in a fraction

363
enriched several fold in specific exopeptidaseactivities and having a relatively high ratio of peptidebond hydrolysis to formation of TCA soluble peptides.The latter measure was shown to be an indication of highexopeptidase activity and low endopeptidase activity andshould be of use in further work characterizing the exo-peptidase/endo-peptidase ratio of complex mixtures ofproteolytic enzymes. The reason for the poor recovery ofendopeptidase activity from the bound fraction of theaffinity column is not known at this time. It ispossible that some enzymes were not released from thecolumn and/or were inactivated by the low pH used in thesecond column eluant. Further research is needed inorder to clarify this point. However, the demonstrationthat an enriched exopeptidase fraction can be simplyrecovered from shellfish digestive tissue has promisefor production of exopeptidases for accelerating cheeseripening and other industrial applications.
RE FERENCE S
1.AI2IAS, K. A. �990!. Utilization of marine biomass forthe production of microbial growth media andbiochemicals. v
Lancaster, PA, Technomic Publications. 361-372.
2.BORRESEN, T. �992!. Biotechnology, by-products andaquaculture.
Cambridge, NA, Blackwell Scientific Publications.278-287.
3. CHOBERT,. J. -M., SITHOHY, N., AND WHITAKER, J. R.�992! . Proteolytic degradation of food proteins.
Lancaster, PA,Technomic Publications. 291-304.
4.DONG, F. M., R. W. HARDY, et al. �993!. "Chemicalcomposition and protein digestibility of poultry
in press:

364
5. ERLANGER, B. F., N. J. KOKOWSKI, et al. �961! .95: 271.
in milk and dairy10:
6. FOX, P. F. �982! . "Proteolysisproducts."282-284.
7.GALGANI, F. AND F. NAGAYAMA �988!. "Digestiveproteolysis and digestive proteinases in deep seacrabs Geyon affi ni s and Chi onocet es j aponi cus. "
54 �!: 983-987.
8.GARCIA-CARRENO, F. L. �992!. "The digestive proteasesof langostilla Pleuroncodes planipes, Decapoda!:their partial characterization, and the effect offeed on their composition."
1038: 575-578.
9.GARCIA-CARRENO, F. L. �992!. "Protease inhibition intheory and practice." 3 ~145-150.
11. GARCIA-CARRENO, F. L. AND N ~ F. HAARD �993! ."Characterization of proteinase classes inlangostilla Pl euroncodes plani pes! and crayf ish Pacifastacus astacus! extracts."
12.GILDBERG, A. AND K. A. ALIAS �986!. Utilization offish viscera.
383.
New York, The Nature Press.
14.HAARD, N. F. �992!. "A review of proteolytic enzymesfrom marine organisms and their application in the
10.GARCIA-CARRENO, F. L., N. DIMES, et al. �993!."Substrate gel electrophoresis for composition andmolecular weight of proteinases or proteinaceousproteinase inhibitors." inPress:

365
food industry."
15.HAARD, N. F. �993! . Protein hydrolysis in seafood.Toronto, in
press.
16 HAARD, N. F., L. A. W. FELTHAM, et al. �982!.Modification of proteins with proteolytic enzymesfrom the marine environment.
Society. 223-244.
1 7 . HAARD, N. F ., K. SHAMMSUZ ZMGQT, et al .Enzymes from marine organisms assubstitutes.
Paris, Technique et Documentation Lavoisier. 237-241.
�983! .
rennet
18.HAMEED, K.S. AND HAARD, N. F. �985!. Isolation andcharacterization od cathepsin C from Atlantic shortfinned squid
82B: 241-246.
19.LAW, J. AND WIGMORE, A. �983!. Accelerated ripeningof Cheddar cheese with commercial proteinases andintracellular enzymes from starter streptococci.
50: 519-525.
21.OLSON, R. L., A. JOHANSEN, et al. �990!. "Recoveryof enzymes from shrimp waste."25: 67-68.
22.OSNES, K. K. �979!. Peptide hydrolases of Antarctickrill EUphausia superba. The Norwegion Institute ofTechnology, Department of Biochemistry, Trondheim.
23.RAA, J. �990!. Biotechnology in aquaculture and thefish processing industry: A success story inNorway. v
20.LIU, L. L. AND G. M. PIGOTT �981!. "Preparation anduse of inexpensive crude pepsin for enzymehydrolysis of fish." 46 �!:1569-1572.

366
Lancaster, PA, Technomic Publishing Co. 509-524.
24.RAKSAKULTHAI, N. AND N. F. HAARD �992!. "Correlationbetween the concentration of peptides and amino
~~ 7 �!: 86-90.
25.RAKSAKULTHAI, N. AND N. F. HAARD �992! . "Fish saucefrom capelin Mal lotus vi llosus!: Contribution of
Q~~ 7 �!: 147-151.
26.RAKSAKULTHAI, N., Y. Z. LEE, et al. �986! ."Influence of mincing and fermentation aids on fishsauce prepared from male, inshore capelin, Nallotusvi ll osus."
19: 28-33.
27.REECE, P. �988!. "Recovery of proteases from fishwaste." 23 June!: 62-66.
28.SAli~OV, I. Y. AND F. E. LITVIN �990!. "Stabilityof serine collagenolytic protease A fromhepatopancreas of crab Paralithodes camtschatica."
97B �!:407-410.
29.SIMPSON, B. K. AND N. F. HAARD �984!. "Purificationand characterization of trypsin from the Greenlandcod Gadus ogac!. 1. Kinetic and thermodynamiccharacteristics."
62 9!: 894-900.
30. SIMPSON, B. K. AND N. F. HAARD �984! . "Trypsin f romGreenland cod Gadus ogac! . Isolation andcomparative properties."
31.SIMPSON, B. K. AND N. F. Haard �985!."Characterization of the trypsin fraction from
BOB �!: 475.

367
32.SIMPSON, B. K. AND N. F. HAARD �987!. Cold-adaptedenzymes from fish. New York,Marcel Dekker, Inc. 495-527.
33.SIMPSON, B. K. AND N. F. HAARD �987!. "Trypsin andtrypsin-like enzymes from the stomach-less cunner.
35: 652-656.
34.SIMPSON, B. K., J. P. SMITH, et al. �991! . MarineEnzymes.
35.VO, V. T., I. KUSAKABE, et al. �983!. "Purificationand some properties of two aminopeptidases fromsardines."
47�1!: 2453-2459.
ACKNOWLEDGMENTS
The study was supported by a grant from theCalifornia Dairy Research Foundation to author Haard anda grant from Consejo Nacional de Ciencia y Tecnologia,Mexico to author Garcia-Carreno.

368
OXIDATIVE SI'AEILIIV OV VARIOUS OILS AS DEOROADSK
BY RANCIMIT METHOD
Victor Nwosu~ and Leon C. BoydNorth Carolina State University
Department of Food Science116 Schauv Box 7624
Raleigh, NC 27695
Pats and oils are essential ingredients in the formulation and processing of foods in the foodindustry. The oxidative stability of fats and oils plays an important role in determining the qualityof lipid-containing products �!. The stability of the omega-3 fatty acids and other essential fattyacids contained in oils is crucial to obtaining their beneficial health efFects.
Oxidative stability is an important parameter for the quality assessment of fats and oils �!.Presently, the conditions and keeping qualities of an oil or fat, as well as the effectiveness ofantioxidants may be assessed in terms of induction time �!. Autoxidation of fats or oils is acomplex process initiated by fiee radical reactions involving unsaturated fatty acids. Hence, fatsand oils containing unsaturated fatty acids are highly susceptible to oxidation. The oxidationprocess'is affected by atmospheric oxygen, heat, heavy metals, exposure to light, and porphyrins.These factors generate free radicals which lead to fommtion of peroxide radicals and subsequentchain reactions leading to the formation of secondary products �!.
Natural and synthetic antioxidants can be added to oils or fats to inhibit autoxidation. Theeffectiveness of the antioxidants vary according to type and stability of an antioxidant as well asthe microenvironment into which it is placed. Improved antioxidant activity can be obtained byaddition of synergistic agents, such as citric acid and ascorbic acid, as well as reduction of factorsfavoring the formation of free radicals,
Therefore, it is the objective of this study to assess the oxidative stability of various oils andthe effectiveness of selected natural and synthetic antioxidants to inhibit oxidation as measured bythe Rancimat method and changes in fatty acids profile.
MATERIALS AND METHODS
The following oils were investigated at 100' C using a Rancimat 617 METROHM, Herisau,Switzerland!: peanut oil, rice bran oil, corn oil, encapsulated sahnon oil, Menhaden oil bothindustrial and dietary grades!. The fish oils were donated by Zapata Haynie Corporation,Reedsville, Virginia,

369
Quaduplicate determinations of each sample were made by weighing 2.5 g into thoroughlycleaned reaction vessels, adding 50 ml of distilled water to the reaction vessels, and adjusting theair Row to 18 liters per hour. The conductivity of the breakdown products was measured on astripe chart recorder of the instrument,
FATTY A ID ANALY I
The fatty acid composition of the oils was determined before and after oxidation on therancimat to determine change in the fatty acids pro6le of the oils. The oils �5mg! weretransesteri6ed at 50' C overnight using 5% methanolic hydrochloric acid. Fatty acid methylesters FAME! were puri6ed by eluting through pasteur pipets packed with Florisil � cm! with95:5 Hexane: diethyl ether solution �!. Puri6ed FAME were analyzed on an HP 5890 HewlettPackard Avondale, PA! gas liquid chromatograph containing a DB 225 capillary column I kW Scienti6c Co., Folsom, CA! as described by Boyd et al. �!. Fatty acids were determined byrelative retention time using 23:0 as an internal standard in both the samples and referencesstandards NuChek Prep, Elysian, MN!.
The antioxidant activity of butyhted hydroxytoluene BHT!, phosphatidyl choline PC!,phosphatidyl ethanolamine PE!, and sphingomyelin SPH! was determined by their addition tosalmon oil and menhaden oil.
The BHT was added at 0.02% of 2.5g samples whereas phosphohpids were added at 0.5%of 2.5g quantities of salmon and menhaden oils. Antioxidant activity of the oils was measuredas the activity index Al!, and was de6ned as the ratio of the time required to oxidize a givensample heated at 100 C with and without the presence of an antioxidant. Therefore,quadruplicate analyses of the antioxidant property of all mnples were determined bymeasuring Al and the change in fatty acid pro6le following heating.
RESULTS AND DISCUSSION
The induction time of the various oils with and without antioxidants is shown in Table 1.Corn oil and salmon oil showed the longest induction time whereas the menhaden oils showedthe shortest induction time. The induction time appeared to be a function of the PUFA contentand the degree of unsaturation of the oils as both menhaden oils had relatively short inductionvalues when compared to the corn oil and the salmon oil. The PUFA content of the peanut andrice bran oils were similar �1.5 and 38.7%! compared to a much higher amount �0.5%!found in the corn oil.

370 Table 1: Induction Time of Various Vegetable Ojl5 using the Rancimat~
~Induction time- Time required for fatty acids to break down upon heating at 100' C
Table 2 shows the induction time and the Al of the fish ods. Comparisons of the induction times Table 1 ! of the Gsh oils prior to the addition of the antioxidants and following addition Table 2!shows that the effectiveness of the antioxidant varied with the type of oil. The BHT was moreeffective in the dietary menhaden oil showing only modest increases in stability when added to thesalmon oil. The PL differed considerably in their ability to stabilize the oils showing differencesbetween individual PL as well as differences between oils. Sphingomyelin appeared to be mosteffective antioxidant, followed by PC and PE, respectively. The SPH exhibited more antioxidantproperty in the salmon oil model system than in the menhaden oil systems. Comparisons of Al valuesand induction times ofboth SPH and PC to those of BHT in the sahnon oil model system showed thatboth PL were more effective antioxidants under these test conditions. The SPH appeared to be ahighly effective natural antioxidant having an induction time of more than 100 hr and an Al valueapproximately 10 times that of BHT.
The Sly acid profiles of the fish oils before and after oxidation, as well as with and without addedantioxidants are shown in tables 3-5. The PUFA contents decreased with increasing oxidation.Sahnon oil model systems containing BHT and SPH retained the greatest amount of PUPA followingoxidation Table 3!. Both the PL and the BHT appeared to perform differently in the two grades ofmenhaden oils. In the dietary grade of menhulen oil Table 4!, the BHT was most effective, followedby PC and SPH with PE being least eIFective. Samples containing PC and PE were equally ineffectivein preventing the extensive loss of PUFA. Only the BHT was used in the industrial grade of menhadenoil Table 5!. The BHT performed at an antioxidant level comparable to that of PE in the dietarygrade of menhaden oil.

371
Table 2: Induction Time and Antioxidant Activity Index of Various Oils Following the Addition of Naturaland Commercial Antioxidants a!
a- Induction is time required for fatty acids to breakdown upon heating at 100' C; b- Antioxidant ActivityIndex= Ratio of time required to oxidize sample with and without antioxidant present. BHT= butylatedhydroxytoluene; PC~hosphatidylcholine; SPH= sphingomyelin PE~hosphatidylethanolamine
Table 3: Changes in fatty acid composition of salmon oil with and without
Each row value is the mean of 4 detertninations. BHT= butylated hydroxy-toluene; PC= phosphatidylcholine;SPH= sphingomyelin; PUFA = polyunsaturated fatty acid.

372 Table 4: CHANGES IN FATTY ACID GROUPS OF MENHADEN OIL DIET.GRD.! WITH ~%QTHOUT ADDED BHT AND PHOSPHOLIPIDS
Each row value is mean of 4 determinations. BHT = butylated hydroxytoluene; PC = phosphatidylcholine;PE = phosphatidylethanolamine; PC = phosphatidylcholine; PUFA = polyunsaturated fatty acid
Table 5: Changes in Fatty Acid Groups of Menhaden Oil industrial Grade! With and Without BHT
Each row value is mean of 4 determinations. BHT= butylated hydroxytoluene; Ind= industrial grade;PUFA= polyunsaturated fatty acid; MO= menhaden oil

373
In general, the BHT and SPH were most efFective in protecting the unsaturated fatty acids &omoxidation. However, the effectiveness of the antioxidants appeared to be dependent on the fatty acidcomposition of the oils as well as the micro-environment of the oil. For example, the corn oilcontained a very high content of 18:2 but had a relatively high Al value comparable to the moresaturated 6sh oils. However, the 6sh oils contained more omega-3 PUFA with a greater degree ofunsatuiation per molecule. The presence of natural antioxidants, such as tocopherols, could explainthe unusual stability observed in corn oil. The natural tocopherol levels as well as the mineralcontent of the oils were not determined and is still under study.
CONCLUSION
The Rancimat method appears to be suitable for the detcnniming of the oxidative stability of oilsas well as for measuring and comparing the relative effectiveness of different antioxidants. TheefFectiveness of antioxidants, however, appears to be dependent on a number of factors includingthe stnucture of the antioxidant as well as the micro-environment of the model system or foodsystem. Changes in 6itty acids pro6le of an oil also appears to be an effective tool that can be usedto monitor the oxidation and deterioration of oils.
REFERENCES
1. BOYD, L.C., D.P. GREEN, F.B. GIESBRECHT, AND M.F. KING. 1993. Inhibition ofoxidative rancidity in frozen cooked 6sh flakes by tert-butylhydroquinone and rosemaryextract. J. Sci. Food Agric 61:87.
2, CHMSTIE, W. W. 1992. Preparation of fatty acid methyl esters, Inform 3 9!:1031.
3. FRANI , J., G., J.V. GEIL AND R. FREASO. 1982. Automatic Determination of OxidationStability of Oil and Fatty Products, Food Technol. June:71
4. KIN G, MF., L.C. BOYD, AND B.W. SHELDON. 1992. EfFects of Phospholipids on LipidOxidation of a Salmon Oil Model System. JAOCS. 69�!: 237.
5. LAUBLI, M.W. AND P,A. BRUTTEL. 1986. Determination of the Oxidation Stability ofFatsandOil: Comparison between the Active Oxygen Method AOCS Cd 12-57! andRancimat Method, JAOCS. 63:792
6. LOURY, M. AND M. FORNEY. Etude de I autoxydation de L'acide linolenique auxtemperatures de 20' et 40'c. Rev. Franc. Corps Gras 16:167
7. PONGRACZ, G. 1982. Fette, Seifen,Anstrichm. 84:269.
8, PONGRACZ, G. 1984. Fette, Seifen, Anstrichm. 86:455.
374
CORRELATION OF SENSORY DECISIONS WITH CHEMICAL INDICATORSOF SEAFOOD ACCEPTABILITY
W.F. StaruszkiewiczWashington Seafood Laboratory
U.S. Food and Drug Administration200 C St., S.W.
Washington, D.C. 20204
The term "decomposition" when applied to seafood, refers to thebreaking down of normal tissue in the fish into new products either bythe action of bacteria, endogenous enzymes or the direct action ofenvironmental abuse. The change from an acceptable state to adecomposed state may manifest itself by abnormal odors, taste, texture,color, physical breakdown of tissue, or other change in appearance.Seafood requires careful handling after removal from their normalaquatic environment if decomposition, or spoilage, is to be avoided.Despite decades of research, training and discussions with producers offishery products, the commercial harvesting of fish is still frequentlyundertaken without sufFicient cooling capacity on fishing vessels andspoilage begins before the fish reach port. Much of the spoilage foundin commercial products is caused by the growth of bacteria resulting innumerous changes which are afFected by the temperature at whichdecomposition occurs. Even in the presence of ice, bacteriological growthcan advance if good sanitation practices are not observed.
A traditional approach for detecting the presence of decompositionin seafood has been the sensory analysis for odors. A determination ofdecomposition by organoleptic analysis is defined as that point when thefirst definite odors of decomposition are detected. Raw/ frozen fisheryproducts are ok en classified as Class 1 acceptable!, Class 2 decomposed!, or Class 3 advanced decomposed! while a Pass/Failapproach is used for processed products such as cooked shrimp orcanned tuna.
The training of organoleptic analysts is a specialized area and islong and difficult. Moreover, analysts trained by different organizationscan develop significant variations in the reject threshoM point which canlead to disagreements over product acceptability. One consequence hasbeen an intensified effort to develop mechanisms to support organoleptic

375
decisions by alternative measurements such as chemical tests. Inaddition, such tests should also be able to detect decomposition inadulterated fishery products where odors have been removed or maskedby processing. Many tests have been explored as potential tests ofdecomposition but few have worked effectively at the rejection point asdetermined by sensory analysts. Some tests have been based on thevolatile acids and amines while others have been directed at nonvolatilecompounds such as hypoxanthine and long chain amines.
In this report, we will summarize some of our findings regardingthe relationships between sensory evidence of decomposition and thepresence of elevated amounts of cadaverine and putrescine for &ozenproducts such as mahimahi and for canned tuna.
MATERIAL AND METHODS
Frozen Fish
Samples of mahimahi were prepared under contract with theDepartment of Food Science, University of Hawaii. Freshly caught fishwere permitted to spoil in sea water at controlled temperatures rangingfrom ice water to 90 F. Fillets were removed, frozen and shipped toorganoleptic experts for sensory analyses followed by chemical analysesfor a variety of chemical indicators of decomposition. Samples of cod,scallops and plaice were prepared under contract for the CanadianDepartment of Fisheries and Oceans. The products were allowed todecompose only in ice. The frozen samples were later examined byorganoleptic experts for their acceptability.
Canned Tuna
Samples designated as "authentic" were prepared by canning fishwhich were obtained from known sources after examixmtion by experts.The canned fish were prepared in commercial plants under supervision.Samples designated as "commercial" were collected at the retail levelor at import. The collected cans were analyzed by organoleptic analystsfor odors of decomposition and then submitted to chemical analyses.
Methods
Samples were analyzed for cadaverine and putrescine by the gaschromatographic method published in 1981 �! and updated in aLaboratory Information Bulletin �! in 1993. All results are expressedas ue'g ppm!.

376
RESULTS AND DISCUSSION
Fresh%Frozen Seafood
The fillets from the mahimahi pack were randomly numbered andsent to three expert sensory analysts who assigned either class 1 acceptable! or class 2 or 3 decomposed! designations to the samples.The fillets were submitted to chemical analyses for a series ofcompounds induding histamine, putrescine and cadaverine. Theorganoleptic results on the frozen fillets were then compared to theknown spoilage treatment conditions, the sensory category of the fish inthe round prior to f'reezing, filleting and storage, and to the chemicalresults. The fillets taken f'rom fish spoiled at low temperatures werecorrectly identified as acceptable or decomposed in accordance with thedecisions made on the whole fish prior to filleting. However, for filletstaken from fish decomposed above 70 F, a significant number ofdecomposed units were labeled as acceptable by the sensory analysts.Sixty-five percent of the fillets which contained scombrotoxic levels ofhistamine 0 mg histamine/100g! were accepted by the analysts basedsolely on odors in the cleaned fillets.
Figures 1 and 2 show the rates of formation for histamine andcadaverine at 3 spoilage temperatures. Figures 3 and 4 show thevariability in amine content between individual 6sh decomposed at thesame temperature, 90 F. Similiar differences in organolepticcharacteristics were also observed between individual fish. Histaminewas frequently found in the samples spoiled at temperatures above 70F while increases in cadaverine were observed in samples spoiled at alltemperatures.
This data demonstrates that sensory testing faces limitationswhen applied to those samples most likely to cause toxic reactions inconsumers. Intensified training on samples decomposed at hightemperatures reduced the differences found in these experiments.Chemical testing, however, provides an improved level of safety incontrast to odor evaluation alone.
The potential extension of chemical testing to other seafoodproducts was explored in preliminary experiments on samples of cod,scallops, and plaice decomposed on ice. Portions of a product, such ascod, were collected from ice storage at various times up to 18 days andfrozen. ARer thawing, the fillets were examined by organolepticanalysts who passed or failed each unit. The samples were thenanalyzed for cadaverine and putrescine and the results compared to thesensory decisions. Figure 5 shows cadaverine levels in cod withincreasing degree of spoilage. Both % rejection and cadaverine

377Figure l.
Histamine Rate of Formation!250
150
8 cib 100
50 12 15 18 24 30 40 72 120 168 264 336Hours
~ 50 degrees ~ 70 degrees ~ 90 degrees
Figure Z.
Cadaverine Rate of Formation!200
150
50 12 15 18 24 30 40 72 120 168 264 336Hours
~50degrces ~70degrees ~90degrees

Figure 3.378
100
0
11 13 191817
Figure 4.
100
13 17 18 19
200
E
0
1
Histamine total fish average!
14 15 16Hours at 90 degrees
Cadaverine total fish average
14 15 16Hours at 90 degrees

379
increased as spoilage proceeded. Table 1 sumaaarizes data from asecond pack of cod . There was good correlation between increases inputrescine and sensory rejection of fillets during the first stage ofdeterioration. The greatest change in sensory rejection occurred whenincreases in both cadaverine and putrescine were observed.
For fillets of plaice decomposed on ice, rejection by sensoryanalysts began when both cadaverine and putrescine were above I ppm Table 2! .
For scallops, Table 3 shows that cadaverine was the first compoundto increase when odors of decomposition were initially detected. A largechange in rejection was observed when putrescine also was formed. Theodor characteristics changed dramatically at this point and suggestedthat a second mode of decomposition had become predominant.

380 elevated levels of histamine or other spoilage metabolites. Table 4summarizes the levels of these two compounds as determined in cans oftuna prepared &om good quality Ssh which were examined prior toprocessing into government packs for workshops and the levels found insamples of commercial canned tuna which have not been found tocontain levels of decompositton or other defects suf6cient to warrant
regulatory action. For government samples where the initial conditionof the fish was known, putrescine averaged 0.3 ppm and cadaverineaveraged 0.2 ppm. Commercial products contained an average of 0.6ppm putrescine and 0.3 ppm cadaverine. A &equency distribution ofthese data is given in Figure 6.
Cans of tuna prepared &om samples containing decomposed tunausually contained increased amounts of the diamines. Exceptions canoriginate from cans originating &om acceptable parts of commingled fishand those circumstances arising &om decomposition mechanisms whichdo not produce amines. Table 5 summaxizes data from packs ofdecomposed tuna prepared by the industry, and exhibit changesrepresentative of high temperature decomposition, and a sample packprepared by FDA at temperatures below 70 F. A frequency distribution

381
Figure 6.
100
to 2520
CADAVER INE SCOREg4 5.i 7 pj~Y"IiGL S D. i!='i'.
I ~ ! I F vaiue = 33.88
Probabitity oE vatue thishigh by chance atone isequai to .GGGO
Figure 6.
350
250
200
5 150
100
50
0.2 0.8 >1.41.4
80
V4
eo
0 40
X
26
IS
e
COMMERCIAL TUNA SAMPLES- PASSED
0.4 1 1.2PPM
K PUTI~CINE E2 CADAVERINE

382
Much more work is needed but the initial results are encouraging.
Canned Tuna
The use of chemical testing for the support of sensory decisionson canned tuna acceptability has had a long history. Groups of testshave been evaluated for correlations with sensory scores with mixedresults. Only histaznine has been routinely applied because of itsrelationship to scombrotoxic poisoning. Other compounds which haveundergone evaluation have included formic and acetic acids, volatile acidnumber, total volatile bases, hypoxanthine, volatile reducing substances,and ethanol. It was found. that the most effective approach was to apply2 or 3 tests in order to cover several potential spoilage routes. Aparticular difBculty revolved around the heterogenous distribution ofsome spoilage metabolites within decomposed fillets which exemplifiedthemselves as wide variations between cans of product which containonly a small section of a fillet. An ideal chemical indicator ofdecomposition would need to form over a large area of a decomposingfillet so that increases could be detected in many of the cans prepared&om such fish. As we have described in talks before this association inthe 1991 meeting, the use off cadaverine and putrescine most closelyfills these needs.
A summary of available data shows that the baseline levels of thetwo amines in samples of good quality acceptable canned tuna are low.Such samples do not exhibit odors of decomposition, honeycomb,

383
of the data from the industry packs is given in Figure 7 and &om theFDA pack in Figure 8 . In the industry packs, approximately 86% of thevalues determined for cans prepared &om decomposed tuna and 94% ofthe values determined for cans prepared Rom advanced decomposed fishexceeded 5 ppm cadaverine. The analyses of cans prepared &om theFDA pack exhibited cadaverine values generally in the range 1 to 3ppm. The importance of the lower range of cadaverine values isunderscored by data collected from regulatory samples in whichorganoleptic analysts reported odors of decomposition, and in whichdiamine levels in the 1 to 2 ppm range are &equently found. Onoccasion, some of the individual can values will remain low because ofanatomical differences in metabolite levels, differences in rates ofspoilage between individual fish, and alternative routes of decompositionin tuna.
The GLC method has been applied to more than 200 cans of tunacollected from samples failed by FDA analysts due to the presence ofdecomposition odors. In such samples, the spoilage odors and themaximum diamine levels are sometimes found in different cans withina sample for reasons previously discussed. Can to can correlations arenot practical for any group of indicators of decomposition on a routinebasis. The objective is to identify CID's that are present in a minimum

384 Figure 7.
iNDUSTRY TUNA PACKSDecomposed Samples
50
$ 50
fl9 20
10
0 0.5 I 2 5 10 20 30 40 50 60 70 80 90 100 >100Concentration PPM!
H Putrescine H Cadaverine
Figure 8
AUTHENTIC TUNA SAMPLES35
30
~, 20O
jo
0.2-0.3 0.4 � 0.5 0.6 0.7 � 0.8 0.9-1.0 1.1 � 1.2 1.3 � L4 >1.4PPM
HIEII putrescible E2 cadaver1ne

385
of 2 cans when odors of decomposition are found in 2 or more canswithin a sample of 24 cans. However, as a special exercise a can to cancomparison was conducted on a set of 128 cans collected fromcommercial samples rejected for the presence of decomposition odors.One hundred seven units were failed by organoleptic experts andincreased levels of the diamines > 0.6 ppm! were found in 98 of thesame cans. An additional 128 analyses were conducted on othersamples and for the combined 256 data points, over 90% of the canscontained > 0.6 ppm of at least 1 diamine. For regulatory purposes, 2of 24 cans 8.3%! in a sample must contain evidence of decomposition tosupport a recommendation or to confirm action. A graphicalrepresentation of the data is given in Figure 9. Cadaverine is the morepredominant compound present at increased levels in these samples.
Approximately 68% of the cadaverine values in cans from failedsamples exceeded 1.4 ppm and 23% were in the range 0.6 to 1.4 ppm.The relationship between cadaverine and putrescine levels is shown inFigure 10. Generally, cadaverine is more frequently found at increasedlevels than is putrescine. Several values from cans collected frampassed samples exceeded 0.6 ppm. These represent samples that did notmeet the criteria for rejection but may have contained some amaunt ofsubstandard material. Similarly, some cans from failed samplescontained less than 0.6 ppm. They may represent commingled lots offish as well as the anatomical variations expected in large fish.Regardless of the efBciency of any chemical test, only a battery ofchemical tests will cover all spoilage possibilities. The sample sizeselected and degree of homogeneity of a commercial lot will remainlimiting factors.
CONCLUSIONS
The use of cadaverine and putrescine levels to confirm sensory6ndings of decomposition appear very promising. The addition of these2 compounds to the applications in which histamine is currently usedshould help resolve questions where diB'erent sensory decisions are atissue, assist in detecting decomposition when adulteration or processinghas obscured odors, and improve the selection and evaluation of trainingsamples for organoleptic analysts. These compounds form under manydecomposition temperatures and should provide improved detection ofspoilage in frozen products such as mahimahi. Interlaboratory testingof the chemical methodology is underway.


387
REFERENCES
1. STARUSZKIEWICZ, W.F. and J. BOND. 1981. GLC Deterxnination ofCadaverine and Putrescine in Foods. JAOAC 64:584-591.
2. ROGERS, P.R. and STARUSZKIEWICZ, W.F. 1993. Modi6cation of the GLCProcedure for the Determination of Cadaverine & Putrescine. FDALaboratory Information Bulletin ¹ 3794, Issue ¹ 7 July!.

388
EFFECT OF DIFFERENT LIPID LEVELS ON THE UPTAKE ANDDEPURATION OF PETROLEUM HYDROCARBONS BY ATLANTIC SALMON*
R.G. Ackman, S. Zhou and H. HerasCanadian Institute of Fisheries Technology,
Technical University of Nova Scotia,P.O.Box 1000, Halifax, Nova Scotia, B3J 2X4.
Salmon in their natural environment are known to avoid partsof the water column contaminated with the water-soluble fraction WSF! of crude petroleum �8!, but farmed, pen-reared salmoncannot avoid this type of oil pollutant. Abnormal situations thatcould be encountered by this species are high doses of WSF forshort periods of time or low doses for prolonged periods. Thefirst possibility was in fact the case in the Shetland Islands inJanuary of 1993 where salmon stocks were exposed for several daysto the oil spill of the Braer tanker, and could certainly occur inCanadian salmon farms located on shores where heavy tanker trafficincreases the chances of oil spills. Low-level exposure can alsobe found along shorelines where normal vessel activity cancontribute to low-level pollution �0! or where hydrocarbons arespilled into natural drainage systems or leached from beaches,marshes or other contaminated sites.
Previous research in our laboratory 9,10! of exposing codand scallops to the WSF showed that lean < 1% fat! fish orshellfish muscle could be tainted through picking up aromatichydrocarbons ranging from benzene to approximately the methylnaphthalenes. Such edible muscles were rapidly freed of theresulting objectionable hydrocarbon flavois by holding the animalsfor a few days in clean seawater. It is generally accepted thatthe more fat in a tissue, the greater the potential for uptake andstorage of lipophilic chemicals �,8,12,27,28! . To test thishypothesis, we performed a series of short-term exposures todifferent concentrations of the WSF to establish the thresholdlevels that could lead to tainting in Atlantic salmon Salmosalar! . With this background, we then studied the uptake anddepuration rates of hydrocarbons in edible muscle, and determinedthe relationship with the lipid content of whole muscle anddifferent muscle types.
MATERIALS AND METHODS
Materials and ExposuresFlotta North Sea crude oil Esso Petroleum Canada! was
stirred with cold seawater in a ratio 1:99 v/v for 24 h followedby 48 h settlement to obtain a WSF of about 10 to 13 ppmhydrocarbon. This was diluted with fresh seawater to obtaindifferent exposure levels ranging from 0.1 to 3 ppm WSF. Salmonwere starved for 24 h before the exposures. Typically, during the
*Presented in part at the Sixteenth Arctic and Marine Oil SpillProgram Techncal Seminar, Calgary, Alberta, June 7-9, 1993.
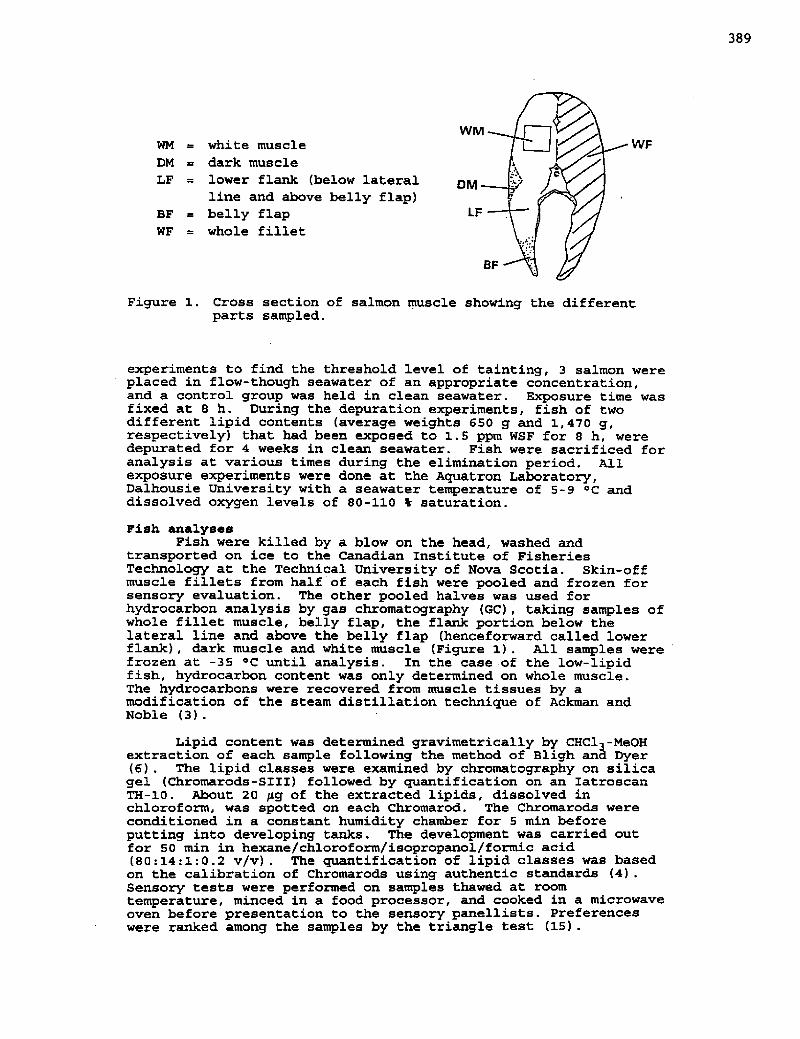
389
WWFWM white muscle
DM dark muscle
LF = lower flank below lateral
line and above belly flap!BF belly flapWF = whole fillet
Figure 1. Cross section of salmon muscle showing the differentparts sampled.
experiments to find the threshold level of tainting, 3 salmon wereplaced in flow-though seawater of an appropriate concentration,and a control group was held in clean seawater. Exposure time wasfixed at 8 h. During the depuration expeziments, fish of twodifferent lipid contents average weights 650 g and 1,470 g,respectively! that had been exposed to 1.5 ppm WSF for 8 h, weredepurated for 4 weeks in clean seawater. Fish were saczificed foranalysis at various times during the elimination period. Allexposure experiments were done at the Aquatron Laboratory,Dalhousie University with a seawater temperature of 5-9 'C anddissolved oxygen levels of 80-110 0 saturation.
Fish analysesPish were killed by a blow on the head, washed and
transported on ice to the Canadian Institute of FisheriesTechnology at the Technical University of Nova Scotia. Skin-offmuscle fillets from half of each fish were pooled and frozen forsensory evaluation. The other pooled halves was used forhydrocarbon analysis by gas chromatography GC!, taking samples ofwhole fillet muscle, belly flap, the flank portion below thelateral line and above the belly flap henceforward called lowerflank!, dark muscle and white muscle Figure 1! . All samples wezefrozen at -35 4C until analysis. In the case of the low-lipidfish, hydrocarbon content was only determined on whole muscle.The hydrocarbons were recovered from muscle tissues by amodification of the steam distillation technique of Ackman andNoble �! .
Lipid content was determined gravimetrically by CHCl -MeOHextraction of each sample following the method of Bligh anh Dyer�! . The lipid classes were examined by chromatography on silicagel Chromarods-SIII! followed by quantification on an IatroscanTH-10. About 20 pg of the extracted lipids, dissolved inchloroform, was spotted on each Chromarod. The Chromarods wereconditioned in a constant humidity chamber for 5 min beforeputting into developing tanks. The development was carried outfor 50 min in hexane/chloroform/isopropanol/formic acid 80:14:1:0.2 v/v!. The quantification of lipid. classes was basedon the calibration of Chromarods using authentic standards �! .Sensory tests were perfozmed on samples thawed at roomtemperature, minced in a food pzocessoz, and cooked in a microwaveoven befoze presentation to the sensory panellists. Preferenceswere ranked among the samples by the triangle test �5!.

390
RESULTS AND DZSCUSSL'ON
Threshold levelThe hydrocarbons of the WSF were dominated by monoaromatic
compounds, and exhibited a pattern similar to those previouslyreported �3!. There were no mortalities or signs of fishdistress over the 8 h of exposure in any of the experiments, andfish rapidly took up the hydrocarbons from the seawater. However,during the depuration stages fish only ate occasionally, possiblybeing disturbed by the added effect of handling, and also by thebioaccumulated hydrocarbons �2!. Figure 2 shows the relationshipbetween the sensory panel results and hydrocarbon concentration inthe exposure water. The threshold level of WSP that producedtainting was around 0.4 ppm. In agreement with this result,Brandal et al. �! found that salmon exposed to 0.04-0.05 ppm WSFwere tainted only after 4 days of continuous exposure.Experiments currently being carried out in our.laboratory haveshown that after 96 h exposure to 0.15 ppm, the fish weresignificantly tainted, but that fish exposed to 0.3. ppm for thesame time, were not. This suggests that the threshold level ofWSF that can taint salmon depends, among other reasons discussedbelow, on the exposure time as well as the concentration of WSF.The amount of hydrocarbon in the whole muscle determined by GC wascorrelated with the sensory panel results and could be ranked inaccord with sea-water concentrations Figure 2!. Pish that werefound by the sensory panellists not to be tainted still had ahydrocarbon content between 0.9 and 4 ppm, and tainted fishcontained approximately 5 to 31 ppm hydrocarbon in muscle. Asreported earlier �3!, monoaromatics, naphthalene and methylnaphthalenes were the major components accumulated results notshowa!.
Uptake and depurationA! Low vs high fat fish
When fish of -3 4 and -10 0 muscle lipid content wereexposed, the uptake was correlated with lipid content Figure 3! .In the lower-fat fish, the total uptake was 30 g 1 ppm while thefattier fish accumulated 53 i 7 ppm. Clearly, whole musclebioconcentrated the hydrocarbons by several orders of magnitudewith respect to the surrounding WSF. This relationship betweenmuscle lipid content and amount concentrated was supported by theresults found in other fish such as cod by Erast et al. 9! . Inthose studies, it was observed that cod exposed to 1.38 ppm WSFdid not have detectable levels of hydrocarbons and withconcentrations as high as 3 ppm WSF cod accumulated only 0.7 ppmhydrocarbons. Cod is a lean fish with 1 0 or less muscle lipid.
The major hydrocarbons assimilated were in all circumstancesthe low molecular weight aromatics with one or two rings.Aromatics with higher molecular weights than dimethyl naphthaleneswere virtually absent. Alkane concentrations were not very muchaffected by the exposure, essentially because alkanes also werenot present in the WSF due to their low solubility in seawater.Alkanes are relatively odourless and almost tasteless, and are notinvolved in the tainting of muscle. High molecular weighthydrocarbons were found to be more slowly depurated than the moxevolatile benzene to xylene range. The same trend of differentrates of depuration for low vs high molecular weight aromatics wasalso found by Rice et al. �4! in coho salmon fry.
Fish took a minimum of 11 days to depurate, a result similarto that of McKeown �8! with juvenile coho salmon. The depurationrate was slower ia the fatty fish. In both experiments,paaellists were unable to detect the taint after 11 days, and as

391
Pg 100
0.0 0.5 1.0 1.5 2.0 2.5 3.0
WSF Img/L]
Figure 2. Relationship between sensory panel results andhydrocarbon concentrations of the exposure water andsalmon muscle figures in parenthesis! . 70% correctanswers are needed for 5% significance.
10
00
Depuration of Atlantic salmon whole muscle for 31 daysfollowing 8 h exposure to 1.5 ppm WSF average ofduplicate analyses! . After day 10 no off flavorsamples could be identified by sensory evaluation.
Figure 3.
Z
O
0 0g
Co
ZOCl
O 0 O z
eo
60
40
20
50
40
30
20
10 15 20 25 30
DAYS

392 found in the threshold experiments, muscle was not freed ofhydrocarbons even after 31 days of depuration. After almostexactly the same time frame sensory panellists could still detectlow levels of hydrocarbons in petroleum-tainted arctic charrSalvelinus alpinus �6!
B! Di fferent muscle typesWhen we compared the uptake and the depuration rates of
different sections of the muscle tissue Figure 4!, the hypothesiswas again corroborated. Salmon used in these experimentscontained 3-10 %. muscle fat, which is within the normal range ofsalmon �,21!. However, the fat distribution is quite dependenton the part of the muscle analyzed. Figure 5 shows the totallipid content of the different parts of muscle. Belly flapcontains the highest lipid content �2.3%!, while white muscle hasonly 3.5% fat. Dark muscle and the lower flank muscle have anintermediate lipid content of 15.7% and 12.7%, respectively. Therelationships among fish lipid classes Table 1! in differenttissues have been discussed elsewhere �! . Although dark musclehad more lipid thm white muscle Figure 5!, it is reputed to bemetabolically more active. This and the fact that there was ahigh proportion of triacylglyceride in all tissues Table 1! meansthat depuration of stored hydrocarbons will not always be relateddirectly to total lipid.
180
160
140
80
70
Z
Q 60
o 50
O 0 40Z 30
20
10 0 0 5 10 15 20 25 30DEPURATION TIME [daysj
Figure 4. Depuration of different muscle types of Atlantic salmonfor 31 days following 8 h exposure to 1.5 ppm WSF average of triplicate analyses!.

393
Table 1. Lipid Classes of Salmon Muscles and Mesenteric Tissue as percentages of total lipid!.
Tissues
White muscleDark muscleLower flankBelly flapMesenteric tissue
a TG-triglyceride, FFA-free fatty acid, CHO-cholesterol, DG-diglyceride, PL-polar lipids.
b TR-trace <-0.1%!c ND-not detected
30
10
0
WM LF BF WFDM
Figure 5. Relationship between lipid content of whole fillet anddifferent muscle types and the time needed to depurate 80% of thehydrocarbons average of triplicate analyses. WM = white muscle,DM dark muscle, LF = lower flank, BF = belly flap, WF = wholefillet.
g I-z I-zO 20
O O CL
TG FFA CHO DG PL
81.39 0.62 1.14 0.61 16.2590.34 0.60 0.73 0.56 7.7694.69 0 26 0.54 0.36 4.1598.13 TR 0.26 ND 1.6199.30 TR 0.21 ND 0.47
6
g0CO
o z0CI
0UJ IrLU
QLUCI
I- O

394
The results of the uptake and depuration of taintinghydrocarbons by these muscle types are shown in Figure 4. At theend of the 8 h exposure, it was found that the higher the lipidcontent of the tissue, the more the hydrocarbons were accumulated.This has also been observed by Stegeman �5! when studying thetainting of oysters by petroleum hydrocarbons. This was not onlyobserved in muscle but also in other tissues of the fish, hencethe mesentery is included in Figure 4. The bioconcentrationclearly paralleled the fat content in the order belly flap > darkmuscle > lower flank muscle > white muscle. The white musclewhich contains only one fourth the lipid content of dark muscle orlower flank muscle, shows one half the level of hydrocarbons �8ppm compared with 60 ppm!. On the other hand, the difference inthe uptake of hydrocarbons between belly flap and dark muscle isquite small �3.4 ppm compared with 60.6 ppm of dark muscle!,although the lipid content of belly flap is two times higher thanthat of dark and lower flank muscle. This may suggest that theaccumulation of hydrocarbons into the salmon tissues on this shortterm exposure had not reached a saturation plateau, and there isalso the possibility that the blood circulation of hydrocarbons tothe belly flap may be slower than to other muscle tissues. Thislast hypothesis is further sustained by looking at thehydrocarbons depurated after one day; more than half of the tissuehydrocarbons were released from the different parts of the muscle,except for the belly flap whiCh needed 1.9 days. However,differences in the lipid class composition may also be involved.
After 17 days of depuration, most of the hydrocarbons in themuscle tissues had been depurated. The monoaromatics depuratedmore quickly than the higher molecular weight di- and polyaromatichydrocarbons PAH!. The higher solubility in body fluids ofmonoaromatics and also their faster enzymatic metabolization�4,26! may be responsible for their relatively swift depurationcompared to the higher molecular weight hydrocarbons that could besequestered in lipid tissues.
The longer-retained hydrocarbons were even better correlatedwith the lipid contents of the tissues. Thus, at day 17 therewere only 0.38 ppm hydrocarbons present in the white muscle, whilein dark muscle and belly flap the levels were 1.35 ppm and 2.36ppm respectively. The depuration of the remaining polyaromatichydrocarbons may well take months.
Figure 5 also illustrates the time needed to depurate 80% ofthe hydrocarbons in different muscles types. It is clear that thetissues with a higher lipid content should display a lowerdepuration rate than tissues with a lower lipid content. Thebelly flap needs 6.2 days, while white muscle needs only 0.94 daysto reach the same extent of hydrocarbon removal. Muscle withintermediate lipid values i.e. dark muscle and lower flank! withsimilar lipid levels -14%! accumulate similar amounts ofhydrocarbons �0.6 ppm for dark muscle and 56.4% for lower flank!.They also depurated to 80 0 at a similar rate �.3 days for darkmuscle and 3.8 days for lower flank muscle!.
Our findings are different from those of Miller et al. �9! whocompared the PCB content of relatively lean �.5-17.1% lipid! laketrout Salve?inus namaycush namaycush! with that of the muchfatter �1-27% lipid! siscowet S. namaycush siscowet!. In theiropinion there were similar rates of PCB bioaccumulation on a basisof mg/kg of PCBs in skin-on edible portion fillets. At this timewe simply draw attention to our results for depuration ofdifferent tissues. Although PCBs are commonly held to be readilystored in marine animal body depot fats, this view is not always

395
based on sound data, methods, samples, and understanding of fats�!. Intestinal absorption of organochlorines has also been splitinto two possible routes, lipid co-transport and chemicaldiffusion �1!. Long-term, low-level exposure to PCBs may not bethe same as our "pulse" exposure to WSF hydrocarbons. Similarlyexposure of cod Gadus morbus to petroleum oils in production areason a presumed long-term basis showed little evidence of taintingby sensory evaluation but uptake and retention of naphthalene andsimilar high molecular weight molecules could be detected �3! .Since we have actually recovered WSF hydrocarbons from isolatedsalmon muscle adipocytes Zhou et al., unpublished results! we areconfident that these cells and their stored hydrocarbons areindeed the source of tainting in the longer term.
CONCLUSIONS
Regardless of the tissue analyzed and the lipid content of thefish, the rates of depuration were compatible with two pools oftainting hydrocarbons. One, fairly rapidly depleted, couldrepresent the hydrocarbons in body fluids. The second pool, morelong-lasting, could be that held in fat storage cells adipocytes!.
Although the hydrocarbons accumulated correlated with the tissuetotal lipid content, some variation not explained by this variablefactor was also observed i.e. belly flap vs dark muscle!. It isfelt that different lipid class compositions and/or the differentcirculation in the tissues may also be involved. Thesepossibilities are now being studied.
A major question confronting the salmon aquaculture andprocessing industries is the influence that petroleum may have onthe edible quality of exposed fish �7!. The belly flap seems tobe the main storage site of hydrocarbons in the muscle and was themajor contributor to the retention of hydrocarbons observed in thewhole muscle, so the frequent consumer practice of excluding thebelly flap when consuming salmon steaks would eliminate the majorpart of any lipophilic pollutant present in the salmon fillet.Commercial size salmon can have more muscle fat up to 12-14lipid! than the fish so far analysed in this experiment, and shortand long term exposure of these fish will be the subject of ourongoing research.
ACKNXILEDGEMENTS
Sensory panel studies were conducted by E. J. Nacpherson. Thisresearch was supported by a Strategic Grant from the NaturalSciences and Engineering Research Council.
REFERENCES
l. Ackman, R.G. 1980. Pish Lipids I. p. 87-103. In: J.J.Connell ed.!, Advances in Fish Science and. Technology,Fishing News Books, Farnham, UK.
2. ACKNAN, R.G. 1989. Nutritional composition of fats inseafoods. Progr. Food Nutr. Sci. 13:161-241.
3. ACKNAN, R.G. and D. NOBLE. 1972. Steam distillation: asimple technique for recovery of petroleum hydrocarbons fromtainted fish. J. Fish Res. Board Can. 30:711-714.

396
4 . ACKMAN, R. G., C.A. MCLEOD; and A.K. BANERJEE. 1990. AnOverview of Analyses by Chromarod-Iatroscan TLC-FID. J.Planar Chromatogr. 3:450-490.
5. ADDISON, R.F. 1989. Organochlorines and marine mammalreproduction. Can. J. Fish. Aquat. Sci. 46:360-368.
6. BLIGH, E.G and W.J. DYER. 1959. A rapid method of totallipid extraction and purification. Can. J. Biochem.Physiol. 37: 911-7.
7. BRANDAL, P.O., O. GRAHL-NIELSEN, T. NEPPELBERG, K.H. PALMORK,K. WESTRHEIM and S. WILHELMSEN. 1976. Oil-tainting offish, a laboratory test on salmon and saithe. I. C. E. S.,CM-E33: 1-6.
8. CHIOU, C.T. 1985. Partition coefficients of ozganiccompounds in lipid-water systems and correlations withbioconcentration factors. Environ. Sci. Technol. 19:57-62.
9. ERNST, R.J., W.M.N. RATNAYAKE, T.E. FARQHUARSON, R.G. ACKMAN,and W.G. TIDMARSH. 1987. Tainting of finfish by petroleumhydrocarbons. Environmental Studies Research Funds ReportNo. 080, Ottawa, 150 pp.
10. ERNST, R.J., J. CARTER and W.M.N. RATNAYAKE. 1989. Taintingand toxicity in sea scallops Placopecten magellan' cus!exposed to the water-soluble fraction of Scotian shelfnatural gas condensate. Environment Canada, Conservation andProtection, Marine Environment Protection Branch. Report EE-116, Section 2.
11. GOBAS, F . A. P. C., J. R. MCCORQUODALE, G. D. HAFFNER. 1993 .Intestinal absorption and biomagnification oforganochlorines. Environ. Toxicol. Chem. 12:567-576.
12. HARDY, R., K.J. MACKIE and A.D. MCINTYRE. 1974.Discrimination in the assimilation of n-alkanes in fish.Nature, 252:577-578,
13. HERAS, H., R.G. ACKMAN and E.J. MACPHERSON. 1992. Taintingof Atlantic salmon Salmo salar! by petroleum hydrocarbonsduring a short-term exposure. Mar. Pollut. Bull. 24:310-315.
14. KENNISH, J.M., D. GILLIS and K. HOTALING. 1988. Metabolicconversion of toluene and ethylbenzene by Pacific salmonmicrosomal preparations. Mar. Environ. Res. 24:69-71.
15. LARMOND, E. 1977. Laboratory Methods for Sensory Evaluationof Food, Publication ¹1637/E, Agriculture Canada, CanadianGovernment Publishing Centre, Ottawa, 73 pp,
16. Lockhart, W.L. and R.W. Danell. 1992. Field and experimentaltainting of arctic freshwater fish by crude and refinedpetroleum products. p. 763-767. In: Proceedings of theFifteenth Arctic and Marine Oil Spill Program TechnicalSeminar, June 1992, Edmonton Alberta. Environment Canada,Ottawa ON.
17. MARTINSEN, C., B. LAUBY, A. NEVISSI and E. BRANNON. 1992.The influence of crude oil and dispersant on the sensorycharacteristics of steelhead Oncorhynchus mykiss! in marinewaters. J. Aquat. Food Prod. Tech. 1:37-51.

397
18. MCKEOWN, B.A. 1981. Long-term sublethal and short-term highdose effects of physically and chemically dispersed oil onaccumulation and clearance from various tissues of juvenileCoho Salmon, Oncorhynchus kisutch. Mar. Environ. Res.5:295-300,
19. MILLER, M.A., C.P. MADENJIAN and R.G. MASNADO. 1992Patterns of organochlorine contamination in lake trout fromWisconsin waters of the Great Lakes. J. Great Lakes Res.18:742-754.
20. PARADIS, M. and R.G. ACKMAN. 1977. Influence of ice coverand man on the odd-chain hydrocarbon and fatty acids in thewaters of Jeddore Harbour, Nova Scotia. J. Fish Res. Bd.Can. 34:2156-2163.
21. POLVI, S. and R.G. ACKMAN. 1992. Atlantic salmon Salvosalaz.! muscle lipids and their response to alternativedietary fatty acid sources. J. Agric. Food Chem.40:1001-1007.
22. PURDY, J.E. 1989. The effects of brief exposure to aromatichydrocarbons on feeding and avoidance behaviour in cohosalmon, Oncorhynchus tusutch. J. Fish Biol. 34:621-629.
23. RASMUSSEN, T., T. SKARA and J.P. AABEL. 1992. Oil-taintingof cod. p. 359-366. In: H.H. Huss, M. Jakobsen, and J.Liston eds.!, Quality Assurance in the Fish Industry.Elsevier, Amsterdam.
24. RICE, S.D., D.L. THOMAS and J.W. SHORT. 1977. Effect ofpetroleum hydrocarbons on breathing and coughing rates andhydrocarbon uptake-depuration of pink salmon fry. p.259-278. In: J.F. Vernberg, A. Calabrese, R.P. Thurberg andW.B. Vernberg Eds.!, Physiological Responses of MarineBiota to Pollutants. Academic Press, New York.
25. STEGEMAN, J.J. 1974. Hydrocarbons in shellfish chronicallyexposed to low levels of fuel oil. p. 329-347. In: J.F.Vernberg and W.B. Vernberg Eds.!, Pollution and Physiologyof Marine Organisms, Academic Press, New York.
26. THOMAS, R.E. and S.D. RICE. 1981. Excretion of aromatichydrocarbons and their metabolites by freshwater andseawater dolly varden char. p. 425-447. In: J.F. Vernberg,A. Calabrese, R.P. Thurberg and W.B. Vernberg Eds.!,Biological Monitoring of Marine Pollutants, Academic Press,New York.
27. WHIPPLE, J.A., M.B. ELDRIDGE and P. BENVILLE. 1981. Anecological perspective of the effects of monocyclic aromatichydrocarbons On fishes. p. 483-549. In: J.F. Vernberg, A.Calabrese, R.P. Thurberg and W.B. Vernberg Eds.!,Biological Monitoring of Marine Pollutants, Academic Pxess,New York.
28. WHITTLE, K.J., J. MURRAY, P.R. MACKIE, R. HARDY and J. FARMER.1977. Fate of Hydrocarbons in Fish. Rapp. p-v. Roun. Cons.Int. Explor. Mer 171:139-142.

398
QUANTITATPfE DESCRIFIIVE ANALYSIS OF AMPHIPOD BROTHS.
Claire Martin, Jo61 de la NoGe and Lucien Adambounou'GREREBA, Sc. et Techn. des Aliments, University Laval, @~i~, P.Q. G1K-7P4.
'Biologic-Science Santb, University du Quebec h J~mi~k', P.Q. GSL-3A1.
Amphipods were harvested dining the fifties and the sixties as a rich sourceof proteins and pigments for the provincial government fish breeding operations.Commercial dry diets stopped the amphipod business because they were easier touse and stock We are searching for ways to give potential commercial outlet to thisunderexploited marine crustacea, mainly for human consumption. A second goal isto help the diversification of catches from the maritime region of Quebec. One of themain objectives of this work is to gather more information about the amphipodbiomass, since there is very little in the literature concerning compositional ornutritional aspects.
People are suspicious of the amphipod external appearence, thinking theyare insects because of their small size, their cuticle or dark color in some cases, Thisattitude changes when they are informed this animal is a crustacean, as indicated intable 1. Amphipods contain a multitude of soluble components, mainly proteins andlipids giving characteristic flavor similar to those of higher crustaceans whensubmitted to thermal treatments. This product could be made directly at the seafoodfactory and sold as a flavor concentrate. The main interest of this transformation isthe constitution of an important source of natural flavors.
Table 1. Classification of the amphipods studied and main flavor characteristics.
Family: GammaroidGammarus oceanicusFamily: LysianassidAnonyx sarci
crustacea
mollusc
The first objective concerning flavors was to develop a precise descriptivevocabulary to characterize amphipod broths. Another objective was to differentiate

399
between the broths from the two amphipod species and to try to define thesimilarities with higher crustaceans or molluscs during tasting sessions.
MAXXRIALS AND MEIHODS
l.a. Choice and principle of test.
A quantitative descriptive analysis QDA! was used, including two parts: abrainstorming session to identify sensory properties of the products and tastingsessions to evaluate each of the stated attributes. An unstructured line scale waschosen to get repeated measures for statistical analysis �!, thus ensuring objectiveconclusions to the test.
WeO identified broth samples and a series of references were presented tothe panel, one for each characteristic, the location of which was readily indicated onthe scale �!. Panelists were asked to taste the first reference before the broths, toverify its situation on the scale and then to proceed with each broth, tasting, rinsing,positioning them both on the same scale. Results were measured as distances in cmfrom the "none" side to the mark left by the judges �, 4!.
b. Panel members.Essentially, judges must know the product, be available, have good
memory and verbal capacities �0!. The test group included people of both sexes,aged between 25 to 40 years. They were workers at the provincial Ministry ofFood, Fisheries and Agriculture MAPA-Quebec! in Gasps city and were excusedfrom their regular duties for a 30 ruin period each day to take part in the sensoryevaluation program. They had little training in descriptive tests, but were chosenfrom a previous triangle test and showed good skills. The triangle test allowed afirst contact of members with amphipod samples and the selection of twelvemembers for the QDA.
c. Test room.
The test room was equipped with regular, well ventilated, individual boothsand a stainless steel sink. The trays were passed through a vertical sliding door,which separates the preparation area from the test room. The test area was alwaysodor-free and cleaned before each working session. A white lighting was used forthe test.
2.a. Amp hipods.
The species Anonyx sarci was harvested on July 1>', 1992 in the St-Lawrence river beside Grandes-Bergeronnes in the province of Quebec. Theanimals were then cleaned, immediately frozen at -30 'C and kept at this temperatureuntil cooking. Gammarus oceanicus were sampled from Rimouski on July 20<,1992 and similarly treated.
b. References for QDA.To guide the panelist, all attributes were accompanied by a reference
sample, except for three words: marshy, flavor intensity and flavor persistence.The varied references were made from food grade compounds or fresh food seeTable 2!.

400
c. Preparation of broths.Dilution of the broths was tried, but only a strong algal note was then
detected. To achieve the best description during tasting sessions, dilution waslimited to one part biomass with two parts water. This material was brought to aboil and cooked for 10 min, The mixture was grinded for 1 min in a Waring blendorand finally, the cuticles were strained out. Broths were always freshly made foreach block of criteria.
d. Preparation of sample trays.The samples and all references required were served in small plastic glasses
containing about 50 g of broth; judges were served as needed. All liquids includingrinsing water, were kept at room temperature �3 C!. The references were notserved at random, but in order of increasing strength. A ruler, a pencil, a napkin, astick or spoon to mix the settling solids were also supplied. Rusks Grissols! wereadded to avoid fatigue caused by persistent flavors and the large number ofattributes.
Table 2. Concentration of reference substances.
CONCENTRATION g4!
* Terms translated from French,
3.The selected design and relevant statistical analysis should ensure the
validity and accuracy of results and conclusion �!. The main objective was todevelop a precise descriptive vocabulary to characterize the broths. Also, by usingthe same scale for both broths, comparison of data by ANOVA analysis was possible.
At the round table session, panelists narrowed down the list of attributes totwenty, which were divided in three blocks, each making up a different test form:1>t= 7, 2«= 7 and 3d= 6 words. Six tasting sessions took place between august 4and 11 1992, panelists being convened between 2 and 3 PM each day. Sessions
AcidAlgalAstringentBitterBoiled cornHepatopancreasIodide/iodineMilkMushroomsPepperPotatoesSaltySnow peasSunflower seedsSweetUmamiUrchin gonads
Citric acid, cristalsDried algae, JapaneseStrong teaQuinine sulfateWithout the kernelsCommercial paste incl. liver!LugolLukewarmFreshBoiled and filteredRaw, peeledNaClCooked 5. minShelledGlucoseMonosodium glutamateFresh, grinded
0.420.024.0
0.1cob cuts10.0 g
1.030.0 ml
1.00.8
pieces1.4
few pods6-10 seeds
18.02.0
86.5

401
lasted around 30 min. Table 3 shows how the experimental design was organized toperform the ANovA analysis. Attributes were named criteria, repetitions were caHedexperiments Exp!, while the treatments Trt! were the broths. Blocks ¹1 and ¹3were evaluated twice by 12 panelists, but for block ¹2, the first session was donewith 11 people and the repetition was done with only 8. To ease analysis of theseresults block ¹2!, we only kept the evaluations from the eight judges that came toboth repetitions. The distance on the scale between the zero side to the mark left bythe panelist was measured and a group mean was computed. Through the SASsystem, a program giving an evaluation of normality, data homogeneity and theanalysis of variance was used.
We proceeded criterion by criterion for the ANOVA, as for repeatedmeasures. Differences between the two broths can be drawn with a high d.f. of 23at the error. It also gives differences between repetitions Exp!, which must be nuH,since broths and all tasting sessions were made according to specific standards.Another part of ANOVA shows the variability between the 12 judges and Judges~Expshows variability of the individual judge from one repetition to the other. A value ofa < 0.05 was considered an acceptable level of significant difference. Type I errors,i. e., rejecting Ho when in reality there is no difference between treatments, areunlikely to happen at this or lower levels.
Table 3. Experimental design for the SAS program.
General Linear Models Procedure: PROC GLMExample of Criteria = Acid "AC"
Dependent variable: EvaluationNumber of observations per group = 48
Ho: null hypothesis, there is no significant difference between the two studiedbroths for the same criteria or qualifier.
Hi: alternative hypothesis, is when Ho is rejected ineaning a difference existsbetween treatments.

402
RESULTS AND DISCUSSION
Dr R. York of Manitoba Fisheries and Oceans Dept. helped over the choiceof test and confirmed that better results would be obtained with regular consumers ofmarine products, even if the training to QDA was short. Attributes called to mindduring the brainstorming depends on personal experience of involved members.Gasps, a fishing region in the province of Quebec, was chosen for the sensoryevaluation of crustacean broths. The panel members all work at the MApAQ and thetasting sessions are seen as a part of their job. This insures a responsible attitudetowards the tests, which was maintained to the end of the study.
The first results are from the round table list of words; if these wereimproper, there would be no point in quantifying them. At the round table, up tosixteen persons were invited to decide on the terminology to be used. Nointerference was made during this session and aH remarks and attributes were writtendown, reducing the number of words with panel agreement only. There was notime for exhaustive training and the round table period was used for that purpose,but this was insufficient see below!.
This study was done in French and the different attributes had to betranslated for the present publication. Many of the twenty attributes are found in theliterature �!. No term received a mean lower than 3.3, so we may say no attributewas eliminated by the quantitative test. There were never differences betweenrepetitions and seldom did significant variations in judgments happen behveen therepetitions for the same criteria and by the same judge Judges~Exp!. The valuesfrom the entire group of judges show great disparities: the worst example is theboiled corn with a minimum of 2.1 and a maximum of 14.1 on the 15-cm scale.Either some panelists had problems detecting or identifying the flavor, else it couldbe they had different opinions on the definition of this term, even if agreed uponpreviously. This emphasizes the need for more training.
Out of the twenty criteria or studied attributes, only seven showedsignificant differences a < 0.05! between the broths: astringency, hepatopancreas,flavor intensity, flavor persistence, milk, pepper and salty taste. The other thirtheencriteria, though not differentiating broths from one another, are nonethelessimportant in distinguishing amphipod broths from other marine products. To easediscussion and allow analysis of prominent features of broths, results werearbitrarily chssified according to types of flavors.
The next five tables show results concerning attributes: the bold lettersindicate the significant differences between broths and the corresponding u values.The qualitative evaluation was given a posteriori to ease discussion of results: 0 isnull, > 0 to 3 is very weak, > 3 to 6 is weak, > 6 to 9 is average, > 9 to 12 is strongand then up to 15 would be extreme. Some attributes can be found in more than onecategory.
The first category comprises all basic tastes Table 4!, including umamibecause it is also produced by non volatiles. Only one of' the basic tastes gave asignificant difference between the amphipod broths: it was the salty criteria. Usingthe standard procedure with a Chloride Analyser 926 froin Corning, the saltconcentration of' the broths was found to be 0,30 % for Anonyx and 0,49 % forGalnInarus. The standard deviations are low, but the judges did not quite agree onthe absolute value on the scale.

403
Table 4. Category: basic tastes.
Significant differences in bold letters. N = 48.
The sweet criteria did not show an acceptable difference a > 0.05!, butthere was a tendency for the members to find one broth sweeter. AH means werehigher for Gammarus except for bitter, which shows equal values for both broths.This could be due to the strong flavor intensity of this species Table 5!.
Table 5. Category: mouthfeeL
Significant differences in boM letters. >N = 32; otherwise N = 48.
Table 5 presents the means for the criteria intensity of flavor and theunquestionable significant difference between the broths, The mouthfeel category isstatistically the most informative: four of the five words gave significant differencesbetween broths with varying values of a. Pepper and persistence are accepted as

404 different, even if values slightly exceed the 0.05 level; care must be taken howeverwhen conclusions are drawn. Gammarus was always rated higher, except for rawpotato and pepper flavors. Judges experienced difficulties with pepper, since wefind disagreement for the same members between repetitions. This definition shouldbe better specified.
The various categories were introduced after treatment of data, only fromlooking at the nature of the words, not f'rom the ANOYA results. Still, it may not bequite the way the inembers saw it, particularly for raw potato: on tasting Anonyx aposteriori, we felt a similar texture to that of starch granules, but this was notdefined at the round table. Instead, panelists specifically chose that term for the rawpotato flavor.
In the sea category Table 6!, there is no difference between broths, exceptfor salty. No words like fishy, cheesy or ammonia came out in this category.Instead words like urchin, hepatopancreas and umami Table 8! are found, whichsupport the resemblance with cooking liquids from molluscs or crustaceans. Somepanel members felt the broths were too concentrated, but dilution made it impossibleto distinguish any other notes besides a predominant algal flavor.
Table 6. Category: sea.
Significant differences in bold letters. >N = 32; otherwise N = 48.
There was a controversy at the round table about iodide/iodine. Somemembers said it felt similar to an algal flavor for thein, others arguing they weretotally different. After discussion and reference tasting, the members agreediodide/iodine represented the closest reference to sea breeze, sea shore smell. Itreceived weak rates, much lower than algal; these words are very different.According to Whitfield et al. 9!, the 2,6-dibromophenol would provide the salty-marine or iodine-like impression froin fish and seafood. This chemical, specific tomarine animals, allows to differentiate them from freshwater ones �!.
From table 7, the evaluations seem to be higher four times out of six for theAnonyx species, but no significant difference was found in the vegetable category.Concerning Anonyx, the reason for all the vegetable words could be explained by

405
their high lipid content �5.8 % of dry wt, unpublished data!. We compared ourresults with reports and articles and found many vegetable-based descriptors. Manycarbonyls and alcohols are yielded by specific lipoxigenases, responsible for theexistence of similar compounds in plants �!.
Table 7. Category: vegetables.
1N = 32; otherwise N = 48.
Algal notes are the strongest in this category also, with means around 8.7.Gammarus species directly feed on algae and there could be some in their stomachthat would impart the algal note. Concerning the boiled corn, the panel talked aboutthe cob without the grains, involving a sulfur compound that resulted in averagemarks for this flavor. The fresh mushroom aroina would essentially come from 1-octen-3-ol, an eight-carbon component 8!. Preliminary GC-MS unpublished resultsshow the presence of a whole family of enol substances, on which no sniffing wasdone. More work is planned to correlate the volatile compounds identified by GC-MS with terms used by the panel.
For the meat flavor category Table 8!, Gammarus was given all the highmarks with a good significant difference for hepatopancreas. The justification forworking with a panel of regular seafood eaters is very clear here; city dwellers avoidthis part of the lobster. We are presently looking at soluble non-protein nitrogen,like nucleotides and quaternary ammoniums. A high amount of these compoundscould explain the stronger values for hepatopancreas notes and umami taste ofGammarus broth.
The qualifier milk did not fit in the previous categories, but it could berelated to the nutty/buttery flavor, as identified by Edmunds and Lillard's panel �!,According to these authors, it characterizes crustacea as well as molluscs. However,broths were parted by this attribute with a significant level of 0.0333. Milk noteswere detected as significantly stronger for the Anonyx broths; it concerns milk atroom temperature, as specified by panel members.

406
These are preliminary results, giving a basis for future work. The choice ofthe experimental place was excellent and all panel members were very interested,professional, motivated and patient. Still more work is needed, plus another roundtable session to discuss more appropriate terms if adequate differences between theproducts are to be determined. In fact, repeated measures would lower variationcoefficients, the standard deviations and provide greater confidence in theconclusions. Absolute values for each studied attribute could probably be obtained.
Table 8. Category: meat flavor.
M>S CELL~US
Significant differences in bold letters. >N = 32; otherwise N = 48.
CONCLUSION
The project main objective was attained, since both broths were specificallydefined. Anonyx broth was qualified a milky juice with nutty, pepper, green, rawpotato and mushroom notes. It leaves a long lasting mouthfeel, probably caused bythe high lipid content. Gammarus broth also possessed a strong persistent flavor; itis more astringent, saltier and characterized by a hepatopancreas note. More testingwould be necessary to validate a correct terminology and establish the minimumwords required to characterize our products.
ACKNO'%ILEDGEMENTS
We especially wish to thank Ms Julie Boyer and Mr Ghislain Masson,"Direction de la Recherche Scientifique et Technique", of the Quebec Ministry ofFood, Fisheries and Agriculture. We are grateful to Dr Roberta York of MPO,Winnipeg Manitoba, Canada! for her knowledgeable advice in sensory evaluationand to Drs J.-M. Girard and J. Collin, University Laval, for help with statistics,

407
REFERENCES
1. A.S.T.M. Committee E-18 �990! "Manual on sensory testing methods" STP434 10e Ed. Am. Soc. for Testing and Materials. Philadelphia, Pa.77p.
2. EDMUNDs, W.J. AND D.A. LILLARD �979! Sensory characteristics ofoysters, clams, and cultured and wild shrimp. J. Food Sci., 44�!:368-373.
3. LINDSAY, R,C. �990! Fish flavors. Food reviews international, 6�!: 437-455.
4. MEILGAARD, M., G.V. CIVILLE AND B.T. CARR �991! "Sensory evaluationtechniques". 2e Ed. CRC Press.
5. SIDEL J. AND H. STONE �976! Experimental design and analysis of sensorytests. Food Techn., 30�1!: 32-38.
6. STONE H, J.L. SIDEL, S. OLIVER, A. WOOLSEY AND R.C. SINGLETON�974! "Sensory evaluation by Quantitative Descriptive Analysis" FoodTechn., 28�1!: 24-31.
7. WEISS, D.J. �972! "Averaging: an empirical validity criterion for magnitudeestimation." Perception and Psychophys., 12: 385.
8. WHITFIELD F.B., D.J. FREEMAN, J.H. LAST, P.A. BANNISTER AND B.H.KENNETT �982! Oct-1-en-3-ol and �Z!-Octa-1,5-dien-3-ol,compounds important in the flavour of Prawns and Sand-Lobsters.Aust. J. Chem., 35: 373-383,
9. WHrlFIELD F.B., J.H. LAST, K.J. SHAW AND C.R, TINDALE �988! 2,6-dibromophenol: the cause of an iodoforrn-like off-flavour in someaustralian crustacea. J. Sci. Food & Agric.,46: 29-42.
10. ZOOK, K. and C. WESSMAN �977! The Selection and use of judges fordescriptive panels. Food Technol., 31�1!: 56-61.

408
U.S. DEPARTMENT OF AGRICULTURE PROGRAMS SUPPORTINGAQUACULTURAL PRODUCTS SAFETY AND QUALITY
Gary L. JensenUSDA-Extension Service
Ag Box 0916Washington, DC 20250-0916
The U. S. Department of Agriculture USDA! has traditionallysupported and participated in programs and projects that help assure thatU. S. agricultural commodities and crops provide consumers with anaffordable, wholesome food supply. Since 1990, USDA's involvement withfood safety and quality issues related to aquacultural products hasincreased. Numerous USDA programs now recognize that aquatic foods,which include finfish and shelNsh, are regarded as agricultural derivedfoods. USDA's Agricultural Marketing Service, Cooperative State ResearchService and Extension Service, in addition to the USDA RegionalAquaculture Center program, have supported research and extensioneducation projects related to food safety and quality.
With an increased awareness of and expanding involvement inaquaculture issues, USDA can be expected to continue supporting foodsafety and quality research and educational projects that have regional andnational impact and relevance to enhancing our Nation's commercial aquaticfood sector.
This paper provides specific information on USDA funded andsupported initiatives and opportunities for extending participation to thosepersons and institutions involved with aquatic foods safety and qualityprograms.

409
A ricultural Marketin Service
This USDA program funded a project through a cooperativeagreement with a university that evaluated physical distribution proceduresto maintain product quality of hybrid striped bass from pick-up at the pointof production, delivery to the processing plant, and final delivery to the retailstore. Funding of cooperative agreements are based on projects of mutualinterest and need for facilitation of critical linkages with private sectorbusinesses. Only research projects are funded. The output from thisproject was a publication �! and an educational video titled, "Sunshine8ass from Tank to Market". Note that sunshine bass is the same as hybridstriped bass.
Coo erative State Research Service
The National Competitive Research Initiative Grants Program wasinitiated in fiscal year 1991. Since that time one funded program area hasbeen "Food Safety". For %seal year 1994 the program area name has beenchanged to "Ensuring Food Safety". Annual funding for Food SafetyProgram area projects has been about $2 million. For fiscal year 1991, agrant was awarded to fund a project titled, "Effects of Refrigeration onVirulence and Viability of Vibrio vulnificus". For fiscal year 1992, a grantwas awarded to fund a project titled, "Effects of Storage and DepurationTemperature on Pathogenic Vibratos in Shellfish". Future annualappropriations are expected as food safety remains a high priority issuewithin USDA.
Extension Service
The Extension Service began a national initiative, "Food Safety andQuality" in 1991. This is a competitive grants program that provides fundingto state Cooperative Extension Services that are involved with thedevelopment and delivery of educational programs related to this topic.Funded projects are anticipated to have regional or national impacts.
In fiscal year 1991 the following projects were funded: developmentof an easy to use hands-on manual for implementing HACCP in delioperations �!; development of a video educational program on the HACCPsystem applied to the catfish industry �!; and development of anaquaculture database as a component of USDA's Food Animal ResidueAvoidance Databank FARAD! located at the University of California,University of Illinois and University of Florida.

410
The aquaculture database project had continued funding in fiscalyear 1992. This project will provide information on the regulatory status ofEPA registered pesticides for aquatic site use and FDA approved newanimal drugs for aquaculture use. Bibliographic support is aiso available toindividuals or organizations to fulfill FDA informational requirementsassociated with Investigational New Animal Drug applications INADs!.Data and information are also available for incorporation into producerdeveioped quality assurance programs.
The Catfish Farmers of America has developed a quaiity assuranceprogram �! and the U. S. Trout Farmers Association is in the process ofdeveloping a similar quality assurance program for trout producers that isexpected to be completed at the beginning of 1994. The American TiiapiaAssociation is aiso developing plans for an industry quality assuranceprogram that meets the needs of U. S. tilapia growers. The WashingtonFish Growers Association was one of the first finfish organizations in the U.S. to develop a program to promote high facility operating standards �!.These voluntary industry initiatives follow earlier efforts directed atdeveloping Hazard Analysis Critical Control Points HACCP! guidelines andmodel programs for U. S. aquaculture producers �,7!.
For fiscal year 1993, two projects related to seafood/aquaculturesafety and quality have been funded by the Extension Service. The firstinvolves a multi-institutional team approach to develop a comprehensiveeducational program that will enable aquaculture firms catfish and oysterprocessors! to utilize TQM and HACCP concepts for the processing of safeand wholesome products. Another aspect of this project is to develop asuggested strategy for national implementation.
The second project also employs a multi-institutional team approachto develop and distribute educational products that will support producer-based quality assurance programs in the U. S.. Materials to be developedinclude an educational fact sheet, video and slide set. Another componentis the broadcast of a national satellite videoconference that will educate abroad aquaculture constituency about the importance and guidance forparticipating in producer oriented quality assurance programs. The lastobjective in this project is to evaluate the access and services of theaquaculture database associated with the FARAD program. The results ofthis evaluation will be shared with the database managers to improveservices as needed. Both Extension Service projects use an industryadvisory committee to assist with project pianning and implementation.
Re ional A uaculture Center Pro ram
The five USDA funded Regional Aquaculture Centers wereestablished in 1987 and 1988. Project priorities are identified by an Industry

411
Advisory Council with private-sector members and a Technical Committeecomposed of research and extension education scientists. Project fundingrecommendations are made by a Board of Directors and final approval isgiven by USDA. There have been numerous projects and publicationsfunded by this program that relate to food safety and quality of aquatic foodproducts.
The Southern Regional Aquaculture Center SRAC! has developedseveral educational fact sheets 8�9,10,11,12,13! that address varioussafety and quality related topics. Two multi-year projects have also beenfunded. One addresses aquaculture food safety residues and the otherfocuses on aquaculture food safety microbials. The residues projectaddresses the following objectives; i! develop a database for chemicalcontamination information in farm-raised catfish, crawfish and rainbow trout,ii! develop guidelines and protocols for a residue monitoring program atprocessing facilities, iii! develop educational materials for producers andprocessors regarding safe use of chemicals associated with production andprocessing, iv! develop a user-friendly computer software recordkeepingprogram, v! determine fate of residues from farm to processing plant to finalretail product, vi! conduct any additional sampling to improve database onresidues.
The other project on microbials addresses the following objectives:i! collect available data to define aquacultured food safety problems anddesign a control program, ii! conduct a forum to assess all relevant data onsafety of aquacultured foods, iii! develop a bibliography of availableinformation relative to food safety and sanitation in the aquaculture industry,iv! evaluate data on microbial quality of caNsh, crawfish and rainbow troutprocessing and distribution operations, v! investigate various methods toreduce and detect significant pathogenic and spoilage microorganisms onprocessed catfish, crawfish and rainbow trout, vi! conduct a food safetyHACCP audit to determine if this approach would be cost-effective andresult in increased product safety, and vii! produce new publications tocomplement existing materials on food safety and sanitation.
One outcome of these projects was the convening of an AquacultureProducts Safety Forum in February 1993 that had objectives to: i! determinepresent status of microbes and residues related to the safety ofSoutheastern U. S. aquacultured products, ii! propose what the status ofmicrobes and residues related to the safety of these products could be orshould be within 3 to 5 years, and iii! develop an action plan to bridge thegap between present status and proposed future status. A proceedingswas developed that included presented papers and recommendations �4!.The highlights of this Forum were also communicated via a live nationalsatellite videoconference on Aquaculture Product Safety in June 1993.

412
The Northeastern Regional Aquaculture Center NRAC! recentlyapproved a project to develop a model quaiity assurance program for theaquaculture industry in the Northeast. Project objectives include thefollowing: i! develop two introductory quality assurance programs designedto provide finfish and shellfish growers with best management practices forcontinued production of safe, quality products, ii! develop a brochure forproducer use to promote public awareness of the quality assuranceprograms. This project is pending final approval by USDA.
The North-Central Regional Aquaculture Center NCRAC! hasconducted surveys related to seafood product quality and published theirfindings �5!. The Center for Tropical and Subtropical Aquaculture CTSA!has also supported projects concerning marketing and shellfish sanitationprograms with findings also published in available reports �6, 17!.
Joint Subcommittee on A uaculture
The Joint Subcommittee on Aquaculture JSA! is a national federalagency coordinating body chaired by the USDA's Secretary of Agriculture designate! that addresses various issues of national scope and importance.Associated with the JSA are numerous national task forces or workinggroups that address specific topics. One is the Working Group on QualityAssurance in Aquaculture Production that was formed in 1990 and includesrepresentatives from Federal agencies, aquaculture industries, nationaltrade organizations, academia and others interested in aquaculture qualityassurance matters. This Working Group is serving as a national Forum toidentify issues and develop action strategies to coordinate efforts primarilydirected at preventing the occurrence of violative drug and pesticideresidues in aquacultural food products.
The Working Group has been addressing several objectives and hasdeveloped several products for national distribution to the aquacultureindustry and persons associated with it. The objectives include thefollowing.i! develop a comprehensive publication summarizing Federal regulation
of drugs, biologicals and chemicals used in aquaculture production�8!
ii! develop a central databank of drug and chemical information forcompounds used in aquaculture production through the FARADprogram,
iii! develop a publication on guide to the proper use of drugs, pesticidesand vaccines used in aquaculture to include a listing of Federallyapproved, registered and licensed regulated products expected to becompleted in 1994 G. L. Jensen, 1993, ES-USDA, personalcommunication!,

413
encourage and coordinate the development of producer qualityassurance programs,seek clarification of regulatory status of compounds used inaquaculture production and,encourage education of Federal/state agency personnel withregulatory jurisdiction of drugs, chemicals and biologicals onaquaculture practices and regulatory needs.
iv!
v!
vi!
The JSA Working Group has also supported the need for and creation ofa part-time position of National INAD Coordinator whose function is to workwith INAD holders and applicants, FDA, the USDA Interregional ProjectNo. 4 IR-4! Animal Drug Program, private industries and other Federalagencies to coordinate the development and collection of data required forFDA approval of new animal drugs for aquaculture.
Conclusion
USDA has various programming structures that facilitate thecoordination of research and educational outreach efforts at the nationaland regional levels. Other networks including the State CooperativeExtension Services and companion Sea Grant Marine Advisory Servicesoffer educational program capabilities that reach a vast nationwideconstituency that is involved with aquatic foods production, processing,handling, distribution, marketing and consumption.
References
1. AMMERMAN, G.R. 1989. Processing Channel Catfish. SRACPublication No. 183
2. BRUNSON, M. ed.!. 1993. Catfish Quality Assurance. CatfishFarmers of America, Indianola, MS, p. 14.
The U. S. Department of Agriculture is recognizing more theimportance of the seafood sector in U. S. and global markets and the issuethat aquaculture products are farm-raised products and thus regarded asbeing agricultural products. Pending Federal legislation can provide furtherclarification on this issue within USDA. With an increased awareness ofand expanding involvement in aquaculture, USDA can be expected tocontinue supporting food safety and quality research and educationalprograms nationwide that are relevant to enhancing our Nation's commercialaquatic food sector and providing consumers with high quality, wholesomeaquatic food products.

414
COALE, C.W., J.P. ANTHONY, G.J. FLICK. G.S. LIBEY, G.HONG, G. Spittle and N.A.VALLEY. 1993. MarketingAquaculture Products: A Retail Market Case Study forSunshine Bass. Bulletin 93-3. Virginia Agricultural ExperimentStation, Virginia Tech.
3.
CRAWFORD, C. 1992. A Review of U. S. Food and DrugAdministration Requirements to Market Giant Clam Meat in theUnited States of America. CTSA Publication 4109.
HUSHAK, L.J., C.F. COLE and D.P. GLECKLER. 1993. Survey ofWholesale and Retail Buyers in the Six Southern States of theNorth Central Region. NCRAC Technical Bulletin Series 4104.
6. JSA WORKING GROUP ON QUALITY ASSURANCE INAQUACULTURE PRODUCTION. 1992. Federal Regulationsof Drugs, Biologicals, and Chemicals Used in AquacultureProduction. USDA National Agricultural Library, Beltsville, MD.p. 123.
KIM, J.M. 1993. Part I An Overview of the HACCP System and PartII Application of the HACCP System to Catfish Farming andProcessing videos!. Coastal Research 8 Extension Center,Mississippi State Cooperative Extension Service, Mississippi
LADEWIG, K. and D.W. LOGAN. 1992. You Can Do Catfish. SRACPublication No. 501.State University.
8.
MCGILBERRY, J.H., V. CULVER, G. BROOKS. K. HOOD. S. DEANand D. LABRUYERE. 1989. Processed Catfish - ProductForms, Packaging, Yields and Product Mix. SRAC PublicationNo. 184.
9.
NATIONAL FISHERIES INSTITUTE, INC. 1991. Seafood IndustryHazard Analysis Critical Control Point Workshop and ModelTests - Aquaculture. Final Report, Arlington, VA.
10. MCGILBERRY, J.H., V. CULVER, G. BROOKS, K. HOOD, S. DEANand D. LABRUYERE. 1989. Processed Catfish - ProductQuality and Quality Control. SRAC Publication No. 185.

12. NATIONAL MARINE FISHERIES SERVICE. 1991. HACCPRegulatory Model - Aquaculture. Model Seafood SurveillanceProject, Office of Trade and Industry Services, Pascagoula,MS. p. 65.
13. PERKINS, B.E. ed.!. 1993. Proceedings of the Aquaculture ProductsSafety Forum. February 2-4, Auburn University, AL. SRACProceedings Publication.
14. PRICE, R.J., P.D. TOM and K.E. STEVENSON. 1993. EnsuringFood Safety.. The HACCP Way - An Introduction to HACCP& A Resource Guide for Retail Deli Managers. California SeaGrant College, University of California at La Jolla, p.40.
15. SCHULER, G.A. and P.T. TYBOR. 1993. Developing a HACCPProgram for the Catfish Processing Industry. SRACPublication No. 490.
16. SHANG, Y.C., P. LEUNG and C. TISDELL. 1992. Test Marketing ofGiant Clams as Seafood and as Aquarium Specimens inSelected Markets. CTSA Publication ¹1 10.
17. VANDERPLOEG. M. 1991. Testing Flavor Quality of PreharvestChannel Catfish. SRAC Publication No. 431.
18. WASHINGTON FISH GROWERS ASSOCIATION. 1991. BestManagement Practices for Net Pens. Olympia, WA, p.12.

416
ABSTRACTS
FDA CERTIFICATION PROGRAM FOR SEAFOOD EXPORTED TO THE EC
Richard Dees
Food and Drug AdministrationWashington, DC
No abstract submitted
STATUS OF THE U.S. DEPARTMENT OF COMMERCEINSPECTION PROGRAM
Tim Hansen
National Marine Fisheries Service
1315 East West HighwaySilver Spring, MD 20910
No abstract submitted
USDC CERTIFICATION PROGRAM FOR SEAFOOD EXPORTED TO THE EC
Robert Nordstrom
National Marine Fisheries Service
Silver Springs, MD
No abstract submitted

417
MANDATORY NUTRITION LABELING UPDATE
Janet Walraven
Consumer Safety OfficerPohcy Guidance Branch, Office of Seafood
Center for Food Safety and Applied NutritionFood and Drug Administration
200 C Street, SW, Washington, DC 20204
The new nutrition labeling regulations are a result of the Nutrition Labeling and EducationAct of 1990. The primally objectives are; 1! to clear up consumer confusion about food labels, 2! aidconsumers in making healthy food choices, and 3! to encourage manufacturers to produce innovativefood products that improve the quality of the food supply and that make healthy choices available tothe consumer.
The four major effects are 1! the list of nutrients whose content levels are required wererevised; 2! a new format made up of three major sections, a! title, serving size and servings percontainer, b! macronutrients and calories, and c! micronutrients and footnotes; 3! nutrition labelingis mandatory for most packaged foods; and 4! nutrients are to be declared based upon standardizedserving sizes.
The regulation include 1!mandatory declaration of nutrient content, definitions of nutrientcontent claims descriptors! that can be used, and 3! what health claims can and can not be declared,

418
OVERVIEW OF PHOSPHATE USE IN SEA SCALLOP PROCESSING
Robert A, Fisher
Virginia Institute of Marine ScienceCollege of William and MaryGloucester Point, VA 23062
Phosphates are used within the sea scallop industry for the primary purpose to controlmoisture content. Sodium tripolyphosphate STP! is the most widely used phosphate product inscallop processing. EfFectiveness of STP in controlling scallop moisture can be highly variable,depending on factors such as reproductive state of scallops at time of harvesting; on-board handlingand stowage practices; STP concentrations used in processing solution; method of phosphateapplication was, dip, soak, vacuum tumbling!; and, the use of sodium chloride NaCl! in STPsolutions. Scallop nutritional equivalency is efFected by resulting moisture content due to thesevariables. Increasing scallop moisture content decreases scallop nutrient levels. Moisture loss dueto freeze/thawing and cooking contributes to the loss of water-soluble nutrients, The use of STPreduced scallop drip loss, which in turn, reduced scallop nutrient loss.
Phosphates have also been used to remove crystalline precipitates white spots! from importedbay scallops from China and domestic sea scallops. Sodium hexametaphosphate SHMP pH 7.0! anda commercial blend of STP, SHMP, and acid pyrophosphate pH 7.2! was demonstrated to dissociatethese precipitates.
REGULATORY PERSPECTIVE ON THE USE OF PHOSPHATESIN THE SEAFOOD INDUSTRY WITH EMPHASIS ON SCALLOPS
JefFrey W, Bier and Millie BenjaminFood and Drug AdministrationWashington Laboratory Branch
Washington, DC 20005
In July of 1992 the Food and Drug Administration issued an interim policy that requiredlabeling sea scallops with over 80'/o moisture as X/o water added Scallop Product. This interimpolicy also required that the phosphates used in processing be declared on the label and set amaximum limit of 84 Jo moisture of 25'lo moisture added for marketing of scallop product,
A field assignment was issued in November of 1992 for districts to inspect domestic scallopprocessors and to sample their product and check for labeling compliance. Thirteen domesticprocessors were inspected and samples were collected and analyzed. Samples were collected from21 consignees of these firms. The moisture content of domestic scallops analyzed ranged from 78.4to 86,6ofo. In addition, 32 shipments of imported scallops were sampled and analyzed for moisturecontent. The moisture range measured in imported scallops was from 75.4 to 89.6o/o. The resultsof these findings will be discussed in detail.

419
DETECTION OF ADDED PHOSPHATES IN SEAFOODS
Judith Krzynowek and Laurie J. PannunzioNMFS
Gloucester, MA
The use of thin layer chromatography techniques to distinquish between naturally occuringmono phosphates present in all seafood and added phosphates in the form of tripolyphosphate saltswill be discussed. The combined TLC methods of Gibson and Murray, 1973; and Redde and Finne,1985; were used to show the capabilities of the technique for inspection purposed. Tripolyphosphateusage was clearly detectable after 3 months of uninterrupted frozen storage. The drip from theproduct is excellent sampling material making the TLC method quick and easy.
This method is only qualitative at this time and has several limitations. Additional work-upis necess:uy to detect abusive practice. Tripolyphosphates hydrolyse over time to naturally occurringphosphates. Therefore, with prolonged storage, detection of initial usage decreases.
FOOD SAFETY AND SANITATION IN THE SEAFOOD INDUSTRY
Dale L. Fredell
Klenzade, A Service of EcolabEcolab Center
St. Paul, MN 55101
The production of safe and quality foods in the primary objective of all food processors.Microorganisms can cause both a quality defect spoilage! and a safety defect foodborne illness!.Control of microbiological contamination requires an understanding of microorganisms and thefactors that influence their growth, survival and the factors that contribute to the microbiologicalcontamination of food. The costs of a foodborne disease outbreak; product recall, adverse pubicity,lawsuits, etc., make prevention of contamination the primary goal of the food processing industry.
Contamination of seafood products by microorganisms or other contaminants, can beminimized by an effective sanitation program. This paper will examine the causes of food bornedisease, the objectives of a sound sanitation program and discuss types of products used to clean andsanitize food processing equipment. New sanitation concepts also will be presented.

420
A NEW LOOK AT REGULATORY MICROBIOLOGICAL STANDARDS,SPECIFICATIONS AND GUIDELINES FOR SEAFOOD PRODUCTS
E. Spencer Garrett, DirectorU,S, Dept. of Commerce
National Marine Fisheries ServiceNational Seafood Inspection Lab
Pascagoula, MS
The paper describes the difficulty in establishing Microbiological Standards, Guidelines, andSpecifications for Foods. The background on the subject is ofFered and the confusion relative to thesubject is detailed. The microbiological criteria established for seafoods in the United States arediscussed. The international aspects of establishing microbiological criteria through the CodexAlimentarious Commission is also elaborated. Future actions relative to the subject are predicted.The future actions include the need for increased awareness of alternative approaches such asHACCP, as well as the need for increased understanding of the statistical reality os AcceptanceSampling Plans. The author points out how a lack of statistical understanding os sampling plans oftenleads regulators to a false sense of security. The author also predicts how in the United States,microbiological standards for raw foods will be elaborated incorporating the use of 3-class samplingplans instead of the 2-class sampling approach currently employed for pathogens in cooked products.
HACCP FOR MICROBIOLOGICAL HAZARD CONTROL IN SEAFOODProcessing Plants
Barbara J. Jackson, Ph.D.VICAM
313 Pleasant Street
Watertown, MA 02172
Over the next few years, many seafood processors will be implementing new programsdesigned to increase product safety. One such program, HACCP, has received much attention as ameans of monitoring and controlling the hazards that exist in food processing plants. In addressingthese hazards, detection and containment of bacterial pathogens in plants is a key safety issue targetedin many HACCP programs.
Application of HACCP to monitoring and control of microbiolgoical hazards is not difficult.The options facing a processor who wishes to implement microbiological HACCP will be discussed.Properties of different microbiological tests will be compared, with particular focus on testingListeria. A 24 our quantitative method for Listeria testing, called Listertest, will be among the testspresented. Finally, examples which illustrate microbiological testing and clean-up of contaminatedenvironments will be analyzed.

421
THE REVISED FISH LIST
Spring Randolph and Mary SnyderFDA
Office of Seafood, HFS-416200 C Street, FOB-8
Washington, DC 20204
In recent years, there has been an increase in seafood consumption in the United States,Increased consumption, along with increase importation of unfamilar seafood and use of differentnames for the same seafood in different regions of the country, led the Food and Drug Adminstratin FDA! and the National Marine Fisheries Service to recognize a need for a single source forrecommended or required market names for seafood sold in interstate commerce in the United States.
In 1988 "The Fish List" was published by FDA to provide a source of names which wouldfacilitate order in the marketplace and reduce confusion among consumers, This list established someorder in the marketplace, however, the invertebrate species mollusks and crustaceans! were notincluded. The FDA established an updated list, entitled "The Seafood List", which includes theinvertebrate species sold as seafood in the United States. The list is located in the Center for FoodSafety and Applied Nutrition Thesaurus for easy access to update and locate information.
The "Seafood List" represents an extensive, although not complete, listing of seafoodcommonly sold in the United States. This hst is divided into two main parts: Part I-Vertebrate andPart II-Invertebrate. Each part is divided into two sections. Section I lists the species alphabeticallyby market names, followed by the common, scientific, and vernacular names. Section II lists thespecies alphabetically by the scientific names, followed by the market names. These section areplaced in "The Seafood List" to aid in locating the species of interest. However, the listed marketname or the common name should be used to label seafood products entering interstate commerce.The agency discourages the use of vernacular names. Vernacular names used outside the regionwhere the name is commonly known may mislead consumers and could result in regulatory actionsby the agency, These names have been included on the list for information purposes only and toreference the vernacular names to the appropriate common and market names. Use of the commonand market names supplied in "The Seafood List" will promote labeling consistency in the variousareas of the United States. It will enhance the abilitty of consumers to make informed choices amongseafood products, In addition, the list will provide the seafood industry with uniform nomenclatureand assurance that the use of the listed common or market name to identify seafood will be incompliance with food labeling requirements,

422
HACCP CURRICULUM IN A COLLEGE PROGRAM
Laxman Kanduri
Marine Education Dept.Kingsborough Community College, Manhattan Beach
Brooklyn, NY 11235
Martha Hudak-Roos
MHR Consultants
109 Keyser St.Marietta, OH 45750
The development and pilot study of a HACCP curriculum for a two-year focused seafoodprogram at the college level will be explained. The course, "HACCP and Quality Control Program"was designed as a four credit elective course for Kingsborough Community College's SeafoodBusiness Management associuate degree program, The draft course consists of both lecture andanalytical laboratory exercises. The content of the course material and the evaluation of the student'sleam' process will be discussed. The importance of such education and training will be examined.This work was funded by NOAA Grant No, NA26FK0400-01.
TEMPERATURE MEDIATED MULTIPLICATION OF VlBRlO VULNIFICUSIn Shellstock Oysters
David W, Cook
U,S. Food and Drug AdministrationGulf Coast Seafood Laboratory
Dauphin Island, AL 36528-0158
Cook and Ruple J. Food Prot. 52:343-349,1989! reported that naturally occurring ~v~1m multiplied in post-harvest Gulf coast oysters between harvest and arrival at the processingplant and in oysters held at 22 and 30'C. Murphy and Oliver Appl. Environ. Microbiol. 58:2771-2775, 1992! failed to verify the multiplication of ~ ~liQgz in shellstock oysters using atransposon-containing strain of the organism and a direct plating technique. The present researchattempts to resolve the differences in these findings.
V ~gjQ~ was enumerated in oysters immediately a&er harvest and in oysters from thesame lot of shellstock after storage at various temperatures. Enumeration techniques used most-probable-number alkaline peptone broth enrichment combined with isolation on CPC agar andconfirmation with an EIA technique Tamplin et al., Appl, Environ. Microbiol. 57: 1235-1240, 1991!.At 10'C, no multiplication of ~ ~jfjggg was observed. However, at temperatures above 13'C, ~~ls~ifi m multiplication was confirmed and found to be temperature dependent. ~ ~~fi~numbers increased by 1 to 2 log units in shellstock oysters held at summer ambient air temperaturesfor 12 h.

423
IMPROVED ENRICHMENT BROTH FOR RECOVERY OF VIBRIO VULVIFICUS
W.Y. Hsu, C.I. Wei, R.L. Murphree and M.L. TamplinDept. of Home Economics and Food Science and Human Nutrition
University of FloridaGainesville, FL 32611
Optimum bacteriological media are needed to detect V. vulnificus in shellfish products, Plateculture, monoclonal antibody. and DNA probes, as well as polymerase chain reactions, all requireenrichment broths to increase V. vulnificus numbers to detectable levels, Currently, alkaline peptone
. water APW!, composed of 1'/0 peptone and 1'/0 NaCl at pH 8.4, is the standard enrichment brothfor V. vulnificus, as well as many other Vibro spp. Although APW can support growth of V.vulnificus, it must be incubated for up to 16 h, delaying results, and many times producing false-negative reactions due to overgrowth bh other bacteria. Consequently, recovery of V. vulnificus canbe enhanced by increasing the selectivity and enrichment properties of broth, thereby elevating V.vulnificus numbers in shorter time intervals. Following a thorough evaluation of various enrichmentbroths under laboratory conditions, selected media were evaluated with field samples of oysterscontaining natural populations of V, vulnificus. Modified APW �'/0 peptone, 1'/0 NaCl, 0,08'/ocellobiose! yielded higher V. vulnificus MPN values within 8 h incubation, compared to standardAPW and modified APW with antibodies. Modified APW containing 2 or 4 U/ml colistinmethanesulfonate slightly inhibited V. vulnificus growth within 8 h, however, V. vulnificus constituteda greater proportion of total bacteria/ml of broth at both 8 and 16 h, compared to standard APW.APW containing colistin also resulted in less overgrowth by endogenous bacteria at 16 h, comparedto standard APW. APW containing colistin also resulted in less overgrowth by endogenous bacteriaat 16 h incubation. A one-year field test is in progress to determine if these new enrichment brothsenhance detection of V. vulnificus using culture, monoclonal antibody and DNA probe methods.
PREPARATION OF MONOCLONAL ANTIBODIES TO SANITOXIN USING
RECOMBIANT PHAGE ANTIBODY SYSTEM
Stephen MayfieldNational Marine Fisheries Service
Gloucester Laboratory
No abstract submitted

424
BIOCHEMICAL, SEROLOGICAL, AND MOLECULAR CH/QVVCTERISTICS OFENVIRONMENTAL AND CLINICAL VIBRIO VULNIFICUS STRAINS
V.V. Gangar', R.L. Murphree', C. Buchrieser', C.W. Kaspar',V. Garrido', J, Simonson', R.J. Siebeling' and M.L. Tamplin'
'Dept. Home Economics, University of Florida, Gainesville, FL 32611'Food Research Institute, Univ, of Wisconsin-Madison, 53706-1187
'Dept. Microbiological, LSU, Baton Rouge, LA 70803
Defining descriminating characteristics of 5/~ ~lni g~ can be important inepidemiological and ecological studies. In the present study, biochemical, serlogical and moleculartechniques were used to compare 41 isolates os. ~~ Rom clinical and environmental sources.Biochemical characteristic were determined using BIOLOG" micowell cluster plates, testingvariations in utilization of 95 different carbon sources, Analysis of interstain homology showed thatisolates could be clusteres at specific similarity coe5cients. Antibodies prepared to nine clinical stainsshowed reactions with clinical isolates, but with none from environmental sources. Restriction-&agment-length-polymorphism of V. vulnificus DNA was measured by ribotyping and pulsed-fieldgel electrophoresis PFGE!, Restriction endonuclease digestion of DNA followed by Southernanalysis using "P-labeled E. coli ribosomal RNA showed that RFLP patterns did not adequatelydiscriminate isolates. In contrast, PFGE RFLP patterns showed that each isolate was unique, Theseresults indicate that varios typing methods may be useful for investigating sources of ~ grgJgifi~iits mode of transmission and virulence.
DETECTION OF CIGUATERA TOXINS IN FINFISH USING CIGUATECT TEST KITS
Douglas ParkHawaii Chemtect International/University of Arizona
No abstract submitted

425
AN INTERMEDIATE MOISTURE PRODUCT FROM MACKERELUSING SALTING, FERMENTATION AND DRYING
Kolli Punna Reddy and T,M,R. SettyUniversity of Agricultural Sciences, Bangalore Currently at Cornell University, Ithaca, NY!
Intermediate moisture products were prepared from mackerel Qgg~lli ~ ~age~! usingsalt curing in 20'lo or saturated brine for 20 hr and fermented with an inoculum level of 10'cells/mLof Pg~iggg~ ggrryi~i and dried in the sun �8-33C! for 23 hr or in an electric oven �0-45C! for14 hr to a minimum desire moisture level of 18'/o. The chemical and microbiological studiescorrelated well with the organoleptical results which indicated a shelf-life of 4 months for salted anddried products and 7 months for fermented products.
RHEOLOGY OF FISH GELS
Tyre C. Lanier and Donald D. HamannFood Science Dept.
North Carolina State UniversityRaleigh, NC
Rheological studies of 6sh protein gelation commonly focus on either development of the gelduring heating isothermal or ramp heating!, or on properties of the finished gel measured at roomtemperature. Torsion gelometry is ideally suited to measuring textural properties of foods gels overa range of temperatures, and was recently applied in our laboratory to measuring textural changes insurimi gels as a function of serving temperature. Interesting trends in this data led us to exploringthe use of such data, auginented by small amplitude oscillatory strain and stress relaxationmeasurements also measured over a range of preliminary results in studying surimi gels by thisapproach, with particular emphasis on the low temperature setting or "surwari" gelling phenomenonof surimi.

426
EFFECT OF EXPOSURE TO LOW PH ON THE SOLUBILITY OFFISH MYOFIBRILLAR PROTEINS IN WATER
Stephen D. Kelleher, Michella A. Ferrante and Herbert O. HultinDept. Food Science, University of Mass./Amherst
Marine Foods Lab, Marine StationGloucester, MA 01930
Ten species of fish were surveyed relative to the solubility of their proteins in water. Theproteins of 6 species were soluble; the initial pH values of these species ranged from 6,5 to 7.3. Theproteins of 4 species had poor solubility and the initial pH of their muscle ranged from 5.9 to 6.5.The question investigated was whether the poor solubility of the latter 4 species was due to a lowinitial pH.
To test this, the pH of cod muscle, a species in which the myofibrilla proteins are soluble inwater, was adjusted to lower pH values and held for 20 min. Some decrease in solubilization wasobserved, but it was not as great as that of the 4 species that had initial low proteins to a value similarto that of species with low initial pH, The effect of low pH treatment could be reversed by re-adjusting the pH to a higher value before washing. Improvement in solubilization of mackerel muscle,a species whose proteins are poorly soluble in water, was obtained by exposing the mackerel muscletissue to a higher pH before washing with water. It appears that the inhibitory effect of a low pH inthe initial stages was more likely related to removal of specific protein s! which limit the solubilityof other proteins rather than to a denaturing effect of low pH,
PHYSICAL PROPERTIES OF ATLANTIC MACKEREL SURIMI
Jin Kim, Stephen D. Kelleher, and Herbert O. HultinMississippi State University
Coastal Reserch and Extension Centerand University of Massachusetts Marine Station
No abstract sumbitted

427
IMPORTANT CONSIDERATIONS IN DEVELOPMENT OF VALUE-ADDED
FISH MINCE-BASED PRODUCTS
Chong M. LeeUniversity of Rhode Island
Fish mince is produced from intact or defected fillet, &arne, or HAG, and then converted intowashed mince such as surimi or formed products without washing. Currently, white fish species areprimary source of mince. The focus of the talk is on the mince-based products which are producedfrom fish mince aRer appropriate formulation with a variety of functional ingredients. Importantelementss to be considered are species characteristics source of fish mince!, type and form ofproducts, mincing method, ingredient selection, formulation and preparation methods, texture andflavor modification, batter and breading, and forming method. Successful product developmentrequires identification of marketable product, proper selection of ingredients, favor andbatter/breading with correct formulation, Optimization of flavor, texture and physical stability thermal and freeze-thaw stability! will also be discussed.
PACIFIC WHITING PRODUCT DEVELOPMENT
Michael T. MorrisseyOregon State University
Astoria, OR
No abstract submitted
THE EFFECTS OF FROZEN STORAGE TEMPERATURE ON THE HIGHQUALITY SHELFLIFE OF SELECTED SEAFOODS
Robert J, Learson and Kurt A. Wilhelm
National Marine Fisheries Service
Gloucester, MS
Results of studies on the frozen storage shelflife of pristine quality products held at 18 C,-23 C, and -29 C are presented. Cod fillet blocks, whole glazed sockeye salmon, glazed headlesswhite shrimp, and Alaska pollock surimi were removed every 5 weeks fi om each storage temperature,and assessed for quality by sensory and phyiscal/chemical methods in comparison to a control sampleheld at -62 C. Sensoric testing remains the most reliable and discriminating tool for qualityassessment. For au products, there were substantial gains in keeping quality when temperatures weremaintained at or below -23 C. Packaging practices are also discussed as they pertain to enhancedproduct quality over frozen storage.

USE OF ELECTRICAL STIMULATION TO CONTROL SEAFOOD QUALITY
J.R. Botta' and J.W. Kiceniuk'
'Inspection Branch ' Science Branch!Canadian Department of Fisheries and Oceans
PO Box 5667, St. John' s, NF, Canada, A1C 5X1
The need of an inexpensibe, portable, rapid, but reliable and nondestructive method ofdetermining the hveliness of shellfish, prior to it being processed, has existed for many years. Sucha method, based upon electrical stimulation, has been developed. In addition to being a very reliablemethod of determining if crab, lobster, and mussels are alive it has other useful applications. Use ofsuch a method allows crab, lobster and mussels to be processed long after each would have to bediscarded, when evaluated using traditional methods. Since the development of the protype, animproved mode1 has become available, commercially.
HANDLING FRESH TUNA IN DISTRIBUTION
Mary LosikoffProgram and Enforcement Branch
FDA, Office of Seafood200 C Street, SW
Washington, DC 20204
FDA's Office of Seafood has completed the preliminary analysis of data from two assignmentsissued in response to the reported histamine illnesses from eating imported fresh tuna in early May,1992, The purpose of the first assignment was to evaluate imported fresh tuna and mahimahi fortemperature abuse, histamine, organoleptic decomposition analysis. The second assignment evaluatedthe handling of fresh scombrotoxigenic fish in domestic distribution channels.
During the Import Assignment, 49% of the 1,118 fish tested for temperature were alsoanalyzed for histamine and decomposition. Of the fish subjected to analysis, 4.8% showed evidenceof decomposition and 2% exceeded 5 mg histamine/100g. Three precent of the fish tested on entryto the U,S. for temperature were 45 F or higher, None of these fish thatwere analyzed were positivefor histamine however, two showed evidence of decomposition. From this data it appears that thetemperature of the fish upon receipt cannot be the solel indicator of potentially violative product.
The results of the Domestic Assignment show that the cumulative time to deplete product atthe supplier, wholesale and retail levels of the distribution chain can be as long as 14 days. 38samples were collected from retail operations. Five of these samples showed evidence ofdecomposition and five samples exceeded Smg histamine/100g. Thermometers in refrigerators,display cases and other storage areas need to be calibrated, Sufficient wet ice should be used towithstand tranport temperatures. Product codes and employees training should be utilized,

429
BIOLOGICAL PROCESSING OF SARDINE PLANT WASTEWATER
AND APPLICATION FOR AGRICULTURE
Georgia Wilson and Patricia OliverInstituto Tecnologic y de Estudios Superiores de Monterrey
Apdo, 484, Guaymas, Son. 85400
The most important industry in the zone of Guqymas is the sardine industry, which is also theprincipal contaminant source to the bay. Approximately 80'/o of the weight of sardine processed isconverted into efHuents containing protein and ammonia compounds which are dumped into the bay.Methods for avoiding the dumping of the efHuents of the sardine process have been proposed, likeevaporation or Qoculation of the protein, Both methods have high costs of installation and operation,and the final products have not gotten good acceptance in the market. A new method has beenattempted using enzymes and bacteria to convert the protein and ammonia content of the eftluentsinto nitrates. The final product of such biological process is a naturally enriched water, The resultsshow that this water has a high nitrate content, a pH close to neutral and almost no turbidity, Suchwater has been used for cultivating microalgae, which are widely used in aquaculture. The water hasapplications also in agriculture
FATTY ACID AND PROXIMATE COMPOSITIONS OF WILD AND CULTUREDGULF OF MEXICO STURGEOR, ACIPENSER OXYTMKCHUS DESTOTO1
I,C. Chen, Frank Chapman and Sean O'KeefeFood Science and Human Nutrition
Fisheries and Aquatic Sciences DepartmentUniversity of Florida, Gainesviile, FL 32611
Cultured and wild samples of Gulf of Mexico sturegon +giizn~gr +gQynr~h <+~i! wereobtained. Proximate composition was determined for muscle using of5cial AOAC methods exceptlipid, which was measured using Bligh and Dyer extraction. Fatty acid methyl esters were preparedusing BF~ethanol catalyzed transesterification and were analyzed by GC using a 30m Omegawax250 column. Fatty acids were identified using FAME standards and cod liver oil. They were verifiedusing AgNO,-TLC and GC-MS.
The meat of wild Gulf sturegeon ranged fi om 1.5 to 24.1'/o lipid and 66. 5 to 76.6'/0 moisture,while that of cultured fish wer leaner �.83-5.3'/0 lipid and 77,1-88.2'lo moisture!. Since the culturedfish were younger and exposed to similar rearing conditions, their lipid contents were quite uniform.However, the variations in the lipid contents of wild sturgeon did not affect the fatty acid compositionof the oils. In saturated acids, the average for 16:0 was 26.1/a in wild fish and 18.3'/0 in cultured,whereas 18:0 was 3.1/o less in wild fish �,4 vs. 5.5'/o!. The contents of 18:1~7 and 20:1~6, werefound in cultured fish oils. No significant difference was found in the fatty acid compositions of otherdienes, trienes and tetraenes, For polyunsaturated fatty acids, 22;6~3 was about 11.4'/0 in culturedfish and half this value in wild fish, The 22:4~6 contents were 4 fo 5 times higher in wild fishcompared to cultured.

430
ANTICMICROBIAL ACTIVITY OF CHITOSAN
G. Trachy, J. Goulet et G. PicardDepartment de Sciences et technologie des AlimentsUniversite Laval, Ste-Foy, P.Q. Canada G1K 7P4
Chitosan is a natural product used in cosmetics, pharmaceuticals, agriculture, food and wastetreatment, It is a deacetylated derivative of chitin which is found in many crustacean shells. Themolecular structure of chitosan is similar to cellulose where an hydroxy group is substituted by anamino acetyl group.
There are various kinds and grades of chitosan commercially available. These are mainlyrelated to the type of raw materials and the specific process used to extract the chitin, and finally tothe varying degree of deacetylation. Our approach to characterize these chitosans is to evaluate theirantimicrobial activity and some chemical properties. This report related to the microbiologicalcharacteristics.
The minimum inhibition concentration ~C! has been tested with Pseudomonas aeruginosaand Aspergillus niger on one type of chitosan, Two microbiological culture media were tested: abroth and a agar. The MIC for A. niger in the liquid medium was not found because no differenceswere observed between the control and the concentrations of chitosan tested. Wit P. aeruginosa a95 /o inhibition was observed after fifteen minutes between the control and the tested concentrationsbut there was no evidence of significant differences between any of the concentrations tested.
In the solid medium, the MIC test of chitosan against P, aeruginosa between 0.25'/o and 0.5/o.With 0.25'/o of chitosan 36.7 organisms were inhibited. However, 99.9'/o were inhibited with 0. 5'/oof chitosan. The results obtained indicated that this microbiological test will be a useful tool tocharacterize different types of chitosan,
SENSORY ANALYSIS APPLICATIONS TO HARMONIZE EXPERTASSESSORS OF FISH PRODUCTS
Roberta K, York
Canadian Department of Fisheriesand
Terriann I. ReillyNational Marine Fisheries Service
Technical Services Unit
1 Blackburn Dr., Gloucester, MA 01930
No abstract submitted

431
DEVELOPMENT OF OFF-FLAVOR IN HYBRID STRIPED BASS GROWNIN RECIRCULATING AQUACULTI JRE SYSTEMS
George Flick, Jr.,', Gail Marshall', Joe Boling', Janet Webster'and George Libey'
'Food Science and Technology Department, Virigina Tech'Brown For man Beverage Company
'Fisheries and Wildlife Sciences Department, Virginia Tech
Hybrid striped bass ~Mrs; >~chili x ~~; Q~~! were grown under commercialconditions in two di6erent recirculating aquaculture systems. The system 1 configuration consistedof 42 concrete tanks containing 65,000 gallons of water each with its separate rotating biologicalfilter. The system 2 configuration consisted of three concrete tanks in series with a common watersource and one biological tower, The fish were grown to market size �.5 approximate average size!within 18 months, Fish &om both systems were found to contain a musty unacceptable flavor whensubjected to sensory evaluation. Analysis by gas liquid gas chromatography GLC!, withconfirmation by mass spectroscopy, confirmed the presence of 2-methylisoborneol. Microbiologicalanalysis of scrapings from the two filter matrices revealed the presence of Actinomyces spp. Adepuration process was able to remove the 2-methylisoborneol in the fish tissue within one-weekperiod when evaluated by sensory analysis with GLC confirmation.
MODELLED INTERACTIONS WITH FISH MUSCLE
Joe RegensteinCornell University
No abstract submitted.
USE OF GRAS COMPOUNDS TO ELIMINATE VIBRIO VULMFICUS FROM OYSTERS
James D. Oliver
University of North Carolina - Charlotte
No abstract submitted
PILOT PLANT PRODUCTION OF MACKEREL SURIIVH
Herbert O. Hultin
University of Massachusetts Marine Station
No abstract submitted