Advances in Cardiovascular Fluid Mechanics: Bench to Bedside
25
INTERDISCIPLINARY TRANSPORT PHENOMENA Advances in Cardiovascular Fluid Mechanics: Bench to Bedside Lakshmi P. Dasi, Philippe Sucosky, Diane de Zelicourt, Kartik Sundareswaran, Jorge Jimenez, and Ajit P. Yoganathan Wallace H. Coulter School of Biomedical Engineering, Georgia Institute of Technology, Atlanta, Georgia, USA This paper presents recent advances in cardiovascular fluid mechanics that define the current state of the art. These studies include complex multimodal investigations with advanced measurement and simulation techniques. We first discuss the complex flows within the total cavopulmonary connection in Fontan patients. We emphasize the quan- tification of energy losses by studying the importance of caval offsets as well as the differences among various Fontan surgical protocols. In our studies of the fluid me- chanics of prosthetic heart valves, we reveal for the first time the full three-dimensional complexity of flow fields in the vicinity of bileaflet and trileaflet valves and the micro- scopic hinge flow dynamics. We also present results of these valves functioning in a patient-specific native aorta geometry. Our in vitro mitral valve studies show the com- plex mechanism of the native mitral valve apparatus. We demonstrate that the different components of the mitral valve have independent and synergistically complex functions that allow the valve to operate efficiently. We also show how valve mechanics change under pathological and repair conditions associated with enlarged ventricles. Finally, our ex vivo studies on the interactions between the aortic valve and its surrounding hemodynamic environment are aimed at providing insights into normal valve function and valve pathology. We describe the development of organ- and tissue-culture systems and the biological response of the tissue subjected to their respective simulated me- chanical environment. The studies noted above have enhanced our understanding of the complex fluid mechanics associated with the cardiovascular system and have led to new translational technologies. Key words: heart valve; mitral valve; aortic valve; mechanical valve; hemody- namics; Fontan; mechanobiology; particle image velocimetry; computational fluid dynamics Introduction Cardiovascular fluid mechanics is a rich area of fluid mechanics that deals with one of the most complex classes of flows nature has to offer. The complexity is a direct result of the highly nonlinear nature of fluid flow at mod- erate Reynolds numbers, the non-Newtonian Address for correspondence: Ajit P. Yoganathan, Wallace H. Coulter Department of Biomedical Engineering, Georgia Institute of Technol- ogy – U. A. Whitaker Building, 313 Ferst Drive, Room 2119, Atlanta, GA 30332-0535. Voice: +(404) 894-2849; fax: +(404) 894-4243. [email protected] nature of blood flow, the complex geometry of blood vessels and the heart, and the pulsating pressure force induced by the heart muscle that drives the flow. Blood flow is in general pulsatile or phasic in nature with strong fluid–structure interaction (FSI) related to ventricular, valve, or vessel wall motion. The Reynolds number of blood flow in the great vessels and heart is mod- est, ranging from about 600 to 6000, indicating a rich mixture of flow complexity from nonlin- ear flow instabilities that govern the small-scale structure of blood cell transport phenomena. Fluid properties are approximately Newtonian over length scales greater than or equal to about Interdisciplinary Transport Phenomena: Ann. N.Y. Acad. Sci. 1161: 1–25 (2009). doi: 10.1111/j.1749-6632.2008.04320.x C 2009 New York Academy of Sciences. 1
-
Upload
uniatlantico -
Category
Documents
-
view
2 -
download
0
Transcript of Advances in Cardiovascular Fluid Mechanics: Bench to Bedside

INTERDISCIPLINARY TRANSPORT PHENOMENA
Advances in Cardiovascular Fluid Mechanics:Bench to Bedside
Lakshmi P. Dasi, Philippe Sucosky, Diane de Zelicourt,Kartik Sundareswaran, Jorge Jimenez, and Ajit P. Yoganathan
Wallace H. Coulter School of Biomedical Engineering, Georgia Institute of Technology,Atlanta, Georgia, USA
This paper presents recent advances in cardiovascular fluid mechanics that define thecurrent state of the art. These studies include complex multimodal investigations withadvanced measurement and simulation techniques. We first discuss the complex flowswithin the total cavopulmonary connection in Fontan patients. We emphasize the quan-tification of energy losses by studying the importance of caval offsets as well as thedifferences among various Fontan surgical protocols. In our studies of the fluid me-chanics of prosthetic heart valves, we reveal for the first time the full three-dimensionalcomplexity of flow fields in the vicinity of bileaflet and trileaflet valves and the micro-scopic hinge flow dynamics. We also present results of these valves functioning in apatient-specific native aorta geometry. Our in vitro mitral valve studies show the com-plex mechanism of the native mitral valve apparatus. We demonstrate that the differentcomponents of the mitral valve have independent and synergistically complex functionsthat allow the valve to operate efficiently. We also show how valve mechanics changeunder pathological and repair conditions associated with enlarged ventricles. Finally,our ex vivo studies on the interactions between the aortic valve and its surroundinghemodynamic environment are aimed at providing insights into normal valve functionand valve pathology. We describe the development of organ- and tissue-culture systemsand the biological response of the tissue subjected to their respective simulated me-chanical environment. The studies noted above have enhanced our understanding ofthe complex fluid mechanics associated with the cardiovascular system and have led tonew translational technologies.
Key words: heart valve; mitral valve; aortic valve; mechanical valve; hemody-namics; Fontan; mechanobiology; particle image velocimetry; computational fluiddynamics
Introduction
Cardiovascular fluid mechanics is a rich areaof fluid mechanics that deals with one of themost complex classes of flows nature has tooffer. The complexity is a direct result of thehighly nonlinear nature of fluid flow at mod-erate Reynolds numbers, the non-Newtonian
Address for correspondence: Ajit P. Yoganathan, Wallace H. CoulterDepartment of Biomedical Engineering, Georgia Institute of Technol-ogy – U. A. Whitaker Building, 313 Ferst Drive, Room 2119, Atlanta,GA 30332-0535. Voice: +(404) 894-2849; fax: +(404) [email protected]
nature of blood flow, the complex geometry ofblood vessels and the heart, and the pulsatingpressure force induced by the heart muscle thatdrives the flow. Blood flow is in general pulsatileor phasic in nature with strong fluid–structureinteraction (FSI) related to ventricular, valve,or vessel wall motion. The Reynolds number ofblood flow in the great vessels and heart is mod-est, ranging from about 600 to 6000, indicatinga rich mixture of flow complexity from nonlin-ear flow instabilities that govern the small-scalestructure of blood cell transport phenomena.Fluid properties are approximately Newtonianover length scales greater than or equal to about
Interdisciplinary Transport Phenomena: Ann. N.Y. Acad. Sci. 1161: 1–25 (2009).doi: 10.1111/j.1749-6632.2008.04320.x C© 2009 New York Academy of Sciences.
1

2 Annals of the New York Academy of Sciences
100 μm. In this paper, we present a cross sec-tion of years of research work in cardiovascu-lar fluid mechanics, focused in particular on:(1) in vitro and in vivo vascular hemodynamicsrelated to Fontan patients; (2) in vitro fluid me-chanics of prosthetic heart valves; (3) in vitro
fluid mechanics of the mitral valve; and (4)ex vivo correlation studies between aortic valvebiology and the surrounding fluid mechani-cal environment. In must be noted that ineach of these areas of cardiovascular fluid me-chanics, there exists an underlying clinical hy-pothesis that links these complex fluid flowproblems to human biology in general andpathophysiology. For instance, the problem re-lated to Fontan hemodynamics is essentiallya fluid flow design problem, where hydrody-namic energy losses in surgically created vesselanastomoses significantly impact patient qual-ity of life and life span. For the prosthetic heartvalve area, the complex fluid mechanics gov-erns the mechanical environment that bloodelements experience and thus determines theultimate clinical success/failure of these valves.For the case of native mitral valve, there is a del-icate interplay among ventricular blood flow,mitral valve structure, and the ventricle mo-tion, which is necessary for the heart to performits function flawlessly over a human life span.Even a slight imbalance can lead to chronicdiseases that necessitate surgical intervention.As a final example, it is hypothesized that thebiological activity in the aortic valve is in “har-mony” with the ambient fluid and structuralstresses. Many diseases, including aortic valvesclerosis, occur as a result of years of abnormalfluid and structural mechanics. The fundamen-tal understanding of how the aortic valve biol-ogy is in equilibrium with the fluid mechanicsmay provide valuable knowledge necessary toadvance the field of tissue engineering of heartvalves.
This paper is organized into four sectionseach highlighting important methods, results,and discussions of the four areas describedabove.
Figure 1. (A) Intra-atrial and (B) extracardiac totalcavopulmonary connections.
Fontan Hemodynamics
Background
Single-ventricle congenital heart defects af-flict two in every 1000 live births. These defectsare characterized by mixing of the oxygenatedblood from the systemic circulation and thedeoxygenated blood from the pulmonary cir-culation, leading to acute cyanosis. “Fontan re-pairs,” the current surgical procedure of choice,are performed in three stages with the anasto-mosis of the superior (SVC) and inferior (IVC)vena cava onto the left (LPA) and right (RPA)pulmonary arteries (PAs) in the second andthird stage, respectively. The resultant vascu-lar anatomy, called the total cavopulmonaryconnection (TCPC) (see Fig. 1), establishes acomplete bypass of the right side of the heart,thus restoring the vital separation between pul-monary and systemic circuits. Unfortunately,these repairs are palliative and not curative.Survivors often require a lifetime of intensivemedical attention. Clinicians report that over50% of their time is devoted to the 20% fractionof their patients with this complex cardiovascu-lar physiology. Owing to the absence of the rightventricular pump, Fontan patients are reportedas having higher pressures than normal in thesystemic return to provide the pressure headnecessary to drive the flow through the pul-monary circuit and back to the left side of theheart. This pressure buildup may be a possible

Dasi et al.: Advances in Cardiovascular Fluid Mechanics 3
explanation for the complications typically ob-served in these patients, including congestiveheart failure, liver dysfunction, protein losingenteropathy, limited exercise capacity, systemicvenous hypertension, hepatic and pulmonarycongestion, and valvular and myocardial dys-function. Among the parameters that come intoplay, one over which the surgeons have somecontrol is the design of the surgically createdconnection. Significant work has been done inunderstanding the fluid dynamics of the TCPC,underscoring the tight relationship between de-sign and associated pressure drops and energydissipation. However, to date no work has beendone toward systematic surgical planning of theTCPC—trying to optimize its design for everysingle patient—in an effort to reduce pressurelosses and improve the long-term outcome.
A large anatomical database of patient-specific TCPC anatomies was compiled inour laboratory. Through a global analysis ofthe main geometrical parameters and detailedanalysis of selected TCPC geometries,1–4 sev-eral parameters have been identified that canbe used toward the optimization, such as theoffsets between the SVC and the IVC,3,5 thesize of the IVC baffle,2 possible repairs of LPAstenosis,2 and the type of connection from theIVC to the PAs (extracardiac or intra-atrial).6
Based on this information, we established asurgical planning methodology that allows thesurgeons to envision different surgical scenar-ios for the third and final stage of the TCPCprocedure and assess their hemodynamicperformances.
The main steps of our approach are asfollows: (i) reconstruct pre-Fontan cardiacanatomies from magnetic resonance images(MRIs) using an in-house segmentation and re-construction scheme, (ii) ask several pediatriccardiac surgeons from three different institu-tions in the United States to ‘virtually’ connectthe IVC to the PAs, and (iii) perform a detailedflow analysis on each of the different options soas to assess and compare their hemodynamic ef-ficiency. However, before we draw any clinicallyrelevant conclusions from such an approach,
each of the techniques and concepts involvedshould be thoroughly and carefully validated.Accordingly, this section proceeds in two steps.First, we review the experimental and compu-tational fluid dynamic (CFD) methodologies,underscoring the need for proper validationmethods. Then, we present the details of thedeveloped surgical methodology by illustratingit on a patient with known pre- and post-Fontananatomies.
Experimental and ComputationalMethodologies
Over the past decades, CFDs has proved anattractive option for modeling complex biolog-ical phenomena, allowing for any desired levelof temporal and/or spatial accuracy. Moreover,in the context of surgical planning or design op-timization, another major advantage of CFDover experimental fluid dynamics is its potentialto be automated and systematically investigatethe impact of small design variations. How-ever, before a CFD tool is applied to a clinicalsetting, its strength and limitations should care-fully be assessed on test cases of relevant com-plexity. Indeed, the fact that a CFD solverproperly captures average flow features in asimple geometry does not ensure that thesame tool will be able to reproduce the dy-namic flow structures observed in complexpatient-specific anatomies. The methodologypresented in this section and summarized inFigure 2 offers an efficient framework allowingfor parallel experimental and CFD studies in re-alistic TCPC geometries under well-controlledconditions.
Anatomical Reconstruction and ModelGeneration
Some 200 Fontan patients were recruited aspart of the study, after either the second or thethird stage of the surgery. For each one of thesepatients, axial cardiac MRIs were acquiredspanning the entire TCPC connection and thesecond- or third-stage Fontan anatomy was seg-mented and reconstructed using our in-house

4 Annals of the New York Academy of Sciences
Figure 2. Overview of the experimental and numerical methodology. (In color in Annalsonline.)
bouncing-ball segmentation algorithm.7,8 Thereconstructed anatomy could then be usedto generate either a computational mesh ora physical model using rapid prototyping toreproduce all the complexities of the in vivo
anatomy. In addition, phase contrast MRIswere acquired in the PAs and venae cavae, pro-viding both inflow and outflow conditions foreither experimental or CFD studies.
Experimental Methods
In vitro experiments were conducted to vali-date numerical simulations, as well as to pro-vide insights into the TCPC hemodynamics.The experimental protocol included the sys-tematic acquisition of: (1) pressure measure-ments at each inlet and outlet for the subse-quent power loss computations, which providea quantitative metric for the overall efficiencyof a given connection design; (2) high-speedflow visualization for a qualitative assessmentof the dynamic flow structures; and (3) particleimage velocimetry (PIV) for a time-averagedbut quantitative assessment of the flow field. Inorder to allow for an accurate comparison ofthe experimental PIV results with their numer-
ical counterparts, a semiautomated registrationmethod was developed that performs a rigidbody transformation and maps the two modal-ities on top of one another. This approach al-lows for a point-by-point comparison of exper-imental and CFD results throughout the fluidvolume and removes any of the user bias usuallyfound in manual registration.
CFD Validation
CFD simulations were carried out usingthree different tools: the commercially availableFIDAP and Fluent CFD packages (Fluent Inc.,Lebanon, NH) and an in-house code. FIDAPprovided sufficient accuracy to capture globaltime-averaged parameters, such as power lossesand time-averaged flow fields. However, de-spite steady and laminar inflows, the first in
vitro experiment in a patient specific model(Fig. 3A–C) revealed complex flow features in-volving flow instabilities and transitions fromlaminar to turbulent regimes.2,9 Comparison ofFIDAP results with experimental data showedthat the model failed to capture the flowunsteadiness with practical temporal and spa-tial resolution.4 This observation led to the

Dasi et al.: Advances in Cardiovascular Fluid Mechanics 5
Figure 3. Experimental and CFD analysis of an intra-atrial TCPC: (A–C): flow visualiza-tion, highlighting the flow instabilities within the baffle. The dye was injected at the samelocation for all three snapshots. (D) PIV versus (E) CFD (in-house code) average in-plane ve-locity field. (F) Time-series of the in-house code generation (red) and PIV (green). (In color inAnnals online.)
development of advanced CFD tools as flowunsteadiness has to be factored into power losscalculations.
Surgical Methodology
Anatomical Reconstruction and Model Generation:A stack of axial MRI slices was acquired froma patient who had undergone the second-stagebidirectional Glenn procedure and was sched-uled for the third-stage Fontan operation. Theanatomy of the bidirectional Glenn connec-tion was segmented and reconstructed usingour in-house bouncing-ball segmentation al-gorithm.7,8 As it does not depict anatomicalconstraints that a surgeon experiences in theoperating room, segmenting only the second-stage anatomy by itself is insufficient for surgi-cal planning purposes. Thus, surrounding car-diovascular structures were segmented as well,including the heart, pulmonary veins, aorta,and IVC stump, which serve as landmarks forthe surgeon to connect the artificial conduit.All the structures were segmented individuallyand merged using Raindrop Geomagic Studio(Triangle Park, NC) to obtain a representa-
Figure 4. Anatomical reconstruction of: (A) astand alone pre-Fontan; and (B) with all the surround-ing cardiac structures included. (In color in Annalsonline.)
tion of the single-ventricle anatomy (Fig. 4).This combined reconstruction was then usedas an input to an anatomy modifying tool,10,11
which was used to identify the best spatial ar-rangement of the IVC conduit given the car-diac anatomy of the patient. The post-Fontananatomy (Fig. 5) was segmented as well, so as toprovide a ground for comparison for the virtualsurgical design.
Surgical Planning and Free-Form Anatomy De-
formation: We previously developed a surgical

6 Annals of the New York Academy of Sciences
Figure 5. The actual post-Fontan geometry of thepatient based on postoperative MRI (from two views).(In color in Annals online.)
planning environment called SURGEM,12
which provides intuitive operations to edit com-plex vascular anatomies as needed for our sur-gical planning purposes. The real-time shapeediting capabilities of SURGEM are basedon a mathematical model of free-form de-formations (FFD) that are weighted averagesof pose-interpolating screw motions,13,14 origi-nally developed for editing motions that inter-polate user-specified position and orientationconstraints. This in-house mathematical tool isintegrated with a new human-shape interac-tion methodology that uses two commerciallyavailable six-degrees-of-freedom haptic devicesto control the parameters of the FFD by sim-ple and natural gestures of both hands. As aresult, SURGEM supports the intuitive manip-ulation of shape with both hands through nat-ural gestures that grab, move, bend, and twistthe desired portion of the shape.
The complete cardiovascular anatomical re-construction of the single-ventricle anatomywas imported into the tool. A pediatric car-diac surgeon was blinded to the actual post-operative anatomy and asked to connect theIVC from the stump included in the segmen-tation to the PAs given the anatomical spaceconstraints (Fig. 6A,B). The heart, the pul-monary veins, and the aorta were then sub-tracted from the anatomy and only the sim-ulated TCPC was retained (Fig. 6C). Theartificial TCPC conduit was then stitched tothe LPA and RPA using Raindrop Geomagic
Figure 6. The process of surgical planning: (A)and (B) two different views of the artificial con-duit connected to the pre-Fontan geometry usingthe anatomical constraints; (C) the heart, pulmonaryveins, and the aorta, subtracted out of the reconstruc-tion; and (D) the stitched anatomical model ready forCFD. (In color in Annals online.)
(Fig. 6D), and this geometry was used for per-forming the CFD simulations in order to com-pare the hemodynamics of the simulated sur-gical planning model with the actual Fontanmodel.
Computational Fluid Dynamics
The virtually generated anatomical lumensurfaces and the actual post-Fontan anatomi-cal lumen surfaces were exported to GAMBITfor mesh generation. Mesh independence wasachieved at around 600,000 four-node tetrahe-dral elements. Grid verification runs had beendone previously for similar anatomies in earlierstudies.2,4 For both models, steady-state flowfields were computed using the parallelized seg-regated finite-element CFD solver FIDAP.
The pressure projection algorithm usedwith both the standard first-order and thestreamwise upwinding scheme demonstratedgood agreement with in vitro experimental re-sults in our earlier studies with more com-plex anatomical models. In order to prescribe

Dasi et al.: Advances in Cardiovascular Fluid Mechanics 7
Figure 7. Stream traces of the flow fields ob-tained from the CFD results of the pre-Fontan model:(A) vector fields along a plane of the model; and (B)streamlines color coded by velocity magnitude. (Incolor in Annals online.)
in vivo flow rates in the CFD simulations, phasecontrast MRI data were acquired concurrentlywith the stack of images used for the anatom-ical reconstruction. Accordingly, the preoper-ative anatomy was run using mean preoper-ative in vivo flow rates of 0.7, 0.28, and 0.42L/min at the SVC, LPA, and RPA, respectively,while both the actual and the virtual postoper-ative anatomies were run using mean in vivo
postoperative flow rates of 1.05, 0.79, 0.86,0.73 L/min at the IVC, SVC, LPA, and RPA,respectively.
Results
Figure 4 shows the reconstructions ofthe original bidirectional Glenn (pre-Fontan)model as well as the surrounding anatomi-cal structures that were used as anatomicallandmarks the surgical planning. Figure 5 il-lustrates the three-dimensional anatomical re-construction of the actual postoperative TCPCanatomy. Figure 6 pictures a step-by-stepdemonstration of the artificial baffle being con-nected to the bidirectional Glenn.
Figures 7 and 8 show sample results from theCFD simulations that were conducted in thepre- and postoperative anatomies. The powerlosses were of 0.58 mW for the actual post-Fontan anatomy and 1.36 mW for the virtuallydesigned one.
The total flow rate through the connectionwas of 0.73 L/min preoperatively and 1.84L/min postoperatively, the increase being duemainly to the IVC flow being brought into theconnection. The actual postoperative TCPC is
Figure 8. CFD results depicting a comparison offlow fields between: (A, B) the TCPC obtained usingthe presented surgical planning methodology; and(C, D) the actual post-Fontan anatomy. As can beseen, there are differences in the flow fields betweenthe modified TCPC and the actual TCPC. The streamtraces on the left are color coded according to the ves-sel from which they were released: red correspondsto the IVC and blue corresponds to the SVC. Thestream traces on the right are color coded accordingto the velocity magnitude. (In color in Annals online.)
an extracardiac baffle with a mean IVC diame-ter of 1.73 cm and hardly any IVC-SVC offset.On the other hand, the surgeon who performedthe virtual surgery created an extracardiac con-nection using a baffle 1.4 cm in diameter andslightly offset the IVC baffle toward the RPA.Both anatomies display helical flow patterns inthe PAs and fairly streamlined flow in the SVC.What was rather unusual was that the in vivo
flow data for that patient revealed a pulmonaryflow ratio of 56/44 LPA/RPA that favored leftlung perfusion. Owing to the IVC-SVC offset,the IVC flow of the virtual anatomy impingedon the superior RPA wall before being redis-tributed to both lungs, whereas the SVC flowwent only to the RPA. In the actual post-Fontananatomy, SVC and IVC streams collided headon, mixed, and were then redistributed to bothlungs.

8 Annals of the New York Academy of Sciences
Discussion
In his virtual design, the surgeon chose toinclude an offset, which had previously beenshown to be beneficial in terms of power losses.3
This, however, is not the case here and the en-ergy losses computed in the virtual extracardiacanatomy (1.36 mW) were in fact higher thanthose computed for the actual postoperativeanatomy (0.58 mW). The primary reason forthis increased energy dissipation is the smaller-sized baffle used in the virtual design comparedto the actual one.
Energy losses in the virtual design could havebeen lowered further by increasing the bafflesize. However, it has also been shown that im-portant mismatches between the baffle size andthe diameters of the connecting vessels yieldeddetrimental flow features, such as regions offlow stagnation or recirculations.
For a proper surgical-planning scenario, thesurgeon should have tested several baffle sizesand used the results of the corresponding CFDsimulations to decide which one was optimal,as there is a trade-off between reduced powerlosses and increased adverse flow features. Inaddition, it has been previously shown thatsmall differences under resting conditions mayactually have a large impact in exercise situ-ations when increased cardiac output wouldresult in increased energy losses.
Conclusion and Future Work
A novel surgical planning methodology ap-plicable for children born with congenital heartdefects is presented. This methodology allowsthe surgeon to envision different surgical sce-narios and test their hemodynamic efficiency.If implemented clinically, this tool would be theperfect platform for surgeons to test implemen-tation techniques they are not familiar with, oreven visualize procedures envisioned by oth-ers. Work is currently under way for studyingthe effects of conduit size, angle, and curva-ture in addition to semiautomatic optimiza-tion strategies that could provide the most ef-
ficient surgical connection prior to the surgeryitself.
Fluid Mechanics of BileafletMechanical Valves
Background
Prosthetic heart valves have been in use forover four decades to replace diseased heartvalves. However, present-day designs are farfrom ideal and significant complications, suchas hemolysis, platelet destruction, and throm-boembolism, often arise after their implanta-tion, requiring aggressive lifelong anticoagu-lation therapy, which in turn carries seriousside effects. It is well established that the rootcause of these pathological conditions is theexposure of blood elements to nonphysiologi-cal hemodynamic stresses induced by the com-plex turbulent flow fields in the vicinity of theseprostheses. Improving current prosthetic heartvalve designs, however, needs highly accurateflow quantification—a task until recently notachievable owing to the complex and intricategeometries of heart valve prostheses combinedwith the lack of an appropriate computationalmethodology to tackle the complexities of heartvalve flows. In this regard, we have successfullydeveloped novel CFD tools and conducted nu-merous experimental studies, which yielded thefirst ever in-depth understanding of the com-plex physics of prosthetic heart valve flows un-der physiological conditions at hemodynami-cally relevant scales.15
Methods
To address the complexities of prostheticheart valve flows under physiological condi-tions we: (1) developed algorithms for simulat-ing flows in arbitrarily complex domains withcomplex moving immersed boundaries; (2) im-plemented efficient iterative methods to solvethe governing equations on fine computationalmeshes; and (3) developed highly resolved PIVexperiments to probe the flow physics and

Dasi et al.: Advances in Cardiovascular Fluid Mechanics 9
Figure 9. Comparisons of out-of-plane vorticity contours between instantaneous flow field from PIV (left)and from DNS (center) and phased-averaged flow field from PIV (right) throughout a cardiac cycle. (In colorin Annals online.)
validation of the computational scheme. Detailsof the computational and experimental meth-ods can be found in the literature.15–21
Results
A major novelty of our work is the tight inte-gration of numerical simulations and in vitro ex-periments. In what follows, we report detailedvalidation of the CFD model by comparingcomputed results with the laboratory measure-ments. All of the following results were obtainedfrom a 23-mm St. Jude Medical (SJM; St. JudeMedical, Inc., St. Paul, MN) regent bileafletmechanical heart valve (BMHV) implanted ina straight aorta chamber with simplified sinusshape, whose geometry can be found in the lit-erature.16 Later in this section, we present morerecent results of BMHV simulation in realisticaorta geometry.
Pulsatile FSI Results
Pulsatile phase-locked PIV experiments15
were conducted to measure the velocity fieldalong the center plane and offset planes withrespect to the valve. Leaflet positions were alsocaptured during the cardiac cycle using a sec-
ond camera. Initially, both the measured flowand leaflet kinematics were used as bound-ary conditions in the simulations.15 The resultsobtained from both our numerical simulationand experimental measurements are shown inFigure 9. The overall conclusion that emergesfrom a first glance at Figure 9 is that the CFDmodel captures essentially all the experimentaltrends with good accuracy, both qualitativelyand quantitatively. A detailed discussion of theflow physics has already been published.15 Themain highlight of the BMHV flow physics re-vealed by analyzing these vorticity dynamics(Fig. 9) is that the flow during the accelerationphase is governed by large-scale coherent struc-tures (vortex rings, hairpin vortices, von Kar-man shedding, etc.) that are inherently three-dimensional and with minimal cycle-to-cyclevariations. From peak flow to end diastole, how-ever, the coherent structures break down intoa chaotic turbulent state with patterns unre-peatable from cycle to cycle. The CFD resultscaptured all the features of the flow physics in-cluding the exact time at which correspondingcoherent structures form and break down.
In Figure 10 we also compare the measuredand calculated instantaneous viscous shear

10 Annals of the New York Academy of Sciences
Figure 10. Comparisons of instantaneous viscousshear stress. (In color in Annals online.)
stress field calculated as τxy = μ(∂u/∂y +∂v /∂x ), where μ is the dynamic viscosity, x andy represent the streamwise and spanwise direc-tions, respectively, and u and v are the corre-sponding velocity components. The use of thisequation implies the approximation of blood asa Newtonian fluid, that is, a valid assumptionat length scales greater than or equal to about100 μm. Shear stress measurements are obvi-ously of great hemodynamical importance ashigh shear stress magnitude could deform thered blood cell (RBC) from its normal biconcaveshape to an ellipsoidal shape. When the shear-induced mechanical load exceeds the RBCmembrane’s mechanical strength, the mem-brane breaks and the cell is damaged.22 Aswas the case for the vorticity field, our calcula-tions reproduce the instantaneous experimen-tal trends with remarkable accuracy consider-ing the complexity of the flow.
Figure 11. FSI simulation of physiological BMHVflow: vortical structures are visualized with theq-criterion at four instants of time in the cardiac cycle.(In color in Annals online.)
Figure 11 shows the vortical structures visu-alized with the isosurfaces of q-criterion at fourdifferent instants of time in the cardiac cycle.During the acceleration phase up to the peaksystole phase, the overall flow field is well orga-nized and laminar, with a number of very largevortical structures induced by the leaflets andthe valve housing. The leading vortical struc-tures separating from the edges of the leaflets

Dasi et al.: Advances in Cardiovascular Fluid Mechanics 11
and stretching downstream are clearly visiblein this phase. During the deceleration phase,the imposed adverse pressure gradient disruptsand disorganizes the flow, leading to the explo-sive emergence of a very complex turbulent-like state. During diastole, the intensity of thesestructures starts to dissipate due to the lack ofnew energy input into the flow region but thesmall-scale richness of the flow remains highuntil nearly the start of the next cycle.
To the best of our knowledge, the resultsshown in Figure 11 constitute the first directnumerical simulation (DNS) of BMHV flowsat such a fine level of resolution. The explo-sive growth of small-scale structures during thedeceleration phase suggests potentially signif-icant hemodynamic implications and justifiesthe need for developing high-resolution CFDtools for prosthetic valve flows. As demon-strated earlier in this section, these computa-tions are in very good agreement with experi-mental measurements.
FSI Simulations and Experiments
The interaction between the blood flow andthe BMHV leaflets is a typical FSI problem: theleaflet movement is driven by the fluid flow andthe motion of these leaflets affects the fluid mo-tion. To simulate such an interaction, we havedeveloped a strongly coupled FSI algorithm,which has been implemented in conjunctionwith the previously described flow solver. Thealgorithm is general and can simulate FSI prob-lems involving an arbitrarily large number ofthree-dimensional solid bodies free to move andinteract with the flow.23
Since the various computational details andresulting flow patterns are the same as thosediscussed above, here we focus only on thecomparisons of the measured and computedleaflet kinematics. The simulated kinematicsof the two leaflets are shown in Figure 12 assolid lines (colors mark different leaflets), whilethe experimentally measured leaflet kinemat-ics is illustrated as open circles. The resultsare plotted in terms of the leaflet position α
defined as the normalized angle: 0 = closed,
Figure 12. Comparison of leaflet kinematicsobtained from FSI CFD (lines) and measurements(circles). (In color in Annals online.)
1 = fully open. As can be seen in the compari-son, the developed FSI solver captures the mo-tion of the two leaflets, including the very rapidopening and closing phases, with remarkableaccuracy.
Experiments and Simulation on theHinge Flow Dynamics
Experiments were also conducted underphysiological pulsatile flow conditions usinglaser Doppler velocimetry (LDV) to obtain highspatial and temporal flow information withinthe hinge region of a SJM valve. Figure 13shows the phase-averaged flow fields measuredduring (A) forward flow and (B) reverse flow inthe hinge region. During the forward phasea recirculation region is observed inside thehinge. In the reverse phase, the maximum ve-locity within the hinge is observed to be ofthe order of 1 m/s. The details of the exper-imental measurements are reported in the lit-erature.21,24,25 In tandem, significant progresstoward the development of a numerical ap-proach for simulating the details of the flow inthe hinge region of BMHV was also achieved.However, owing to the large disparity in spatialscales, the flow through the hinge was simulatedseparately by prescribing the boundary condi-tions imposed from the large-scale simulations.

12 Annals of the New York Academy of Sciences
Figure 13. Phase-averaged hinge velocity measurements using LDV in SJM valve placedin mitral position during: (A) peak forward flow; and (B) reverse flow. (In color in Annalsonline.)
A grid system consisting of 5 million grid nodesis used to study the flow in the vicinity of aleaflet hinge placed in the aortic position, whosegeometry is obtained through microcomputedtomography scan. The motion of the leaflet isspecified from our large-scale FSI simulation.Figure 14 illustrates the flow pattern early inthe systolic phase (forward flow phase) and atmid-diastolic phase (leakage flow phase). As re-vealed in the streamlines visualization, there isflow passing through the gap region in both theforward and backward flow phases. The flowpassing through the gap region is very com-plicated and three dimensional, especially sofor the leakage flow phase, and is strongly af-fected by the flow outside the hinge region. Toour knowledge, these results are the first three-dimensional numerical simulations of the flowthrough a BMHV hinge.
However, our results do reveal the neces-sity of an integrated, multiscale simulation ap-proach, which couples the large-scale geomet-rical and flow features driven by the overallvalve and the local geometrical features of thehinge. Such an approach is currently beingdeveloped.
BMHV in an Anatomical Aorta
To illustrate the potential of our novel nu-merical approach to be used as a patient-specific simulation tool, we have used it to inves-
Figure 14. Calculated instantaneous streamtraces through a BMHV hinge. (In color in Annalsonline.)
tigate the blood flow patterns through a BMHVmounted in an anatomically accurate, albeitrigid, aorta obtained from MRIs. A curvilin-ear grid system consisting of 10 million gridnodes is used to discretize the flow domain.FSI DNS was carried out for a pulsatile in-coming flow waveform, with a Repeak of 4000.Figure 15 visualizes the complexity of the in-stantaneous, coherent vortical structures fillingthe aorta downstream of the leaflets at two rep-resentative instants of the cardiac cycle.

Dasi et al.: Advances in Cardiovascular Fluid Mechanics 13
Figure 15. Simulation of a BMHV in an anatom-ical aorta: vortical structures visualized with the q-criterion. (In color in Annals online.)
Mitral Valve Mechanics
Background
The mitral valve is the most complex andheavily loaded of the four valves in the heart.Its function is characterized by the elaborateinterplay of its different components, which isstill not well understood. Recent publicationsconcerned with mitral valve mechanics havedemonstrated that the geometry of the mitralvalve,26,27 its constituent specific dynamics,28–30
the material properties of its components,31,32
and the living elements of its structure33–36
optimize its function and mechanical config-uration. In brief, normal valvular geometryand dynamics decrease leaflet stress,27 improvechordal force distribution,26 enhance ventricu-lar filling and reduce closing volumes.28 There-fore, alterations to the normal mitral valve willlead to substandard function and unfavorablemechanics.
The overall objective of the research pre-sented here is to better understand nor-mal valve mechanics and function and howalteration—typically due to alteration of theventricular geometry—may affect this functionand dynamics. In vitro experiments were uti-
lized to analyze the variables of interest in-dependently. In vitro experimental capabilitieshave the clear advantage of focusing on and in-dependently controlling parameters that are ofimportance in mitral valve mechanics and func-tion. The in vitro experiments were carried outin the modified Georgia Tech left heart simula-tor (Fig. 16). This system is capable of imposingphysiological and pathological geometric andhemodynamics conditions on the mitral valve.The ventricular chamber of this simulator has atraversing system to control the location of thepapillary muscles (PMs) in three-dimensionalspace. Additionally, force transducers attachedto the PM positioning system allowed for themeasurement of force on the individual PMs.This simulator has been described in detail inprevious studies.26,31,32
Effects of Annular Shape on Mitral ValveFunction and Mechanics
A variable annular-shaped atrial chamberwas constructed to obtain the various annu-lar geometries during these in vitro experiments.The experiments were conducted in annularconfigurations associated with saddle height tocommissural diameter ratios (SR) of 0, 10, 20,and 30%.
During the experiments, the annulus shapewas changed from flat to saddle with the PMsin the normal position and an apical postero-lateral pathological position in order to modelfunctional mitral regurgitation (MR). Cardiacoutput and transmitral pressure were analyzedto determine MR volume. When comparingthe flat and saddle-shaped configurations, therewas no significant (P = 0.17, n = 11) differ-ence in MR volume, 11.2 ± 24.7%. Theseresults suggest that annular shape alone doesnot significantly affect MR caused by PMdisplacement.26
C-ring force transducers37 were placed on sixchordae tendineae (CT) to investigate the rela-tion between annular shape and CT force dis-tribution under physiological and pathologicalconditions. For all valves, the tension on the

14 Annals of the New York Academy of Sciences
Figure 16. Schematic of the modified Georgia Tech physiological left heart simulator.
anterior strut chord was lower in the saddleconfiguration when compared to the flat con-figuration. The average difference of the forceon this chord was 18.5 ± 16.1% (P < 0.02).The average difference in the posterior inter-mediate chord was 22.3 ± 17.1%, with highertensions being present in all the valves for thesaddle configuration (P < 0.03). Measurementsof the commissural chord showed a decrease intension in the saddle configuration for all thevalves. The average variation in force for thischord was 59.0 ± 32.2% (P < 0.01). Althoughall valves showed an increase in tension for theposterior marginal chord in the saddle config-uration, the change was not statistically signifi-cant (P = 0.12). Measurements on basal chordsand anterior marginal chords showed no signif-icant variation in tension between the two dif-ferent annular configurations. When we com-pared the force distribution among the CT, theflat annulus configuration showed a higher vari-ability of tension among the different chordswith a standard deviation of ±0.47 N, as com-pared to the saddle configuration with a stan-dard deviation of ±0.36 N. The results of thisstudy suggest that a saddle-shaped annulus re-distributes the forces on the chords by alter-ing the coaptation geometry, leading to anoptimally balanced anatomical/physiologicalconfiguration.26
Porcine mitral valves were tested in orderto characterize the strain on the central re-
Figure 17. Average major and minor principalstretch for the eight valves studied during the systolicphase of the cardiac cycle. Bars represent one stan-dard deviation. (In color in Annals online.)
gion of the anterior leaflet using the markertechnique.31 The mitral valves were tested withfour different SRs: 0 (flat annulus), 10, 20, and30%. The experiments were carried out underphysiological transmitral pressure (TP = 120 ±2 mmHg) and mitral flow (CO = 5.0 ±0.2 L/min) conditions for all the annular con-figurations. For all these configurations the an-terior leaflet material showed anisotropy withthe major principal stretch in the radial di-rection and the minor principal stretch in thecircumferential direction (Fig. 17). The centralregion of the anterior leaflet was also character-ized by a nonlinear load–strain response. Theloading and unloading curves did not followthe same path, indicating that the material pre-sented hysteresis. This characteristic of the ma-terial response was observed in all of the valvesstudied.
Dasi et al.: Advances in Cardiovascular Fluid Mechanics 15
Figure 18. Average peak areal stretch for thedifferent annular configurations. Paired t-tests wereused for statistical comparisons. Bars represent onestandard deviation.
Averaged values (n = 8) showed that dur-ing valve closure the major principal stretchrate was 21.25 ± 1.95 s−1, whereas the mi-nor principal stretch rate was 19.34 ± 1.5 s−1.Maximum stretch was reached while the valveswere fully loaded. The maximum major princi-pal stretch was 1.22 ± 0.07, whereas the maxi-mum minor principal stretch was 1.11 ± 0.049,demonstrating the highly anisotropic nature ofthe material, with the major principal stretchbeing twice as large as the minor principalstretch. The maximum areal stretch was 1.36 ±0.14, representing the overall maximum defor-mation of the central region of the anteriorleaflet. After the systolic stretch plateau, stretchdecreased rapidly with valve aperture. Duringvalve aperture the major principal stretch ratewas 29.75 ± 2.73 s−1, whereas the minor prin-cipal stretch rate was 27.01 ± 2.10 s−1. Theprogression of stretch was followed until themarkers of interest were no longer visible.
Variations in SR were associated withchanges in the areal stretch of the central re-gion of the anterior leaflet of the mitral valve. Asshown in Figure 18, there were significant re-ductions in areal stretch for the 20 and 30% SRconfigurations when compared to the flat (0%SR) annulus configuration. These reductionscorrespond to changes in areal strain of 18.62 ±18.98% and 27.97 ± 35.01% for the 20 and30% SR configurations, respectively. Althoughthe 10% SR configuration appeared to inducea reduction in strain when compared to the flatannulus, this reduction was not statistically sig-
nificant (P = 0.62). The results from this sectionsuggest that increased saddle height on the mi-tral annulus decreases the strain on the centralregion of the anterior leaflet and therefore maydecrease subsequent stress on this region undernormal conditions.
Alterations to Mitral Valve Function andMechanics Associated with Ventricular
Dilation
Studies have shown how the mechanics ofdifferent components of the mitral valve arealtered in instances of ventricular remodeling.In pathologies, such as ischemic heart diseaseand dilated cardiomyopathy, changes in annu-lar geometry, annular dynamics, PM function,and location have been identified.
Porcine valves were tested in an in vitro flex-ible left ventricular model in order to visualizeand analyze leaflet geometrical changes undersimulated pathological left ventricular dilationconditions.38 The valves were tested at differ-ent levels of annular dilation and for symmetricand asymmetric PM displacements.
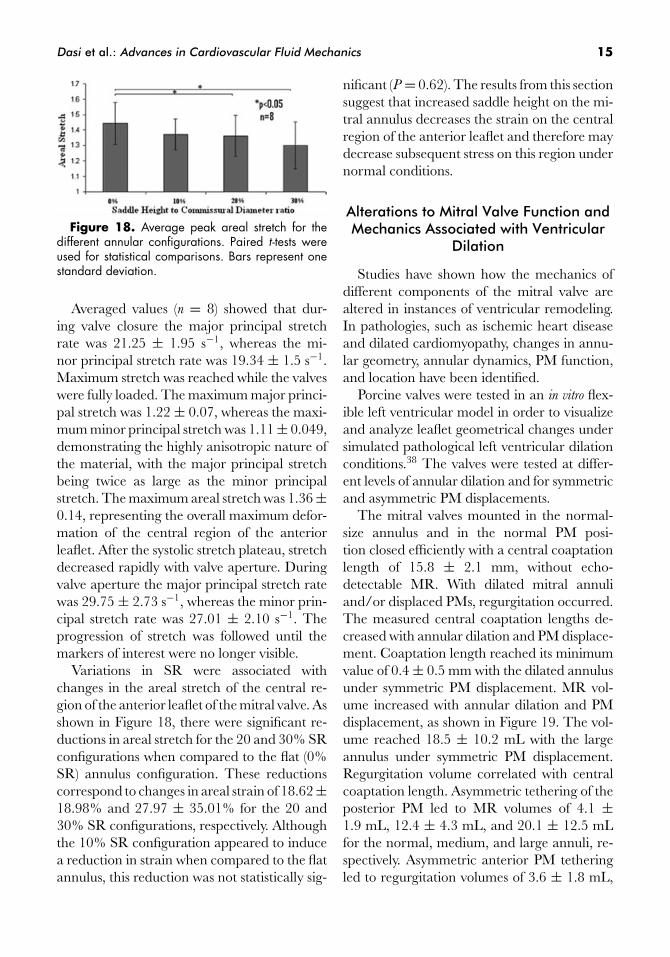
The mitral valves mounted in the normal-size annulus and in the normal PM posi-tion closed efficiently with a central coaptationlength of 15.8 ± 2.1 mm, without echo-detectable MR. With dilated mitral annuliand/or displaced PMs, regurgitation occurred.The measured central coaptation lengths de-creased with annular dilation and PM displace-ment. Coaptation length reached its minimumvalue of 0.4 ± 0.5 mm with the dilated annulusunder symmetric PM displacement. MR vol-ume increased with annular dilation and PMdisplacement, as shown in Figure 19. The vol-ume reached 18.5 ± 10.2 mL with the largeannulus under symmetric PM displacement.Regurgitation volume correlated with centralcoaptation length. Asymmetric tethering of theposterior PM led to MR volumes of 4.1 ±1.9 mL, 12.4 ± 4.3 mL, and 20.1 ± 12.5 mLfor the normal, medium, and large annuli, re-spectively. Asymmetric anterior PM tetheringled to regurgitation volumes of 3.6 ± 1.8 mL,

16 Annals of the New York Academy of Sciences
Figure 19. Mitral regurgitation volume as a func-tion of annular size and papillary muscle position.
10.5 ± 3.5 mL, and 19.6 ± 9.9 mL for the nor-mal, medium, and large annuli, respectively.No leakage gaps were observed while simulat-ing annular dilation alone. However, PM dis-placement (symmetric or asymmetric) tentedthe leaflets and shifted the coaptation line to-ward their edges. Leakage gaps [gap orificearea (GOA): medium annulus 7.3 + 4.5 mm2
and large annulus 11.7 + 3.8 mm2] emergedfirst at the center of the coaptation line undersymmetrical PM tethering. Asymmetrical PMdisplacement tented the leaflets creating off-centered gaps at the tethered side. When theanterior PM was tethered, the average GOAwas 4.7 + 1.2 mm2 for the medium-sized an-nulus and 7.5 + 4.2 mm2 for the large annulus.Similarly, for posterior PM tethering the aver-age GOA was 5.8 + 1.9 mm2 for the mediumannulus and 9.5 + 2.4 mm2 for the large annu-lus. When one side of the valve was tethered,the opposite side (the commissural area) rela-tively bulged toward the left atrium. The over-all tenting and bulging created a funnel-shapedconfiguration, and significant regurgitant jetsoccurred on the tethered side of the valve.
Leaflet geometry during valve closure wasaffected by annular dilation and PM position.Symmetrical PM displacement caused leakagegaps in the central region of the coaptation lineand subsequent regurgitation. Asymmetric PMtethering caused tethered side leakage gaps andmoderate to severe regurgitation. Tenting andbulging of the commissural leaflets generatedvulnerable points for MR under these condi-tions. The geometric details of leaflet coapta-
Figure 20. Spatial reference system based onthe normal papillary muscle position. The edges ofthe cube represent the eight different experimentalpositions used in the study. (In color in Annals online.)
tion and regurgitant leakage gaps created underthe simulated physiological and pathologicalconditions provide fundamental insights intothe mechanisms of functional MR.
Alterations in the left ventricle may affect mi-tral leaflet coaptation by displacing the tips ofthe PMs and subsequently changing the forcedistribution on the CT. C-ring force transduc-ers were sutured onto six individual chords—anterior strut chord, anterior marginal chord,posterior intermediate chord, stem of the pos-terior marginal chord, basal posterior chord,and commissural chord—in order to mea-sure chordal force distribution under differ-ent PM displacements.39 The experiment wasconducted for eight different PM positions,which were constructed from 5-mm vectorialdisplacements from the normal PM position(Fig. 20).
In addition, force in all the aforementionedchords and positions was tested for the flat an-nulus configuration, which is also associatedwith ventricular dilation.
Intermediate Chords
In the flat annulus configuration, the averageforce on the anterior strut chord was 1.12 ±0.53 N in the normal PM position. Significant(P ≤ 0.05) increase in peak systolic forces (PSF)40 ± 23%, 43 ± 24%, and 39 ± 33% were
Dasi et al.: Advances in Cardiovascular Fluid Mechanics 17
observed when the PMs were moved to position500, 550, and 555, respectively. All these posi-tions are associated with apical PM displace-ment. The average PSF on the posterior inter-mediate chord in the normal position (PSF =0.34 ± 0.28 N) decreased by 37 ± 10% with theposterior displacement of the PMs in position005 (P ≤ 0.05). Position 500 showed a signif-icant increase in force of 105 ± 68% whencompared to the force present in the normalPM position. Similarly, the force had a signifi-cant increase (P < 0.05) for position 550.
Marginal Chords
For the anterior and posterior marginalchords, there was no significant difference (P >
0.05) in PSF for any of the PM positions usedin this study, with the exception of position 550for the anterior marginal chord, where therewas a reduction of 26 ± 32%.
Basal Chords
The basal posterior chord was very sensi-tive to changes in PM position; there were sixdifferent positions with statistically significantvariations. Position 005, 055, and 050 showed asignificant decrease in PSFs of 40 ± 16%, 43 ±22%, and 20 ± 20%, respectively, when com-pared to the normal PM position (PSF = 0.21 ±0.18 N). In contrast, relocation of the PMs toposition 500 increased the force by 107 ± 45%,whereas relocation to position 550 induced anincrease in force of 109 ± 50%. Position 555also showed an increase in force, although thisvariation was smaller than those observed inpositions 500 and 550.
Commissural Chords
The force on the commissural chord showedhigh sensitivity to PM displacement. Position005, 050, and 055 showed a decrease in PSFsof 60 ± 17%, 38 ± 17%, and 30 ± 28%, re-spectively, when compared to the PSF in thenormal PM position (PSF = 0.15 ± 0.21 N).In contrast, position 500, 505, 550, and 555had an increase in force of 114 ± 52%, 153 ±110%, 104 ± 58%, and 104 ± 93%, respec-
tively. All of the variations were statistically sig-nificant (P ≤ 0.05).
The results show how different types ofchords are affected by different types of mo-tion. Apical motion increased the force on thesecondary chords, whereas chords on the pos-terior side of the valve were subject to a reduc-tion in force after posterior motion of the PMs.Chords that insert near the annulus were af-fected by lateral, posterior, and apical displace-ment of the PMs. Chords that insert nearer tothe annulus are more sensitive to PM displace-ment, whereas those further from the annulus,such as marginal chords, are less sensitive toPM displacement.
Conclusion
In summary, the normal geometry of thenative mitral valve optimized its function andmechanics. Under pathological conditions as-sociated with ventricular dilation, significant al-terations to mitral valve function and mechan-ics were present.
Aortic Valve Biology
Background
The aortic valve interacts closely with its sur-rounding hemodynamic environment to drivecritical cell–extracellular matrix interactions.Studies indicate that pathological mechanicalloading experienced by the valve leaflets leadsto aortic valve disease, which is characterizedby inflammation, calcification, stenosis, and ul-timate failure. The bulk of research to date hasfocused on gross pathology and surgical treat-ments. Unfortunately, the molecular, cellular,and tissue-level events involved in these pro-cesses are not well characterized. In order to ad-dress this issue, this project aims at studying theeffects of various mechanical stimuli on porcinevalve biology in three sterile ex vivo organ- ortissue-culture systems that closely mimic thein vivo environment, guide cell organization,and control cell–matrix interactions. Chosen
18 Annals of the New York Academy of Sciences
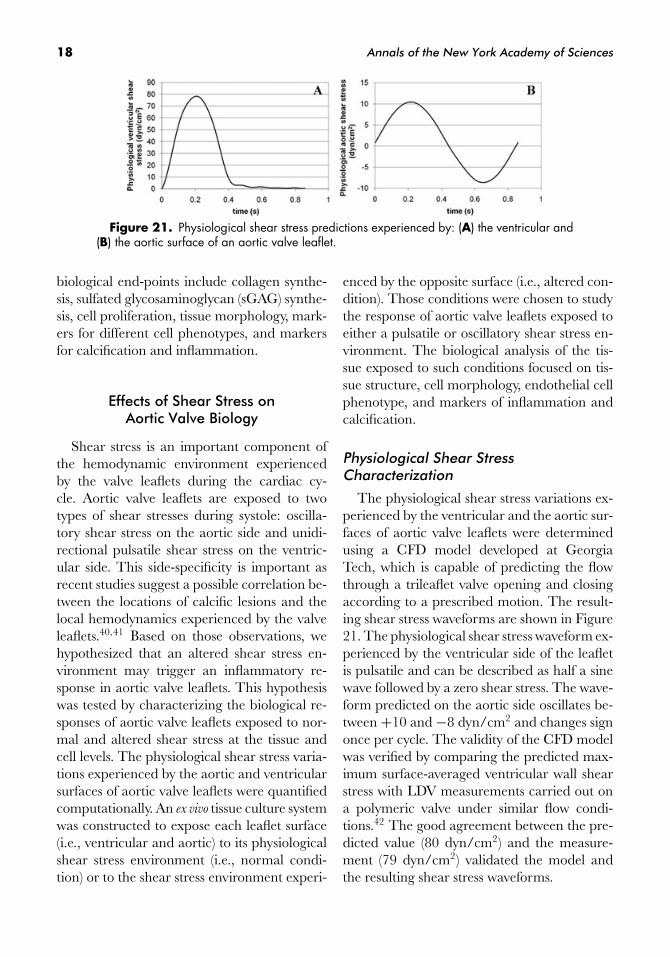
Figure 21. Physiological shear stress predictions experienced by: (A) the ventricular and(B) the aortic surface of an aortic valve leaflet.
biological end-points include collagen synthe-sis, sulfated glycosaminoglycan (sGAG) synthe-sis, cell proliferation, tissue morphology, mark-ers for different cell phenotypes, and markersfor calcification and inflammation.
Effects of Shear Stress onAortic Valve Biology
Shear stress is an important component ofthe hemodynamic environment experiencedby the valve leaflets during the cardiac cy-cle. Aortic valve leaflets are exposed to twotypes of shear stresses during systole: oscilla-tory shear stress on the aortic side and unidi-rectional pulsatile shear stress on the ventric-ular side. This side-specificity is important asrecent studies suggest a possible correlation be-tween the locations of calcific lesions and thelocal hemodynamics experienced by the valveleaflets.40,41 Based on those observations, wehypothesized that an altered shear stress en-vironment may trigger an inflammatory re-sponse in aortic valve leaflets. This hypothesiswas tested by characterizing the biological re-sponses of aortic valve leaflets exposed to nor-mal and altered shear stress at the tissue andcell levels. The physiological shear stress varia-tions experienced by the aortic and ventricularsurfaces of aortic valve leaflets were quantifiedcomputationally. An ex vivo tissue culture systemwas constructed to expose each leaflet surface(i.e., ventricular and aortic) to its physiologicalshear stress environment (i.e., normal condi-tion) or to the shear stress environment experi-
enced by the opposite surface (i.e., altered con-dition). Those conditions were chosen to studythe response of aortic valve leaflets exposed toeither a pulsatile or oscillatory shear stress en-vironment. The biological analysis of the tis-sue exposed to such conditions focused on tis-sue structure, cell morphology, endothelial cellphenotype, and markers of inflammation andcalcification.
Physiological Shear StressCharacterization
The physiological shear stress variations ex-perienced by the ventricular and the aortic sur-faces of aortic valve leaflets were determinedusing a CFD model developed at GeorgiaTech, which is capable of predicting the flowthrough a trileaflet valve opening and closingaccording to a prescribed motion. The result-ing shear stress waveforms are shown in Figure21. The physiological shear stress waveform ex-perienced by the ventricular side of the leafletis pulsatile and can be described as half a sinewave followed by a zero shear stress. The wave-form predicted on the aortic side oscillates be-tween +10 and −8 dyn/cm2 and changes signonce per cycle. The validity of the CFD modelwas verified by comparing the predicted max-imum surface-averaged ventricular wall shearstress with LDV measurements carried out ona polymeric valve under similar flow condi-tions.42 The good agreement between the pre-dicted value (80 dyn/cm2) and the measure-ment (79 dyn/cm2) validated the model andthe resulting shear stress waveforms.

Dasi et al.: Advances in Cardiovascular Fluid Mechanics 19
Figure 22. Design solution: (A) cross-sectional rendering of the cone-and-plate assemblyshowing the main components of the system; (B) schematic of the tissue mounting system; and(C) picture of the bottom plate, tissue holders, and plate cover with mounted tissue samples.(In color in Annals online.)
Tissue Culture System Design
A shear stress device capable of exposing aor-tic valve leaflets to the shear stress waveformsdescribed above was designed based on a com-mon cone-and-plate design.43 The chosen ge-ometry consists of a cone angle of 179◦, a coneradius of 40 mm, and a gap of 0.2 mm be-tween the cone apex and the plate.44 Thosedimensions comply with the geometrical re-quirements to allow for the production of a floworiented mainly in the tangential direction andto neglect secondary flow effects. As comparedto cell monolayers, the use of tissue samplesin this device is challenging because of the fi-nite thickness of the tissue, which may causesome perturbations to the surrounding flowand affect dramatically the uniformity of theshear stress produced over its surface. This issuewas overcome in the following design solution(Fig. 22A). The device consists of a cylindri-cal plate containing nine equiangularly spacedcylindrical wells. Each well accommodates achamfered cylindrical tissue holder on top ofwhich the tissue sample is located. The lastcomponent of the mounting system is the platecover that clamps the sample against the holder.This system ensures that the top surface of thetissue is mounted flush with the top surface ofthe plate cover (Fig. 22B,C).
Biological Results
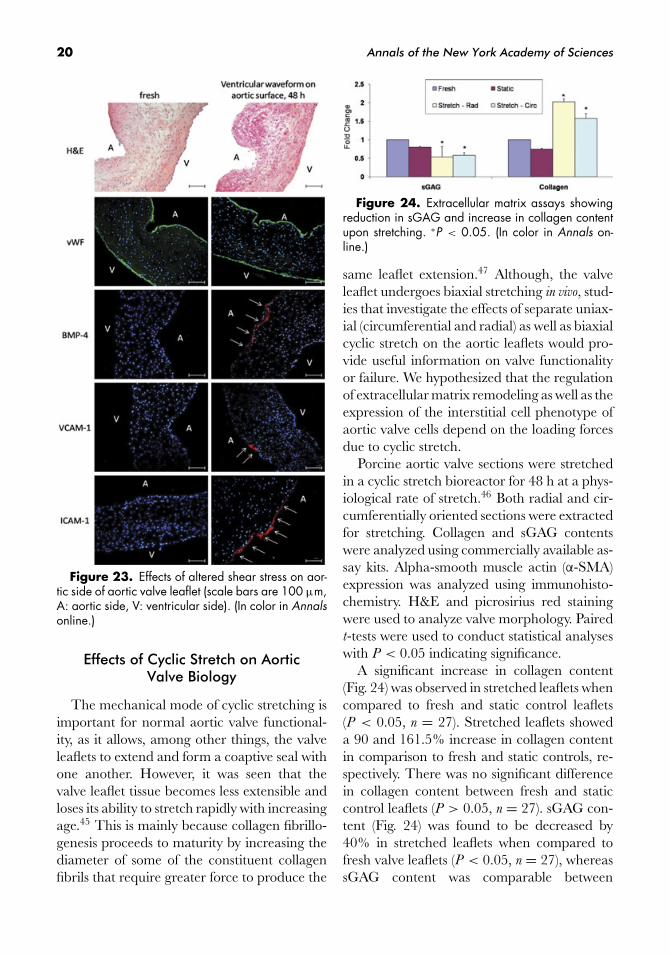
The tissue culture system described abovewas used to expose intact porcine aortic valveleaflets to both normal and altered shear stressconditions for 48 h. The hematoxylin and eosin(H&E) and von Willebrand factor (vWF) stainsdemonstrate that tissue structure was not dam-aged and that endothelium integrity was pre-served after the ventricular surface of an aorticvalve leaflet was subjected to the ventricularshear stress waveform for 48 h (Fig. 23). Sim-ilar results were obtained after exposing eachsurface to altered shear stress conditions. Al-though no significant biological change couldbe observed on the ventricular surface exposedto the ventricular and aortic shear stress wave-forms or on the aortic surface exposed to theaortic waveform, significant increases in bonemorphogenic protein 4 (BMP-4), intercellularadhesion molecule 1 (ICAM-1), and vascularcell adhesion molecule 1 (VCAM-1) expres-sions were observed on the aortic surface ex-posed to the ventricular shear stress waveform(Fig. 23). These results suggest differences be-tween the endothelial cells lining each surface ofthe leaflet. Although those cells are character-ized by a similar structure, they do not respondsimilarly to the same external mechanicalstimulus.
20 Annals of the New York Academy of Sciences
Figure 23. Effects of altered shear stress on aor-tic side of aortic valve leaflet (scale bars are 100 μm,A: aortic side, V: ventricular side). (In color in Annalsonline.)
Effects of Cyclic Stretch on AorticValve Biology
The mechanical mode of cyclic stretching isimportant for normal aortic valve functional-ity, as it allows, among other things, the valveleaflets to extend and form a coaptive seal withone another. However, it was seen that thevalve leaflet tissue becomes less extensible andloses its ability to stretch rapidly with increasingage.45 This is mainly because collagen fibrillo-genesis proceeds to maturity by increasing thediameter of some of the constituent collagenfibrils that require greater force to produce the
Figure 24. Extracellular matrix assays showingreduction in sGAG and increase in collagen contentupon stretching. ∗P < 0.05. (In color in Annals on-line.)
same leaflet extension.47 Although, the valveleaflet undergoes biaxial stretching in vivo, stud-ies that investigate the effects of separate uniax-ial (circumferential and radial) as well as biaxialcyclic stretch on the aortic leaflets would pro-vide useful information on valve functionalityor failure. We hypothesized that the regulationof extracellular matrix remodeling as well as theexpression of the interstitial cell phenotype ofaortic valve cells depend on the loading forcesdue to cyclic stretch.
Porcine aortic valve sections were stretchedin a cyclic stretch bioreactor for 48 h at a phys-iological rate of stretch.46 Both radial and cir-cumferentially oriented sections were extractedfor stretching. Collagen and sGAG contentswere analyzed using commercially available as-say kits. Alpha-smooth muscle actin (α-SMA)expression was analyzed using immunohisto-chemistry. H&E and picrosirius red stainingwere used to analyze valve morphology. Pairedt-tests were used to conduct statistical analyseswith P < 0.05 indicating significance.
A significant increase in collagen content(Fig. 24) was observed in stretched leaflets whencompared to fresh and static control leaflets(P < 0.05, n = 27). Stretched leaflets showeda 90 and 161.5% increase in collagen contentin comparison to fresh and static controls, re-spectively. There was no significant differencein collagen content between fresh and staticcontrol leaflets (P > 0.05, n = 27). sGAG con-tent (Fig. 24) was found to be decreased by40% in stretched leaflets when compared tofresh valve leaflets (P < 0.05, n = 27), whereassGAG content was comparable between
Dasi et al.: Advances in Cardiovascular Fluid Mechanics 21
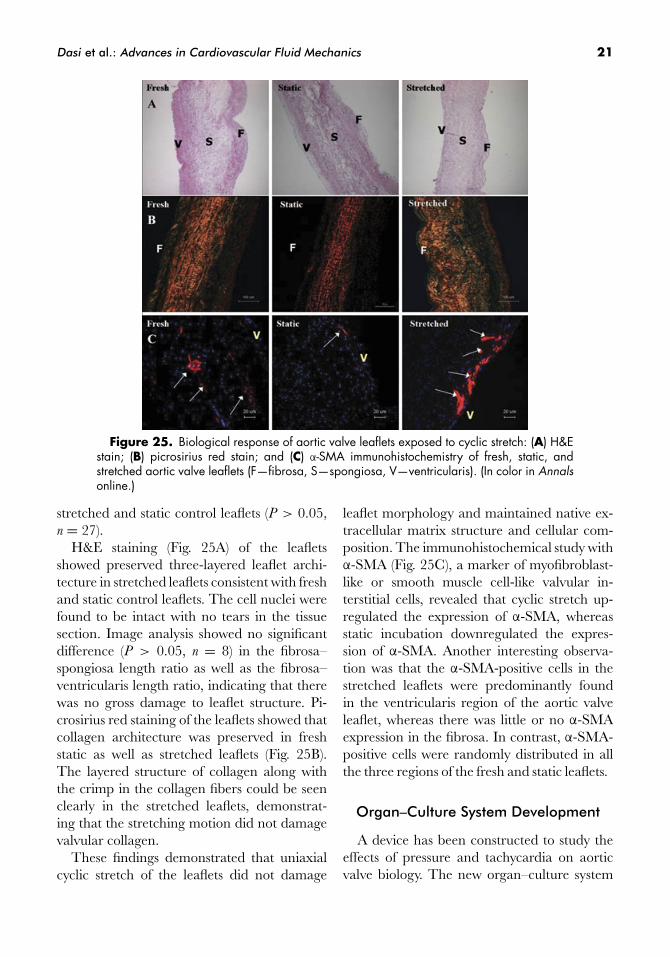
Figure 25. Biological response of aortic valve leaflets exposed to cyclic stretch: (A) H&Estain; (B) picrosirius red stain; and (C) α-SMA immunohistochemistry of fresh, static, andstretched aortic valve leaflets (F—fibrosa, S—spongiosa, V—ventricularis). (In color in Annalsonline.)
stretched and static control leaflets (P > 0.05,n = 27).
H&E staining (Fig. 25A) of the leafletsshowed preserved three-layered leaflet archi-tecture in stretched leaflets consistent with freshand static control leaflets. The cell nuclei werefound to be intact with no tears in the tissuesection. Image analysis showed no significantdifference (P > 0.05, n = 8) in the fibrosa–spongiosa length ratio as well as the fibrosa–ventricularis length ratio, indicating that therewas no gross damage to leaflet structure. Pi-crosirius red staining of the leaflets showed thatcollagen architecture was preserved in freshstatic as well as stretched leaflets (Fig. 25B).The layered structure of collagen along withthe crimp in the collagen fibers could be seenclearly in the stretched leaflets, demonstrat-ing that the stretching motion did not damagevalvular collagen.
These findings demonstrated that uniaxialcyclic stretch of the leaflets did not damage
leaflet morphology and maintained native ex-tracellular matrix structure and cellular com-position. The immunohistochemical study withα-SMA (Fig. 25C), a marker of myofibroblast-like or smooth muscle cell-like valvular in-terstitial cells, revealed that cyclic stretch up-regulated the expression of α-SMA, whereasstatic incubation downregulated the expres-sion of α-SMA. Another interesting observa-tion was that the α-SMA-positive cells in thestretched leaflets were predominantly foundin the ventricularis region of the aortic valveleaflet, whereas there was little or no α-SMAexpression in the fibrosa. In contrast, α-SMA-positive cells were randomly distributed in allthe three regions of the fresh and static leaflets.
Organ–Culture System Development
A device has been constructed to study theeffects of pressure and tachycardia on aorticvalve biology. The new organ–culture system

22 Annals of the New York Academy of Sciences
Figure 26. Organ culture system designed to study the effects of tachycardia and hyper-tension on aortic valve leaflet biology: (A) schematic of the flow loop; and (B) picture of thesystem. (In color in Annals online.)
can be considered a sterile pulse duplicator withoptimized fluid volume capable of maintainingsterile, pressure, and flow rate conditions for upto 120 h. The flow loop is shown in Figure 26.The new system, which has already been vali-dated with respect to its capability to producedesired levels of pressure and flow rate over onecardiac cycle and to maintain those levels overlong periods of time, was used to determinethe effects of hypertension (160/120 mmHg at70 bpm) on the intact aortic valve. Collagenand sGAG contents of the aortic valves weremeasured using colorimetric assays. H&E stain-ing was performed to analyze cell morphology.α-SMA immunostaining was done to analyzeinterstitial cell phenotype. Western blotting wasalso carried out to determine change in α-SMA protein expression. Student t-tests wereused for the statistical analysis of quantitativedata.
As shown in Figure 27, collagen content in-creased by a significant 32.3% in the culturedvalves when compared to fresh controls (P <
0.05, n = 12). sGAG content showed no signifi-cant difference (P = 0.2, n = 12). H&E stainingshowed well-preserved three-layer morphol-ogy in both the controls and cultured valves.α-SMA immunostaining showed increased ex-pression of α-SMA in the cultured valves. Den-sitometric analysis of the Western blots revealeda 92.9% increase in α-SMA for valves cul-tured under hypertensive conditions comparedto the fresh valves. Additional biological analy-ses will be conducted to further elucidate thesefindings.
Conclusions
The biological changes experienced by aor-tic valve leaflets exposed to altered shear stress

Dasi et al.: Advances in Cardiovascular Fluid Mechanics 23
Figure 27. Effects of hypertension on whole valve: (A) ECM assay results; (B) Westernblot results; (C) α-SMA immunohistochemistry; and (D) H&E stain. F, fibrosa; S, spongiosa;V, ventricularis. (In color in Annals online.)
conditions or cyclic stretch or by a wholeaortic valve exposed to hypertension demon-strate clear interactions between the valve andits surrounding hemodynamic environment.The characterization of the biological responseof valve leaflets to isolated or combined me-chanical stimuli will improve the current knowl-edge of the adaptive mechanisms of aorticvalves to altered hemodynamics and the un-derstanding of valve disease progression. Ul-timately, the characterization of the valvularbiological response will provide insights intonormal valve function and valve pathology andpermit the design of bioreactors for the precon-ditioning and evaluation of tissue-engineeredheart valve constructs.
Acknowledgments
The authors gratefully acknowledge thefunding support from the various grantsawarded by National Heart, Lung, and BloodInstitute, National Science Foundation, and theGeorgia Tech/Emory Center for the Engi-neering of Living Tissues. We also acknowl-edge all our collaborators, in particular Dr.Kerem Pekkan at Carnegie Mellon Univer-sity, Dr. Jarek Rossignac at the Georgia Insti-tute of Technology, Dr. Kirk Kanter at Chil-dren’s Healthcare of Atlanta at Egleston, Dr.Fotis Sotiropoulos at the University of Min-
nesota, Dr. Mark Fogel at Children’s Hospital ofPhiladelphia, Dr. Hanjoong Jo at Emory Uni-versity, and Dr. Michael Sacks at the Universityof Pittsburgh.
Conflicts of Interest
The authors declare no conflicts of interest.
References
1. de Zelicourt, D.A., K. Pekkan, J. Parks, et al. 2006.Flow study of an extracardiac connection with persis-tent left superior vena cava. J. Thorac. Cardiovasc. Surg.
131: 785–791.2. Pekkan, K. et al. 2005. Total cavopulmonary con-
nection flow with functional left pulmonary arterystenosis: angioplasty and fenestration in vitro. Circu-
lation 112: 3264–3271.3. Ensley, A.E. et al. 1999. Toward designing the optimal
total cavopulmonary connection: an in vitro study.Ann. Thorac. Surg. 68: 1384–1390.
4. Pekkan, K. et al. 2005. Physics-driven CFD modelingof complex anatomical cardiovascular flows: a TCPCcase study. Ann. Biomed. Eng. 33: 284–300.
5. Ensley, A.E. et al. 2000. Fluid mechanic assessment ofthe total cavopulmonary connection using magneticresonance phase velocity mapping and digital particleimage velocimetry. Ann. Biomed. Eng. 28: 1172–1183.
6. Sundareswaran K.S., M.A. Fogel, K.P. Pekkan, et al.2006. Viscous dissipation power loss of the totalcavopulmonary connection evaluated using phasecontrast magnetic resonance imaging. Presented at

24 Annals of the New York Academy of Sciences
the American Heart Association Annual Scientific Session
2006 .7. Frakes, D.H. et al. 2003. Application of an adaptive
control grid interpolation technique to morphologi-cal vascular reconstruction. IEEE Trans. Biomed. Eng.
50: 197–206.8. Frakes, D.H. et al. 2005. New techniques for the
reconstruction of complex vascular anatomies fromMRI images. J. Cardiovasc. Magn. Reson. 7: 425–432.
9. de Julien de Zelicourt, D.A., K. Pekkan, D.H. Frakes,et al. 2004. Fluid mechanical assessment of anatom-ical models of the total cavopulmonary connection.Presented at the Fourteenth European Society of Bioengi-
neering Conference. Hertogenbosch, The Netherlands.10. Pekkan K.S.D., W.J. Parks, H. Kitajima, et al. 2005.
Pre-Fontan surgery computational fluid dynamicanalysis of three Glenn stage anatomies: effects ofinnominate vein and upper-lobe RPA branch. Pre-sented at the American Society of Mechanical Engineering
Conference. Vail, Colorado.11. Pekkan, K.S.D., D. Sorensen, H. Kitajima & A.P.
Yoganathan. 2005. Surgical planning of the totalcavopulmonary connection using MRI, computa-tional and experimental fluid mechanics. Presentedat the Third European Medical and Biological Engineering
Conference. EMBEC, Prague, Czech Republic.12. Rossignac, J.P.K., B. Whited, K. Kanter & A. Yo-
ganathan. 2006. SURGEM: next generation CADtools targeting anatomical complexity for patient-specific surgical planning. Presented at the ASME-
Bio2006 Summer Bioengineering Conference. Florida.13. Safonova, A. & J. Rossignac. 2003. Compressed
piecewise-circular approximation of 3D curves.Computer-Aided Design 35: 533–547.
14. Ibarria, L., & J. Rossignac. 2003. Dynapack: space-time compression of the 3D animations of trianglemeshes with fixed connectivity. Tech Report GIT-GVU-03-08. ACM Symposium on Computer Ani-mation (SCA).
15. Dasi, L.P. et al. 2007. Vorticity dynamics of a bileafletmechanical heart valve in an axisymmetric aorta.Phys. Fluids 19(6): 067105.
16. Ge, L. et al. 2003. Numerical simulation of flow inmechanical heart valves: grid resolution and the as-sumption of flow symmetry. J. Biomech. Eng. Trans.
ASME 125: 709–718.17. Ge, L. et al. 2005. Flow in a mechanical bileaflet
heart valve at laminar and near-peak systole flowrates: CFD simulations and experiments. J. Biomech.
Eng. Trans. ASME. 127: 782–797.18. Ge, L. & F. Sotiropoulos. 2007. A numerical method
for solving the 3D unsteady incompressible Navier–Stokes equations in curvilinear domains with com-plex immersed boundaries. J. Comp. Phys. 225(2):1782–1809.
19. Gilmanov, A. & F. Sotiropoulos. 2005. A hybridCartesian/immersed boundary method for simulat-ing flows with 3D, geometrically complex, movingbodies. J. Comp. Phys. 207: 457–492.
20. Gilmanov, A., F. Sotiropoulos & E. Balaras. 2003. Ageneral reconstruction algorithm for simulating flowswith complex 3D immersed boundaries on Cartesiangrids. J. Comp. Phys. 191: 660–669.
21. Simon, H.A. et al. 2004. Comparison of the hingeflow fields of two bileaflet mechanical heart valvesunder aortic and mitral conditions. Ann. Biomed. Eng.
32: 1607–1617.22. Leverett, L.B. et al. 1972. Red blood cell damage by
shear stress. Biophys. J. 12: 257–273.23. Borazjani, I., L. Ge & F. Sotiropoulos. 2008. Curvilin-
ear immersed boundary method for simulating fluidstructure interaction with complex 3D rigid bodies.J. Comp. Phys. 227(16): 7587–7620.
24. Leo, H.L. et al. 2006. Effect of hinge gap width on themicroflow structures in 27-mm bileaflet mechanicalheart valves. J. Heart Valve Dis. 15: 800–808.
25. Leo, H.L. et al. 2002. Microflow fields in the hingeregion of the CarboMedics bileaflet mechanical heartvalve design. J. Thorac. Cardiovas. Surg. 124: 561–574.
26. Jimenez, J.H. et al. 2003. Effects of a saddle shapedannulus on mitral valve function and chordal forcedistribution: an in vitro study. Ann. Biomed. Eng. 31:1171–1181.
27. Salgo, I.S. et al. 2002. Effect of annular shape onleaflet curvature in reducing mitral leaflet stress. Cir-
culation 106: 711–717.28. Timek, T.A. & D.C. Miller. 2001. Experimental and
clinical assessment of mitral annular area and dy-namics: what are we actually measuring? Ann. Tho-
racic Surg. 72: 966–974.29. Madu, E.C. et al. 2001. Papillary muscle contri-
bution to ventricular ejection in normal and hy-pertrophic ventricles: a transesophageal echocardio-graphic study. Echocardiography 18: 633–638.
30. Toumanidis, S.T. et al. 1992. The role of mitral an-nulus motion in left-ventricular function. Acta Cardio-
logica. 47: 331–348.31. Sacks, M.S. et al. 2002. Surface strains in the anterior
leaflet of the functioning mitral valve. Ann. Biomed.
Eng. 30: 1281–1290.32. He, Z.M. et al. 2003. Effects of papillary muscle posi-
tion on in-vitro dynamic strain on the porcine mitralvalve. J. Heart Valve Dis. 12: 488–494.
33. Quick, D.W. et al. 1997. Collagen synthesis is upregu-lated in mitral valves subjected to altered stress. Asaio
J. 43: 181–186.34. Kunzelman, K.S., D.W. Quick & R.P. Cochran.
1998. Altered collagen concentration in mitral valveleaflets: biochemical and finite element analysis. Ann.
Thoracic Surg. 66: S198–S205.
Dasi et al.: Advances in Cardiovascular Fluid Mechanics 25
35. Taylor, P.M., S.P. Allen & M.H. Yacoub. 2000. Phe-notypic and functional characterization of interstitialcells from human heart valves, pericardium and skin.J. Heart Valve Dis. 9: 150–158.
36. Chester, A.H., M. Misfeld & M.H. Yacoub.2000. Receptor-mediated contraction of aortic valveleaflets. J. Heart Valve Dis. 9: 250–254.
37. Nielsen, S.L. et al. 2004. Miniature C-shaped trans-ducers for chordae tendineae force measurements.Ann. Biomed. Eng. 32: 1050–1057.
38. He, S.Q. et al. 2003. Mitral leaflet geometry pertur-bations with papillary muscle displacement and an-nular dilatation: an in-vitro study of ischemic mitralregurgitation. J. Heart Valve Dis. 12: 300–307.
39. Jimenez, J.H. et al. 2005. Effects of papillary mus-cle position on chordal force distribution: an in-vitrostudy. J. Heart Valve Dis. 14: 295–302.
40. Chappell, D.C. et al. 1998. Oscillatory shear stressstimulates adhesion molecule expression in culturedhuman endothelium. Circ. Res. 82: 532–539.
41. Butcher, J.T. et al. 2006. Transcriptional profiles ofvalvular and vascular endothelial cells reveal pheno-typic differences: influence of shear stress. Arterioscler.
Thromb. Vasc. Biol. 26: 69–77.42. Weston, M.W., D.V. LaBorde & A.P. Yoganathan.
1999. Estimation of the shear stress on the surfaceof an aortic valve leaflet. Ann. Biomed. Eng. 27: 572–579.
43. Mooney, M. & R.H. Ewart. 1934. The conicylindri-cal viscometer. Physics 5: 350–354.
44. Sorescu, G.P. et al. 2003. Bone morphogenic protein4 produced in endothelial cells by oscillatory shearstress stimulates an inflammatory response. J. Biol.
Chem. 278: 31128–31135.45. Christie, G.W. & B.G. Barratt-Boyes. 1995. Age-
dependent changes in the radial stretch of humanaortic valve leaflets determined by biaxial testing. Ann.
Thorac. Surg. 60: S156–158; discussion S159.46. Thubrikar, M. 1990. The Aortic Valve. CRC Press.
Boca Raton, FL.