ADVANCED INTEGRATED SYSTEMS TECHNOLOGY ...
130
Energy Research and Development Division FINAL PROJECT REPORT ADVANCED INTEGRATED SYSTEMS TECHNOLOGY DEVELOPMENT JULY 2013 CEC-500-08-044 Prepared for: California Energy Commission Prepared by: Center for the Built Environment University of California, Berkeley
-
Upload
khangminh22 -
Category
Documents
-
view
1 -
download
0
Transcript of ADVANCED INTEGRATED SYSTEMS TECHNOLOGY ...

E n e r g y R e s e a r c h a n d De v e l o p m e n t Di v i s i o n F I N A L P R O J E C T R E P O R T
ADVANCED INTEGRATED SYSTEMS TECHNOLOGY DEVELOPMENT
JULY 2013 CEC-500-08-044
Prepared for: California Energy Commission Prepared by: Center for the Built Environment University of California, Berkeley

DISCLAIMER This report was prepared as the result of work sponsored by the California Energy Commission. It does not necessarily represent the views of the Energy Commission, its employees or the State of California. The Energy Commission, the State of California, its employees, contractors and subcontractors make no warranty, express or implied, and assume no legal liability for the information in this report; nor does any party represent that the uses of this information will not infringe upon privately owned rights. This report has not been approved or disapproved by the California Energy Commission nor has the California Energy Commission passed upon the accuracy or adequacy of the information in this report.
Prepared by: Primary Author(s): Fred Bauman Tom Webster
Hui Zhang Edward Arens David Lehrer Darryl Dickerhoff Jingjuan (Dove) Feng David Heinzerling David Fannon Tiefeng Yu Sabine Hoffmann Tyler Hoyt Wilmer Pasut Stefano Schiavon Janani Vasudev Soazig Kaam
Center for the Built Environment, University of California 390 Wurster Hall Berkeley, CA 94720-1839 Phone: 510-642-4950 | Fax: 510-643-5571 www.cbe.berkeley.edu Contract Number: 500-08-044 Prepared for: California Energy Commission Heather Bird Contract Manager
Virginia Lew Office Manager Energy Efficiency Research Office
Laurie ten Hope Deputy Director RESEARCH AND DEVELOPMENT DIVISION
Robert P. Oglesby Executive Director

i
ACKNOWLEDGEMENTS
This work was supported by the California Energy Commission Public Interest Energy
Research (PIER) Buildings Program under Contract 500-08-044. We would like to express our
sincere appreciation to Chris Scruton of the Energy Commission PIER Buildings Team, who
expertly served as our Commission Project Manager for the majority of the project duration. We
would also like to thank Heather Bird, who took over for Chris upon his retirement in
December 2012.
Additional support for this project was also provided by the Center for the Built Environment
(CBE) at the University of California, Berkeley (UCB). CBE is a National Science Foundation
(NSF)/Industry/University Cooperative Research Center. Current CBE sponsors include
Aditazz, Affiliated Engineers, Inc., Armstrong World Industries, Arup, California Energy
Commission, Cannon Design, Charles Salter Associates, Inc., Dialog, EHDD Architecture, HGA
Architects and Engineers, HOK, Integral Group Team (Integral Group, CPP, Inc., DPR
Construction, P2S Engineering, Perkins+Will), Interface Engineering, LG Electronics, LPA, Inc.,
Mary Davidge Associates, National Security Agency/Central Security Service, Pacific Gas &
Electric Co., Price Industries, Rehau, RTKL Associates, Inc., San Diego Gas and Electric, SOM,
Southern California Edison, Syska Hennessy Group, Tate Access Floors, Inc., Taylor
Engineering Team (Taylor Engineering, Cadmus Group, Inc., Guttmann & Blaevoet, Southland
Industries, Swinerton Builders), Webcor Builders, WSP Flack + Kurtz, Zimmer Gunsul Frasca
Architects, and the Regents of the University of California.
We would like to thank the following individuals for their cooperation and support in setting
up, providing access, and sharing information during our case study of the David Brower
Center (DBC): Amy Tobin, DBC Executive Director; Suzanne Brown, Principal, Equity
Community Builders; Ellen Whittom, DBC Director of Operations and Finance; and Ryan
Miller, DBC Facility Manager.
We would also like to thank the following for their direct contributions to the work reported
herein: Allan Daly, Taylor Engineering, for his support of our UFAD simulations work, Dave
Troup, HOK, and David Hill, Able Engineering, for their help on the CALSTRS project.
Additional thanks to the LBNL team of Eleanor Lee, Brian Coffey, Luis Fernandes, and Andrew
McNeil for their tremendous contributions on the detailed modeling of the New York Times
Building.

ii
PREFACE
The California Energy Commission Energy Research and Development Division supports
public interest energy research and development that will help improve the quality of life in
California by bringing environmentally safe, affordable, and reliable energy services and
products to the marketplace.
The Energy Research and Development Division conducts public interest research,
development, and demonstration (RD&D) projects to benefit California.
The Energy Research and Development Division strives to conduct the most promising public
interest energy research by partnering with RD&D entities, including individuals, businesses,
utilities, and public or private research institutions.
Energy Research and Development Division funding efforts are focused on the following
RD&D program areas:
Buildings End-Use Energy Efficiency
Energy Innovations Small Grants
Energy-Related Environmental Research
Energy Systems Integration
Environmentally Preferred Advanced Generation
Industrial/Agricultural/Water End-Use Energy Efficiency
Renewable Energy Technologies
Transportation
Advanced Integrated Systems Technology Development is the final report for the Advanced
Integrated Systems Technology Development project (contract number 500-08-044) conducted
by the Center for the Built Environment, University of California, Berkeley. The information
from this project contributes to Energy Research and Development Division’s Buildings End-
Use Energy Efficiency Program.
For more information about the Energy Research and Development Division, please visit the
Energy Commission’s website at www.energy.ca.gov/research/ or contact the Energy
Commission at 916-327-1551.
iii
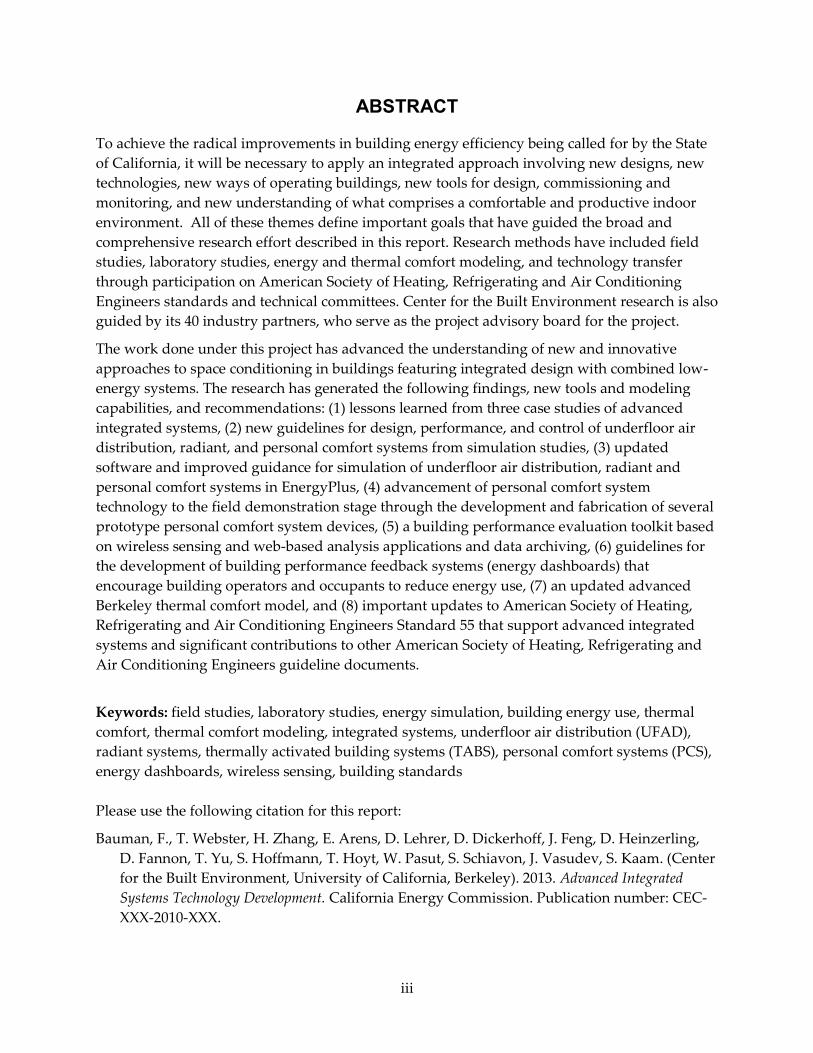
ABSTRACT
To achieve the radical improvements in building energy efficiency being called for by the State
of California, it will be necessary to apply an integrated approach involving new designs, new
technologies, new ways of operating buildings, new tools for design, commissioning and
monitoring, and new understanding of what comprises a comfortable and productive indoor
environment. All of these themes define important goals that have guided the broad and
comprehensive research effort described in this report. Research methods have included field
studies, laboratory studies, energy and thermal comfort modeling, and technology transfer
through participation on American Society of Heating, Refrigerating and Air Conditioning
Engineers standards and technical committees. Center for the Built Environment research is also
guided by its 40 industry partners, who serve as the project advisory board for the project.
The work done under this project has advanced the understanding of new and innovative
approaches to space conditioning in buildings featuring integrated design with combined low-
energy systems. The research has generated the following findings, new tools and modeling
capabilities, and recommendations: (1) lessons learned from three case studies of advanced
integrated systems, (2) new guidelines for design, performance, and control of underfloor air
distribution, radiant, and personal comfort systems from simulation studies, (3) updated
software and improved guidance for simulation of underfloor air distribution, radiant and
personal comfort systems in EnergyPlus, (4) advancement of personal comfort system
technology to the field demonstration stage through the development and fabrication of several
prototype personal comfort system devices, (5) a building performance evaluation toolkit based
on wireless sensing and web-based analysis applications and data archiving, (6) guidelines for
the development of building performance feedback systems (energy dashboards) that
encourage building operators and occupants to reduce energy use, (7) an updated advanced
Berkeley thermal comfort model, and (8) important updates to American Society of Heating,
Refrigerating and Air Conditioning Engineers Standard 55 that support advanced integrated
systems and significant contributions to other American Society of Heating, Refrigerating and
Air Conditioning Engineers guideline documents.
Keywords: field studies, laboratory studies, energy simulation, building energy use, thermal
comfort, thermal comfort modeling, integrated systems, underfloor air distribution (UFAD),
radiant systems, thermally activated building systems (TABS), personal comfort systems (PCS),
energy dashboards, wireless sensing, building standards
Please use the following citation for this report:
Bauman, F., T. Webster, H. Zhang, E. Arens, D. Lehrer, D. Dickerhoff, J. Feng, D. Heinzerling,
D. Fannon, T. Yu, S. Hoffmann, T. Hoyt, W. Pasut, S. Schiavon, J. Vasudev, S. Kaam. (Center
for the Built Environment, University of California, Berkeley). 2013. Advanced Integrated
Systems Technology Development. California Energy Commission. Publication number: CEC-
XXX-2010-XXX.

iv
TABLE OF CONTENTS
Acknowledgements ................................................................................................................................... i
PREFACE ................................................................................................................................................... ii
ABSTRACT .............................................................................................................................................. iii
TABLE OF CONTENTS .......................................................................................................................... iv
LIST OF FIGURES ................................................................................................................................ viii
LIST OF TABLES ...................................................................................................................................... x
1 EXECUTIVE SUMMARY ..................................................................................................................... 1
1.1 Introduction ..................................................................................................................................... 1
1.2 Research Goals ................................................................................................................................ 1
1.2.1 Task 2.0 Monitoring, Commissioning, and Benchmarking Tools Development ............ 1
1.2.2 Task 3.0. Advanced Integrated Systems Research and Development .............................. 2
1.2.3 Task 4.0. Technology transfer activities ................................................................................ 3
1.3 Significant Findings and Accomplishments ............................................................................... 3
1.3.1 Task 2.0 Monitoring, Commissioning, and Benchmarking Tools Development ............ 3
1.3.2 Task 3.0 Advanced Integrated Systems Research and Development ............................... 9
1.3.3 Task 4.0 Technology Transfer Activities ............................................................................. 15
2 CHAPTER 2: Monitoring, Commissioning, and Benchmarking Tools Development ........... 18
2.1 Advanced Integrated Systems Design and Performance Analysis ....................................... 18
2.1.1 David Brower Center ............................................................................................................. 18
2.1.2 CalSTRS California State Teachers’ Retirement System Headquarters .......................... 22
2.1.3 The New York Times Building ............................................................................................. 31
2.2 Monitoring and Commissioning Wireless Hardware Devices and Procedures .................. 38
2.2.1 Wireless Monitoring System Development ........................................................................ 38
2.2.2 Conclusions ............................................................................................................................. 46
2.2.3 References ............................................................................................................................... 48
2.3 Building Performance Feedback Systems ................................................................................. 49
2.3.1 Description of research methods ......................................................................................... 49
2.3.2 Phase One: A Study of Tools, Expert Users, and Building Occupants ........................... 49
2.3.3 Phase 2: Evaluating a Social Media Application for Sustainability in the Workplace . 51

v
2.3.4 References ............................................................................................................................... 56
3 CHAPTER 3: Advanced Integrated Systems Research and Development .............................. 57
3.1 Integrated Systems Modeling and Technology Development ............................................... 57
3.1.1 Improved UFAD and DV EnergyPlus Algorithms ........................................................... 57
3.1.2 Modeling of radiant system cooling loads ......................................................................... 61
3.1.3 Personal comfort systems technology development ......................................................... 66
3.2 Integrated Systems Performance and Control Analysis ......................................................... 72
3.2.1 UFAD performance analyses................................................................................................ 72
3.2.2 Radiant cooling system design and performance analyses ............................................. 90
3.2.3 Personal comfort systems (PCS) modeling......................................................................... 95
3.3 Thermal Comfort Research ......................................................................................................... 98
3.3.1 Linking to Simulink ............................................................................................................... 98
3.3.2 Calculation of Diffuse and Direct Solar Load on Occupants through shades and blinds
(a new software tool, SoLoCalc – solar load calculator) ........................................................... 100
3.3.3 Clothing insulation test ....................................................................................................... 102
3.3.4 Improvements in sweat distribution within the physiology model ............................. 102
3.3.5 References ............................................................................................................................. 105
4 CHAPTER 4: Technology Transfer Activities .............................................................................. 107
4.1 ASHRAE Standard 55: Thermal Environmental Conditions for Human Occupancy ...... 107
4.1.1 Moving air for comfort ........................................................................................................ 107
4.1.2 Are ‘Class A’ Temperature Requirements Realistic or Desirable? ................................ 108
4.1.3 Thermal comfort thresholds ............................................................................................... 108
4.1.4 ASHRAE Standard 55 user manual ................................................................................... 109
4.1.5 Additional work for ASHRAE Standard 55 ..................................................................... 109
4.2 ASHRAE TC 2.1: Physiology and Human Environment ...................................................... 110
4.2.1 The Performance Measurement Protocols for Commercial Buildings ......................... 110
4.2.2 ASHRAE Performance Measurement Protocols (PMP) - Best Practices Guide for
Building Commissioning .............................................................................................................. 110
4.2.3 ASHRAE Project RP-1515 ................................................................................................... 111
4.2.4 ASHRAE database II development ................................................................................... 111
4.3 Revision of ASHRAE UFAD Design Guide ............................................................................ 112

vi
4.4 References .................................................................................................................................... 112
5 LIST OF APPENDIXES .................................................................................................................... 114
2.1.1: David Brower Center: Thermal Comfort and Radiant Performance Study
2.1.1a: Radiant Cooling Slab Design, Control and Application
2.1.2: Technical Report on California State Teachers Retirement System Building: UFAD
Performance and Blinds Study
2.1.3: The New York Times Building Field Measurement Report
2.2.1: Building Performance Evaluation Toolkit Specifications
2.2.2: BPE Toolkit Wireless Hardware Device Report
2.3.1: Visualizing Energy Information in Commercial Buildings: A Study of Tools, Expert
Users, and Building Occupants
2.3.2: Using Social Media Applications for Conserving Energy and Improving Operations
in Commercial Buildings
3.1.1: UFAD Modeling Upgrade Summary
3.1.2: UFAD Model Specifications Comparison
3.1.3: CBE EnergyPlus Modeling Methods for UFAD Systems
3.1.4: Cooling Load Differences between Radiant and Air Systems
3.1.5: Performance Specification: Fan, Low Power
3.1.6: Thermal Comfort and Perceived Air Quality of a PCS System
3.1.7: Study of a Personal Environmental Control System Using Opposing Airstreams
3.1.8: Effect of a Heated and Cooled Office Chair on Thermal Comfort
3.2.1: UFAD Energy Optimization Study #1
3.2.2: Influence of Design and Operating Conditions on Underfloor Air Distribution
(UFAD) System Performance
3.2.3: Influence of Supply Air Temperature on Underfloor Air Distribution (UFAD) System
Energy Performance
3.2.4: The New York Times Building Post-Occupancy Evaluation: Simulation Model
Calibration
3.2.5: Radiant Cooling System Design and Performance Analysis
3.2.6: Energy Savings from Extended Air Temperature Setpoints and Reductions in Room
Air Mixing
3.3.1: SoloCalc for Complex Fenestration Systems
3.3.2: Clothing Insulation Test

vii
3.4.1: Moving Air for Comfort
3.4.2: Are "Class A" Temperature Requirements Realistic or Desirable?
3.4.3: Air Temperature Thresholds for Indoor Comfort and Perceived Air Quality
6 GLOSSARY ......................................................................................................................................... 115
viii
LIST OF FIGURES
Figure 2.1.1-1: David Brower Center, Berkeley, CA ............................................................................ 19
Figure 2.1.1-2: Average satisfaction ratings by category – David Brower Center vs. CBE
Benchmark. Survey conducted March 22 – April 9, 2010 ............................................................ 20
Figure 2.1.2-1: CalSTRS Headquarters, Sacramento, CA (Mechanical design by Dave Troup,
HOK) ................................................................................................................................................... 22
Figure 2.1.2-2: Thermal stratification profiles for blinds scenarios in third floor conference room
.............................................................................................................................................................. 24
Figure 2.1.2-3: Airflow and space temperature BMS data for third floor conference room .......... 25
Figure 2.1.2-4: Thermal stratification profiles for blinds scenarios in third floor conf. room ....... 26
Figure 2.1.2-5: Thermal stratification profiles for blinds scenarios in 11th floor open plan space 27
Figure 2.1.2-6: UFAD performance summary for 11th floor open plan office .................................. 28
Figure 2.1.3-1: The New York Times Building, New York, NY ......................................................... 31
Figure 2.1.3-2: Map of wireless sensors deployed on 20th floor of The NYT Building ................... 34
Figure 2.1.3-3: East interior zone stratification pole and example hourly temperature profiles,
9/14/2011 ............................................................................................................................................. 35
Figure 2.1.3-4: Monthly weekday and weekend average plug load profiles................................... 36
Figure 2.2.1-1: “All wireless” monitoring system architecture .......................................................... 39
Figure 2.2.1-2: Kresge Foundation headquarters building ................................................................. 40
Figure 2.2.1-3: Stratification measurements and results display at Kresge Foundation ................ 41
Figure 2.2.1-4: sMAP architecture illustration ..................................................................................... 42
Figure 2.2.1-5a: Stratification tree .......................................................................................................... 43
Figure 2.2.1-5b: Stratification cart .......................................................................................................... 43
Figure 2.2.1-5c: Power metering ............................................................................................................. 43
Figure 2.2.1-5d: Chilled water flow and temperature metering ........................................................ 43
Figure 2.2.1-6: BPE Toolkit ICM ............................................................................................................. 44
Figure 2.2.1-7: Example of sMAP trending data visualization .......................................................... 44
Figure 2.2.1-8: Example of map-based sensor placement tool ........................................................... 45
Figure 2.2.1-9: Example of scoring system presentation screen ........................................................ 46
Figure 2.3.3-1: Site map for the building energy and social media application ............................. 53
Figure 2.3.3-2a: Individual energy goals page ..................................................................................... 53
Figure 2.3.3-2b: Energy use shown by floor level (energy competition) .......................................... 53
Figure 2.3.3-2c: Billboard page ............................................................................................................... 53
Figure 3.1.1-1: Revised phi-gamma curves for modeling UFAD stratification ............................... 58
Figure 3.1.2-1: Schematic of the three types of radiant surface ceiling systems (not to scale) ...... 62
Figure 3.1.2-2: Schematic diagram of single zone model ................................................................... 63
Figure 3.1.2-3: Comparison of surface cooling breakdown (convective and radiative part) for air
system (left) and radiant cooling panel (RCP) system (right) ..................................................... 65
Figure 3.1.3-1: Battery-powered PCS chair ........................................................................................... 68
Figure 3.1.3-2: PCS fan + footwarmer, occupant’s desktop interface, and manufacturing of 105
units ..................................................................................................................................................... 68

ix
Figure 3.1.3-3: PCS legwarmer .............................................................................................................. 69
Figure 3.1.3-4: Fan+Footwarmer testing in a UC Library ................................................................... 69
Figure 3.1.3-5: Examples of each of the four major fan designs ....................................................... 70
Figure 3.1.3-6: Infrared images of the thermal manikin showing the initial case on the left, the
2.7 °C cooling of the breathing zone provided by a fan on the right ......................................... 70
Figure 3.1.3-7: Examples of conductive work surfaces that draw heat away passively from the
hands ................................................................................................................................................... 71
Figure 3.2.1-1: UFAD vs. OH performance for San Francisco ........................................................... 74
Figure 3.2.1-2: UFAD vs. OH performance for Miami ........................................................................ 75
Figure 3.2.1-3: UFAD vs. OH performance for Minneapolis ............................................................. 75
Figure 3.2.1-4: Energy performance across climates ........................................................................... 78
Figure 3.2.1-5: Comparisons of energy performance between OH and UFAD and various UFAD
design and operating options .......................................................................................................... 80
Figure 3.2.1-6: Energy performance sensitivity to SAT ...................................................................... 82
Figure 3.2.1-7: UFAD comfort histogram for Sacramento .................................................................. 84
Figure 3.2.1-8: UFAD comfort histogram for San Francisco .............................................................. 84
Figure 3.2.1-9: The New York Times Building ..................................................................................... 86
Figure 3.2.1-10: Simulation zoning configuration ............................................................................... 87
Figure 3.2.1-11: Actual thermal zoning layout ..................................................................................... 88
Figure 3.2.1-12: End use breakdown comparison of measured vs. simulated energy
consumption (for floor cooling and heating models) ................................................................... 89
Figure 3.2.2-1: Example showing expanding thermal comfort range with air motion .................. 93
Figure 3.2.2-2: Exceedance of weighted PPD too warm for Sacramento ........................................ 94
Figure 3.2.3-1: HVAC Energy Savings from widened thermostat setpoints in various climates . 98
Figure 3.3.1-1: Logic of the linking of the Berkeley comfort model with the third-party
application tool that simulates environmental conditions .......................................................... 99
Figure 3.3.2-1: Linking the 3-D transmission to the solar load on certain body parts ................. 101
Figure 3.3.2-2: Meshing of manikin (1356 polygons) and façade (64 polygons) ........................... 101
Figure 3.3.3-1: Skin temperature predictions with old and new sweat distributions (resting,
nude body) ....................................................................................................................................... 103
Figure 3.3.3-2: Comparison of measured and predicted skin temperatures ................................. 105
Figure 4.1.1-1: Elevated air speed for warm air temperatures in ASHRAE Standard 55-2010 ... 108
Figure 4.1.5-1: ASHRAE thermal comfort web-tool (developed by CBE) .................................... 110
Figure 4.2.4-1: Map of data collection for Database II development .............................................. 111

x
LIST OF TABLES
Table 2.1.1-1: Energy Star Rating Report for David Brower Center, August 2010 ......................... 21
Table 2.1.2-1: Leakage and normal operating pressures and flows of leak paths to the 3rd floor
conference room underfloor plenum. Normal operating pressures are for 11 AM to 2 PM on
July 20-23, 2010. The flow into the 3rd floor conference room UF plenum was 2000 cfm
(commanded by the BMS system). .................................................................................................. 29
Table 3.2.1-1: Summary of UFAD simulation activities ...................................................................... 73
Table 3.2.1-2: Simulation cases ............................................................................................................... 79
Table 3.2.1-3: Temperatures not met for OH and UFAD.................................................................... 80
Table 3.2.1-4: Predicted percent people dissatisfied............................................................................ 81
Table 3.2.1-5: Energy savings vs. SAT ................................................................................................... 83
Table 3.2.1-6: End uses mean bias errors (NMBE, normalized mean biased error)........................ 89
Table 3.2.2-1: Evaluated system design and operating strategies ..................................................... 92
Table 3.2.3-1: HVAC energy savings for various room cooling and heating setpoints, Fresno ... 96
Table 3.2.3-2: HVAC energy savings for various room cooling and heating setpoints, San
Francisco ............................................................................................................................................. 97
1
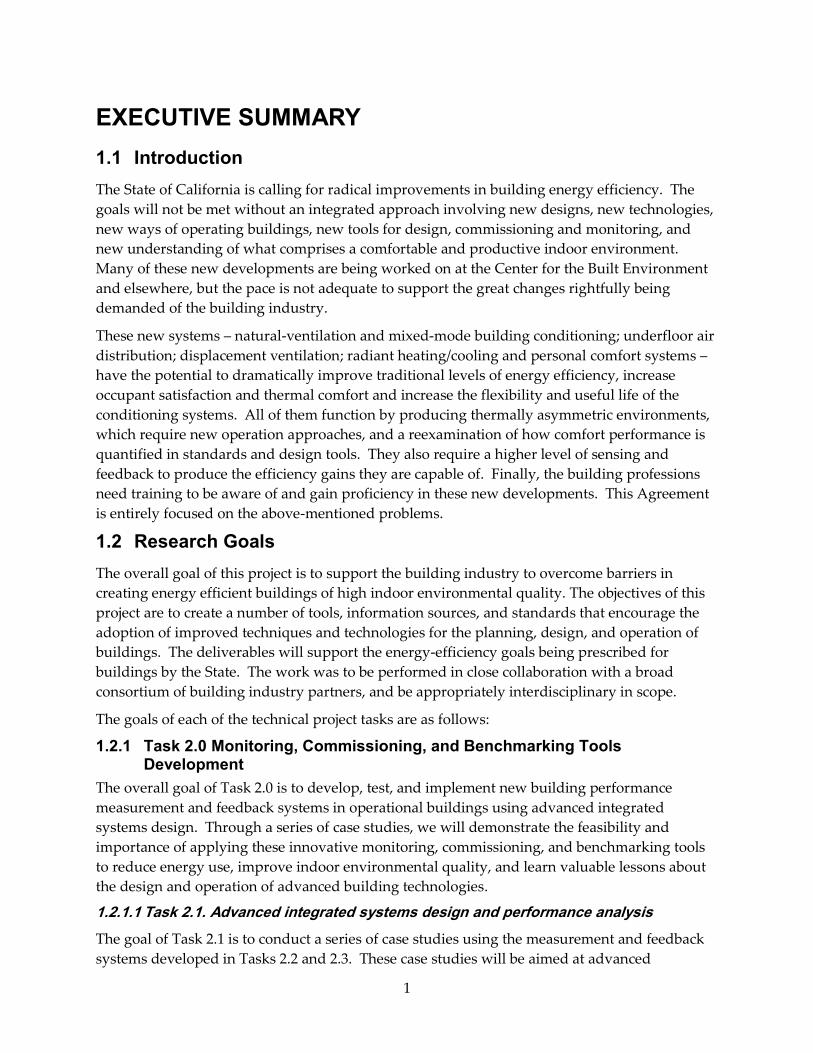
EXECUTIVE SUMMARY
1.1 Introduction
The State of California is calling for radical improvements in building energy efficiency. The
goals will not be met without an integrated approach involving new designs, new technologies,
new ways of operating buildings, new tools for design, commissioning and monitoring, and
new understanding of what comprises a comfortable and productive indoor environment.
Many of these new developments are being worked on at the Center for the Built Environment
and elsewhere, but the pace is not adequate to support the great changes rightfully being
demanded of the building industry.
These new systems – natural-ventilation and mixed-mode building conditioning; underfloor air
distribution; displacement ventilation; radiant heating/cooling and personal comfort systems –
have the potential to dramatically improve traditional levels of energy efficiency, increase
occupant satisfaction and thermal comfort and increase the flexibility and useful life of the
conditioning systems. All of them function by producing thermally asymmetric environments,
which require new operation approaches, and a reexamination of how comfort performance is
quantified in standards and design tools. They also require a higher level of sensing and
feedback to produce the efficiency gains they are capable of. Finally, the building professions
need training to be aware of and gain proficiency in these new developments. This Agreement
is entirely focused on the above-mentioned problems.
1.2 Research Goals
The overall goal of this project is to support the building industry to overcome barriers in
creating energy efficient buildings of high indoor environmental quality. The objectives of this
project are to create a number of tools, information sources, and standards that encourage the
adoption of improved techniques and technologies for the planning, design, and operation of
buildings. The deliverables will support the energy-efficiency goals being prescribed for
buildings by the State. The work was to be performed in close collaboration with a broad
consortium of building industry partners, and be appropriately interdisciplinary in scope.
The goals of each of the technical project tasks are as follows:
1.2.1 Task 2.0 Monitoring, Commissioning, and Benchmarking Tools Development
The overall goal of Task 2.0 is to develop, test, and implement new building performance
measurement and feedback systems in operational buildings using advanced integrated
systems design. Through a series of case studies, we will demonstrate the feasibility and
importance of applying these innovative monitoring, commissioning, and benchmarking tools
to reduce energy use, improve indoor environmental quality, and learn valuable lessons about
the design and operation of advanced building technologies.
1.2.1.1 Task 2.1. Advanced integrated systems design and performance analysis
The goal of Task 2.1 is to conduct a series of case studies using the measurement and feedback
systems developed in Tasks 2.2 and 2.3. These case studies will be aimed at advanced

2
integrated system designs that are appropriate for California’s climates, and include a range of
building types.
1.2.1.2 Task 2.2. Monitoring and commissioning wireless hardware devices and procedures
The goal of Task 2.2 is to further develop our monitoring, diagnosing, and commissioning tools
with additional analysis capability and wireless mesh networking, in order to expand the
number and effectiveness of their applications. Real-time remote monitoring and feedback are
essential for the efficient commissioning and operation of buildings, and demonstrating the
effectiveness of these wireless tools is essential in encouraging their adoption by the industry.
1.2.1.3 Task 2.3. Building performance feedback systems
The goals of this work are: (1) to identify the optimal methods for displaying building
performance information, in order to influence commercial building occupants to reduce
resource use; and (2) to identify methods to provide actionable information in order to assist
building operators in achieving improved building performance; (3) to develop methods to
include occupant feedback in these information displays, based on previous work conducted at
Center for the Built Environment on occupant comfort and workplace satisfaction; and (4) to
develop and test user interfaces for building data with various building stakeholders.
1.2.2 Task 3.0. Advanced Integrated Systems Research and Development
The overall goal of Task 3.0 is to aid the development and wider adoption of advanced
integrated systems, including hydronic-based radiant cooling and heating, underfloor air
distribution, displacement ventilation, and personal comfort systems. These systems are
attractive candidates for energy-efficient cooling technologies, but work is needed to develop
design and analysis tools that are fully capable of modeling these systems and the more
complex and often non-uniform environmental conditions they produce.
1.2.2.1 Task 3.1. Integrated systems modeling and technology development
The goal of Task 3.1 is to develop and/or improve EnergyPlus models for radiant, underfloor air
distribution, displacement ventilation, and personal comfort systems by validating the model
predictions against laboratory experiments. A further goal is to develop optimized approaches
to applying these technologies.
1.2.2.2 Task 3.2. Integrated systems performance and control analysis
The goal of Task 3.2 is to use simulation studies to investigate the energy and comfort
performance of integrated architectural and engineering systems. Advanced integrated systems
using radiant cooling and heating, underfloor air distribution, displacement ventilation, natural
ventilation, and mixed mode, all appropriate to California’s climates, will be emphasized. This
task will include evaluation and development of controls sequences for advanced building
systems. This will address the current tendency to use existing (canned) control sequences,
which may subvert the efficient operation of these advanced systems.
1.2.2.3 Task 3.3. Thermal comfort research
The goal of Task 3.3 is to integrate University of California, Berkeley Thermal Comfort, a
thermal physiology and comfort model, into newly available building energy models capable of

3
simulating detailed interior environmental conditions, and to develop applications of the joint
tool that improves designers’ ability to design advanced non-uniform environments.
1.2.3 Task 4.0. Technology transfer activities
The goal of Task 4.0 is to make the knowledge gained, experimental results and lessons learned
available to key decision-makers. This will include encouraging that revisions to American
Society of Heating, Refrigerating and Air Conditioning Engineers standards be done in an
energy-conscious manner, reflecting the full range of design and technology choices available
today. In addition, modeling improvements to EnergyPlus, EnergyPro, and eQUEST in support
of Title 24 will be continued. Work will also be performed to assist American Society of
Heating, Refrigerating and Air Conditioning Engineers in developing Handbook chapters, the
revised Underfloor Air Distribution Design Guide, and special publications that adequately
reflect new technologies and advanced design concepts. Finally this task will also include
workshops for practitioners addressing the building technologies being developed at Center for
the Built Environment.
1.3 Significant Findings and Accomplishments
The work done under this project has advanced the understanding of new and innovative
approaches to space conditioning in buildings featuring integrated design with combined low-
energy systems. The research has generated (1) lessons learned from three case studies of
advanced integrated systems, (2) new guidelines for design, performance, and control of
underfloor air distribution, radiant, and personal comfort systems from simulation studies, (3)
updated software and improved guidance for simulation of underfloor air distribution, radiant
and personal comfort systems in EnergyPlus, (4) advancement of personal comfort systems
technology to the field demonstration stage through the development and fabrication of several
prototype personal comfort system devices, (5) a building performance evaluation toolkit based
on wireless sensing and web-based analysis applications, and data archiving, (6) guidelines for
the development of building performance feedback systems (energy dashboards) that
encourage building operators and occupants to reduce energy use, (7) an updated advanced
Berkeley thermal comfort model, and (8) important updates to American Society of Heating,
Refrigerating and Air Conditioning Engineers Standard 55 that support advanced integrated
systems and significant contributions to other American Society of Heating, Refrigerating and
Air Conditioning Engineers guideline documents.
1.3.1 Task 2.0 Monitoring, Commissioning, and Benchmarking Tools Development
1.3.1.1 Task 2.1. Advanced integrated systems design and performance analysis
Three case studies of buildings with advanced integrated systems were conducted as
summarized below.
Case Study #1: David Brower Center. The David Brower Center is a 4-story 45,000-ft2 office
building located in downtown Berkeley, California. The building opened in May 2009 and is
home to a collection of non-profit organizations focusing on environmental activism and other
sustainable pursuits following the legacy of David Brower. David Brower Center is an excellent
example of a building that grew out of a highly integrated design process, combining thermal
4
mass, shading, and insulation into an efficient building envelope, implementing daylighting
and efficient lighting control strategies, and employing advanced integrated low-energy
heating, ventilation and air conditioning system design. The primary space conditioning
subsystem is hydronic, in-slab radiant cooling and heating, which is installed in the exposed
ceiling slab of the 2nd – 4th floors of the building. Radiant slab systems (often referred to as
thermally activated building systems make up an important part of the research described in
this report and therefore the Brower Center was a good choice for the first case study. In
addition to the improved efficiency of transporting thermal energy with water versus air (about
7 times more efficient), the building cooling energy savings are attained through the utilization
of a cooling tower, instead of a chiller, to make cooling supply water. Ventilation air is
provided through an underfloor air distribution system.
In the spring of 2010 Center for the Built Environment conducted its web-based occupant
satisfaction survey. The survey results, based on a 50 percent response rate, indicate an
extremely positive response from the occupants of the David Brower Center. With one
exception (acoustic quality, due to the exposed radiant slab ceilings), the ratings from David
Brower Center are all significantly higher than the Center for the Built Environment benchmark,
demonstrating excellent occupant satisfaction with the building.
To assess the energy performance, the Energy Star rating for the building was calculated based
on one year's worth of utility bill data (including photovoltaic generation) for the period ending
June 30, 2010. The David Brower Center achieved an Energy Star rating of 99, demonstrating
exceptional energy performance and well above the threshold of 75 to qualify for an “Energy
Star Label.”
During the summer of 2011, Center for the Built Environment researchers conducted a month
long series of field measurements using the portable wireless measurement system. The goals
of the study were the following: (1) help verify and assist with known thermal comfort
problems in the building, (2) pilot the portable wireless measurement system, and (3) collect
data on radiant slab surfaces for use in the EnergyPlus modeling study. Center for the Built
Environment is continuing, under separate funding, to collect and analyze trend data from the
building management system, which includes detailed sub-metered power measurements, as
well as zone temperatures and heating, ventilation and air conditioning operations. Measured
performance data of the radiant slab system will continue to be used for purposes of
comparison with and semi-validation of whole-building energy models.
Case Study #2: California State Teachers’ Retirement System Headquarters.
The California State Teachers’ Retirement System headquarters in West Sacramento is a 13-
story office tower (Figure 2.1.2-1). The main green elements are: building materials made of 10
percent recycled content, fritted exterior lobby glass to diffuse sunlight, underfloor air
distribution , overall water usage reduced by nearly 40 percent, reduced risk of ozone
destruction by using chlorofluorocarbon free-cooling, refrigeration, and fire protection systems.
Like the David Brower Center, the California State Teachers’ Retirement System headquarters
was another example of a building with advanced integrated design involving one of our
Center for the Built Environment partners, HOK, a global design, architecture, engineering and

5
planning firm, who invited us to apply our field measurement methods on the building. The
field study focused on the underfloor air distribution system, as described briefly below.
The two main objectives of this field study were: (1) to determine the impact of the position of
blinds (100 percent open, closed-horizontal, 100 percent closed) on cooling loads and
temperatures in the building, and thus provide guidance on being controlled in an energy
efficient manner, and (2) to help validate the underfloor air distribution design tool created by
Center for the Built Environment with measured building data.
The primary conclusions were:
1. Results from testing with blinds open versus closed (3rd floor) and versus horizontal (11th
floor) suggest an impact on room load for closed blinds but little impact due to blinds
horizontal.
2. More definitive results were compromised however by the fact that the fan coil units
were undersized for the supply temperatures being used. Thus the room temperatures
were not well controlled, especially on the 3rd floor. They were better on the 11th floor but
the fan coil units were still running at maximum throughout much of the day in both
places.
3. Further complicating the results was the impact of high airflows on stratification. In the
3rd floor conference room two observations were made; in one case the stratification
profiles showed a marked increase in temperature near the ceiling when blinds were
closed. This is consistent with our hypothesis that a strong window thermal plume
exists, that draws warm air up to the ceiling and tends to reduce the cooling load in the
lower occupied region of the zone. This effect was not observed on the 11th floor with the
blinds horizontal. On the other hand, we also observed that high diffuser airflows
impinging on the ceiling tended to destroy stratification causing erratic looking profiles.
The behavior demonstrated in these tests highlights the dilemma with underfloor air
distribution systems. Unless the units are sized for high supply air temperatures they will not
be able to meet the load and their high airflow compromises the stratification further
aggravating control of the space load. These effects can be ameliorated by either installing more
(or different, low throw) diffusers and/or by lowering air handling unit supply air temperature.
However, lowering air handling unit supply air temperature tends to end up overcooling the
interior spaces. Raising the space setpoint would help all of these issues; the fact that the spaces
operate at the lower end of the comfort envelope indicates that comfort would not be adversely
affected by increased setpoints.
Case Study #3: The New York Times Building. The New York Times Building is a 52-story
high performance office building in downtown Manhattan. The New York Times Building has
attracted interest nationally due to its key innovative energy efficiency measures installed in the
building, including advanced external shading, automatic internal shading control, dimmable
electric lighting, and underfloor air distribution. The New York Times Building case study was
another excellent opportunity to work on a high-profile building that truly implemented an
advanced integrated low-energy systems design approach.

6
The purpose of this study was to conduct a detailed post-occupancy evaluation of The New
York Times Building. Researchers from the Center for the Built Environment and Lawrence
Berkeley National Laboratory collaborated on this study; Center for the Built Environment
focused on evaluating the performance of the underfloor air distribution system, while
Lawrence Berkeley National Laboratory studied the shading and lighting performance. This
post-occupancy evaluation study was primarily sponsored by United States Department of
Energy’s Commercial Buildings Partnerships Program, which encourages building owners and
operators to collaborate with research staff at national laboratories and universities to explore
energy-saving ideas and strategies in retrofit and new construction projects. It was hoped that
some of the innovations used in the New York Times Building could become a model and
prototype for larger scale implementation and replication in new and existing buildings in New
York and nationally. The California Energy Commission Public Interest Energy Research
program provided partial co-funding to enable Center for the Built Environment researchers to
conduct more in-depth field measurements and analysis, as well as to extend their efforts to
complete the EnergyPlus detailed modeling work.
Underfloor air distribution lessons learned drawing from the analysis of the New York Times
Building, as well as experiences of the authors with other underfloor air distribution systems
are as follows:
1. Cooling setpoints: Cooling setpoints should be set higher than conventional practice
with overhead systems to account for stratification and combat overcooling (a pervasive
problem in the industry).
2. Heating setpoints may need to be set higher when large window to wall ratios are used
(as in the New York Times Building).
3. It is recommended that a deadband of 2-3 degrees Fahrenheit minimum be used
between heating and cooling setpoints.
4. Air handling unit supply air temperature settings (and reset) should be decided on the
basis of the impact on interior zone comfort, minimum ventilation rates, and terminal
unit sizing and potential cooling setpoints.
5. Linear bar grilles in the perimeter, while good for heating, provide challenges for
desirable cooling (stratified) performance due to the increased mixing caused by the
discharged air into the space.
The implementation of an underfloor air distribution system in The New York Times Building
proved to be very successful for both The New York Times management and workforce. Based
on the high level of satisfaction reported in the survey responses, the thermal comfort and
indoor environmental quality provided by the underfloor air distribution system in
combination with the other energy efficiency measures were well received. Whole-building
energy modeling results indicate that the building also performed very efficiently compared to
a code-compliant baseline building. Beyond the careful selection of complementary advanced
energy efficient technologies, the overriding reason behind the high quality environment
achieved at The New York Times Building was the commitment and attention paid to installing
and commissioning the various systems over time.
7
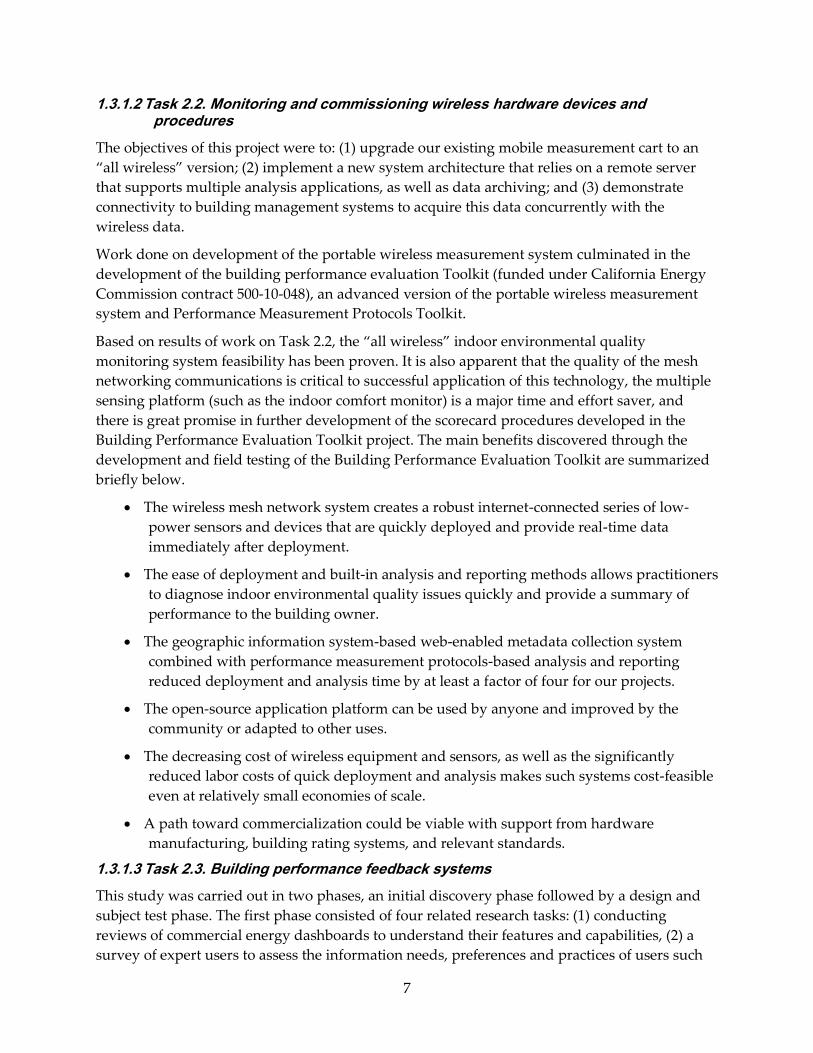
1.3.1.2 Task 2.2. Monitoring and commissioning wireless hardware devices and procedures
The objectives of this project were to: (1) upgrade our existing mobile measurement cart to an
“all wireless” version; (2) implement a new system architecture that relies on a remote server
that supports multiple analysis applications, as well as data archiving; and (3) demonstrate
connectivity to building management systems to acquire this data concurrently with the
wireless data.
Work done on development of the portable wireless measurement system culminated in the
development of the building performance evaluation Toolkit (funded under California Energy
Commission contract 500-10-048), an advanced version of the portable wireless measurement
system and Performance Measurement Protocols Toolkit.
Based on results of work on Task 2.2, the “all wireless” indoor environmental quality
monitoring system feasibility has been proven. It is also apparent that the quality of the mesh
networking communications is critical to successful application of this technology, the multiple
sensing platform (such as the indoor comfort monitor) is a major time and effort saver, and
there is great promise in further development of the scorecard procedures developed in the
Building Performance Evaluation Toolkit project. The main benefits discovered through the
development and field testing of the Building Performance Evaluation Toolkit are summarized
briefly below.
The wireless mesh network system creates a robust internet-connected series of low-
power sensors and devices that are quickly deployed and provide real-time data
immediately after deployment.
The ease of deployment and built-in analysis and reporting methods allows practitioners
to diagnose indoor environmental quality issues quickly and provide a summary of
performance to the building owner.
The geographic information system-based web-enabled metadata collection system
combined with performance measurement protocols-based analysis and reporting
reduced deployment and analysis time by at least a factor of four for our projects.
The open-source application platform can be used by anyone and improved by the
community or adapted to other uses.
The decreasing cost of wireless equipment and sensors, as well as the significantly
reduced labor costs of quick deployment and analysis makes such systems cost-feasible
even at relatively small economies of scale.
A path toward commercialization could be viable with support from hardware
manufacturing, building rating systems, and relevant standards.
1.3.1.3 Task 2.3. Building performance feedback systems
This study was carried out in two phases, an initial discovery phase followed by a design and
subject test phase. The first phase consisted of four related research tasks: (1) conducting
reviews of commercial energy dashboards to understand their features and capabilities, (2) a
survey of expert users to assess the information needs, preferences and practices of users such

8
as facility managers, designers and architects, and building occupants; (3) contextual inquiries
and interviews of these expert users; and (4) the implementation of an energy information
survey of workplace occupants.
Based on the results of this study and related research, the authors offer the following design
recommendations to developers and customers interested in using social media technologies for
energy feedback and/or building operations.
Provide energy information that is specific to the individual building occupant. In this study
subjects showed an overwhelming preference for energy displays on the scale of the individual
workspace. When providing individual energy feedback is not possible, zone or floor level
energy information is preferable. If only whole building energy data is available, showing
energy in terms of per person energy use may be an alternate way to engage occupants.
Provide normative energy comparisons in terms of average energy use, and also show the
energy use of an energy efficient user. Subjects were most interested in comparing their energy
use to the average user in the building. To avoid the “boomerang effect” (when low-energy
individuals use more energy when they see that they are below average) providing access to
efficient energy use data is a useful approach (and is seen on some commercial energy feedback
products that show the energy use of top 20th percentile in energy efficiency).
Allow users to share and view personal energy displays as “social objects,” and to share and
view energy saving goals. Subjects showed a strong inclination to share their energy use charts
and goals with others, and indicated that the social aspects of such sharing may be useful for
engaging people in energy conservation.
Be explicit about the use of energy information being solely for energy conservation. Due to
subjects concerns about privacy and competition in the workplace, the authors suggest that
energy feedback programs be explicit about using personal energy use information solely for
energy conservation, and not for other purposes such as monitoring employee schedules.
Focus on positive aspects of energy comparisons, avoiding judgmental feedback. For the
reasons noted above, energy use should be shown in positive terms such as energy saved
compared to past use, potential for savings, etc.
Display energy information in terms of the cost of energy use as the default. Subjects had a
strong preference for seeing energy use data in terms of costs, in spite of the relatively low cost
of electricity used by an individual (less than $2 per week per person in this study). In cases
where energy use is low, it may be preferable to show energy use in terms of weekly, monthly,
or annual costs.
Enable occupants to collaborate and communicate with facility managers on building
problems and repairs. Both occupants and energy professionals found the “billboard” feature
valuable and indicated that they would use such a feature if it were available. To avoid the
possibility that such a system will increase the rate of complaints, the authors suggest using an
intelligent complaint reporting approach that informs users if a particular problem has already
been reported. Such a feature would benefit by allowing facility managers to respond to
complaints and to push announcements to building occupants via the application. Providing a

9
simple method for facility managers to survey or poll occupants on specific issues or
improvements shows potential for diagnostics and measuring impacts of facility improvements.
1.3.2 Task 3.0 Advanced Integrated Systems Research and Development
1.3.2.1 Task 3.1. Integrated systems modeling and technology development
Improved Underfloor Air Distribution and Displacement Ventilation EnergyPlus algorithms.
Many changes to the underfloor air distribution modeling capability have been made in Center
for the Built Environment’s underfloor air distribution simulation infrastructure over the course
of this project. These changes have been migrated into the Center for the Built Environment
development version of v7.2 of EnergyPlus. Along with algorithms development, revisions to
the commercial building prototype models were also made.
Many of the revisions, modifications, and upgrades were in process as this project closed and
therefore were not fully implemented. Proposed further development work is described in the
main body of the report. After these improvements have been implemented there are a number
of associated comfort and energy performance studies that should be conducted, as
summarized below:
Insulated slab – compare insulation on top versus bottom of supply plenum slab.
Furniture – impact of revised internal mass object.
Blinds – determine impact of blinds down at peak loads.
Underfloor air distribution system type – York, variable speed fan coil unit, Tate.
Room air stratification effectiveness – impact of number of diffusers, diffuser type, room
setpoints and climate (i.e., effectiveness may depend on amount of economizer use).
Supply air temperature reset – outside air versus load based
Climates – include Sacramento, San Francisco, MinneapolisMN, Baltimore, Atlanta,
Phoenix, Houston
Occupant control - impact of occupant control (requires “operating runs” where sizing is
held constant and setpoints increased).
Plenum configurations – impact of reverse series.
Modeling of radiant system cooling loads. The goals of this simulation study were to 1) assess
the cooling load differences for a radiant cooling system (with activated chilled surface) versus
an air system by comparing the zone level peak cooling load and 24-hour total cooling energy
for the two systems; and 2) suggest potential improvements in current design guidelines for
radiant cooling systems.
The following methodology was used:
Two single zone models, one conditioned by an air system and one by a radiant system
were developed in EnergyPlus v7.1 for comparison. All three radiant systems (radiant
cooling panel, embedded surface cooling system, and thermally activated building
system ) were studied.

10
The models were parameterized for studying the influence of envelope thermal
insulation, thermal mass, type of internal gain, solar heat gain with different shading
options, and radiant surface orientation (ceiling, floor).
EnergyPlus v7.1 was used for the simulation study because it performs a fundamental heat
balance on all surfaces in the zone. In total, seventy-four simulation cases were configured,
including 13 (11 for radiant cooling panel) variations for the three types of radiant systems and
their equivalent air systems. Key findings were as follows:
For interior zones with longwave radiant heat gain, the peak cooling rate differences
ranged from 7 percent to 27 percent at the radiant surface level. This implies that higher
radiant fraction in heat gain produces larger differences in peak cooling rates between
the two systems. This was further demonstrated in cases with solar load.
For perimeter zones and atriums where direct solar heat gain constitutes a large portion
of the cooling load, the peak cooling load difference is pronounced. When exterior
shading was not installed, radiant cooling panel ceiling surface peak cooling rate is 36
percent higher than the air system, and for embedded surface cooling systems ceiling
system it is 35 percent, and 49 percent for thermally activated building system ceiling
systems. Exterior shading reduced the direct solar impact, but the surface peak cooling
rates were still 24-33 percent higher than the ceiling system.
When the floor was used as the radiant cooling surface and when it was illuminated by
direct solar, the embedded surface cooling systems surface peak cooling rate was 69
percent higher and for thermally activated building systems, 85 percent higher.
In conclusion, zones conditioned by a radiant system have different peak cooling loads than
those conditioned by an air system. While the increase in 24-hour total cooling energy is
relatively small and may be offset by other energy savings benefits associated with radiant
cooling systems, the differences in peak cooling load both in terms of magnitude and time
compared to the air systems require special attention in system and control design. These
differences in cooling load should be clearly stated in radiant system design guidelines and
translated into requirements for design tools and energy simulation methods.
Personal comfort systems technology development. The purpose of this task is to optimize the
efficiency and demonstrate the practical applicability of advanced personal comfort systems.
The specific goals of this task are to (1) undertake the detailed industrial design of personal
comfort systems, (2) construct prototypes and test these designs in the laboratory to optimize
performance, and (3) to manufacture a number of units for use in actual office spaces for
demonstration and evaluation. Center for the Built Environment developed two personal
comfort system prototypes that allow individual building occupants to control the thermal
environment of thermally sensitive body parts. Each personal comfort system device creates
normal comfort over an 18 – 28°C (64 – 82°F) range of ambient air temperatures.
The two prototypes, which are ready for commercialization, are described below:
Battery-powered personal comfort system chair. The personal comfort system chair has
several components. Reflective surfaces behind the seat and back of a commercially
available mesh chair reflect body heat back to people in winter. Small areas of

11
resistance heating tape wire are added in the seat mesh of the chair to provide
additional heating as needed (maximum 14watt). Cooling in summer is accomplished
by small fans increasing convection in the porous plenum between the mesh and the
reflective back (maximum 3.6watt). Control knobs on the chair switch between heating
and cooling and adjust their levels. The chair needs no electrical cord when in
operation; the battery (below the seat) has capacity for 2 – 4 days operation, and is
recharged at night when needed (adding to a building’s demand response capability).
A full-function high-quality office chair is the starting point, and there is no
inconvenience from the added features. We have applied for a provisional patent for
the chair, and are fabricating 34 copies for field studies (with funding from California
Institute for Energy and the Environment/California Energy Commission Public
Interest Energy Research). We have a manufacturer’s quote of $900 per chair in
quantity of 1000.
Fan plus footwarmer personal comfort system devices. These provide air movement for
head cooling (less than 4watt) and carefully focused radiation for foot warming. The
foot warmer, by enclosing the foot area in a highly reflective insulated shell, requires
less than 50watt to provide 9 degrees Fahrenheit (5 degrees Kelvin) of heating in
steady-state (compared to the typical 750 – 1500watt portable heater). We have
manufactured 105 of these prototypes for use in field testing in buildings. We are also
now fabricating slightly taller legwarmers that provide a very fast warming sensation
on the leg as well as the foot and ankle. These cost well under $100 in small quantities.
Center for the Built Environment has begun to conduct field studies with the personal comfort
system devices to quantify their effectiveness in practice. Fan plus footwarmers are currently
being used in a pilot demonstration project in a University of California Berkeley library
building. The results show equivalent comfort when the heating setpoint was lowered from the
original 70 degrees Fahrenheit to 66 degrees Fahrenheit. The zone heating/reheating energy
savings are estimated around 30 percent. We will continue the study during the summer under
a separate funding source to evaluate comfort and energy savings under cooling operation.
Center for the Built Environment is also communication with potential manufacturing partners
to encourage the commercialization of personal comfort systems.
1.3.2.2 Task 3.2. Integrated systems performance and control analysis
Underfloor air distribution performance analyses. Several simulation studies have been
conducted over the course of this project to investigate the energy, comfort, and control
performance of underfloor air distribution systems.
The goal of Underfloor Air Distribution Optimization Study #1 was to conduct simulations to
compare energy performance between conventional variable air volume and underfloor air
distribution and to identify the sensitivity of energy performance of underfloor air distribution
systems to various design and operating conditions. In this study, three climates were
simulated for a series plenum, fan power box terminal unit system so the impact of design and
operating factors could be studied over a range of extreme climates. Underfloor air distribution
energy performance was gauged by comparing it to a conventional overhead system applied to

12
the same building model, and designed and simulated according to American Society of
Heating, Refrigerating and Air Conditioning Engineers 90.1-2004, Appendix G standards.
It is clear from the results that climate has a significant effect on performance due to factors
somewhat unrelated to underfloor air distribution; e.g., no economizer in Miami, and a central
heating coil in Minneapolis. Underfloor air distribution performance can be best optimized by
increasing supply air temperature to maximize the use of the economizer, increasing
stratification, and increasing room cooling setpoints. However, these strategies produce a
tradeoff effect that tends to reduce the potential savings; e.g., increasing supply air temperature
tends to reduce cooling, but increase fan and reheat energy. Reducing minimum volumes at
terminal units by using a dual max control strategy has been shown to decrease heating energy
consumption.
Overall, this study suggests that underfloor air distribution energy consumption is lowest in
mild climates and where the design maximizes stratification. Increasing room setpoints can
also have a beneficial effect in all climates, but it is more pronounced in mild climates.
The objective of Underfloor Air Distribution Optimization Study #2 was to identify underfloor
air distribution best practices design and operating parameters based on a comparison of a wide
variety of options, including plenum configurations, number of diffusers, and room setpoint
changes by comparing the impact of each option with the others and with the performance of
conventional overhead systems. For this study the building models were upgraded to American
Society of Heating, Refrigerating and Air Conditioning Engineers 90.1-2010, Appendix G
standards.
This study indicates that optimized design and operating strategies can deliver significant
benefits relative to conventional overhead systems. For example, increased stratification
indicates 11 percent savings, an occupant control strategy yields 17 percent savings, and the
combination case shows savings of 22 percent. The results also show that, at least for the
Sacramento climate, plenum configuration options have little impact relative to one another.
Their overall impact on heating, air conditioning and ventilation energy use is about 8 percent
relative to a “best practices” case for overhead systems. The common plenum assumption
yields slightly better performance than the other configurations. However, the savings are
heavily skewed by the heating performance differences, a subject that needs to be studied
further.
Two additional underfloor air distribution simulation studies were conducted (1) Energy and
comfort impacts of supply air temperature settings, and (2) New York Times Building energy
monitoring and detailed modeling.. In the former, the energy use for underfloor systems was
found to decrease with increase in air handler supply temperature but tends to reach a point of
diminishing returns. The inflection in savings occurs at lower supply temperatures for warmer
climates (e.g., Sacramento) than cooler climates (e.g., San Francisco) where it reaches 11.3
percent at 63 degrees Fahrenheit supply temperature. Overall comfort was virtually unaffected
for the San Francisco climate but was more pronounced for Sacramento for a supply air
temperature of 55 degrees Fahrenheit.
13
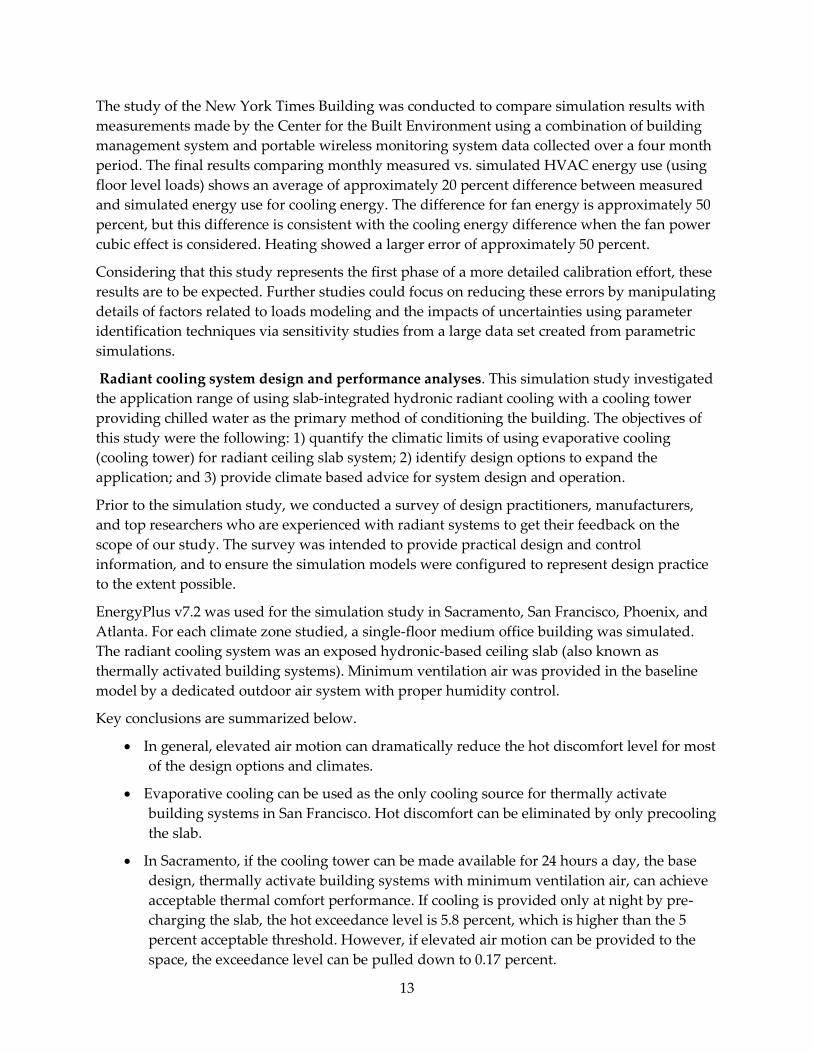
The study of the New York Times Building was conducted to compare simulation results with
measurements made by the Center for the Built Environment using a combination of building
management system and portable wireless monitoring system data collected over a four month
period. The final results comparing monthly measured vs. simulated HVAC energy use (using
floor level loads) shows an average of approximately 20 percent difference between measured
and simulated energy use for cooling energy. The difference for fan energy is approximately 50
percent, but this difference is consistent with the cooling energy difference when the fan power
cubic effect is considered. Heating showed a larger error of approximately 50 percent.
Considering that this study represents the first phase of a more detailed calibration effort, these
results are to be expected. Further studies could focus on reducing these errors by manipulating
details of factors related to loads modeling and the impacts of uncertainties using parameter
identification techniques via sensitivity studies from a large data set created from parametric
simulations.
Radiant cooling system design and performance analyses. This simulation study investigated
the application range of using slab-integrated hydronic radiant cooling with a cooling tower
providing chilled water as the primary method of conditioning the building. The objectives of
this study were the following: 1) quantify the climatic limits of using evaporative cooling
(cooling tower) for radiant ceiling slab system; 2) identify design options to expand the
application; and 3) provide climate based advice for system design and operation.
Prior to the simulation study, we conducted a survey of design practitioners, manufacturers,
and top researchers who are experienced with radiant systems to get their feedback on the
scope of our study. The survey was intended to provide practical design and control
information, and to ensure the simulation models were configured to represent design practice
to the extent possible.
EnergyPlus v7.2 was used for the simulation study in Sacramento, San Francisco, Phoenix, and
Atlanta. For each climate zone studied, a single-floor medium office building was simulated.
The radiant cooling system was an exposed hydronic-based ceiling slab (also known as
thermally activated building systems). Minimum ventilation air was provided in the baseline
model by a dedicated outdoor air system with proper humidity control.
Key conclusions are summarized below.
In general, elevated air motion can dramatically reduce the hot discomfort level for most
of the design options and climates.
Evaporative cooling can be used as the only cooling source for thermally activate
building systems in San Francisco. Hot discomfort can be eliminated by only precooling
the slab.
In Sacramento, if the cooling tower can be made available for 24 hours a day, the base
design, thermally activate building systems with minimum ventilation air, can achieve
acceptable thermal comfort performance. If cooling is provided only at night by pre-
charging the slab, the hot exceedance level is 5.8 percent, which is higher than the 5
percent acceptable threshold. However, if elevated air motion can be provided to the
space, the exceedance level can be pulled down to 0.17 percent.

14
The base design option in Atlanta creates a 40.8 percent hot exceedance level. However,
with elevated air motion, the hot exceedance level can be dramatically reduced to 4.8
percent. For Atlanta, another design option evaluated is to enhance the cooling
capacity of the air system by increasing the design air flow rate to 1.5 times the
minimum ventilation flow rate. This can reduce the hot exceedance level to 6.4 percent,
and with elevated air motion, hot discomfort can be eliminated.
For Phoenix, using evaporative cooling as the primary cooling source for thermally
activate building systems cannot satisfy the thermal comfort requirement unless the
cooling capacity on the air side is significantly enhanced. However, the use of an
embedded surface cooling system, plus an air system with the design cooling air flow
rate triple the minimum requirement, can reduced the discomfort level to 26.6 percent,
and if elevated air motion is provided, the discomfort level can be further reduced to 4.4
percent.
Personal comfort system modeling. Personal comfort systems permit widened thermostat
temperature setpoint ranges due to the ability of occupants to control their local environment.
Personal comfort systems consume little energy (4 watts for a personal fan, 40-50 watts for a
foot warmer) and thus contribute a relatively small portion to the total energy consumed by a
building. Modeling the personal comfort system directly is thus not necessary to predict the
energy savings that can be realized with personal comfort systems. The primary factor in the
resulting energy consumption in a building equipped with personal comfort systems is the
thermostat setpoint range permitted in which there is no central heating or cooling.
A parametric study was carried out to assess the potential of the personal comfort system as a
technology that saves energy by permitting wider thermostat setpoints. EnergyPlus simulation
reference models created by the United States Department of Energy were used to represent
realistic engineering practices. In this study we used the Medium Office Department of Energy
reference model. The nominal setpoint range was 70 degrees Fahrenheit – 72 degrees
Fahrenheit. The simulations and analysis were carried out for seven cities, each representative
of an American Society of Heating. Refrigerating and Air Conditioning Engineers climate zone.
The cities and respective climate zones are Miami (1A), Phoenix (2B), Fresno (3B), San Francisco
(3C), Baltimore (4A), Chicago (5A), and Duluth (7). The Department of Energy reference
buildings include models tailored specifically for each of these climates.
Unexpectedly, raising the cooling setpoint reduced the heating energy consumption of terminal
units. This occurred due to less overcooling of the zone, which occurs during warm periods in
which air is supplied at a low temperature. When the thermostat setpoint range is small, it is
common for the cooling provided by air terminals at minimum volume to drive the zone to the
heating setpoint. This causes the heating coils to activate and provide enough heat to maintain
the heating setpoint, consuming significant energy. This phenomenon has been observed in
practice, and the simulations demonstrate the effect strongly.
The simulation results predicted energy savings for cooling setpoints ranging from 72-86
degrees Fahrenheit and showed that total heating, air conditioning and ventilation savings can
be as high as 68 percent in San Francisco. Predicted results for heating setpoints in the range
from 64 degrees Fahrenheit-70 degrees Fahrenheit showed savings as high as 31 percent in San
15
Francisco. Personal comfort systems have been shown to provide comfort within these even
wider ranges in laboratory studies, suggesting a practical limit may be similar.
1.3.2.3 Task 3.3. Thermal comfort research
Several tasks were completed in support of University of California, Berkeley Thermal Comfort
(a thermal physiology and comfort model) that improved the model’s capabilities and
developed applications of the tool to support the design of advanced non-uniform
environments. These are summarized briefly below.
Successfully linked the Center for the Built Environment advanced comfort model to the
Simulink in Matlab, a computer language for numerical computation, visualization, and
programming, and other third-party applications.
Developed Solar Load Calculator , a software tool that calculates the solar load on a
person in the perimeter zone of a transparent façade in consideration of the incidence
angle of the sun and the diffuse/direct distribution of incident and transmitted
radiation. Solar Load Calculator works in combination with WINDOWS6, which
simulates direct and diffuse solar load through complex fenestration systems, to enable
the comfort model to predict comfort for shades, blinds, and other complex fenestration
systems.
Performed clothing insulation tests for about 50 typical clothing ensembles using the
Center for the Built Environment thermal manikin. The data will be useful for whole
body thermal comfort modeling (e.g., 2-node model, using the whole body insulation
value), as well as the Center for the Built Environment advanced comfort model, which
needs insulation values for each body part.
Implemented new sweat distribution coefficients into the comfort model to allow more
accurate prediction of skin temperatures, particularly under warm conditions when
sweating tends to occur.
1.3.3 Task 4.0 Technology Transfer Activities
1.3.3.1 Task 4.1. American Society of Heating, Refrigerating and Air Conditioning Engineers Standard 55: Thermal environmental conditions for human occupancy
Moving air for comfort. Center for the Built Environment drafted a new proposal allowing
elevated air movement to maintain comfort in warm environments to the American Society of
Heating, Refrigerating and Air Conditioning Engineers Standard 55 committee. The new air
movement criteria (and also the removal of the draft limit section) was accepted and published
in American Society of Heating, Refrigerating and Air Conditioning Engineers Standard 55-
2012.
Are ‘Class A’ temperature requirements realistic or desirable? In 2009, American Society of
Heating, Refrigerating and Air Conditioning Engineers Standard 55 was considering a proposal
to categorize buildings as class A, B, or C depending on how tight the room air temperature
control is. Class A, the presumed highest rated classification, had the narrowest temperature
range and required the largest amount of energy to maintain. Center for the Built Environment
presented data and arguments that demonstrated that the Class A range conferred no
16
satisfaction benefits to either individuals or realistic occupancies, and as a result, the class
system was impractical and of dubious validity. The proposed class system was therefore
dropped from consideration by American Society of Heating, Refrigerating and Air
Conditioning Engineers Standard 55.
Thermal comfort thresholds. Center for the Built Environment further examined air
temperature thresholds (ranges) for acceptable comfort in air-conditioned buildings. It was
determined that within the thresholds, the acceptability is indistinguishable, and therefore,
there is little gain from conditioning spaces to an “optimum” air temperature. Beyond the
thresholds, however, there is a significant drop-off in acceptability. Ideally, air-conditioning
would be used only when the environmental conditions are beyond the thresholds. The use of
ceiling fans or personal comfort systems broadens the threshold range.
1.3.3.2 Task 4.2. American Society of Heating, Refrigerating and Air Conditioning Engineers TC 2.1: Physiology and human environment
Performance Measurement Protocols for Commercial Buildings. The book was published by
American Society of Heating Refrigerating and Air Conditioning Engineers in 2010 and was
sponsored by American Society of Heating, Refrigerating and Air Conditioning Engineers,
United States Green Building Council, and Chartered Institute of Building Services Engineers
(United Kingdom). It describes practical methods at three different levels of investigation for
measuring energy and water consumption and indoor environmental quality (thermal comfort,
indoor air quality, lighting, and acoustics) in buildings. Center for the Built Environment (Ed
Arens) wrote the thermal comfort chapter for the book. The Center for the Built Environment
Occupant Satisfaction Survey and its unique database is a featured basis for obtaining and
benchmarking occupant response measurements throughout the performance measurement
protocols.
American Society of Heating, Refrigerating and Air Conditioning Engineers Performance
Measurement Protocols - Best Practices Guide for Building Commissioning. The book was
published by American Society of Heating, Refrigerating and Air Conditioning Engineers in
2013 as an addendum to the original Performance Measurement Protocols document to provide
greater guidance on best practices. Center for the Built Environment (Ed Arens) wrote several
chapters for the book.
1.3.3.3 Task 4.3. Revision of American Society of Heating, Refrigerating and Air Conditioning Engineers Underfloor Air Distribution Design Guide
In May 2007, American Society of Heating, Refrigerating and Air Conditioning Engineers
formed the Technical Resource Group, TRG7-UFAD, to review and revise the original
Underfloor Air Distribution Design Guide published by American Society of Heating,
Refrigerating and Air Conditioning Engineers in 2003. The goal was to provide new and
updated information that was not available at the time of publication of the original Guide.
Based on its extensive research and experience with underfloor air distribution systems, Center
for the Built Environment made significant contributions to many of the chapters in the new
Guide. The final draft of the Guide was approved for publication by unanimous vote of the
TRG7-UFAD committee at the American Society of Heating Refrigerating and Air Conditioning

17
Engineers Winter Conference in Dallas, January 2013, and was published by American Society
of Heating, Refrigerating and Air Conditioning Engineers in June 2013.

18
2 CHAPTER 2: Monitoring, Commissioning, and Benchmarking Tools Development
The overall goal of Task 2.0 is to develop, test, and implement new building performance
measurement and feedback systems in operational buildings using advanced integrated
systems design. Through a series of case studies, the feasibility and importance of applying
these innovative monitoring, commissioning, and benchmarking tools to reduce energy use,
improve indoor environmental quality, and learn valuable lessons about the design and
operation of advanced building technologies will be demonstrated.
2.1 Advanced Integrated Systems Design and Performance Analysis
The goal of Task 2.1 was to conduct a series of case studies using the measurement and
feedback systems developed in Tasks 2.2 and 2.3. These case studies were aimed at advanced
integrated system designs that are appropriate for California’s climates, and include a range of
building types.
2.1.1 David Brower Center
The David Brower Center (DBC) is a 4-story 45,000-ft2 office building located in downtown
Berkeley, California (Figure 2.1.1-1). The building was completed and first occupied in May
2009. It contains lobby and public meeting space on the first floor and open plan office spaces
on the 2nd – 4th floors that primarily house non-profit environmental activist organizations.
Integral Group (formerly Rumsey Engineers) was the mechanical design engineer on the project
and, working with the architect (Solomon E.T.C.–WRT) and other design specialists, put
together a design promoting low energy consumption.
Since the DBC opened in 2009, Center for the Built Environment (CBE) has been conducting an
ongoing field study with the following objectives: (1) assess occupant satisfaction with the
building, (2) monitor and analyze building energy consumption, and (3) evaluate and improve
the control and operation of the radiant slab system. Previous results were reported by Bauman
et al. (2011).
The goal of a low energy building was achieved through an integrated design process that
combined thermal mass, shading, and insulation into an efficient building envelope,
implemented daylighting and efficient lighting control strategies, and used a low energy
heating, ventilation, air conditioning (HVAC) system. The primary space conditioning
subsystem is hydronic in-slab radiant cooling and heating that is installed in the exposed ceiling
slab of the 2nd – 4th floors of the building. Due to their larger surface area and high thermal mass,
slab integrated radiant systems use relatively warmer chilled water temperatures, making them
well-matched with non-compressor-based cooling, such as cooling towers. In addition to the
improved efficiency of transporting thermal energy with water versus (vs.) air (about 7 times
more efficient), the building cooling energy savings are attained through the utilization of a
cooling tower, instead of a chiller, to make cooling supply water.

19
Figure 2.1.1-1: David Brower Center, Berkeley, CA
2.1.1.1 Occupant satisfaction survey
CBE conducted its web-based occupant satisfaction survey at the DBC during the period March
22 – April 9, 2010. Of the 150 invited occupants, 74 valid responses were received, representing
a response rate of nearly 50 percent which is considered acceptable for such surveys.
Figure 2.1.1-2 presents the average satisfaction ratings for each of the major environmental
categories addressed by the survey questions. Results from the recent DBC survey are
compared against the large CBE Benchmark database, containing 52,934 individual survey
responses collected from over 475 buildings since 1997. The ratings are presented in terms of
the 7-point satisfaction scale, ranging from -3 (very dissatisfied) to +3 (very satisfied) with 0
being neutral. Results shown for each category represent the average score for the 2-4 questions
that were asked pertaining to that category (see http://www.cbesurvey.org/survey/demos2010/
for a list of typical questions). The results indicate an extremely positive response from the
occupants of the DBC. With one exception, the ratings from DBC are all significantly higher
than the CBE benchmark. For two categories, View and Blinds/Shades, there is no benchmark
data because these represent two new question categories that were added for the DBC survey.
Due to high interest in this building, it is anticipated that a second survey under separate
funding will be implemented in the future to track any changes/improvements in occupant
satisfaction over time.

20
CBE Benchmark (N=52,934)
Brower Center (N=74)
Figure 2.1.1-2: Average satisfaction ratings by category – David Brower Center vs. CBE Benchmark.
Survey conducted March 22 – April 9, 2010
2.1.1.2 Energy performance
Table 2.1.1-1 summarizes the Energy Star rating report obtained from the Energy Star Portfolio
Manager website (Environmental Protection Agency (EPA) 2010). The results are based on one
year's worth of utility bill data (including Photovoltaic (PV) generation) for the period ending
June 30, 2010. The DBC achieved an Energy Star rating of 99, demonstrating exceptional energy
performance and well above the threshold of 75 to qualify for an “Energy Star Label.” The
weather normalized site energy utilization intensity (EUI) was 47 kBtu-sf/yr.
2.1.1.3 Field measurements
During the summer of 2011, CBE researchers conducted a month long series of field
measurements using the portable wireless measurement system (PWMS - Section 2.2). The
goals of the study were the following: (1) help verify and assist with known thermal comfort
problems in the building, (2) pilot test the PWMS, and (3) collect data on radiant slab surfaces
for use in the EnergyPlus modeling study (Section 3). An internal report was written describing
the measurements, findings, and recommendations and is attached as Appendix 2.1.1: David
Brower Center Internal Report. The report focuses on the use of the portable wireless
measurement system to record air and surface temperature measurements, along with
underfloor plenum pressures, that were used to analyze the performance of the radiant and
underfloor air distribution (UFAD) systems to maintain comfort in the building.

21
Table 2.1.1-1: Energy Star Rating Report for David Brower Center, August 2010
Performance Metrics
Current(Ending 6/30/2010)
ENERGY STARLabel
National Average
ENERGY STAR Rating 99 75 50
Energy Use Intensity
Site (kBtu/ft2) 47 109 147
Source (kBtu/ft2) 68 157 212
The detailed measurements that were obtained were very helpful in identifying and verifying
ongoing zoning issues. The results demonstrated the difficulty of using a relatively large area
of radiant slab controlled by one thermostat to satisfy comfort requirements in several separate
tenant spaces with different cooling loads. The collected data was also able to show that the east
end of the building served by air handler #2 was receiving a less than desired amount of outside
air. These findings were helpful for the building owner and operator to take corrective action
with the HVAC system configuration and controls.
A student poster was created summarizing the design, control, and application of the radiant
slab cooling system in the DBC. It is attached as Appendix 2.1.1a: Radiant cooling DBC case
study. Energy modeling work with radiant slab systems completed to date is discussed in
Sections 3.1.2 and 3.2.2.
2.1.1.4 Next steps
With separate funding CBE is continuing to collect and analyze trend data from the building
management system (BMS) which includes detailed sub-metered power measurements, as well
as zone temperatures and HVAC operations. Measured performance data of the radiant slab
system will continue to be used for purposes of comparison with and semi-validation of whole-
building energy models.
2.1.1.5 References
Bauman, F., T. Webster, D. Dickerhoff, S. Schiavon, J. Feng, and C. Basu. 2011. Case study
report: David Brower Center. Center for the Built Environment, University of California,
Berkeley. Excerpted from Final Report submitted to California Energy Commission, Public
Interest Energy Research Program.
http://www.cbe.berkeley.edu/research/pdf_files/Bauman2011-Brower-interim-report.pdf
EPA. 2010. “Energy Star Portfolio Manager.” Environmental Protection Agency.
https://www.energystar.gov.

22
2.1.2 California State Teachers’ Retirement System Headquarters
The California State Teachers’ Retirement System (CalSTRS) headquarters in West Sacramento
is a 13-story office tower (Figure 2.1.2-1). The main green elements are: building materials made
of 10 percent recycled content, fritted exterior lobby glass to diffuse sunlight, UFAD, overall
water usage reduced by nearly 40 percent, reduced risk of ozone destruction by using
chlorofluorocarbon-free cooling, refrigeration, and fire protection systems.
Figure 2.1.2-1: CalSTRS Headquarters, Sacramento, CA (Mechanical design by Dave Troup, HOK)
2.1.2.1 Goals
The two main goals of this field study were: (1) to determine the impact of the position of blinds
(100 percent open, closed-horizontal, 100 percent closed) on cooling loads and temperatures in
the building, and thus provide guidance on being controlled in an energy efficient manner, and
(2) to help validate the UFAD design tool created by CBE with measured building data.
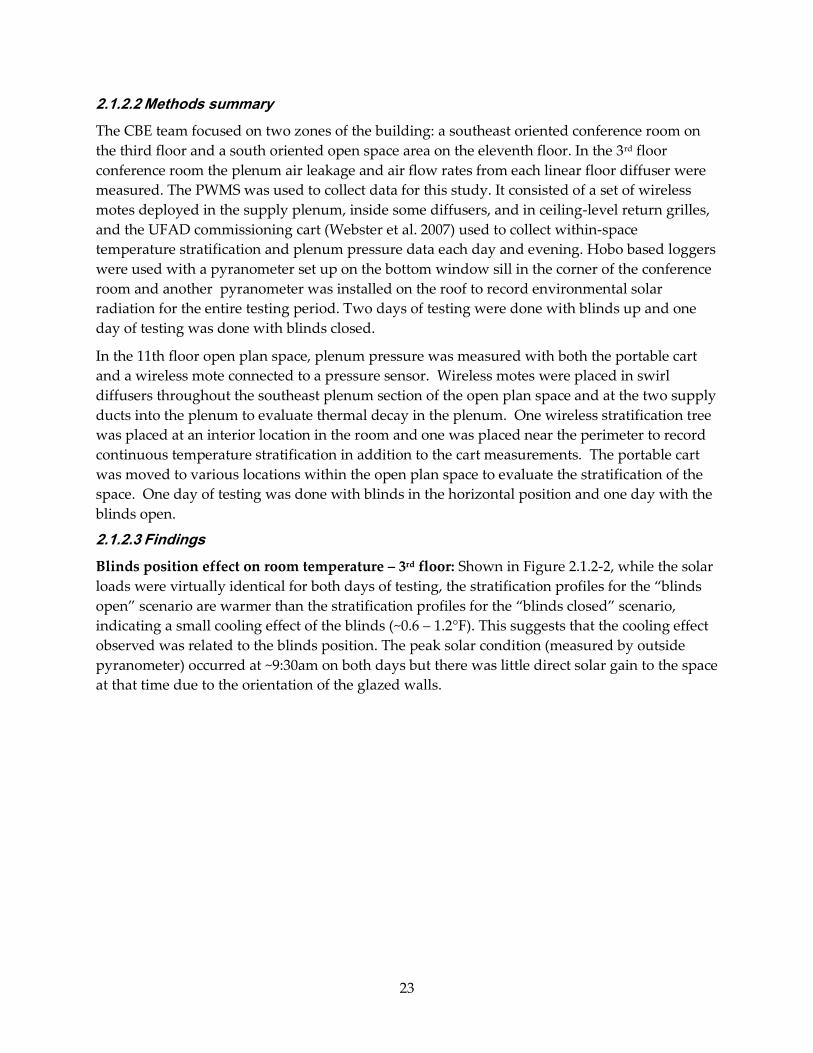
23
2.1.2.2 Methods summary
The CBE team focused on two zones of the building: a southeast oriented conference room on
the third floor and a south oriented open space area on the eleventh floor. In the 3rd floor
conference room the plenum air leakage and air flow rates from each linear floor diffuser were
measured. The PWMS was used to collect data for this study. It consisted of a set of wireless
motes deployed in the supply plenum, inside some diffusers, and in ceiling-level return grilles,
and the UFAD commissioning cart (Webster et al. 2007) used to collect within-space
temperature stratification and plenum pressure data each day and evening. Hobo based loggers
were used with a pyranometer set up on the bottom window sill in the corner of the conference
room and another pyranometer was installed on the roof to record environmental solar
radiation for the entire testing period. Two days of testing were done with blinds up and one
day of testing was done with blinds closed.
In the 11th floor open plan space, plenum pressure was measured with both the portable cart
and a wireless mote connected to a pressure sensor. Wireless motes were placed in swirl
diffusers throughout the southeast plenum section of the open plan space and at the two supply
ducts into the plenum to evaluate thermal decay in the plenum. One wireless stratification tree
was placed at an interior location in the room and one was placed near the perimeter to record
continuous temperature stratification in addition to the cart measurements. The portable cart
was moved to various locations within the open plan space to evaluate the stratification of the
space. One day of testing was done with blinds in the horizontal position and one day with the
blinds open.
2.1.2.3 Findings
Blinds position effect on room temperature – 3rd floor: Shown in Figure 2.1.2-2, while the solar
loads were virtually identical for both days of testing, the stratification profiles for the “blinds
open” scenario are warmer than the stratification profiles for the “blinds closed” scenario,
indicating a small cooling effect of the blinds (~0.6 – 1.2°F). This suggests that the cooling effect
observed was related to the blinds position. The peak solar condition (measured by outside
pyranometer) occurred at ~9:30am on both days but there was little direct solar gain to the space
at that time due to the orientation of the glazed walls.

24
Figure 2.1.2-2: Thermal stratification profiles for blinds scenarios in third floor conference room
Blinds position effect on fan terminal unit airflow – 3rd floor: Figure 2.1.2-3 shows BMS data
(fan terminal unit command airflow, space temperature, setpoint, and supply air temperature
(SAT) for the corresponding two-day time period. Air handler SAT and fan terminal unit (FTU)
discharge temperature BMS data and setpoint are only shown for the occupied time in order to
reduce clutter on the chart and enhance clarity.
Despite the slight cooling effect associated with closed blinds, we do not see an associated
reduction in fan energy during the occupied hours of the day when the system is operational.
The FTU operates the same amount of time above its minimum setting during the closed blinds
scenario and the open blinds scenario (8.5 hours). However, the relationship between FTU
energy and blinds position is confounded by the differing SAT behaviors between the two days.
During the blinds open day, the SAT dropped from 69 degrees Fahrenheit (F) to 65 degrees F
starting at 3:00PM, while the same drop in SAT happens at 4:15PM on the blinds closed day.
This appears to be the result of air handling unit (AHU) SAT resetting. The same operation
characteristics occur on the 11th floor as well.
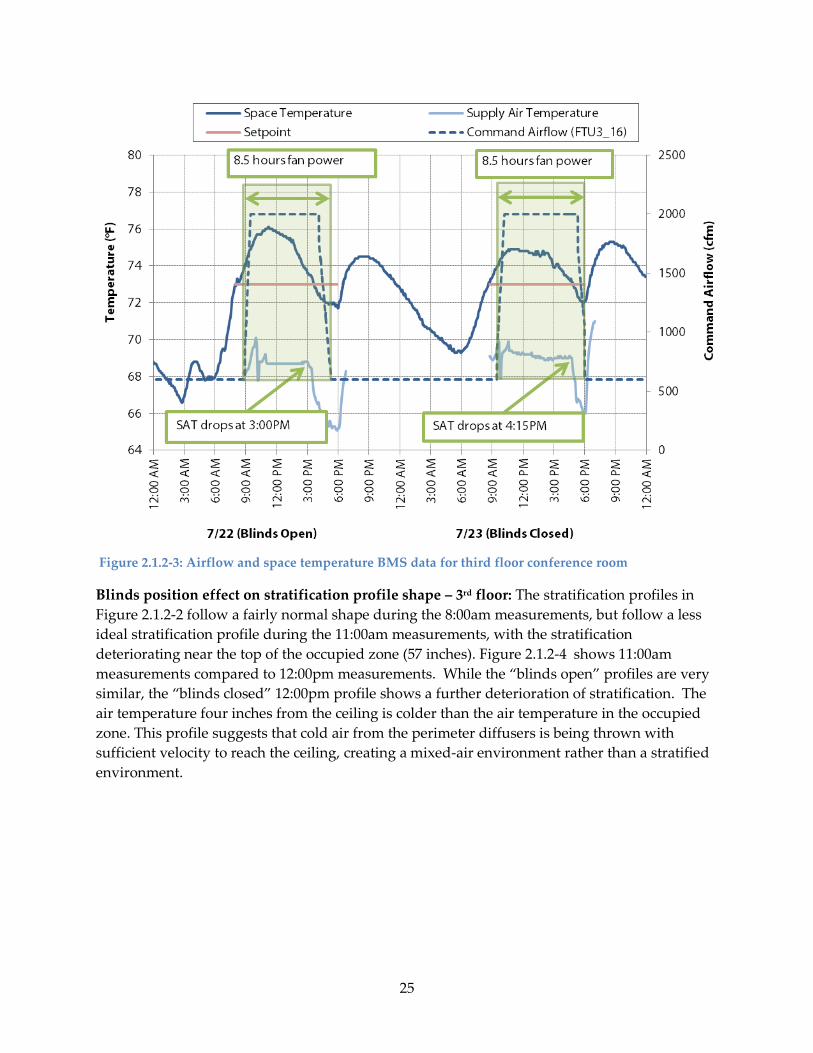
25
Figure 2.1.2-3: Airflow and space temperature BMS data for third floor conference room
Blinds position effect on stratification profile shape – 3rd floor: The stratification profiles in
Figure 2.1.2-2 follow a fairly normal shape during the 8:00am measurements, but follow a less
ideal stratification profile during the 11:00am measurements, with the stratification
deteriorating near the top of the occupied zone (57 inches). Figure 2.1.2-4 shows 11:00am
measurements compared to 12:00pm measurements. While the “blinds open” profiles are very
similar, the “blinds closed” 12:00pm profile shows a further deterioration of stratification. The
air temperature four inches from the ceiling is colder than the air temperature in the occupied
zone. This profile suggests that cold air from the perimeter diffusers is being thrown with
sufficient velocity to reach the ceiling, creating a mixed-air environment rather than a stratified
environment.

26
Figure 2.1.2-4: Thermal stratification profiles for blinds scenarios in third floor conf. room
Blinds position effect on room temperature – 11th floor: Figure 2.1.2-5 shows the average
stratification profiles for the hour-long measurement period on each of the two blinds case
scenarios (horizontal and open). The profiles are very close to each other, indicating that the
system is controlling well and the blinds position is not affecting the temperature in the space.
The stratification profiles for this space were consistent with expectations of a well-performing
UFAD system.

27
Figure 2.1.2-5: Thermal stratification profiles for blinds scenarios in 11th floor open plan space
Figure 2.1.2-6 provides a graphical summary of the performance of the UFAD system in the 11th
floor open plan space. The chart plots average room air temperature stratification against the
average occupied zone air temperature for each location measured on the 11th floor on two days
of testing (blinds open and blinds horizontal). There are two shaded areas representing different
“comfort zones.” The beige shaded area represents the comfort zone as determined by the CBE
comfort modeling study (Zhang et al. 2005). The pink shaded area represents the comfort zone
as determined by American Society of Heating, Refrigeration and Air Conditioning Engineers
(ASHRAE) Standard 55.
All points fall within the two comfort zones and most points fall within the CBE Comfort Model
zone, which we feel provides a more accurate picture of comfortable conditions. There is little
variability in both stratification and occupied zone temperature, indicating good control of the
open plan space to setpoint (73 degrees F). However, the occupied zone temperatures fall on the
colder side of the comfort zone, indicating potential to raise the setpoint for energy savings.

28
Figure 2.1.2-6: UFAD performance summary for 11th floor open plan office
Multi-path leakage test – 3rd floor: From the 3rd floor conference room, air leakage was
measured to areas adjacent to the underfloor plenum, including to the room (Category 2
leakage), to the adjacent underfloor plenums, to the floor below, directly to the return plenum,
and to outside the building. The purpose of this multi-path leakage test is to simultaneously
characterize airflow rates through all major leakage pathways from the underfloor plenum. The
accuracy of this test method has been demonstrated at a few other buildings during the last few
years. Hult, et al (2012) examines the assumptions, analysis methods and accuracy of this test
method.
Table 2.1.2-1 shows the regression coefficients, normal operating pressures and resulting
leakage flows. Note that leakage to/from adjacent underfloor plenums likely still serves an
occupied zone, just not the 3rd floor conference room. Only about 3 percent of the total supply
flow does not go to an occupied zone and total leakage is only 12.7 percent. Leakage to the floor
below, an occupied zone, was assumed to be zero based on separate measurements which
showed no change in leakage flow when this zone pressure was changed. No method of
measuring the pressure to the outside was found and the area between the underfloor plenum
and the outside is small so the leakage to the outside was assumed to be zero.
The equation below shows the results of the regression to determine the other leakage paths.
Where:
Leakage Flow is the total leakage flow in cubic feet per minute (cfm)
Pr is the pressure between the underfloor (UF) plenum and the conference room in Pascals
(Pa)

29
Pnpl is the pressure between the UF plenum and the north adjacent UF plenum [Pa]
Pwpl is the pressure between the UF plenum and the west adjacent UF plenum [Pa]
Prpl is the pressure between the UF plenum and return plenum [Pa]
Ppd is the pressure between the UF plenum and the perimeter duct [Pa]
Note: The equation as shown must have positive pressures. The actual fit uses
sign(Px)*abs(Px)^n in place of Px^n as shown.
Table 2.1.2-1: Leakage and normal operating pressures and flows of leak paths to the 3rd floor
conference room underfloor plenum. Normal operating pressures are for 11 AM to 2 PM on July 20-23,
2010. The flow into the 3rd floor conference room UF plenum was 2000 cfm (commanded by the BMS
system).
Leakage Path
Flow coefficient (k) {for flow in
cfm}
Flow exponent
(n) Normal operating
pressure (Pa)
Normal operating flow (cfm)
Leakage, % of Normal
operating flow
Room 10.88 .545 15.0 48.2 2.4
North UF Plenum
37.47 .500 13.8 138.9 6.9
West UF Plenum
0.67 1.000 14.8 9.9 0.5
Floor below 0 (forced) N/A N/A N/A 0.0
Return Plenum 11.79 .568 17.3 57.4 2.9
Outside 0 (forced) N/A N/A 0 0.0
Perimeter Duct 5.95 .852 N/A N/A N/A
Total Leakage 12.7
2.1.2.4 Conclusions
The final report, included as Appendix 2.1.2: CALSTRS Internal Report (Webster et al. 2011)
contains a complete description of testing and detailed analysis of the results. The primary
conclusions were:
1. Results from testing with blinds open vs. closed (3rd floor) and vs. horizontal (11th floor)
suggest a positive impact on room load for closed blinds but little impact due to
horizontal blinds.
2. More definitive results were compromised however by the fact that the fan coil units
(FCU)s were undersized for the supply temperatures being used. Thus the room
temperatures were not well controlled, especially on the 3rd floor. They were better on
the 11th floor but the FCUs were still running at maximum capacity throughout much of
the day in both places.
3. Further complicating the results was the impact of high airflows on stratification. In the
3rd floor conference room two observations were made; in one case the stratification
profiles showed a marked increase in temperature near the ceiling when blinds were

30
closed. This is consistent with our hypothesis that a strong window thermal plume
exists that draws warm air up to the ceiling and tends to reduce the cooling load in the
lower occupied region of the zone. This effect was not observed on the 11th floor with the
blinds horizontal. On the other hand, we also observed that high diffuser airflows
impinging on the ceiling tended to destroy stratification causing erratic looking profiles.
The behavior demonstrated in these tests highlights the dilemma with UFAD systems. Unless
the units are sized for high SATs they will not be able to meet the load and their high airflow
compromises the stratification, further aggravating control of the space load. These effects can
be ameliorated by either installing more (or different, low throw) diffusers and/or by lowering
AHU SAT. However, lowering AHU SAT tends to end up overcooling the interior spaces.
Raising the space setpoint would help all of these issues; the fact that the spaces operate at the
lower end of the comfort envelope indicates that comfort would not be adversely affected by
increased setpoints.
2.1.2.5 References
Hult, E., D. Dickerhoff, P. Price. 2012. Measurement Methods to Determine Air Leakage
Between Adjacent Zones. LBNL # LBNL-5887E.
Webster, T., F. Bauman, and G. Anwar. 2007. CBE Portable Wireless Monitoring System
(PWMS): UFAD systems commissioning cart design specifications and operating manual.
Webster, T., F. Bauman, D. Heinzerling, S. Schiavon, and D. Dickerhoff. 2011. Technical Report
on California State Teachers Retirement System Building: UFAD Performance and Blinds
Study. CBE internal report. Center for the Built Environment, August.
Zhang, H., C. Huizenga, E. Arens, and T. Yu. 2005. Modeling Thermal Comfort in Stratified
Environments. Proceedings of Indoor Air 2005, Beijing, 133 – 137.

31
2.1.3 The New York Times Building
The New York Times (NYT) Building is a 52-story high performance office building in
downtown Manhattan (Figure 2.1.3-1). The NYT Building has attracted interest nationally due
to its key innovative energy efficiency measures installed in the building, including advanced
external shading, automatic internal shading control, dimmable electric lighting, and UFAD.
Figure 2.1.3-1: The New York Times Building, New York, NY
2.1.3.1 Goals
The purpose of this study was to conduct a detailed post-occupancy evaluation (POE) of The
NYT Building. Researchers from CBE at University of California, Berkeley (UCB) and Lawrence
Berkeley National Laboratory (LBNL) collaborated on this study; CBE focused on evaluating
the performance of the UFAD system, while LBNL studied the shading and lighting
performance. This POE study was primarily sponsored by United States Department of Energy
(U.S. DOE)’s Commercial Buildings Partnerships (CBP) Program, that encourages building
owners and operators to collaborate with research staff at national laboratories and universities
to explore energy-saving ideas and strategies in retrofit and new construction projects. It was
hoped that some of the innovations used in The NYT Building could become a model and
prototype for larger scale implementation and replication in new and existing buildings in New
York and nationally. The California Energy Commission (Energy Commission) Public Interest

32
Energy Research (PIER) program provided partial co-funding to enable CBE researchers to
conduct more in-depth field measurements and analysis, as well as to extend their efforts to
complete the EnergyPlus energy modeling work.
2.1.3.2 Measurement results
The approach used in this field study was to carefully monitor building performance data on
one typical tower floor to determine lighting energy use, UFAD operations, and other loads
within the open plan office zones. Monitored data was then used to create a semi-empirical 1
models of some end use components in a specially developed whole-building energy
simulation model of one tower floor of The NYT Building using EnergyPlus. The whole
building model is capable of representing the combined energy performance of the shading,
dimmable lighting, and UFAD systems. This model was then used to assess potential energy
savings in comparison to an ASHRAE Standard 90.1 reference prototype building. In this
section, we provide a brief summary of field measurement findings. Full details of the
measurements and analysis are contained in Appendix 2.1.3. Further discussion of the
EnergyPlus modeling work is described in Section 3.2.1.4.
During the first field visit (August 22-26, 2011), an array of wireless sensors was deployed to
measure temperature, water flow, and power on the 20th floor of The NYT Building (see Figure
2.1.3-2). These wireless sensors continuously monitored conditions over the entire study period
(August 25, 2011 – January 9, 2012) and transferred data to our data server in Berkeley in real
time. As shown in the figure, the following types of measurements were made:
Room air stratification.
Underfloor plenum temperatures.
Perimeter floor grille supply air temperature.
Underfloor fan powered box (FPB) inlet temperature.
Chilled water supply/return temperature.
Electrical panel submeter.
Figure 2.1.3-3 presents a photo and representative measured hourly vertical temperature profile
from the stratification poles located in the east interior zone. Data are shown for one day,
9/14/2011, during warm weather. Results for this interior zone indicate that a reasonable
amount of stratification (2-3 degrees F) is achieved in the occupied zone, as indicated by the
difference in temperature between standing head height (67 inches) and ankle height (4 inches).
Note that the warmest temperatures occurred at 10 AM and 12 PM noon, matching the expected
1 Semi-empirical modeling refers to the practice of using field measurements to create empirically based
models for the most obvious components (e.g., internal loads, HVAC components) where measurements
were available. This is typically a step before a more thorough calibration effort using parametric studies
to match measured vs. simulated results more precisely. Only the first step was conducted for this project
and used in two studies, one reported in this section and the other in Section 3.2.1.4 (see also Appendix
3.2.4)

33
peak solar load for this east-facing zone. Stratification is one indicator of good UFAD cooling
performance because it demonstrates how comfortable conditions can be maintained in the
lower occupied zone, while allowing warmer and less comfortable conditions to exist in the
higher space elevations; in general, energy can be saved by increasing the setpoints (thus
lowering the airflow and reducing cooling) while still allowing the average conditions in the
occupied zone to remain comfortable. In the case of The NYT Building, the interior zone
thermostats are all located at a height of 84 inches (for architectural reasons). The Times
Company has implemented an interior zone setpoint temperature offset to account for the
effects of stratification.

34
Figure 2.1.3-2: Map of wireless sensors deployed on 20th floor of The NYT Building

35
0
10
20
30
40
50
60
70
80
90
69 70 71 72 73 74 75
He
igh
t (i
n.)
Temperature (°F)
8:00 AM
10:00 AM
12:00 PM
2:00 PM
4:00 PM
6:00 PM
a) Photo of pole b) Temperature vs. height
Figure 2.1.3-3: East interior zone stratification pole and example hourly temperature profiles, 9/14/2011
Figure 2.1.3-4 shows an example of average daily measured profiles for plug loads on the 20th
floor. Each separate line in the figures is based on data collected during an entire month, as
indicated. The two figures show average weekday and weekend plug loads (watts per square
foot (W/ft2)), respectively. The plug load profiles reveal a slight seasonal dependence with
somewhat reduced loads in the winter; ~0.6 – 0.7 W/ ft2 at peak, and 0.3 W/ ft2 at nights and
weekends. The flat pattern of use on weekends demonstrates that this particular floor of The
NYT Building has very limited occupancy.
Example results for all monitored parameters are presented and discussed in the New York
Times Building Field Measurement Report contained in Appendix 2.1.3.

36
Figure 2.1.3-4: Monthly weekday and weekend average plug load profiles
2.1.3.3 Lessons learned
Overall, the operators have done an excellent job of navigating among a number of issues
related to the control setpoints and interior versus perimeter comfort control (summarized on
page 18 of Appendix 2.1.3) to provide an acceptable comfort level (see survey results). Several
recommendations are contained in Appendix 2.1.3 that could move overall comfort in a more
positive direction.
Lessons learned drawing from the analysis of The NYT Building, as well as experiences of the
authors with other UFAD systems are as follows:
1. Cooling setpoints: As described above, cooling setpoints should be set higher than
conventional practice with overhead (OH) systems to account for stratification and
combat overcooling (a pervasive problem in the industry).
2. Heating setpoints may need to be set higher when large window to wall ratios are used
(as in the NYT Building).
3. It is recommended that a deadband of 2-3 degrees F minimum be used between heating
and cooling setpoints.
4. AHU SAT settings (and reset) should be decided on the basis of the impact on interior
zone comfort, minimum ventilation rates, and terminal unit sizing and potential cooling
setpoints.
5. Linear bar grilles at the perimeter, while good for heating, provide challenges for
desirable cooling (stratified) performance due to the increased mixing caused by the
discharged air into the space.

37
The implementation of an UFAD system in The NYT Building proved to be very successful for
both The NYT Building management and workforce. Based on the high level of satisfaction
reported in the survey responses, the thermal comfort and indoor environmental quality
provided by the UFAD system in combination with the other energy efficiency measures were
well received. As discussed previously, whole-building energy modeling results indicate that
the building also performed very efficiently compared to a code-compliant baseline building.
Beyond the careful selection of complementary advanced energy efficient technologies, the
overriding reason behind the high quality environment achieved at The NYT Building was the
commitment and attention paid to installing and commissioning the various systems over time.
In the case of the UFAD system, operators were able to fine-tune control strategies and
thermostat setpoints to provide a thermal environment that was stable and comfortable across
the entire floorplate. Due to this consistent operation and reduced occupant complaints, the
operators expressed strong support for the choice of a UFAD system.
A full discussion of all lessons learned and recommendations for improved operation of the
UFAD system at The NYT Building are presented in Appendix 2.1.3. An overall final report on
the collaborative project between LBNL, CBE, and NYT staff is reported by Lee et al. (2013).
2.1.3.4 References
Lee, E.S., L.L. Fernandes, B. Coffey, A. McNeil, R. Clear, T. Webster, F. Bauman, D. Dickerhoff,
D. Heinzerling, and T. Hoyt. 2013. A Post-Occupancy Monitored Evaluation of the
Dimmable Lighting, Automated Shading, and Underfloor Air Distribution System in The
New York Times Building. Lawerence Berkeley National Laboratory Report LBNL-6023E,
January. http://buildings.lbl.gov/sites/all/files/lbnl-6023e.pdf

38
2.2 Monitoring and Commissioning Wireless Hardware Devices and Procedures
The goal of Task 2.2 is to further develop our monitoring, diagnosing, and commissioning tools
with additional analysis capability and wireless mesh networking, in order to expand the
number and effectiveness of their applications. Real-time remote monitoring and feedback are
essential for the efficient commissioning and operation of buildings, and demonstrating the
effectiveness of these wireless tools is essential in encouraging their adoption by the industry.
2.2.1 Wireless Monitoring System Development
2.2.1.1 Goals
The goals of this project are to: (1) upgrade our existing mobile measurement cart to an “all
wireless” version; (2) implement a new system architecture that relies on a remote server that
supports multiple analysis applications, as well as data archiving; and (3) demonstrate
connectivity to BMS to acquire this data concurrently with the wireless data.
2.2.1.2 Summary of accomplishments
The following summarizes development activities over the period of this contract that were
instrumental and supportive to the development the Building Performance Evaluation (BPE)
Toolkit system funded under California Institute for Energy and Environment (CIEE)/Energy
Commission PIER “Wireless Measurement Tools for Better Indoor Environments” (contract No.
500-10-048).
Wireless technology investigations. We conducted a study of newer nascent wireless mesh
networking products and tested one of these (ArchRock) in the DBC (that turns out to be a
rigorous test bed due to its high thermal mass) against our current technology based on Dust
Networks products as implemented by Federspiel Controls (now Vigilent). The results were
dramatic in that the alternative system required a very dense network and repeaters plus two
weeks of trouble shooting and technical support help to set up. In comparison, our current
technology was implemented within about two hours with a much less dense network. This
confirmed that networking capabilities are important for systems such as these since it is
intended for short term monitoring and diverse spacing of sensors and rapid deployment.
System architecture development. A major challenge facing indoor environmental quality
(IEQ) measurement lies in the connection of each of the required pieces. Traditionally, IEQ
measurement consisted of using sensors/devices that independently stored measurements in
on-board storage; thus, there was no connection between measurement devices. This lack of
connection includes communication, power, and metadata relationships. These connections
represent a major usability hurdle of tradition IEQ measurement. Advances in wireless
technology have brought the price and reliability of wireless mesh sensor networks into a range
viable for use in IEQ measurement. These networks provide a communication connection
between sensors and allow a single point of data storage. The system architecture shown in
Figure 2.2.1-1 is an evolution of the preliminary version used for the original PWMS, the New
York Times Commissioning Cart (Webster et al. 2007). As illustrated in Figure 2.2.1-1, a set of

39
sensors/devices at the building level is connected to wireless motes that transmit data to a local
buffering database. This buffering database is connected to the Internet via either a building
network connection or a cellular broadband connection. Data is sent through this Internet
connection to an application server located outside of the building. Because the data is
accessible through the Internet, data access is possible from inside and outside of the building
network. To accommodate the architecture, the wireless network system was upgraded with the
latest Federspiel Controls software tools and 15 motes were added. A remote server was
deployed and successfully demonstrated that data could be transferred to and from it via cell
net modems (Sprint data service).
Internet
Remote Analysis
Monitoring and
Analysis computers
Broadband Router
Wireless Measurement
System (WMS)
Base StationWireless network
manager
Mote mesh network
UPS
Remote Cx
On-site cart or site laptop
Application Server (AS) Hosted Archive DBApplications server
BMS Interface
Cel
l Net
Cell N
et
Figure 2.2.1-1: “All wireless” monitoring system architecture
Performance Measurement Protocol development. ASHRAE/Chartered Institute of Building
Service Engineers (CIBSE)/United States Green Building Council (USGBC) Performance
Measurement Protocols (PMP) (ASHRAE 2010) became a central focus of the work on this
project since it provides a framework for the types of IEQ measurements needed and methods
for evaluating the data against standards and benchmarks.

40
Kresge field test. In conjunction with Task 2.1 protocols development, we employed a
transition version of the “all wireless” system to support case studies work at two Kresge
Foundation (Figure 2.2.1-2) field tests in March and August, 2010 where measurements were
made at PMP Level 1 and some at Level 2. See Goins (2011) for complete details of this
comprehensive case study.
Figure 2.2.1-2: Kresge Foundation headquarters building
We found that one of the main limitations of the PMP is related to the evaluation of acoustical
quality. However, it was also found that the Level 2 measurements were very useful for
understanding thermal comfort performance based on measurements (see Figure 2.2.1-3)
relative to the occupant survey results. The occupant survey alone does not provide enough
information to fully characterize comfort performance.

41
Figure 2.2.1-3: Stratification measurements and results display at Kresge Foundation
Likewise, energy performance is not adequately covered by the EnergyStar rating system,
especially, as in the case of the Kresge project, if results show a low score. Valuable additional
information was obtained from the more detailed Level 2 measurements that helped to explain
the low score.
During the period of June 2010 to July 2011, we continued development of the PWMS with
special emphasis on adding instrumentation and support for ASHRAE PMP measurements.
We conducted a proof of concept study using a prototype PWMS in the DBC, in May-June 2010.
Although this system did not have the full complement of PMP measurements, it did
demonstrate that devices other than temperature sensors on the motes were feasible. We also
confirmed the feasibility of the “all wireless” version of the stratification tree. All data collected
was uploaded to a CBE central server for subsequent review and analysis.
Analytics software investigations – Simple Monitoring and Actuation Protocol. To support
frontend data analysis and visualization we embarked on seeking a replacement for our
LabView system used on the NYT Building project. We began working with Controlco to use
their new system frontend product, Prophet, to serve as a base for data archiving and to support
our applications tools. However, it turned out to be cumbersome and difficult to modify to suit
the needs of this project. In the meantime, we found that the LoCal (A Network Architecture for
Localized Electrical Energy Reduction, Generation and Sharing) group in the UCB Electrical
Engineering & Computer Sciences (EECS) department was working on a new data base schema
for central data archiving and applications server named Simple Monitoring and Actuation
Protocol (sMAP); see Figure 2.2.1-4 (Dawson-Haggerty et al. 2010). sMAP is a set of tools to
enable simple and efficient exchange of time-series data through web-enabled applications. The
key feature of this system is much faster response then using traditional relational databases
(e.g., MySQL) that we used previously and tried to interface with the Controlco front end. We

42
began working closely with the EECS sMAP team and commenced architecting methods for
presenting this data via a web browser via sMAP application programming interfaces (APIs)
and additional middleware software.
Figure 2.2.1-4: sMAP architecture illustration
New York Times field study. Further improvements were made in the PWMS in preparation
for supporting a new study of The NYT Building under the CBP program at U.S. DOE; we were
subcontracted by LBNL for this work. The field work started in late August 2011. 25 motes were
added to the existing 30 mote system, some were used to construct several wireless stratification
trees. Plug and lighting loads were measured at floor panels as well as air handler power and
chilled water flow as shown in Figures 2.2.1-5.
All of these extensions of the PWMS are necessary to support Level 2 and 3 measurements of
the PMP. This study also tested the feasibility of using 4G cellnet modems for data acquisition
to the sMAP server.
The data collected along with BMS data were used to analyze the operations and to create semi-
empirical models for end use components in an EnergyPlus simulation model (see Sections 2.1.2
and 3.1.1.2). The system performed exceptionally well, setup and initiation of data collection
was relatively quick, although deployment of 55 motes took a few hours.

43
Figure 2.2.1-5a:
Stratification tree
Figure 2.2.1-5b:
Stratification cart
Figure 2.2.1-5c: Power
metering
Figure 2.2.1-5d: Chilled
water flow and
temperature metering
Building performance evaluation Toolkit project. During July 2011 we received a new contract
to develop a PMP-centric all wireless system based on the PWMS. The following descriptions
were excerpted from the project documents to provide a preview of its capabilities.
In the development of this system, we departed to some extent from strict adherence to the
PMP, most notably, with the addition of an IEQ scoring capability. For this system prototypes
based on a new Dust Networks advanced mesh networking system were developed. The
devices from this system have expanded input/output (I/O) capabilities, better battery life, on-
board programmability, and time of flight (TOF) location sensing, and operate at 2.4 gigahertz
frequency. The devices also include the latest enhancements to the 801.15.4 standard of the
Institute of Electrical and Electronics Engineers (IEEE) standard networking protocols. These
more advanced capabilities make it more feasible to accomplish the goals of the wireless
monitoring system development:
Fast, robust deployment of sensors.
Real-time analysis of data.
Built-in PMP-based analysis methods.
Scorecard and report generation tools.
Key parts of the BPE toolkit are the indoor comfort monitors (ICM), Figure 2.2.1-6; the backend
system supported by the sMAP based archiving database discussed above; the web-based
analytics software shown in Figure 2.2.1-7 and 8; and the scorecard system shown in Figure
2.2.1-9. The ICM, in its final version, supports six IEQ sensors with all data sent through the
wireless mesh network to the (cloud-based) server where it is accessible via a standard web

44
browser. The embedded analytics present the post processed data in near real time in a variety
of displays depending on the IEQ category.
Figure 2.2.1-6: BPE Toolkit ICM
Figure 2.2.1-7: Example of sMAP trending data visualization

45
Figure 2.2.1-8: Example of map-based sensor placement tool

46
Figure 2.2.1-9: Example of scoring system presentation screen
2.2.2 Conclusions
2.2.2.1 BPE toolkit
Work done on development of the PWMS culminated in the development of the BPE Toolkit, an
advanced version of the PWMS and PMP Toolkit discussed above that is summarized in
Appendix 2.2.1: BPE Toolkit specifications, Appendix 2.2.2: Toolkit hardware device report, and
by Heinzerling (Heinzerling 2012) .
Based on results of these two projects the “all wireless” IEQ monitoring system feasibility has
been proven. It is also, apparent that the quality of the mesh networking communications is
critical to successful application of this technology, the multiple sensing platform (such as the
ICM) is a major time and effort saver, and that there is great promise in further development of

47
the scorecard procedures developed in the BPE Toolkit project. Reiterated in the following are
the main benefits discovered through the development and field testing of the BPE Toolkit as
reported in the project final report.
The wireless mesh network system creates a robust internet-connected series of low-
power sensors and devices that are quickly deployed and provide real-time data
immediately after deployment.
The ease of deployment and built-in analysis and reporting methods allows practitioners
to diagnose IEQ issues quickly and provide a summary of performance to the building
owner.
The Graphic Information System (GIS)-based web-enabled metadata collection system
combined with PMP-based analysis and reporting reduced deployment and analysis
time by at least a factor of four for our projects.
The open-source application platform can be used by anyone and improved by the
community or adapted to other uses.
The decreasing cost of wireless equipment and sensors, as well as the significantly
reduced labor costs of quick deployment and analysis makes such systems cost-feasible
even at relatively small economies of scale.
A path toward commercialization could be viable with hardware manufacturing
support and support from building rating systems and relevant standards.
2.2.2.2 Path toward commercialization
Commercialization of a product is a complex task with many players. This section is not
intended to serve as an exhaustive analysis of the feasibility of commercializing the BPE Toolkit,
but rather a short discussion of some of the immediate needs on a path toward
commercialization. The primary driver toward commercialization is ensuring that features add
value for the users. A primary barrier to IEQ measurement as standard practice has been
unclear value for owners. With decreased hardware costs and labor costs associated with data
collection and analysis, we feel that IEQ measurement systems such as the BPE Toolkit have
potential to generate market interest. Future work showing connections between occupant
satisfaction with indoor environmental quality and productivity and retention rates would help
drive market feasibility. Other avenues toward improving market feasibility include
establishment of the requirements for IEQ monitoring in high performance building rating
systems (through industry and agency sources (USGBC, ASHRAE, Energy Commission, U.S.
DOE etc.); as well as solutions that enhance the workflows of building operators and
commissioning agents. To move toward these goals, the primary steps involve improving ease-
of-use, reliability, and cost of the Toolkit. While the first two steps will happen as a result of
increased use and further development from our group, the third step requires interest from a
hardware manufacturer. We believe that ICM and portable underfloor commissioning cart
(PUCC) wireless devices could be made at quantity for reasonable cost. Consulting firms
interested in the Toolkit suggested that an overall price of $10,000 would be a reasonable
investment for the purposes of IEQ performance evaluation. Given the rapidly falling price of
wireless sensors, we feel that a system with 20 ICMs could be built within this budget if a

48
limited number of anemometers and illuminance meters (the two most expensive sensors) were
included. Borrow/rental programs like Pacific Gas and Energy’s tool lending library (PEC)
could also be another feasible route for getting this type of system into the marketplace.
2.2.3 References
ASHRAE. 2010. Performance measurement protocols for commercial buildings. Atlanta:
American Society of Heating, Refrigerating, and Air-Conditioning Engineers.
Dawson-Haggerty, S., X. Jiang, G. Tolle, J. Ortiz, and D. Culler. 2010. sMAP – a Simple
Measurement and Actuation Profile for Physical Information. Association for Computing
Machinery, 197-210.
Goins, J. 2011. Case study of Kresge Foundation office complex. Final report.
http://escholarship.org/uc/item/30h937bh
Heinzerling, D. 2012. Commercial Building Indoor Environmental Quality Evaluation: Methods and
Tools. http://escholarship.org/uc/item/2f6562grPEC. Pacific Energy Center: Tool Lending
Library n.d.
Webster, T., F. Bauman, and G. Anwar. 2007. CBE Portable Wireless Monitoring System
(PWMS): UFAD systems commissioning cart design specifications and operating manual.

49
2.3 Building Performance Feedback Systems
The goals of this work are: (1) to identify the optimal methods for displaying building
performance information, in order to influence commercial building occupants to reduce
resource use; (2) to identify methods to provide actionable information in order to assist
building operators in achieving improved building performance; (3) to develop methods to
include occupant feedback in these information displays, based on previous work conducted at
CBE on occupant comfort and workplace satisfaction; and (4) to develop and test user interfaces
for building data with various building stakeholders.
2.3.1 Description of research methods
This study was carried out in two phases, an initial discovery phase followed by a design and
subject test phase. The first phase consisted of four related research tasks: (1) conducting
reviews of commercial energy dashboards to understand their features and capabilities; (2) a
survey of expert users to assess the information needs, preferences and practices of users such
as facility managers, designers and architects, and building occupants; (3) contextual inquiries
and interviews of these expert users; and (4) the implementation of an energy information
survey of workplace occupants.
A key discovery from the first phase was an industry need for better methods for
communication between occupants and operators, as well as ways to engage occupants so that
they may be more aware of building energy and operation, with the hope that they may adopt
energy-conserving behaviors. For the second phase we developed and tested a prototype of a
social media application intended to fill this industry need.
2.3.2 Phase One: A Study of Tools, Expert Users, and Building Occupants
The research team reviewed a number of commercial building information products. We
selected products having established customer bases, that attempt to provide visually
interesting displays of information, and/or that offer user interfaces appropriate for a range of
users, such as facility managers, building occupants, or students. These products and the
companies that produce them are evolving rapidly, so CBE’s report provides a snapshot of
trends at the time of this investigation, conducted in the spring of 2010. The research team
identified many products with promise for providing useful feedback about energy use, and
anecdotal evidence that the use of these products is indeed leading to energy savings. This
research is reported in the Appendix 2.3.1: Info Visualizing of this report.
2.3.2.1 Information Practices and Preferences of Expert Users
We implemented an “expert user” survey to gather information from users who are highly
familiar with energy monitoring and analysis, and who may be able to influence (to varying
degrees) energy performance in commercial buildings. The survey asked about current sources
and types of building performance information that people have access to, and frequency of
their use of this information. Another section asked respondents to rate the usefulness of several
types of energy information. The final section included background questions on the users’
demographics and computer use patterns. We received 70 responses from a wide variety of
building energy experts including design engineers, building operators, architects, and others.
50
We also conducted interviews with six expert user subjects having a variety of information and
data visualization needs and practices. Each inquiry included a semi-structured interview with
subjects to learn about their backgrounds in energy management, current sources of energy
information, frequency of access, and their interaction with occupants. We also asked subjects to
demonstrate the tools they used to view building information with an attention to the
commonly used features. We asked them about the shortcomings with the current sources of
information, additional building information not available but that might be useful, and about
their experience and preferences for interacting with the occupants.
Results from the study of expert users were presented as a peer-reviewed paper at the
American Council for an Energy-Efficient Economy (ACEEE) Summer Study on Energy
Efficiency in Buildings 2010 (Lehrer and Vasudev 2010), and are included in Section 3 of
Appendix 2.3.1: Info Visualizing.
2.3.2.2 Key Findings from Expert User Study
Although our interview subjects varied in terms of information needs and access to energy
information, they reported a common number of unmet information needs that we summarize
below. As part of our interview process, we asked the subjects to imagine and describe their
ideal energy visualization tools; the responses to this question are revealing and some are
included in this summary. The following list summarizes the key information needs observed
in the interviews of expert users.
High-level overview with drill-down capabilities, including visualization of end-use energy
information including lighting, plug loads, and HVAC components. The interview subjects
use energy information tools infrequently, supporting our survey findings. They require a
visualization that provides a quick overview, with an ability to get detailed information when
needed. One group of subjects described an ideal visualization tool as a cross between a
dashboard-style product with overviews of daily and weekly energy use, combined with the
capability of the BMS system, including alarms to identify anomalies.
Integration of energy visualization features with data analysis. Many users rely on data
downloaded from BMSs and then manipulated it in spreadsheet programs. The ability to filter
and generate energy analyses in tabular or graphical form directly from the energy monitoring
system would be a great time saver for these users.
Support for normalization and energy benchmarking. Several interview subjects cited the
need to accurately benchmark between buildings, including normalized values and energy use
intensity.
Compatibility with existing BMSs. The multiplicity of systems, proprietary BMS protocols,
and lack of interoperability were common complaints. Some interview subjects described an
ideal tool that would be based on open source products that could be built in a modular fashion
with the flexibility of web-enabled tools.
Support for occupant interaction capability. Several of the interview subjects stated a desire to
have better interaction with building occupants, a finding that supports our survey results. One
group of subjects believed that that they would benefit from an ability to record occupant
discomfort with time and location data that could be compared to BMS data for diagnostics. The

51
most common sources of energy information to workplace occupants are word-of-mouth from
co-workers or managers.
2.3.2.3 Survey of Workplace Occupants
Finally, we implemented a workplace energy survey to investigate energy attitudes and
behaviors of occupants in commercial buildings, and to explore the potential for energy
feedback to promote energy conserving behaviors. The survey asked about people’s energy use
in their workplace environments; specifically, about their current sources of energy information,
energy use sensibilities, and efforts towards energy conservation. We also asked people about
the kinds of energy information that might be useful for saving energy and the preferred
methods for display. We received 170 responses to this survey from the occupants of four
educational and office buildings. Our report shows occupants’ preferences for getting energy
information, their motivations for saving energy at work, and compares the relationship
between reported energy conservation at work and at home. While more comprehensive
research on this topic is needed, the results provide insights regarding what energy information
commercial building occupants have, what energy actions they take, and their motivations for
doing so. These results are described in detail in Section 4 of Appendix 2.3.1: Info Visualizing.
2.3.2.4 Key Findings from Workplace Occupant Study
Although few occupants can access building energy information currently, our survey reveals
that web applications are the most preferred medium for accessing such information.
A large majority of workplace occupants claim that they already take actions to save energy,
and that they would do more if they got feedback on either the amount or related cost of energy
used. Similar to the expert survey, the occupant survey also reveals an interest in seeing energy
use for the entire building, and also broken down by end use, by floor or department, and/or at
the level of individual workspaces. This finding was studied in greater detail in phase two,
described below.
2.3.3 Phase 2: Evaluating a Social Media Application for Sustainability in the Workplace
From the phase-one study CBE’s research team learned that over 90 percent of the expert users
surveyed expressed a desire for a more systematic way of communicating with workplace
occupants. The most common ways these expert users currently get feedback from occupants is
through discussions with occupants, email, phone, anecdotal information, and via complaints
logged in a BMS. A shortcoming of these communications is that they primarily provide one-
way communication from workplace occupants to building managers. Although these sources
allow workplace occupants to register their individual feedback, they remain largely unaware
of their peers’ concerns. Also, existing complaint-based systems primarily focus on identifying
problems, and show a negative bias that may not represent a complete picture of a building’s
operation.
As a response to these shortcomings, the research team envisioned a web-based portal where
the workplace occupants and managers can collaboratively discuss issues related to the
workplace environment, including energy use, problems, and solutions. We hypothesize that a
social media network, on the scale of a single office building or corporate campus, can provide a
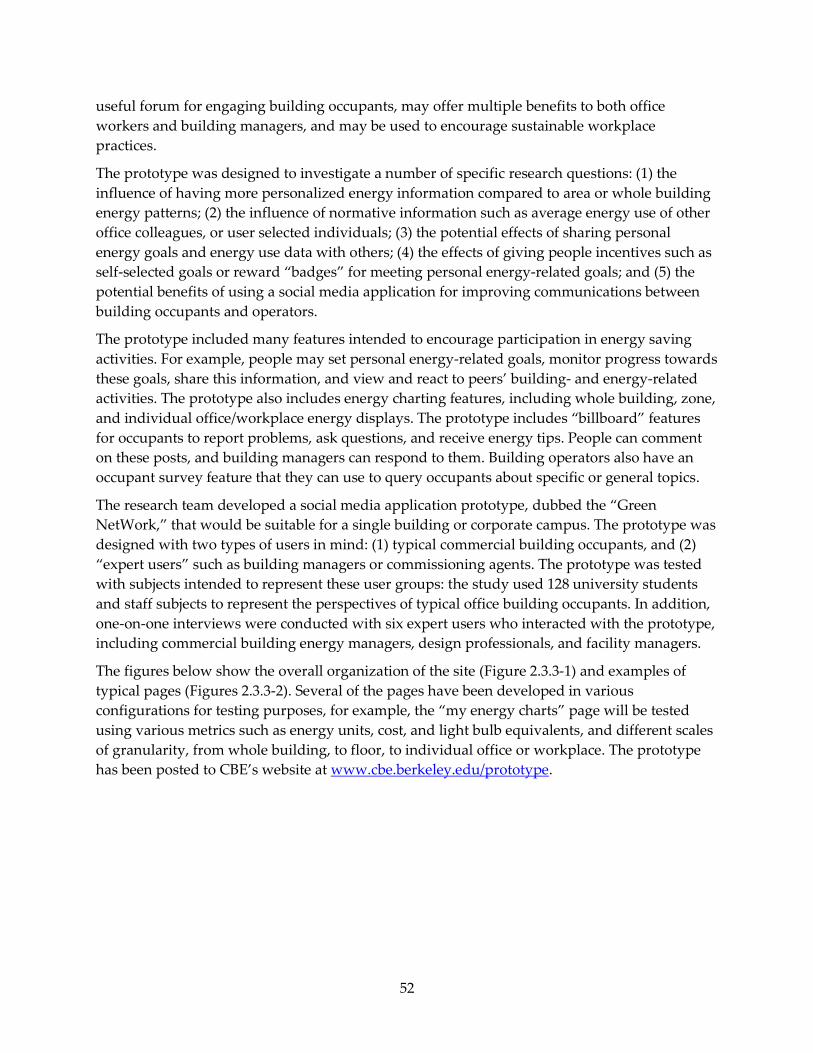
52
useful forum for engaging building occupants, may offer multiple benefits to both office
workers and building managers, and may be used to encourage sustainable workplace
practices.
The prototype was designed to investigate a number of specific research questions: (1) the
influence of having more personalized energy information compared to area or whole building
energy patterns; (2) the influence of normative information such as average energy use of other
office colleagues, or user selected individuals; (3) the potential effects of sharing personal
energy goals and energy use data with others; (4) the effects of giving people incentives such as
self-selected goals or reward “badges” for meeting personal energy-related goals; and (5) the
potential benefits of using a social media application for improving communications between
building occupants and operators.
The prototype included many features intended to encourage participation in energy saving
activities. For example, people may set personal energy-related goals, monitor progress towards
these goals, share this information, and view and react to peers’ building- and energy-related
activities. The prototype also includes energy charting features, including whole building, zone,
and individual office/workplace energy displays. The prototype includes “billboard” features
for occupants to report problems, ask questions, and receive energy tips. People can comment
on these posts, and building managers can respond to them. Building operators also have an
occupant survey feature that they can use to query occupants about specific or general topics.
The research team developed a social media application prototype, dubbed the “Green
NetWork,” that would be suitable for a single building or corporate campus. The prototype was
designed with two types of users in mind: (1) typical commercial building occupants, and (2)
“expert users” such as building managers or commissioning agents. The prototype was tested
with subjects intended to represent these user groups: the study used 128 university students
and staff subjects to represent the perspectives of typical office building occupants. In addition,
one-on-one interviews were conducted with six expert users who interacted with the prototype,
including commercial building energy managers, design professionals, and facility managers.
The figures below show the overall organization of the site (Figure 2.3.3-1) and examples of
typical pages (Figures 2.3.3-2). Several of the pages have been developed in various
configurations for testing purposes, for example, the “my energy charts” page will be tested
using various metrics such as energy units, cost, and light bulb equivalents, and different scales
of granularity, from whole building, to floor, to individual office or workplace. The prototype
has been posted to CBE’s website at www.cbe.berkeley.edu/prototype.

53
Figure 2.3.3-1: Site map for the building energy and social media application
Figure 2.3.3-2a: Individual
energy goals page
Figure 2.3.3-2b: Energy use
shown by floor level (energy
competition)
Figure 2.3.3-2c: Billboard page
2.3.3.1 Testing with Workplace Occupant Proxies
To test how the prototype would be perceived by potential building occupants, test were
conducted with 128 subjects at UCB’s Experimental Social Science Laboratory(Xlab). Xlab staff
recruited subjects by email to attend one of four test sessions lasting 1-1/2 hours. Subjects were
given a brief introduction to the application by research staff, and then completed a “pre-demo”
online survey that asked general questions about subjects’ demographic information and
energy attitudes. Subjects then completed a paper survey with questions about specific aspects
of the application, and finally they completed a closing survey with general questions about
their experience using the application. A peer-reviewed extended abstract on this research was
included in a CHI 2011 Conference on Human Factors in Computing Systems, Vancouver, B.C.,
in May 2011 (Lehrer and Vasudev 2011). A summary of this research is included as Appendix
2.3.2: Energy Social Media.

54
2.3.3.2 Testing with energy and facility professionals
The fifth and final task was to investigate the potential benefits of using a social media
application for improving communications between building occupants and operators. We
conducted one-on-one interviews with six expert users who would provide a range of
perspectives, including commissioning and design professionals, and facility managers. The
objective of this work was to understand whether such professionals see potential benefits from
using such an application to communicate with building occupants, track and respond to
complaints, and survey occupants about buildings management issues.
Interviews were conducted in person or remotely, using a desktop sharing utility, and lasted
about 60 minutes. The interviews followed a semi-structured format. The participants were
walked through the various features of the application and were asked to reflect on its overall
usefulness and user-experience.
A majority of the interview subjects found the “billboard” and “survey” features to be most
interesting. The billboard was seen as a convenient way for users to report energy-related
problems, and for managers or peers to respond. This overcomes one of the key shortcomings
of traditional complaint systems, the long response time and lack of acknowledgment that a
complaint has been received.
The surveys feature was seen as a very useful tool by all subjects as it helps managers to
quantitatively measure occupants’ comfort levels, and assess occupants’ responses to changes in
building controls such as lighting, heat, etc. Additional suggested features include options to
run multiple surveys at the same time, and analytics that track differentials and performance
improvements over time.
A number of the participants found energy goals useful. Participants described the feature as a
“vehicle to help [an individual] participate in energy conservation.” They expressed that being able to
share goals with peers is important in motivating people to do better. Participants (P2 and P5)
noted that people are “competitive by nature” and are “more likely to do better, if there is someone
watching over their shoulders.” However some participants wondered whether the cost of
providing the energy feedback to occupants would be cost effective.
2.3.3.3 Design Recommendations for Social Media Energy Feedback
Based on the results of this study and related research, the authors offer the following design
recommendations to developers and customers interested in using social media technologies for
energy feedback and/or building operations.
Provide energy information that is specific to the individual building occupant. In this study
subjects showed an overwhelming preference for energy displays on the scale of the individual
workspace. As this requires specialized hardware (smart plug strips, wireless lighting controls)
and associated software, such an approach may only be feasible for highly motivated
companies. However, some notable companies are installing such systems, and costs are likely
to come down as they become more widely adopted. When providing individual energy
feedback is not possible, zone or floor level energy information is preferable. If only whole
building energy data is available, showing energy in terms of per person energy use may be an
alternate way to engage occupants.

55
Provide normative energy comparisons in terms of average energy use, and also show the
energy use of an energy efficient user. Subjects were most interested in comparing their energy
use to the average user in the building. To avoid the “boomerang effect” (when low-energy
individuals use more energy when they see that they are below average) providing the energy
use of an efficient energy use is a useful approach (and is seen on some commercial energy
feedback products that show the energy use of top 20th percentile in energy efficiency).
Allow users to share and view personal energy displays as “social objects,” and to share and
view energy saving goals. Subjects showed a strong inclination to share their energy use charts
and goals with others, and indicated that the social aspects of such sharing may be useful for
engaging people in energy conservation. This capability should be an opt-in feature, as some
subjects expressed concerns about privacy or competition. Having an option that allows people
to share their energy use anonymously may allow people to be engaged with a program while
not being identified personally, if they harbor such concerns.
Be explicit about the use of energy information being solely for energy conservation. Due to
subjects concerns about privacy and competition in the workplace, the authors suggest that
energy feedback programs be explicit about using personal energy use information solely for
energy conservation, and not for other purposes such as monitoring employee schedules.
Focus on positive aspects of energy comparisons, avoiding judgmental feedback. For the
reasons noted above, energy use should be shown in positive terms such as energy saved
compared to past use, potential for savings, etc. Obviously terms that reflect poorly on groups
or individuals (e.g., energy hogs, wasting energy, etc.) should be avoided entirely, and the
program should explicitly recognize that energy use will necessarily vary greatly among
individuals as a result of varying usage and equipment needs.
Display energy information in terms of the cost of energy use as the default. Subjects had a
strong preference for seeing energy use data in terms of costs, in spite of the relatively low cost
of electricity used by an individual (less than $2 per week per person in this study). In cases
where energy use is low, it may be preferable to show energy use in terms of weekly, monthly,
or annual costs. For example, an energy display could show a user the yearly cost if the current
power level were continued. While a web interface can easily let users toggle between various
energy metrics, and this provides the benefit of letting users explore and interact with data, this
study shows that cost is considered the relevant energy metric that is consistent with other
recent research.
Enable occupants to collaborate and communicate with facility managers on building
problems and repairs. Both occupants and energy professionals found the “billboard” feature
valuable and indicated that they would use such a feature if it were available. However such a
system should be optimized so that users can easily search and also filter out irrelevant
information. To avoid the possibility that such a system will increase the rate of complaints, the
authors suggest using an intelligent complaint reporting approach (perhaps with branching
radio-button selections, for example), that inform users if a particular problem has already been
reported. Such a feature would benefit by allowing facility managers to respond to complaints
and to push announcements to building occupants via the application. Providing a simple

56
method for facility managers to survey or poll occupants on specific issues or improvements
shows potential for diagnostics and measuring impacts of facility improvements.
2.3.3.4 Follow-on research
CBE staff is building on the results of this research with a project to develop and evaluate a
building information feedback system (BIFS) that supports energy efficient operations, provides
occupant feedback to commercial building operators, and encourages occupants to reduce their
energy consumption. The project will also provide insights and guidelines useful for
commercial developers of energy feedback systems, and also fills gaps in the literature about
the size, persistence and evenness of behavioral approaches to reduce energy use. The project is
sponsored by the California Air Resources Board, and was launched in the fall of 2012.
The study will involve approximately 250 subjects in three office building locations. The BIFS
system will track plug load data from each participant, and display individual energy use and
other information to participants on Android tablet computers. Individualized plug energy use
and other types of information will be shown on the tablets for approximately five months.
During this period, subjects will be able to pick personal goals and will be given occasional
reminders and prompts about saving energy. Energy use will be compared between a baseline
period and after the feedback is provided via the tablet computers. We will also provide an
operator interface for the system, to allow building operators to monitor the project progress.
This work is expected to be complete by the winter of 2013.
2.3.4 References
Lehrer, D., and J. Vasudev. 2010. Visualizing Information to Improve Building Performance:
A Study of Expert Users. Proceedings, ACEEE Summer Study on Energy Efficiency in Buildings,
Pacific Grove, CA, August 15-20.
Lehrer, D., and J. Vasudev. 2011. Evaluating a Social Media Application for Sustainability in the
Workplace. Extended abstract, Proceedings, CHI 2011, Vancouver, May.

57
3 CHAPTER 3: Advanced Integrated Systems Research and Development
The overall goal of Task 3.0 is to aid the development and wider adoption of advanced
integrated systems, including hydronic-based radiant cooling and heating, UFAD, displacement
ventilation (DV), and personal environmental control systems (PECS). These systems are
attractive candidates for energy-efficient cooling technologies, but work is needed to develop
design and analysis tools that are fully capable of modeling these systems and the more
complex and often non-uniform environmental conditions they produce.
3.1 Integrated Systems Modeling and Technology Development
The goal of Task 3.1 is to develop and/or improve EnergyPlus models for radiant, UFAD, DV,
and PECS by validating the model predictions against laboratory experiments. A further goal is
to develop optimized approaches to applying these technologies.
3.1.1 Improved Underfloor Air Distribution and Displacement Ventilation EnergyPlus Algorithms
3.1.1.1 UFAD Systems modeling algorithm development
Many changes to the UFAD modeling capability have been made in CBE’s UFAD simulation
infrastructure over the course of this project. The final modeling capability contains the upgrade
changes summarized in Appendix 3.1.1: UFAD Modeling Upgrades Summary and those made
in the model .imf file structure, accessible at GitHub https://github.com/thoyt/CBE-EnergyPlus-
Model. These changes have been migrated into the CBE development version of v7.2 of
EnergyPlus. Appendix 3.1.2: UFAD Model Specification Summary provides a summary of the
model characteristics and how they compare to other models. Appendix 3.1.3: CBE UFAD
Modeling Guide provides detailed documentation of the modeling methodology.
The following list summarizes the improvements made; details of how fifteen of these changes
were made are covered in Appendix 3.1.1: UFAD Modeling Upgrades Summary. Several energy
and comfort studies conducted with the various upgrades are discussed in Section 3.2.
Prototype model characteristics were modified depending on the focus of the particular study
being conducted; these are summarized in Table 3.2.1-1, in Section 3.2.1.
1. Bug fix for convection heat transfer coefficients.
2. Bug fix for heating in the deadband.2
3. Supply plenum options – new supply plenum configuration options added including
single plenum, ducted to perimeter, and reverse series.2
4. Internal mass – revised methods for modeling furnishings.
5. New terminal unit sizing procedures based on thermal decay for each zone.
2 Work conducted by Oklahoma State University under contract to CBE

58
6. Customized design days for perimeter zones based on exposure to ensure proper sizing.
7. Updated linear bar grille and York/Johnson Controls, Incorporated (JCI) stratification
models based on recent testing at Walnut laboratories. (See Figure 3.3.3-1)
8. New models based on ASHRAE 90.1 2010 prototypes created by Pacific Northwest
National Laboratory (PNNL) that represent industry best practice design. (United States
Department of Energy (U.S. DOE) 2012)
9. Revised HVAC modelling objects and parameters.
10. New clothing model has been implemented to more accurately simulate comfort
conditions.
Figure 3.1.1-1: Revised phi-gamma curves for modeling UFAD stratification
3.1.1.2 EnergyPlus Commercial Building Prototype Model development
Along with algorithms development, revisions to the commercial building prototype models
were also made. Three basic versions of a medium sized office building model, conforming to
various CA Title 24 standards for OH buildings, were created. Specifications for window, wall,
roof and systems were modified as necessary according to the standards for different climates.
These models were nominally equivalent to U.S. DOE Reference models (U.S. DOE 2012)
although several modifications were made where the authors disagreed or found errors in the
Reference model assumptions (e.g., radiant fractions for lighting and occupants). In addition,
the medium office reference model assumes a direct expansion (DX) packaged unit for the
central system, where, for expediency and simplicity, chilled water systems are used

59
throughout the CBE studies. Likewise, modifications were made in part load curves for system
equipment based on more recent data on fan and boiler performance modeling. Changes made
to the models were implemented either in the Excel based customized user interface, code
changes in the CBE development version, or model .imf files. A summary of these changes is
included in Appendix 3.1.1: UFAD Modeling Upgrades Summary. A summary of model inputs
is shown in Appendix 3.1.2: UFAD Model Specification Summary.
3.1.1.3 Recommended Further UFAD Research
Many of the revisions, modifications, and upgrades were in process as this project closed and
therefore were not fully implemented. Proposed further development work and associated
studies are as follows:
Outstanding issues/recommended modeling revisions and code modifications:
Model changes:
Air terminal unit (ATU) ducted perimeter – revise ducted perimeter model to replace
variable speed fan coil unit (VSFCU) with variable air volume (VAV) reheat box.
SAT reset - revise SAT outside air (OSA) based reset schedules for both UFAD and OH;
investigate load based reset to replace OSA reset (per 90.1-2010).
90.1 OSA requirements – currently we use CA Title 24 OSA requirements for simplicity,
check compatibility with those for 90.1 2010 and make appropriate changes.
AHU OSA controller for UFAD – check OSA control operation to ensure requirements
are met.
New plenum coefficients – check to ensure realistic values are working.
Condensing boilers – upgrade boilers to condensing boilers and to determine its impact
on VSFCU heating sizing (i.e., 140 degrees F vs. 180 degrees F hot water supply
temperature).
Service core – revise model to add service core for interior zones.
Building configuration – investigate alternative aspects ratios more in line with current
practice, e.g., narrow buildings.
Upgrade to v7.3 – upgrade and investigate open source to allow others to use
development version.
Code/model changes (in order of priority):
Deadband bug – fix deadband bug that causes heating in the deadband.
Heating differences OH vs. UFAD – There appears to be a fundamental discrepancy in
the heating breakdown between OH and UFAD that needs further investigation.
Furniture mass object – determine need for alternative internal mass object for UFAD in
implemented required code and model changes.

60
Dual minimums for VSFCU – revise code to support dual minimums (minimum fan
speed and leakage flows) for both fan on and fan off options in the deadband and
implement VAV heating consistent with how VAV/reheat units operate.
Design sizing – implement multi-design days and thermal decay based sizing, check
accuracy of sizing in perimeter and core zones. Implement “unit sizing” for VSFCUs.
Plenum configurations – impact of reverse series.
Underfloor cooling – add Tate model for perimeter ATU cooling coils.
Output reports – revise hourly output reports, make more modular; revise the standard
EnergyPlus output table to ensure UFAD is being represented properly (e.g.,
temperatures not met using occupied zone; sizing reported properly).
Create an output report that rolls up comfort measures (e.g., percent persons dissatisfied
(PPD) to building level.
Other issues, further research studies:
Issues that need to be studied to determine if they cause adverse impact on energy performance
modeling
Impact of SAT on startup conditions – study constant vs. reset based SAT on startup
loads due to impact on slab thermal storage.
Impact of swirl diffusers in perimeter – investigate methods to accommodate swirl
diffusers plus linear bar grilles in perimeter zones as per common practice (may require
further lab testing).
Cooling load design tool – with revised models and code changes, revise peak load
offsets for UFAD.
Blinds offsets – lab studies to refine impact of blinds on peak loads.
Thermostat model – investigate use of advanced thermostat model and assumption of
fixing occupied zone control to setpoint (i.e., current assumption does not properly
simulate effects of setpoint change on increase in room air stratification (RAS) when
setpoint is increased).
Further comfort and energy performance studies:
Insulated slab – compare insulation on top vs. bottom of supply plenum slab.
Furniture – impact of revised internal mass object.
Blinds – determine impact of blinds down at peak loads.
UFAD system type – York, VSFCU, Tate.
RAS effectiveness – impact of number of diffusers, diffuser type, room setpoints (see
Thermostat model) and climate (i.e., effectiveness may depend on amount of
economizer use).
SAT reset – OSA vs. load based

61
Climates – include Sacramento, San Francisco, Minneapolis, Baltimore , Phoenix and
Houston
Occupant control - impact of occupant control (requires “operating runs” where sizing
is held constant and setpoints increased (see Thermostat model above).
Plenum configurations – impact of reverse series.
3.1.1.4 Displacement ventilation modeling
Displacement ventilation modeling improvements in EnergyPlus were delayed due to an
unexpected loss of personnel resources. This topic has been deferred to future work.
3.1.1.5 References
CEC. 2008. California Energy Efficiency Standards for Residential and Nonresidential Buildings.
California Energy Commission. CEC-400-2008-001-CMF, December.
DOE. 2012. Commercial Building Prototype Models. U.S. Department of Energy.
http://www.energycodes.gov/development/commercial/90.1_models
3.1.2 Modeling of radiant system cooling loads
Water-based radiant cooling systems are gaining popularity as an energy efficient approach for
conditioning buildings. The design of radiant systems is complicated because of the coupling
between thermal load, building structure and the hydronic system and because of the important
impact of both radiation and convection on thermal comfort. Dedicated radiant system design
and testing standards have been developed to address issues like system sizing, installation,
operation and control (ISO 2012, ASHRAE 2009, CEN (2004, 2008), Babiak et al. 2007, Watson
and Chapman 2002). However, radiant cooling systems are still considered an innovative
approach, and their application in North America is limited.
Cooling load calculations are a crucial step in designing any HVAC system. Compared to air
systems, the presence of an actively cooled surface changes the heat transfer dynamics in the
room. During the course of CBE’s modeling research on radiant systems using EnergyPlus, it
became evident that cooling loads for radiant systems need to be considered differently than
loads for conventional air systems. Two potential impacts on zone cooling loads were
identified and investigated: 1) cooled surfaces may create different inside surface temperatures
of the non-active exterior building walls, causing different heat gain through the building
envelope, and in turn different zone level total energy; and 2) cooled surfaces change the effect
of thermal mass on cooling loads, and therefore create different peak cooling load.
3.1.2.1 Goals
The goals of this simulation study were to 1) assess the cooling load differences between the
two systems by comparing the zone level peak zone cooling load and 24-hour total cooling
energy for a radiant cooling system (with activated chilled surface) vs. an air system; and 2)
suggest potential improvements in current design guidelines for radiant cooling systems.
3.1.2.2 Radiant cooling systems
The Federation of European Heating, Ventilation and Air-conditioning Associations (REHVA)
guidebook on radiant systems (Babiak et al. 2007) has roughly categorized these systems into

62
three types: radiant cooling panels (RCP), water-based embedded surface cooling systems
(ESCS), and thermally activated building systems (TABS). As shown in Figure 1, RCP are metal
panels with integrated pipes usually suspended under the ceiling with heat carrier temperature
relatively close to room temperature. ESCS have pipes embedded in plaster or gypsum board or
cement screed, and they are thermally decoupled from the main building structure (floor, wall
and ceiling) by the use of thermal insulation. They are used in all types of buildings and work
with heat carriers at relatively high temperatures for cooling. Finally, “systems with pipes
embedded in the building structure (slab, walls), TABS, that are operated at heat carrier
temperatures very close to room temperature and take advantage of the thermal storage
capacity of the building structure.” These systems usually have different applications due to
their thermal and control characteristics, and therefore, the design and dimensioning strategies
for these systems vary.
Figure 3.1.2-1: Schematic of the three types of radiant surface ceiling systems (not to scale)
3.1.2.3 Modeling approach
To investigate the impacts of the presence of activated cooled surface on zone cooling load, we
adopted the following methodology:
Two single zone models, one conditioned by an air system and one by a radiant system
were developed in EnergyPlus v7.1 for comparison. All three radiant systems
(RCP/ESCS/TABS) were studied. Because the construction of each radiant system type
is different and is highly influential on overall building response, the comparison air
models were configured to match the construction of the radiant systems.
The models were parameterized for studying the influences of envelope thermal
insulation, thermal mass, type of internal gain, solar heat gain with different shading
options, and radiant surface orientation (ceiling, floor).
EnergyPlus v7.1 was used for the simulation study because it performs a fundamental heat
balance on all surfaces in the zone. In total, seventy-four simulation cases were configured,
including 13 (11 for RCP) variations for the three types of radiant systems and their equivalent
air systems. Since the objective of the study was to understand the heat transfer and the
resultant cooling load differences between a radiant system and an air system, a representative
single zone model was developed primarily based on ASHRAE Standard 140 (ASHRAE 2007).
The simulation model was a rectangular, heavy weight construction single zone building (8
meter (m) wide 6 m long 2.7 m high) with no interior partitions (Figure 3.1.2-2). Both the
floor and roof boundary conditions were set to be adiabatic to simplify the analysis. Only
selected cases had 12 m2 of south-facing windows. Full details of the simulation approach are

63
described in Appendix 3.1.4: Cooling Load Differences between Radiant and Air Systems (Feng
et al. In press).
Figure 3.1.2-2: Schematic diagram of single zone model
3.1.2.4 Results
The simulation study compared the peak cooling rate and the 24-hour total cooling energy for
radiant and air systems over a range of design parameters. Key findings were as follows:
For interior zones with long wave radiant heat gain, the peak cooling rate differences
ranged from 7 percent to 27 percent at the radiant surface level. This implies that higher
radiant fraction in heat gain produces larger differences in peak cooling rates between
the two systems. This was further demonstrated in cases with solar load.
For perimeter zones and an atrium, where direct solar heat gain constitutes a large
portion of the cooling load, the peak cooling load difference is pronounced. When
exterior shading was not installed, the RCP ceiling surface peak cooling rate is 36
percent higher than the air system, and for the ESCS ceiling system it is 35 percent, and
49 percent for the TABS ceiling systems. Exterior shading reduced the direct solar
impact, but the surface peak cooling rates were still 24-33 percent higher for the ceiling
system.
When the floor was used as the radiant cooling surface and when it was illuminated by
direct solar, the ESCS surface peak cooling rate was 69 percent higher and for TABS, 85
percent higher.
In order to explain why the radiant system peak cooling rate is higher than the equivalent air
systems, Figure 3.1.2-3 investigates zone cooling load dynamics for the two systems. Results are
shown for one case with adiabatic walls and no windows (internal loads with a typical radiant

64
fraction of only 60 percent) as an example. The figure compares the processes by which
radiative and convective heat gains are converted into zone cooling load for the two systems.
As shown, the cooling load for both systems was composed of two components, one that
originated as convective heat gain from internal loads, and one that originated as radiative heat
gain from internal loads. The instantaneous cooling load depends both on the magnitude and
the nature of the heat gains acting at the same instant. In a zone conditioned by an air system,
the cooling load is 100 percent convective, while for the radiant systems the cooling load
represents the total heat removed at the activated ceiling surface, that includes incident radiant
loads, long wave radiation with non-activated zone surfaces and convective heat exchange with
the warmer room air. In the case of the air system Figure 3.1.2-3 (left plots), convective heat gain
becomes cooling load instantaneously, and radiative gains are absorbed by zone thermal mass
and re-released as convective load. The fact that building mass delays and dampens the
instantaneous heat gain is well recognized by cooling load calculation methods. For the radiant
cooling system Figure 3.1.2-3 (right plots), a large portion of the radiative heat gain converts to
cooling load directly during the occupied period due to the presence of the cooling surface(s).
Not all convective gains instantaneously contribute to cooling load, a smaller amount compared
to the air system, during the occupied hours because a higher zone air temperature is reached to
balance the cooler ceiling surface temperature, thereby maintaining an equivalent operative
temperature. And because of the higher zone air temperature, a small part of the convective
heat gain is absorbed by non-activated building mass and removed by the radiant surface via
long wave radiation.
The bottom plots Figure 3.1.2-3 stack up the two cooling load components, and the solid black
lines in the bottom plots are hourly cooling loads, that reach their peak value at the end of the
occupied period for both systems. These predicted cooling loads represent the total amount of
heat being removed by each system to maintain the same operative temperature profile. Note
that the peak cooling rate for the radiant system is predicted to be 13.0 percent greater than that
for the air system.
3.1.2.5 Conclusions
Zones conditioned by a radiant system have different peak cooling loads than those conditioned
by an air system. While the increase in 24-hour total cooling energy is relatively small and may
be offset by other energy savings benefits associated with radiant cooling systems, the
differences in peak cooling load, both in terms of magnitude and time, compared to the air
systems, require special attention in system and control design. These differences in cooling
load should be clearly stated in radiant system design guidelines and translated into
requirements for design tools and energy simulation methods. Transfer Function based
methods are not appropriate for cooling load calculation when radiant cooling systems are
involved. Radiant systems should be modeled using a dynamic simulation tool that employs
either a Heat Balance model or Thermal Network models during the design process for accurate
cooling load calculation.
Full details of this simulation study are presented in Appendix 3.1.4: Cooling Load Differences
between Radiant and Air Systems (Feng et al. 2013).

65
Figure 3.1.2-3: Comparison of surface cooling breakdown (convective and radiative part) for air system
(left) and radiant cooling panel (RCP) system (right)
3.1.2.6 References
ASHRAE. 2007. ANSI/ASHRAE Standard 140: Standard Method of Test for the Evaluation of Building
Energy Analysis Computer Programs. American Society of Heating, Refrigerating and Air
Conditioning Engineers, Inc., Atlanta, GA.
ASHRAE. 2009. ANSI/ASHRAE 138-2009: Method of Testing for Rating Ceiling Panels for Sensible
Heating and Cooling. American Society of Heating, Refrigerating and Air Conditioning
Engineers, Inc., Atlanta, GA.

66
Babiak, J., B. Olesen, D. Petras. 2007. Low temperature heating and high temperature cooling_REHVA
Guidebook. Federation of European Heating and Air-Conditioning Associations.
CEN. 2004. EN14240 : Ventilation for buildings-Chilled ceiling testing and rating. CEN.
CEN. 2008. EN15377: Heating systems in buildings-design of embedded water based surface heating and
cooling systems. CEN.
J. Feng, S. Schiavon, and F. Bauman. 2013. Cooling load differences between radiant and air
systems. Energy and Buildings, 65: 310-321. DOI:
http://dx.doi.org/10.1016/j.enbuild.2013.06.009
ISO. 2012. ISO-11855: Building Environment Design—Design, Dimensioning, Installation and Control
of Embedded Radiant Heating and Cooling Systems. International Organization for
Standardization.
Watson, R.D., and K.S. Chapman. 2002. Radiant Heating and Cooling Handbook. McGraw-Hill.
3.1.3 Personal comfort systems technology development
3.1.3.1 Goals
The purpose is to optimize the efficiency and demonstrate the practical applicability of
advanced personal comfort systems (PCSs). The specific goals of this task are to (1) undertake
the detailed industrial design of PCSs, (2) construct prototypes and test these designs in the
laboratory to optimize performance, and (3) to manufacture a number of units for use in actual
office spaces for demonstration and evaluation.
3.1.3.2 Methods
Personal comfort technologies for commercial building occupants are emerging as a key
innovation for the built environment. They ensure individual comfort, while saving energy by
enabling wide ambient air temperature ranges (roughly 5 percent of total HVAC energy is
consumed per degree Fahrenheit of extra heating or cooling (Hoyt et al. 2009), sometimes with
additional energy waste from increased simultaneous heating and cooling).
Extensive human-subject studies by CBE have showed that comfort is most efficiently provided
by cooling the head and torso when warm, or warming the feet and torso when cool (Zhang et
al. 2010, Arens et al. 2011, 2008). Based on these studies, we developed two prototype PCSs that
allow individual building occupants to control the thermal environment of these thermally
sensitive body parts. Each PCS creates normal comfort over an 18 – 28 degrees Celsius (64 – 82
degrees Fahrenheit) range of ambient air temperatures.
3.1.3.3 Final PCSs
Two types that are ready for commercialization are described below.
Battery-powered personal comfort system chair (Figure 3.1.3-1). The PCS chair has several
components. Reflective surfaces behind the seat and back of a commercially available mesh
chair reflect body heat back to people in winter. Small areas of resistance heating tape wire
are added in the seat mesh of the chair to provide additional heating as needed (max. 14
watt (W)). Cooling in summer is accomplished by small fans increasing convection in the
porous plenum between the mesh and the reflective back (max. 3.6W). Controls knobs on

67
the chair switch between heating and cooling and adjust their levels. The chair needs no
electrical cord when in operation; the battery (below the seat) has capacity for two to four
days operation, and is recharged at night when needed (adding to a building’s demand
response capability). A full-function, high-quality office chair is the starting point, and
there is no inconvenience from the added features. We have applied for a provisional
patent for the chair, and are fabricating 34 copies for field studies (with funding from
CIEE/PIER). We have a manufacturer’s quote of $900 per chair in quantity of 1000.
Fan + footwarmer PCS devices (Figure 3.1.3-2). These provide air movement for head
cooling (less than 4W) and carefully focused radiation for foot warming. The footwarmer,
by enclosing the foot area in a highly reflective insulated shell, requires less than 50W to
provide 9 degrees F (5 degrees K) of heating in steady-state (compared to the typical 750 -
1500W portable heater). We have manufactured 105 of these prototypes for use in field
testing in buildings. We are also now fabricating slightly taller legwarmers (Figure 3.1.3-3)
that provide very fast warming sensation on the leg as well as foot and ankle. These cost
well under $100 in small quantities.
The Fan + footwarmer system is also designed to be a field study research instrument, in
that it contains temperature- and internal-state sensors to measure the air temperature and
how and when occupants use it and the levels of the fan and the footwarmer setting. It
links via universal serial bus (USB) to the occupant’s desktop computer (Figure 3.1.3-2).
Embedded software automatically transfers monitored information to the occupant’s
computer, and from there software periodically ships the data to a CBE research database
via the internet. The data encryption and security parts of the code are quite complex and
sophisticated (meeting NSA ‘top-secret’ standards).
All the PCS units have occupancy sensors assuring shut-off when unoccupied. They have
optional internet connectivity for transmitting temperature and state data to the HVAC controls
via sMAP (see below).

68
PCS chair components
• Reflective surfaces behind the
seat and back
• Spot heating
• Three 1.2 W fans in the back
and seat
• Heating/cooling switch
• Heating/cooling level knob
• Occupancy sensor
• LiFePO4 battery (below the
seat)
Chair main features
• Modified high quality full-
function office chair
• Battery powered
• 2 – 4 days operation capacity
• Energy consumption: 14 W
heating; 3.6 W cooling.
• User-adjustable heating and
cooling levels.
• Maintains comfort conditions
between 60.5 and 82.5 °F. Figure 3.1.3-1: Battery-powered PCS chair
Figure 3.1.3-2: PCS fan + footwarmer, occupant’s desktop interface, and manufacturing of 105 units
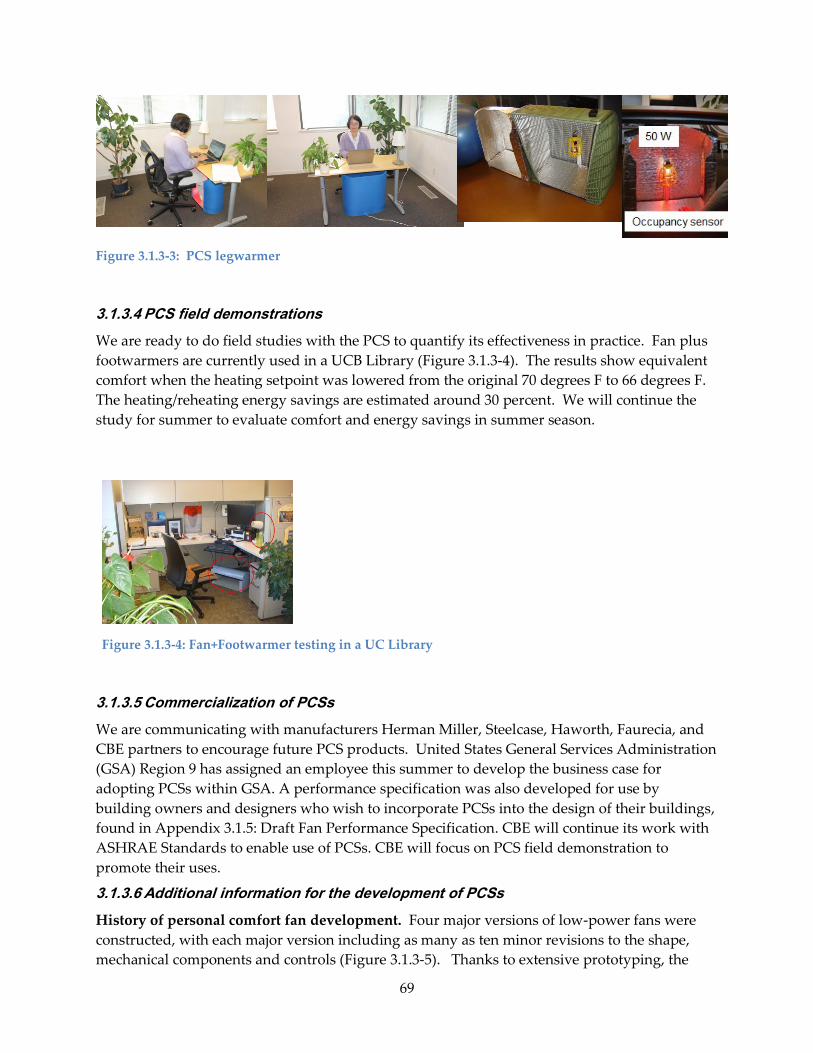
69
Figure 3.1.3-3: PCS legwarmer
3.1.3.4 PCS field demonstrations
We are ready to do field studies with the PCS to quantify its effectiveness in practice. Fan plus
footwarmers are currently used in a UCB Library (Figure 3.1.3-4). The results show equivalent
comfort when the heating setpoint was lowered from the original 70 degrees F to 66 degrees F.
The heating/reheating energy savings are estimated around 30 percent. We will continue the
study for summer to evaluate comfort and energy savings in summer season.
Figure 3.1.3-4: Fan+Footwarmer testing in a UC Library
3.1.3.5 Commercialization of PCSs
We are communicating with manufacturers Herman Miller, Steelcase, Haworth, Faurecia, and
CBE partners to encourage future PCS products. United States General Services Administration
(GSA) Region 9 has assigned an employee this summer to develop the business case for
adopting PCSs within GSA. A performance specification was also developed for use by
building owners and designers who wish to incorporate PCSs into the design of their buildings,
found in Appendix 3.1.5: Draft Fan Performance Specification. CBE will continue its work with
ASHRAE Standards to enable use of PCSs. CBE will focus on PCS field demonstration to
promote their uses.
3.1.3.6 Additional information for the development of PCSs
History of personal comfort fan development. Four major versions of low-power fans were
constructed, with each major version including as many as ten minor revisions to the shape,
mechanical components and controls (Figure 3.1.3-5). Thanks to extensive prototyping, the
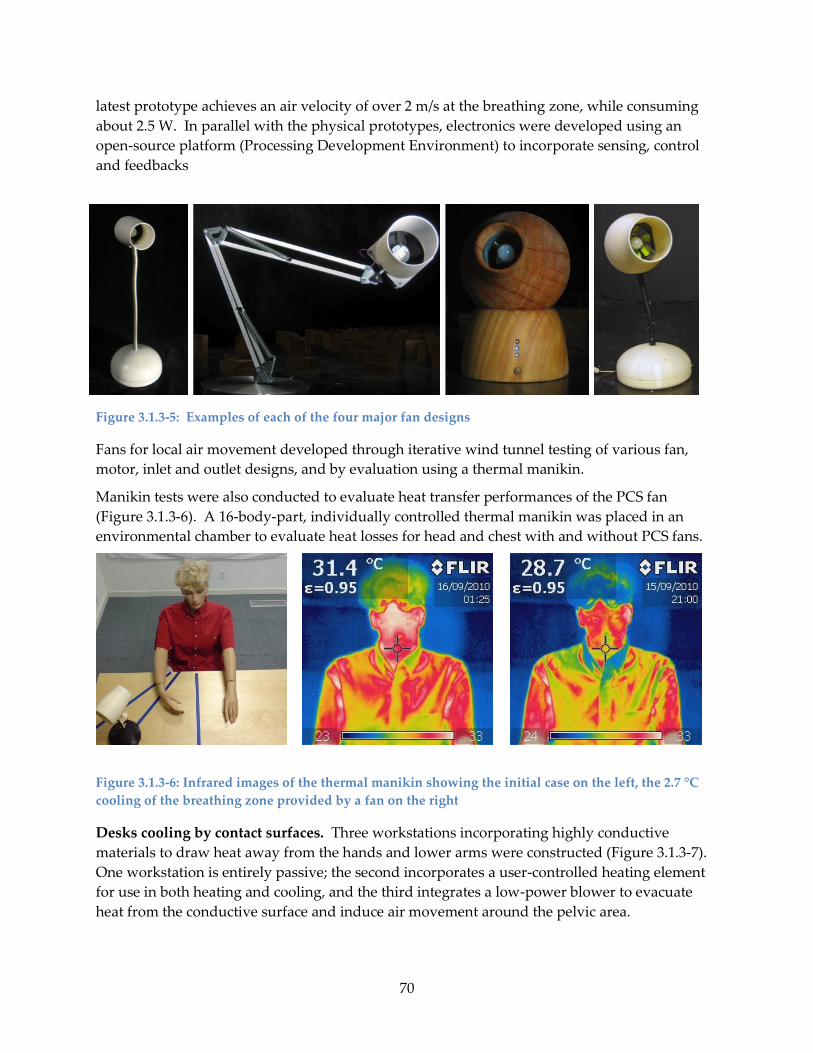
70
latest prototype achieves an air velocity of over 2 m/s at the breathing zone, while consuming
about 2.5 W. In parallel with the physical prototypes, electronics were developed using an
open-source platform (Processing Development Environment) to incorporate sensing, control
and feedbacks
Figure 3.1.3-5: Examples of each of the four major fan designs
Fans for local air movement developed through iterative wind tunnel testing of various fan,
motor, inlet and outlet designs, and by evaluation using a thermal manikin.
Manikin tests were also conducted to evaluate heat transfer performances of the PCS fan
(Figure 3.1.3-6). A 16-body-part, individually controlled thermal manikin was placed in an
environmental chamber to evaluate heat losses for head and chest with and without PCS fans.
Figure 3.1.3-6: Infrared images of the thermal manikin showing the initial case on the left, the 2.7 °C
cooling of the breathing zone provided by a fan on the right
Desks cooling by contact surfaces. Three workstations incorporating highly conductive
materials to draw heat away from the hands and lower arms were constructed (Figure 3.1.3-7).
One workstation is entirely passive; the second incorporates a user-controlled heating element
for use in both heating and cooling, and the third integrates a low-power blower to evacuate
heat from the conductive surface and induce air movement around the pelvic area.

71
Figure 3.1.3-7: Examples of conductive work surfaces that draw heat away passively from the hands
Two papers evaluating the impact of PCS fans on comfort and perceived air quality by human
subject tests were presented at the Indoor Air Conference in June 2011 (Arens et al. 2011, Liu et
al. 2011). They are attached as Appendixes 3.1.6: PCS-Indoor Air 1 and 3.1.7: PCS-Indoor Air 2.
We conducted a human subject study to test a heated/cooled chair for thermal comfort. The
chair provides comfort over ambient temperature range 61 – 84ºF. A paper has been accepted
by HVAC & Research (Appendix 3.1.8: Heated and cooled office chair).
3.1.3.7 References
Arens, E., H. Zhang, W. Pasut, A. Warneke, F. Bauman, and H. Higuchi. 2011. Thermal comfort
and perceived air quality of a PECS. Proceedings of Indoor Air 2011, Austin, June 5 – 10.
Arens, E., H. Zhang, D. Kim, E. Buchberger, F. Bauman, C. Huizenga, H. Higuchi. 2008. Impact
of a task-ambient ventilation system on perceived air quality. Proceedings of Indoor Air 2008,
Copenhagen, August 17-22.
Hoyt, T., K.H. Lee, H. Zhang, E. Arens, and T. Webster. 2009. Energy savings from extended air
temperature setpoints and reductions in room air mixing. Proceedings from International
Conference on Environmental Ergonomics, Boston, August 2 – 7.
Liu, C., H. Higuchi, E. Arens, and H. Zhang. 2011. Study of a personal environmental control
system using opposing airstreams. Proceedings of Indoor Air 2011, Austin, June 5 – 10.
Pasut, W., H. Zhang, S. Kaam, E. Arens, J. Lee, F. Bauman, and Y. Zhai. 2012. Effect of a heated
and cooled office chair on thermal comfort. Accepted for publication in HVAC&R Research.
Zhang, H., E. Arens, D. Kim, E. Buchberger, F. Bauman, and C. Huizenga. 2010. Comfort,
perceived air quality, and work performance in a low-power Task-Ambient Conditioning
system. Building and Environment, Volume 45, Number 1, 29 – 39.

72
3.2 Integrated Systems Performance and Control Analysis
The goal of Task 3.2 is to use simulation studies to investigate the energy and comfort
performance of integrated architectural and engineering systems. Advanced integrated systems
using radiant cooling and heating, UFAD, DV, natural ventilation (NV), and mixed mode (MM)
control, all appropriate to California’s climates, will be emphasized. This task will include
evaluation and development of control sequences for advanced building systems. This will
address the current tendency to use existing (canned) control sequences that may subvert the
efficient operation of these advanced systems.
3.2.1 UFAD performance analyses
The following sections describe simulation studies that have been conducted over the course of
this project to investigate the energy, comfort, and control performance of UFAD systems.
In this report, results from simulations conducted with the advanced modeling capabilities of
EnergyPlus versions 3.1 and 6.0 including additions and modifications made by CBE are
presented. These studies include comparisons between conventional OH and UFAD systems,
and various sensitivity studies to illustrate the impact of design and operating decisions. The
CBE sub-projects under which this work was conducted are named “UFAD Optimization Study
#1,” nicknamed herein as “Opto1;” and “UFAD Optimization Study #2,” nicknamed herein as
“Opto2.” These are included as Appendices 3.2.1: UFAD Optimization Study #1 and 3.2.2:
UFAD Optimization Study #2. Two Simbuild3 papers (and associated Simbuild presentations)
reported on this work and are attached to this report (Webster et al. 2010, 2012). A roadmap of
these and related studies are shown in Table 3.2.1-1 below. Included, also in this section, is a
summary of the findings from The NYT Building energy monitoring and detailed modeling
project that is attached as Appendix 3.2.4: The NYT Building End-use Energy Monitoring and
Detailed EnergyPlus Modeling.
3 Simbuild is the bi-annual buildings simulation conference sponsored by International Building
Performance Simulation Association (IBPSA)

73
Table 3.2.1-1: Summary of UFAD simulation activities
Year Month
Eplus
version Model STd Activity/study Climate
Floorplate,
sf
Service
core WWR
Central
heating
coil
2009 9 3.1 T-24-2005 Toolkit development SAC 20,000 Yes 40% On
2009 10 3.1 T-25-2005CBE workshop - UFAD
simulationSAC 20,000 Yes 40% On
2010 2-6 3.1 T-25-2005Simbuild 2010 - SAT
sensitivitySAC, SF 20,000 Yes 40% On
2010 4 3.1 90.1-2004Opto1 - Design/operating
Sensitivity SF, MI, MN 40,000 Yes 38% On
2010 5-6 3.1 90.1-2004 Opto1- OH vs UFAD compare SF, MI, MN 40,000 Yes 38% Off
2010 6 3.1 90.1-2004
PEC workshop - UFAD
stratification & Energy
performance
SF, MI, MN 40,000 Yes 38% Off
2010 7 3.1 90.1-2004Opto1- Room setpoint
studiesSF, MI, MN 40,000 Yes 38% Off
2010 5&10 3.1 90.1-2004 UFAD Thermal decay SF, MI, MN, BAL 40,000 Yes 38% On
2011 6 3.1 90.1-2004Simbuild 2011 - Lessons
learnedSF, MI, MN 40,000 Yes 38% NA
2010 11 6 Switch to v6.0
2011 10 6 90.1-2010Opto2 - Design/operating
sensitivitySAC 20,000 No 33% Off
2011 10 6 90.1-2010Opto2 - OH vs UFAD
compareSAC 20,000 No 33% Off
2012 4 6 NACBE workshop - Optomizing
UFAD energy & comfort
3.2.1.1 UFAD Optimization Study #1
Goals. The goal of this project was to conduct simulations to compare energy performance
between conventional VAV and UFAD systems, and to identify the sensitivity of energy
performance of UFAD systems to various design and operating conditions.
Methods. In this study a model of a 40,000 ft2 per floor, 3 story office building was used. Side by
side simulations of the same building with a conventional OH system vs. a UFAD system with a
VSFCU system were conducted in three different climates.4 Details of building and system
characteristics are contained in Appendix 3.2.1: UFAD Optimization Study #1. The building and
major HVAC parameters are based on ASHRAE 90.1-2004, Appendix G with some variation for
simplicity sake. All results are presented on the basis of HVAC system EUI (thousand British
Thermal Units per square foot per year (kBtu/ft2/yr)), site energy.
Findings - OH vs. UFAD comparison. The focus of this part of the study was to compare the
energy performance of UFAD as compared to conventional OH systems for three climates that
4 This refers to the perimeter terminal units, interior zones use swirl diffusers as opposed to the other
major option of a York/Johnson Controls, Inc. (JCI) system (not modeled)

74
represent extremes. The assumption being that these three represent the range of climate
impacts and will “bracket” climatic performance issues and identify how the savings are
affected by these overriding climatic effects. Figures 3.2.1-1,2,3 show comparison results for San
Francisco, Miami, and Minneapolis, respectively.
Note that the OH cases were simulated with various VAV terminal unit minimum volumes to
capture the range from the extreme of 90.1 specifications (0.4 cubic feet per square foot (cfm/ft2))
to “best practices” VAV heating.5 Savings comparisons are shown relative to both 30 percent
minimum and VAV heating.
Figure 3.2.1-1: UFAD vs. OH performance for San Francisco
5 VAV heating represents “Dual Max” control strategy (variable air volume to maximum heating volume
setting from a low minimum to meet ventilation requirements (0.15 cfm/ft2 in this study) that has now
been standardized in 90.1-2010 and CA Title 24-2008, while the 0.4 cfm/ft2 has been deleted. The 30%
minimum has been the default standard in practice for many years. The UFAD cases are simulated on the
same basis but the FCU is assumed to be off in the deadband.

75
Figure 3.2.1-2: UFAD vs. OH performance for Miami
Figure 3.2.1-3: UFAD vs. OH performance for Minneapolis
Findings – underfloor air distribution sensitivity analysis. This section describes example
results for studies aimed at determining the energy impact of various design and operating
conditions applied to UFAD systems.
The following sections have been excerpted from Appendix 3.2.1: UFAD Optimization study #1.

76
Heating energy summary. The following summarizes the findings with regard to heating
energy.
Counterintuitive reheat effect – For series plenum arrangements in mild climates with
low heating loads, reheat is increased when SAT is increased due to the impact.
However, in cold climates, the reverse occurs; reheat is decreased as SAT increases.
This results from the way that VSFCU operate; the electrically commuted motor (ECM)
drive, has a minimum speed of approximately 10-12 percent that results in a minimum
flow corresponding to the size of the unit.6
Central coil effects – Since UFAD systems have no independent way to heat the interior
zones, central coils at the AHU are necessary to prevent overcooling the interior zones.
This results in a large increase in the heating energy.
OH vs. UFAD reheat – Reheat for UFAD systems is significantly less than OH systems
due to plenum temperature rise that increases the entering temperature at the terminal
unit.
VAV heating – VAV heating using the dual max strategy significantly lowers heating,
fan and cooling energy..
Cooling energy summary. The following summarizes the findings with regard to cooling
energy.
Economizer “tradeoff” effect – Increased economizer use, a climate dependent factor,
appears to reduce cooling energy in all but hot-humid climates. However, this requires
increasing SAT setpoints that causes increased airflow and consequently fan energy.
This is called the tradeoff effect, that ends up reducing the effect of the cooling benefits
of the increased SAT for UFAD systems. Furthermore, the impact of increased heating
(due to increased reheat or central heating coil energy) further erodes the overall
savings potential.
This study did not simulate SAT reset that is required in new standards and may have a
significant impact on UFAD cooling and heating performance.
Latent cooling – Latent cooling appears to have an impact on cooling energy for hot-
humid climates. For example, in Miami where an economizer is not used, 57 degrees F
SAT would yield the lowest overall energy, except for the increase in cooling due to
latent load.(i.e., at 57 degrees F, SAT cooling would normally be less than at 63 degrees
F, but in Miami, it is greater).
Design and operating factors sensitivity summary. The following summarizes the findings
with regard to results from sensitivity analyses.
6 In these studies, “exact sizing” was used instead of “unit sizing” where the size is selected from
available size ranges offered in practice, which could cause some changes in the results when SAT63 and
SAT57 are compared. However, since the simulation zones represent an aggregation, a series of smaller
real zones, on average, the roll-up sizing, is probably fairly representative.
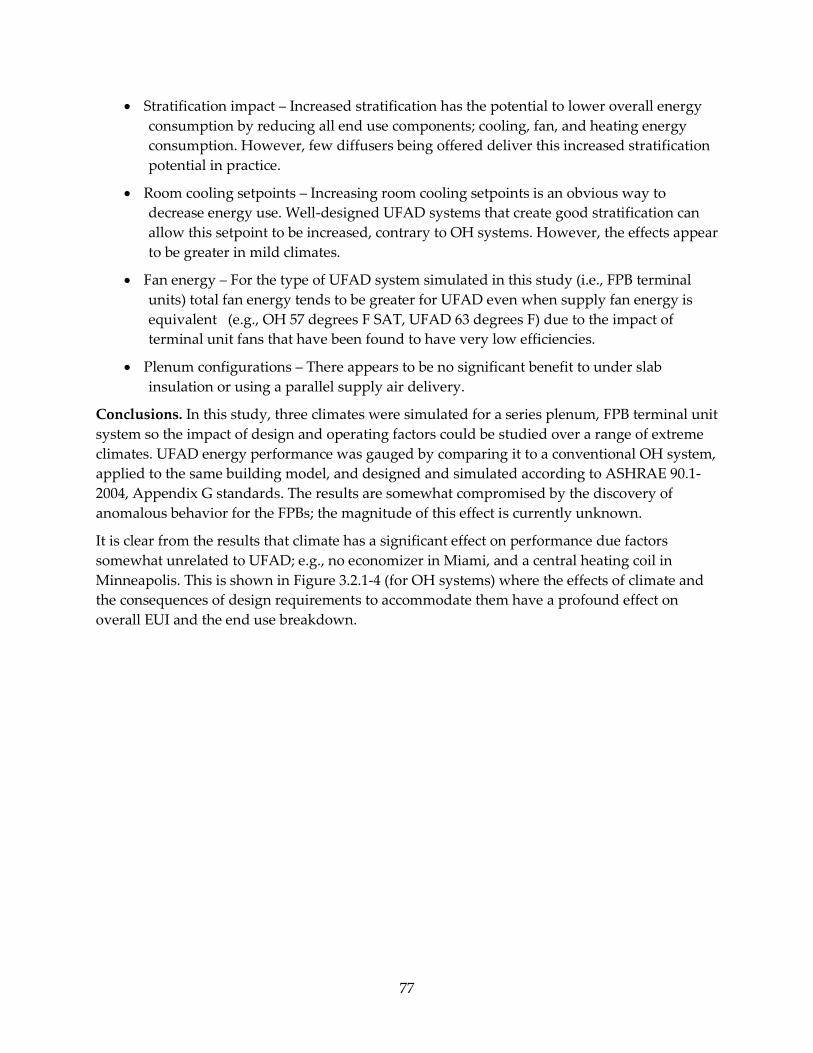
77
Stratification impact – Increased stratification has the potential to lower overall energy
consumption by reducing all end use components; cooling, fan, and heating energy
consumption. However, few diffusers being offered deliver this increased stratification
potential in practice.
Room cooling setpoints – Increasing room cooling setpoints is an obvious way to
decrease energy use. Well-designed UFAD systems that create good stratification can
allow this setpoint to be increased, contrary to OH systems. However, the effects appear
to be greater in mild climates.
Fan energy – For the type of UFAD system simulated in this study (i.e., FPB terminal
units) total fan energy tends to be greater for UFAD even when supply fan energy is
equivalent (e.g., OH 57 degrees F SAT, UFAD 63 degrees F) due to the impact of
terminal unit fans that have been found to have very low efficiencies.
Plenum configurations – There appears to be no significant benefit to under slab
insulation or using a parallel supply air delivery.
Conclusions. In this study, three climates were simulated for a series plenum, FPB terminal unit
system so the impact of design and operating factors could be studied over a range of extreme
climates. UFAD energy performance was gauged by comparing it to a conventional OH system,
applied to the same building model, and designed and simulated according to ASHRAE 90.1-
2004, Appendix G standards. The results are somewhat compromised by the discovery of
anomalous behavior for the FPBs; the magnitude of this effect is currently unknown.
It is clear from the results that climate has a significant effect on performance due factors
somewhat unrelated to UFAD; e.g., no economizer in Miami, and a central heating coil in
Minneapolis. This is shown in Figure 3.2.1-4 (for OH systems) where the effects of climate and
the consequences of design requirements to accommodate them have a profound effect on
overall EUI and the end use breakdown.

78
Figure 3.2.1-4: Energy performance across climates
UFAD performance can be optimized the most by increasing SAT to maximize the use of the
economizer, increasing stratification, and increasing room cooling setpoints. However, these
strategies produce a tradeoff effect that tends to reduce the potential savings; e.g., increasing
SAT tends to reduce cooling, but increase fan and reheat energy. Reducing minimum volumes
at terminal units by using a dual max control strategy has been shown to decrease heating
energy consumption.
Overall, this study suggests that UFAD energy consumption is lowest in mild climates and
where the design maximizes stratification. Increasing room setpoints can also have a beneficial
effect in all climates, but the benefit is more pronounced in mild climates.
3.2.1.2 UFAD Optimization Study #2
Goals. The objective of this study was to identify UFAD best practices design and operating
parameters based on a comparison of a wide variety of options including plenum
configurations, number of diffusers, and room setpoint changes by comparing the impact of
each option with the others and with the performance of conventional OH systems. This study
extended the work from the Optimization study #1 to additional sensitivity options using a
revised model based on requirements of ASHRAE Standard 90.1-2010.
Methods. In this study a model of a 20,000 ft2 per floor, 3 story office building was used. Side by
side simulations of the same building with a conventional OH system vs. a UFAD system with a
VSFCU UFAD system were conducted in the Sacramento CA climate zone.7 Details of building
7 This refers to the perimeter terminal units. Interior zones use swirl diffusers as opposed to the other
major option of a York/JCI system (not modeled)

79
and system characteristics and findings can be found in our Simbuild paper (Webster et al.
2012) that is attached as Appendix 3.2.2: UFAD Optimization Study #2. The following findings
and conclusions have been excerpted from that paper.
Table 3.2-2 shows the simulation cases studied. The building and major HVAC parameters are
based on ASHRAE 90.1-2010, Appendix G with some variation for simplicity’s sake. All results
are presented on the basis of HVAC system EUI in kBtu/ft2/yr units of site energy.
Table 3.2.1-2: Simulation cases
Case Label Description
1 OH - MinOSA (Base) VAV box minimums set to “best practices” consistent with OSA requirements of 0.15 cfm/ft
2
2 OH – 20% min VAV box minimums set to 20 percent, as per ASHRAE 90.1(2010)
3 OH – MinOSA, no core htg
Case 1 but with no reheat for interior boxes; similar to UFAD
4 UF - common plenum UFAD with common plenum
5 UF – series plenum UFAD with series plenum
6 UF- ducted perimeter UFAD with ducting directly to perimeter diffusers (no thermal decay)
7 UF – Increased stratification + common plenum
UFAD with increased stratification by doubling number of perimeter diffusers
8 UF – occupant control + common plenum
UFAD with cooling setpoints increased to 25 degrees Celsius (C) (77 degrees F)
9 UF – combo Combination of ducted perimeter, increased stratification, and occupant control (Cases 6, 7, 8 combined)
Findings – Energy performance. Figure 3.2-5 shows results from a comparison of energy
performance between the strategies described above as well as an additional “combo” case,
which shows the combined effects of increased diffusers, ducted perimeter plenum, and
personal control. Included in this figure is the percentage difference (shown as percentage
change) between each of the cases and the baseline OH simulation. Negative numbers indicate
energy reductions (i.e., savings).
It is clear from Figure 3.2.1-5 that most of the savings result from savings in heating and there
are only savings in both electric loads and heating for the cases on the far right of the figure
(cases 8 and 9 in Table 3.2.1-2). The decrease in heating energy for UFAD is about 45 percent,
overall. The overall HVAC savings reflects the net effect of these trends. The heating trends
tend to mask the impact on the electric loads that support cooling; for example, electric energy
use increases from approximately 7-12 percent for the three-plenum configurations. In the
ducted perimeter case, the electric energy penalty is least (approximately 7 percent) but heating
energy is increased by 6 percentage points (due to increased reheat due to lower entering
temperatures to the terminal unit) so the impact on overall HVAC energy is about the same for

80
all plenum cases. See Appendix 3.2.2: UFAD Optimization Study #2 for a detailed discussion of
the heating issues. Although these plenum cases are idealized versions of real systems, the
results indicate that designers should strive to avoid designs that tend to produce the series
case. Cases 8 and 9 show positive savings for both gas and electric that yield decreases of 17
percent and 22 percent, respectively. It is clear that combining strategies delivers the best energy
performance.
Figure 3.2.1-5: Comparisons of energy performance between OH and UFAD and various UFAD design
and operating options
Findings – Comfort performance. For this study, thermal comfort results were presented in
two ways: (1) a comparison between OH and UFAD of zone temperature setpoints not met
(TNM), and (2) some examples of PPD, based on operative temperature, for selected zones.
Tables 3.2.1-3 shows results for temperatures not met where comparisons are made to OH cases
and for the various UFAD options simulated. Table 3.2.1-4 shows PPD results for middle floor
interior and west zones in terms of “too hot” and “too cool” thresholds.
Table 3.2.1-3: Temperatures not met for OH and UFAD
OH MinOSA
(base)
OH 20%
minimum
OH No Core
Heating
Series
plenum
Common
plenum
Ducted
perimeter
Increased
stratification
Occupant
Control Combo
Perimeter cooling 0.0 0.0 0.0 3.7 7.2 10.8 3.3 7.2 6.7
Interior cooling 0.0 0.0 0.0 0.0 0.1 0.2 0.1 0.0 0.1
Perimeter heating 1.9 1.9 2.0 1.5 1.4 1.9 1.4 1.4 1.8
Interior heating 1.6 0.5 8.7 9.6 7.1 5.7 7.4 6.3 5.1
UFADOverhead
Percentage of occupied hours with cooling or heating setpoint not met

81
Table 3.2.1-4: Predicted percent people dissatisfied
MF Core
Jan Feb Mar Apr May Jun Jul Aug Sep Oct Nov Dec
Too cold 19.4 15.3 10.8 10.0 10.2 10.1 9.4 9.5 9.9 9.5 11.9 19.1
Too hot 0.2 0.3 0.4 0.5 0.4 0.4 0.5 0.5 0.4 0.5 0.4 0.2
UFAD
Common
Monthly average Fanger PPD -- Zone :
MF Core
Jan Feb Mar Apr May Jun Jul Aug Sep Oct Nov Dec
Too cold 16.6 12.9 9.8 8.5 8.2 7.8 7.0 7.0 7.3 7.7 10.8 15.6
Too hot 0.3 0.4 0.5 0.6 0.6 0.7 0.8 0.8 0.7 0.7 0.5 0.3
OH MinOSAMonthly average Fanger PPD -- Zone :
MF West
Jan Feb Mar Apr May Jun Jul Aug Sep Oct Nov Dec
Too cold 17.5 15.6 10.9 9.1 7.9 7.0 6.2 6.6 7.7 9.0 13.0 17.4
Too hot 0.3 0.5 0.8 1.2 1.4 1.6 1.9 1.9 1.5 1.1 0.6 0.3
UFAD
Common
Monthly average Fanger PPD -- Zone :
MF West
Jan Feb Mar Apr May Jun Jul Aug Sep Oct Nov Dec
Too cold 27.7 22.6 14.4 10.0 7.5 5.9 5.2 5.5 6.8 9.7 17.5 26.5
Too hot 0.2 0.3 0.6 1.0 1.4 1.7 1.9 1.9 1.5 1.0 0.4 0.2
OH MinOSAMonthly average Fanger PPD -- Zone :
Conclusions. This study indicates that optimized design and operating strategies can deliver
significant benefits relative to conventional OH systems. For example, increased stratification
indicates 11 percent savings, an occupant control strategy yields 17 percent savings, and the
combination case shows savings of 22 percent. The results also show that, at least for the
Sacramento climate, plenum configuration options have little impact relative to one another.
Their overall impact on HVAC energy use is about 8 percent relative to a “best practices” case
for OH systems. The common plenum assumption yields slightly better performance than the
other configurations. However, the savings are heavily skewed by the heating performance
differences, a subject that needs to be studied further.
Overall, the results suggest that simulated thermal comfort does not appear to be significantly
different between the two technologies for any of the various options studied. Unexpectedly, in
winter (for the Sacramento climate) indications are that OH systems are slightly less
comfortable in some areas (e.g., west perimeter zone) due to lower mean radiant temperatures.
However, these results may not accurately reflect real world conditions because it is difficult to
model effects such as drafts.
3.2.1.3 Energy and comfort impacts of supply air temperature settings
In this study a model of a 20,000 ft2 per floor, 3 story office building was used to study the
impact of SAT on energy and comfort performance for a UFAD system with a VSFCU UFAD
system for climate zones represented by Sacramento, CA and San Francisco, CA. Details of
modeling methods including building and system characteristics and findings can be found in
our Simbuild paper (Webster et al. 2010) that is attached as Appendix 3.2.3: UFAD SAT study.
The following findings and conclusions have been excerpted from that paper.
Findings – Energy performance.
Figure 3.2.1-6 shows that, optimum (for systems with fixed SATs) design SAT performance
appears to be climate dependent; 15.6 degrees C (60 degrees F) in Sacramento but 17.2 degrees
C (63 degrees F) for San Francisco due to various tradeoffs. The primary tradeoff is between fan
energy and cooling energy; increased SAT tends to lower cooling energy consumption due to
more economizer hours, but fan energy consumed is increased due to the higher cooling
airflows required. From Figure 3.2.1-6 it is clear that there is a net electric savings as SAT is

82
increased but more so for San Francisco than Sacramento; savings for both appear to level off as
SAT is increased.
As shown in Figure 3.2.1-6, zone heating loads decrease as SAT increases. This is due to
increased concrete slab and raised floor surface temperatures caused by higher temperatures of
the air passing through the underfloor plenum at higher SATs. However, as shown, this effect is
relatively small.
A larger impact is shown for reheat; the reheat portion of the FCU heating energy increases as
SAT increases (i.e., reheat is calculated from the FCU supply volume and the temperature
difference between the room and supply air temperature entering the FCU). This occurs
primarily because the minimum volume of the FCU (i.e., 12 percent of maximum design
volume) is greater due to the larger size FCUs required to accommodate the higher cooling
airflows at higher SATs. The reheat increases despite the fact that the temperature entering the
FCU is higher as SAT is increased; the higher minimum volume dominates this tradeoff. The
entering temperature is higher with increased SAT even though the temperature rise in the
plenum actually decreases; the temperature rise through the plenum is less as airflow increases
with higher SAT, but not enough to lower the FCU entering temperature.
Figure 3.2.1-6: Energy performance sensitivity to SAT
As Table 3.2.1-5 shows, in warm climates like Sacramento, cooling and fan energy changes tend
to offset each other as SAT is increased so there is little difference between SAT 15.6 degrees C
(60 degrees F) and 17.2 degrees C (63 degrees F). In a mild, “good economizer” climate, like San
Francisco, there are noticeable savings at SAT 17.2 degrees C (63 degrees F). However, as shown

83
in the figure and table, heating energy increases with increasing SAT. This increase
counterbalances the net electric savings producing the counterintuitive results shown, yielding,
for example, an optimum SAT for Sacramento of 15.6 degrees C (60 degrees F).
Table 3.2.1-5: Energy savings vs. SAT
Sacramento San Francisco
SAT57°F SAT60°F SAT63°F SAT57°F SAT60°F SAT63°F
Boiler 0 -2.1% 6.7% 0 5.1% 18.6%
Chiller 0 -9.9% -17.6% 0 -23.6% -40.8%
Fans 0 6.3% 23.7% 0 6.2% 23.5%
Auxiliaries 0 -13.1% -22.8% 0 -23.7% -40.8%
Total HVAC 0 -4.9% -3.4% 0 -9.6% -11.3%
Findings – Comfort performance.
Figures 3.2.1-7, 8 show operative temperature histograms for each SAT in each of the two
climates. The curves show cumulative results on the right hand axis. If we assume that heating
conditions occur at operative temperatures below about 21 degrees C (equal to the heating dry
bulb set point), lower SATs appear to affect comfort very little in San Francisco. However, in
Sacramento they have more of an effect; 24 percent below 21 degrees C for SAT =13.9 degrees C
(57 degrees F), and 13 percent for SAT= 15.6 degrees C (60 degrees F), the optimum energy
operating point. With this knowledge, designers can make a judgment about whether to install
a central heating coil in the AHU to mitigate low interior zone temperatures or possibly rely on
occupants controlling their diffuser to manage their comfort instead. Other work by the authors
indicates that these coils can have a significant energy impact. In San Francisco, it appears that
there is little risk of overcooling interior zone occupants which confirms common practice in
this area.
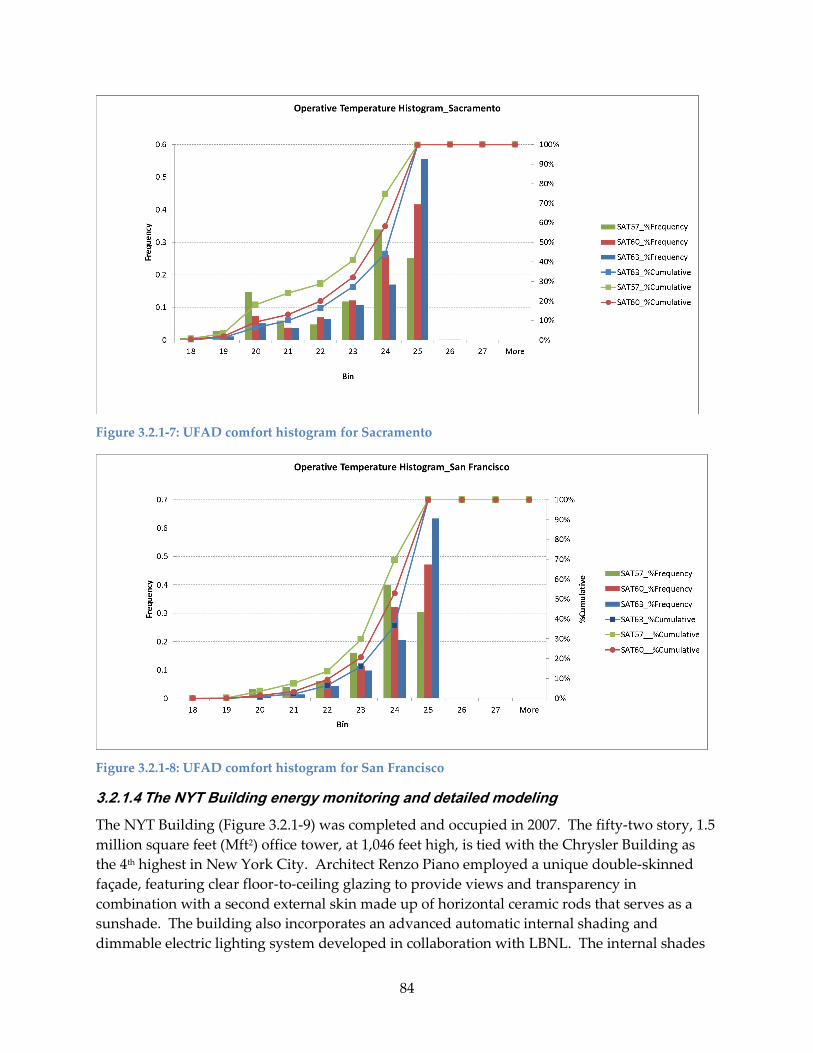
84
Figure 3.2.1-7: UFAD comfort histogram for Sacramento
Figure 3.2.1-8: UFAD comfort histogram for San Francisco
3.2.1.4 The NYT Building energy monitoring and detailed modeling
The NYT Building (Figure 3.2.1-9) was completed and occupied in 2007. The fifty-two story, 1.5
million square feet (Mft2) office tower, at 1,046 feet high, is tied with the Chrysler Building as
the 4th highest in New York City. Architect Renzo Piano employed a unique double-skinned
façade, featuring clear floor-to-ceiling glazing to provide views and transparency in
combination with a second external skin made up of horizontal ceramic rods that serves as a
sunshade. The building also incorporates an advanced automatic internal shading and
dimmable electric lighting system developed in collaboration with LBNL. The internal shades

85
operate to further control solar loads while allowing natural daylight to replace the use of
electric lighting as much as possible. The NYT Company occupies floors 2-27, the first floor is
retail space and an entrance lobby, and the upper floors are occupied by other tenants. UFAD
was installed on all floors occupied by the NYT.
A POE study was sponsored by U.S. DOE’s CBP Program that encourages building owners and
operators to collaborate with research staff at national laboratories and universities to explore
energy-saving ideas and strategies in retrofit and new construction projects. Researchers from
the CBE at UCB and LBNL collaborated on this study with CBE focusing on evaluating the
performance of the UFAD system and end use energy monitoring, while LBNL studied the
shading and lighting performance and developed innovative modeling approaches for
EnergyPlus. This information was used to carefully document energy and comfort
performance in The NYT Building and to estimate the energy savings provided by the energy
saving strategies incorporated in the building (Lee et al. 2013). To accomplish the UFAD study
and energy monitoring, as discussed fully in Appendix 2.1.3: The NYT Building Field
Measurement Report, and in Appendix 3.2.4: The NYT Building End-use Energy Monitoring
and Detailed EnergyPlus Modeling, CBE researchers installed a detailed wireless monitoring
system on the 20th floor, that was selected to represent a typical tower floor of the high-rise The
NYT Building.
Two modeling studies were conducted, one to compare as closely as possible on an apples-to-
apples basis, the performance of a UFAD system with the features of The NYT Building with
that of a conventional OH building, both operating in the same manner in terms of schedules
and setpoints. This was reported in the POE report by Lee et al. (2013)
The objective of the second study reported here and in Appendix 3.2.4, was to incorporate
HVAC and end-use energy monitoring results into a detailed EnergyPlus model that LBNL and
CBE developed. With these inputs, an end use energy comparison between measured and
simulated results can be made. This is considered a first step in a model calibration process and
serves to help understand where to focus further calibrated modeling efforts.

86
Figure 3.2.1-9: The New York Times Building
Methods overview. For this study a detailed EnergyPlus model of the 20th floor of The NYT
Building was developed. This model included innovative methods developed by the LBNL
team to simulating solar and lighting gains (see Figure 3.2.1-10 below). The model consists of
eight perimeter zones, four interior zones, and a service core. The zoning being used in the
EnergyPlus model is a simplification of the actual zoning layout of the building, shown for
comparison in Figure 3.2.1-11. Underfloor air distribution is modeled with the UFAD modeling
routines in EnergyPlus using inputs supplied by CBE corresponding to equipment types used
in the building.8 Sizing was based on the actual sizing of zone equipment rolled up to the
simulation zones as shown in Appendix 3.2.4.
Due to the complex behavior of the automated interior and fixed exterior shading devices, a
novel approach to modeling solar gains on interior surfaces was devised. Instead of modeling
the shades directly in EnergyPlus, a detailed Radiance model was constructed by researchers at
LBNL. The output of the Radiance simulation, that models the building envelope, urban
shadowing, and exterior shades, can be used to generate hourly schedules of solar gains to each
interior surface.
8 Since the variable speed fan coil model was not working for unknown reasons, a standard VAV/reheat
box was substituted and power consumption was back-calculated for the simulation based on a
measured performance curve.

87
Figure 3.2.1-10: Simulation zoning configuration
In order to apply the scheduled solar gains to interior surfaces, special modifications to the
EnergyPlus source code were made. A field specifying a schedule for incident solar radiation
was added to the input definition of the detailed building surface object. Internal to EnergyPlus,
the appropriate schedule value overrode the incident solar gains that would normally be
calculated.
In a similar effort to account for behavior difficult to model with EnergyPlus, solar gains
schedules were added to the detailed fenestration object. Gains schedules derived from
Radiance hourly output were then applied to the two layers of glazing. In addition, the
Radiance model provided solar gains on furniture that were applied in the EnergyPlus model
using the “other equipment” gains object.

88
Figure 3.2.1-11: Actual thermal zoning layout
Summary of results. As shown in Figure 3.2.1-12 the differences between measured and
simulated lighting and plug loads are minimal. For HVAC end uses, due to complexity of
measurement and simulation issues, the comparison between measured data and the
simulation model was performed on a floor and space level (i.e., a loads basis as opposed to
chilled water end use) basis (see Appendix 3.2.4: for assumption details). An overview of the
results is included in Figure 3.2.1-12 below. The methods of ASHRAE Guideline 14 (ASHRAE
2002)9 were used to evaluate the HVAC energy differences. Table 3.2-1 shows a summary of the
errors based on the Nominal Mean Bias Error (NMBE) calculations for comparison on a
monthly basis.
9 This method is normally used for evaluating the results of a full calibration effort but was used here to
evaluate the overall differences for this first level assessment.

89
Figure 3.2.1-12: End use breakdown comparison of measured vs. simulated energy consumption (for
floor cooling and heating models)
Table 3.2.1-6: End uses mean bias errors (NMBE, normalized mean biased error)
End use Floor Cooling Floor Heating AHU Fan Energy
NMBE 19.2% 48.7% 50.7%
Conclusions. As shown in Table 3.2.1-6 the final results comparing monthly measured vs.
simulated HVAC energy use (using floor level loads) shows an average of approximately 20
percent difference between measured and simulated energy use for cooling energy. The
difference for fan energy is approximately 50 percent, but this difference is consistent with the
cooling energy difference when the fan power cubic effect is considered. Heating showed a
larger error of approximately 50 percent.
Considering that this study is just the first phase of a more detailed calibration effort, these
results are to be expected. A next phase effort would focus on reducing these errors by
manipulating details of factors related to loads modeling and the impacts of the uncertainties
outlined in Appendix 3.2.4 using parameter identification via sensitivity studies from a large
data set created from parametric simulations.
3.2.1.5 References
ASHRAE. 2002. “Guideline 14: Measurement of Energy and Demand Savings.” American
Society of Heating, Refrigerating, and Air-conditioning Engineers, Inc. Altanta, GA

90
Lee, E.S., L.L. Fernandes, B. Coffey, A. McNeil, R. Clear T. Webster, F. Bauman, D. Dickerhoff,
D. Heinzerling, and T. Hoyt. 2013. A Post-Occupancy Monitored Evaluation of the
Dimmable Lighting, Automated Shading, and Underfloor Air Distribution System in The
New York Times Building. Lawrence Berkeley National Laboratory, Berkeley CA. January.
Webster, T., K. H. Lee, F. Bauman, S. Schiavon, T. Hoyt, J. Feng and A. Daly. 2010. Influence of
supply air temperature on underfloor air distribution (UFAD) system energy performance.
Proceedings of SimBuild 2010, The 4th National Conference of IBPSA-USA, New York, NY,
August.
Webster, T., T. Hoyt, E. Lee, A. Daly, J. Feng, F. Bauman, S. Schiavon, K.H. Lee, W. Pasut, and
D. Fisher. 2012. Influence of design and operating conditions on underfloor air distribution
(UFAD) system performance. Proceedings of SimBuild 2012. Madison, WI. August 1-3, 2012.
3.2.2 Radiant cooling system design and performance analyses
TABS are gaining popularity as a potentially energy efficient strategy for conditioning
buildings. These systems can use large surfaces for heat exchange, and the temperature of the
cooling water can be only a few degrees lower than the room air temperature. This small
temperature difference allows the use of alternative cooling sources, for example, indirect/direct
evaporative cooling, to possibly eliminate refrigerant cooling to reduce energy consumption. In
addition, TABS allow the potential to reduce the electric power demand of the building if a
night time precooling strategy is used.
3.2.2.1 Goals
This simulation study investigated the application range of using slab-integrated hydronic
radiant cooling, also known as Thermally Activated Building Systems (TABS), with a cooling
tower providing chilled water as the primary way of conditioning the building. The objectives
of this study were the following: 1) quantify the climatic limits of using evaporative cooling
(cooling tower) for radiant ceiling slab system; 2) identify design options to expand the
application; and 3) provide climate based advice for system design and operation.
3.2.2.2 Radiant system design survey
Prior to the simulation study, we conducted a survey of design practitioners, manufacturers,
and top researchers who are experienced with radiant systems to get their feedback on the
scope of our study. The survey was intended to provide practical design and control
information, and to ensure the simulation models were configured to represent design practice
to the extent possible. Selected findings from the survey are summarized below.
Compared to embedded radiant ceiling systems, radiant floor systems are the most
commonly used, and HVAC professionals have more experience designing them
successfully. One survey respondent estimated that among all the embedded radiant
projects, only 5 percent are radiant ceiling systems. Another survey respondent stated
that he usually designs radiant ceiling based systems when the building is five stories
or greater, and design floor based systems when the building is less than five stories.
Radiant floor systems are a popular application in large rooms with high ceilings and
when they can be used for the absorption of solar loads.

91
Tube depth: The depth of the hydronic tubing in the slab depends on construction and
technique, and whether exploitation of the slab thermal inertia is considered. Also
construction concerns are important: 2” depth of the tubes in the concrete is a code
requirement in Canada to allow the minimum 1.5” concrete coverage to the reinforcing
bars in the slab to meet fire ratings. When designing radiant ceiling systems, the
normal practice is to tie the tubes for a radiant ceiling system to the tops of the bottom
layer of reinforcing bars.
Pipe diameter: The most commonly used pipe sizes are 1/2” , 5/8”, and 3/4”. The tubing
diameter is a function of the size of the radiant zones, floor plate size and economics: on
smaller radiant slab systems, 1/2” or 5/8” tubing is used. For larger zones, there is
usually no special requirement, but it is common to use 3/4” tubing for additional
gallons per minute (GPM) and increased loop length; this can minimize the number of
manifold cabinets and their size.
Tube spacing: The spacing between tubing generally ranges from 6 inches to 12 inches,
on center, and spacing is defined by the bend radius of the particular tube diameter
being used, and the desired average slab surface temperature . Where maximum
cooling effect is desired, tighter tube spacing is used to get a very consistent slab surface
temperature. Where the cooling load/output is less critical and a minor amount of
thermal striping is tolerable, twelve inch spacing is feasible for economic reasons.
A cooling tower can be used for supplying cold water under suitable climatic conditions.
Ground source heat pumps are another alternative that is often considered. However,
more conventional design is seen in practice because of concerns about the limited
capacity of cooling towers and the high first costs of installing ground source heat
exchangers. A chiller is the most frequently used source for chilled water.
Controlling solar heat gain (shading) is important in the success of a radiant cooling
project.
3.2.2.3 Modeling approach
EnergyPlus v7.2 was used for the simulation study in Sacramento, San Francisco, Phoenix, and
Atlanta. For each climate zone studied, a single-floor medium office building was simulated.
The radiant cooling system was an exposed hydronic-based ceiling slab. Minimum ventilation
air was provided in the baseline model by a dedicated outdoor air system (DOAS) with proper
humidity control.
The model envelope construction was compliant with ASHRAE 90.1-2010 (ASHRAE 2010). One
improvement in the prototype building was the shading system. The survey results and
literature study indicated that a key component of a successful TABS project is to control the
solar heat gain. Since this study aims to evaluate the application potential of TABS integrated
with evaporative cooling, shading systems were designed to the extent possible to minimize
direct solar heat gain.
For all climates, we started the analysis with the baseline model. For some climates where the
base design alone was not able to ensure thermal comfort for the hottest periods, we explored
other options such as expanding the thermal comfort zone by increasing air movement with
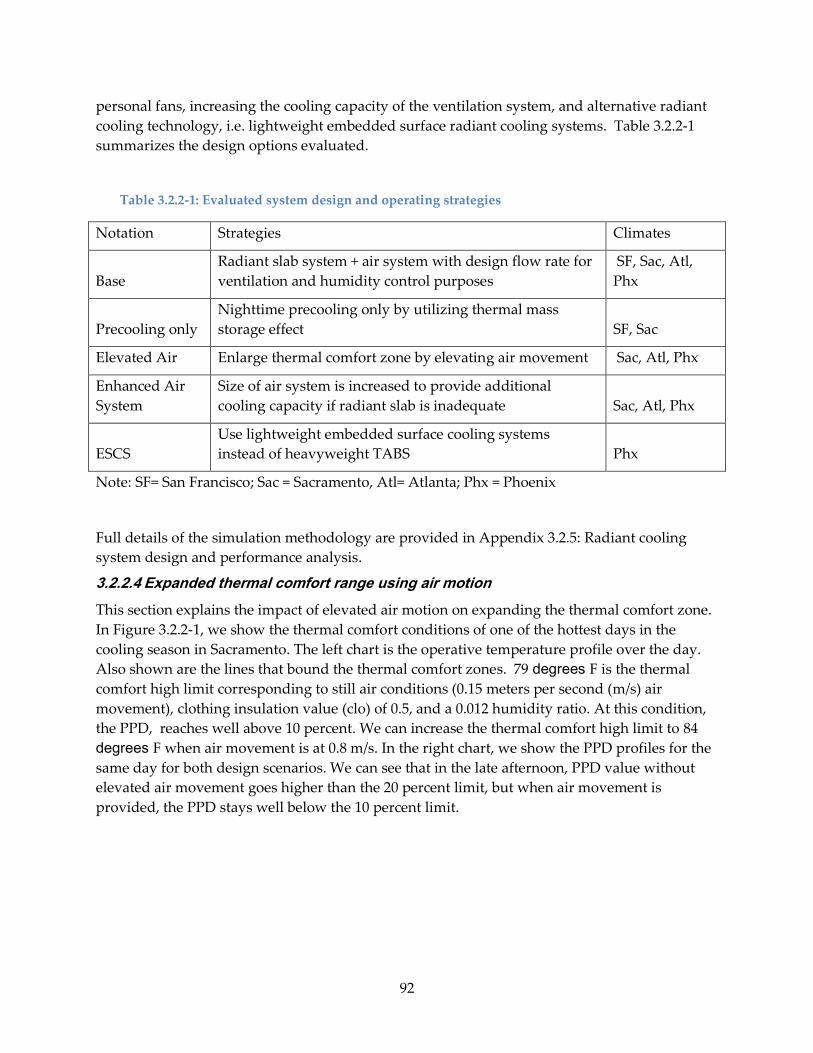
92
personal fans, increasing the cooling capacity of the ventilation system, and alternative radiant
cooling technology, i.e. lightweight embedded surface radiant cooling systems. Table 3.2.2-1
summarizes the design options evaluated.
Table 3.2.2-1: Evaluated system design and operating strategies
Notation Strategies Climates
Base
Radiant slab system + air system with design flow rate for
ventilation and humidity control purposes
SF, Sac, Atl,
Phx
Precooling only
Nighttime precooling only by utilizing thermal mass
storage effect SF, Sac
Elevated Air Enlarge thermal comfort zone by elevating air movement Sac, Atl, Phx
Enhanced Air
System
Size of air system is increased to provide additional
cooling capacity if radiant slab is inadequate Sac, Atl, Phx
ESCS
Use lightweight embedded surface cooling systems
instead of heavyweight TABS Phx
Note: SF= San Francisco; Sac = Sacramento, Atl= Atlanta; Phx = Phoenix
Full details of the simulation methodology are provided in Appendix 3.2.5: Radiant cooling
system design and performance analysis.
3.2.2.4 Expanded thermal comfort range using air motion
This section explains the impact of elevated air motion on expanding the thermal comfort zone.
In Figure 3.2.2-1, we show the thermal comfort conditions of one of the hottest days in the
cooling season in Sacramento. The left chart is the operative temperature profile over the day.
Also shown are the lines that bound the thermal comfort zones. 79 degrees F is the thermal
comfort high limit corresponding to still air conditions (0.15 meters per second (m/s) air
movement), clothing insulation value (clo) of 0.5, and a 0.012 humidity ratio. At this condition,
the PPD, reaches well above 10 percent. We can increase the thermal comfort high limit to 84
degrees F when air movement is at 0.8 m/s. In the right chart, we show the PPD profiles for the
same day for both design scenarios. We can see that in the late afternoon, PPD value without
elevated air movement goes higher than the 20 percent limit, but when air movement is
provided, the PPD stays well below the 10 percent limit.

93
Figure 3.2.2-1: Example showing expanding thermal comfort range with air motion
3.2.2.5 Results
For evaluation of predicted thermal comfort, we considered not only the total number of hours
that the zone operative temperatures are outside of the thermal comfort zone, but also the
severity of deviation from the comfort zone. In order to do this, the Method C PPD weighted
criteria proposed in EN 15251 Appendix F (CEN 2007) was used for long-term thermal comfort
evaluation. In this method, the overall percentage of exceedance, i.e. the time during which the
actual predicted mean vote (PMV) exceeds the thermal comfort boundaries, is calculated as the
product of a weighting factor and the time for a characteristic working period during a year.
The weighting factor used is a function of the actual PPD. In Appendix G of the same standard,
the recommended threshold for acceptable deviation is that the percentage of exceedance in
rooms representing 95 percent of the total occupied space is not more than 5 percent of
occupied hours of a day, a week, a month and a year. This 5 percent limit has been used in the
analysis of results presented below.
San Francisco. San Francisco has a very mild climate with an average wet-bulb temperature of
55 degrees F during the cooling season, and 100 percent of the time the wet-bulb temperature
stays below 68 degrees F. For this climate condition coupled with a well-designed shading
system for the building, cooling demand was minimized in the simulated model. For San
Francisco, the base design with the pre-cooling only option, was able to provide acceptable
thermal comfort at all times, with hot exceedance eliminated.
Sacramento. Sacramento features a warm and dry summer season with more than 10 percent of
the year having dry-bulb temperatures higher than 86 degrees F and an average wet-bulb
temperature at 60 degrees F during the cooling season. Due to the large average diurnal wet-
bulb temperature variation during the cooling season of about 15 degrees F, Sacramento has
excellent potential for the precooling strategy.
Figure 3.2.2-2 presents the thermal comfort results of all design cases. The red dashed line is the
5 percent exceedance high limit required in EN 15251-2007.

94
Figure 4 indicates that if a cooling tower can be made available for 24 hours a day, the base
design, TABS with minimum ventilation air, can achieve acceptable thermal comfort
performance. If cooling was provided only at night by pre-charging the slab, the hot exceedance
level is 5.8 percent, higher than the 5 percent threshold. However, if elevated air motion can be
provided to the space, the exceedance level can be pulled down to 0.17 percent.
Figure 3.2.2-2: Exceedance of weighted PPD too warm for Sacramento
A complete description of all findings, including results for Atlanta and Phoenix, are presented
in Appendix 3.2.5: Radiant cooling system design and performance analysis.
3.2.2.6 Conclusions
Key conclusions are summarized below.
In general, elevated air motion can dramatically reduce the hot discomfort level for most
of the design options and climates.
Evaporative cooling can be used as the only cooling source for TABS in San Francisco.
Hot discomfort can be eliminated by simply precooling the slab.
The base design option in Atlanta creates a 40.8 percent hot exceedance level. However,
with elevated air motion, the hot exceedance level can be dramatically reduced to 4.8
percent. For Atlanta, another design option evaluated was to enhance the cooling
capacity of the air system by increasing the design air flow rate to 1.5 times the
minimum ventilation flow rate. This can reduce the hot exceedance level to 6.4 percent,
and with elevated air motion, hot discomfort can be eliminated.
For Phoenix, using evaporative cooling as the primary cooling source for TABS cannot
satisfy the thermal comfort requirement unless the cooling capacity on the air side is
significantly enhanced. However, using lightweight ESCS, instead of using the
heavyweight TABS, plus using an air system with a design air flow rate tripling the
minimum requirement, can reduced the discomfort level to 26.6percent, thanks to the

95
higher cooling capacity of the ESCS compared to the TABS. For this design option, if
elevated air motion is provided, the discomfort level can be further reduced to
4.4percent.
3.2.2.7 References
CEN. 2007. EN 15251-2007: Indoor environmental input parameters for design and assessment of
energy performance of buildings addressing indoor air quality, thermal environment, lighting
and acoustics. European Committee for Standardization.
ASHRAE. 2010. ANSI/ASHRAE/IES Standard 90.1-2010: Energy standard for buildings except low-
rise residential buildings. Atlanta: American Society of Heating, Refrigerating and Air-
Conditioning Engineers.
3.2.3 Personal comfort systems modeling
PCSs save energy by enabling wide ambient air temperature ranges while providing adequate
comfort. The paper by Hoyt et al. (2009) (Appendix 3.1.4: Energy saving by expanding
setpoints) describes how energy was saved through expanding setpoints. Roughly 5 percent of
total HVAC energy is consumed per degree Fahrenheit of extra heating or cooling.
PCSs permit widened thermostat temperature setpoint ranges due to the ability of occupants to
control their local environment. PCSs consume little energy (4W for a personal fan, 40W for a
footwarmer) and thus contribute a relatively small portion of the total energy consumed by a
building. Modeling the PCS directly is thus not necessary to predict the energy savings that can
be realized with PCSs. The primary factor in the resulting energy consumption in a building
equipped with PCSs is the thermostat setpoint range permitted where there is no central
heating or cooling.
3.2.3.1 Energy savings simulations
Modeling a wide thermostat setpoint range can be done using the existing capabilities of
EnergyPlus. A parametric study was carried out to assess the potential of PCSs as a technology
that saves energy by permitting wider thermostat setpoints. EnergyPlus simulation reference
models created by the U.S. DOE (U.S. DOE 2012) were used to represent realistic engineering
practices and serve to simplify the assumptions made in the simulation study. By using these
reference models and targeting medium-sized office buildings, we achieved the highest level of
generality without creating a large number of energy models. In this study we targeted three
domains of analysis using the Medium Office U.S. DOE reference model:
1. New construction - zone heating and cooling setpoints are implemented at the design
stage
2. Existing buildings - constructed in or after 1980 when only the zone setpoints are
altered
3. Existing buildings - as in (2) but with zone setpoints and maximum VAV terminal
flowrates altered as part of a low-cost control retrofit.
The nominal setpoint range was 70 degrees F – 72 degrees F. The simulations and analysis were
carried out for 7 cities, each representative of an ASHRAE climate zone. The cities and

96
respective climate zones are Miami (1A), Phoenix (2B), Fresno (3B), San Francisco (3C),
Baltimore (4A), Chicago (5A), and Duluth (7). The U.S. DOE reference buildings include models
tailored specifically for each of these climates.
Upon execution of each simulation, EnergyPlus performs a detailed load calculation to size
central and terminal equipment (e.g. nominal capacity of central cooling coils) as well as fix
control variables (e.g. maximum VAV terminal flow rate), that determine how the equipment is
operated during the simulation. This process is known as autosizing. In case (1) above, all
equipment is autosized, representing a building that may be designed according to specific
heating and cooling setpoints. In order to represent case (2), we held fixed the sizing results
from the nominal case where the setpoint range is 70 degrees F – 72 degrees F, and altered only
the heating and cooling setpoints in the remaining simulations. In case (3), the sizing results
from the nominal case are held fixed, with the exception of VAV terminal maximum air flow
rates, which are autosized. This assumption represents the ability to reduce maximum airflow
settings in VAV terminals without any hardware modifications.
During the study we discovered that the VAV Minimum Volume Setpoint (MVS) is a highly
significant factor in determining the savings of thermostat setpoint adjustments. A rule of
thumb in engineering practice is to specify the MVS as a fraction of the VAV unit’s maximum
flow capacity. The U.S. DOE reference models use 30 percent for the MVS Fraction, and it is
common for engineers to implement values as high as 50 percent. Flow rates at this level
provide a significant amount of cooling, in effect continuing to cool the zone well below the
cooling setpoint and down to the heating setpoint despite high outside air temperatures, a
phenomenon known as overcooling. This restricts the energy savings that can be realized by
PCSs as a result of increasing the cooling setpoint and/or decreasing the heating setpoint,
because less time is spent in the region between the setpoints where air is supplied at the
minimum volume. Thus we repeated the simulations representing the three domains above,
changing only the MVSs to 10 percent. Earlier research has shown that MVSs can be reduced to
approximately 10 percent (or less), and still provide adequate mixing and fresh air, satisfying
building codes such as California’s Title-24.
The following table (Table 3.2.3-1,2), for Fresno and San Francisco climate zones, summarize the
HVAC energy consumption resulting of increasing the cooling setpoint and decreasing the
heating setpoint separately; case (3) above, with low MVSs. PCSs have been shown to provide
comfort in the room temperature range of 66-80 degrees F.
Unexpectedly, raising the cooling setpoint reduced the heating energy consumption of terminal
units. This occurred due to less overcooling of the zone that occurs during warm periods when
air is supplied at a low temperature. When the thermostat setpoint range is small, it is common
for the cooling provided by air terminals at minimum volume to drive the zone to the heating
setpoint. This causes the heating coils to activate and provide enough heat to maintain the
heating setpoint, consuming significant energy. This phenomenon has been observed in
practice, and the simulations demonstrate the effect strongly.
Table 3.2.3-1: HVAC energy savings for various room cooling and heating setpoints, Fresno

97
Fresno Energy Consumption [kBTU/sf-year] Energy Savings [%]
Cooling Setpoint
[°F] HVAC Heating Cooling Fans HVAC Heating Cooling Fans
72 17.6 4.5 10.4 1.6 Baseline
76 13.6 3.3 8.1 1.2 23 26 23 25
80 10.6 2.7 6.2 1.1 40 39 41 35
Heating Setpoint
[°F]
70 17.6 4.5 10.4 1.6 Baseline
68 16.3 3.2 10.4 1.6 7 28 0 0
66 15.5 2.4 10.4 1.6 12 47 0 0
Table 3.2.3-2: HVAC energy savings for various room cooling and heating setpoints, San Francisco
San Francisco Energy Consumption [kBTU/sf-year] Energy Savings [%]
Cooling Setpoint
[°F] HVAC Heating Cooling Fans HVAC Heating Cooling Fans
72 7.97 2.92 3.35 1.19 Baseline
76 5.47 1.68 2.33 0.95 31 42 30 20
80 3.89 1.16 1.55 0.85 51 60 54 29
Heating Setpoint
[°F]
70 7.97 2.92 3.35 1.19 Baseline
68 6.63 1.59 3.31 1.18 17 46 1 1
66 5.88 0.84 3.30 1.18 26 71 1 1
Figure 3.2.3-1 shows the energy savings for cooling setpoints ranging from 72-86 degrees F
showing total HVAC savings as high as 68 percent in San Francisco, and for heating setpoints
ranging from 64 degrees F-70 degrees F showing savings as high as 31 percent in San Francisco.
PCSs have been shown to provide comfort within these even wider ranges in laboratory studies,
suggesting a practical limit may be similar.

98
Figure 3.2.3-1: HVAC Energy Savings from widened thermostat setpoints in various climates
3.2.3.2 References
Hoyt, T., K.H. Lee, H. Zhang, E. Arens, and T. Webster. 2009. Energy savings from extended air
temperature setpoints and reductions in room air mixing. Proceedings from International
Conference on Environmental Ergonomics, Boston, August 2 – 7.
DOE. 2012. U.S. Department of Energy Commercial Reference Buildings
http://www1.eere.energy.gov/buildings/commercial/ref_buildings.html
3.3 Thermal Comfort Research
The goal of Task 3.3 is to integrate UCB Thermal Comfort Model, a thermal physiology and
comfort model, into newly available building energy models capable of simulating detailed
interior environmental conditions, and to develop applications of the joint tool that improves
designers’ ability to design advanced non-uniform environments.
3.3.1 Linking to Simulink
To integrate the UCB Thermal Comfort Model to other third-party applications and tools that
provide environmental conditions, we developed a UCB Comfort C-API interface that can be
executed by third party applications such as COMFEN and Simulink. COMFEN is a tool
designed to support the systematic evaluation of alternative fenestration systems for project-
specific commercial building applications, and provides environmental conditions including
surface temperature. Simulink® is a data flow graphical programming language tool widely
used in control theory and digital signal processing for multi-domain simulation and Model-
Based Design. It can be programmed so that the environmental conditions can be predicted.
Once the environmental conditions are predicted with these third-party tools, they can call

99
(connect to) the UCB Thermal Comfort Model to predict thermal comfort based on the
environmental conditions.
We have already successfully linked the CBE Thermal Comfort Model to Simulink in Matlab.
Using MATLAB, one can analyze data, develop algorithms, and create models and applications.
The primary demo codes have been successfully executed. All of the codes are able to
encapsulate in a self-defined block in Simulink and other common blocks can be further
designed based on the need to achieve further simulation.
The two essential considerations for the C-API interface are 1) It has a complete graphic user
interface (UI); 2) It provides integration capability to enlarge the third-party applications. Figure
3.3.1-1 shows how the comfort model is linked to a third-party application tools.
Tools (like Simulink) need to
support languages like C to
enlarge their capability;
Tools will get comfort results by
providing ambient conditions like
air temperature, solar load,
clothing, etc.
UCB Comfort C-API is a C library
with a series of regular C functions
that are called in any tools
supporting Microsoft Visual C++
(MSVC) programming like
Simulink’s S function;
C-API establishes “phases” and
simulation conditions (like air
temperature, panel temps, relative
humidity (RH), etc.) in each phase,
step by step by way of calling a C-
function;
C-API invokes comfort model, an
integration version of comfort
model to a run simulation and
receives simulation result.
An integration version of comfort
model is developed to support
integration to the other applications.
Figure 3.3.1-1: Logic of the linking of the Berkeley comfort model with the third-party application tool
that simulates environmental conditions

100
3.3.2 Calculation of Diffuse and Direct Solar Load on Occupants through shades and blinds (a new software tool, SoLoCalc – solar load calculator)
CBE comfort model has linked to COMFEN, WINDOW6 through the XLM data exchange
format. COMFEN and WINDOW6 are widely used and publically available software packages.
COMFEN simulates interior surface temperatures for a room (windows, window frames, and
walls). WINDOW6 simulates solar load through different window systems. One significant
addition of the WINDOW6 is that it simulates direct and diffuse solar load through complex
fenestration systems such as shades and blinds. These shading systems are common in
commercial construction projects as they reduce the solar load for a building and therefore
reduce the need for room conditioning while offering a wide range of design opportunities.
To use this feature so that the CBE advanced comfort model can predict comfort with shades
and blinds, we programmed software that locates the direct and diffuse solar radiation from
WINDOW6 to each of 16 body parts of a thermal manikin solar load calculator (SoLoCalc), a
necessary step for detailed comfort predictions.
SoLoCalc calculates the solar load on a person in the perimeter zone of a transparent façade in
consideration of the incidence angle of the sun and the diffuse/direct distribution of incident
and transmitted radiation. It is based on bi-directional scattering distribution functions (BSDF).
This information is provided from WINDOW6 (free downloadable software:
http://windows.lbl.gov/software/window/window.html) in the form of a matrix where the
columns represent the hemispherical incidence angle (“outer hemisphere”) and the rows
represent hemispherical transmission into the room (“inner hemisphere”). This concept allows
for easy access to the necessary data during the simulation.
The knowledge of the three-dimensional transmission through the transparent façade enables
the detailed calculation of the solar load on a person behind this façade. To achieve this, two
steps are carried out: First the incidence angle on the façade has to be determined dependent on
the location, hour and day of the year and orientation of the façade. This incidence angle
(expressed in spherical coordinates) gives the information that a column of the BSDF matrix has
to be chosen. Second, for the so determined incidence angle, the three-dimensional transmitted
energy has to be attributed to the body parts of the person sitting (or standing) behind the
façade. These values can be derived from the rows of the BSDF matrix.
While the coupling of the outer hemisphere to a given solar incidence angle is straightforward,
the linking of the transmitted energy to the occupant, needs a new approach. The approach that
was chosen in the new method is to use viewfactors for solar radiation. Using viewfactors in the
calculation of radiation transfer is justified where the emitter can be considered as uniformly
diffuse, that is only true for ideally diffusing systems. Nevertheless, in this approach the
viewfactor method is applicable for not-ideally scattering systems due to the incremental nature
of the data. In the BSDF files the inner hemisphere is subdivided into a substantial number of
“bins.” Each bin corresponds hereby to a defined solid angle on the unit sphere. The viewfactor
method treats the emitting surface as a uniform diffuse emitter for this solid angle. The emitted
heat flux is the amount of solar load transmitted in this particular direction (Figure 3.3.2-1).

101
Figure 3.3.2-1: Linking the 3-D transmission to the solar load on certain body parts
For the chosen approach it is necessary to subdivide the geometrical description of the occupant
(called “manikin”) into small plane polygons where a group of polygons represents a body
segment. It is also necessary to subdivide the façade into partial areas. Figure 3.3.2-2 shows an
example of the meshed manikin behind the façade.
Figure 3.3.2-2: Meshing of manikin (1356 polygons) and façade (64 polygons)
For the viewfactor calculation the open source shareware View3D is used
(http://view3d.sourceforge.net/) to handle the number of surfaces and the amount of blocking.
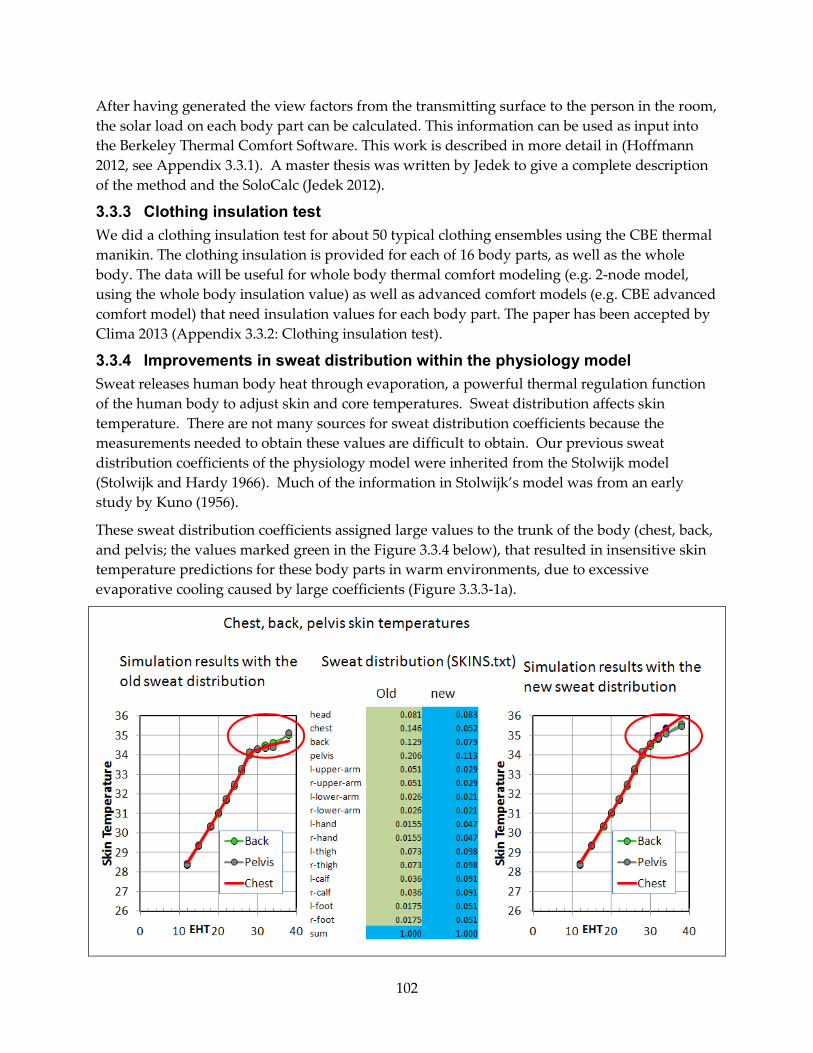
102
After having generated the view factors from the transmitting surface to the person in the room,
the solar load on each body part can be calculated. This information can be used as input into
the Berkeley Thermal Comfort Software. This work is described in more detail in (Hoffmann
2012, see Appendix 3.3.1). A master thesis was written by Jedek to give a complete description
of the method and the SoloCalc (Jedek 2012).
3.3.3 Clothing insulation test
We did a clothing insulation test for about 50 typical clothing ensembles using the CBE thermal
manikin. The clothing insulation is provided for each of 16 body parts, as well as the whole
body. The data will be useful for whole body thermal comfort modeling (e.g. 2-node model,
using the whole body insulation value) as well as advanced comfort models (e.g. CBE advanced
comfort model) that need insulation values for each body part. The paper has been accepted by
Clima 2013 (Appendix 3.3.2: Clothing insulation test).
3.3.4 Improvements in sweat distribution within the physiology model
Sweat releases human body heat through evaporation, a powerful thermal regulation function
of the human body to adjust skin and core temperatures. Sweat distribution affects skin
temperature. There are not many sources for sweat distribution coefficients because the
measurements needed to obtain these values are difficult to obtain. Our previous sweat
distribution coefficients of the physiology model were inherited from the Stolwijk model
(Stolwijk and Hardy 1966). Much of the information in Stolwijk’s model was from an early
study by Kuno (1956).
These sweat distribution coefficients assigned large values to the trunk of the body (chest, back,
and pelvis; the values marked green in the Figure 3.3.4 below), that resulted in insensitive skin
temperature predictions for these body parts in warm environments, due to excessive
evaporative cooling caused by large coefficients (Figure 3.3.3-1a).

103
a) Old sweat distribution coefficients b) New sweat distribution coefficients
Figure 3.3.3-1: Skin temperature predictions with old and new sweat distributions (resting, nude body)
In recent years, Park and Tamura (1992) have measured local sweat distributions for resting
nude people under various ambient conditions from 25-28 degrees C. The sweat distributions
under ambient air temperature between 34 degrees C and 38 degrees C are similar, but they are
different from the distributions at the lower ambient air temperatures. Because warm
environments generally are the cause of sweat, we used the distributions pertaining to warm
conditions. The values in the above figure (the column marked blue) are the calculated
distributions based on measured data under a 34 degrees C environmental condition. The
coefficients for the trunk regions (chest, back, and pelvis) are much smaller than the old values,
but the values for hands and feet are larger.
The skin temperatures for the chest, back, and pelvis with the new sweat distributions from
Park and Tamura are shown in the right figure above (Figure 3.3.3-1b). Gone is the flat shape
representing skin temperature in warm environments as shown in the left figure, instead, the
skin temperatures for these body parts increase significantly as the ambient air temperature
increases from 30 degrees C to 38 degrees C.
Below 26 degrees C the skin temperatures with both old and new sweat distributions are very
similar (comparing Figure 3.3.3-1a & b) because the sweat distributions have little effect on skin
temperatures under cool conditions.
Comparisons with measured data. We compared simulated skin temperatures using the old
and new sweat distributions against measured data from Werner (1980). He measured nude
subjects’ skin temperatures under supine resting conditions for air temperatures between 10-50
degrees C. The skin temperature sensors were exposed to the ambient air without a covering
layer of tape.
Figure 3.3.3-2 (below) shows results for chest, pelvis, and feet. The solid lines are the simulated
skin temperatures with both new and old sweat distributions. The red dots represent Werner’s
measured skin temperatures.

104
Chest.

105
Pelvis.
Feet.
Figure 3.3.3-2: Comparison of measured and predicted skin temperatures
With the new sweat distributions, the simulated skin temperatures under warm conditions
(between 30 – 50 degrees C) for the chest and pelvis are much higher than the simulated results
with the old sweat distributions, and they are much closer to the measured data. The simulated
foot skin temperature is lower, but also closer to the measured data.
We are now completing this work by examining the effect of exercise on our sweat distribution
coefficients. We are doing this with data from Cotter et al. (1995), and Smith and Havenith
(2010).
3.3.5 References
Cotter, J.D., M.J. Patterson, N.A. Taylor. 1995. The topography of eccrine sweating in humans
during exercise. European Journal of Applied Physiology and Occupational Physiology, 71:549–
554.
Hoffmann, S., C. Jedek, and E. Arens. 2012. Assessing thermal comfort near glass facades with
new tools. Presented in BEST3 Building Enclosure Science and Technology, Atlanta, April.
Jedek, C. 2012. Calculation of the Solar Load onto Occupants in a Room using Bidirectional
Scattering Distribution Functions and a View Factor Approach. Master’s thesis,
http://escholarship.org/uc/item/9j11b4z9#page-1
Kuno, Y. 1956. Human perspiration. Charles C. Thomas Publ., Springfield.

106
Park, S.J. and T. Tamura. 1992. Distribution of evaporation rate on human body surface. Annals
of Physiological Anthropology, 11 (6): 593 – 609.
Smith, C.J., and G. Havenith. 2010. Body mapping of sweating patterns in male athletes in mild
exercise-induced hyperthermia. European Journal of Applied Physiology.
Stolwijk, J.A.J., and J.D. Hardy. 1966. Temperature regulation in man — a theoretical study.
Pflugers Archive: European Journal of Applied Physiology, 291:129–62.
Werner, J., and T. Reents. 1980. A contribution to the topography of temperature regulation in
man. European Journal of Applied Physiology, 45, 87 – 94.

107
4 CHAPTER 4: Technology Transfer Activities
The goal of Task 4.0 is to make the knowledge gained, experimental results and lessons learned
available to key decision-makers. This will include encouraging that revisions to ASHRAE
standards be made in an energy-conscious manner, reflecting the full range of design and
technology choices available today. In addition, modeling improvements to EnergyPlus,
EnergyPro, and eQUEST in support of Title 24 will be continued. Work will also be performed
to assist ASHRAE in developing Handbook chapters, revising the UFAD Design Guide, and
developing Special Publications that adequately reflect new technologies and advanced design
concepts. Finally this task will also include conducting workshops for practitioners addressing
the building technologies being developed at CBE.
4.1 ASHRAE Standard 55: Thermal Environmental Conditions for Human Occupancy
4.1.1 Moving air for comfort
The ASHRAE Standard 55 (prior to version 2010) viewed air movement primarily as a source of
drafts, and restricts air movement to almost imperceptible levels unless it is under the personal
control of the occupants. CBE studies in buildings have without exception shown a strong
preference for more air movement in neutral and warm temperatures, in direct conflict with the
standard’s requirements. The standard causes substantially more discomfort due to lack of air
movement than it averts by preventing drafts. By preventing air movement cooling, it also
restricts an attractive option for improving building energy efficiency.
CBE's Ed Arens and Hui Zhang drafted a new proposal allowing elevated air movement in
warm environments to the ASHRAE Standard 55, answered questions at the Standard
committee in ASHRAE Standard 55 committee after the public review. The new proposed
standard that allows elevated air movement for comfort (and also removed the draft limit
section) has been published in the ASHRAE Standard 55-2012 (Figure 4.1.1-1). A paper
describing the new standard, co-authored by Ed Arens, Hui Zhang, and Gwelen Paliaga (Taylor
Engineers) has been published by ASHRAE Journal (Arens et al. 2009) that is included as
Appendix 3.4.1: Moving air for comfort.

108
Figure 4.1.1-1: Elevated air speed for warm air temperatures in ASHRAE Standard 55-2010
4.1.2 Are ‘Class A’ Temperature Requirements Realistic or Desirable?
It requires more energy to maintain a narrow indoor temperature range than a broader range.
Circa 2009, there was a proposal to tighten the ASHRAE Standard 55 temperature range to
categorize buildings as class A, B, and C, based on how tightly the room air temperature was
controlled. Was tightening the temperature range necessary, from the occupants’ perspective,
or even technically defensible? Four databases of occupant satisfaction in buildings were used
to examine the acceptability of the International Organization for Standardization (ISO) and
European Class A, B, and C control ranges that were proposed for ASHRAE Standard 55. The
Class A range was found to confer no satisfactory benefits to either individuals or realistic
occupancies, and the class system was found to be impractical and of dubious validity. A paper
was published by the journal Building and Environment. (Arens et al. 2010) (See Appendix 3.4.2:
No classes in standard). The paper was presented in the ASHRAE Standard 55 committee and
effectively stopped the proposal of indoor environment classifications based on the tightness of
the indoor air temperature control.
4.1.3 Thermal comfort thresholds
Following the paper against the proposal to classify indoor environment based on the tightness
of the indoor air temperature in the ASHRAE standard, we further examined air temperature
thresholds for acceptable comfort in air-conditioned buildings. Using the ASHRAE database of
field studies, where acceptability votes were obtained from occupants, the results showed that
within the thresholds, the acceptability is indistinguishable. Therefore, there is little gain from

109
conditioning spaces to an “optimum” air temperature. Beyond the thresholds, however, there
is a significant drop-off in acceptability. Thresholds are determined for both air-conditioned
and ventilation-cooled buildings in the database. The equally-acceptable range between the
thresholds is 8 – 10 K (Kelvin temperature scale, 1 K is equivalent to unit of 1 degree C) wide in
both types of buildings.
Ideally, air-conditioning would be used only when the environmental conditions are beyond
the thresholds. The use of ceiling fans or personal environmental control systems broadens the
threshold range.
4.1.4 ASHRAE Standard 55 user manual
CBE will work together with Heschong Mahone Group (lead organization), Schoen Engineering,
and Arup to write the user manual for the ASHRAE Standard 55. This is newly approved
funding from ASHRAE.
4.1.5 Additional work for ASHRAE Standard 55
Ed Arens finished draft versions for Sections 5, 6, and 7 for ASHRAE Standard 55.
Currently, the draft versions have been approved by the Standard 55 committee,
passed public review, and is now scheduled for publication in September 2013. 2013.
Ed Arens is working on a solution to incorporate solar load impact on thermal sensation
predictions from the 2-node model, as a way of controlling the effects of unshaded
glass.
CBE thermal comfort web tool for ASHRAE 55-2010. Using the Processing
programming environment for visualizations, CBE has created a java applet to be used
within the web tool. Interactive visualizations of comfort regions within the
psychrometric chart were implemented in the web tool, allowing users to quickly
identify the range of permissible temperatures. An interface showing an example of the
comfort zone in the webtool is presented in Figure 4.1.5-1. The visualization can
efficiently demonstrate the impact of design or policy decisions in buildings. For
example, provisions for extra air movement can be shown to expand the comfort
region, and the ability of occupants to change their clothing can be shown to allow a
large range of temperatures with high acceptability. Designers or students can explore
these scenarios effectively. The tool was also designed to be more user-friendly and
allow side-by-side comparison of input and results. The new version of the tool is now
available as a beta at http://cbe.berkeley.edu/comforttool.

110
Figure 4.1.5-1: ASHRAE thermal comfort web-tool (developed by CBE)
4.2 ASHRAE TC 2.1: Physiology and Human Environment
4.2.1 The Performance Measurement Protocols for Commercial Buildings
This book has been published by ASHRAE (ASHRAE 2010). It was prepared at the request of
the USGBC. It details specific measurements and analysis methods for determining compliance
to the Leadership in Energy and Environmental Design (LEED) rating system, or to other
building standards and codes. Prof. Ed Arens (CBE) wrote a few chapters for the book. The
CBE Occupant Satisfaction Survey and its unique database will be the featured basis for
obtaining and benchmarking occupant response measurements throughout the PMP. The
document also describes how to take physical measurements of the indoor environment for
several levels of comfort assessment.
4.2.2 ASHRAE Performance Measurement Protocols - Best Practices Guide for Building Commissioning
This book has been published by ASHRAE (ASHRAE 2013). Ed Arens wrote several chapters of
the book. In these chapters, several practices are listed as the best practice:
Expanding design deadband based on comfort zones provided by the ASHRAE
Standard 55, that changes with seasons.
Using elevated air movement for comfort in neutral to warm environments.
Promoting personal comfort systems for comfort and expand ambient air temperature
setpoints.

111
Reducing excessive minimum air supply volume.
Providing solar control for glazing.
Providing separate humidity control to reduce summer overcooling.
4.2.3 ASHRAE Project RP-1515
CBE teamed with Taylor Engineering and Price Industries for the ASHRAE project “Thermal
and air quality acceptability in buildings that reduce energy by reducing minimum airflow
from overhead diffusers”. The project ended in November 2012 with a 150 page final report
that described the findings for energy saving, trend data of supply air volume, internal load,
thermal comfort, and lab testing results. An ASHRAE seminar, “Save Energy and Improve
Occupant Comfort with Advanced VAV Zone Controls”, was presented at the Winter 2013
conference in Dallas. Steven Taylor and Gwelen Paliaga from Taylor Engineering, and Ed Arens
from CBE gave the presentation. Approximately 150 people attended the seminar. The seminar
received the highest score among all the seminars. CBE Hui Zhang chaired the seminar.
ASHRAE Golden Gate (GG) Chapter hosted a seminar in December 2012. Gwelen Paliaga from
Taylor Engineering and Hui Zhang from CBE presented the energy saving and comfort results
from the study.
4.2.4 ASHRAE database II development
The goal of the database II development was to collect field study data on thermal comfort since
1997, after ASHRAE Database I was developed. So far, we have put together a database that
includes about 18,000 individual responses from the United States and Europe (Figure 4.2.4-1).
We will continue this data collection. There are about 20 experts participating internationally in
field study data collection. A meeting to discuss the development of the database will be hosted
during the Clima conference in June 2013. Hui Zhang continues to serve as the research sub-
committee chair of TC2.1.
Figure 4.2.4-1: Map of data collection for Database II development

112
4.3 Revision of ASHRAE UFAD Design Guide
In May 2007, ASHRAE formed the Technical Resource Group, TRG7-UFAD, to review and
revise the original Underfloor Air Distribution (UFAD) Design Guide published by ASHRAE in
2003 (Bauman 2003). The goal was to provide new and updated information that was not
available at the time of publication of the original Guide. The information is based on new
research findings and field experience from the large number of UFAD installations that have
occurred since 2003. CBE researchers, Fred Bauman, Tom Webster, Stefano Schiavon, and
Wilmer Pasut attended many meetings of the TRG7-UFAD committee since its formation. The
development of the 2nd edition of the UFAD Design Guide was a collaborative effort by
members of the TRG7-UFAD committee. Based on its extensive research and experience with
UFAD systems, CBE made significant contributions to the new Guide. The table of contents for
the new UFAD Design Guide is listed below. CBE was the lead author for Chapters 3, 8, parts of
11, 14, and 16, with reviews and other contributions to Chapters 1, 2, 5, 6, 7, and 10.
Table of Contents – ASHRAE UFAD Design Guide (2nd edition)
Chapter 1: Introduction
Chapter 2: Room Air Distribution Principles
Chapter 3: Underfloor Air Supply Plenum Principles
Chapter 4: Applications
Chapter 5: UFAD System Configurations
Chapter 6: Diffusers and Terminal Units for UFAD
Chapter 7: Indoor Environmental Quality (Principles and Guidelines)
Chapter 8: Energy Considerations
Chapter 9: Standards, Codes, and Ratings
Chapter 10: Cost Considerations
Chapter 11: Guidance for System Design
Chapter 12: Controls for UFAD Systems
Chapter 13: Guidance for Construction
Chapter 14: Guidance for Building Commissioning
Chapter 15: Guidance for Operations and Maintenance
Chapter 16: References
The final draft of the UFAD Design Guide was approved for publication by unanimous vote of
the TRG7-UFAD committee at the ASHRAE Winter Conference in Dallas, January 2013.
ASHRAE released the final publication of the UFAD Design Guide through the ASHRAE
bookstore at the ASHRAE Annual Conference in Denver, June 2013.
4.4 References
Arens, E., H. Zhang, T. Hoyt, G. Paliaga, B. Tully, J. Goins, F. Bauman, Y. Zhai, J. Toftum, T.
Webster, B. West. 2012. Thermal and air quality acceptability in buildings that reduce
energy by reducing minimum airflow from overhead diffusers, RP-1515 final report to
American Society of Heating, Refrigerating and Air Conditioning Engineers (ASHRAE).
Arens, E., M. Humphreys, R. de Dear, H. Zhang. 2010. “Are ‘Class A’ temperature requirements
realistic or desirable?” Building and Environment 45(1), 4 - 10. Earlier version in Proceedings,

113
International Symposium on the Interaction between Human and Building Environment, July 2-3,
Yonsei University, Korea.
Arens E., S. Turner, H. Zhang, G. Paliaga. 2009. “Moving Air for Comfort,” ASHRAE Journal,
May 51 (5), 8 – 18.
ASHRAE. 2010. Performance measurement protocols for commercial buildings. Atlanta:
American Society of Heating, Refrigerating, and Air-Conditioning Engineers.
ASHRAE. 2013. Performance measurement protocols– Best practice guide for commercial
buildings. Atlanta: American Society of Heating, Refrigerating, and Air-Conditioning
Engineers.
Bauman, F. 2003. Underfloor Air Distribution (UFAD) Design Guide. Atlanta: ASHRAE,
American Society of Heating, Refrigerating, and Air-Conditioning Engineers.
Zhang, H., Arens, E., Pasut, W. 2011. Air temperature thresholds for indoor comfort and
perceived air quality. Building Research Information 39(2), 134 – 144.

114
5 LIST OF APPENDIXES
2.1.1: David Brower Center: Thermal Comfort and Radiant Performance Study
2.1.1a: Radiant Cooling Slab Design, Control and Application
2.1.2: Technical Report on California State Teachers Retirement System Building: UFAD Performance and Blinds Study
2.1.3: The New York Times Building Field Measurement Report
2.2.1: Building Performance Evaluation Toolkit Specifications
2.2.2: BPE Toolkit Wireless Hardware Device Report
2.3.1: Visualizing Energy Information in Commercial Buildings: A Study of Tools, Expert Users, and Building Occupants
2.3.2: Using Social Media Applications for Conserving Energy and Improving Operations in Commercial Buildings
3.1.1: UFAD Modeling Upgrade Summary
3.1.2: UFAD Model Specifications Comparison
3.1.3: CBE EnergyPlus Modeling Methods for UFAD Systems
3.1.4: Cooling Load Differences between Radiant and Air Systems
3.1.5: Performance Specification: Fan, Low Power
3.1.6: Thermal Comfort and Perceived Air Quality of a PCS System
3.1.7: Study of a Personal Environmental Control System Using Opposing Airstreams
3.1.8: Effect of a Heated and Cooled Office Chair on Thermal Comfort
3.2.1: UFAD Energy Optimization Study #1
3.2.2: Influence of Design and Operating Conditions on Underfloor Air Distribution (UFAD) System Performance
3.2.3: Influence of Supply Air Temperature on Underfloor Air Distribution (UFAD) System Energy Performance
3.2.4: The New York Times Building Post-Occupancy Evaluation: Simulation Model Calibration
3.2.5: Radiant Cooling System Design and Performance Analysis
3.2.6: Energy Savings from Extended Air Temperature Setpoints and Reductions in Room Air Mixing
3.3.1: SoloCalc for Complex Fenestration Systems
3.3.2: Clothing Insulation Test
3.4.1: Moving Air for Comfort
3.4.2: Are "Class A" Temperature Requirements Realistic or Desirable?
3.4.3: Air Temperature Thresholds for Indoor Comfort and Perceived Air Quality

115
6 GLOSSARY
Acronym Definition
abs Absolute
ACEEE American Council for an Energy-Efficient Economy
AHU Air Handling Unit
API Application Program Interface
ASHRAE American Society of Heating, Refrigerating and Air Conditioning Engineers
ATU Air Terminal Unit
BIFS Building Information Feedback System
BMS Building Management System
BPE Building Performance Evaluation
BSDF Bi-directional Scattering Distribution Functions
C Celsius
CalSTRS California State Teachers’ Retirement System
CBE Center for the Built Environment, UC Berkeley
CBP Commercial Buildings Partnerships
CFC Chlorofluorocarbon
CFM Cubic Feet per Minute
CFM/ft2 Cubic Feet per Minute per square foot
CIEE California Institute for Energy and Environment
clo Clothing insulation value
DOAS Dedicated outdoor air system
DBC David Brower Center
DV Displacement Ventilation
DX Direct Expansion
ECM Electronically commutated motor
EECS Electrical Engineering and Computer Sciences Department
Energy
Commission California Energy Commission

116
Acronym Definition
EPA United States Environmental Protection Agency
EPlus Table EnergyPlus table
ESCS Embedded Surface Cooling Systems
EUI Energy Utilization Intensity
F Fahrenheit
FPB Fan powered box
FCU Fan Coil Unit
FTU Fan Terminal Unit
GIS Geographic Information System
GPM Gallons per Minute
GSA United States General Services Administration
HVAC Heating, ventilating, and air-conditioning
ICM Indoor Comfort Monitors
IEEE Institute of Electrical and Electronics Engineers
IEQ Indoor Environmental Quality
I/O Input/output
ISO International Organization for Standardization
kBTU/ft2/yr Thousand British Thermal Units per square foot per year
LBNL Lawrence Berkeley National Laboratory
M Million
Mft2 Million square feet
m/s Meters per second
MVS Minimum Volume Setpoint
MySQL Open source structured query language (SQL) database
NMBE Normalized Mean Biased Error
NV Natural ventilation
NYT New York Times
OH Overhead
Opto1 UFAD Optimization Study #1

117
Acronym Definition
Opto2 UFAD Optimization Study #2
OSA Outside Air
Pa Pascals
PCS Personal Comfort System
PEC Pacific Gas and Electric (PG&E) Pacific Energy Center
PECS Personal Environmental Control System
PIER Public Interest Energy Research, administered by California Energy
Commission
PMP Performance Measurement Protocol
PMV Predicted Mean Vote
PNNL Pacific Northwest National Laboratory
Pnpl Pressure between the underfloor plenum and the north adjacent underfloor
plenum
POE Post-Occupancy Evaluation
PPD Predicted Percentage Dissatisfied
Ppd Pressure between the underfloor plenum and the perimeter duct
Prpl Pressure between the underfloor plenum and return plenum
PUCC Portable underfloor commissioning cart
PV Photovoltaic
PWMS Portable Wireless Measurement System
Pwpl Pressure between the underfloor plenum and the west adjacent underfloor
plenum
RAS Room Air Stratification
RCP Radiant Cooling Panel
REHVA Federation of European Heating, Ventilation, and Air-conditioning
Associations
RH Relative humidity
SAT Supply Air Temperature
sMAP Simple Monitoring and Actuation Protocol
SoLoCalc Solar Load Calculator

118
Acronym Definition
TABS Thermally Activated Building Systems
TNM Temperature setpoints not met
UCB University of California, Berkeley
UF Underfloor
UFAD Underfloor Air Distribution
UI User interface
U.S. DOE United States Department of Energy
USGBC United States Green Building Council
VAV Variable Air Volume
Vs. Versus
VSFCU Variable Speed Fan Coil Unit
W Watts
Xlab UCB’s Experimental Social Science Laboratory