Technology survey for renewable energy integrated to bridge ...
292
Statens vegvesens rapporter Technology survey for renewable energy Integrated to bridge constructions Wave and tidal energy Nr. 109 SP Technical Research Institute of Sweden April 2012
-
Upload
khangminh22 -
Category
Documents
-
view
3 -
download
0
Transcript of Technology survey for renewable energy integrated to bridge ...
Statens vegvesens rapporter
Technology survey for renewable energy Integrated to bridge constructions Wave and tidal energy
Nr. 109
SP Technical Research Institute of Sweden
April 2012

Statens vegvesens rapporter
Technology survey for renewable energy Integrated to bridge constructions
Technology survey for renewable energy Integrated to bridge constructions
Daniel Vennetti, SP Daniel Vennetti, SP
Trafikksikkerhet, miljø- og teknologiavde-lingen
Traffic Safety, Environment and Technology
603360 603360
Nr. 109 No. 109
Hoseini Mohammed Hoseini Mohammed
286 286
April 2012 April 2012
Tittel Title
AuthorForfatter
Avdeling Department
Prosjektnummer Project number
Rapportnummer Report number
Prosjektleder Project manager
Seksjon Section
Emneord Key words
Sammendrag Summary
Antall sider
Dato
Pages
Date
Wave and tidal energy Wave and tidal energy SubtitleUndertittel
Godkjent av Approved by
Norwegian Public Roads AdministrationNPRA reports

Wave and Tidal Energy Technology Survey for Ferry Free E39 Project
Daniel Vennetti
SP Structural and Solid Mechanics
SP Arbetsrapport :2012:06
SP
Tec
hnic
al R
esea
rch
Inst
itute
of S
wed
en

2
Wave and Tidal Energy Technology Survey for Ferry Free E39 Project Daniel Vennetti SP Sveriges Tekniska Forskningsinstitut SP Technical Research Institute of Sweden SP Arbetsrapport :2012:06 ISBN ISSN 0284-5172 Borås 2012-04-05

3
Table of contents Executive summary 6
1 Introduction 8
2 Energy from the tides 9 2.1 How tides are generated 9 2.2 Tidal range energy conversion 9 2.3 Tidal current energy conversion 11
3 Tidal in-stream conversion technology request for information 12 3.1 General information 12 3.2 Device classification 12 3.2.1 General device classification information 13 3.2.2 Device type 13 3.2.3 Method to fix the device 15 3.3 Technology status 16 3.3.1 Development status 16 3.3.2 Description of testing activities 17 3.3.3 Next development steps 18 3.3.4 Environmental impact studies 18 3.3.5 Technical publications 18 3.3.6 Estimated date commercially available 18 3.4 Operational characteristics 18 3.4.1 General operational characteristics 18 3.4.2 Installation requirements 19 3.4.3 Performance characteristics 19 3.4.4 Economic characteristics 19 3.5 Relevance to Ferry Free E39 19 3.6 List of developers 19
4 Tidal energy conversion technology state of the art summary 20
5 Energy from the waves 21 5.1 How waves are generated 21 5.2 Wave energy conversion 21
6 Wave energy conversion technology request for information 23 6.1 General information 23 6.2 Device classification 23 6.2.1 General device classification information 23 6.2.2 Device type 24 6.2.3 Device survivability 26 6.3 Technology status 26 6.4 Operational characteristics 27 6.4.1 General operational characteristics 27

4
6.4.2 Installation requirements 27 6.4.3 Performance characteristics 27 6.4.4 Economic characteristics 27 6.5 Relevance to Ferry Free E39 27 6.6 List of developers 28
7 Wave energy conversion technology state of the art summary 29
8 Crossing locations 30
9 Bridging technologies 31 9.1 Suspension bridge 31 9.2 Floating bridge 31 9.3 Submerged floating tunnel 31
10 Determining tidal energy potential 33 10.1 Tidal resources 33 10.2 Combining tidal energy conversion devices with bridging technologies 35 10.2.1 Concepts 35 10.2.2 Advantages 35 10.2.3 Disadvantages 36 10.2.4 Requirements and limitations 37 10.2.4.1 Downstream direction 37 10.2.4.2 Cross-stream direction 37 10.2.4.3 Bridge type specific limitations 38 10.2.4.4 Energy extraction 43 10.3 Tidal energy conversion device output 43 10.3.1 Detailed method for device output calculations 44 10.3.2 Simplified method for device output calculations 45 10.3.3 Calculated device output 46 10.4 Tidal energy recommendations 47
11 Determining wave energy potential 49 11.1 Wave resources 49 11.2 Combining wave conversion devices with bridging technologies 50 11.2.1 Concepts 50 11.2.2 Advantages 51 11.2.3 Disadvantages 51 11.2.4 Requirements and limitations 51 11.2.4.1 Downstream direction 51 11.2.4.2 Cross-stream direction 52 11.2.4.3 Bridge type specific limitations 52 11.3 Wave energy conversion device output 53 11.3.1 Detailed method for device output calculations 53 11.3.2 Simplified method for device output calculations 54 11.3.3 Calculated device output 54 11.4 Wave energy recommendations 55

5
12 Combining multiple renewable energy technologies 57
13 Summary and conclusions 58
14 References 59
Appendix 1: TISEC device request for information 61
Appendix 2: TISEC device list of developers 70
Appendix 3: TISEC device responses 73
Appendix 4: WEC device request for information 158
Appendix 5: WEC device list of developers 166
Appendix 6: WEC device responses 170
Appendix 7: Fjord crossing locations 268
Appendix 8: Calculations of the number of TISEC devices 273
Appendix 9: Calculations of the energy from TISEC devices 277
Appendix 10: Calculations of the number of WEC devices 279
Appendix 11: Calculations of the energy from WEC devices 286

6
Executive summary E39 is a road that is located on the west coast of Norway and extends from Kristiansand in the south to Trondheim in the north. Currently, a number of ferry crossings are required to traverse its entire length. The Transport Ministry has given a mandate for the project “Ferry Free E39” to assess the technological solutions for the crossing of eight large fjords without ferries. The fjords crossings range from 1.5 km to 25 km in length and have depths up to 1300 m. Proposed solutions for the crossings that are under consideration consist of suspension bridges, floating bridges and submerged floating tunnels. Part of the project is to consider how the construction of the crossings can be combined with devices that produce energy from waves, tides, wind and the sun. The idea is that, by using the bridge construction as part of the facility, the costs of the renewable energy power plants could be reduced and therefore be more competitive. SP Technical Research Institute of Sweden has been commissioned by the Norwegian Public Roads Administration to perform a technology survey and generate a summary of the current state of the art wave and tidal energy conversion technologies. Requests for information were sent to the majority of the active developers in order to obtain the most up to date information about the current technology status, performance data and conditions of functionality for each of the devices. The thoughts behind the questions asked in the requests for information and the results of this technology survey are presented herein. Additionally, SP has been commissioned to make rough estimations of the potential energy that could be obtained from each fjord crossing by employing wave and tidal energy conversion technologies and to recommend the most suitable technology for integration with each fjord crossing concept. The methods behind the estimations of potential energy from each crossing and the background for the recommendations that are made are presented herein. Unfortunately, a lack of tidal and wave energy resource data at the fjord crossing locations made it impossible to utilize the detailed calculation method that was described and a simplified calculation method was used to calculate rough estimates of the energy potential from the different devices. When the estimates were compared to previous studies it showed that the estimates based on the simplified approach were non-conservative. Source of non-conservatism in the calculations were discussed and it was concluded that the next stage of the study should concentrate on obtaining reliable data about the tidal and wave energy resources for the different fjord crossing locations. The data should be obtained over a significant period of time to ensure that the effects of seasonal variations in the resources are captured. Once tidal and wave resources data is available, more realistic calculations of the potential energy production can be completed. At that point, comparisons of the performance of the difference technologies can be made. From that point, more detailed studies should be undertaken where the concepts for combining the devices with the bridging technologies are optimized. This optimization should include actions such as loads analysis, structural strength

7
calculations, reliability and fatigue performance evaluations and detailed cost estimates.

8
1 Introduction E39 is a road that is located on the west coast of Norway and extends from Kristiansand in the south to Trondheim in the north. Currently, a number of ferry crossings are required to traverse its entire length. The Transport Ministry has given a mandate for the project “Ferry Free E39” to assess the technological solutions for the crossing of eight large fjords without ferries. The fjords crossings range from 1.5 km to 25 km in length and have depths up to 1300 m. Proposed solutions for the crossings that are under consideration consist of suspension bridges, floating bridges and submerged floating tunnels. Part of the project is to consider how the construction of the crossings can be combined with devices that produce energy from waves, tides, wind and the sun. The idea is that, by using the bridge construction as part of the facility, the costs of the renewable energy power plants could be reduced and therefore be more competitive. SP Technical Research Institute of Sweden has been commissioned by the Norwegian Public Roads Administration to perform a technology survey and generate a summary of the current state of the art wave, tidal, wind and solar energy conversion technologies. For the wave and tidal energy conversion technologies, requests for information were sent to the majority of the active developers in order to obtain the most up to date information about the current technology status, performance data and conditions of functionality for each of the devices. The thoughts behind the questions asked in the requests for information and the results of the technology survey for the wave and tidal energy conversion technologies are presented herein. Additionally, SP has been commissioned to make rough estimations of the potential energy that could be obtained from each fjord crossing by employing wave, tidal, wind and solar energy conversion technologies and to recommend the most suitable technology for integration with each fjord crossing concept. The methods behind the estimations of potential energy for the wave and tidal energy conversion devices and the background for the recommendations that are made are presented herein.

9
2 Energy from the tides 2.1 How tides are generated Tidal energy is a unique form of renewable energy. While other renewable energies are either directly or indirectly derived from solar energy, tidal energy is generated by the orbital characteristics of the Earth-Moon-Sun system [1]. The gravitational attractions between the Earth, the Sun and the Moon and the orbital nature of the system cause the ocean to bulge in different locations on the Earth at different times. As these bulges in the ocean rotate around the Earth, the water level seen from a specific location will rise and fall [2]. The main periods of the tides are called the diurnal (~24 hours) and the semidiurnal (12 hours 25 min) [3]. Throughout the year, the relative position of the two planets and the sun changes, causing the magnitude of the tides to vary. When the gravitational effects of the Sun and Moon are acting in the same direction, this is referred to as a spring tide and the difference in water height between high tide and low tide is above average. When the gravitational effects of the Sun and Moon are separated by 90°, this is referred to as a neap tide, and the tidal conditions are less extreme. A figure showing the types of tides caused by the relative location of the Earth, Moon and Sun is shown as Figure 1.
Figure 1 Tidal variation schematic. The change in water height due to this rising and falling motion is referred to as tidal range. The rising and falling movement of the water also results in horizontal water motions which are called tidal currents. Because the tides are a result of the periodic variations of the Earth-Moon-Sun system, the tidal energy is more predictable than other renewable energy sources. Because generation and consumption across the electrical grid must be constantly balanced, this predictability is seen as a major advantage of tidal energy when compared to other renewable energy sources.
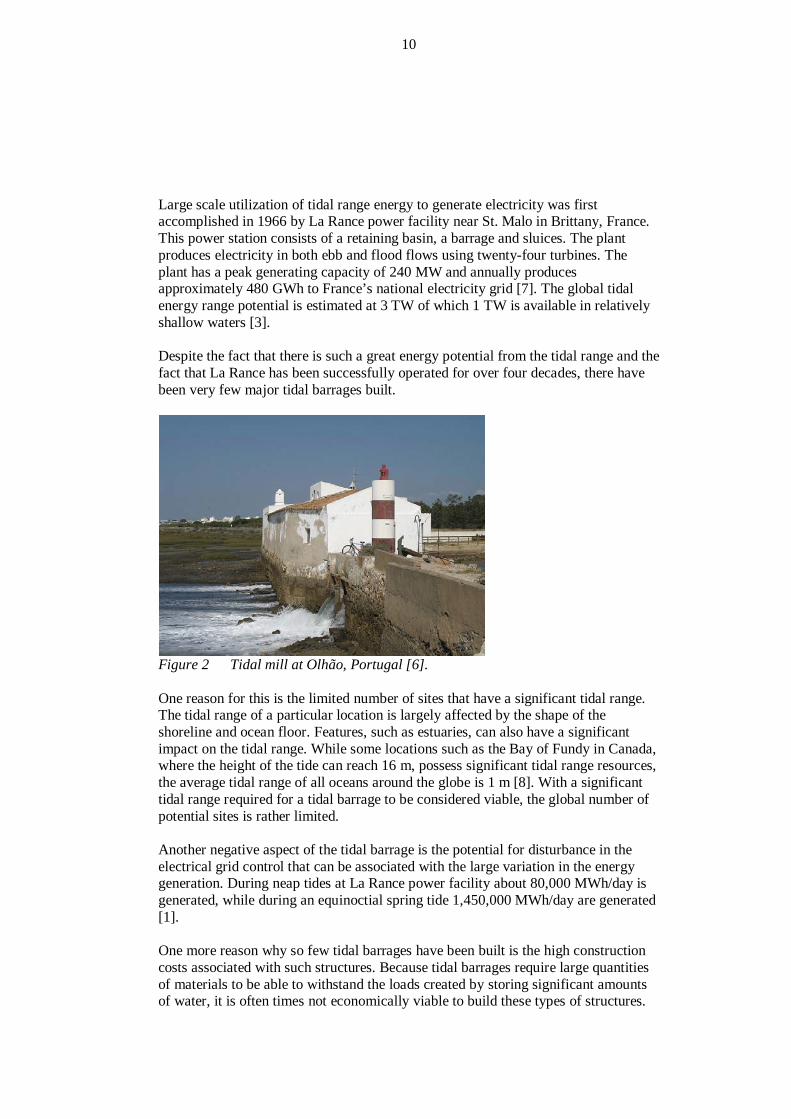
2.2 Tidal range energy conversion The idea of extracting energy from the tidal range has existed for many centuries. It is documented that farmers in the middle ages (1200-1500 AD) would capture waters in mill ponds as the tides rose and use this stored potential energy to run tide mills as the tide level dropped [4]. It is even suggested that people may have been using tide mills as far back as Roman times [5]. An image of a more modern tidal mill is shown as Figure 2.
10
Large scale utilization of tidal range energy to generate electricity was first accomplished in 1966 by La Rance power facility near St. Malo in Brittany, France. This power station consists of a retaining basin, a barrage and sluices. The plant produces electricity in both ebb and flood flows using twenty-four turbines. The plant has a peak generating capacity of 240 MW and annually produces approximately 480 GWh to France’s national electricity grid [7]. The global tidal energy range potential is estimated at 3 TW of which 1 TW is available in relatively shallow waters [3]. Despite the fact that there is such a great energy potential from the tidal range and the fact that La Rance has been successfully operated for over four decades, there have been very few major tidal barrages built.
Figure 2 Tidal mill at Olhão, Portugal [6]. One reason for this is the limited number of sites that have a significant tidal range. The tidal range of a particular location is largely affected by the shape of the shoreline and ocean floor. Features, such as estuaries, can also have a significant impact on the tidal range. While some locations such as the Bay of Fundy in Canada, where the height of the tide can reach 16 m, possess significant tidal range resources, the average tidal range of all oceans around the globe is 1 m [8]. With a significant tidal range required for a tidal barrage to be considered viable, the global number of potential sites is rather limited. Another negative aspect of the tidal barrage is the potential for disturbance in the electrical grid control that can be associated with the large variation in the energy generation. During neap tides at La Rance power facility about 80,000 MWh/day is generated, while during an equinoctial spring tide 1,450,000 MWh/day are generated [1]. One more reason why so few tidal barrages have been built is the high construction costs associated with such structures. Because tidal barrages require large quantities of materials to be able to withstand the loads created by storing significant amounts of water, it is often times not economically viable to build these types of structures.

11
However, possibly the greatest disadvantage of tidal barrages is the potential for negative environmental impacts [7]. When a dam is built across an estuary, the currents into and out of the area inherently change which can have an effect on the natural balance within the estuary. As a result of all of these negative aspects, by the early 1990s much of the focus for extracting the energy from the tides shifted from tidal range conversion technologies to tidal current conversion technologies [4].
2.3 Tidal current energy conversion Technologies that convert the kinetic tidal current energy are referred to as tidal in-stream conversion (TISEC) devices [9], marine current energy converters (MCECs) [10] or marine current turbines. These types of devices were first conceived in the 1970s during the oil crisis [11]. Because they do not incorporate tidal barrages, they have been shown to have far less negative impacts on the local environment than the tidal range energy conversion devices [12]. While there is a broad range of concepts at this point, many of the designs are very similar to the wind turbine. Because the density of water is over 800 times greater than that of air, the power intensity in water currents is much higher than that of airflows. This means that a water current turbine can be built much smaller than a wind turbine to get the same power output, or that the water speeds can be significantly slower than wind speeds while generating the same amount of power for a similarly sized device. The optimum current speed for most technologies is between 1.5-3.5 m/s [13]. Because there are many sites globally with currents in the optimum range for these technologies, recent studies have indicated that marine currents could potentially supply a significant fraction of the future global energy needs. In Europe alone, the potential for MCECs is estimated to exceed 12,000 MW of installed capacity [3]. In two studies of the Norwegian coast, rough estimates of the technical tidal current energy resources have been calculated. The technical resource takes into account the amount of kinetic energy that can be extracted without creating a negative ecological impact or a reduction in the current speed (often referred to as the significant impact factor (SIF) [14]. The studies estimated the annual technical resource in Norway to be between 0.55 TWh to greater than 1 TWh [15] [16]. The broad range is largely due to the uncertainty in the SIF. Both studies also addressed Norway’s economical tidal current energy resource, which takes into account the fact that there may be technical or economic factors that would limit the site availability. The annual estimations for the economical resource were between well below 1 TWh to 1 TWh [15][16]. These estimates take into account Norway’s total economical tidal current energy resource and are therefore expected to be greater than the energy potential from just the fjord crossing locations of the Ferry Free E39 project.

12
3 Tidal in-stream conversion technology request for information
Because the tidal in-stream conversion industry is still in its infancy, it is in a constant state of change. Because many developers are using all of their available time and resources for further developing their technologies, much of the most up to date information is not available in published literature or even on homepages. With that in mind, it was decided that the best way of ensuring that the most relevant information was obtained from each technology developer was to send out a request for information (RFI). This method has proved to be an effective way of obtaining relevant information and to be able to form contacts with the actual tidal in-stream conversion technology developers [9]. The contacts that were made through the RFI process could also be used to inform the technology developers, stakeholders and research groups about the upcoming workshop/conference. The RFI questions were formulated in an attempt to gain concise and relevant information which can be broken up into five basic categories: general information, device classification, technology status, operational characteristics, and relevance to the Ferry Free E39 project. In the RFI it was stated that if any of the requested information was currently unavailable that the technology provider could simply state that in their reply. A sample reply was also generated for a fictional device in an attempt to give some guidance as to the desired style and format of the responses. The RFI that was sent to the TISEC device developers and the sample reply are included as Appendix 1.
3.1 General information The general information questions were generated in large part to ensure that we have all of the necessary information to be able to distinguish the different technologies from one another and to ensure that we have appropriate ways to find information about the developer and technology in the future. The requested general information is as follows: company name, country, web address, technology name, figures/photographs of the device.
3.2 Device classification Unlike many mature industries, the TISEC industry has not converged to a narrow band of solutions. Currently the range of solutions is extremely broad and there are new patents being granted all the time for novel approaches to solving the challenge of converting tidal current energy into something useful. With that in mind, it is extremely important to gain enough information about the design of the devices so that we can make relevant comparisons based on a classification scheme. The following sections describe the RFI questions that are meant to gain information about the classification of the devices.

13
3.2.1 General device classification information The general device classification questions allowed the developer to discuss the unique idea behind their technology. The developer was asked to briefly explain the features and design principle of their technology. Additionally, information about the power train type and whether or not power was generated during ebb (when water height is decreasing) and flood (when water height is increasing) flows was requested of the developer.
3.2.2 Device type While there is an extremely broad range of solutions, there are four basic design principles that many technology providers have utilized [17]. In the RFI, the developers were asked to identify if their device utilized one of those four basic design principles, or if it was a novel design. The four basic design principles are shown in Figure 3 through Figure 6. The first common design principle is the horizontal axis turbine, or axial flow turbine. These devices are very similar to typical wind turbines. The flow moves parallel to the axis of the turbine and energy from the flowing water is converted to rotation of the turbine as the water passes the blades. Figure 3 shows a typical horizontal axis turbine.
Figure 3 Horizontal axis or axial flow turbine design principle [18]. The second common design principle is the cross-axis or cross flow turbine. For these devices, the flow moves perpendicular to the axis of the turbine. The kinetic energy from the water is again converted to rotation of the turbine as the water passes the blades. This design type encompasses devices where the turbine axis is mounted both vertically and horizontally. The horizontal axis cross-axis turbine can even be used in shallow water. The cross-axis design principle is shown in Figure 4.

14
Figure 4 Cross-axis or cross flow turbine design principle [18]. The next common design principle is the oscillating hydrofoil. These devices incorporate a hydrofoil which is mounted to an arm. As water flows past the hydrofoil lift is generated and the arm moves in one direction, as the hydrofoil reaches the limit of its movement in the one direction the orientation of the hydrofoil is changed, causing the lift force of the hydrofoil to move the arm in the opposite direction. This process is repeated causing the arm to oscillate as the flow moves past the device. Figure 5 shows an example of an oscillating hydrofoil.
Figure 5 Oscillating hydrofoil design principle [18]. The last common design principle is the enclosed tips (Venturi) type. This design is based on the Venturi effect, which is the reduction in fluid pressure that results when a fluid flows from a larger area pipe to a smaller area pipe. With this type of design, a funnel-like device is used to concentrate the flow past a turbine or the resulting pressure differential can be used to drive an air turbine. One such device is shown as Figure 6.

15
Figure 6 Enclosed tips (Venturi) design principle [19]. If the design did not fit into one of those four categories, it was considered a unique design principle, which was labelled “other designs”. 3.2.3 Method to fix the device Another way of classifying the different devices is to look at how the devices are held in place. There are four main methods to fix the devices, and the technology providers were asked to identify which methods could be used for their particular technology [17]. The first is the seabed mounted / gravity base. With this method, the device is attached to the bottom directly, or is heavy enough that it is held in place by the static friction force generated by its own weight. Pile mounted devices consist of a pole that penetrates the ocean floor. Some technologies use piles to allow the device to align with the flow and others use the pile to allow the devices to be raised out of the water for maintenance. The third classification of fixing applies to devices that are floating. This classification has three subdivisions. Floating devices can be fixed by flexible mooring, which means that the device is tethered to the seabed and has significant freedom of movement. Alternatively, if less freedom of movement is desired, a rigid mooring can be used. The last subdivision for a floating device is the floating structure, which allows for several devices to be mounted to the floating platform. The last main fixing method is using a hydrofoil attached to the device. As flow passes the hydrofoil, a downward force is induced, resulting in a static friction force

16
that keeps device in place. As the flow speed increases, the downward force increases, meaning that the fixing force, to some degree, self-adjusts to the flow conditions.
3.3 Technology status Because so few tidal in-stream conversions technologies are to the commercial phase at this point, understanding how far a technology has come in the development process is important to capture in the technology survey. The next set of questions in the RFI were aimed at developing a picture of the current status of the device and determining how long it will take before the technology is to a stage where it could be utilized on a larger scale. 3.3.1 Development status The U.S. department of energy (DOE) has adopted a set of technology readiness levels (TRLs) in the area of marine and hydrokinetic technology industry. Technology readiness levels were originally used by that National Aeronautics and Space Administration (NASA) and are used to assess how mature evolving technologies are. The technology developers were asked to classify the TRL of their technology according to the following criteria which are directly taken from the DOE website [18]: TRL 1-3: Discovery / Concept Definition / Early Stag Development, Design and Engineering
• TRL 1-2: These are the lowest levels of technology readiness. Scientific research begins to be translated into applied research and development where basic principles are observed and reported. Technology concept and application are formulated and investigated through analytic studies and in-depth investigations of principal design considerations. This stage is characterized by paper studies, concept exploration, and planning.
• TRL 3: In this stage, active research is initiated, including engineering studies and laboratory studies to physically validate analytical predictions of separate elements of the technology.
The purpose of this stage is to evaluate, insofar as possible, the scientific or technical merit and feasibility of ideas that appear to have commercial potential. TRL 4: Proof of Concept
• In this stage basic technological components of a sub-scale model are integrated to validate design predictions and system level functionality. The models, or critical subsystems, are tested in a laboratory environment.
This TRL represents early stage proof-of-concept system or component development, testing and concept validation. In this stage, critical technology elements are developed and tested in a laboratory environment. It is envisioned that scale models will be at 1:10 scale or smaller. TRL 5/6: System Integration, and Technology Laboratory Demonstration

17
• TRL 5: At this level, basic technological components are fabricated at a scale relevant to full scale and integrated to establish and verify subsystem and system level functionality and preparation for testing in a simulated environment.
• TRL 6: At this level, representative model or prototype system at a scale relevant to full scale, which is beyond that of TRL 5, is tested in a relevant environment. This stage represents a major step up in a technology's demonstrated readiness and risk mitigation and is the stage leading to open water testing.
At this stage device, system, and subsystem level interfacing/integration testing represent a vital stage in technology development, and must be demonstrated. Models should be at a relevant scale (1:1 – 1:5) to reflect the challenges and realities of the full scale (1:1) system. Model testing is to be performed in a test facility capable of producing simulated waves/currents and other operational conditions while monitoring device response and performance. Furthermore, the devices foundation concept shall be incorporated and demonstrated. TRL 7/8: Open Water System Testing, Demonstration, and Operation
• TRL 7: At this level, the prototype scale components and subsystems are fabricated and integrated to establish and verify subsystem and system level functionality and preparation for testing in an open water operational environment to verify expected operation and fine tune the design prior to deployment in an operational demonstration project.
• TRL 8: At this level, the prototype in its final form (at or near full scale) is to be tested, and qualified in an open water environment under all expected operating conditions to demonstrate readiness for commercial deployment in a demonstration project. Testing should include extreme conditions.
At this stage, the device model scale is expected to be at or near full scale (1:1 – 1:2). Testing may be initially performed in water at a relatively benign location, with the expectation that testing then be performed in a fully exposed, open water environment, where representative operating environments can be experienced. The final foundation/mooring design shall be incorporated into model testing at this stage. DOE TRL 9: Commercial-Scale Production / Application
• At this stage, the actual, commercial-scale system is proven through successful mission operations, whereby it is fielded and in-use in commercial application.
This stage represents an in-service application of the technology in its final form and under mission condition
3.3.2 Description of testing activities Prototype testing of these devices is an extremely important part of proving that that they will function in real world conditions. It is therefore important to understand the amount of testing that has been performed on each device. The technology providers were asked to describe all of their prototype testing activities including the scale of the test, test facility or location of the testing, the dates and the hours of operation

18
during the testing. All of those parameters should give a good understanding of how much testing is complete, and how much testing needs to be done before the device can be declared a success or not. 3.3.3 Next development steps The technology developers were asked to briefly describe their next development steps. This question was intended to give us an understanding what coming tasks the developer has judged to be the most important next phase of development for their particular technology. 3.3.4 Environmental impact studies Several reports exists where the potential environmental impacts of TISEC devices has been explored. Such studies generally look into installation, operation and decommissioning and how these activities affect the surrounding environment. While the impact is in many cases presumed to be small, there is little long term data from actual installations because the technology is still in such an early development stage [12]. The environmental impacts will often times depend on the specific technology and the location of the installation. With that in mind, one of the questions for the request for information was to describe if the developer had performed any environmental impact studies for their specific technology.
3.3.5 Technical publications The developers were also asked to list any technical publications that contain data about their technology. At a later stage in the project, where more detailed information about the technology is needed, technical publications could be useful for helping understanding the details of the concept better or for understanding the methods used to generating vital performance data. Having technical publications also shows that the developer has incorporated an academic aspect in their development plan. 3.3.6 Estimated date commercially available The developers were asked to estimate a date when the technology would be commercially available. The answer to this question will be used to determine if it is feasible that the technology will be ready for large scale utilization within an acceptable timeframe for the Ferry Free E39 project.
3.4 Operational characteristics The next category of questions was developed to gain information about the operational characteristics of the technologies. 3.4.1 General operational characteristics The general operational characteristics of the device include information about the dimensions, area of current flow used by the device, weight of super structure and weight of power conversion equipment. When the locations of the crossings are determined, this information could be useful in determining how many TISEC devices would be able to fit in the crossing. This information is also useful for determining some of the additional loads that the bridging structure will need to withstand as a result of adding the TISEC devices.

19
3.4.2 Installation requirements Information about the installation requirements of the technologies is critical in determining whether or not the individual devices could be used for the different crossings. The minimum installation depth and maximum installation depth were requested. Additionally, the lowest flow speed in which the device can be utilized (cut in speed) and the maximum allowable flow speed were also requested. 3.4.3 Performance characteristics The technology developers were asked to identify the rated flow speed and the rated power of their devices. Additionally, information was requested about the estimated power outputs at various current speeds. Because the tidal flows vary drastically throughout the various stages of the tidal cycles, in order to estimate power production over a longer period it is necessary to understand how the devices behave over a broad range of flow speeds. 3.4.4 Economic characteristics To facilitate cost comparisons of the various devices in the future, information was requested about the costs of the devices. Because it is assumed that the devices will be past the research and development phase by the time they will be utilized for the Ferry Free E39 project, the requested cost was for a production level device. Additionally, information about the design lifetime was requested in order to be able to determine the long term economic feasibility of the devices.
3.5 Relevance to Ferry Free E39 The last type of questions gave the technology developers the chance to explain how their particular devices could specifically be utilized for the Ferry Free E39 project. The developers were asked if and how their device could be combined with a suspension bridge fjord crossing, a floating bridge fjord crossing and a submerged floating tunnel fjord crossing. Other questions asked them to explore the possible advantages and disadvantages of combining their device with such structures. Because the technology developers know the strengths and limitations of their devices best, it was decided that this was an effective way of determining how feasible it is to combine these types of devices with infrastructure, and what the advantages and disadvantages are.
3.6 List of developers Table A2:1 shows the technology developers with whom contact was attempted. All contact information was found on the developer’s homepages. If the “Confirmed contact” column is green, it means that a response to the initial contact was received. This response could have been in the form of an automatically generated email, personal email, or telephone call. If the “Confirmed contact” column is red, it means that no response to the initial contact was received or that the email address that was used led to a failed email notification. If the “Responded to RFI” column is green, this means that the developer responded to the request for information. If this column is red, it means that for whatever reason, no response was received from that particular developer.

20
4 Tidal energy conversion technology state of the art summary
Table A3:1 shows some basic information about the technologies that responded to the RFI. There were a total of 19 technology developers who responded to the RFI. Several of the developers were unable to reply to the RFI or limited their response due to the fact that the information was going to be distributed beyond our organization. Several companies were unable to respond because of limited time or personnel resources. The complete responses from all of the developers who responded to the RFI are included in Appendix 3.
21
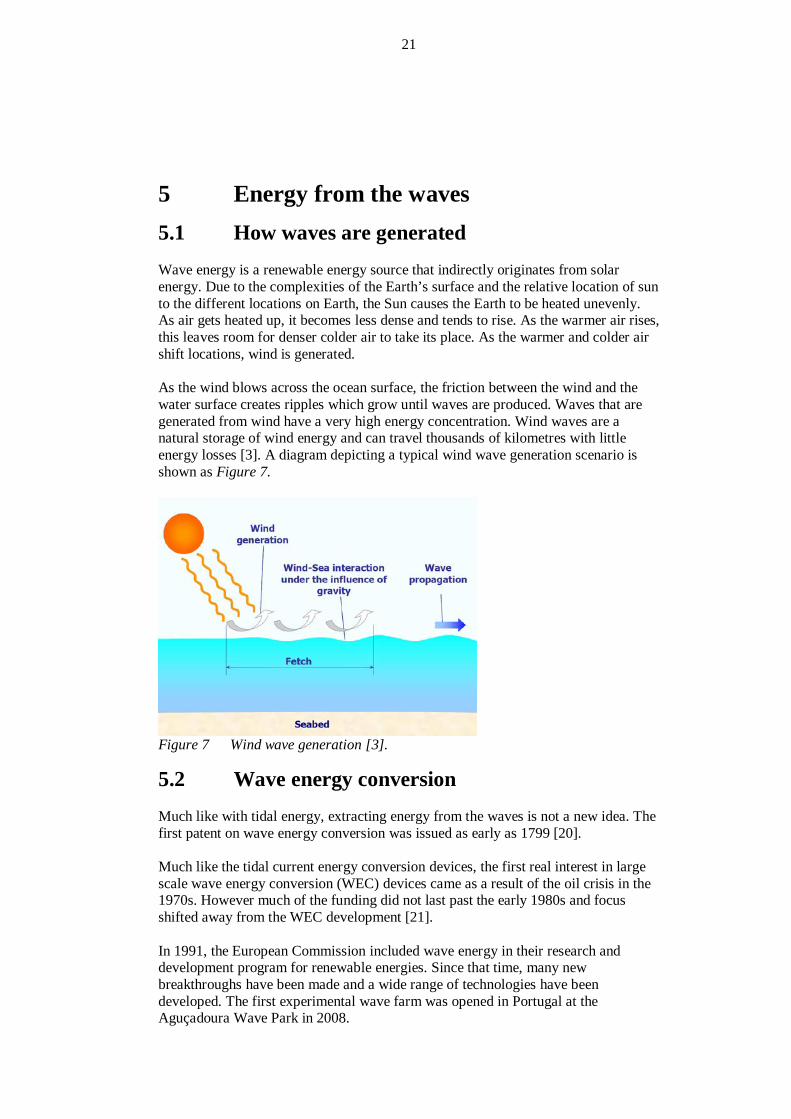
5 Energy from the waves 5.1 How waves are generated Wave energy is a renewable energy source that indirectly originates from solar energy. Due to the complexities of the Earth’s surface and the relative location of sun to the different locations on Earth, the Sun causes the Earth to be heated unevenly. As air gets heated up, it becomes less dense and tends to rise. As the warmer air rises, this leaves room for denser colder air to take its place. As the warmer and colder air shift locations, wind is generated. As the wind blows across the ocean surface, the friction between the wind and the water surface creates ripples which grow until waves are produced. Waves that are generated from wind have a very high energy concentration. Wind waves are a natural storage of wind energy and can travel thousands of kilometres with little energy losses [3]. A diagram depicting a typical wind wave generation scenario is shown as Figure 7.
Figure 7 Wind wave generation [3].
5.2 Wave energy conversion Much like with tidal energy, extracting energy from the waves is not a new idea. The first patent on wave energy conversion was issued as early as 1799 [20]. Much like the tidal current energy conversion devices, the first real interest in large scale wave energy conversion (WEC) devices came as a result of the oil crisis in the 1970s. However much of the funding did not last past the early 1980s and focus shifted away from the WEC development [21]. In 1991, the European Commission included wave energy in their research and development program for renewable energies. Since that time, many new breakthroughs have been made and a wide range of technologies have been developed. The first experimental wave farm was opened in Portugal at the Aguçadoura Wave Park in 2008.

22
Although there is a broad range of estimates of the global wave energy resources, most agree that wave power is one of the most abundant sources on earth [22]. Siegel et al. have made a powerful comparison between the World Energy Council’s estimate of the global annual amount of wave power energy of 17.5 PWh (Peta Watt hours = 1012 kWh) with the currently estimated annual worldwide electric energy consumption of 16 PWh. In one study, it was estimated that around 600 TWh of total wave energy reached the Norwegian coast per year [16]. When one accounts for the efficiency of the energy conversion and the amount of coast that is acceptable to develop for wave energy, the estimated contribution of wave energy to the Norwegian energy portfolio could reach between 12 to 30 TWh per year [16].

23
6 Wave energy conversion technology request for information
As the WEC technology industry is also in a very early stage of development, it was again decided that the best method for ensuring that the most relevant information was obtained for the technology survey was to send out an RFI to the technology developers. The RFI process could again be used to establish contact with the developers and to inform the developers, stakeholders and research groups about the Ferry Free E39 workshop/conference. While the formatting of the RFI that was sent to the WEC device developers was intentionally kept similar to the RFI that was sent to the TISEC device developers, many updates were made in order for the questions to be more relevant to these types of devices. Although several of the questions are different, the RFI for WEC device developers can again be broken up into the same five basic categories: general information, device classification, technology status, operational characteristics, and relevance to the Ferry Free E39 project. Again, the technology providers were informed that if any of the requested information was currently unavailable that they could simply state that in their reply. A fictional sample reply was again provided in an attempt to give some guidance as to the desired style and format of the responses. The RFI that was sent to the WEC device developers and the sample reply are included as Appendix 4.
6.1 General information The general information questions for the WEC device developers are identical to those for the TISEC device developers described in section 3.1
6.2 Device classification WEC devices are much like the TISEC devices in that they have a very wide range of solutions currently under consideration. The device classification questions of the WEC RFI are meant to gain an understanding of what makes the particular technologies unique, and at the same time allowing for relevant comparisons to be made between the different devices. 6.2.1 General device classification information Again, the general device classification questions allow the developer to discuss what makes their concept unique. The developer was asked to explain the basic features and design principle that their technology employs. Additionally, the developer was asked to describe the method in which the energy is converted from the waves into a more usable form of energy. This system is commonly referred to as the power take-off (PTO) system.
24
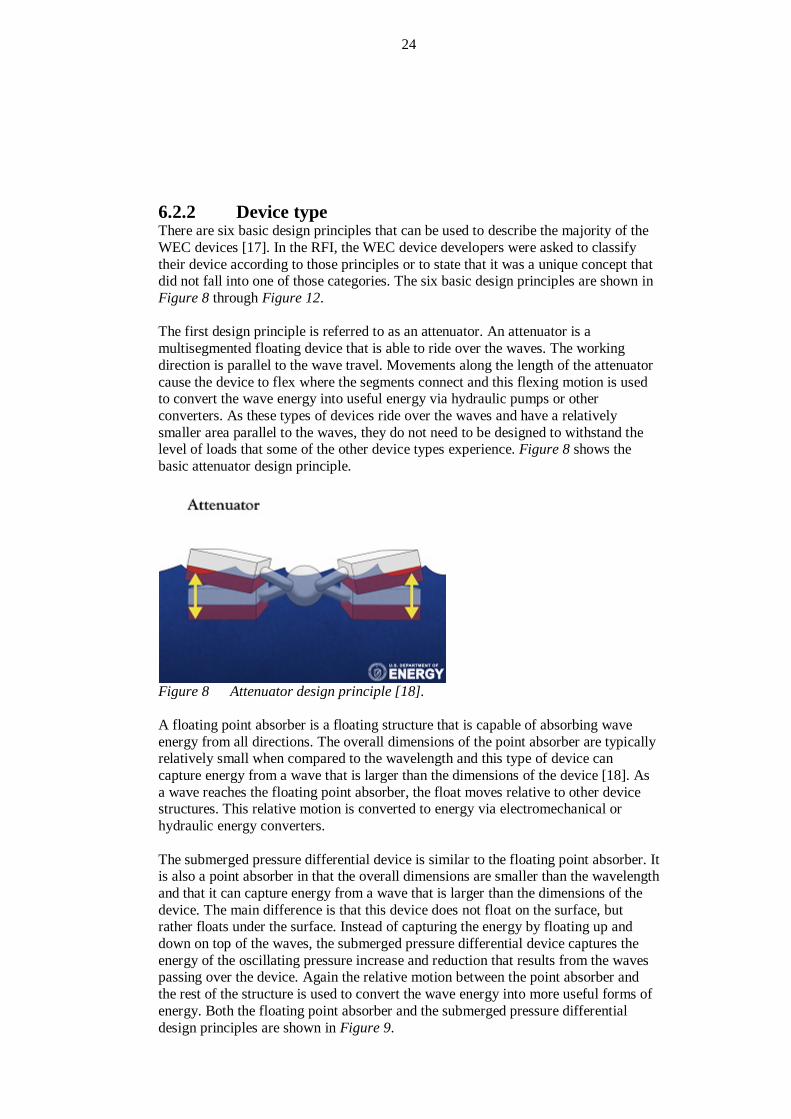
6.2.2 Device type There are six basic design principles that can be used to describe the majority of the WEC devices [17]. In the RFI, the WEC device developers were asked to classify their device according to those principles or to state that it was a unique concept that did not fall into one of those categories. The six basic design principles are shown in Figure 8 through Figure 12. The first design principle is referred to as an attenuator. An attenuator is a multisegmented floating device that is able to ride over the waves. The working direction is parallel to the wave travel. Movements along the length of the attenuator cause the device to flex where the segments connect and this flexing motion is used to convert the wave energy into useful energy via hydraulic pumps or other converters. As these types of devices ride over the waves and have a relatively smaller area parallel to the waves, they do not need to be designed to withstand the level of loads that some of the other device types experience. Figure 8 shows the basic attenuator design principle.
Figure 8 Attenuator design principle [18]. A floating point absorber is a floating structure that is capable of absorbing wave energy from all directions. The overall dimensions of the point absorber are typically relatively small when compared to the wavelength and this type of device can capture energy from a wave that is larger than the dimensions of the device [18]. As a wave reaches the floating point absorber, the float moves relative to other device structures. This relative motion is converted to energy via electromechanical or hydraulic energy converters. The submerged pressure differential device is similar to the floating point absorber. It is also a point absorber in that the overall dimensions are smaller than the wavelength and that it can capture energy from a wave that is larger than the dimensions of the device. The main difference is that this device does not float on the surface, but rather floats under the surface. Instead of capturing the energy by floating up and down on top of the waves, the submerged pressure differential device captures the energy of the oscillating pressure increase and reduction that results from the waves passing over the device. Again the relative motion between the point absorber and the rest of the structure is used to convert the wave energy into more useful forms of energy. Both the floating point absorber and the submerged pressure differential design principles are shown in Figure 9.

25
Figure 9 Floating point absorber and submerged pressure differential design
principles [18]. Oscillating wave surge converter devices are used at the shoreline or for near-shore applications. These devices consist of an arm, flap, float or membrane that is capable of rotating about a fixed point or axis. As the water particles in the wave surges move back and forth, the arm, flap, float or membrane oscillates about the rotation centre and this relative motion is converted into useful energy. One example of an oscillating wave surge converter is shown in Figure 10.
Figure 10 Oscillating wave surge converter design principle [18]. An oscillating water column device consists of a partially submerged structure that encloses a column of air above the waterline and is open to the sea below the waterline. As a wave passes the device, the water column rises and falls, leading to a corresponding pressure increase and decrease in the air column. As the pressure changes in the air column, the air is pushed and pulled through a turbine, which converts the energy in the airflow into rotation of the turbine blades, which is then converted into electricity. These devices can be utilized as floating devices or as shore-based devices. The basic principle of the oscillating water column is shown in Figure 11.

26
Figure 11 Oscillating water column design principle [18]. An overtopping/terminator device consists of a partially submerged structure that is formed to allow water from waves to travel up a ramp and into a water reservoir that is above the waterline. As gravity causes the water to return to sea-level, it passes through conventional low-head turbines, which are used to generate power. These devices can also be utilized as floating devices or as shore-based devices. A simple schematic of the overtopping design principle is given as Figure 12.
Figure 12 Overtopping design principle [18]. If the design did not fit into one of the six aforementioned categories, the technology was listed as “other designs”. 6.2.3 Device survivability Because of the extremely hostile environment that WEC devices must be able to endure in storm conditions, one key aspect of classifying the devices is how survivability has been addressed by the developer. The technology developers were asked to give a brief description of the survivability strategy of their device and whether or not the survivability system had been tested.
6.3 Technology status The questions of the RFI that was sent to the WEC technology providers relating to the technology status were again focused around the development status, description of testing activities, next development steps, environmental impact studies, technical publications and estimated date the technology would be commercially available. For a detailed description of those questions, the reader is referred to section 3.3.

27
6.4 Operational characteristics The operational characteristics of the WEC devices are important when considering if it is possible to incorporate the devices into the design of the bridging structures at each of the crossing. 6.4.1 General operational characteristics The questions about the general operational characteristics of the device are meant to obtain information about the dimensions, weight of super structure and weight of PTO system. Additionally, information was requested about how far apart the devices should be spaced if multiple devices were to be used. When the locations of the crossings are determined, this information could be useful in determining how many WEC devices would be able to fit in the crossing. This information is also useful for determining additional loads that the WEC devices will exert on the bridging structures.
6.4.2 Installation requirements Information about the installation requirements of the technologies makes it possible to determine which devices could potentially be utilized at the different crossings. The minimum installation depth and maximum installation depth were requested.
6.4.3 Performance characteristics The WEC device developers were asked to identify the rated power of their technology. Additionally, wave energy absorption performance as a function of significant wave height and peak wave period was requested. In order to accurately calculate the energy absorption of a WEC device, this performance matrix can be compared with the wave resource data for a specific location, which has also been quantified according to significant wave height and peak wave period [23]. Because this performance matrix is so vital to determining accurate estimations of energy absorption, the source of this data is also important. The developers were asked whether this information was generated from numerical simulations or random wave model tests.
6.4.4 Economic characteristics Because cost comparisons of these devices will be relevant at a later stage of the Ferry Free E39 project, information was again requested about the costs of a production level devices and the design lifetime of the technologies.
6.5 Relevance to Ferry Free E39 The developers were finally asked whether or not it was possible to combine their device with a fjord crossing that implements a suspension bridge, floating bridge or submerged floating tunnel and to explain how their device could possibly be combined with these types of structures. Initial investigations showed that many of the WEC devices were designed specifically for offshore wave environments. Because this stage of the project is intended to survey the entire WEC industry, it was decided that the developers should be encouraged to respond even if they currently did not envision their technology being compatible with a bridging

28
structure in the fjords. With this in mind, it was stated in the RFI that if their device is best suited for offshore applications that the possibility to install the device in other locations such as offshore would be considered.
6.6 List of developers Table A5:1 shows the WEC technology developers with whom contact was attempted. All contact information was found on the homepages of the specific developers. The same colour coding that was described in section 3.6 is used for Table A5:1.

29
7 Wave energy conversion technology state of the art summary
Some basic information obtained from the WEC device RFI is shown in Table A6:1. There were a total of 31 responses to the RFI received (one developer submitted responses for three different technologies). Several of the developers were unable to reply to the RFI or limited their response due to the fact that the information was going to be distributed beyond our organization. Several companies were unable to respond because of limited time or personnel resources. The complete responses from all of the developers who responded to the RFI are included in Appendix 6.

30
8 Crossing locations Because the potential energy output from wave and tidal energy conversion devices is extremely dependent on the wave and tidal resources at the specific installation location of the device, one of the first steps towards estimating the potential output is to determine where the devices will be installed. For the Ferry Free E39 project, eight fjord crossings need to be considered:
• Kanestraum-Halsa (Halsafjord) • Vestnes-Molde (Moldefjord) • Festøy-Solavågen (Storfjord) • Volda-Folkestad (Voldafjord) • Anda-Lote (Nordfjord) • Opedal-Lavik (Sognefjord) • Sandvikvågen-Halhjem (Bjørnafjord) • Mortavika-Arsvågen (Boknafjord)
As energy production is just one aspect of the Ferry Free E39 project, it is unlikely that the location of the crossings will be decided solely based on the best location for energy production. With spans of up to 25 km in fjords with depths up 1300 m, the bridging technologies will be impressive engineering feats in of themselves. In all likelihood, because of the challenges that the designers face to simply construct bridges that will function in these locations, some of the crossings may even intentionally be situated in areas where the tides and waves are not most energetic. When determining a location for the crossings, a host of other factors including location of existing infrastructure, conflicts with business interests and environmental concerns must also be considered. Because the relative importance each of these variables is currently unknown, at this point it was decided, a good first approximation is to assume that the crossings are based on the shortest distance in the area near the current ferry route. By decreasing the length of the crossing, costs can be significantly reduced. Additionally, by choosing the shortest crossings, the wind and tidal current resources are also typically maximized. Figures of each of the eight crossings are shown below as Figure A7:1 through Figure A7:8. The proposed crossings are shown in red and the current ferry route is shown in blue. The approximate lengths of the proposed crossing locations are shown in Table 1. For Bjørnafjord, the two different proposed crossings are labelled Bjørna a and Bjørna b for the southern crossing and the northern crossing respectively. The crossings are each given a unique crossing number, which is used in some of the tables shown later in the report.
Table 1 Proposed crossing information.
Halsa Molde Stor Volda Nord Sogne Bjørna a
Bjørna b Bokna
Crossing # 1 2 3 4 5 6 7a 7b 8 Length (m) 1829 8034 3400 2014 1700 3810 1600 5732 8416

31
9 Bridging technologies Because the designs of the bridges are still undetermined at this point, the all of the different bridging technologies must be considered when making estimates of the energy production potential at the different fjord crossing locations. There are three types of bridging technologies that are currently under consideration for the different crossings: suspension bridges, floating bridges, and submerged floating tunnels.
9.1 Suspension bridge The suspension bridge is a traditional bridging technology. The bridge typically has towers with suspension cables that run through the towers and are anchored to land. Vertical suspender cables or rods connect the suspension cables to the deck, which is the load-bearing portion of the roadway. A concept for a suspension bridge technology used for the Sognefjord crossing from the Norwegian Public Roads Administrations feasibility study is shown as Figure 13 [25].
Figure 13 Suspension bridge example [25].
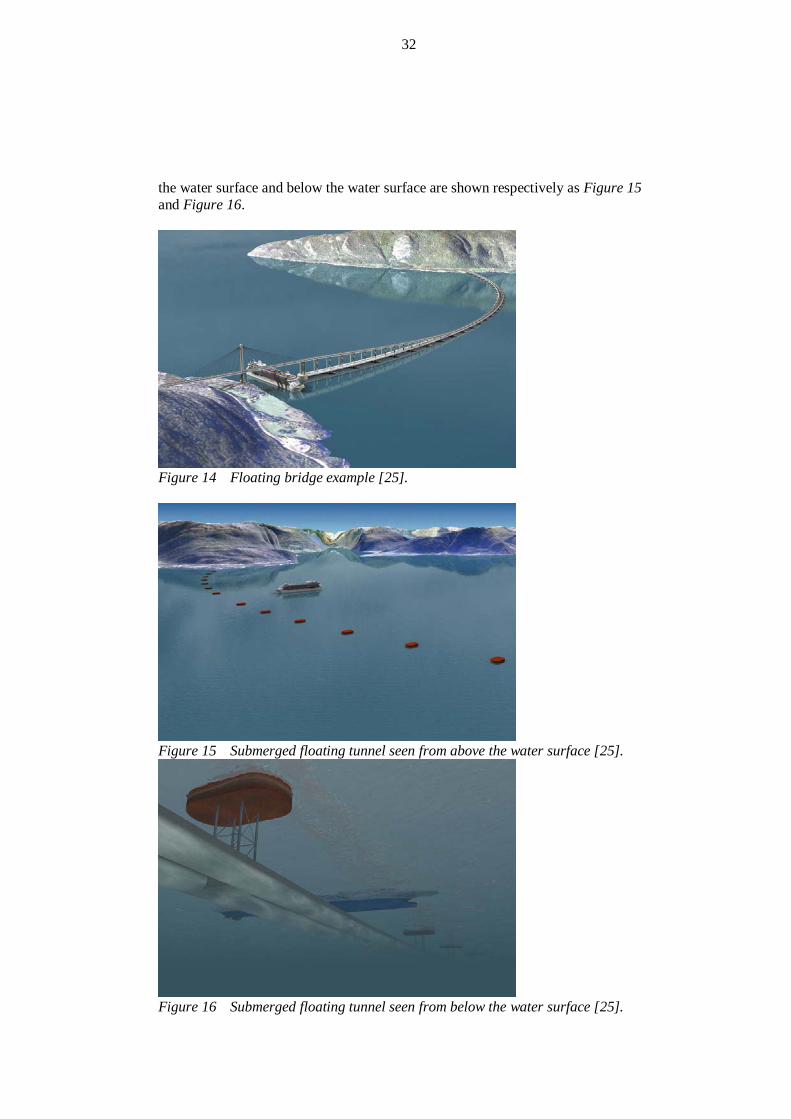
9.2 Floating bridge A floating bridge, or pontoon bridge, is a bridging technology that incorporates floating pontoons that have enough buoyancy to support the deck, service loads, and any dynamic loads the bridge may experience. An example of a floating bridge concept with an opening for ship passage from the Sognefjord crossing feasibility study is shown as Figure 14 [25].
9.3 Submerged floating tunnel The submerged floating tunnel concept is an innovative bridging technology that takes advantage of the inherent buoyancy of tunnels that are under the surface of the water which house the road surface. By calculating the weight of the displaced fluid and matching the weight of the tunnel to that, the tunnel is approximately neutrally buoyant. The tunnel is then either anchored to the seafloor, shore or to pontoons floating on the surface. Images of a submerged floating tunnel concept from above
32
the water surface and below the water surface are shown respectively as Figure 15 and Figure 16.
Figure 14 Floating bridge example [25].
Figure 15 Submerged floating tunnel seen from above the water surface [25].
Figure 16 Submerged floating tunnel seen from below the water surface [25].

33
10 Determining tidal energy potential The first step in determining if it is feasible to use tidal energy conversion devices in combination with the bridging structures is to quantify the tidal resources at the specific fjord crossings. If the tidal current flow rates in the areas of interest are not significant, the devices will operate at low efficiencies and very little energy will be produced. The next step is to look closer at the specific technologies that convert kinetic tidal energy. The possibility of combining the specific devices with the different bridging technologies is investigated and estimations of the potential number of devices that can be utilized at each of the fjord crossing locations are made. Rough calculations of the annual energy production from the different devices are presented and recommendations are made about what the next steps should be when considering combining tidal energy conversion devices with the fjord crossings.
10.1 Tidal resources Because the tidal currents vary with time and location, in order to accurately determine the total tidal resources of a particular location the annual distribution of water velocities must be known. Typically data from at least a single year is required to ensure that seasonal differences in the energy flux are accounted for. It is a well-known fact that there are variations in the flow field near a solid boundary due to boundary layer effects. The no slip condition between fluid and the boundary means that the flow near the edges of the crossings and at the seabed is lower than it is in the middle of the channel. Because knowing the actual flow characteristics across the channel requires a detailed analysis of the flow and the bathymetry of the channel, typically assumptions are made about the variations in the flow field in order to account for variations in the flow speed as a function of depth and cross-channel location. In order to take into account variations in the speed as a function of depth, the 1/10th power law approximation is commonly used [26]. This 1/10th power law is used to determine the flow velocity throughout the depth of the flow and can be represented as follows:
𝑢(𝑧) = 𝑢𝑜 �𝑧𝑧𝑜�1/10
where u(z) is the velocity at depth z, and uo is the reference velocity at the reference depth zo. Depth is measured relative to the seabed, where z is equal to 0. Using this approximation, a depth-averaged current velocity distribution can be determined from current velocity data that is typically measured at the surface. The annual distribution of the depth averaged velocities can be broken up into bins and the frequency of the velocities in each bin can be plotted as shown in Figure 17.

34
Figure 17 Fictional example of annual depth-averaged velocity distribution. Once the depth-averaged current velocity is determined, an assumption has to be made about the cross channel variation. For feasibility level studies, a common assumption is that there is no variation in the flow across channel [26]. While this overestimates the available resource, it is often a necessary approximation in the absence of other data. With these assumptions, the annual total tidal energy resource (Eannual) can be expressed by the following equation:
𝐸𝑎𝑛𝑛𝑢𝑎𝑙 =12𝜌 ∙ 𝐴�𝑓𝑖𝑢𝑖3
𝑛
𝑖=1
where ρ is the density of seawater (1025 kg/m3), A is the cross-sectional area of the channel, fi is the annual frequency (hours/year) of the current velocity ui and n is the total number of velocity bins. Unfortunately, very little current velocity data is currently available in the regions where the fjord crossings are proposed. In a draft report released to the investigators, the authors concluded that there were very little tidal resources in the following fjord locations [27]:
• Kanestraum-Halsa (Halsafjord) • Festøy-Solavågen (Storfjord) • Opedal-Lavik (Sognefjord) • Sandvikvågen-Halhjem (Bjørnafjord)
For the following proposed crossing locations, no detailed information about the tidal current velocities was available at the time the feasibility study was concluded:
• Vestnes-Molde (Moldefjord) • Volda-Folkestad (Voldafjord) • Anda-Lote (Nordfjord)
0100200300400500600700800900
1000
0.1 0.3 0.5 0.7 0.9 1.1 1.3 1.5 1.7 1.9 2.1 2.3 2.5 2.7 2.9 3.1 3.3 3.5 3.7 3.9
Freq
uenc
y (h
rs p
er y
ear)
Depth-Averaged Velocity (m/s)

35
• Mortavika-Arsvågen (Boknafjord)
Because the tidal currents depend so strongly on the bathymetry of the specific location, it is feasible that there are significant tidal resources at the fjord crossing locations where we have no data despite the fact that the other fjord crossing locations did not have very promising tidal resources. However, with no detailed information available, it was not possible to calculate the available tidal resources for the fjord crossing locations. When more tidal resource data is available, the methods described above can be used to determine the tidal resource available for the proposed fjord crossing locations.
10.2 Combining tidal energy conversion devices with bridging technologies
The main goal of this part of the project is to reduce the cost of the renewable energy plant by combining the technologies with bridging structures for the different fjord crossings. The developers were asked in the RFI to discuss potential ways in which their technology could be combined with a suspension bridge, floating bridge, or submerged floating tunnel. The developers were also asked to explain the advantages and disadvantages of combining their devices with the different bridging technologies. The responses to these questions are discussed in this section. Additionally limitations and requirements which can be used to determine the number of devices that can be utilized at each location are investigated.
10.2.1 Concepts Many of the developers responded positively when asked if their devices could be combined with the different bridging technologies. The full responses of the developers are given in Appendix 3. The different concepts for combining the devices with the bridge technologies can be summarized as follows:
• Suspending the TISEC devices from the bridge structure using inverted pylons
• Suspending the TISEC devices from the bridge using a rigid frame • Attaching the TISEC devices to the bridge piles or foundations • Mooring the TISEC device directly to the bridge • Connecting the TISEC devices to floating platforms which are moored to the
bridge • Integrating the TISEC device into the bridge structure itself • Mounting the devices directly to the submerged floating tunnel (either above
or below) 10.2.2 Advantages The developers were asked to discuss the possible advantages of combining their device with the bridging structures. Many of the concepts are applicable for all three of the different bridging technologies. The main advantages were focused on the cost savings that can be generated by combining the technologies with the bridging structures. The most common mention of costs savings was related to installation and maintenance. By having the devices

36
integrated into the infrastructure, the required time for vessels and divers is significantly reduced or even eliminated, which can amount to a huge cost savings over the lifetime of the device. Additionally, cost savings could be realized by using the bridge structure as part of the foundation instead of having individual foundations for each device. By mooring devices directly to the bridge structure, mooring line lengths are reduced, which also reduces costs. Lastly, the costs associated with cables are reduced because of the possibility of shorter and more effective cable runs. The other advantages were focused on increases in performance that can be realized by combining the devices with the bridge structures. With the faster currents closer to the surface, having the bridge as an attachment point means that the device installation depth can be better optimized regardless of the depth of the fjord. Another advantage of combining the devices with the bridging technologies is that the shape of bridge structure itself could be used to increase the flow rate to the devices, leading to higher energy output. It was also mentioned that the blockage effect of multiple turbines could create a small pressure head difference across the devices, further increasing their performance. 10.2.3 Disadvantages The disadvantages of combining the devices to the bridge structures were also discussed. One of the major disadvantages of attaching device to any of the bridging technologies is the additional horizontal and torsional loads that will be induced into the structure. As mentioned previously, in several locations, the design of the bridges themselves are a significant challenge. The spans of some of the crossings could reach record lengths for some of the bridging techniques. Adding additional loads to the structure by attaching the TISEC devices makes the challenge even more difficult. One concept for alleviating this problem is to take advantage of the overcapacity that is built into the bridge design. Because the bridges have to be designed for severe loads that result from storm conditions, there is an inherent overcapacity of the structure under normal operating conditions. One could determine a maximum allowable operating current speed which the TISEC devices could be used for. This current speed could be calculated so that the additional loads resulting from the TISEC devices were a safe level below the bridge’s overcapacity. If the current speed were to exceed the maximum allowable speed, the devices could automatically be converted to standby mode. The loads on the bridge would then be reduced until the current speed dropped below the maximum allowable flow rate. Of course the maximum allowable speed will depend on the overcapacity of the bridge, the number and location of the TISEC devices as well as the operational characteristics of the TISEC devices. As the final bridge designs are unknown at this point, calculations of the maximum allowable current speeds are outside the scope of this project and it is assumed that the additional loads on the bridge construction are not a limiting factor for the calculations of potential energy output. Another disadvantage discussed was the potential for increased dynamic loads that could result from attaching the devices to the structures. While this could be true in some situations, configurations could be envisioned where the addition of support

37
structures for the devices could actually increase the stiffness or damping of the bridging structures, leading to more desirable dynamic characteristics. The last disadvantage that was mentioned was that attaching the devices to the bridging structures could be a health and safety risk to passing vessels. As personal safety is of utmost importance, this clearly has to be addressed. There must be well marked areas where safe passage is possible and warnings or restraint systems installed to ensure that risks are minimized for passing vessels. This topic is further explored in the separate risk analysis report [28]. 10.2.4 Requirements and limitations When determining the total potential energy output from the TISEC devices, one important part is determining the number of devices that can be utilized for each of the locations. Several requirements and limitations must be considered.
10.2.4.1 Downstream direction The first requirement is that the concept for generating energy from the tides should incorporate the bridge construction itself, in order to reduce the cost of the renewable power plant. This requirement inherently places a limitation on the number of devices that can be utilized in the downstream direction. Initial investigations of TISEC device farms have used a rule of thumb for downstream device spacing of 10 times the diameter of the device [26]. This spacing is required in order to avoid negative effects on the performance of the downstream device caused by flow disruptions from the upstream device. The number of rows of devices that will fit in the downstream direction is therefore a function of the total width of the bridging structure and the size of the device itself. One can imagine configurations where long mooring lines are attached to the bridge and used to hold floating platforms in place relatively far upstream and downstream of the bridge, but in order to really take advantage of the bridge structure to reduce the costs of the plant, the practical number of rows in the downstream direction is limited by the width of the bridging structure. While the actual required spacing between rows could be different for some technologies, the required fluid flow calculations or testing goes beyond the scope of the present study. With that in mind, a minimum downstream device spacing of 10 times the diameter for horizontal axis or cross-axis turbines and 10 times the width of the device perpendicular to the flow for other types of devices was used for the present study.
10.2.4.2 Cross-stream direction Another limitation on the number of devices that can be utilized for each crossing is associated with the number of devices that can be placed in the cross-stream direction. In order to avoid negative performance effects on adjacent TISEC devices, a suggested rule of thumb for horizontal axis turbines is to have a 1/2 diameter gap between devices [26]. The rule of thumb is generalized in the present study so that the minimum device spacing is equal to 1/2 the diameter for horizontal axis or cross-axis turbines or 1/2 the width of the device perpendicular to the flow for other types of devices. Another requirement to be considered is the fact that there must be a location in the bridging structure that is totally free from TISEC devices so that ships can pass the crossing. Using information from one concept of a floating bridge for the Bjørnafjord

38
as a reference, it was decided that all crossings will incorporate a 200 m wide passage for ships which will be free of TISEC devices [29]. When determining the number of devices that fit across the channel, we have taken into account the fact that the flow is lower near the edges and implemented a zone of 100 m from either edge of the crossing where no TISEC devices will be placed. Additionally, there is a minimum depth in which most TISEC devices can be used. Once the bathymetry of the actual crossing location is known, the number of devices in the cross-stream direction can be reduced if there are areas of the crossing where the minimum depth requirements were not fulfilled. Information about the depth requirements of the specific devices are given in the responses to the RFI. Where no information about the minimum depth requirement is given in the response to the RFI, the minimum allowable depth can be set to equal 1.5 times the height of the device, which is an assumption that has been used in other similar studies [15].
10.2.4.3 Bridge type specific limitations Upon review of the proposed concepts for combining the renewable energy power plants with the bridge designs, it was noted that there were very few bridge type specific limitations on the number of devices that could be utilized. Though the geometries of the bridge structures vary greatly, with the aid of relatively simple additional structures, the number of devices that could be utilized for the three bridge types is very similar. All three bridge types could have the same usable width in the downstream direction by adding trusses or wider floating platforms with mooring lines attached to the bridge deck. While these additional structures will naturally increase the cost of the construction, when compared to a TISEC device farm not utilizing infrastructure, the cost of the plant is still significantly reduced and can therefore be considered a viable option at this point. While there are many possible configurations, some basic concepts that show how the usable width of the different bridges could be equal are shown in Figure 18 through Figure 23. Views are given from both under the water surface and from the side in order to show the details of the basic concepts.

39
Figure 18 Concept for using truss structures and pontoons to allow for additional
rows of TISEC devices in the downstream direction for a suspension bridge (seen from below).
Figure 19 Concept for using truss structures and pontoons to allow for additional
rows of TISEC devices in the downstream direction for a suspension bridge (seen from the side).
Figure 20 Concept for using truss structures to allow for additional rows of TISEC
devices in the downstream direction for a floating bridge (seen from below).

40
Figure 21 Concept for using truss structures to allow for additional rows of TISEC
devices in the downstream direction for a floating bridge (seen from the side).
Figure 22 Concept for using truss structures and pontoons to allow for additional
rows of TISEC devices in the downstream direction for a submerged floating tunnel (seen from below).
Figure 23 Concept for using truss structures and pontoons to allow for additional
rows of TISEC devices in the downstream direction for a submerged floating (seen from the side).
The number of rows of devices in the downstream direction (Ndown) that can be utilized regardless of bridging technology type is expressed by the following equation

41
𝑁𝑑𝑜𝑤𝑛 = 1 +𝑊𝑏𝑟𝑖𝑑𝑔𝑒
𝑊𝑑𝑒𝑣 ∙ 10− 0.5
where Wbridge is the width of the bridging structure and Wdev is the diameter for horizontal axis or cross-axis turbines and the width of the device perpendicular to the flow for other types of devices. The result of the equation for Ndown should be rounded to the nearest whole number. A Wbridge of 70 m was chosen for all bridging structures. This value corresponds to the width of the pontoon used in the floating bridge concept for the Bjørnafjord crossing [29]. Although this value was somewhat arbitrarily chosen, it was decided that 70 m gives a good estimate of a reasonable width for such a structure. Using this value, some of the smaller technologies will be able to utilize several rows of devices in the downstream direction with the help of the additional structures. In the cross-stream direction, additional structures could again be utilized to ensure that the maximum number of devices that can be utilized is relatively unaffected by the choice of bridge type. For the submerged floating tunnel design, there are some additional limitations that affect the number of devices that can be utilized in the cross-stream direction. These potential limitations are strongly dependent on the details of the bridge design and the bathymetry of the crossing and are therefore hard to quantify at this point in the project. For the submerged floating tunnel design, most of the TISEC devices could be incorporated into the structure either above or below the tunnel. If the devices are to be located above the tunnel, the tunnel would have to be far enough under the surface of the water to ensure that the minimum installation depth was observed. If however the floating tunnel is designed to be located closer to the surface, then the devices will need to be positioned under the tunnel. If the devices are under the tunnel, then the distance between the bottom of the tunnel and the seabed must meet minimum installation depth, meaning that the depth of the crossing will in some cases be more limiting for the submerged floating tunnel design. The submerged floating tunnel design has additional structures that could also limit the number of TISEC devices that could be installed in the cross-stream direction. In deeper water, the tunnels are typically anchored to pontoons floating on the surface of the water. If the TISEC devices are to be located above the tunnel, the structures attaching the pontoons to the tunnel will limit the space available for the devices. A sketch of the basic concept for a submerged floating tunnel with the TISEC devices located above the tunnel is shown as Figure 24. In the figure, one can see that the number of devices is limited due to the pontoon attachment structures.

42
Figure 24 Sketch showing how the number of TISEC devices in the cross-stream
direction can be limited by additional structures for a submerged floating tunnel.
For shallower crossings, the tunnels may be anchored to the bottom of the fjord using mooring lines. If the TISEC devices are positioned below the tunnel, these mooring lines could limit the number of devices that can be utilized. Because there are so many unknowns about the final designs of the bridges at this point, a constant reduction factor was assumed for all crossing locations so that the number of TISEC devices that could be utilized in the cross-stream direction is 15% less for a submerged floating tunnel design when compared to the suspension bridge or floating bridge designs. Sketches of basic concepts for using truss structures to increase the potential number of TISEC devices in the cross-stream direction for the suspension bridge and floating bridge are shown as Figure 25 and Figure 26. From these figures, one can see that many limitations on the number of devices in the cross-stream direction can be eliminated with the use of some additional structures.
Figure 25 Concept for using truss structures to increase the number of TISEC
devices that can be utilized for a suspension bridge.

43
Figure 26 Concept for using truss structures to increase the number of TISEC
devices that can be utilized for a floating bridge. The maximum number of devices in the cross-stream direction (Ncross) can be expressed by the following equation
𝑁𝑐𝑟𝑜𝑠𝑠 = ��𝐿𝑡𝑜𝑡 − 𝐿𝑑𝑒𝑝𝑡ℎ − 𝐿𝑠ℎ𝑖𝑝 − 2 ∙ 𝐿𝑒𝑑𝑔𝑒 − 𝑊𝑑𝑒𝑣
𝐿𝑑𝑒𝑣 +𝑊𝑑𝑒𝑣/2� ∙ (1− 𝑅)� − 0.5
where Ltot is the total length of the crossing, Ldepth is the total length of all of the sections in the crossing where the minimum depth requirement is not met, Lship is the length of the shipping passage (200m), Ledge is the distance from the edge of the crossing to the location where devices are first utilized due to reduced flow near the boundaries (100 m), Ldev is the length of the device in the cross-stream direction (this value can be different than Wdev for cross-axis devices) and R is a reduction factor equal to 0.0 for suspension bridge and floating bridge designs and 0.15 for the submerged floating tunnel design. The result of the equation for Ncross should be rounded to the nearest whole number The total maximum number of devices that can be utilized for each crossing for each bridge type (Ntot) can be calculated by simply multiplying Ndown by Ncross.
10.2.4.4 Energy extraction Another limitation on the number of devices that can be utilized that needs to be considered is the actual amount of energy that can safely be extracted from the flow without creating a negative ecological impact or reducing the current speed. This value is often referred to as the extractable resource and is calculated by multiplying the total resource for a given location by the significant impact factor (SIF). The SIF therefore represents the percentage of the total resource that can be safely extracted [14]. Typical values for SIF are 10% to 20%.
10.3 Tidal energy conversion device output With no available data for the fjord crossings where current velocities are in the usable range, it was not possible to perform detailed potential energy output

44
calculations at this phase of the project. However, a method for accurate calculations is presented which can be used when the appropriate data is available. Additionally a greatly simplified method is presented, which is used to give a rough idea of potential annual energy outputs for the different technologies at the different fjord locations if it is found that the fjord crossings have significant tidal resources. 10.3.1 Detailed method for device output calculations An accurate method to determine the potential energy output of a TISEC device requires that the annual distribution of velocities at the height of the device is known. The same 1/10th power law that was described in section 10.1 can be used to convert data that was taken at the surface to velocity information at the height of the device. This data is often simplified to a single location at the centre of the device, which is referred to as a hub-height approximation [26]. The annual distribution of the hub-height velocities can be broken up into bins and the number of hours that the flow exhibits each velocity per year can be plotted. The result is a figure that looks very similar to Figure 17. The device developers were asked to share a curve of electric power output as a function of current speed. This includes information such as the cut in speed, electric output up to the cut out speed, cut out speed and the maximum flow speed. The cut in speed is the minimum flow velocity where the device can generate power. The cut out speed is the speed at which the power output levels out. For flows above the cut out speed, the power output will remain constant until the flow reaches the maximum flow speed. When the maximum flow speed is reached, the devices will go into survival mode and not generate power. The advantage of obtaining this information from the developer is that all of the efficiencies of the device, including the drive train, generator and power conditioning are already taken into account when using this information. By simply taking the number of hours per year at a given flow speed from the annual hub-height velocity distribution and determining the electric power output at that flow, the energy (in watt hours per year) for each velocity bin can be determined. By adding the resultant energy output for all of the bins, the annual energy production from each device is determined (assuming that the device is operated year round). Several of the device developers were unable to share their electric power output as a function of current speed curve. Some of the developers are at an early enough stage where this information is unknown, while other developers consider this information proprietary, and are not able to share it with the general public. At a later stage of the project, when more detailed energy estimates are required for the individual technologies, it may be necessary to sign non-disclosure agreements with the developers in order to gain access to proprietary information. The next step is to determine the number of devices that can be utilized for the particular fjord crossing locations. This can be done using the methods described in section 10.2.4. As we have assumed that the cross-channel variations in the flow is to be ignored at this point, the maximum annual energy output for the fjord crossing can be determined by multiplying the number of devices by the annual energy production from each device. This maximum annual energy output assumes that the devices are operated year round and with no losses due to transmission effects.

45
With the maximum annual energy output for the fjord crossing determined, the next step is to determine the extracted annual resource and compare that to the annual extractable resource limit. The annual extracted energy can be calculated by dividing the maximum annual energy output by the efficiency of the power take-off system. The power take-off system efficiency includes efficiency from the drivetrain, generator and the power conditioning. A suggested power take-off system efficiency is 90% [26]. In cases where the extracted resource exceeds the extractable resource limit for the fjord crossing using an SIF of 10-20%, the number of devices should be reduced until the extractable resource limit is not exceeded. Down time for maintenance and additional losses due to transmission effects should also be considered when trying to determine realistic annual energy production. One study suggests that availability for these devices should be 95% and the efficiency due to transmission effects should be around 98% [26]. By multiplying the maximum annual energy output by 0.98 and 0.95 an accurate estimate of the annual energy production for the specific crossing location is determined. 10.3.2 Simplified method for device output calculations As there is currently no flow velocity data available for the four fjord crossings which could potentially utilize TISEC devices, a much simpler approach was used to estimate the potential annual energy production for these devices. A common measure of system performance in the power production industry is the capacity factor. The capacity factor is the ratio of the actual output of the power plant over a period of time divided by its potential output if it had operated at its full rated capacity over the entire period. In the wind power industry, capacity factors are between 25-30% [15]. It has been suggested that in order for TISEC devices to be competitive with the wind power industry, these devices will have to reach capacity factors of up to 40% [15]. While combining these technologies with infrastructure will reduce the cost of the power plant, thereby reducing the required capacity factor, because the other technologies considered in this feasibility study will also be utilizing the infrastructure to reduce costs, it was decided that 40% is a good estimate of the required capacity factor for the TISEC devices. As a simple approach to determining an approximate annual energy production where the resources are currently unknown, it was decided that the annual energy production for the remaining fjord crossings would be calculated utilizing the assumed capacity factor of 40%. Using the methods described in section 10.2.4, the number of devices was determined for each of the four fjord crossings and for each of the three fjord crossing technologies. The total annual energy production was then determined using the following equation:
𝐸𝑇𝐼𝑆𝐸𝐶 𝑎𝑛𝑛𝑢𝑎𝑙 = 𝑁𝑡𝑜𝑡 ∙ 𝑃𝑟𝑎𝑡𝑒𝑑 ∙ 𝐶𝑃 ∙ 24ℎ𝑟𝑑𝑎𝑦
∙ 365𝑑𝑎𝑦𝑦𝑒𝑎𝑟
where Prated is the rated capacity of the device and CP is the capacity factor. This estimate does not give any information about whether or not the power plant is in fact viable at the different locations. This estimate simply shows that, if future studies show that the tidal resources for the given fjord crossing is significant enough

46
for a TISEC device plant to be viable, the approximate annual energy production should be on this order of magnitude. This calculation also gives a good idea of the relative amount of energy that the individual technologies might be able to produce. 10.3.3 Calculated device output Using the fjord crossing lengths shown in Table 1 for the Moldefjord, Voldafjord, Nordfjord and Boknafjord, the number of devices that can be utilized for each crossing was calculated. The results are shown in Table A8:1, where Ntot_sus/float is the total number of devices that can be utilized for a suspension bridge or a floating bridge and Ntot_SFT is the total number of devices that can be utilized for a submerged floating tunnel. The reader is referred to Appendix 8 for the full details of the calculations. The values shown in the table do not take into account fjord specific depth limitations (Ld=0). Where the technology developer did not supply device dimensions, it was not possible to calculate the number of devices that could be utilized. Using the rated power for each device and the number of devices that can be utilized, the estimated annual energy production was determined for the different technologies, fjord crossing locations and bridging technologies using the assumed capacity factor of 40%. The results are shown in Table A9:1, where Esus/float is the annual energy production for a suspension bridge or floating bridge in GWh/yr and ESFT is the annual energy production for a submerged floating tunnel in GWh/yr. At the bottom of the table, the minimum, maximum and average estimated annual energy production for the different technologies is shown. Where the technology developer did not supply device dimensions or the rated power of the device, no calculation of the annual energy production was performed. One can see from the table that there is a large range of estimated annual energy production from the different technologies. This is in large part due to the variation in the different technology types, sizes of the devices and the flow speed in which the devices are rated. Because of the number of unknowns about the tidal resources, a rough approximation of the annual energy production can be determined by using the average of the different estimates. Using this method, we obtain approximate annual energy productions in (GWh/yr) from suspension bridges or floating bridges of 2875, 603, 486 and 3019 for the Moldefjord, Voldafjord, Nordfjord and Boknafjord respectively. For the submerged floating tunnels, we obtain approximate annual energy productions of 2444, 512, 412 and 2566 for the Moldefjord, Voldafjord, Nordfjord and Boknafjord respectively. If it is assumed that all four of the fjord crossing locations have significant tidal resources the calculations show that the total annual energy production from the TISEC devices is between 5.9 and 7.0 TWh/yr (depending on the bridge designs). When the calculated values are compared to previous estimations of the annual economical resource in Norway, we see that there is a large discrepancy. The two previously mentioned studies estimated that the maximum total economical resource was around 1TWh/yr for the entire country [15] [16]. Additionally, they had considered that the majority of the tidal resources were further north than the fjord crossings that are being considered for the Ferry Free E39 project. With the presented calculations grossly overestimating the energy production when compared to previous studies, it can be concluded that at least one of the assumptions

47
made in the calculations is non-conservative. The first potentially erroneous assumption is the fact that the number of devices could be maximized without exceeding reasonable significant impact factors. With no data available for determining the total resources, it was not possible to determine what the significant impact factors of the proposed configurations are. If too many devices are utilized, too much of the energy can be extracted, leading to negative environmental consequences. Another potentially incorrect assumption is that averaging the calculated annual energy production from the different devices would produce a good estimation. With such a large variation in the rated power and rated flow speed of the different technologies and with such a large range of technology readiness levels, it could be that taking the average value of all of the devices leads to non-conservative results. The last potentially non-conservative assumption is the fact that the resources are significant enough to reach a capacity factor of 40%. Again with no tidal resource data for the fjords of interest available it is not possible to know what accurate capacity factors of the different devices are.
10.4 Tidal energy recommendations The lack of tidal current velocity data makes it impossible to know what the actual potential energy output is from combining TISEC devices with the fjord bridging technologies. Because the different technologies are optimized for different flow conditions, it is not possible to know which technologies would actually provide the most energy for the different crossing locations based on the results shown in the previous section. It is therefore recommended that the next stage of the study concentrates on obtaining more tidal resource data for the following fjord crossing locations:
• Vestnes-Molde (Moldefjord) • Volda-Folkestad (Voldafjord) • Anda-Lote (Nordfjord) • Mortavika-Arsvågen (Boknafjord)
Initially the resource data could be obtained from models to see if current levels are significant enough to be considered further. The optimum current speed for most technologies is between 1.5-3.5 m/s [13]. If the models show that there is a significant number of hours with current speeds close to this range, then experimental data should be gathered to verify the predictions from the models. This experimental data should be gathered over a significant period of time in order to verify that the models are accurate enough to account for seasonal variations in the flow. Once detailed information about the annual distribution of current velocities is available, the detailed method for device output calculations described in section 10.3.1 can be used to determine realistic estimates of energy production from the different technologies. For some of the technology developers, it may be necessary to sign non-disclosure agreements in order to gain access to proprietary information about the performance of the TISEC devices. It is recommended that these agreements are signed in order to ensure that all of the options are considered.

48
Once estimates of energy production are generated for all devices under consideration, comparisons between costs and energy output can be made. These comparisons will give a better basis for making recommendations about whether or not the TISEC device power plant is viable and, if it is viable, which technology or combination of technologies should be utilized for the different fjord crossing locations.
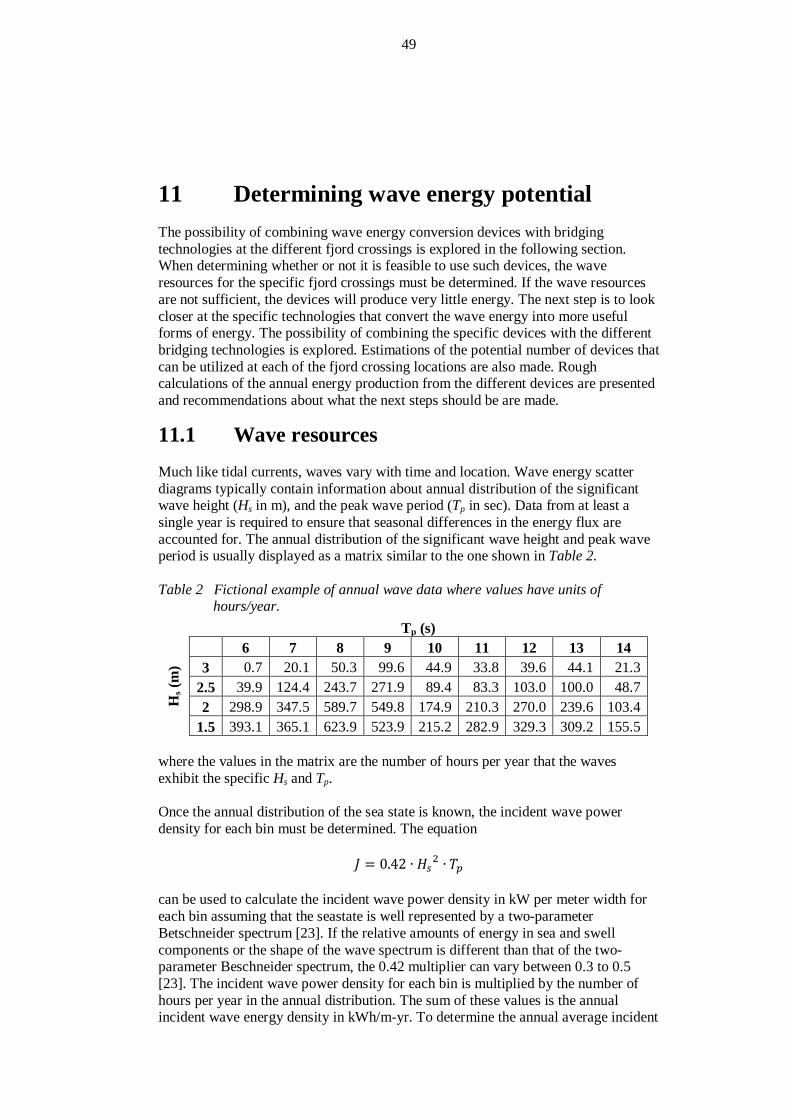
49
11 Determining wave energy potential The possibility of combining wave energy conversion devices with bridging technologies at the different fjord crossings is explored in the following section. When determining whether or not it is feasible to use such devices, the wave resources for the specific fjord crossings must be determined. If the wave resources are not sufficient, the devices will produce very little energy. The next step is to look closer at the specific technologies that convert the wave energy into more useful forms of energy. The possibility of combining the specific devices with the different bridging technologies is explored. Estimations of the potential number of devices that can be utilized at each of the fjord crossing locations are also made. Rough calculations of the annual energy production from the different devices are presented and recommendations about what the next steps should be are made.
11.1 Wave resources Much like tidal currents, waves vary with time and location. Wave energy scatter diagrams typically contain information about annual distribution of the significant wave height (Hs in m), and the peak wave period (Tp in sec). Data from at least a single year is required to ensure that seasonal differences in the energy flux are accounted for. The annual distribution of the significant wave height and peak wave period is usually displayed as a matrix similar to the one shown in Table 2. Table 2 Fictional example of annual wave data where values have units of
hours/year. Tp (s)
Hs (
m)
6 7 8 9 10 11 12 13 14 3 0.7 20.1 50.3 99.6 44.9 33.8 39.6 44.1 21.3
2.5 39.9 124.4 243.7 271.9 89.4 83.3 103.0 100.0 48.7 2 298.9 347.5 589.7 549.8 174.9 210.3 270.0 239.6 103.4
1.5 393.1 365.1 623.9 523.9 215.2 282.9 329.3 309.2 155.5 where the values in the matrix are the number of hours per year that the waves exhibit the specific Hs and Tp. Once the annual distribution of the sea state is known, the incident wave power density for each bin must be determined. The equation
𝐽 = 0.42 ∙ 𝐻𝑠2 ∙ 𝑇𝑝 can be used to calculate the incident wave power density in kW per meter width for each bin assuming that the seastate is well represented by a two-parameter Betschneider spectrum [23]. If the relative amounts of energy in sea and swell components or the shape of the wave spectrum is different than that of the two-parameter Beschneider spectrum, the 0.42 multiplier can vary between 0.3 to 0.5 [23]. The incident wave power density for each bin is multiplied by the number of hours per year in the annual distribution. The sum of these values is the annual incident wave energy density in kWh/m-yr. To determine the annual average incident

50
wave power density at the location (in kW/m), annual incident wave energy density can be divided by the number of hours in the year. Once the annual incident wave energy density is known, an assumption has to be made about the cross channel variation. For feasibility level studies, it can be assumed that there is no variation in the wave resources across the channel. While this overestimates the available resource, it is often a necessary approximation in the absence of other data. With this assumption, the annual wave resource (in kWh/year) can be calculated by multiplying the annual incident wave energy density by the width of the channel. Unfortunately, very little wave resource data is currently available in the regions where the fjord crossings are proposed. An investigation into the reasons for this lack of data revealed that modelling of waves in the fjord is a difficult task and experts in the field claim that it is a very time consuming and expensive process. This is partially due to the fact that the swells usually must be accounted for in addition to wind waves and that the geography of the specific site is very important. Additionally there is less satellite data near shore, and not very many in situ buoys, which makes validation of models very difficult. With no reliable data available, it was not possible to calculate the available wave resources at the fjord crossing locations at this time. When more wave resource data is available, the method described above can be used to determine the wave available for the proposed fjord crossing locations.
11.2 Combining wave conversion devices with bridging technologies
The developers were asked in the RFI to discuss whether or not their technology could be combined with a suspension bridge, floating bridge, or submerged floating tunnel. The responses to these questions are discussed in this section. Limitations and requirements which can be used to determine the number of devices that can be utilized at each location are investigated.
11.2.1 Concepts While some of the developers did not see a possibility to combine their devices with the bridging structure, several of the developers did respond positively when asked if their devices could be combined with the different bridging technologies. The full responses of the developers are given in Appendix 6. The basic concepts for combining the WEC devices with the different bridging technologies are described below:
• Integrating the WEC device into the bridging structure • Integrating just the power take-off of the device into the bridging structure • Mooring the WEC device directly to the bridging structure • Integrating the WEC device into a floating platform, which is then moored to
the bridging structure • Using the WEC as a breakwater that is installed adjacent to the bridging
structure

51
• Replacing a typical mooring line with a lever arm that can be directly attached to the bridging structure
11.2.2 Advantages Many of the advantages of combining the WEC devices with the bridging structures are similar to those discussed for the TISEC devices in section 10.2.2. Costs savings related to installation and maintenance are again a great advantage of combining the devices with the bridging structures. By using the bridging structures as attachment points for the mooring lines, or as part of the device structure, savings on materials can be realized. The lengths of cable or pipe runs can also be reduced as a result of using the bridging structure as part of the installation which will also reduce costs. Some of the WEC devices can be used as breakwaters, which could help reduce the loads from waves on the bridging structure themselves.
11.2.3 Disadvantages One disadvantage of combining the WEC devices with the bridge structures is the fact that location of the installation is in an area where the wave resources are reduced when compared to offshore installations. The depths of the water in the fjords could also pose some limitations on the size of the devices. Several device manufacturers are however able to optimize the parameters of their devices for different locations and wave climates, meaning that the performance of the devices will not necessarily be negatively affected as a result of being located in the fjords. As discussed in section 10.2.2 for the TISEC devices, one disadvantage with combining the devices with the bridging structures is the additional loads that are induced into the structure. The same concept of using the overcapacity of the bridge during normal operating conditions could again be employed for the WEC devices so that this problem is alleviated. It can also be envisioned that attaching the WEC devices to the bridging structures will introduce the possibility of a health and safety hazard to passing vessels. The reader is again referred to the risk analysis report for more information about how this problem can be alleviated [28].
11.2.4 Requirements and limitations To determine the total potential energy output from the WEC devices, the number of devices that can be utilized for each of the crossing locations must be determined. As was the case for the TISEC devices, several requirements and limitations must be considered.
11.2.4.1 Downstream direction The number of devices must be limited in the downstream direction in order to fulfil the requirement that devices must be combined with the bridging structure. The device developers were asked to provide a centreline device spacing for multiple devices. For most device types, the provided centreline spacing was used as the spacing in both the downstream direction and the cross-stream direction. However, for devices which are much longer in the downstream direction, the number of devices in the downstream direction was limited based on the device’s length.
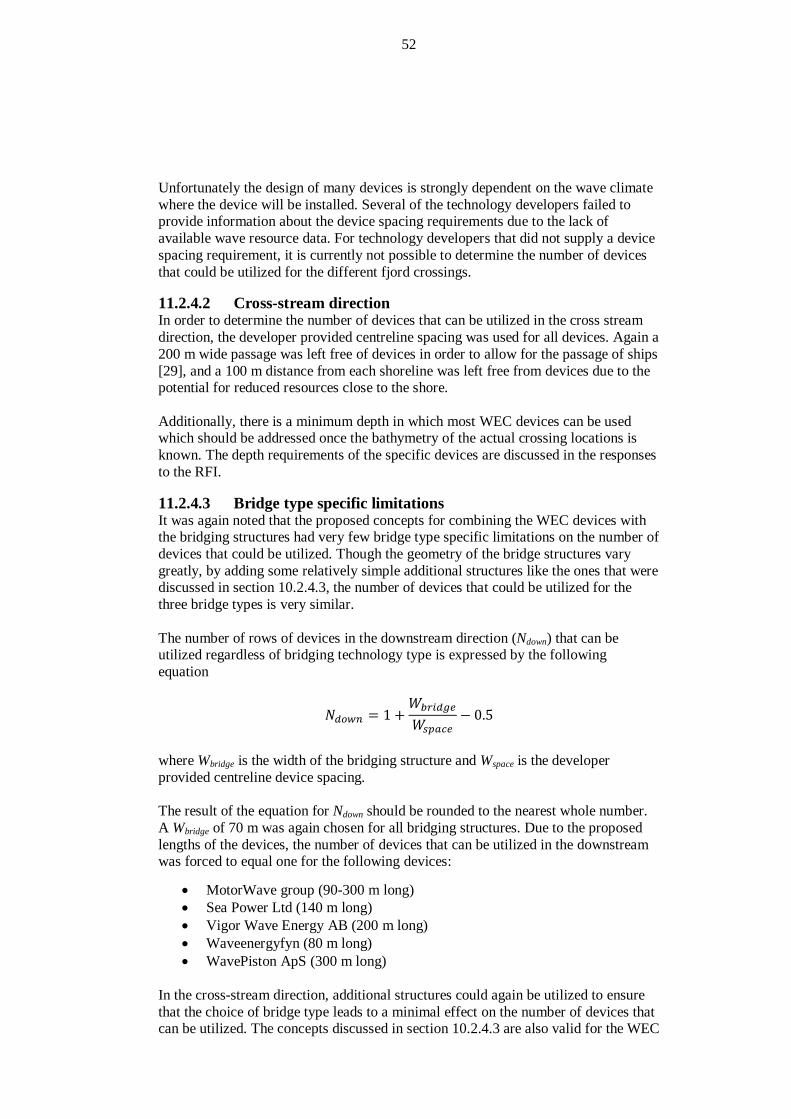
52
Unfortunately the design of many devices is strongly dependent on the wave climate where the device will be installed. Several of the technology developers failed to provide information about the device spacing requirements due to the lack of available wave resource data. For technology developers that did not supply a device spacing requirement, it is currently not possible to determine the number of devices that could be utilized for the different fjord crossings.
11.2.4.2 Cross-stream direction In order to determine the number of devices that can be utilized in the cross stream direction, the developer provided centreline spacing was used for all devices. Again a 200 m wide passage was left free of devices in order to allow for the passage of ships [29], and a 100 m distance from each shoreline was left free from devices due to the potential for reduced resources close to the shore. Additionally, there is a minimum depth in which most WEC devices can be used which should be addressed once the bathymetry of the actual crossing locations is known. The depth requirements of the specific devices are discussed in the responses to the RFI.
11.2.4.3 Bridge type specific limitations It was again noted that the proposed concepts for combining the WEC devices with the bridging structures had very few bridge type specific limitations on the number of devices that could be utilized. Though the geometry of the bridge structures vary greatly, by adding some relatively simple additional structures like the ones that were discussed in section 10.2.4.3, the number of devices that could be utilized for the three bridge types is very similar. The number of rows of devices in the downstream direction (Ndown) that can be utilized regardless of bridging technology type is expressed by the following equation
𝑁𝑑𝑜𝑤𝑛 = 1 +𝑊𝑏𝑟𝑖𝑑𝑔𝑒
𝑊𝑠𝑝𝑎𝑐𝑒− 0.5
where Wbridge is the width of the bridging structure and Wspace is the developer provided centreline device spacing. The result of the equation for Ndown should be rounded to the nearest whole number. A Wbridge of 70 m was again chosen for all bridging structures. Due to the proposed lengths of the devices, the number of devices that can be utilized in the downstream was forced to equal one for the following devices:
• MotorWave group (90-300 m long) • Sea Power Ltd (140 m long) • Vigor Wave Energy AB (200 m long) • Waveenergyfyn (80 m long) • WavePiston ApS (300 m long)
In the cross-stream direction, additional structures could again be utilized to ensure that the choice of bridge type leads to a minimal effect on the number of devices that can be utilized. The concepts discussed in section 10.2.4.3 are also valid for the WEC

53
devices. As a rough approximation, the same 15% reduction was used when determining the number of WEC device that could be used with the submerged floating tunnel bridge design. The maximum number of devices in the cross-stream direction (Ncross) can thus be calculated using the following equation
𝑁𝑐𝑟𝑜𝑠𝑠 = ��𝐿𝑡𝑜𝑡 − 𝐿𝑑𝑒𝑝𝑡ℎ − 𝐿𝑠ℎ𝑖𝑝 − 2 ∙ 𝐿𝑒𝑑𝑔𝑒 −𝑊𝑠𝑝𝑎𝑐𝑒
𝑊𝑠𝑝𝑎𝑐𝑒� ∙ (1− 𝑅)� − 0.5
The result of the equation for Ncross should be rounded to the nearest whole number. The total maximum number of WEC devices that can be utilized for each crossing for each bridge type (Ntot) can be calculated by multiplying Ndown by Ncross.
11.3 Wave energy conversion device output With no wave data currently available for the fjord crossing locations, it was not possible to perform detailed potential energy output calculations at this phase of the project. A method for accurate calculations is again presented which can be used when the appropriate data becomes available. The simplified method discussed in section 10.3.2 can be applied to the WEC devices in order to get a rough idea of the potential annual energy outputs for the different technologies at the different fjord locations if the wave data collection shows that the fjord crossings have significant wave resources.
11.3.1 Detailed method for device output calculations In order to accurately determine the potential output of the WEC device, the approximate annual distribution of the significant wave height, and the peak wave period must be known for the specific location of interest. The device developers were asked to provide a matrix showing the wave power absorption performance (in kW before losses in conversion to electric power) as a function of significant wave height and peak wave period. By multiplying the matrix of the annual distribution of the resources by the matrix of the wave power absorption performance, the total annual absorbed energy (in GWh/yr) can be calculated by summing all of the bins. The individual device maximum annual energy output can then be calculated by multiplying the total annual absorbed energy by the efficiency of the power take-off system. The power take-off system efficiency includes efficiency from the drivetrain, generator and the power conditioning. The efficiency of the power take-off system is highly dependent on the actual design, and should be based on manufacturer supplied data. The next step is to determine the number of devices that can be utilized for the particular fjord crossing locations. The methods described in section 11.2.4 can be used to determine the number of devices that can be used for each fjord crossing and each bridge type. By assuming that the cross-channel variations in the waves is to be ignored at this point, the maximum annual energy output for the fjord crossing can be determined by multiplying the number of devices by the annual energy production from each device.
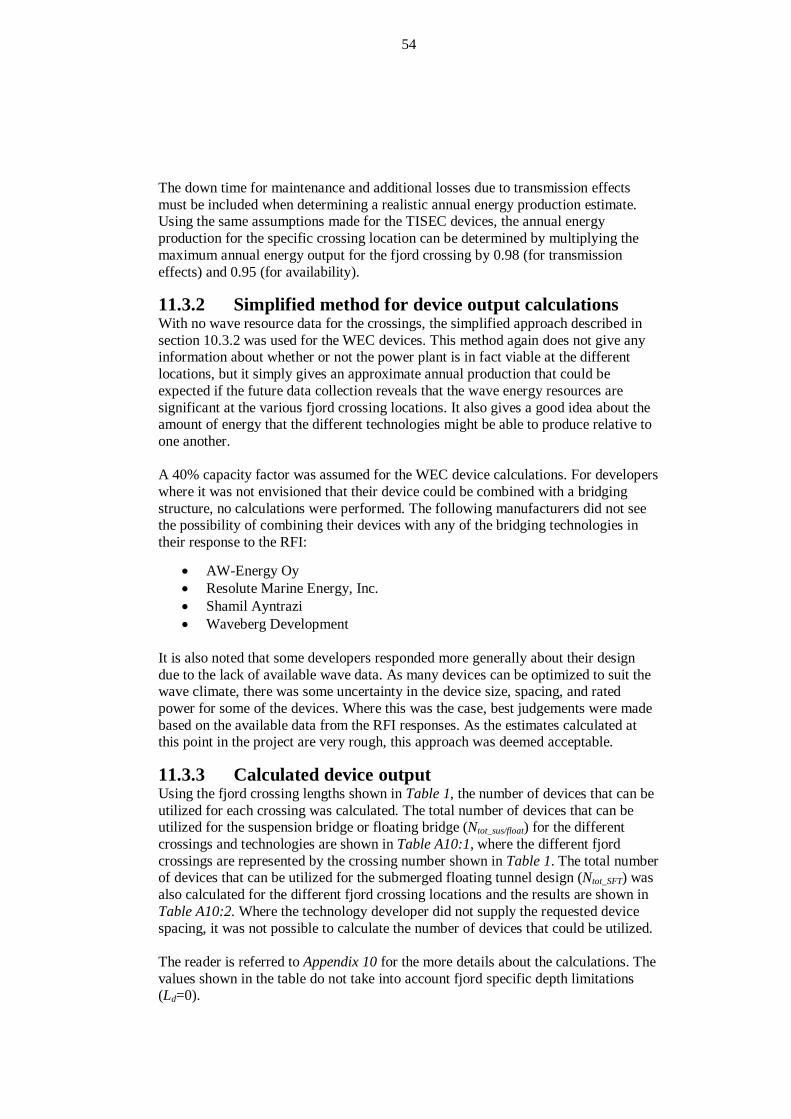
54
The down time for maintenance and additional losses due to transmission effects must be included when determining a realistic annual energy production estimate. Using the same assumptions made for the TISEC devices, the annual energy production for the specific crossing location can be determined by multiplying the maximum annual energy output for the fjord crossing by 0.98 (for transmission effects) and 0.95 (for availability).
11.3.2 Simplified method for device output calculations With no wave resource data for the crossings, the simplified approach described in section 10.3.2 was used for the WEC devices. This method again does not give any information about whether or not the power plant is in fact viable at the different locations, but it simply gives an approximate annual production that could be expected if the future data collection reveals that the wave energy resources are significant at the various fjord crossing locations. It also gives a good idea about the amount of energy that the different technologies might be able to produce relative to one another. A 40% capacity factor was assumed for the WEC device calculations. For developers where it was not envisioned that their device could be combined with a bridging structure, no calculations were performed. The following manufacturers did not see the possibility of combining their devices with any of the bridging technologies in their response to the RFI:
• AW-Energy Oy • Resolute Marine Energy, Inc. • Shamil Ayntrazi • Waveberg Development
It is also noted that some developers responded more generally about their design due to the lack of available wave data. As many devices can be optimized to suit the wave climate, there was some uncertainty in the device size, spacing, and rated power for some of the devices. Where this was the case, best judgements were made based on the available data from the RFI responses. As the estimates calculated at this point in the project are very rough, this approach was deemed acceptable.
11.3.3 Calculated device output Using the fjord crossing lengths shown in Table 1, the number of devices that can be utilized for each crossing was calculated. The total number of devices that can be utilized for the suspension bridge or floating bridge (Ntot_sus/float) for the different crossings and technologies are shown in Table A10:1, where the different fjord crossings are represented by the crossing number shown in Table 1. The total number of devices that can be utilized for the submerged floating tunnel design (Ntot_SFT) was also calculated for the different fjord crossing locations and the results are shown in Table A10:2. Where the technology developer did not supply the requested device spacing, it was not possible to calculate the number of devices that could be utilized. The reader is referred to Appendix 10 for the more details about the calculations. The values shown in the table do not take into account fjord specific depth limitations (Ld=0).

55
Using the rated power for each device and the number of devices that can be utilized, the estimated annual energy production was determined for the different technologies, fjord crossing locations and bridging technologies using the assumed capacity factor of 40%. The results shown in Table A11:1 show the annual energy production in (GWh/year) for the suspension bridge or floating bridge designs (Esus/float) and the results shown in Table A11:2 show the annual energy production for the submerged floating tunnel design (ESFT). The different fjord crossings are represented by the crossing number shown in Table 1. Where the technology developer did not supply device spacing requirements or the rated power of the device, no calculation of the annual energy production was performed. Table A11:1 and Table A11:2 show that there is a large range of estimated annual energy production from the different technologies. This is in large part due to the variation in the different technology types, sizes of the devices and the wave resources in which the devices are rated. Because there is no available information about the wave resources, a rough approximation of the annual energy production is again determined using the average of the different estimates. Assuming all of the fjord crossing locations have significant tidal resources it can be estimated that the total annual energy production from the WEC devices is between 9.3 and 11.0 TWh/yr (depending on the bridge designs). When the calculated values are compared to previous annual estimations of the resource in Norway, we see that there is a discrepancy. The previously mentioned study estimated that the maximum total economical resource was around 30 TWh/yr for Norway [16]. Though the presented calculations do not exceed this estimate, the estimate considers offshore locations, where resources are likely greater than they are at the fjord crossing locations of interest. With the presented calculations overestimating the energy production when compared to previous studies, it can be concluded that at least one of the assumptions made in the calculations is non-conservative. The first potentially non-conservative assumption is that the average of the calculated annual energy productions from the different devices would be representative of the actual possible energy production. As for the TISEC devices, the WEC devices have a large spread in their rated power and the sea state for which they are rated. Also the devices are all at different technology readiness levels causing there to be different levels of uncertainty in their estimated performance. The other potentially non-conservative assumption is that the WEC devices will be able to achieve capacity factors of 40% in the locations of the fjord crossings. Unfortunately with no wave resource data for the fjords of interest available it is not possible to estimate what accurate capacity factors of the different devices are.
11.4 Wave energy recommendations Without wave resource data for the particular locations of the proposed fjord crossings, it is not possible to calculate realistic estimates of what the potential energy output is from combining the WEC devices with the bridging technologies. Additionally, with no available wave resource data, the WEC developers did not have the possibility to optimize their devices according to the wave conditions for the particular fjord crossing locations. This means that it is not possible to use the results from the previous section when making recommendations about which technologies

56
would provide the most energy for the crossing locations. It is therefore recommended that the next step is to obtain more wave resource data for all of the fjord crossing locations. The wave resource data could initially be obtained from models, which should be able to provide accurate enough information to see if the wave resources at the particular fjord crossing location are significant enough to be considered further. If the models show that the wave resources are significant, then experimental data should be gathered at the fjord crossing locations in order to verify the results from the models. Data should include both the significant wave height and the peak wave period. Again, the experimental data should be gathered over a significant period of time to ensure that the models reliably take into account seasonal variations in the wave resources. With detailed information about the annual distribution of the significant wave height and the peak wave period available, the developers should be contacted and asked to optimize the designs of their devices according to the wave resources at the fjord crossing locations of interest. At that point any necessary non-discloser agreements should be signed in order to gain access to proprietary information about the performance of the WEC devices. Once the designs have been optimized and updates have been made to the wave power absorption performance matrices, the calculation methods described in section 11.3.1 can be utilized to determine realistic estimates of the energy production for the different technologies. Using this detailed information, comparisons can be made between the different technologies, and recommendations can be made. The recommendations can include information about whether or not the WEC device power plants are viable and about which technology, or combination of technologies will be most effective for the different fjord crossing locations if the power plants are viable.

57
12 Combining multiple renewable energy technologies
Within the Ferry Free E39 project, several different renewable energy technologies are being simultaneously considered. This report discusses the potential of combining tidal and wave energy conversion devices with the bridging technologies at the various fjord crossing locations. Because both the tidal and wave energy conversion devices need access to the water in the area surrounding the bridge structure, there will likely be conflicts over the available area around the structure. More than likely compromises will need to be made and bridges will not be able to utilize both tidal and wave energy conversion devices in the same sections of the bridge. When the wave and tidal resources are better known, optimal solutions can be better determined. When considering combining wave or tidal energy conversion devices with wind and solar energy conversion technologies, both conflicts and synergy effects can be envisioned. The reader is refered to SP’s Solar and Wind energy technology surveys for the Ferry Free E39 project, which give detailed information about how solar and wind energy conversion devices can be combined with the bridging structures [30] [31]. If it is decided to use additional structures to increase the number of potential tidal or wave energy conversion devices in the downstream direction, then the available area for solar cells can be greatly increased. The additional structures could even be formed to help increase the wind velocity seen by the wind conversion technologies. Of course the optimization of the designs will depend on the relative available resources at each of the different locations and goes beyond the scope of the present study.

58
13 Summary and conclusions In order to determine the feasibility of combining the proposed fjord crossing solutions for the Ferry Free E39 project with renewable energy power plants, the current state of the art of the renewable energy technologies must be reviewed and realistic estimations of the potential energy that could be obtained from the fjord crossings must be made. This report describes the background of the project and the requests for information questionnaires that were developed and sent to the tidal and wave energy technology developers. The result of survey is a comprehensive and up to date collection of information about the tidal and wave energy technology developers who are are potential partners for later stages in the Ferry Free E39 project. The information is presented in table format allowing for comparisons to be easily made between the different technologies. This report also describes the concepts that developers suggested for how their devices could be attached to the different bridging structures and the advantages and disadvantages of the different concepts. Additionally, concepts were presented which allow the number of devices that can be utilized at the various fjord crossings to be maximized. Methods to calculate the energy that could be obtained by employing wave and tidal energy conversion technologies are also discussed. Unfortunately, a lack of tidal and wave energy resource data at the fjord crossing locations made it impossible to utilize the detailed calculation method that was described and a simplified calculation method was used to calculate rough estimates of the energy potential from the different devices. When the estimates were compared to previous studies it showed that the estimates based on the simplified approach were non-conservative. Source of non-conservatism in the calculations were discussed and it was concluded that the next stage of the study should concentrate on obtaining reliable data about the tidal and wave energy resources for the different fjord crossing locations. The data should be obtained over a significant period of time to ensure that the effects of seasonal variations in the resources are captured. Once tidal and wave resources data is available, more realistic calculations of the potential energy production can be completed. At that point, comparisons of the performance of the difference technologies can be made. From that point, more detailed studies should be undertaken where the concepts for combining the devices with the bridging technologies are optimized. This optimization should include actions such as loads analysis, structural strength calculations, reliability and fatigue performance evaluations and detailed cost estimates.

59
14 References [1] Zabihian F, Fung AS. Review of marine renewable energies: Case study of
Iran. Renewable and Sustainable Energy Reviews 2011;15:2461-2474. [2] Yun Seng. Lim and Siong Lee. Koh (2009). Marine Tidal Current Electric
Power Generation: State of Art and Current Status, Renewable Energy, T J Hammons (Ed.), ISBN: 978-953-7619-52-7, InTech, Available from: http://www.intechopen.com/articles/show/title/marine-tidal-current-electric-power-generation-state-of-art-and-current-status
[3] Comission, E., Ocean energy conversion in Europe: Recent advancements and prospects. 2006, Centre for Renewable Energy Sources: Pikermi, Greece.
[4] Fujita Research - Wave and tidal power. http://www.fujitaresearch.com/reports/tidalpower.html. Retrieved February 15, 2012.
[5] Spain R. A possible Roman Tide Mill. Paper 005. Kent Archaelological Society 2002.
[6] Ryckaert M. Olhao Tide Mill.jpg. http://en.wikipedia.org/wiki/File:Olhao_Tide_Mill.jpg. Retrieved February 15, 2012. Under the Creative Commons Attribution 3.0 Unported license. More information on this license is available at http://creativecommons.org/licenses/by/3.0/.
[7] Rourke FO, Boyle F, Reynolds A. Tidal energy update 2009. Applied Energy 2010;87:398-409.
[8] The original Bay of Fundy website. http://bayoffundy.com/about/highest-tides/. Retrieved February 15, 2012.
[9] Bedard R. Survey and characterization - tidal in stream energy conversion (TISEC) devices. EPRI TP-004 NA; November 2005.
[10] Bahaj AS, Myers L. Analytical estimates of the energy yield potential from the Alderney Race (Channel Islands) using marine current energy converters. Renewable Energy 2004;29:1931-1945.
[11] T. J. Hammons (2009). Tidal Energy Technologies: Currents, Wave and Offshore Wind Power in the United Kingdom, Europe and North America, Renewable Energy, T J Hammons (Ed.), ISBN: 978-953-7619-52-7, InTech, Available from: http://www.intechopen.com/articles/show/title/tidal-energy-technologies-currents-wave-and-offshore-wind-power-in-the-united-kingdom-europe-and-nor
[12] Grabbe M, Lalander E, Lundin S, Leijon M. A review of the tidal current energy resource in Norway. Renewable and Sustainable Energy Reviews 2009;13:1898-1909.
[13] Johnson JB, Pride DJ. River, Tidal, and Ocean Current Hydrokinetric Energy Technologies: Status and Future Opportunities in Alaska. 2010, Alaska Center for Energy and Power.
[14] UK, Europe and global tidal stream energy resource assessment. Black Veatech Ltd.; September 2005.
[15] Fröberg E. Current Power Resource Assessment - A study of selected sites in Sweden and Norway. Master's thesis. Uppsala University; September 2006.
[16] Potensialstudie av havenergi i Norge. SWECO Grøner. Report 154650-2007.1, Enova SF; October 2007.
[17] The European Marine Energy Centre (EMEC) Ltd website. http://www.emec.org.uk/. Retrieved February 15, 2012.

60
[18] The U.S. Department of Energy - Marine and Hydrokinetic Technology Database website. http://www1.eere.energy.gov/water/hydrokinetic/default.aspx. Retrieved February 15, 2012.
[19] Lunar Energy official website. http://www.lunarenergy.co.uk/productOverview.htm. Retrieved February 15 2012.
[20] Rahm M. Ocean Wave Energy - Underwater Substation System for Wave Energy Converters. PhD thesis. Uppsala University; March 2010.
[21] de O. Falcão AF. Wave energy utilization: A review of the technologies. Renewable and Sustainable Energy Reviews 2010;14(3):899-918.
[22] Siegel SG, Fagley C, Römer M, Mclaughlin, TE. Experimental Wave Cancellation using a Cycloidal Wave Energy Converter. Proceedings of the 9th European Wave and Tidal Energy Conference, Southampton, UK, 5th-9th September 2011.
[23] Hagerman G, Bedard R. Guidelines for Preliminary Estimation of Power Production by Offshore Wave Energy Conversion Devices. E2I EPRI-WP-US-001; December 2003.
[24] Google Mpas. http://maps.google.com. Retrieved March 9, 2012. [25] Mulighetsstudie – Kryssing av Sognefjorden – oppsummering etter idéfasen,
Statens vegvesen Region vest, Versjon 23.03.2011. [26] Bedard R, Previsic M. Methodology for Estimating Tidal Current Energy
Resources and Power Production by Tidal In-Stream Energy Conversion (TISEC) Devices. EPRI TP-001 NA Rev 3; September 2006.
[27] Gjevik B, Gundersen E, Sandbo H. Vudering av potensialet for kraftproduksjon i forbindelse med bruer langs ferjefri E39. Arbeidsutkast, 2012-03-14.
[28] Lindberg U, Probability estimate of ship collision with planned E39 bridges, SSPA Report No.:20126158, SSPA Sweden AB, March 5, 2012.
[29] Ferjefri E39 – bru over Bjørnafjorden, Jan Soldal/Akvator AS, Multiconsult AS, LMG Marin AS, Sintef/Marintek, February 2012.
[30] Kovacs P, Wahlgren P, Solar energy technology survey for Ferry Free E39 project, SP, Borås Sweden, March 2012.
[31] Åkesson L, Wind energy technology survey for Ferry Free E39 project, SP, Borås Sweden, March 2012.
Appendices 1. TISEC device request for information 2. TISEC device list of developers 3. TISEC device responses 4. WEC device request for information 5. WEC device list of developers 6. WEC device responses 7. Fjord crossing locations 8. Calculations of the number of TISEC devices 9. Calculation of the energy from TISEC devices 10. Calculations of the number of WEC devices 11. Calculation of the energy from WEC devices

61
Appendix 1: TISEC device request for information

62
Dear Sir or Madam: SP Technical Research Institute of Sweden has been commissioned by the Norwegian Public Roads Administration in a project that will potentially utilize a large number of tidal in stream energy conversion devices. We are currently in the process of performing a technology survey to determine the capabilities and characteristics of the different devices that are being developed. Upon review of the information available on the internet it seems that your technology is potentially promising for our application. We have developed a short questionnaire that we are asking all companies of interest to fill out in order to have an up-to-date basis for comparison of the different technologies. We would appreciate it if you could take the time to fill out the table below and send it back to me before 2012-01-31. If any of the information is not currently available then simply state that in your reply. A fictional sample reply is provided for your convenience and more information about some of the questions is given in the information below. I have also attached a copy of the questionnaire in excel format if you have any problems with the formatting of the table in the email when you reply. For more information about the background of the project itself, please see the information below*. The results of this technology survey will be presented as part the workshop/conference scheduled for April 2012 (probably in Trondheim, Norway). If you have any questions about the questionnaire or if you would like more detailed information about the project then feel free to contact me by replying to this email or calling at the number given below. Best regards, Daniel
Daniel Vennetti
SP Sveriges Tekniska Forskningsinstitut SP Technical Research Institute of Sweden Byggnadsteknik och Mekanik/Buildning Technology and Mechanics Box 857, SE-501 15 Borås, Sweden Tel: +46 (0)10 516 50 00, (direct) +46 (0)10 516 57 83 E-post: [email protected] Internet: www.sp.se

63
Fictional Sample Reply Company SP - Technical Research Institute of Sweden Country Sweden Web address http://www.sp.se/en/Sidor/default.aspx
Technology Name SP Tidal Technology
Device Type ** A) Horizontal Axis Turbine B) Cross-Axis Turbine C) Oscillating Hydrofoil D) Enclosed Tips (Venturi) E) Other Designs
A
Method to fix the device ** i) Seabed Mounted/Gravity Base ii) Pile Mounted iii) Floating (Flexible Mooring, Rigid Mooring, or Floating structure) iv) Hydrofoil Inducing Downforce
iii (Flexible mooring)
Is power generated during ebb and flood flows Yes
Features / Design principle
SP Tidal Technology has three unshrouded horizontal axis turbines that are attached to
a floating platform that has a flexible mooring system. The flexible mooring
allows the platform to swing as the tidal direction changes so that power is generated with equal efficiency in both ebb and flood
flows. Development status *** TRL 1-3, TRL 4, TRL 5/6, TRL 7/8 or TRL 9 TRL7/8
Description of any and all prototypes (including test facility used or location of testing, dates, and hours of operation)
A 1:10 scale proof-of-concept model was tested at SP's wave laboratory in Borås
Sweden 2007-10.
A 1:5 scale model including the floating platform and flexible mooring devices was
tested at SP's Big wave test facility in Borås, Sweden 2009-11.
A full scale model is currently being tested including the floating platform and flexible
mooring system in the SP slow fjord in Borås, Sweden which has maximum flow speed of 1.5 m/s. The full scale model was deployed 2010-06 and has been generating
power to the grid for over 4000 hours.

64
Next development steps
We have a spot reserved at the SP fast fjord test facility in Borås, Sweden
which has a maximum flow speed of 3.0 m/s. Testing is expected to begin in 2012-07
Power train type Direct drive generator
Dimensions
Each of the three turbines has 2 rotors with a 20 m diameter. The floating platform itself
is 100 m wide x 100 m deep and has a height of 3 m. the bottom 1 m of the
platform will be under the water level.
Area of current flow used by the device (m2) Shroud inlet area for an enclosed tips turbine Swept area of the turbine blades for an unshrouded turbine Plan form area for a vertical axis turbine
942
Weight of super structure (ton) 75 Weight of power take off equipment (ton) 100 Min installation depth (m) 30 Max installation depth (m) 100 Design lifetime (years) 15 Cut in speed (m/s) 0.7 Rated flow speed (m/s) 3 Rated power (kW) at rated flow speed 4000 Maximum flow speed (m/s) 3.5 Current speed (m/s) vs electric power output (kWe) data points See below
Estimated date commercially available 2015-01 Estimated production cost per rated unit (EUR) 5.00E+06
Have environmental impact studies been performed Yes
Technical publications
Vennetti D. Power predictions of the SP Tidal Technology,. Renewable Energy
Review 2007;5(5)20-50.
Vennetti D. SP Tidal Technology Environmental Impact Study,. Environment
Magazine 2011;2(20)15-35. Figures/photographs of device have been attached to reply
Yes (not actually true for this fictional example)
Could the device be combined with a suspension bridge fjord crossing / how?
Yes, the mooring lines could be attached to an overhanging suspension bridge.
This configuration was tested with the 1:5
scale model described above.

65
Advantages / disadvantages of combining the device with a suspension bridge fjord crossing
For a deep water fjord, connecting the mooring lines to an overhanging bridge
would be an advantage because the main limitation on the depth of the design is due
to a maximum permissible length of the mooring lines. Using an overhanging
bridge, the fjord could be infinitely deep.
Another advantage of attaching the mooring lines to an overhanging bridge would be
that the attachment point could be designed into the bridge structure, which saves time
and money that is spent in a traditional installation attaching the mooring lines to
the seabed.
One disadvantage is the additional horizontal load on the bridge structure from reacting the force absorbed by the device.
Could the device be combined with a floating bridge fjord crossing / how?
Yes, the mooring lines could be attached to the overhanging bridge assuming that there is enough clearance between the pontoons for the platform to turn around when the
tides change direction.
Advantages / disadvantages of combining the device with a floating bridge fjord crossing
Based on the clearance between the pontoons, a special device may need to be designed that allows the platform to rotate
when the tides change direction.
The effects of the pontoons on the flow characteristics around the device would have to be evaluated to ensure that the device performance is not negatively
affected.
A disadvantage would again be the additional horizontal load on the bridge
structure from reacting the force absorbed by the device.
Could the device be combined with a submerged floating tunnel fjord crossing / how?
Yes, depending on the submerged depth of the floating tunnel, our platform should be
able to be combined to a submerged floating tunnel because it in principle would be the same as attaching the mooring lines to the
ocean floor.

66
Advantages / disadvantages of combining the device with a submerged floating tunnel fjord crossing
The main advantage is that it would be cheaper to install the device because an
attachment point could be designed into the tunnel geometry, which saves time and
money that is spent in a traditional installation attaching the mooring lines to
the seabed.
The disadvantage again would be the additional horizontal load on the supporting
structure caused by reacting the force absorbed by the device.
Current Speed
(m/s) Electric Power Output (kWe)
0.7 59 0.8 89 0.9 125 1 172
1.1 219 1.2 285 1.3 362 1.4 475 1.5 611 1.6 759 1.7 910 1.8 1080 1.9 1214 2 1416
2.1 1524 2.2 1735 2.3 2029 2.4 2304 2.5 2605 2.6 2930 2.7 3135 2.8 3497 2.9 3614 3 4000
3.1 4000

67
3.2 4000 3.3 4000 3.4 4000 3.5 4000
* Project Background E39 is a road that is located on the west coast of Norway and extends from Kristiansand in the south to Trondheim in the north. Currently, a number of ferry crossings are required to traverse its entire length. The Transport Ministry has given a mandate for the project “Ferry Free E39” to assess the technological solutions for the crossing of eight large fjords without ferries. The fjords crossings range from 1.5 km to 25 km in length and have depths up to 1300 m. Proposed solutions for the crossings that are under consideration consist of suspension bridges, floating bridges, submerged floating tunnels, and sub-sea rock tunnels. Part of the project is to consider how the construction of the crossings can be combined with devices that produce energy from waves, tides, wind and the sun. The idea is that by using the bridge construction as part of the facility, the costs of the renewable power plants could be reduced and therefore be more competitive with non-renewable energy sources. Questionnaire Information ** Device Type and Method to fix the device More information about the classification of device types and methods to fix the device can be found at the European Marine Energy Centre (EMEC) website at the following address: http://www.emec.org.uk/tidal_devices.asp *** Development status The development status of the project should be classified using the following technology readiness levels, which were obtained from the U.S. department of energy website at the following address: http://www1.eere.energy.gov/water/hydrokinetic/usingDB.aspx TRL 1-3: Discovery / Concept Definition / Early Stage Development, Design and Engineering TRL 1-2: These are the lowest levels of technology readiness. Scientific research begins to be translated into applied research and development where basic principles are observed and reported. Technology concept and application are formulated and investigated through analytic studies and in-depth investigations of principal design considerations. This stage is characterized by paper studies, concept exploration, and planning. TRL 3: In this stage, active research is initiated, including engineering studies and laboratory studies to physically validate analytical predictions of separate elements of the technology.

68
The purpose of this stage is to evaluate, insofar as possible, the scientific or technical merit and feasibility of ideas that appear to have commercial potential. TRL 4: Proof of Concept In this stage basic technological components of a sub-scale model are integrated to validate design predictions and system level functionality. The models, or critical subsystems, are tested in a laboratory environment. This TRL represents early stage proof-of-concept system or component development, testing and concept validation. In this stage, critical technology elements are developed and tested in a laboratory environment. It is envisioned that scale models will be at 1:10 scale or smaller. TRL 5/6: System Integration, and Technology Laboratory Demonstration TRL 5: At this level, basic technological components are fabricated at a scale relevant to full scale and integrated to establish and verify subsystem and system level functionality and preparation for testing in a simulated environment. TRL 6: At this level, representative model or prototype system at a scale relevant to full scale, which is beyond that of TRL 5, is tested in a relevant environment. This stage represents a major step up in a technology's demonstrated readiness and risk mitigation and is the stage leading to open water testing. At this stage device, system, and subsystem level interfacing/integration testing represent a vital stage in technology development, and must be demonstrated. Models should be at a relevant scale (1:1 – 1:5) to reflect the challenges and realities of the full scale (1:1) system. Model testing is to be performed in a test facility capable of producing simulated waves/currents and other operational conditions while monitoring device response and performance. Furthermore, the devices foundation concept shall be incorporated and demonstrated. TRL 7/8: Open Water System Testing, Demonstration, and Operation TRL 7: At this level, the prototype scale components and subsystems are fabricated and integrated to establish and verify subsystem and system level functionality and preparation for testing in an open water operational environment to verify expected operation and fine tune the design prior to deployment in an operational demonstration project. TRL 8: At this level, the prototype in its final form (at or near full scale) is to be tested, and qualified in an open water environment under all expected operating conditions to demonstrate readiness for commercial deployment in a demonstration project. Testing should include extreme conditions. At this stage, the device model scale is expected to be at or near full scale (1:1 – 1:2). Testing may be initially performed in water at a relatively benign location, with the expectation that testing then be performed in a fully exposed, open water environment, where representative operating environments can be experienced. The final foundation/mooring design shall be incorporated into model testing at this stage.

69
DOE TRL 9: Commercial-Scale Production / Application At this stage, the actual, commercial-scale system is proven through successful mission operations, whereby it is fielded and in-use in commercial application. This stage represents an in-service application of the technology in its final form and under mission condition

70
Appendix 2: TISEC device list of developers
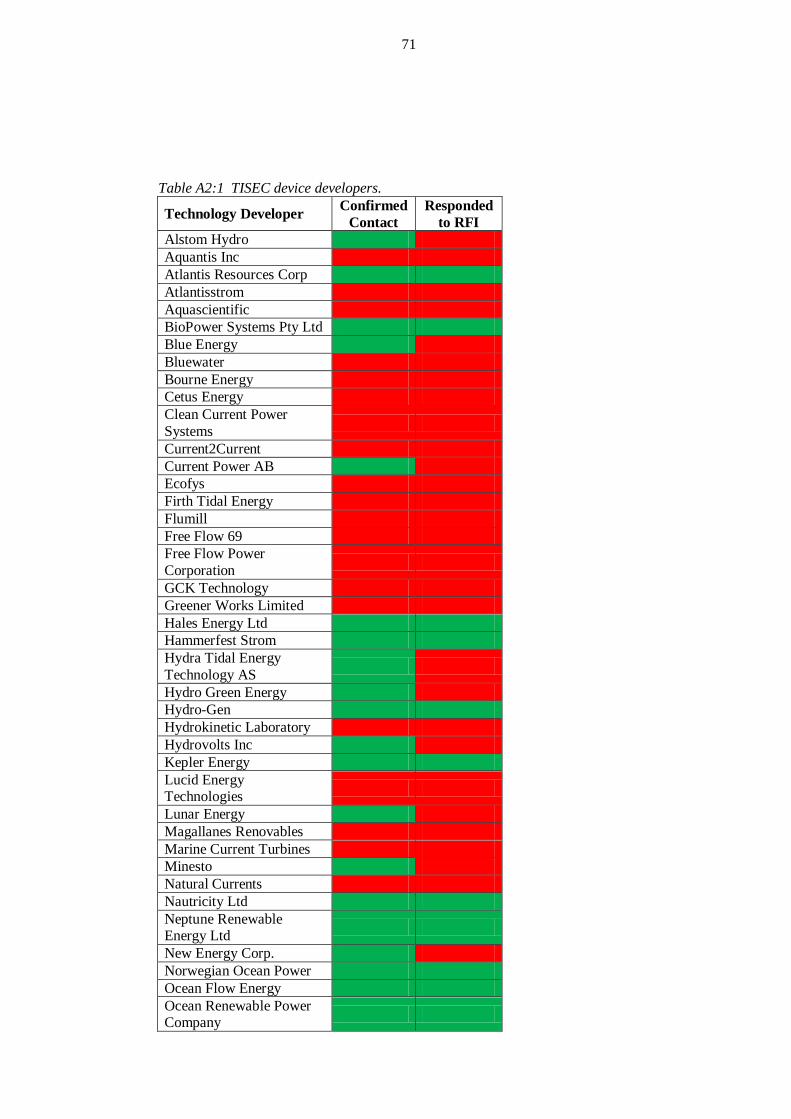
71
Table A2:1 TISEC device developers.
Technology Developer Confirmed Contact
Responded to RFI
Alstom Hydro 1 0 Aquantis Inc 0 0 Atlantis Resources Corp 1 1 Atlantisstrom 0 0 Aquascientific 0 0 BioPower Systems Pty Ltd 1 1 Blue Energy 1 0 Bluewater 0 0 Bourne Energy 0 0 Cetus Energy 0 0 Clean Current Power Systems 0 0
Current2Current 0 0 Current Power AB 1 0 Ecofys 0 0 Firth Tidal Energy 0 0 Flumill 0 0 Free Flow 69 0 0 Free Flow Power Corporation 0 0
GCK Technology 0 0 Greener Works Limited 0 0 Hales Energy Ltd 1 1 Hammerfest Strom 1 1 Hydra Tidal Energy Technology AS 1 0
Hydro Green Energy 1 0 Hydro-Gen 1 1 Hydrokinetic Laboratory 0 0 Hydrovolts Inc 1 0 Kepler Energy 1 1 Lucid Energy Technologies 0 0
Lunar Energy 1 0 Magallanes Renovables 0 0 Marine Current Turbines 0 0 Minesto 1 0 Natural Currents 0 0 Nautricity Ltd 1 1 Neptune Renewable Energy Ltd 1 1
New Energy Corp. 1 0 Norwegian Ocean Power 1 1 Ocean Flow Energy 1 1 Ocean Renewable Power Company 1 1

72
Oceana Energy Company 0 0 Offshore Islands Ltd 1 0 OpenHydro 0 0 Ponte di Archimede 1 0 Pulse Tidal 1 0 Scotrenewables 0 0 SMD Hydrovision 0 0 Swanturbines Ltd. 0 0 Tidal Electric 1 0 Tidal Energy Ltd 0 0 Tidal Energy Pty Ltd 1 1 Tidal Generation Limited 1 1 Tidal Sails 1 1 TidalStream 0 0 Tide Tec AS 1 1 Tideng 1 1 Tocardo BV 1 1 UEK Corporation 1 0 Verdant Power 1 1 VerdErg 0 0 Voith Hydro 1 1 Vortex Hydro Energy 0 0 Water Wall Turbine 0 0

73
Appendix 3: TISEC device responses
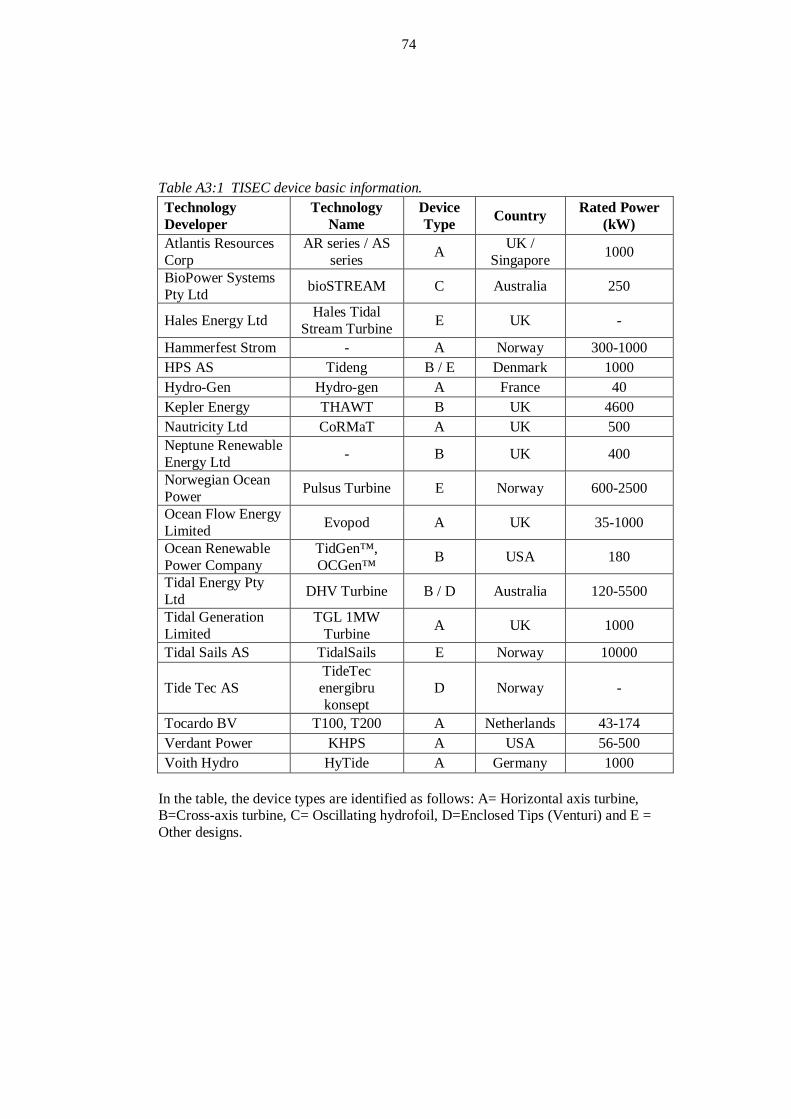
74
Table A3:1 TISEC device basic information. Technology Developer
Technology Name
Device Type Country Rated Power
(kW) Atlantis Resources Corp
AR series / AS series A UK /
Singapore 1000
BioPower Systems Pty Ltd bioSTREAM C Australia 250
Hales Energy Ltd Hales Tidal Stream Turbine E UK -
Hammerfest Strom - A Norway 300-1000 HPS AS Tideng B / E Denmark 1000 Hydro-Gen Hydro-gen A France 40 Kepler Energy THAWT B UK 4600 Nautricity Ltd CoRMaT A UK 500 Neptune Renewable Energy Ltd - B UK 400
Norwegian Ocean Power Pulsus Turbine E Norway 600-2500
Ocean Flow Energy Limited Evopod A UK 35-1000
Ocean Renewable Power Company
TidGen™, OCGen™ B USA 180
Tidal Energy Pty Ltd DHV Turbine B / D Australia 120-5500
Tidal Generation Limited
TGL 1MW Turbine A UK 1000
Tidal Sails AS TidalSails E Norway 10000
Tide Tec AS TideTec energibru konsept
D Norway -
Tocardo BV T100, T200 A Netherlands 43-174 Verdant Power KHPS A USA 56-500 Voith Hydro HyTide A Germany 1000
In the table, the device types are identified as follows: A= Horizontal axis turbine, B=Cross-axis turbine, C= Oscillating hydrofoil, D=Enclosed Tips (Venturi) and E = Other designs.

75
Company Atlantis Resources Corporation ("Atlantis") Country United Kingdom HQ/Singapore HQ Web address www.atlantisresourcescorporation.com
Technology Name AR™ series and AS™ series tidal power turbines Device Type ** A) Horizontal Axis Turbine B) Cross-Axis Turbine C) Oscillating Hydrofoil D) Enclosed Tips (Venturi) E) Other Designs
A
Method to fix the device ** i) Seabed Mounted/Gravity Base ii) Pile Mounted iii) Floating (Flexible Mooring, Rigid Mooring, or Floating structure) iv) Hydrofoil Inducing Downforce
(i), (ii) or (iii). Atlantis has experience of gravity based foundations (for the AR1000™ at EMEC), piled foundations (at our test site in San Remo,
Australia) and floating systems from our tow tests of the AS™ series turbines in Singapore and Australia. Atlantis believes that the foundation solution should be selected according to the unique site conditions and our portfolio of technology allows us to retain
this flexibility of approach with respect to final foundation design .
Is power generated during ebb and flood flows Yes
Features / Design principle
The AR™ series turbines are open ocean devices, designed for robust and reliable performance in wind
and wave swept sites. The turbines are open, unshrouded horizontal axis devices with three mono-directional blades and a 180o yawing capability for
ebb and flood generation and seasonal heading optimisation. Fixed pitch rotors with winglets to
reduce tip losses deliver reliable performance across the flow velocity distribution of a given site and an
active pitch system is used for tubrine survival mode to reduce overall system loading. The AR series
tubrines use a Permanent Magnet Generator with a single stage gearbox to maximise efficiency and
reliability.These devices are typically seabed mounted, either on piled or gravity foundations.
The AS™ series turbines are more suited to
sheltered locations as they incorporate a shroud structure to reduce tip losses from the rotor blades and increase the velocity flow of water through the
three bladed turbine. The blades are bi-directional in design and so this device incorporates no rotate
(yaw) function and is well suited for integration in permanent civil engineering structures.
Development status *** TRL 1-3, TRL 4, TRL 5/6, TRL 7/8 or TRL 9
AR™ series: TRL 8 AS™ series: TRL 7

76
Description of any and all prototypes (including test facility used or location of testing, dates, and hours of operation)
The AR1000™ was connected to grid at the European Marine Energy Centre (EMEC) in August
2011. This is a full depth, open ocean site in the North Sea, representative of the most challenging conditions to which turbines will be subjected in
commercial arrays. The turbine is the first full scale 1 MW turbine (rated at 2.65 m/s) to be connected at
such an open ocean site in Scottish waters.
In 2008 the AS400™ was extensively tow tested in Australia and Singapore and the high efficiencies were independently verified by Black and Veatch.
The AS™ series control system and operating methodology has much in common with the
AR1000™ system as tested at EMEC.
ARC has been selected as the technology provider of choice in both of the world's largest tidal power projects, including the Pentland Firth 400MW
flagship project, MeyGen and the Gulf of Kutch 250MW flagship project, Mundra Tidal Power. The
AR series tubrine systems have been selected by governments in Asia, Nth America and Europe as
the platform for full scale demonstration programs.
Of particular note, Atlantis is the technology partner of the Clearwater Consortium, a consortium of
predominentaly Dutch companies including Royal Haskoning, IHC Merwede & Ballast Nedham who are working on developing a similar project in the
Amsterdam Surge Barrier, the Oosterscheldte (Eastern Scheldt Barrier) in the Zeeland Province,
Holland. This group of experienced hydro/civil engineers and technology companies possess a particularly relevant set of skills in the design,
integration, manufacture and installation of a hydro-kinetic solution in combination with planned civil infrastructure. We would be delighted to offer you more information on the skills, service and product
offerings of the Clearwater Consortium upon request.
Next development steps
The AR1000 will be the first full scale system to be tested at the UK's National Renewable Energy
Centre (NaREC) in 2012. Due to customer demand, Atlantis will commence detailed design on a 1.5MW
and 2.0MW drive train system for the AR series turbines during 2012, due for open ocean testing in
2013. A berth has been awarded to ARC at the Fundy Ocean Research Centre for Energy in Canada which we seek to develop in 2012/13, and other full
scale demonstration projects are planned in Italy,

77
China and the Netherlands. These form an integral part of ARC's path to a warranted commercial
product.
Power train type
The ARC turbines are currently fitted with single stage gearboxes connected to a PMG. The single stage gearbox is used to to step up the rotational speed for the permanent magnet generator. The
current systems is rated at 1.0 MW @ 2.65 m/s. A full study is underway to evaluate the relative costs and benefits of transitioning to a direct drive system
with some of the world's leading developers of Direct Drive PMGs. Atlantis has already
commenced work on offering the AR drive train platform in 1.5 MW & 2.0 MW configurations which will be capable of being adjusted to rated
velocity or rotor diameter, depending on the bathymetry and flow velocity distribution profile at
each particular project site. The current AR1000 Mark 1 EMEC tubrine is a 1MW drive train rated at
2.65 m/s.
Dimensions
The optimal turbine rotor size is chiefly dependent on water depth and flow regime, and so is selected
according to the specific site conditions. The 1MW AR1000™ EMEC turbine has an 18m rotor diameter
and is typically positioned at least 5m above the seabed to avoid the slow moving boundary layer.
The EMEC AR1000 turbine has a total height of 23 meters once mounted on its gravity base structure.
Area of current flow used by the device (m2) Shroud inlet area for an enclosed tips turbine Swept area of the turbine blades for an unshrouded turbine Plan form area for a vertical axis turbine
As discussed, turbine diameter can be varied to suit site conditions. The AR1000™ has a swept area of
254m2.
Weight of super structure (ton)
Total Turbine System weight 1500T including Gravity Base and Ballast
Gravity Base structure - 180T Turbine Super structure - 80T
Weight of power take off equipment (ton) 40T
Min installation depth (m) 25
Max installation depth (m) 60
(This is a maximum submersion rather than a limiting total water depth)
Design lifetime (years) 20 Cut in speed (m/s) 0.65 Rated flow speed (m/s) 2.65

78
Rated power (kW) at rated flow speed 1000* (*1.5MW drive train system to ve available in 2013)
Maximum flow speed (m/s) Survival Condition - 4.3m/s peak tidal flow
combined with 10.2m Hmax wave (5.2m/s combined with 13.5 Hmax as of 2013)
Cut out speed (m/s) 3.4 (4.5 as of 2013) Current speed (m/s) vs electric power output (kWe) data points See below for AR1000™
Estimated date commercially available 2013-01 (9 month delivery time on long lead items)
Estimated production cost per rated unit (EUR) 3.40E+06
Have environmental impact studies been performed
Yes. No negative impact has been recorded on local flora and fauna for any ARC installation.
Technical publications
PCT/AU2004/001281, PCT/AU2008/001737, PCT/AU2010/000618, PCT/AU2009/000457, PCT/AU2009/000458, PCT/IB2010/001364, PCT/AU2010/001161,PCT/AU2010/001427, PCT/IB2010/001346,PCT/AU2010/001426,
PCT/AU2011/001009, 2011901759 Figures/photographs of device have been attached to reply
Yes (in addition - footage of onshore/offshore/sub-sea operations can be found at the Atlantis website)
Could the device be combined with a suspension bridge fjord crossing / how?
Atlantis technologies are designed for deployment flexibility, and can be matched to most installation
scenarios. Integrating the turbines with civil structures would require close collaboration with the
bridge design team to establish the most cost effective method of securing the turbine.
In the most simple scenario the turbine could be suspended from the bridge platform using a rigid
frame, such as that used in tow testing of the AS™ series turbines.
Advantages / disadvantages of combining the device with a suspension bridge fjord crossing
Raising and lowering of the frame would allow for easy access to the device for maintenance and the
bridge itself provides an ideal corridor for routing of power export cables. Vessel costs for both
installation and maintenance would be substantially reduced in comparison to a gravity base or piled
foundation. The sophisticated proprietary Atlantis control and power conditioning equipment could be
housed either on the bridge or onshore to reduce installed cost per MW, improve access and reduce
intervention (maintenance) costs as well as maximise overall yield through the reduction of
system losses.
If the turbine is not bottom mounted, then the depth of water is no longer a limiting factor for installation as the submersion depth can be optimised from the

79
surface.
Wave and current action on the device will create horizontal and vertical loads which would be
transmitted to the bridge structure. The horizontal loads are likely to prove the greater challenge for
bridge designers but could, if necessary, be reduced through ancillary structures.
Could the device be combined with a floating bridge fjord crossing / how?
Yes. As pontoon bridges are usually only practicable in relatively sheltered waters, the AS™
device is likely to offer a good solution in this instance. As it is fitted with bidirectional blades
there is no requirement for a yawing function, and this facilitates permanent integration into the bridge
structure.
Advantages / disadvantages of combining the device with a floating bridge fjord crossing
As with a suspension bridge, the pontoon bridge provides a platform for turbine access and cable
routing, again reducing installation and maintenance expenditure.
Depending on the requirement for the passage of marine traffic, the pontoon structures could be
designed to effectively channel flow through the inter-pontoon turbines, thus increasing energy
output.
As before, the effect of the turbines will be to increase the overall drag on the structure. The
design of the anchor layout can be adapted to ensure that this is adequately resisted.
Could the device be combined with a submerged floating tunnel fjord crossing / how?
Yes. As with the floating bridge, this is likely to be practicable only in a relatively benign flow regime,
and so a shrouded turbine, the AS™ series, is recommended to maximise energy output. This
could be affixed directly to the seabed as part of the anchoring system for the tunnel, or attached to the
tunnel itself, most probably beneath the tunnel. The optimal solution would depend on, among other
factors, the water depth.
Advantages / disadvantages of combining the device with a submerged floating tunnel fjord
As with the other options, the tunnel provides a useful passageway for cables, though it is likely that
these would run along the exterior walls as the watertight integrity of the tunnel itself will be
absolutely paramount. This means that access for maintenance is unlikely to be as substantially
enhanced as for the bridge structures.
The tunnel itself will present an obstruction to the flow which, if profiled appropriately, could increase
the flow directed through the turbines, thus increasing energy output.

80
However, if the turbines are attached solely to the tunnel they will again serve to create horizontal
loading which must be resisted by the anchor spread.
Current Speed (m/s) Electric Power Output (kWe)
0.65 15 0.7 19 0.8 28 0.9 40 1 55
1.1 73 1.2 95 1.3 120 1.4 150 1.5 185 1.6 224 1.7 269 1.8 319 1.9 376 2 438
2.1 507 2.2 583 2.3 666 2.4 757 2.5 856 2.6 963
2.65 1000 2.7 1000 2.8 1000 2.9 1000 3 1000
3.1 1000 3.2 1000 3.3 1000 3.4 1000
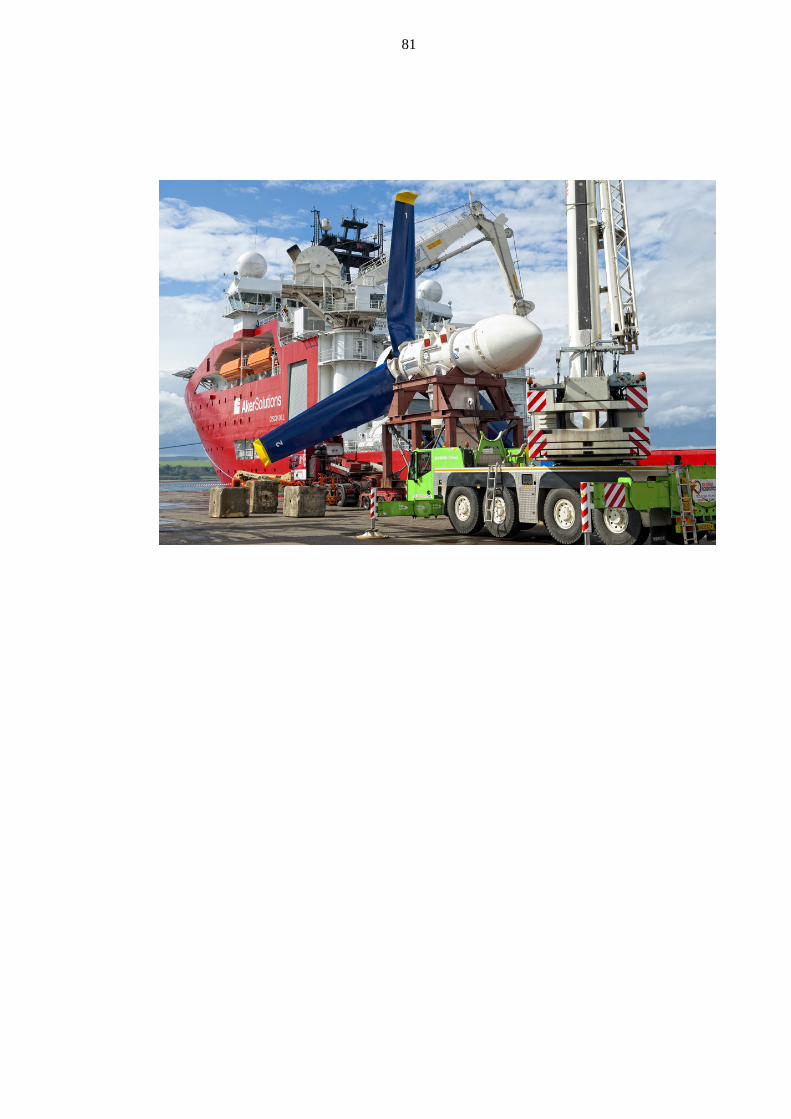
81

82
Note – The remainder of the details of the response from BioPower Systems Pty Ltd are not to be distributed to the general public.
Company BioPower Systems Pty Ltd Country Australia Web address www.biopowersystems.com
Technology Name bioSTREAM Device Type ** A) Horizontal Axis Turbine B) Cross-Axis Turbine C) Oscillating Hydrofoil D) Enclosed Tips (Venturi) E) Other Designs
C
Rated power (kW) at rated flow speed 250

83
Company Hales Energy Ltd Country UK Web address www.halesenergy.com
Technology Name HALES TIDAL STREAM TURBINE Device Type ** A) Horizontal Axis Turbine B) Cross-Axis Turbine C) Oscillating Hydrofoil D) Enclosed Tips (Venturi) E) Other Designs
(E) The Hales Turbine design is a Side Drive Turbine that can operate ducted or open stream. see
website www.halesenergy.com
Method to fix the device ** i) Seabed Mounted/Gravity Base ii) Pile Mounted iii) Floating (Flexible Mooring, Rigid Mooring, or Floating structure) iv) Hydrofoil Inducing Downforce
i) Gravity Base ii) Pile Mounted iii) Floating structure
Is power generated during ebb and flood flows YES
Features / Design principle
The patented Hales Turbine design is a vertical axis tidal stream or ROR water turbine that is
modelled on the primary principle of a standard water wheel but with special engineering adaptions
to allow full rotation under high torque loading while totally immersed.
Development status *** TRL 1-3, TRL 4, TRL 5/6, TRL 7/8 or TRL 9
TRH 5/6
Description of any and all prototypes (including test facility used or location of testing, dates, and hours of operation)
A 1metre capture area Hales Turbine prototype is at present under trial on the River Thames,
England, The test site has tidal flows on the Ebb up to 1.0 m/s. This prototype is housed in a venturi
form ducting with a mouth entry area of 3.2 metres. This prototype will form the basis for a modular for
of ducted Hales turbine that can be scaled up as requires and sited in many river or shallow tidal
locations.
Next development steps
Further test tank design work is programmed at UCL university , London by a Masters student,
sponsored by Hales Energy Ltd and also a programmed test tank biuld and test pregramme to
scale up the design for large MW sized units deployed by a gravity weighted system.
Power train type PM generator driven through Epicylic gearbox
Dimensions
Present test pontoon on River Thames is 7.5m x 4m and has an all up weight with ducting of approx 2.5 metric tonne. (the Hales Turbine prototype has an
approx weight of 54 Kg).

84
Area of current flow used by the device (m2) Shroud inlet area for an enclosed tips turbine Swept area of the turbine blades for an unshrouded turbine Plan form area for a vertical axis turbine
UNDER DEVLOPMENT
Weight of super structure (ton) UNDER DEVELOPMENT Weight of power take off equipment (ton) UNDER DEVELOPMENT
Min installation depth (m) UNDER DEVELOPMENT Max installation depth (m) UNDER DEVELOPMENT Design lifetime (years) 25 Cut in speed (m/s) 0.4 Rated flow speed (m/s) UNDER DEVELOPMENT Rated power (kW) at rated flow speed UNDER DEVELOPMENT
Maximum flow speed (m/s) Design will allow all water flow speeds to be farmed by simple blade changes
Current speed (m/s) vs electric power output (kWe) data points UNDER DEVELOPMENT
Estimated date commercially available 2013
Estimated production cost per rated unit (EUR) UNDER DEVELOPMENT
Have environmental impact studies been performed in process ( expect it to be zero)
Technical publications Nil Figures/photographs of device have been attached to reply attached to email
Could the device be combined with a suspension bridge fjord crossing / how?
Yes, A ducted version of the Hales Turbine is a modular unit which is avaiiable for various forms of fixing, only dependent on postion of PM generator which must remain above water and accessable.
Advantages / disadvantages of combining the device with a suspension bridge fjord crossing
No problems foreseen, more a case of designing deployment systems to take modular units.
Could the device be combined with a floating bridge fjord crossing / how? As above
Advantages / disadvantages of combining the device with a floating bridge fjord crossing
The Hales Turbine design is happy to work in turbulant and shallow water so most locations could
be used. Could the device be combined with a submerged floating tunnel fjord crossing / how?
See above
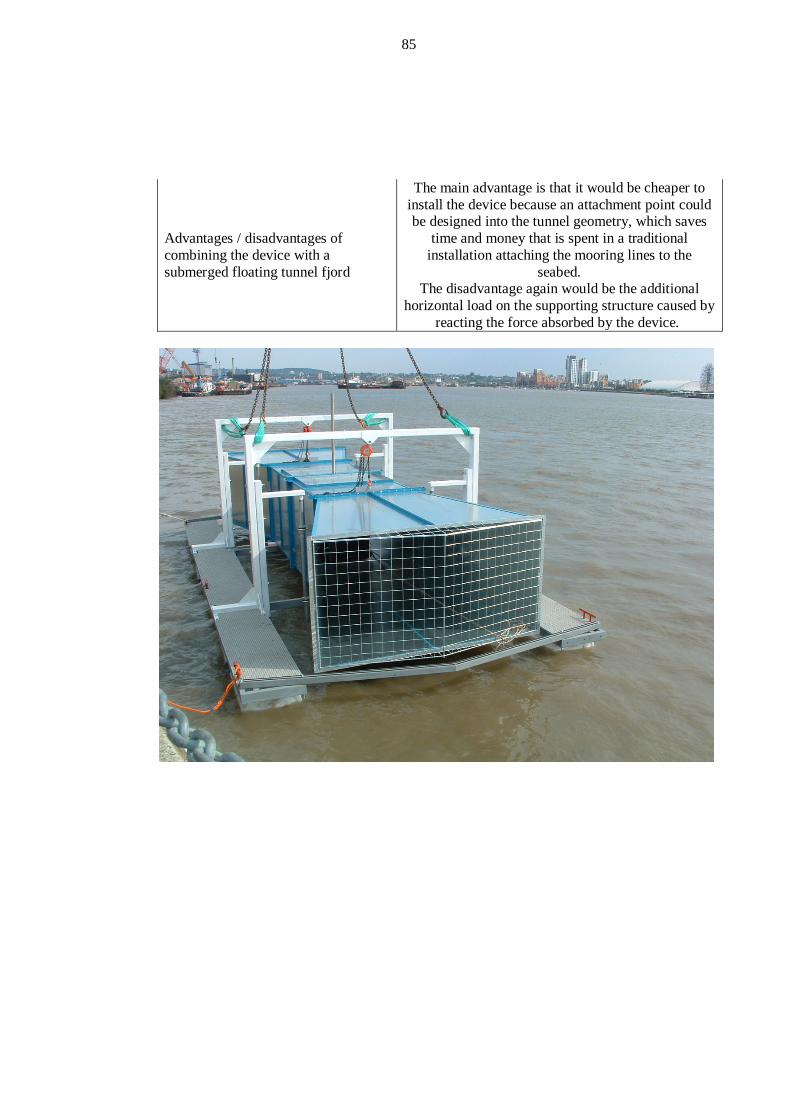
85
Advantages / disadvantages of combining the device with a submerged floating tunnel fjord
The main advantage is that it would be cheaper to install the device because an attachment point could be designed into the tunnel geometry, which saves
time and money that is spent in a traditional installation attaching the mooring lines to the
seabed. The disadvantage again would be the additional
horizontal load on the supporting structure caused by reacting the force absorbed by the device.

86
Company Hammerfest Strøm Country Norway Web address www.hammerfeststrom.com
Technology Name Device Type ** A) Horizontal Axis Turbine B) Cross-Axis Turbine C) Oscillating Hydrofoil D) Enclosed Tips (Venturi) E) Other Designs
A
Method to fix the device ** i) Seabed Mounted/Gravity Base ii) Pile Mounted iii) Floating (Flexible Mooring, Rigid Mooring, or Floating structure) iv) Hydrofoil Inducing Downforce
i)(Seabed Mounted/Gravity Base)
Is power generated during ebb and flood flows Yes
Features / Design principle Ref to attached technical description Development status *** TRL 1-3, TRL 4, TRL 5/6, TRL 7/8 or TRL 9
TRL 9
Description of any and all prototypes (including test facility used or location of testing, dates, and hours of operation)
Ref to attached technical description
Next development steps Ref to attached technical description Power train type Direct connected generator Dimensions Ref to attached technicla description Area of current flow used by the device (m2) Shroud inlet area for an enclosed tips turbine Swept area of the turbine blades for an unshrouded turbine Plan form area for a vertical axis turbine
To be kept from public acess
Weight of super structure (ton) Ref ta attached technical description Weight of power take off equipment (ton) Ref ta attached technical description
Min installation depth (m) 40 Max installation depth (m) 100 Design lifetime (years) 25 Cut in speed (m/s) HS300: 0,9 and HS1000: 1,1 Rated flow speed (m/s) HS300: 1,7 and HS1000: 2,7 Rated power (kW) at rated flow speed HS300: 300KW and HS1000: 1MW Maximum flow speed (m/s) To be kept from public acess

87
Current speed (m/s) vs electric power output (kWe) data points To be kept from public acess
Estimated date commercially available Per to-day
Estimated production cost per rated unit (EUR) To be kept from public acess
Have environmental impact studies been performed Yes, continuous
Technical publications None Figures/photographs of device have been attached to reply Ref to our webside
Could the device be combined with a suspension bridge fjord crossing / how?
Technical feasible, depending of the high from the bridge to the sea level.
Advantages / disadvantages of combining the device with a suspension bridge fjord crossing
Could the device be combined with a floating bridge fjord crossing / how? Technical feasible provided strong enough velocity
Advantages / disadvantages of combining the device with a floating bridge fjord crossing
Have not carried out any study of this solution, but avoiding of substrcture and subsea caples and
simple maintenance can be an advantages. Could the device be combined with a submerged floating tunnel fjord crossing / how?
Technical feasible
Advantages / disadvantages of combining the device with a submerged floating tunnel fjord
A sensible advantage/disadvantage is difficult to give because we haven't investigated this mentioned combinations, but technical feasible, depending on
the high from the bridge to the sea level.
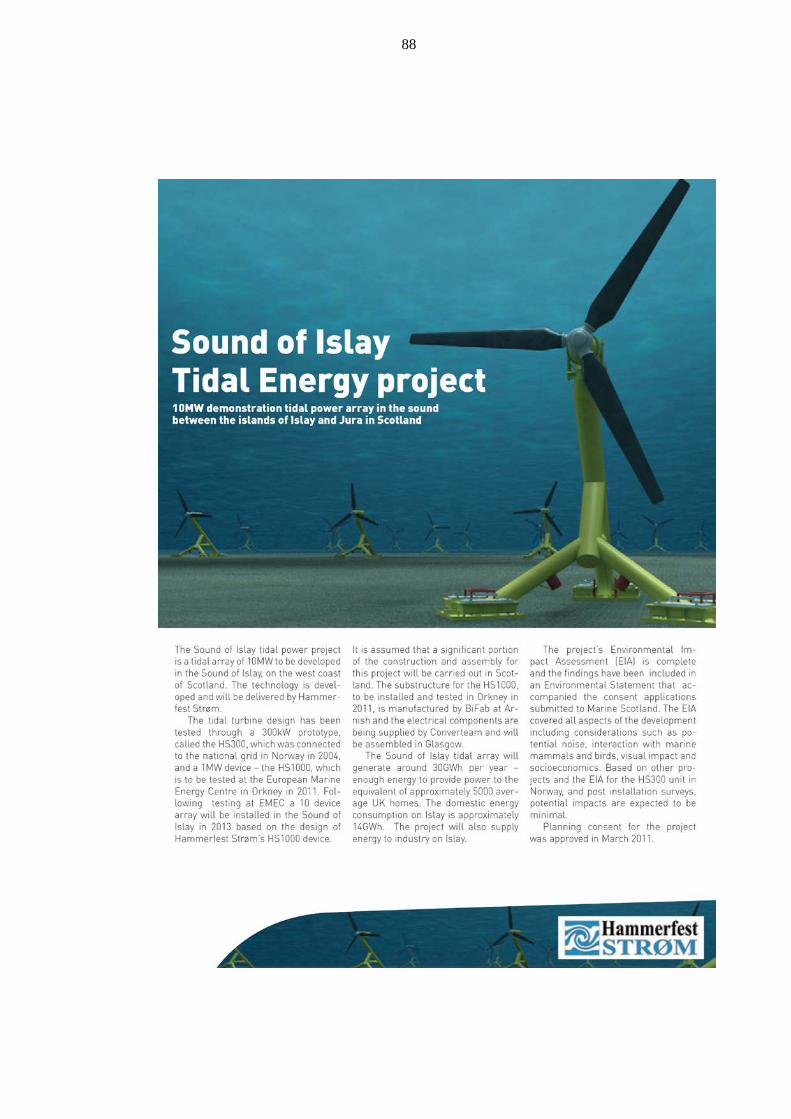
88

89

90

91
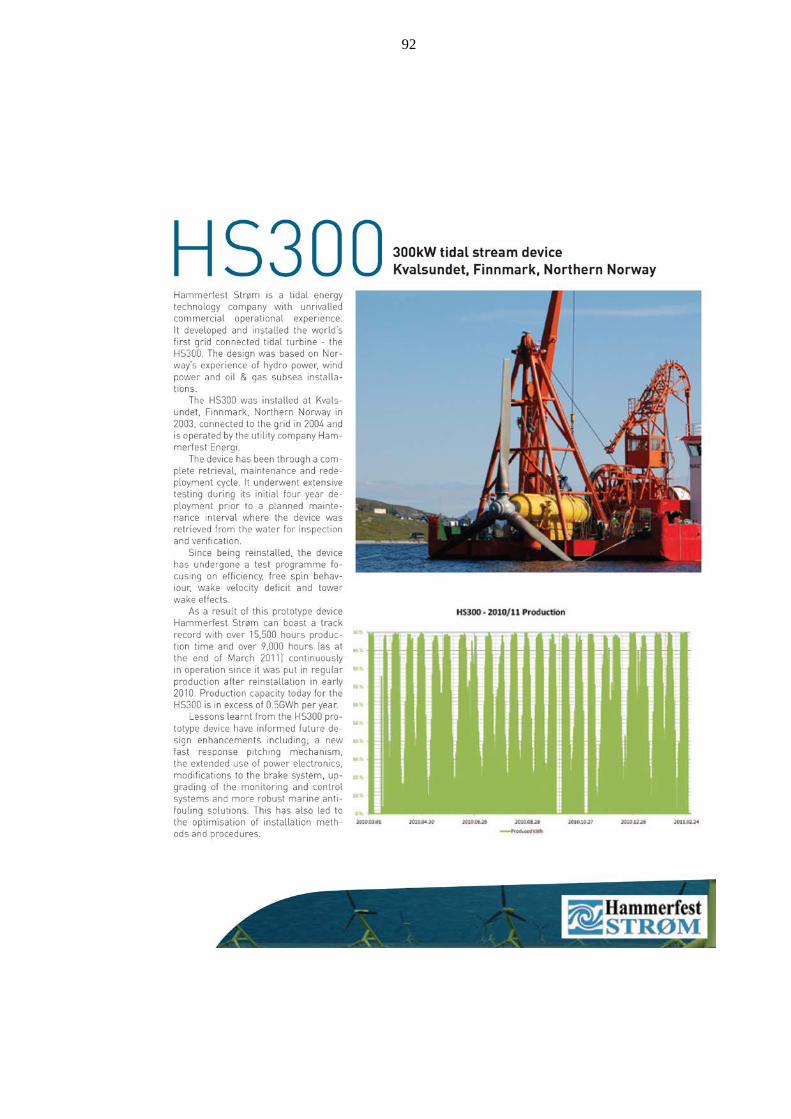
92
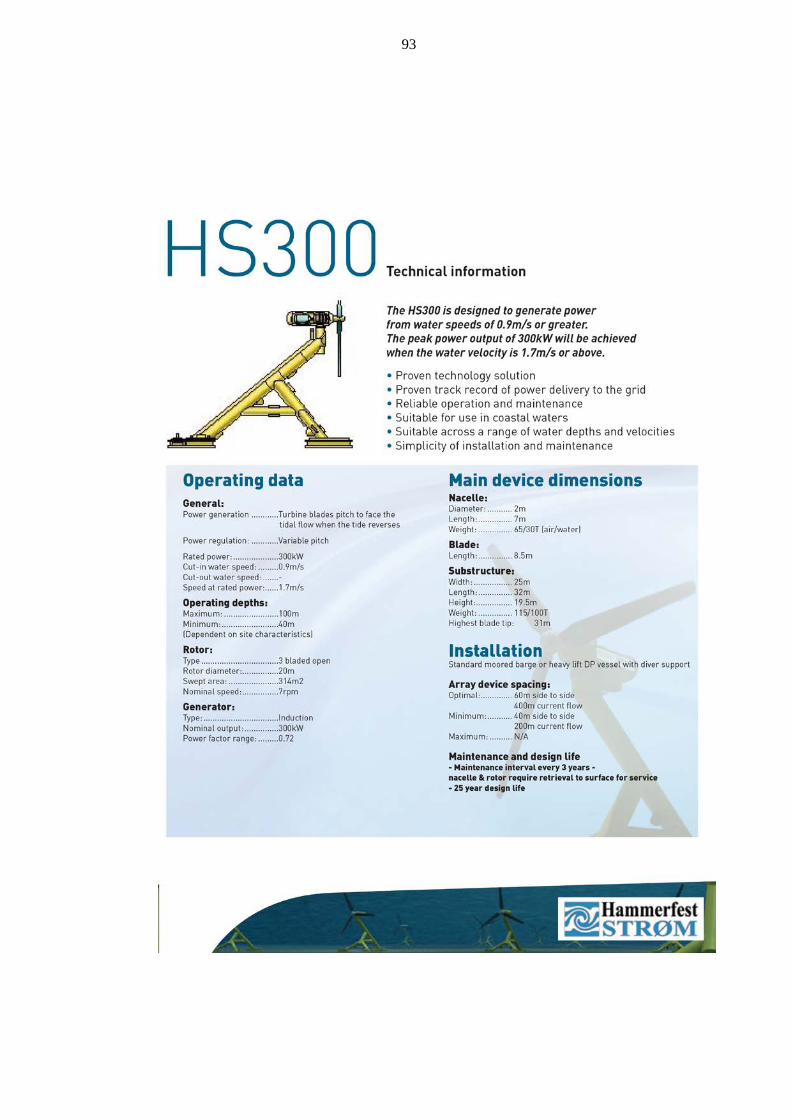
93

94
Company HPS AS Country Denmark Web address www.hps.as
Technology Name Tideng Device Type ** A) Horizontal Axis Turbine B) Cross-Axis Turbine C) Oscillating Hydrofoil D) Enclosed Tips (Venturi) E) Other Designs
B or E
Method to fix the device ** i) Seabed Mounted/Gravity Base ii) Pile Mounted iii) Floating (Flexible Mooring, Rigid Mooring, or Floating structure) iv) Hydrofoil Inducing Downforce
i)Gravity Base ii) Pile Mounted
Is power generated during ebb and flood flows Yes
Features / Design principle
Tideng is a tidal stream and river current energy converter.
It is composed by a cross-flow turbine with horizontal axis, supported by a base structure placed
on the bottom of the sea. The base, besides providing the necessary stability to the device,
enhances the incoming flow speed towards the rotor, which converts the kinetic energy of the flow into
electricity. The space is used in an optimal way, making the device a modular unit which can be deployed in
arrays or individually. The rotor is the innovative and novel aspect of the device. The blades are
connected at both ends to the fixed part of the hub by a joint which is moving along a path grooved in it. This path is designed so that, during the rotation, the blades are forced to move alternatively in and
out of the rotor. Tideng is a tidal stream and river current energy
converter. It is composed by a cross-flow turbine with
horizontal axis, supported by a base structure placed on the bottom of the sea. The base, besides
providing the necessary stability to the device, enhances the incoming flow speed towards the rotor,
which converts the kinetic energy of the flow into electricity.
The space is used in an optimal way, making the device a modular unit which can be deployed in
arrays or individually. The rotor is the innovative and novel aspect of the device. The blades are

95
connected at both ends to the fixed part of the hub by a joint which is moving along a path grooved in it. This path is designed so that, during the rotation, the blades are forced to move alternatively in and
out of the rotor. Tideng is a tidal stream and river current energy
converter. It is composed by a cross-flow turbine with
horizontal axis, supported by a base structure placed on the bottom of the sea. The base, besides
providing the necessary stability to the device, enhances the incoming flow speed towards the rotor,
which converts the kinetic energy of the flow into electricity.
The space is used in an optimal way, making the device a modular unit which can be deployed in
arrays or individually. The rotor is the innovative and novel aspect of the device. The blades are
connected at both ends to the fixed part of the hub by a joint which is moving along a path grooved in it. This path is designed so that, during the rotation, the blades are forced to move alternatively in and
out of the rotor. Development status *** TRL 1-3, TRL 4, TRL 5/6, TRL 7/8 or TRL 9
Description of any and all prototypes (including test facility used or location of testing, dates, and hours of operation)
Model of device in scale 1:20 has been tested at SINTEF 2007. CDF modeling has been performed
by Aalborg University 2010.
Next development steps Awaiting investors to implement full scale test of 100 kW device.
Power train type Either direct drive or with gearbox. Dimensions Various depending on size of generator up to 3 MW. Area of current flow used by the device (m2) Shroud inlet area for an enclosed tips turbine Swept area of the turbine blades for an unshrouded turbine Plan form area for a vertical axis turbine
396 sqm. The Tideng machine can be deployed in different scale. The 1 MW device can have a base 11 meter high including 3 meter rotor blades; Blades 6 meter in diameter and width 32 meter; this giver at a
peak velocity of the stream of 4 m/sec a 1MW device with a yearly production of 8.15 GWh
Weight of super structure (ton) TBD Weight of power take off equipment (ton) TBD
Min installation depth (m) Is depending on size but absolutely min is double the depth of device, in the example above 22 meter
Max installation depth (m) no max Design lifetime (years) 50 years

96
Cut in speed (m/s) NA, but very low Rated flow speed (m/s) 4m/sec in a tidal cycle Rated power (kW) at rated flow speed 1MW / 8.15 GWh Maximum flow speed (m/s) NA Current speed (m/s) vs electric power output (kWe) data points NA
Estimated date commercially available 2013
Estimated production cost per rated unit (EUR) 0.09 €/kWh
Have environmental impact studies been performed Yes
Technical publications
Power Production and Economical Feasbility of Tideng Tidal Stream Power Converter; DCE
Technical report no. 81 Aalborg University by S. Parmeggiani, P. Frigaard, et. al.
Figures/photographs of device have been attached to reply yes
Could the device be combined with a suspension bridge fjord crossing / how?
any place upstream
Advantages / disadvantages of combining the device with a suspension bridge fjord crossing
Could be part of release system for pillows and cable land fall could be much easier
Could the device be combined with a floating bridge fjord crossing / how? Advantages / disadvantages of combining the device with a floating bridge fjord crossing
Mooring block of the Tideng could be integrated in the mooring of the floating bridge
Could the device be combined with a submerged floating tunnel fjord crossing / how?
Yes could be mounted on top of the tunnel
Advantages / disadvantages of combining the device with a submerged floating tunnel fjord
Mooring block of the Tideng could be integrated in the mooring of the floating bridge; cable land fall
could be easier

97

98
Company Hydro-Gen Country France Web address http://www.hydro-gen.fr
Technology Name Hydro-Gen technology Device Type ** A) Horizontal Axis Turbine B) Cross-Axis Turbine C) Oscillating Hydrofoil D) Enclosed Tips (Venturi) E) Other Designs A) Method to fix the device ** i) Seabed Mounted/Gravity Base ii) Pile Mounted iii) Floating (Flexible Mooring, Rigid Mooring, or Floating structure) iv) Hydrofoil Inducing Downforce iii) (Flexible mooring) Is power generated during ebb and flood flows Yes
Features / Design principle
A floating catamaran barge supporting one or two rotating turbines, so that it can be put easily outside
the water for maintenance, cleaning, check, evolution, neutralisation, etc
Development status *** TRL 1-3, TRL 4, TRL 5/6, TRL 7/8 or TRL 9 TRL7/8 but limited to 20 kw power Description of any and all prototypes (including test facility used or location of testing, dates, and hours of operation)
Several floating turbines prototypes (20 kw) have been tested at sea since 5 years, including paddel
wheeels, sliding turbine, etc. Tests are conducted by campaigns of few days or one week.
Next development steps To have a fully operationnal current turbine in an
emerging country (Congo, or Madagascar, or French Guyana)
Power train type Direct drive generator Dimensions on demand and adapted to each situation and site. Area of current flow used by the device (m2) Shroud inlet area for an enclosed tips turbine Swept area of the turbine blades for an unshrouded turbine Plan form area for a vertical axis turbine 10 Weight of super structure (ton) 0.6 (600 kg) for a 20 kw turbine Weight of power take off equipment (ton) it depends Min installation depth (m) 4
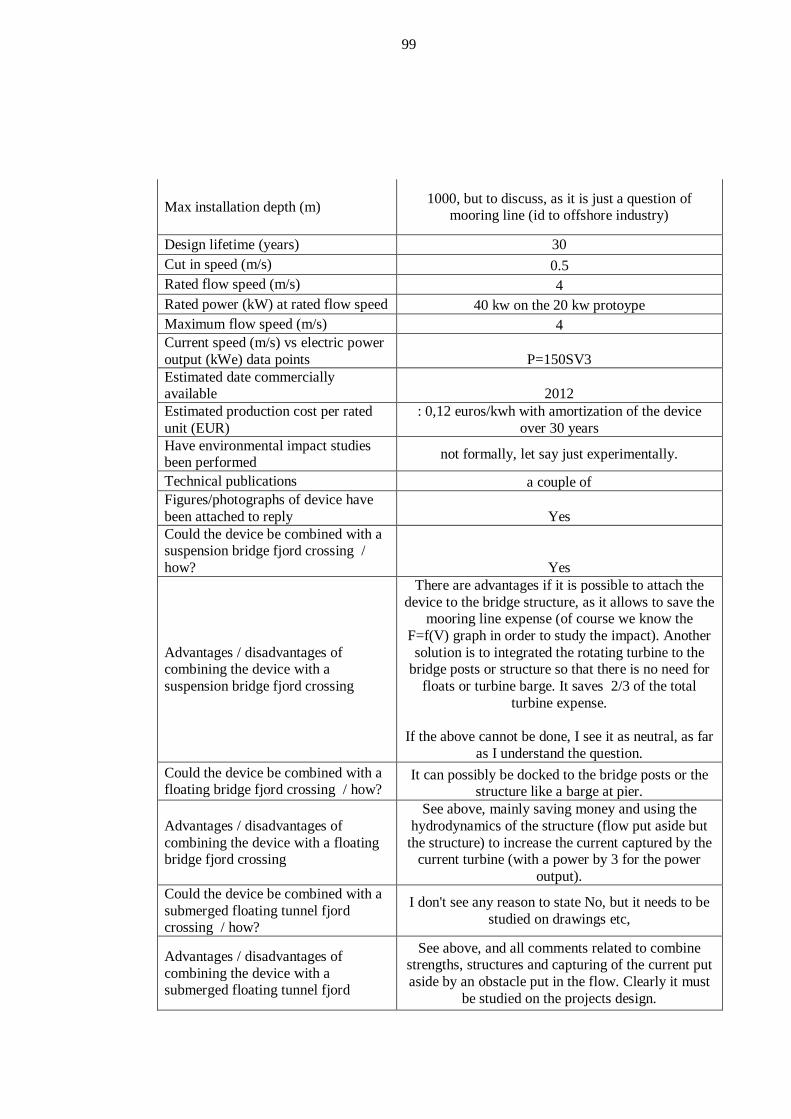
99
Max installation depth (m) 1000, but to discuss, as it is just a question of mooring line (id to offshore industry)
Design lifetime (years) 30 Cut in speed (m/s) 0.5 Rated flow speed (m/s) 4 Rated power (kW) at rated flow speed 40 kw on the 20 kw protoype Maximum flow speed (m/s) 4 Current speed (m/s) vs electric power output (kWe) data points P=150SV3 Estimated date commercially available 2012 Estimated production cost per rated unit (EUR)
: 0,12 euros/kwh with amortization of the device over 30 years
Have environmental impact studies been performed not formally, let say just experimentally.
Technical publications a couple of Figures/photographs of device have been attached to reply Yes Could the device be combined with a suspension bridge fjord crossing / how? Yes
Advantages / disadvantages of combining the device with a suspension bridge fjord crossing
There are advantages if it is possible to attach the device to the bridge structure, as it allows to save the
mooring line expense (of course we know the F=f(V) graph in order to study the impact). Another solution is to integrated the rotating turbine to the
bridge posts or structure so that there is no need for floats or turbine barge. It saves 2/3 of the total
turbine expense.
If the above cannot be done, I see it as neutral, as far as I understand the question.
Could the device be combined with a floating bridge fjord crossing / how?
It can possibly be docked to the bridge posts or the structure like a barge at pier.
Advantages / disadvantages of combining the device with a floating bridge fjord crossing
See above, mainly saving money and using the hydrodynamics of the structure (flow put aside but
the structure) to increase the current captured by the current turbine (with a power by 3 for the power
output). Could the device be combined with a submerged floating tunnel fjord crossing / how?
I don't see any reason to state No, but it needs to be studied on drawings etc,
Advantages / disadvantages of combining the device with a submerged floating tunnel fjord
See above, and all comments related to combine strengths, structures and capturing of the current put aside by an obstacle put in the flow. Clearly it must
be studied on the projects design.

100

101
Company Kepler Energy Ltd Country UK Web address www.keplerenergy.co.uk
Technology Name THAWT Device Type ** A) Horizontal Axis Turbine B) Cross-Axis Turbine C) Oscillating Hydrofoil D) Enclosed Tips (Venturi) E) Other Designs
Transverse Horizontal Axis
Method to fix the device ** i) Seabed Mounted/Gravity Base ii) Pile Mounted iii) Floating (Flexible Mooring, Rigid Mooring, or Floating structure) iv) Hydrofoil Inducing Downforce
I or ii
Is power generated during ebb and flood flows yes
Features / Design principle See website Development status *** TRL 1-3, TRL 4, TRL 5/6, TRL 7/8 or TRL 9
Moving to 5
Description of any and all prototypes (including test facility used or location of testing, dates, and hours of operation)
A 1:10 scale proof-of-concept model was tested at Newcastle flume in 2011
Next development steps Build, install and operate a full size protype Power train type May be direct drive
Dimensions Can be manufactured in a variety of diameters up to
about 10m. Length would then be 60m, and each unit will have two rotors (to one generator).
Area of current flow used by the device (m2) Shroud inlet area for an enclosed tips turbine Swept area of the turbine blades for an unshrouded turbine Plan form area for a vertical axis turbine
2X600m for a 10m diameter rotor machine
Weight of super structure (ton) tbd Weight of power take off equipment (ton) tbd
Min installation depth (m) in theory, very low limit
Max installation depth (m) Up to about 20-30m. Blockage ratio needs to be about 0.5 to 0.6 which then determines the depths.
Design lifetime (years) 20 Cut in speed (m/s) ? Rated flow speed (m/s) 2m/sec

102
Rated power (kW) at rated flow speed 4600 for 10m diameter machine at 2 m/sec. (This is not a prcatical joke!)
Maximum flow speed (m/s) Currently about 2.5m/sec Current speed (m/s) vs electric power output (kWe) data points n/a publicly
Estimated date commercially available 2014
Estimated production cost per rated unit (EUR) Very competitive!
Have environmental impact studies been performed No
Technical publications See below Figures/photographs of device have been attached to reply No but see publications
Could the device be combined with a suspension bridge fjord crossing / how?
Yes
Advantages / disadvantages of combining the device with a suspension bridge fjord crossing
Need to be aware of blockage effect
Could the device be combined with a floating bridge fjord crossing / how? Too early to tell
Advantages / disadvantages of combining the device with a floating bridge fjord crossing
Too early to tell
Could the device be combined with a submerged floating tunnel fjord crossing / how?
Too early to tell
Advantages / disadvantages of combining the device with a submerged floating tunnel fjord
Too early to tell

103
Source – www.keplerenergy.co.uk
McAdam, R.A., Houlsby, G.T., Oldfield, M.L.G., 2011, “Structural and Hydrodynamic Model Testing of the Transverse Horizontal Axis Water Turbine”, Proceedings of the 9th European Wave and Tidal Energy Conference, University of Southampton, 5-9 September 2011.
Draper, S., Houlsby, G.T., Oldfield, M.L.G. and Borthwick, A.G.L., 2010, “Modeling Tidal Energy Extraction in a Depth Averaged Domain”, IET Renew. Power Gener., 2010, Vol. 4, Iss. 6, pp. 545–554. doi: 10.1049/iet-rpg.2009.0196 (Also in Proceedings of the 8th European Wave and Tidal Energy Conference, Uppsala, Sweden, 7-10 September 2009).
McAdam, R.A., Houlsby, G.T., Oldfield, M.L.G. and McCulloch, M.D., 2010, “Experimental Testing of the Transverse Horizontal Axis Water Turbine”, IET Renew. Power Gener., 2010, Vol. 4, Iss. 6, pp. 545–554. doi: 10.1049/iet-rpg.2009.0196 (also in Proceedings of the 8th European Wave and Tidal Energy Conference, Uppsala, Sweden, 7-10 September 2009).
Rawlinson-Smith, R., Bryden, I., Folley, M., Martin, V., Stallard, T., Stock-Williams, C. and Willden, R.,2010, “The PerAWaT project: Performance Assessment of Wave and Tidal Array Systems”. In Proc. 3rd International Conference on Ocean Energy (ICOE), Bilbao, Spain.
Consul, C.A. & Willden, R.H.J. 2010,.”Influence of Flow Confinement of the Performance of a Cross-Flow Turbine”. In Proc. 3rd International Conference on Ocean Energy (ICOE), Bilbao, Spain.
Belloni, C. & Willden, R.H.J. , 2010. “A computational study of a bi-directional ducted tidal turbine”. In Proc. 3rd International Conference on Ocean Energy (ICOE), Bilbao, Spain.
Consul, C.A., Willden, R.H.J., Ferrer, E. & McCulloch, M.D. , 2009,. “Influence of Solidity on the Performance of a Cross-Flow Turbine”. In Proc. 8th European Wave and Tidal Energy Conference, Uppsala, Sweden.
Houlsby, G.T., Draper, S. and Oldfield, M.L.G., 2008, “Application of Linear Momentum Actuator Disc Theory to Open Channel Flow” Oxford University Dept. Engineering Science Report No. OUEL 2296/08
Houlsby, G.T., Oldfield, M.L.G. and McCulloch, M.D., 2008, “Water Turbine”, British Patent WO/2008/145991 “Water Turbine” filed on 30 May 2007 and published on 04.12.2008.

104
Company Nautricity Limited Country United Kingdom Web address http://www.nautricity.com
Technology Name CoRMaT Device Type ** A) Horizontal Axis Turbine B) Cross-Axis Turbine C) Oscillating Hydrofoil D) Enclosed Tips (Venturi) E) Other Designs
A
Method to fix the device ** i) Seabed Mounted/Gravity Base ii) Pile Mounted iii) Floating (Flexible Mooring, Rigid Mooring, or Floating structure) iv) Hydrofoil Inducing Downforce
III
Is power generated during ebb and flood flows Yes
Features / Design principle
The CoRMaT next generation tidal turbine uses two contra-rotating rotors to directly drive a flooded contra-rotating permanent magnet generator. It’s
neutral buoyancy enables it to be mounted mid water column in the highest flow velocities with minimum
wave interference. Using a flexible tensioned mooring for station keeping enables the device to be
deployed in any depth of water, up to typically 500m.
Development status *** TRL 1-3, TRL 4, TRL 5/6, TRL 7/8 or TRL 9
TRL 7/8
Description of any and all prototypes (including test facility used or location of testing, dates, and hours of operation)
A 1:15 scale proof of concept device was tested in the University of Strathclyde’s large tow tank, UK
2005. A 1:7 Scale device was tested in the River Clyde
estuary, UK 2007. A prototype system was tested and generated
electricity in the Sound of Islay of the West Coast of Scotland, UK 2008.
A full scale device is currently in build and due for deployment in the UK late summer 2012.
Next development steps Development of a 3 MW commercial array to be
deployed on sea bed we have secured at the Mull of Kintyre, in the summer of 2014.
Power train type Direct Drive contra-rotating PMG
Dimensions Each of the turbine’s rotors have a 14m diameter and is rated at 500 kW in flow velocities of 2.5 m/s

105
Area of current flow used by the device (m2) Shroud inlet area for an enclosed tips turbine Swept area of the turbine blades for an unshrouded turbine Plan form area for a vertical axis turbine
154
Weight of super structure (ton) 15 Weight of power take off equipment (ton) 30
Min installation depth (m) 30 Max installation depth (m) 500 Design lifetime (years) 20 Cut in speed (m/s) 1 Rated flow speed (m/s) 2.5 Rated power (kW) at rated flow speed 500 Maximum flow speed (m/s) 3.5 Current speed (m/s) vs electric power output (kWe) data points See below
Estimated date commercially available 2013-04
Estimated production cost per rated unit (EUR) Unit size and volume dependent
Have environmental impact studies been performed Yes
Technical publications
Many technical publications have been produced, a couple of these include:
- J A Clarke, G Connor, A D Grant, C M Johnstone and S Ordonez-Sanchez 'Analysis of a Single Point
Tensioned Mooring System for Station Keeping of a Contra-rotating Marine Current Turbine' Journal of Renewable Power Generation, IET, UK, December
2010. - J A Clarke, G Connor, A D Grant, C M Johnstone
and S Ordonez-Sanchez ‘Contrarotating Marine Turbines: Single Point Tethered Floating System – Stability and Performance’ Proceedings of the 8th
European Wave and Tidal Energy Conference, Uppsala, Sweden, September 2009
Figures/photographs of device have been attached to reply Yes
Could the device be combined with a suspension bridge fjord crossing / how?
Yes, from cables between the supports.

106
Advantages / disadvantages of combining the device with a suspension bridge fjord crossing
Attaching the mooring lines to an overhanging bridge would allow the attachment points to be
designed into the bridge structure, which saves time and money that is spent in a traditional installation
attaching the mooring lines to the seabed.
One disadvantage is the additional horizontal thrust load on the bridge structure from reacting the force
absorbed by the device.
Could the device be combined with a floating bridge fjord crossing / how?
Yes, mooring lines could be attached between the pontoons or to the overhanging bridge assuming that
there is enough clearance to turn around when the tides change direction.
Advantages / disadvantages of combining the device with a floating bridge fjord crossing
Yes, mooring lines could be attached between the pontoons so long as there is sufficient clearance
between the pontoons.
The effects of the pontoons on the flow characteristics around the device would have to be evaluated. These could have a positive effect by
focusing and accelerating the flow, thus improving power capture.
A disadvantage would again be the additional
horizontal load on the supporting structure from the thrust load on the device.
Could the device be combined with a submerged floating tunnel fjord crossing / how?
Most definitely. Irrespective of depth, The mooring system would be secured to the tunnel in the same
way as attaching the mooring line to the ocean floor
Advantages / disadvantages of combining the device with a submerged floating tunnel fjord
The big advantage is that it would be cheaper to install the device because an attachment point could be designed into the tunnel geometry, which saves
time and money that is spent in a traditional installation attaching the mooring lines to the
seabed.
The disadvantage again would be the additional horizontal load on the supporting structure from the
thrust load on the turbine.
Current Speed (m/s) Electrical Power Output (kWe)
0.7 - 0.8 - 0.9 - 1 32
1.1

107
1.2 1.3 1.4 1.5 106 1.6 1.7 1.8 1.9 2 252
2.1 2.2 2.3 2.4 2.5 500 2.6 2.7 2.8 2.9 3 600
3.1 3.2 3.3 3.4 3.5 600
Source - http://www.nautricity.com

108
Company Neptune REnewable Energy Ltd Country UK Web address www.neptunerenewableenergy.com
Technology Name Device Type ** A) Horizontal Axis Turbine B) Cross-Axis Turbine C) Oscillating Hydrofoil D) Enclosed Tips (Venturi) E) Other Designs
B
Method to fix the device ** i) Seabed Mounted/Gravity Base ii) Pile Mounted iii) Floating (Flexible Mooring, Rigid Mooring, or Floating structure) iv) Hydrofoil Inducing Downforce
iii
Is power generated during ebb and flood flows Yes
Features / Design principle
Each NP1200 has a three blades cross flow vertical axis rotor 10 D x 7.2m H driving gearbox and
400kW AC generator on a floating pontoon structure designed for estuarine sites
Development status *** TRL 1-3, TRL 4, TRL 5/6, TRL 7/8 or TRL 9
TRL 7/8
Description of any and all prototypes (including test facility used or location of testing, dates, and hours of operation)
Full scale prototype deployed on the North Bank of the Humber Estuary and grid connected
Next development steps Production Power train type gearbox and generator
Dimensions pontoon 11m x 11m turbine 10m (diam) x 7.2m (H)
Area of current flow used by the device (m2) Shroud inlet area for an enclosed tips turbine Swept area of the turbine blades for an unshrouded turbine Plan form area for a vertical axis turbine
72/device 360 / 2MW pod of 5
Weight of super structure (ton) 40T Weight of power take off equipment (ton) 12T
Min installation depth (m) none Max installation depth (m) none Design lifetime (years) 20 Cut in speed (m/s) 0.5 m/s

109
Rated flow speed (m/s) 5 m/s Rated power (kW) at rated flow speed 400 kW Maximum flow speed (m/s) tops out at 5 m/s Current speed (m/s) vs electric power output (kWe) data points Richards curve, asympotopic at 400kW at 5 m/s
Estimated date commercially available 2012
Estimated production cost per rated unit (EUR) commercial in confidence
Have environmental impact studies been performed yes and approved
Technical publications Hardisty J (The University of Hull). The tidal stream power curve: A case study. A paper for Energy and
Power Engineering v06 Figures/photographs of device have been attached to reply see web site
Could the device be combined with a suspension bridge fjord crossing / how?
yes, moored between piles etc
Advantages / disadvantages of combining the device with a suspension bridge fjord crossing
Could the device be combined with a floating bridge fjord crossing / how?
Advantages / disadvantages of combining the device with a floating bridge fjord crossing
Could the device be combined with a submerged floating tunnel fjord crossing / how?
Advantages / disadvantages of combining the device with a submerged floating tunnel fjord
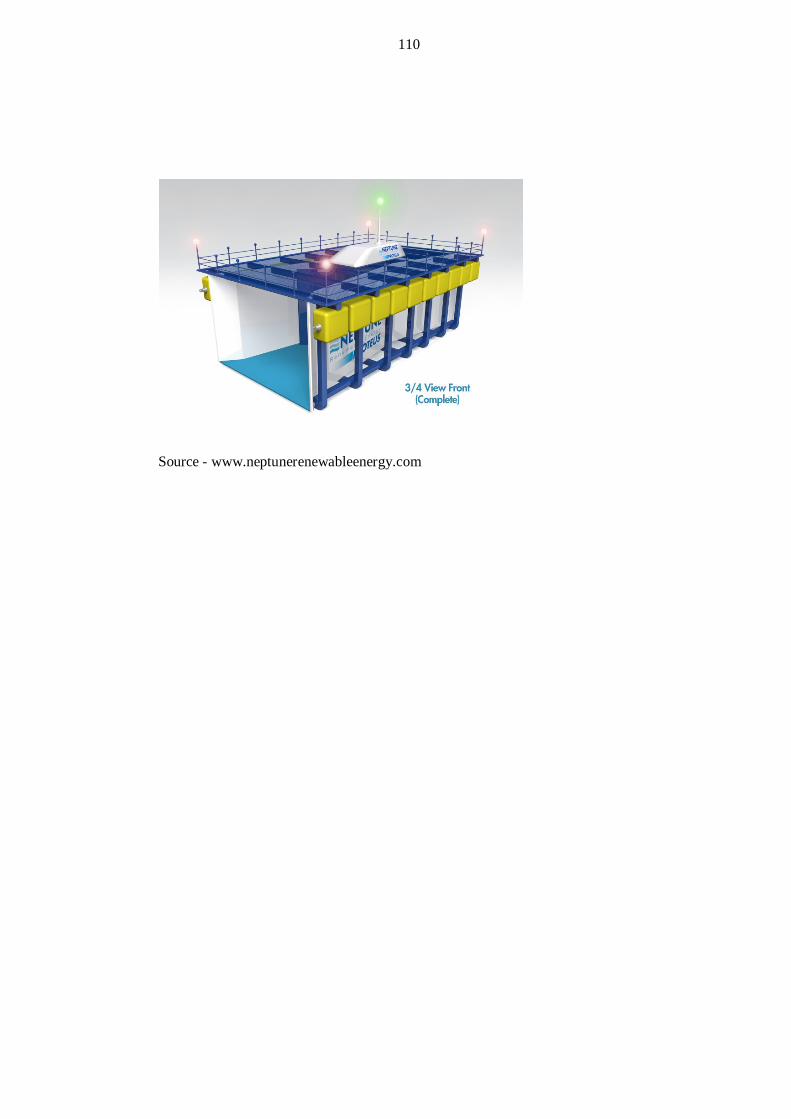
110
Source - www.neptunerenewableenergy.com

111
Company Norwegian Ocean Power AS Country Norway Web address norwegianoceanpower.com Technology Name Pulsus turbine Device Type ** A) Horizontal Axis Turbine B) Cross-Axis Turbine C) Oscillating Hydrofoil D) Enclosed Tips (Venturi) E) Other Designs
E) Darieus turbine vertical axis
Method to fix the device ** i) Seabed Mounted/Gravity Base ii) Pile Mounted iii) Floating (Flexible Mooring, Rigid Mooring, or Floating structure) iv) Hydrofoil Inducing Downforce
i) Seabed Mounted/Gravity Base (ii) pile mounted is fully conceivable)
Is power generated during ebb and flood flows Yes
Features / Design principle
The Pulsus turbine is a very rugged design, it is designed for produsing power at lower flow speeds and it only has one moving part. The pulsus turbine is designed from a financial viability standpoint and has long maintenance & free operating intervalls -
typical 10 years between service Development status *** TRL 1-3, TRL 4, TRL 5/6, TRL 7/8 or TRL 9
TRL 6
Description of any and all prototypes (including test facility used or location of testing, dates, and hours of operation)
The turbine has been in development for almost 10 years and we have carried out exstensive simulation
and modeling,
Next development steps
currently we are building a 1:8 scale turbine for dynamic load testing that we will conduct this
summer. A pilot powerplant with gridd connection is the next step after this summers test
Power train type Direct drive generator
Dimensions The turbines blades covers a sylindrical area, the
cylinder diameter and hight varies after the intended maksimum power produktion at peek flow
Area of current flow used by the device (m2) Shroud inlet area for an enclosed tips turbine Swept area of the turbine blades for an unshrouded turbine Plan form area for a vertical axis turbine
Cross section area varies with powerplant size (600KW) 160 m2 (2,5MW) of 500m2
Weight of super structure (ton) 10-30 ton Weight of power take off equipment 15-50 ton

112
(ton) Min installation depth (m) 17 - 34 meter Max installation depth (m) any dept if flow conditions are favorable Design lifetime (years) 30 Cut in speed (m/s) 0.5 Rated flow speed (m/s) 2.6 Rated power (kW) at rated flow speed 600-2500 Maximum flow speed (m/s) 3.6 Current speed (m/s) vs electric power output (kWe) data points
Estimated date commercially available 2014-05
Estimated production cost per rated unit (EUR)
Have environmental impact studies been performed NO
Technical publications STUDY OF NORWEGIAN OCEAN POWER
VERTICAL AXIS HELICAL BLADES HYDRO TURBINE Dr. Ion Paraschivoiu
IOPARA Inc. Figures/photographs of device have been attached to reply full scale
Could the device be combined with a suspension bridge fjord crossing / how?
yes it could be suspended from the bridge
Advantages / disadvantages of combining the device with a suspension bridge fjord crossing
Suspending the turbine from the bridge would replace the normal seabed floor mooring. The
turbine flow direction is omnidirectional. Simply suspending it into the water would be sufficient for operations. The mooring could be surface based,
seafloore based or sideways. The turbine spins in the same direction regardless of flow direction and is
very tolerant of turbulence. Could the device be combined with a floating bridge fjord crossing / how? Same as above
Advantages / disadvantages of combining the device with a floating bridge fjord crossing
Same as above
Could the device be combined with a submerged floating tunnel fjord crossing / how?
Yes - the total available water depth only needs to be large enough to accomodate the turbine. (larger than
turbine height)
Advantages / disadvantages of combining the device with a submerged floating tunnel fjord
An advantage is that devices positioned deeper will have positive effects on costs, since the
environmental conditions are much more reliable. A disavantage is that current is often stronger at the
surface.

113

114
Company Oceanflow Energy Limited Country UK Web address www.OceanflowEnergy.com
Technology Name Evopod Device Type ** A) Horizontal Axis Turbine B) Cross-Axis Turbine C) Oscillating Hydrofoil D) Enclosed Tips (Venturi) E) Other Designs
A
Method to fix the device ** i) Seabed Mounted/Gravity Base ii) Pile Mounted iii) Floating (Flexible Mooring, Rigid Mooring, or Floating structure) iv) Hydrofoil Inducing Downforce
iii) Floating with flexible mooring (catenary or tension tether)
Is power generated during ebb and flood flows Yes
Features / Design principle
Evopod consists of a patented low-motion semi-submerged floating platform which is modular in
that it can be adapted to support multiple unshrouded turbine nacelles.
The platform geometry that supports mono or twin turbines is tethered by a four point spread mooring.
Each fixed pitch turbine is coupled through a step-up epicyclic gearbox to a variable speed induction or
PM generator controlled by an inverter drive system to smooth the output power. The four line catenary mooring system allows the device to swing around with the tidal stream such that it is always facing into the flow. The mooring swivel incorporates a slipring for power export. The mooring lines are
fixed to the seabed by pin pile or gravity anchors. This Evopod solution has been developed for open
sea conditions where the flood and ebb tidal streams are not perfectly in parallel.
Oceanflow’s multi-turbine support platform for
more sheltered estuarine conditions adopts the same semi-submerged platform design principles as
Evopod but is moored fore and aft as the current direction reversals are constrained to 180 degrees by the geometry of the estuary or channel. The power
train is the same as for Evopod only a full reversing pitch turbine is incorporated as the platform is
moored on a fixed heading. The platform layout allows for access and removal of individual turbines for maintenance. The platform is moored fore and
aft to the seabed by multi-line mooring system.

115
Either catenary or tension tether mooring solutions can be employed. Tension tethers have the
advantage of constraining platform motions but require larger capacity pile anchors to resist uplift
forces. Development status *** TRL 1-3, TRL 4, TRL 5/6, TRL 7/8 or TRL 9
Turbine generator system: TRL 7 Evopod mono-turbine support platform: TRL 7
Multi-turbine support platform: TRL 3
Description of any and all prototypes (including test facility used or location of testing, dates, and hours of operation)
1:40 scale models of the mono and twin turbine units have undergone performance, mooring and
survivability tests at Newcastle and Strathclyde Universities flume and wave tanks between 2006
and 2009.
A 1:10 scale fully functional device, including the full mooring system, has been in field testing in the tidal flows of Strangford Narrows, Northern Island, since 2008. The device is now grid-connected. The
unit has also been used by Queen’s University Belfast and Edinburgh University for turbine wake
field analysis trials since 2009.
Next development steps
A 1:4 scale device is under construction for deployment in 2012 in Sanda Sound, South Kintyre, Scotland including grid connection. This unit has a rated output of 35kW and is termed our E35 unit. This is an open-ocean site, so the full effects of
waves and storms will form part of the device testing phase.
A full scale 1MW turbine is also being designed for deployment in a scaled up Evopod platform. This
unit is expected to be under test at a site in Scottish waters by 2014.
Power train type Turbine is coupled through a step-up epicyclic gearbox to a variable speed induction or PM
generator controlled by an inverter drive.
Dimensions
Evopod E35, the 1:4 scale prototype, has a single nacelle and a turbine of 4.5m diameter. Its linear dimensions are length: 13m, beam: 4.5m, height: 8m, displacement: 13 tonnes. The 4-point spread mooring has anchor points on the seabed at each corner of an approximate 300m x 50m rectangle
Area of current flow used by the device (m2) Shroud inlet area for an enclosed tips turbine Swept area of the turbine blades for an unshrouded turbine Plan form area for a vertical axis turbine
Dimensions given below are for E35 unit and E1000 unit
20.3 / 201
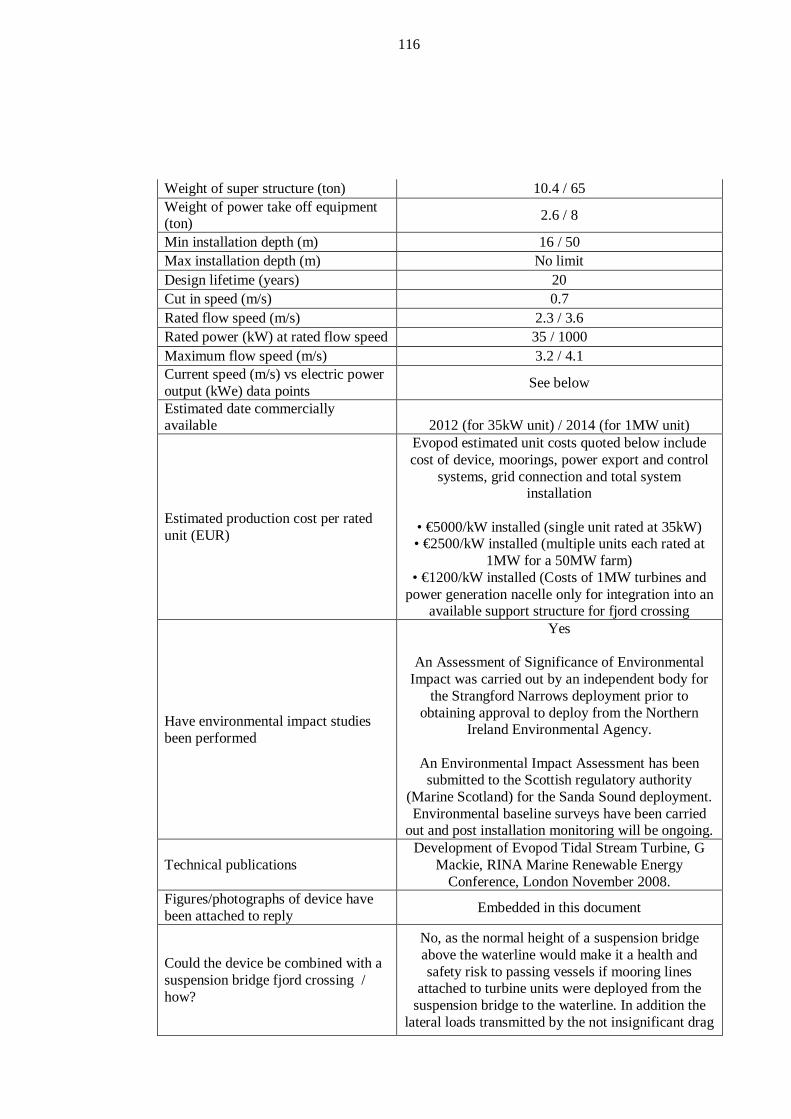
116
Weight of super structure (ton) 10.4 / 65 Weight of power take off equipment (ton) 2.6 / 8
Min installation depth (m) 16 / 50 Max installation depth (m) No limit Design lifetime (years) 20 Cut in speed (m/s) 0.7 Rated flow speed (m/s) 2.3 / 3.6 Rated power (kW) at rated flow speed 35 / 1000 Maximum flow speed (m/s) 3.2 / 4.1 Current speed (m/s) vs electric power output (kWe) data points See below
Estimated date commercially available 2012 (for 35kW unit) / 2014 (for 1MW unit)
Estimated production cost per rated unit (EUR)
Evopod estimated unit costs quoted below include cost of device, moorings, power export and control
systems, grid connection and total system installation
• €5000/kW installed (single unit rated at 35kW) • €2500/kW installed (multiple units each rated at
1MW for a 50MW farm) • €1200/kW installed (Costs of 1MW turbines and
power generation nacelle only for integration into an available support structure for fjord crossing
Have environmental impact studies been performed
Yes
An Assessment of Significance of Environmental Impact was carried out by an independent body for
the Strangford Narrows deployment prior to obtaining approval to deploy from the Northern
Ireland Environmental Agency.
An Environmental Impact Assessment has been submitted to the Scottish regulatory authority
(Marine Scotland) for the Sanda Sound deployment. Environmental baseline surveys have been carried
out and post installation monitoring will be ongoing.
Technical publications Development of Evopod Tidal Stream Turbine, G
Mackie, RINA Marine Renewable Energy Conference, London November 2008.
Figures/photographs of device have been attached to reply Embedded in this document
Could the device be combined with a suspension bridge fjord crossing / how?
No, as the normal height of a suspension bridge above the waterline would make it a health and safety risk to passing vessels if mooring lines
attached to turbine units were deployed from the suspension bridge to the waterline. In addition the
lateral loads transmitted by the not insignificant drag

117
forces of the turbine would change the design basis for a typical box girder suspension bridge by
introducing excessive lateral loads.
Advantages / disadvantages of combining the device with a suspension bridge fjord crossing
See H&S risk referred to above. Also significant capital would need to be spent to reinforce an
existing bridge, or upgrade plans for a proposed bridge, in order to cope with the drag force imposed
on the structure by the Evopod platform.
Could the device be combined with a floating bridge fjord crossing / how?
Yes, this is a preferred solution. Oceanflow’s multi-turbine support platform could be
used as the support structure for a roadway. The semi-submerged turbine support platform with its
streamline vertical struts would be an ideal structure for spanning a fjord. The platforms would be tension tethered to the seabed (see illustration). The turbines operate in channels between the vertical struts and
can be removed for maintenance without disrupting the use of the roadway. The semi-submerged
platform can be constructed in steel or reinforced concrete. It would be feasible to incorporate a
section without turbines and with raised bridges to allow small vessels to pass through. The pictures below are for a floating river bridge crossing but
could be adapted for a longer fjord crossing.

118
Advantages / disadvantages of combining the device with a floating bridge fjord crossing
Advantages:
A floating bridge structure, being close to the waterline, is ideal for reacting the drag loads from a
submerged tidal turbine.
It is possible that flow speed could be higher in the areas between the bridge support structure, therefore
enhancing the power density of the tidal stream at these locations. The blockage effect of multiple turbines could also create a small pressure head
difference across the turbines which would increase energy recovery. This could make a floating bridge more attractive economically, because the power rating of each device could be higher for a given
cross sectional area of water.
The bridge structure simplifies machinery access and power export.
Disadvantages:
The turbines will increase the drag load on the floating bridge and will thus necessitate stronger
moorings. However the facility will exist to park the turbine blades, which would significantly reduce
turbine drag forces and could be used to limit mooring loadings under extreme environmental
conditions. Yes, provided the design of the tunnel was such that the drag force would not compromise the safety of
the tunnel. Could the device be combined with a submerged floating tunnel fjord crossing / how?
Yes, provided the design of the tunnel was such that the drag force would not compromise the safety of
the tunnel.
Advantages / disadvantages of combining the device with a submerged floating tunnel fjord
In an area where the tidal flow is sufficiently strong to make power generation attractive it will also be
the case that the drag on a submerged tunnel will be very significant and will most likely rule out this
option as a fjord crossing.
It would be feasible to tie-off Evopod units to a submerged tunnel structure, effectively using the tunnel structure as an artificial seabed. The tunnel submergence would have to be sufficient so that it
did not disturb the flow feeding into the tidal turbine.
Current Speed (m/s) 35kW unit rated for
a flow speed of 2.3m/s
1000kW unit rated for a flow speed of
3.6m/s

119
Electric Power Output (kWe)
Electric Power Output (kWe)
0.6 0 (insufficient flow) 0 (insufficient flow) 0.7 1 12 0.8 1.5 18 0.9 2.1 26 1 2.9 36
1.1 3.8 48 1.2 4.9 62 1.3 6.3 79 1.4 7.8 99 1.5 10 122 1.6 12 148 1.7 14 177 1.8 17 210 1.9 20 247 2 23 289
2.1 26 334 2.2 30 384 2.3 35 439 2.4 39 499 2.5 45 564 2.6 50 634 2.7 32 710 2.8 36 792 2.9 40 880 3 44 974
3.1 49 1074 3.2 53 1182
3.3 0 (turbine shut down) 1296
3.4 0 1418 3.5 0 889 3.6 0 962 3.7 0 1044 3.8 0 1131 3.9 0 1222 4 0 1319
4.1 0 1420

120
4.2 0 0 (turbine shut down)
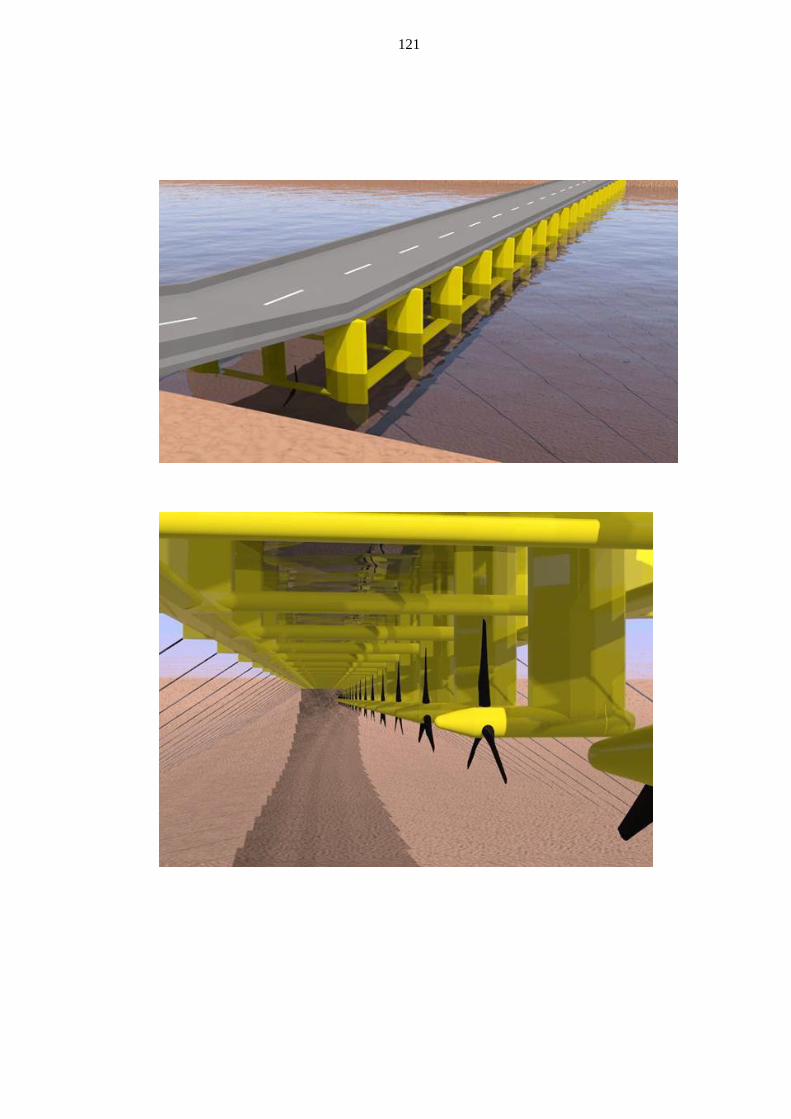
121

122
Company Ocean Renewable Power Company Country United States Web address www.orpc.co
Technology Name TidGen™, OCGen™ Device Type ** A) Horizontal Axis Turbine B) Cross-Axis Turbine C) Oscillating Hydrofoil D) Enclosed Tips (Venturi) E) Other Designs
B (Turbine is a cross flow tubine, with the axis
oriented horizontally)
Method to fix the device ** i) Seabed Mounted/Gravity Base ii) Pile Mounted iii) Floating (Flexible Mooring, Rigid Mooring, or Floating structure) iv) Hydrofoil Inducing Downforce
(i)TidGen™ (iii) OCGen™
Is power generated during ebb and flood flows Yes
Features / Design principle
ORPC's TidGen technology involves ORPC's patented TGU and a bottom support frame which provides structural support and holds it in place
above the sea floor. The TGU is comprised of two proprietary advanced design crossflow turbines that drive a permanent magnet generator on a common drive shaft with equal efficiency on ebb and flood
tides. Development status *** TRL 1-3, TRL 4, TRL 5/6, TRL 7/8 or TRL 9
TidGen™- TRL 7/8, OCGen- TRL4
Description of any and all prototypes (including test facility used or location of testing, dates, and hours of operation)
1:30 scale models (multiples) tested in University of Maine tow tank
1:10 scale model was tested during the ORPC
Demonstration Project
1:3 scale model tested during ORPC Beta TGU Project
A full scale unit is now being installed in Lubec,
Maine, USA
Next development steps Commercial deployment of TidGen™ Device in Eastport, Maine in March 2012.
Power train type Direct drive generator
Dimensions The overal length of the unit is 33m, height of 10m.

123
Area of current flow used by the device (m2) Shroud inlet area for an enclosed tips turbine Swept area of the turbine blades for an unshrouded turbine Plan form area for a vertical axis turbine
Weight of super structure (ton) 80 Weight of power take off equipment (ton) 34.5
Min installation depth (m) None Max installation depth (m) 45/ Design lifetime (years) 20 Cut in speed (m/s) 0.5 Rated flow speed (m/s) 3.0 Rated power (kW) at rated flow speed 180kW Maximum flow speed (m/s) 4.0 Current speed (m/s) vs electric power output (kWe) data points n/a publicly
Estimated date commercially available 2012
Estimated production cost per rated unit (EUR)
Have environmental impact studies been performed Yes
Technical publications
Viehman, H. (2011, November). Field evaluation of fish interactions with a commercial scale marine
hydrokinetic device. Siegel, E. (2011, November). Using a forward
looking acoustic doppler current profiler for turbine optimization and control.
Maynard, M. (2011, November). The complexity of seabed investigations and foundation selection for high tidal energy environments: a case study from the ORPC Cobscook Bay TidGen™ Power System
Project. Urbina, R. (2011, November). Modeling and
validation of a cross flow turbine using free vortex model and modified dynamic stall model.
Laoulache, R. (2011, November). Analysis of a vertical axis turbine using computational fluid
dynamics at low and high solidities. Viehman, H., and G. Zydlewski, J. McCleave, and G. Staines (2012, January). Fishes and tidal power development in Cobscook Bay. Paper presented at 2012 Research Forum: Atlantic Salmon and Their
Ecosystems, Bangor, ME. Figures/photographs of device have Yes

124
been attached to reply Could the device be combined with a suspension bridge fjord crossing / how?
Potentially in between the foundation piles
Advantages / disadvantages of combining the device with a suspension bridge fjord crossing
The design of the bridge is a permitted structure which may not allow for attachement of additional
structures.
The addition of turbine loads to a suspension bridge is novel. Dynamic loads on suspension bridges are
potentially important. Resonance of the bridge structure is an issue. Turbuelence induced loads on the turbine may incite oscillating loads on the bridge
structure. ORPC is unclear as to how this project will receive a
permit and who will perform the structural calculations for the bridge
Could the device be combined with a floating bridge fjord crossing / how? See above
Advantages / disadvantages of combining the device with a floating bridge fjord crossing
See above
Could the device be combined with a submerged floating tunnel fjord crossing / how?
Yes. The addition of a fixed bottom mounted structure is
more analytical tractable than a floating or suspension bridge.
Advantages / disadvantages of combining the device with a submerged floating tunnel fjord
The main advantage is that it would be cheaper to install the device because an attachment point could be designed into the tunnel geometry, which saves
time and money that is spent in a traditional installation attaching the mooring lines to the
seabed.
The disadvantage again would be the additional horizontal load on the supporting structure caused by
reacting the force absorbed by the device.

125
Source - www.orpc.co
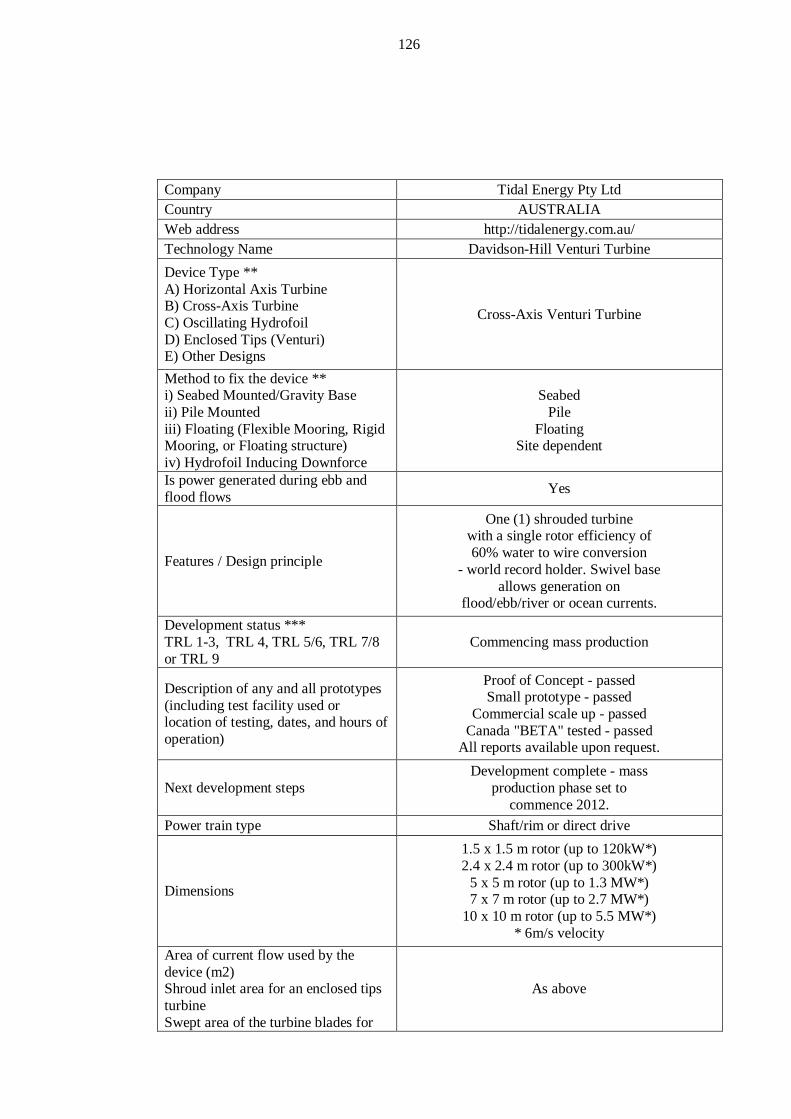
126
Company Tidal Energy Pty Ltd Country AUSTRALIA Web address http://tidalenergy.com.au/ Technology Name Davidson-Hill Venturi Turbine Device Type ** A) Horizontal Axis Turbine B) Cross-Axis Turbine C) Oscillating Hydrofoil D) Enclosed Tips (Venturi) E) Other Designs
Cross-Axis Venturi Turbine
Method to fix the device ** i) Seabed Mounted/Gravity Base ii) Pile Mounted iii) Floating (Flexible Mooring, Rigid Mooring, or Floating structure) iv) Hydrofoil Inducing Downforce
Seabed Pile
Floating Site dependent
Is power generated during ebb and flood flows Yes
Features / Design principle
One (1) shrouded turbine with a single rotor efficiency of 60% water to wire conversion
- world record holder. Swivel base allows generation on
flood/ebb/river or ocean currents. Development status *** TRL 1-3, TRL 4, TRL 5/6, TRL 7/8 or TRL 9
Commencing mass production
Description of any and all prototypes (including test facility used or location of testing, dates, and hours of operation)
Proof of Concept - passed Small prototype - passed
Commercial scale up - passed Canada "BETA" tested - passed
All reports available upon request.
Next development steps Development complete - mass
production phase set to commence 2012.
Power train type Shaft/rim or direct drive
Dimensions
1.5 x 1.5 m rotor (up to 120kW*) 2.4 x 2.4 m rotor (up to 300kW*)
5 x 5 m rotor (up to 1.3 MW*) 7 x 7 m rotor (up to 2.7 MW*)
10 x 10 m rotor (up to 5.5 MW*) * 6m/s velocity
Area of current flow used by the device (m2) Shroud inlet area for an enclosed tips turbine Swept area of the turbine blades for
As above

127
an unshrouded turbine Plan form area for a vertical axis turbine
Weight of super structure (ton) varies Weight of power take off equipment (ton) varies
Min installation depth (m) 2 x rotor diameter Max installation depth (m) >100m Design lifetime (years) 25 years Cut in speed (m/s) immediate start from standstill Rated flow speed (m/s) up to 12 m/s Rated power (kW) at rated flow speed as above Maximum flow speed (m/s) up to 12 m/s Current speed (m/s) vs electric power output (kWe) data points http://tidalenergy.com.au/faq.html
Estimated date commercially available 2012
Estimated production cost per rated unit (EUR) from AU$125,000 (100kW)
Have environmental impact studies been performed Supported by QLD Australia EPA
Technical publications Available upon request Figures/photographs of device have been attached to reply http://tidalenergy.com.au/faq.html
Could the device be combined with a suspension bridge fjord crossing / how?
Possibly
Advantages / disadvantages of combining the device with a suspension bridge fjord crossing
Could the device be combined with a floating bridge fjord crossing / how?
Cantilever or cable to the shore
Advantages / disadvantages of combining the device with a floating bridge fjord crossing
Pure speculation
Could the device be combined with a submerged floating tunnel fjord crossing / how?
As above
Advantages / disadvantages of combining the device with a submerged floating tunnel fjord
Unknown

128
Source - http://tidalenergy.com.au/

129
Company Tidal Generation Limited Country UK Web address www.tidalgeneration.co.uk
Technology Name TGL 1MW Turbine Device Type ** A) Horizontal Axis Turbine B) Cross-Axis Turbine C) Oscillating Hydrofoil D) Enclosed Tips (Venturi) E) Other Designs
A)
Method to fix the device ** i) Seabed Mounted/Gravity Base ii) Pile Mounted iii) Floating (Flexible Mooring, Rigid Mooring, or Floating structure) iv) Hydrofoil Inducing Downforce
i)
Is power generated during ebb and flood flows Yes
Features / Design principle
Upstream rotor, three variable pitch blades, yaws to face the tide, outputs grid compliant power.
Buoyant nacelle for rapid low cost deployment. Lightweight tripod foundation pinned to seabed
Development status *** TRL 1-3, TRL 4, TRL 5/6, TRL 7/8 or TRL 9
TRL6
Description of any and all prototypes (including test facility used or location of testing, dates, and hours of operation)
500kW concept demonstrator installed at EMEC (European Marine Energy Centre) in September 2010 and exported 215 MWh to the grid up to
March 2012. Achieved extended periods (up to 4 weeks) of continuous automated and remote
controlled operation.
Next development steps
1MWe device is under construction at present and due for deployment in Q3 2012. It will then undergo
a 2 year test programme gathering device and environmental impact data. This device will achieve TRL7. Beyond this TGL are negotiating to install a
small demonstration array of 5 or more 1MWe devices and these will be under pre-commercial
terms and deliver TRL8. Power train type Step-up gearbox and induction generator
Dimensions Turbine nacelle is 20.5m long, 3.5m diameter, 5.3m
high (max. dimension) with 18.2m blade swept diameter. Structure is 16m high.
Area of current flow used by the device (m2) Shroud inlet area for an enclosed tips turbine Swept area of the turbine blades for an unshrouded turbine
254m2

130
Plan form area for a vertical axis turbine
Weight of super structure (ton) 100 approx. Weight of power take off equipment (ton) 150
Min installation depth (m) 40 Max installation depth (m) 80 Design lifetime (years) 30 Cut in speed (m/s) 1.0 Rated flow speed (m/s) 2.7 Rated power (kW) at rated flow speed 1,000
Maximum flow speed (m/s) 5.0 m/s (site and wave dependent, may be lower than this)
Current speed (m/s) vs electric power output (kWe) data points
Estimated date commercially available 2016
Estimated production cost per rated unit (EUR) N/A
Have environmental impact studies been performed In progress at EMEC
Technical publications N/A Figures/photographs of device have been attached to reply Refer to TGL website
Could the device be combined with a suspension bridge fjord crossing / how?
The current TGL device is not suited to this requirement.
Advantages / disadvantages of combining the device with a suspension bridge fjord crossing
The TGL device is designed to be mounted on a rigid structure attached to the sea bed. It has a
deployment and retrieval method based on a buoyant nacelle which again assumes a structure that is
underneath the turbine. To allow the turbine to be suspended from a bridge would require considerable
modification. In fact there may well be other technical solutions that would make the turbine
lower cost as the turbine could be “hung” under a rigid support from a suspension bridge.
Could the device be combined with a floating bridge fjord crossing / how?
The current TGL device is not suited to this requirement.
Advantages / disadvantages of combining the device with a floating bridge fjord crossing
The TGL device is designed to be mounted on a rigid structure attached to the sea bed. It has a
deployment and retrieval method based on a buoyant nacelle which again assumes a structure that is
underneath the turbine. To allow the turbine to be suspended from a bridge would require considerable
modification. In fact there may well be other technical solutions that would make the turbine

131
lower cost as the turbine could be “hung” under a rigid support connected to a floating bridge.
Could the device be combined with a submerged floating tunnel fjord crossing / how?
The current TGL device could be adapted to this requirement.
Advantages / disadvantages of combining the device with a submerged floating tunnel fjord
The TGL device is designed to be mounted on a rigid structure attached to the sea bed. It has a
deployment and retrieval method based on a buoyant nacelle which again assumes a structure that is
underneath the turbine. A submerged floating tunnel could be treated as the “sea bed” and a structure
could be designed to which the TGL turbine could be attached. The turbine would need to be above the
bridge rather than below.
Source - www.tidalgeneration.co.uk

132
Company Tidal Sails AS Country Norway Web address www.tidalsails.com
Technology Name TidalSails Device Type ** A) Horizontal Axis Turbine B) Cross-Axis Turbine C) Oscillating Hydrofoil D) Enclosed Tips (Venturi) E) Other Designs
E
Method to fix the device ** i) Seabed Mounted/Gravity Base ii) Pile Mounted iii) Floating (Flexible Mooring, Rigid Mooring, or Floating structure) iv) Hydrofoil Inducing Downforce
iii
Is power generated during ebb and flood flows
Features / Design principle
Linearly moving sail profiles travelling a triangular track
with several hundred meter legs, attached to a rope belt
rotating large sheaves driving generators. Development status *** TRL 1-3, TRL 4, TRL 5/6, TRL 7/8 or TRL 9
Description of any and all prototypes (including test facility used or location of testing, dates, and hours of operation)
Several prototypes tested in Haugesund since 2007, Balder Demonstration via Eurostars project fall of
2011, Full skale engineering ongoing for deployment
primo 2013
Next development steps Tidal Sails Ocean Energy Test Center,
Skjoldastraumen in Tysvær, up to 3m/s 30 minutes east of Haugesund
Power train type Direct PMG 3-10MW Dimensions Up to 500 meter legs, up to 500 sails, 10 x1m Area of current flow used by the device (m2) Shroud inlet area for an enclosed tips turbine Swept area of the turbine blades for an unshrouded turbine Plan form area for a vertical axis turbine
Up to 10 000
Weight of super structure (ton) Up to 200 Weight of power take off equipment (ton) Up to 100
Min installation depth (m) 10 (Floating version)

133
Max installation depth (m) Unlimited, Max for Tidal Sails Vertical: 500m Design lifetime (years) 20 plus Cut in speed (m/s) 1 Rated flow speed (m/s) 2 Rated power (kW) at rated flow speed 10000
Maximum flow speed (m/s) 16, Of course with much smaller sails and shorter legs!!! 1
Current speed (m/s) vs electric power output (kWe) data points
Estimated date commercially available Late fall of 2013
Estimated production cost per rated unit (EUR) M6-10€
Have environmental impact studies been performed Yes
Technical publications DnV Figures/photographs of device have been attached to reply
Could the device be combined with a suspension bridge fjord crossing / how?
Yes, the standing configuration shown in the figure could be mounted to a floating bridge fjord crossing
Advantages / disadvantages of combining the device with a suspension bridge fjord crossing
Nice view with LED lights on each sail from the deep;-)
Could the device be combined with a floating bridge fjord crossing / how?
Yes, the standing configuration shown in the figure could be mounted to a floating bridge fjord crossing
Advantages / disadvantages of combining the device with a floating bridge fjord crossing
?
Could the device be combined with a submerged floating tunnel fjord crossing / how?
Yes, the standing configuration shown in the figure could be mounted to a floating bridge fjord crossing
Advantages / disadvantages of combining the device with a submerged floating tunnel fjord
?
Current Speed (m/s) Electric Power Output (kWe)
0.7 0.8 0.9 1
1.1 1000 1.2 1.3 5000 1.4

134
1.5 8000 1.6 1.7 10000 1.8 1.9 2 10000
2.1 2.2 2.3 2.4 2.5 2.6 2.7 2.8 2.9 3
3.1 3.2 3.3 3.4 3.5

135
Company TideTec AS Country Norway Web address wwe.tidetec.no Technology Name TideTec energibru konsept Device Type ** A) Horizontal Axis Turbine B) Cross-Axis Turbine C) Oscillating Hydrofoil D) Enclosed Tips (Venturi) E) Other Designs
D) Turnable Kaplan-type turbine patented by TideTec
Method to fix the device ** i) Seabed Mounted/Gravity Base ii) Pile Mounted iii) Floating (Flexible Mooring, Rigid Mooring, or Floating structure) iv) Hydrofoil Inducing Downforce
Turbine mounted in bridge structure that are seabed mounted, but turbines may also be mounted in floating bridge.
Is power generated during ebb and flood flows Yes
Features / Design principle
Turnable +/- 180 degrees around the vertical axis. According to University of Liverpool report: This
provides up to 56% added power production compared to traditional single-direction Kaplan
turbines. Pre-fabricated seabed mounted concrete sections makes the foundation for bridge and turbines and focuses the tidal currents into the
turbines. An option for wave energy on the same turbines is also patented. See:
http://tidetec.com/?page_id=180
Development status *** TRL 1-3, TRL 4, TRL 5/6, TRL 7/8 or TRL 9
TRL3- 4
Description of any and all prototypes (including test facility used or location of testing, dates, and hours of operation)
Planned TRL4-5 project for testing and proof of concept in Narvik. See attached note "Energibru
Narvik"
Next development steps Testing scale model in laboratory. Modelling and
calculating of costs etc. Se attached note: "Energibru Narvik"
Power train type Mechanical gear to high speed standard generator
Dimensions Turbine diameter adjusted for locations but normal diameter beetween 5-10 meters
Area of current flow used by the device (m2) Shroud inlet area for an enclosed tips turbine Swept area of the turbine blades for an unshrouded turbine Plan form area for a vertical axis
Depends on the locations. See example Narvik

136
turbine
Weight of super structure (ton) Weight of power take off equipment (ton)
Min installation depth (m) approx. 8-10 m
Max installation depth (m) Seabed mounted bridge: Not yet decided. Floating bridge: unlimited.
Design lifetime (years) Cut in speed (m/s) Rated flow speed (m/s) Rated power (kW) at rated flow speed Maximum flow speed (m/s) Current speed (m/s) vs electric power output (kWe) data points
Estimated date commercially available
Estimated production cost per rated unit (EUR)
Have environmental impact studies been performed yes
Technical publications see attached "høringsuttalelse fra Tidetec…" Figures/photographs of device have been attached to reply see attached "høringsuttalelse fra Tidetec…"
Could the device be combined with a suspension bridge fjord crossing / how?
no
Advantages / disadvantages of combining the device with a suspension bridge fjord crossing
Could the device be combined with a floating bridge fjord crossing / how? yes
Advantages / disadvantages of combining the device with a floating bridge fjord crossing
This is an interesting possibility, but much testing and proofing remains. Especially interesting to
combine TideTec turbines with waves. Could the device be combined with a submerged floating tunnel fjord crossing / how?
no
Advantages / disadvantages of combining the device with a submerged floating tunnel fjord
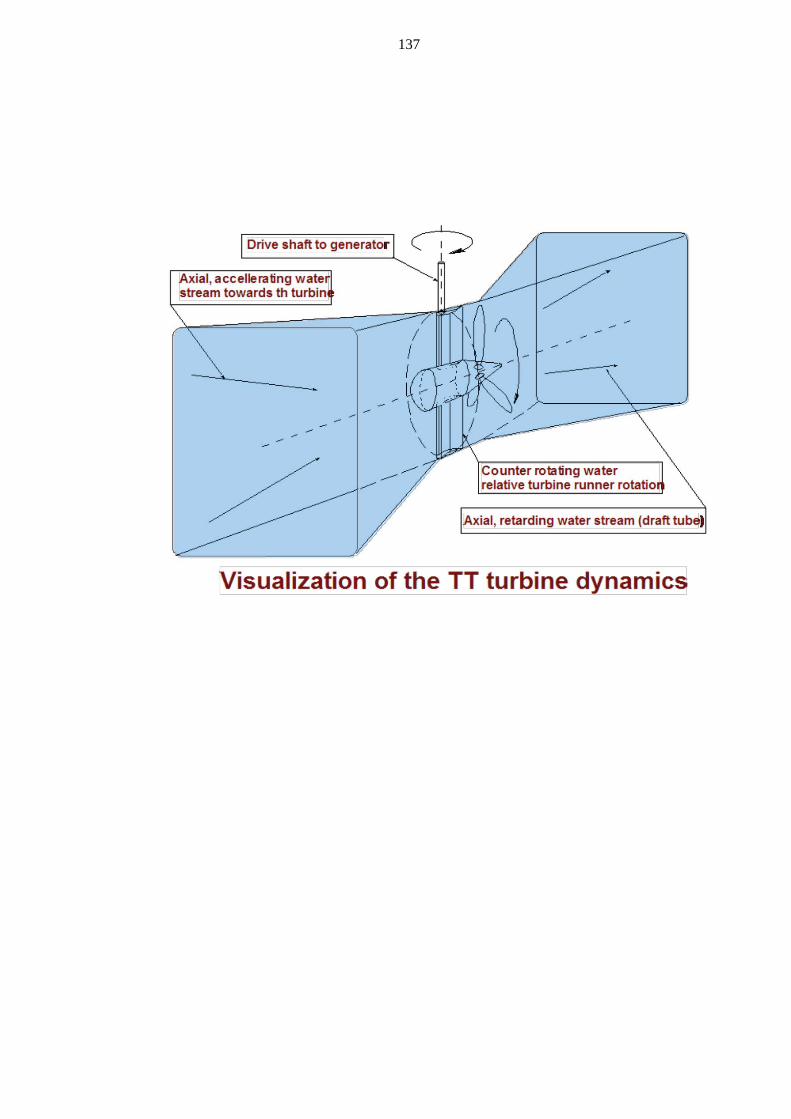
137

138
Company Tocardo International BV - Hydropower from Holland
Country Netherlands Web address www.tocardo.com Technology Name Tocardo T100, Tocardo T200 Device Type ** A) Horizontal Axis Turbine B) Cross-Axis Turbine C) Oscillating Hydrofoil D) Enclosed Tips (Venturi) E) Other Designs
Free flow, horizontal axes, direct drive generator, fixed pitch (bi-directional) blades.
Method to fix the device ** i) Seabed Mounted/Gravity Base ii) Pile Mounted iii) Floating (Flexible Mooring, Rigid Mooring, or Floating structure) iv) Hydrofoil Inducing Downforce
Multiple ways: - Floating (flexible or rigid moored platform) - Bottom mounted (gravity based, pile based) - Retro fitted to existing structures (bridges,
barrages, dames, tunnels etc.)
Is power generated during ebb and flood flows
The turbines can be equipped with (patented) bi-directional blades which will automatically (without the use of a pitching mechanism) flip when the flow
reverses.
Features / Design principle
Tocardo offers turbines with a rated power of 50, 100, 200 and 500 kW. The 100 and 200 kW turbines
are commercially available. The focus of the design is on kWh. This means the turbines are built to be robust and thus need very
little maintenance. The bi-directional blade enables the turbines to operate in bi-directional flows
without the need of vulnerable pitching mechanisms. The turbines are designed to be attached to any kind of structure, ranging from bridges, barrages, floating
platforms to bottom mounted. Development status *** TRL 1-3, TRL 4, TRL 5/6, TRL 7/8 or TRL 9
Commercially available
Description of any and all prototypes (including test facility used or location of testing, dates, and hours of operation)
A Tocardo T100 has been installed in Den Oever, the Netherlands since 2008 and has been grid
connected (and delivering power) since then. This is a demo project which proofs the technology. The
T200 turbine is an up-scaled copy of the T100 using the same technologies.
Next development steps
Tocardo started to roll out commercial activities and is now involved in setting up projects in:
- UK - Scotland - Canada - Japan - USA - Korea

139
Power train type Direct drive generator
Dimensions
T100 Turbine:
- Rotor diameter: 6.4 m - Total length of turbine(incl rotor): 4.38 m
- Nacelle diameter: 1.03 m Foundation:
- Foundation size depends on the foundation type, location and the number of turbines attached.
Power cabinet: - 2.0 x 0.8 x 2.3 m (WxDxH)
T200
Turbine: - Rotor diameter: 9.2 m
- Total length of turbine(incl rotor): 6 m - Nacelle diameter 1.40 m
Foundation: - Foundation size depends on the foundation type,
location and the number of turbines attached. Power cabinet:
- 2.0 x 1.0 x 2.3 m (WxDxH)
Area of current flow used by the device (m2) Shroud inlet area for an enclosed tips turbine Swept area of the turbine blades for an unshrouded turbine Plan form area for a vertical axis turbine
T100 - 32.2 m2 T200 - 66.5 m2
Weight of super structure (ton) Total weight incl rotor:
T100 - 4925 kg T200 - 11400 kg
Weight of power take off equipment (ton) 600 kg
Min installation depth (m) Minimum nacelle depth:
T100 - 3.7 m T200 - 5.1 m
Max installation depth (m) Maximum nacelle depth: 25 m Design lifetime (years) 20 Cut in speed (m/s) 0.4 m/s Rated flow speed (m/s) 2 - 4 m/s (adjustable with blade size)
Rated power (kW) at rated flow speed T100 - 43 kW T200 - 87 kW
Maximum flow speed (m/s) 4 m/s (survival speed) Current speed (m/s) vs electric power output (kWe) data points
Please see Appendix for a power curve and rated power table.

140
Estimated date commercially available
T100 and T200 are commercially available. Delivery time 6-7 months.
Estimated production cost per rated unit (EUR)
T100 - € 242.100 T200 - € 424.600
Single turbine, incl rotor and control/electro cabinet, excl foundation/installation cost, FOB Port of
Rotterdam.
Have environmental impact studies been performed
A preliminary fish impact study has been done in Den Oever. No deaths or injuries were recorded
caused by the turbine. Tocardo is preparing a project in the Oosterschelde storm barrage in the south of the Netherlands. All (environmental) permits for this project have been approved by the responsible authorities. An impact
study was done as a basis for the environmental permits.
Technical publications No technical publications, as Tocardo is a commercial company, not a research company.
Figures/photographs of device have been attached to reply Yes, see rest of the document
Could the device be combined with a suspension bridge fjord crossing / how?
Yes. Turbines van be directly attached to the bridge pillars or a platform can be attached to the bridge.
Tocardo works together with partners for foundation and installation solutions. Tocardo’s partners are:
- Rambol - RES - SMT
Strukton
Advantages / disadvantages of combining the device with a suspension bridge fjord crossing
Disadvantage: - Restriction in numbers when attached to pilars (if
pilars are in the water) - Extra load on bridge pilars or bridge deck. As the
bridge pilars are the strongest parts, the extra load is neglectible. Advantages:
- Low cost when attached to pilars (foundation is allready there)
- Connecting to the pilars or the deck can be included in the bridge design, reducing costs
- No extra space is used for a floating platform when attached to the pilars
- Easy and cheap connection to the grid using bridge structure
Could the device be combined with a floating bridge fjord crossing / how?
Yes. Turbines can be (retro) fitted to a floating bridge. Either by directly attaching them to the parts
of the bridge that are submerged or by mooring a platform to the bridge.
Tocardo’s partner, SMT (Sustainable Marine Technologies), are experts in engineering floating
solutions.

141
Advantages / disadvantages of combining the device with a floating bridge fjord crossing
Disadvantage: - When using a special platform this is more
expensive - Additional load on the bridge
Advantage: - The floating parts of the bridge can be used as
foundation (cost reduction) - The grid connection can be realized using the
bridge, cost reduction No extra space is used when attaching to the bridge
Could the device be combined with a submerged floating tunnel fjord crossing / how?
Yes, depending on the depth (max 25 m). Turbines can be directly attached to the tunnel or attached
with mooring lines to a floating platform.
Advantages / disadvantages of combining the device with a submerged floating tunnel fjord
Disadvantage: - Extra load on the tunnel
- Restrction of depth for the tunnel Advantage:
- When directly attached to the tunnel no extra foundation is necessary
- Grid connectioncan be realized using the tunnel The energy generated can be used to supply power
to the tunnel

142
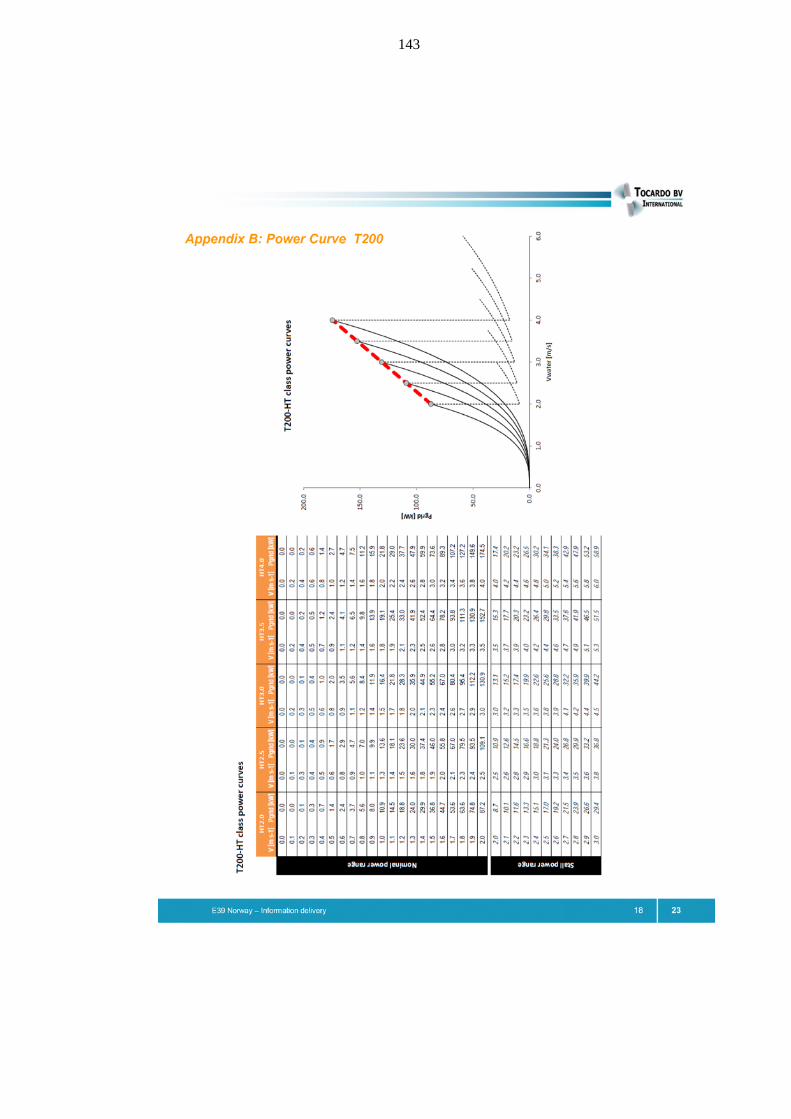
143
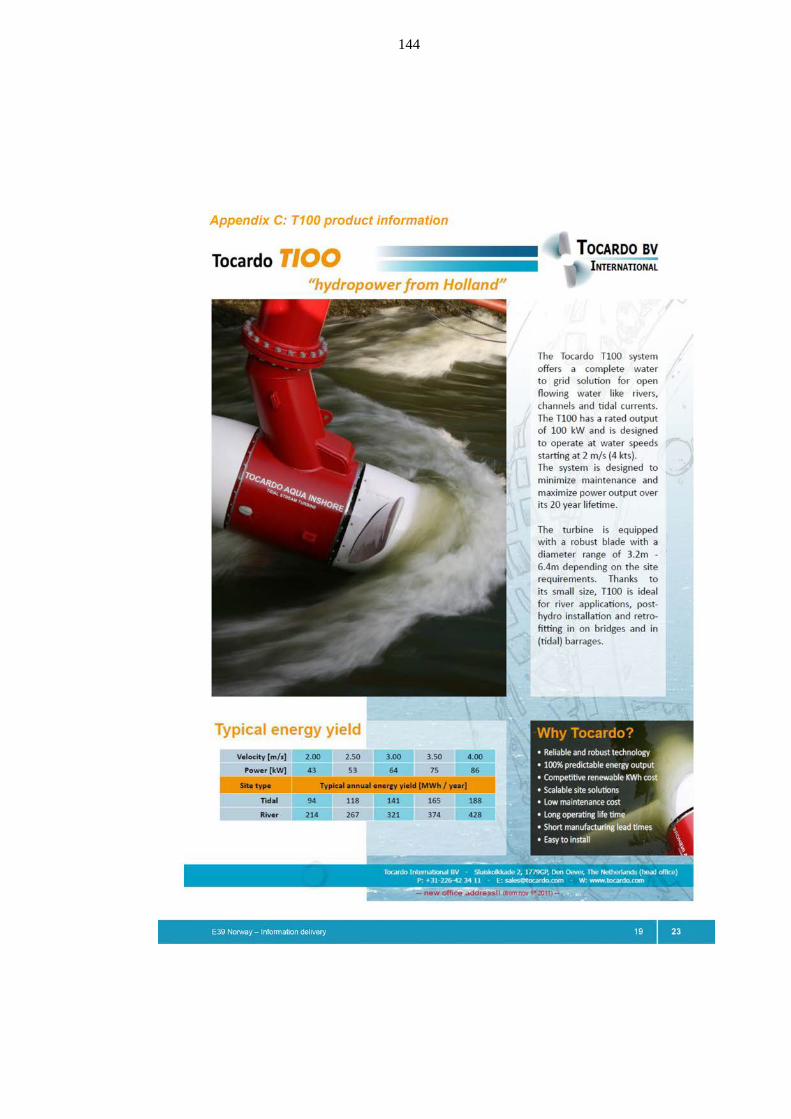
144

145

146

147

148
Company Verdant Power, Inc. Country U.S. (also Canada, UK & Hong Kong) Web address www.verdantpower.com
Technology Name Kinetic Hydropwer System (KHPS) Device Type ** A) Horizontal Axis Turbine B) Cross-Axis Turbine C) Oscillating Hydrofoil D) Enclosed Tips (Venturi) E) Other Designs
A
Method to fix the device ** i) Seabed Mounted/Gravity Base ii) Pile Mounted iii) Floating (Flexible Mooring, Rigid Mooring, or Floating structure) iv) Hydrofoil Inducing Downforce
i) (gravity and hybrid designs) and ii) (not surface-piercing)
Is power generated during ebb and flood flows Yes
Features / Design principle
The KHPS uses a yawing turbine with a fixed-pitch 3 bladed rotor that is scalable from 50 to 500kW, and can be mounted individually on piles, gravity
bases or triframes of 3 turbines. Development status *** TRL 1-3, TRL 4, TRL 5/6, TRL 7/8 or TRL 9
TRL 7/8
Description of any and all prototypes (including test facility used or location of testing, dates, and hours of operation)
1/6 scale rotor design tests at US Navy David Taylor 1981, 1982.
3m diameter rotor vessel drag tests in Chesepeake
and New York East River in 2001 - 2003.
5m diameter rotor; dynamometry and entire turbine system tests in East River at RITE Project, 2006-
2008, 2.5m/s max.
Grid-connected five-turbine array >70MWh (TRL 7/8)
Next development steps
Testing at our RITE project site in New York City of the Gen5 commercial turbines in 2012, then buildout
to 30 turbines under FERC license.
Scale Gen5 to the 10m-class site-suitedsm systems.
Power train type Induction generator - direct grid connection; future direct drive option
Dimensions Test turbines have 5m diameter rotors, designs to 11m. TriFrame mounting structure starts at 2m
high, 15m x 10m
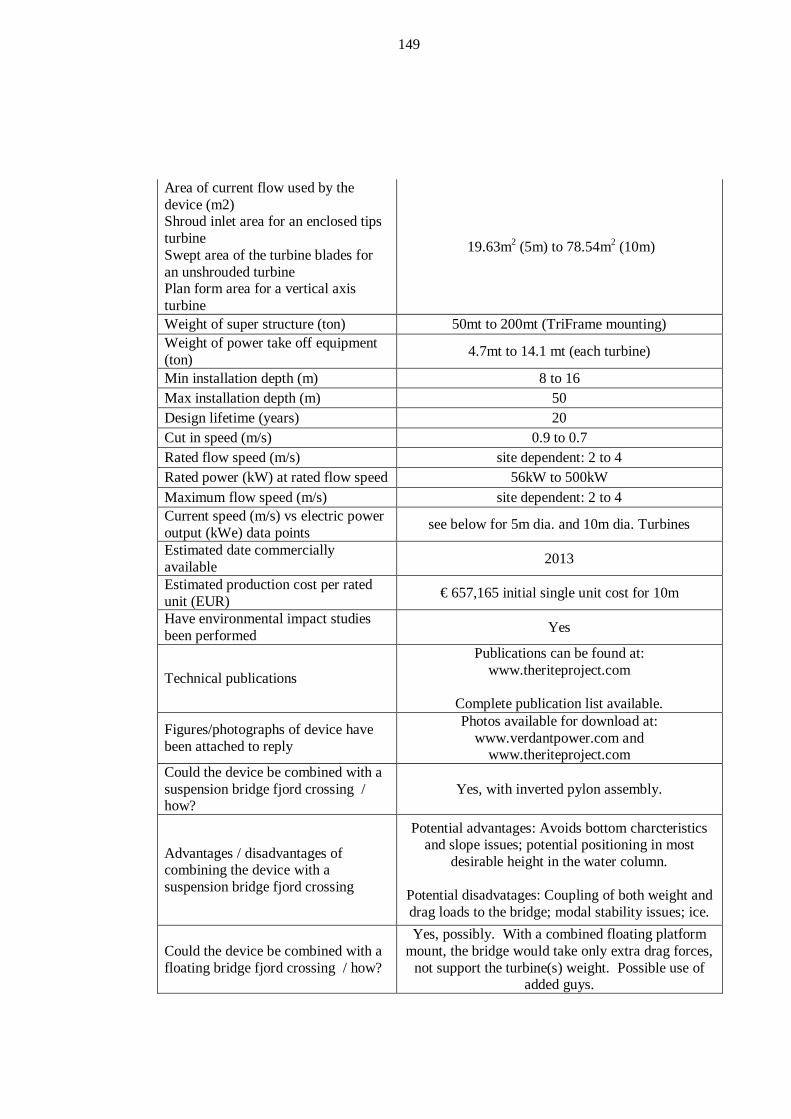
149
Area of current flow used by the device (m2) Shroud inlet area for an enclosed tips turbine Swept area of the turbine blades for an unshrouded turbine Plan form area for a vertical axis turbine
19.63m2 (5m) to 78.54m2 (10m)
Weight of super structure (ton) 50mt to 200mt (TriFrame mounting) Weight of power take off equipment (ton) 4.7mt to 14.1 mt (each turbine)
Min installation depth (m) 8 to 16 Max installation depth (m) 50 Design lifetime (years) 20 Cut in speed (m/s) 0.9 to 0.7 Rated flow speed (m/s) site dependent: 2 to 4 Rated power (kW) at rated flow speed 56kW to 500kW Maximum flow speed (m/s) site dependent: 2 to 4 Current speed (m/s) vs electric power output (kWe) data points see below for 5m dia. and 10m dia. Turbines
Estimated date commercially available 2013
Estimated production cost per rated unit (EUR) € 657,165 initial single unit cost for 10m
Have environmental impact studies been performed Yes
Technical publications
Publications can be found at: www.theriteproject.com
Complete publication list available.
Figures/photographs of device have been attached to reply
Photos available for download at: www.verdantpower.com and
www.theriteproject.com Could the device be combined with a suspension bridge fjord crossing / how?
Yes, with inverted pylon assembly.
Advantages / disadvantages of combining the device with a suspension bridge fjord crossing
Potential advantages: Avoids bottom charcteristics and slope issues; potential positioning in most
desirable height in the water column.
Potential disadvatages: Coupling of both weight and drag loads to the bridge; modal stability issues; ice.
Could the device be combined with a floating bridge fjord crossing / how?
Yes, possibly. With a combined floating platform mount, the bridge would take only extra drag forces,
not support the turbine(s) weight. Possible use of added guys.

150
Advantages / disadvantages of combining the device with a floating bridge fjord crossing
Potential advantages: Avoids bottom charcteristics and slope issues; potential positioning in most
desirable height in the water column.
Potential disadvatages: Coupling of drag loads to the bridge; modal stability issues; ice.
Could the device be combined with a submerged floating tunnel fjord crossing / how?
Yes, if the structure is capable of supporting the turbine(s) using appropriate adaption.
Advantages / disadvantages of combining the device with a submerged floating tunnel fjord
Potential advantages: Combined econimics of sharing other structure; avoids bottom charcteristics
and slope issues; potential positioning in most desirable height in the water column; convenient
cabling.
Potential disadvatages: Coupling of drag loads to the bridge; modal stability issues; corrosion issues.
Electric Power Output (kWe) (per
Turbine) Current Speed (m/s) 5m 10m
0.7 0 5 0.8 2 7 0.9 3 11 1 4 14
1.1 5 1.2 6 1.3 8 1.4 10 1.5 12 49 1.6 15 1.7 18 1.8 21 1.9 25 2 29 115
2.1 33 2.2 38 2.3 44 2.4 50 2.5 56 225 2.6 63 2.7 71 2.8 79 2.9 85 3 85 389

151
3.1 85 429 3.2 85 472 3.3 85 500 3.4 85 500 3.5 85 500
Source - www.verdantpower.com

152
Company Voith Hydro Ocean Current Technologies GmbH & Co. KG
Country Germany Web address http://www.voithhydro.com
Technology Name HyTide Device Type ** A) Horizontal Axis Turbine B) Cross-Axis Turbine C) Oscillating Hydrofoil D) Enclosed Tips (Venturi) E) Other Designs
A
Method to fix the device ** i) Seabed Mounted/Gravity Base ii) Pile Mounted iii) Floating (Flexible Mooring, Rigid Mooring, or Floating structure) iv) Hydrofoil Inducing Downforce
Device can be intergrated in several types of foundation. Experience so far with monopile and
gravity
Is power generated during ebb and flood flows Yes
Features / Design principle
The Voith HyTide is designed under the main principle of robustness and simplicity. The
technology needs to provide a low-maintenance plant in order to minimize expensive offshore operations for maintenance and repair work.
Therefore the basic principle is to keep complex systems and components out of the turbine and to
focus on simple, robust and reliable technology. To address this challenge the consortium has selected the Voith Hy Tide 1000 turbine with the following
key-features: 1. Direct drive, gearbox-free coupling and a generator with permanent magnet excitation
2. Three-bladed rotor with symmetric blades and variable speed for operation in the two main
directions of the tidal flow, avoiding failure-prone pitch and yaw requirements
3. Elimination of grease through seawater lubrication bearing technology, ensuring
environmentally friendly operation
The small number of components lead to a robust turbine and thus to presumably lower life cycle costs of a tidal power plant consisting of multiple of these
turbines.
The Voith Hy-Tide 1000 Turbine generator works as an electrical motor to start the turbine from a defined
minimum of the tidal speed and as well as the turbine brake. The bearings need no sealing against the external medium sea water. Instead it uses sea

153
water itself for setting up a lubricating hydrodynamic film. Thus complex measures for
sealing and periphery such as leakage water pumps are not required. The machine is protected by proven
protective coatings and sacrificial anodes from corrosion and maritime fouling.
Development status *** TRL 1-3, TRL 4, TRL 5/6, TRL 7/8 or TRL 9
TRL 7/8
Description of any and all prototypes (including test facility used or location of testing, dates, and hours of operation)
In early 2011 Voith Hydro Ocean Current Technologies GmbH has successfully installed, grid-
connected, commissioned and tested a prototype scale tidal turbine at Jindo in South Korea. The 1:3 scale prototype has a rated power of 110 kW and is
fixed on a concrete gravity based foundation.
Parallel to this prototype development Voith Hydro has started to develop a 1 MW full scale pre
commercial test device which will be ready for installation in late summer 2012. The monopile foundation has been installed already in summer
2011 at the European Marine Energy Center, using a revolutionary environmental friendly subsea drilling technology. The drill unit has been operated from a
special offshore construction vessel that is using Voith Schneider propulsion units to keep in position.
Next development steps Next step will be to test the technology in a
park/array configuration with several units of at least 3
Power train type Direct drive generator
Dimensions
1MW unit: Length of nacelle 17 m
Rotor diameter varaing according to flow caracteristics from 13-16 m

154
Area of current flow used by the device (m2) Shroud inlet area for an enclosed tips turbine Swept area of the turbine blades for an unshrouded turbine Plan form area for a vertical axis turbine
201
Weight of super structure (ton) 90 (1MW) Weight of power take off equipment (ton) 200 (1MW)
Min installation depth (m) 25 (absolute min 20 for smaller rotor) (1MW) Max installation depth (m) 60 (1MW) Design lifetime (years) 20 (1MW) Cut in speed (m/s) 1 Rated flow speed (m/s) 2.9 Rated power (kW) at rated flow speed 1000 Maximum flow speed (m/s) 5 Current speed (m/s) vs electric power output (kWe) data points See below
Estimated date commercially available 2012-08
Estimated production cost per rated unit (EUR)
Have environmental impact studies been performed Yes
Technical publications
Tidal Current Energy Converter: On the challenge of effective and comprehensive characterization of complex met-ocean conditions and combinations
thereof in a Basis of Design, Hydrovision, Sacramento, California, USA
2011 Arlitt, R.: Third Party Verification: Assessments, Certification, Classification and Marine Warranty Survey of a Tidal Project, Hydrovision, Sacramento, California, USA
2011 Arlitt, R.: Tidal Current Energy Projects Due Diligence: Energy Extraction Modelling, All-
Energy, Aberdeen, UK 2011 Biskup F., Daus P., Arlitt R., Auslegung und
Evaluierung eines Rotordesigns für Gezeitenströmungsanlagen, 5. Deutsche
Meeresenergieforum, Dresden 2011 Daus P., Sepri M., Biskup F., Arlitt R., Methoden zur Ermittlung und Bewertung von
Standortdaten für die Nutzung der Gezeitenströmungsenergie, 5. Deutsche
Meeresenergieforum, Dresden 2010 Arlitt, R.: Meeresenergie – Energieformen,
Stand der Technologie, Entwicklungsperspektiven, „ENERGIE“, Vortragsreihe Thema Energie des

155
Studiengangs Bauingenieurwesen 2010 Arlitt R.: A New Case Study in Tidal Current Resource Monitoring, Analysis and Modelling, 4th
International Tidal Energy Summit & Awards, London
2010 Arlitt R.: How to Overcome Real Tidal Technology and Engineering Challenges, Panelist, 4th International Tidal Energy Summit & Awards,
London 2010 Arlitt R., Argyriadis K.: Certification of Tidal Current Power Plants, International Conference on
Ocean Energie 2010, Bilbao 2010 Arlitt R.: Resource Assessment of Tidal
Current Flows and its consequences on power plant technology, Hydro Vision 2010, Charlotte Convention Center – Charlotte, NC USA
2010 Arlitt R.: Fortschritte in der Nutzung der
Wellen- und Gezeitenströmungsenergie, Vorlesung Meeresenergien, Hochschule Biberach, Biberach 2010 Arlitt R.: Meeresenergieprojekte bei Voith
Hydro, 3. Deutsches Meeresenergieforum, 25-26. März 2010, Haus der Wissenschaften, Bremen
2010 Arlitt R.: Wellenenergie, Gezeitenströmungsenergie, Lecture Ocean Energies,
TU Hamburg-Harburg
2009 Arlitt R.: Resources Assessment of Tidal Current Flows and implications to tidal current power plants, 33rd International Association of
Hydraulic Engineering & Research (IAHR) Biennial Congress, Vancouver, British-Columbia, Canada
Figures/photographs of device have been attached to reply Yes
Could the device be combined with a suspension bridge fjord crossing / how?
Yes - has to be discussed in detail. Especially on acceptable loads on the bridge crossing.
Advantages / disadvantages of combining the device with a suspension bridge fjord crossing
double use of supoprt structure, accessability and ease of cabling and grid connection
Could the device be combined with a floating bridge fjord crossing / how? Yes.
Advantages / disadvantages of combining the device with a floating bridge fjord crossing
See above on the fixed bridge crossing combination. Needs investigations in detail.
Could the device be combined with a submerged floating tunnel fjord crossing / how?
Yes
Advantages / disadvantages of combining the device with a submerged floating tunnel fjord
See above on the fixed bridge crossing combination. Needs investigations in detail

156
Current Speed (m/s) Electric Power Output (kWe)
0.05 0 0.15 0 0.25 0 0.35 0 0.45 0 0.55 0 0.65 0 0.75 0 0.85 0 0.95 0 1.05 0 1.15 59 1.25 76 1.35 96 1.45 119 1.55 145 1.65 175 1.75 209 1.85 247 1.95 289 2.05 336 2.15 387 2.25 444 2.35 506 2.45 573 2.55 646 2.65 725 2.75 810 2.85 902 2.95 1000 3.05 1000 3.15 1000 3.25 1000 3.35 1000 3.45 1000 3.55 1000 3.65 1000 3.75 1000 3.85 1000 3.95 1000 4.05 1000 4.15 1000 4.25 1000 4.35 1000 4.45 1000 4.55 1000
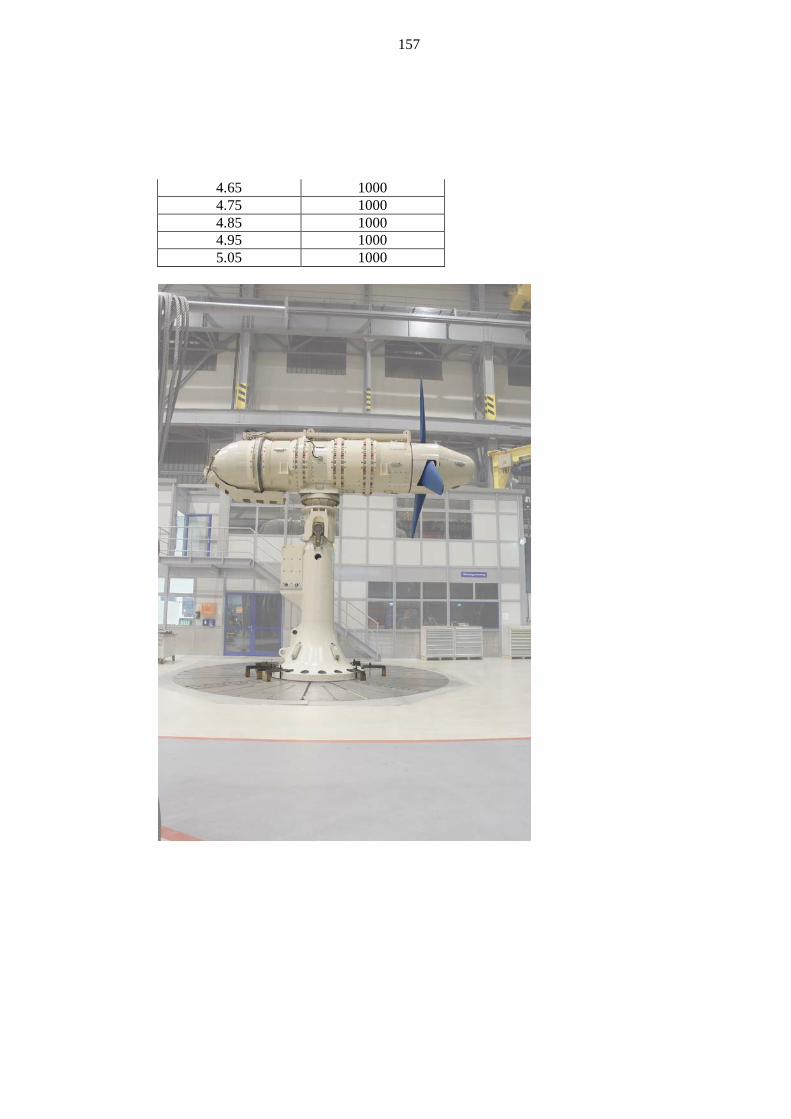
157
4.65 1000 4.75 1000 4.85 1000 4.95 1000 5.05 1000

158
Appendix 4: WEC device request for information

159
Dear Sir or Madam: SP Technical Research Institute of Sweden has been commissioned by the Norwegian Public Roads Administration in a project that will potentially utilize a large number of wave energy conversion devices. We are currently in the process of performing a technology survey to determine the capabilities and characteristics of the different devices that are being developed. Upon review of the information available on the internet it seems that your technology is potentially promising for our application. We have developed a short questionnaire that we are asking all companies of interest to fill out in order to have an up-to-date basis for comparison of the different technologies. We would appreciate it if you could take the time to fill out the table below and send it back to me before February 3, 2012. If any of the information is not currently available then simply state that in your reply. A fictional sample reply is provided for your convenience and more information about some of the questions is given in the information below. I have also attached a copy of the questionnaire in excel format if you have any problems with the formatting of the table in the email when you reply. For more information about the background of the project itself, please see the information below*. The results of this technology survey will be presented as part the workshop/conference scheduled for April 2012 (probably in Trondheim, Norway). If you have any questions about the questionnaire or if you would like more detailed information about the project then feel free to contact me by replying to this email or calling at the number given below. Best regards, Daniel
Daniel Vennetti
SP Sveriges Tekniska Forskningsinstitut SP Technical Research Institute of Sweden Byggnadsteknik och Mekanik/Buildning Technology and Mechanics Box 857, SE-501 15 Borås, Sweden Tel: +46 (0)10 516 50 00, (direct) +46 (0)10 516 57 83 E-post: [email protected] Internet: www.sp.se

160
Fictional Sample Reply Company SP - Technical Research Institute of Sweden Country Sweden Web address http://www.sp.se/en/Sidor/default.aspx
Technology Name SP Wave Technology
Device Type ** A) Attenuator B) Point Absorber C) Oscillating Wave Surge Converter D) Oscillating Water Column E) Overtopping/Terminator Device F) Submerged Pressure Differential G) Other Designs
A
Features / Design principle
SP Wave Technology has three platforms that are attached with hinges and hydraulic
cylinders both above and below the platforms. The up and down motion of the waves results in high pressure sea water,
which turns a generator.
Development status *** TRL 1-3, TRL 4, TRL 5/6, TRL 7/8 or TRL 9
TRL 7/8
Description of any and all prototypes (including test facility used or location of testing, dates, and hours of operation)
A 1:10 scale proof-of-concept model was tested at SP's wave laboratory in Borås
Sweden 2007-10.
A 1:5 scale model including the proposed mooring system was tested at SP's Big wave
laboratory in Borås, Sweden 2009-11.
A full scale model is currently being tested including a new and improved mooring
system off the east coast of Borås, Sweden which has an avg annual wave power density
of 15 kW/m. The full scale model was deployed 2010-06 and has been generating
power to the grid for over 4000 hours.
Next development steps
We have a spot reserved off the west coast of Borås, Sweden
which has an avg annual wave power density of 30 kW/m. Testing is expected to begin in
2012-07
Power take off Hydraulic using sea water

161
Dimensions Each of the three sections is 10 m wide and has a length of 100 m, for a total length of
300 m. Centerline device spacing for multiple devices (m) 75
Weight of super structure (ton) 200 Weight of power take off equipment (ton) 50 Min installation depth (m) 50 Max installation depth (m) 150 Design lifetime (years) 15 Rated power (kW) of commercial unit 1000 Wave energy absorption performance (kW) (before losses in conversion to electric power) as a function of significant wave height and peak wave period ****
See below
Source of wave energy absorption performance (numerical simulations or random wave model tests)
Numerical simulations
Estimated date commercially available 2015-01 Estimated production cost per rated unit (EUR) 5.00E+06
Have environmental impact studies been performed Yes (see publications)
Discuss the survivability of the device and whether or not it has been tested.
The device equipped with a remote operated survival system. When a storm is
approaching, the device automatically will detect that it should go into survival mode
and will be filled with water so that it submerges until the storm has passed. This
system has been tested in the full scale model that is currently being off the east coast of Borås Sweden and has worked flawlessly.
Technical publications
Vennetti D. Power predictions of the SP Wave Technology,. Renewable Energy
Review 2007;5(5)20-50.
Vennetti D. SP Wave Technology Environmental Impact Study,. Environment
Magazine 2011;2(20)15-35.
Figures/photographs of device have been attached to reply
Yes (not actually true for this fictional example)
Is it possible to combine this device with a fjord crossing that implements a suspension bridge, floating bridge, or submerged floating tunnel. If so, how?
This device is best suited for offshore applications and it would be very difficult to
combine with a fjord crossing structure.

162
Fictional Sample Reply Wave energy conversion absorption performance (kW) as a function of significant wave height (Hs) and peak wave period (Tp)
Your Reply Wave energy conversion absorption performance (kW) as a function of significant wave height (Hs) and peak wave period (Tp)
3 4 5 6 7 8 9 10 11 12 13 14 15 16 17 18 19 2010 0 0 0 0 0 0 0 0 0 0 0 0 0 0 0 0 0 09.5 0 0 0 0 0 0 0 0 0 0 0 0 0 0 0 0 0 09 0 0 0 0 0 0 0 0 0 0 0 0 0 0 0 0 0 0
8.5 0 0 0 0 0 0 0 0 0 0 0 0 0 0 0 0 0 08 0 0 0 0 0 0 0 0 0 0 0 0 0 0 0 0 0 0
7.5 0 0 0 0 0 0 0 0 0 0 0 0 0 0 0 0 0 07 0 0 0 0 0 0 0 0 0 0 1000 0 0 0 0 0 0 0
6.5 0 0 0 0 0 0 0 0 0 1000 964 789 822 0 0 0 0 06 0 0 0 0 0 0 0 0 1000 900 821 844 700 635 0 0 0 0
5.5 0 0 0 0 0 0 0 0 950 846 856 709 643 533 0 0 0 05 0 0 0 0 0 0 0 1000 858 854 708 643 532 525 440 0 0 0
4.5 0 0 0 0 0 0 1000 845 834 693 631 520 509 425 399 0 0 04 0 0 0 0 0 821 777 780 659 605 499 481 452 377 315 263 0 0
3.5 0 0 0 0 0 769 757 669 561 525 440 416 347 288 261 219 0 03 0 0 0 0 560 565 556 492 457 441 367 305 277 231 192 160 133 0
2.5 0 0 0 0 550 456 468 427 365 307 280 232 193 160 133 112 100 02 0 0 0 0 350 320 300 273 260 216 180 149 124 103 85 72 57 0
1.5 0 0 0 250 231 215 191 172 147 121 101 84 69 57 48 40 27 01 0 0 0 0 0 0 0 0 0 0 0 0 0 0 0 0 0 0
0.5 0 0 0 0 0 0 0 0 0 0 0 0 0 0 0 0 0 00.13 0 0 0 0 0 0 0 0 0 0 0 0 0 0 0 0 0 0
H s (m
)
Tp (s)
3 4 5 6 7 8 9 10 11 12 13 14 15 16 17 18 19 20109.59
8.58
7.57
6.56
5.55
4.54
3.53
2.52
1.51
0.50.13
Tp (s)
H s (m
)

163
* Project Background E39 is a road that is located on the west coast of Norway and extends from Kristiansand in the south to Trondheim in the north. Currently, a number of ferry crossings are required to traverse its entire length. The Transport Ministry has given a mandate for the project “Ferry Free E39” to assess the technological solutions for the crossing of eight large fjords without ferries. The fjords crossings range from 1.5 km to 25 km in length and have depths up to 1300 m. Proposed solutions for the crossings that are under consideration consist of suspension bridges, floating bridges, submerged floating tunnels, and sub-sea rock tunnels. Part of the project is to consider how the construction of the crossings can be combined with devices that produce energy from waves, tides, wind and the sun. The idea is that by using the bridge construction as part of the facility, the costs of the renewable power plants could be reduced and therefore be more competitive with non-renewable energy sources. If it is not possible to combine certain technologies with the actual bridge construction, the possibility will also be considered to install the devices in other locations, such as offshore. Questionnaire Information ** Device Type More information about the classification of device types can be found at the European Marine Energy Centre (EMEC) website at the following address: http://www.emec.org.uk/wave_energy_devices.asp

164
*** Development status The development status of the project should be classified using the following technology readiness levels, which were obtained from the U.S. department of energy website at the following address: http://www1.eere.energy.gov/water/hydrokinetic/usingDB.aspx TRL 1-3: Discovery / Concept Definition / Early Stage Development, Design and Engineering TRL 1-2: These are the lowest levels of technology readiness. Scientific research begins to be translated into applied research and development where basic principles are observed and reported. Technology concept and application are formulated and investigated through analytic studies and in-depth investigations of principal design considerations. This stage is characterized by paper studies, concept exploration, and planning. TRL 3: In this stage, active research is initiated, including engineering studies and laboratory studies to physically validate analytical predictions of separate elements of the technology. The purpose of this stage is to evaluate, insofar as possible, the scientific or technical merit and feasibility of ideas that appear to have commercial potential. TRL 4: Proof of Concept In this stage basic technological components of a sub-scale model are integrated to validate design predictions and system level functionality. The models, or critical subsystems, are tested in a laboratory environment. This TRL represents early stage proof-of-concept system or component development, testing and concept validation. In this stage, critical technology elements are developed and tested in a laboratory environment. It is envisioned that scale models will be at 1:10 scale or smaller. TRL 5/6: System Integration, and Technology Laboratory Demonstration TRL 5: At this level, basic technological components are fabricated at a scale relevant to full scale and integrated to establish and verify subsystem and system level functionality and preparation for testing in a simulated environment. TRL 6: At this level, representative model or prototype system at a scale relevant to full scale, which is beyond that of TRL 5, is tested in a relevant environment. This stage represents a major step up in a technology's demonstrated readiness and risk mitigation and is the stage leading to open water testing. At this stage device, system, and subsystem level interfacing/integration testing represent a vital stage in technology development, and must be demonstrated. Models should be at a relevant scale (1:1 – 1:5) to reflect the challenges and realities of the full scale (1:1) system. Model testing is to be performed in a test facility

165
capable of producing simulated waves/currents and other operational conditions while monitoring device response and performance. Furthermore, the devices foundation concept shall be incorporated and demonstrated. TRL 7/8: Open Water System Testing, Demonstration, and Operation TRL 7: At this level, the prototype scale components and subsystems are fabricated and integrated to establish and verify subsystem and system level functionality and preparation for testing in an open water operational environment to verify expected operation and fine tune the design prior to deployment in an operational demonstration project. TRL 8: At this level, the prototype in its final form (at or near full scale) is to be tested, and qualified in an open water environment under all expected operating conditions to demonstrate readiness for commercial deployment in a demonstration project. Testing should include extreme conditions. At this stage, the device model scale is expected to be at or near full scale (1:1 – 1:2). Testing may be initially performed in water at a relatively benign location, with the expectation that testing then be performed in a fully exposed, open water environment, where representative operating environments can be experienced. The final foundation/mooring design shall be incorporated into model testing at this stage. DOE TRL 9: Commercial-Scale Production / Application At this stage, the actual, commercial-scale system is proven through successful mission operations, whereby it is fielded and in-use in commercial application. This stage represents an in-service application of the technology in its final form and under mission condition **** Wave energy absorption performance The wave energy absorption performance should be based on numerical simulation or random wave model tests. Useful information about how to convert data that is characterized by mean zero-crossing period to peak period characterization and how to extrapolate simulated or tested performance data to other sea states is discussed on pages 9 and 10 in the EPRI Guidelines for Preliminary Estimation of Power Production by Offshore Wave Energy Conversion Devices. This can be found at the following address: http://oceanenergy.epri.com/attachments/wave/reports/001_WEC_Power_Production.pdf

166
Appendix 5: WEC device list of developers
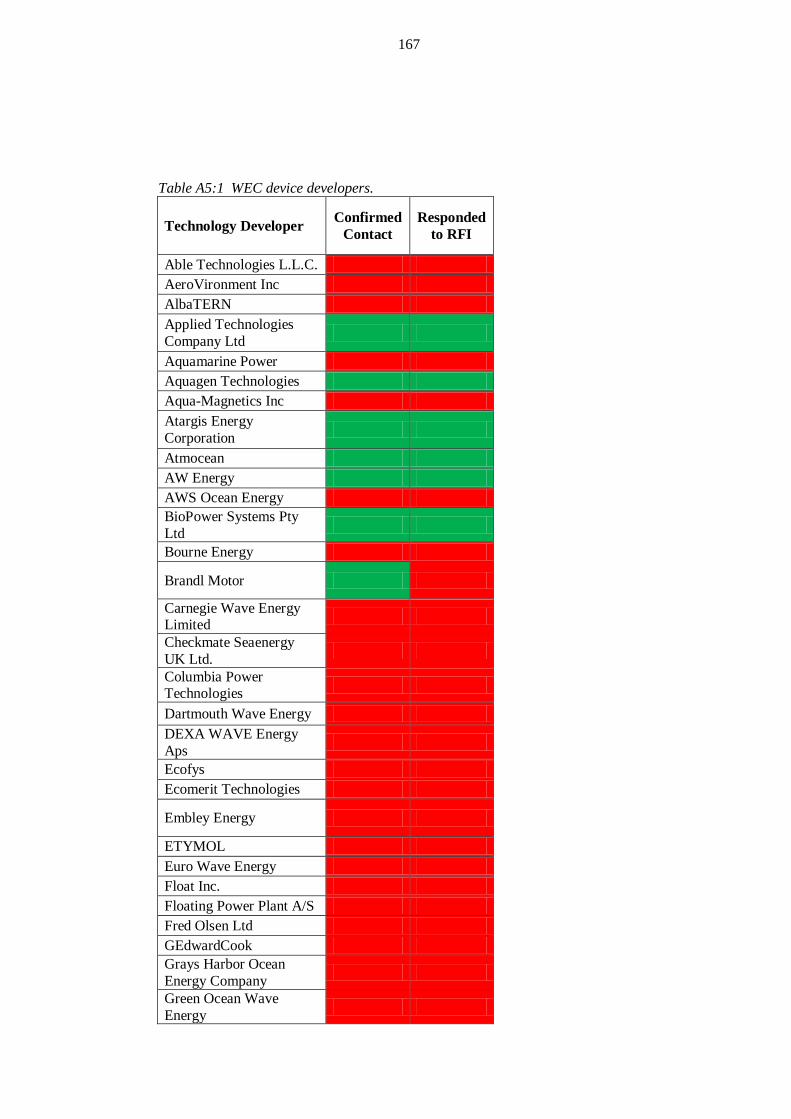
167
Table A5:1 WEC device developers.
Technology Developer Confirmed Contact
Responded to RFI
Able Technologies L.L.C. 0 0 AeroVironment Inc 0 0 AlbaTERN 0 0 Applied Technologies Company Ltd 1 1
Aquamarine Power 0 0 Aquagen Technologies 1 1 Aqua-Magnetics Inc 0 0 Atargis Energy Corporation 1 1
Atmocean 1 1 AW Energy 1 1 AWS Ocean Energy 0 0 BioPower Systems Pty Ltd 1 1
Bourne Energy 0 0
Brandl Motor 1 0
Carnegie Wave Energy Limited 0 0
Checkmate Seaenergy UK Ltd. 0 0
Columbia Power Technologies 0 0
Dartmouth Wave Energy 0 0 DEXA WAVE Energy Aps 0 0
Ecofys 0 0 Ecomerit Technologies 0 0
Embley Energy 0 0
ETYMOL 0 0 Euro Wave Energy 0 0 Float Inc. 0 0 Floating Power Plant A/S 0 0 Fred Olsen Ltd 0 0 GEdwardCook 0 0 Grays Harbor Ocean Energy Company 0 0
Green Ocean Wave Energy 0 0

168
Greencat Renewables 0 0 Hann-Ocean 1 1 HidroFlot SA 0 0 Indian Wave Energy Device 0 0
Instituto Superior Tecnico 0 0 Intentium AS 1 0 Interproject Service (IPS) AB 0 0
Kinetic Wave Power 0 0 Langlee Wave Power 0 0 Leancon Wave Energy 0 0 Motor Wave 1 1 Navatek Ltd 0 0 Neptune Renewable Energy Ltd 0 0
Nodding Beam = Power 0 0 Ocean Energy Industries, Inc. 1 1
Ocean Energy Ltd 0 0 Ocean Harvesting Technologies 1 1
Ocean Motion International 0 0
Ocean Power Technologies 0 0
Ocean Wave Energy Company 1 1
Oceanlinx 1 1 Offshore Islands Limited 0 0 Offshore Wave Energy Ltd 0 0
Ocean Wave and Wind Energy (OWWE) - INNOVAKO
1 1
OWC Power 1 0 Pelagic Power AS 0 0 Pelamis Wave Power 1 0 PerpetuWave Power Pty Ltd 1 1
Pontoon Power 0 0 Protean Energy Limited 0 0 Renewable Energy Pumps 1 1
Resolute Marine Energy, Inc 1 1
Sara Ltd 0 0

169
SDE 1 0
Seabased AB 0 0
SeaNergy 1 0
Sea Power Ltd 1 1 Seatricity 1 1 Seawood Designs Inc 1 1 Straumekraft AS 0 0 Swell Fuel 1 1 Trident Energy Ltd, Direct Thrust Designs Ltd 1 1
Vigor Wave Energy AB 1 1 Voith Hydro Wavegen 1 1 Wave Dragon 1 0 Wave Energy AS 0 0 Wave Energy Fyn 1 1 Wave Energy Technologies Inc. 0 0
Wave Star Energy ApS 1 1 Waveberg Development 1 1 WaveBob Limited 0 0 WavePiston 1 1 Waves4Power 1 1 Wello OY 1 1 Weptos 0 0

170
Appendix 6: WEC device responses

171
Table A6:1 WEC device basic information.
Technology Developer Technology Name Device
Type Country Rated Power (kW)
Applied Technologies Company Ltd
Float Wave Electric Power Station G Russia 10-12000
AquaGen Technologies SurgeDrive B Australia 40000
Atargis Energy Corporation Cycloidal Wave Energy Converter G USA 5000
Atmocean Wave Energy/Sequestration Technology ("WEST") B USA 1000
AW-Energy Oy WaveRoller C Finland 500 BioPower Systems Pty Ltd
bioWAVE C Australia 1000
Hann-Ocean Energy Pte Ltd Drakoo G Singapore 4-1000
MotorWave group MotorWave G Hong
Kong 16
Ocean Energy Industries, Inc. WaveSurfer B USA 0.5-
10000 Ocean Harvesting Technologies AB
Ocean Harvester B Sweden 100-150
OWWE - INNOVAKO Floating Bridge - Norway -
OWWE - INNOVAKO OWWE-Rig E Norway 5000
OWWE - INNOVAKO Wave Pump-Rig B Norway -
OWECO Ocean Wave Energy Company
OWEC® Ocean Wave Energy Converter B USA 30-
2150
Oceanlinx Ltd greenWAVE/ogWAVE/blueWAVE D Australia 500-2500
PerpetuWave Power Pty Ltd Wave Harvester A / B Austrailia 850-
1500 RESEN ENERGY LOPF wave energy buoys B Denmark 300
Resolute Marine Energy, Inc
SurgeWECTM C USA 30
Sea Power Ltd Sea Power Platform A Ireland 3750 Seatricity Oceanus A/B UK 30-300 Seawood Designs Inc SurfPower B Canada 300

172
Shamil Ayntrazi
Wind, Wave, Tidal and Deep Sea Water Air Conditioning G USA 90
Trident Energy Ltd Wave Energy technology A UK 40-150
Vigor Wave Energy AB Vigor Wave Energy Converter G Sweden 3-
100000 Voith Hydro Wavegen - D Scotland 18.5-
132 Waveenergyfyn Crestwing G Denmark 200 Wavestar A/S Wave Star B Denmark 600 Waveberg Development Waveberg A USA 125
WavePiston ApS WavePiston G / A Denmark 30-
1000 W4P Waves4Power AB
WaveEL-buoy B Sweden 250
Wello Ltd. Penguin G Finland 1000 In the table, the device types are identified as follows: A= Attenuator, B=Floating point absorber, C=Oscillating wave surge converter, D=Oscillating water column, E = Overtopping/terminator, F=Submerged pressure differential and G=Other designs.

173
Company Applied Technologies Company Ltd Country Russia Web address www.atecom.ru
Technology Name Float Wave Electric Power Station (FWEPS)
Device Type ** A) Attenuator B) Point Absorber C) Oscillating Wave Surge Converter D) Oscillating Water Column E) Overtopping/Terminator Device F) Submerged Pressure Differential G) Other Designs
G: Matched Load
Features / Design principle
The FWEPS concept uses the advanced approach when the process
of energy conversion is based on efficient interaction of wave energy
source and oscillatory loading mechanism intrinsic for the case. The
module of FWEPS is a vertically oriented, oblong axisymmetrical
capsule‐float located on sea surface. Inside the capsule there are a
mechanical converter consisting of an oscillatory system and drive; an
electric generator and energy accumulator. Under waves effect the
capsule‐float and inner oscillatory system of a mechanical converter are
in continuous oscillatory motion, while the drive engaged with the
system provides a continuous spin‐up of an electric generator. Owing to its peculiarity, the device is matchable
with outer wave space that gives the most effective mode for energy taking‐off and sustainable operation at varying wave harsh conditions.
Depending on the mission it is possible to develop both a single
modular FWEPS for output power up to 50 kW and multi‐modular plant
designed for the total electric power of the order of some dozens of
megawatts. Development status *** TRL 1-3, TRL 4, TRL 5/6, TRL 7/8 or TRL 9 TRL 4

174
Description of any and all prototypes (including test facility used or location of testing, dates, and hours of operation)
FWEPS scaled models were tested in the laboratory and seakeeping basin.
The research has shown that: • FWEPS using an oscillatory drive as the main unit enables to be considered a perspective device for wave energy conversion to electricity and owing to
its features and arrangement advantages it can secure the best
condition for effective wave energy taking‐off.
• The mechanical actuator with an oscillatory system being one of its
main parts can be effectively used as a drive for an electric generator in the
given type of energy converter. • The study of FWEPS model
irregular‐sea behavior at Sea States 4…5 numbers performed in the sea keeping basin with wavemaker has
demonstrated the device survivability in stormy condition. As a whole the research has shown that the device is
basically serviceable for effective wave energy conversion and
survivable in stormy condition.
Next development steps
Phase 1: Development of full scaled 10…50 kW FWEPS module (2.0 ÷
2.5 years). Phase 2: Development of
multimodule grid installation of not less than two megawatt output power
(3 ÷ 4 years). Power take off Oscillatory drive‐actuator
Dimensions The 10 kW FWEPS module of cylindrical shape is of 2.5 m in diameter and 12 m in length.
Centerline device spacing for multiple devices (m) It depends on rated power of module and multimodule installation capacity.
Weight of super structure (ton) For the 10 kW module: 20 (mainly
ballast of metal products waste dominantly)
Weight of power take off equipment (ton) For the 10 kW module: 2 Min installation depth (m) 40 Max installation depth (m) No limitation. Design lifetime (years) 20…30
Rated power (kW) of commercial unit
Depending on the mission it is possible to develop both a single
modular FWEPS for output power up to 50 kW and multi‐modular plant

175
designed for the total electric power of the order of some dozens of
megawatts. Wave energy absorption performance (kW) (before losses in conversion to electric power) as a function of significant wave height and peak wave period ****
See below
Source of wave energy absorption performance (numerical simulations or random wave model tests)
Numerical simulations and wave model tests
Estimated date commercially available 2015‐01
Estimated production cost per rated unit (EUR) The cost of power units will be not
more than 2500 EUR/kW, depending on place and conditions of operation.
Have environmental impact studies been performed
Yes, preliminary. Wide application of FWEPS will facilitate the removal of reasons aggravating the hotbed and climate warming up effects, thus
promoting the environment rehabilitation and life improvement.
Discuss the survivability of the device and whether or not it has been tested.
The study of FWEPS model irregular‐sea behavior at Sea States 4…5
numbers performed in the sea keeping basin with wavemaker has
demonstrated the device survivability in stormy condition. One of FWEPS competitive advantages is reliability
and long useful life because of waterproof capsulefloat protects
elements of the device from corrosive attack of sea water and its vapour.
Technical publications See Below Figures/photographs of device have been attached to reply
Yes photographs of device are given in Appendix.
Is it possible to combine this device with a fjord crossing that implements a suspension bridge, floating bridge, or submerged floating tunnel. If so, how?
This device is best suited for offshore applications and it is possible to combine it with a fjord crossing
structure.
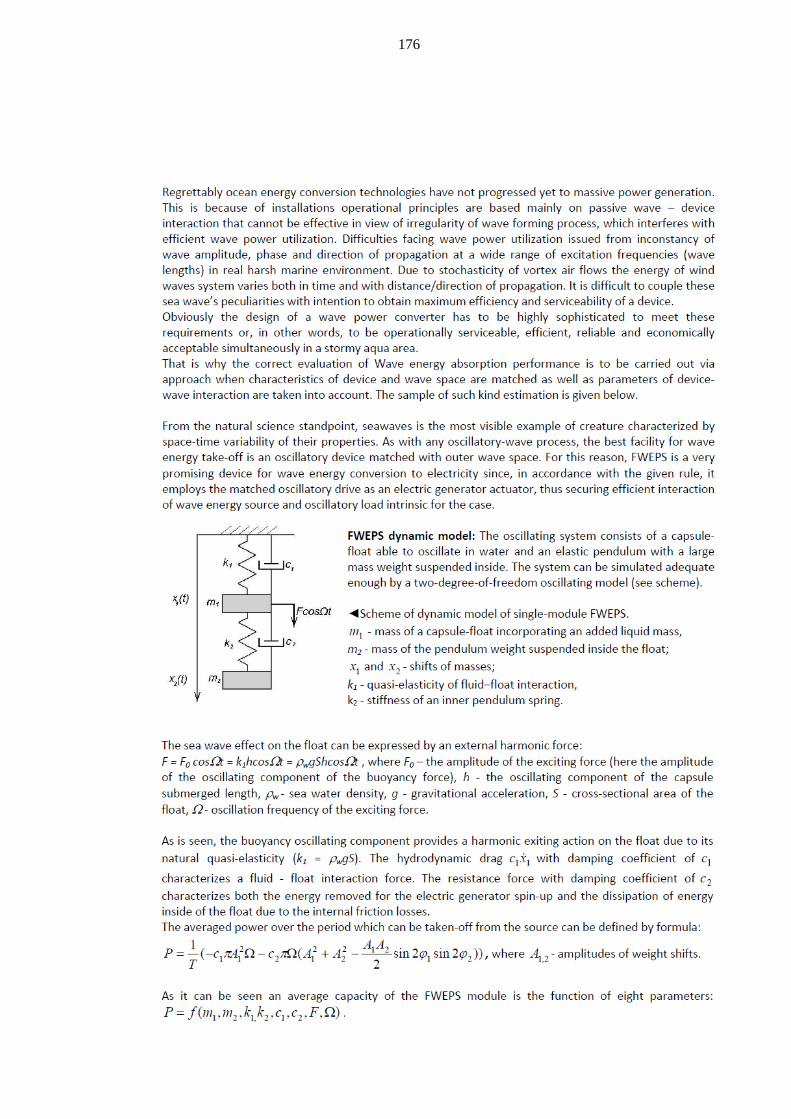
176

177

178
1. Temeev A.A. High Efficient Ecologically Pure Wave Electric Power Stations and Its Applications, Proceedings of the 32‐th Intersociety Energy Conversion Engineering Conference. 1997. Vol.3, p.2001‐ 2004, Honolulu, Hawaii, USA. 2. Temeev A.A. and Sorokodoum E.D.. Unsteady Effects in Oscillatory Body – Water Interaction. Proceedings of the Conference the 4‐th European Wave Energy Conference, December 4–6, 2000, Aalborg, Dk. 3. Temeev A.A., Antufyev B.A., Temeev S.A. Simulation of Oscillatory Drive for Float Wave Energy Converter. Proceedings of the Fifth European Wave Energy Conference, September 17th‐20th 2003, Cork, Ireland. 4. Temeev A.A., Belokopytov V.P., Temeev S.A. Floating Wave Energy Converter and Electrolytic Hydrogen Production Integrated System. Proceedings of the World Renewable Energy Congress VIII, 29 August – 3 September, 2004. Denver, Colorado, USA. 5. Alexander A. Temeev, Victor P. Belokopytov, Sergey A. Temeev. An Integrated System of Floating Wave Energy Converter and Electrolytic Hydrogen Producer. Journal Renewable Energy 31 (2006) 225‐239, © Elsevier Ltd. 6. Alexander Temeev, Oleg Sladkov, Sergey Temeev. Dynamic model of oscillatory drive for Floating Wave Energy Converter. Proceedings of the tenth World Renewable Energy Congress, 19‐25 July 2008, Glasgow, Scotland. 7. Temeev A.A., Sladkov O.S., Temeev S.A. Dynamic Model of a Float Waves Energy Converter // Thermal Engineering, 2008, Vol. 55, No. 12, pp. 1017–1025. ISSN 0040‐6015, © Pleiades Publishing, Inc.
Company AquaGen Technologies

179
Country Australia Web address www.aquagen.com.au
Technology Name SurgeDrive
Device Type ** A) Attenuator B) Point Absorber C) Oscillating Wave Surge Converter D) Oscillating Water Column E) Overtopping/Terminator Device F) Submerged Pressure Differential G) Other Designs
B
Features / Design principle
As waves pass the buoyancy units of a SurgeDrive® wave farm, they move in oscillation and the system transfers the pure wave forces out of the water, via tension transfer elements. From there, the energy conversion module is able to use these forces to
generate electricity or desalinated water, using an innovative mixture of design and 'off the shelf' components. This dramatically simplifies the
capture of wave energy because most components are above water and underwater components are
minimised and simplified. This leads to a significant reduction in capital expenditure (less expensive,
corrosion resistant materials required), maintenance (hence lower electrical / desal generation costs)
whilst also enabling the flexibility for the system to not only survive storms but to continue to generate
during them. Development status *** TRL 1-3, TRL 4, TRL 5/6, TRL 7/8 or TRL 9
TRL 7/8
Description of any and all prototypes (including test facility used or location of testing, dates, and hours of operation)
1. Small scale wave flume model testing, 2009/10, Monash University, Melbourne, Australia
2. Demonstration Trial of 1.5kw unit on Lorne pier, Victoria, Australia Nov 2010
Next development steps
Currently raising capital for next stage of development - a Full-Scale (limited expension) pilot demonstration. This will finalise and test the final full scale coponentry prior to the first large scale
commercial wave farm.
Power take off Hydraulic/Electric or Hydraulic/Desalinated water options
Dimensions
full size buoyancy units are 6m diameter each. 100's of these are tethered back to a central platform,
a purpose-built pier or straight back to land to generate megawatts of electricity or gigalitres of
desalinated water. Centerline device spacing for multiple devices (m) 15m between buoyancy units in 20m water depth

180
Weight of super structure (ton) depends on number of buoyancy units tying into Energy Conversion Module
Weight of power take off equipment (ton)
depends on number of buoyancy units tying into Energy Conversion Module
Min installation depth (m) 10 Max installation depth (m) 50 Design lifetime (years) 25
Rated power (kW) of commercial unit
40000kw or 40Mw for 400 buoyancy units in 45kw/m wave region
This is just an example as it depends on local wave resource and marine area available.
Wave energy absorption performance (kW) (before losses in conversion to electric power) as a function of significant wave height and peak wave period ****
The energy output of our technology is very high but is not publically available at this stage but can be
disclosed privately under an NDA.
Source of wave energy absorption performance (numerical simulations or random wave model tests)
scale model tests.
Estimated date commercially available 2014-01
Estimated production cost per rated unit (EUR) USD $50 million for the rated 40Mw nameplate unit
Have environmental impact studies been performed Yes, for our Lorne Pier Demonstration
Discuss the survivability of the device and whether or not it has been tested.
During extreme storm conditions, the SurgeDrive® control system automatically pulls the buoyancy
units under the water to avoid storm damage and yet enable the continued generation of power.
Technical publications
N.Boyd, 'The Development of Wave Energy as a Viable Renewable Source', All-Energy Conference
and Exhibition, Oct 2011 EcoGen 2011, Sept 2011
Figures/photographs of device have been attached to reply Yes
Is it possible to combine this device with a fjord crossing that implements a suspension bridge, floating bridge, or submerged floating tunnel. If so, how?
This technology is suited to applications where there is an existing waterbourne strucutre such as a pier or bridge, provided that there are ocean waves passing close to that structure as it is not a tidal but a wave
energy device.

181

182
Company Atargis Energy Corporation Country USA Web address www.atargis.com
Technology Name Cycloidal Wave Energy Converter
Device Type ** A) Attenuator B) Point Absorber C) Oscillating Wave Surge Converter D) Oscillating Water Column E) Overtopping/Terminator Device F) Submerged Pressure Differential G) Other Designs
G. Lift based, fully submerged wave termination device with direct wave-to-shaft power conversion
Features / Design principle two hydrofoils that rotate around a shaft alinged with the wave crests and operated under feedback control
achieve wave termination Development status *** TRL 1-3, TRL 4, TRL 5/6, TRL 7/8 or TRL 9
TRL 3 with TRL 4 work in progress
Description of any and all prototypes (including test facility used or location of testing, dates, and hours of operation)
A 1:300 scale model was tested in a wave flume in 2010-2011. Presently, a 1:10 scale model is being
tested in a 3D wave basin advancing this technology to TRL 4
Next development steps TRL 5 work will start in the second half of 2012,
and open ocean 1/4 scale tests are planned for mid-2013
Power take off Generator, either with gear box or low speed direct drive
Dimensions wave climate dependent, invisicid optimal diameter
is about 30% of a wave length. Power output increases linearly with hydrofoil span
Centerline device spacing for multiple devices (m) 0
Weight of super structure (ton) 75 Weight of power take off equipment (ton) 45
Min installation depth (m) 25 Max installation depth (m) 100 Design lifetime (years) 20 Rated power (kW) of commercial unit 5000 Wave energy absorption performance (kW) (before losses in conversion to electric power) as a function of significant wave height and peak wave period ****
The data requested in the wave performance tab is currently unpublished and proprietary. We have
published an efficiency of >70% at the design point including viscous losses, and an invisicd efficiency
of >95% which is experimentally confirmed. Source of wave energy absorption performance (numerical simulations or random wave model tests)
Both

183
Estimated date commercially available 2016
Estimated production cost per rated unit (EUR)
5-10M Euro for a 5MW unit depending on site specifics, deployed
Have environmental impact studies been performed No
Discuss the survivability of the device and whether or not it has been tested.
The CycWEC can be feathered in a storm, as well as be submerged deeper into the ocean to prevent storm damage. This will be experimentally demonstrated
in TRL5
Technical publications See publication list at: http://atargis.com/MoreInfo.html
Figures/photographs of device have been attached to reply No, please refer to above web site
Is it possible to combine this device with a fjord crossing that implements a suspension bridge, floating bridge, or submerged floating tunnel. If so, how?
Yes, the CycWEC can be attached to the substructure of a bridge if desired
Source - www.atargis.com

184
Company Atmocean, Inc. Country USA Web address www.atmocean.com
Technology Name Wave Energy/Sequestration Technology ("WEST")
Device Type ** A) Attenuator B) Point Absorber C) Oscillating Wave Surge Converter D) Oscillating Water Column E) Overtopping/Terminator Device F) Submerged Pressure Differential G) Other Designs
B (array)
Features / Design principle
Hydraulic system. Onshore generators. Patent-pending variable sea anchors suspended beneath each pump provide the resistance against buoy rising, to create the pressure fed into lateral pressure line. This means the pumps do not need individual moorings - a big cost saving. By operating in low waves (under 1m), annual availability is above 90% most locations. To prevent overstressing, above 3.5m wave the forces are capped. Designed for low cost - containerized for shipping - deployed from moving vessel no undersea operations needed - array moorings at each end.
Development status *** TRL 1-3, TRL 4, TRL 5/6, TRL 7/8 or TRL 9
TRL 5/6 or 7/8
Description of any and all prototypes (including test facility used or location of testing, dates, and hours of operation)
We have conducted 22 ocean tests of subsystems. Most recent sea trial at California Polytechnic State University 4 months 1/2 scale system, characterize input/output, evaluate durability, gain data on biofouling.
Next development steps
We are now completing the full-scale design drawings which are getting cost quotes from suppliers. We expect to initiate our environmental impact study in July 2012 by Rutgers University Coastal Ocean Observing Laboratory. This will be a 3 month analysis using a 10-pump moored array in the Atlantic 60km east of Tuckerton NJ. This system will generate power locally (on a small barge or raft) since transmitting the hydraulic pressure 60km to shore is not feasible for this pilot scale unit.
Power take off Hydraulic using seawater

185
Dimensions
Each WEST unit is 20m deep, weighing about 1.5 metric tons excluding connecting hose. Adjacent
WEST units are spaced 30m apart. A one MW array comprises 50 connected units. The connecting hose depth is ~10m. At end of array, the hose is allowed to sink to the seafloor where it extends (not buried)
to shoreline. Beach crossing is a rigid pipe. The pressure line is then brought to the Power house
Pelton motor connected to generator. Centerline device spacing for multiple devices (m) 30m preliminary
Weight of super structure (ton) 0.5 metric tons approx. Weight of power take off equipment (ton) onshore Pelton motor weight tbd
Min installation depth (m) 30m preliminary Max installation depth (m) 200m preliminary
Design lifetime (years) overall 20 years. Some parts require periodic refurbishing each 1 to 5 years.
Rated power (kW) of commercial unit one MW per array of 50 pumps Wave energy absorption performance (kW) (before losses in conversion to electric power) as a function of significant wave height and peak wave period ****
See output page
Source of wave energy absorption performance (numerical simulations or random wave model tests)
Numerical calculations supported by Cal Poly sea trial data
Estimated date commercially available 2013
Estimated production cost per rated unit (EUR)
Under US $ one million per MW (50 pumps, connecting hoses, moorings, assembly, deployment,
and Pelton motor but not shipping costs, onshore generator or power conditioning)
Have environmental impact studies been performed Upcoming this summer-fall
Discuss the survivability of the device and whether or not it has been tested.
The system automatically submerges in waves above about 3.5m, to protect against storm damage and ensure stress limits are not exceeded. No external signal or forecast is needed. This function has not
yet been tested. Technical publications None Figures/photographs of device have been attached to reply Yes
Is it possible to combine this device with a fjord crossing that implements a suspension bridge, floating bridge, or submerged floating tunnel. If so, how?
Yes. The fjord crossing can act as one end of the array mooring, so it is simple to extend the array outward from the crossing and install a seabed
mooring for the other end of the array. If a floating bridge or submerged tunnel, our hydraulic pressure
line could be run adjacent to this structure rather

186
than lie on the seafloor.
Wav
e en
ergy
con
vers
ion
abso
rptio
n pe
rfor
man
ce (k
W) a
s a fu
nctio
n of
sign
ifica
nt w
ave
heig
ht (H
s) an
d pe
ak w
ave
perio
d (T
p)W
e ca
lcul
ate
the
volu
me
pum
ped
per w
ave
base
d on
the
cylin
der d
imen
sion
of 0
.2m
dia
met
er, b
y 2.
5m h
eigh
t, gi
ving
a u
sefu
l vol
ume
of 0
.078
5 cu
bic
met
ers p
er fu
ll st
roke
. In
wav
es le
ss th
an 2
.5 m
hei
ght,
the
volu
me
pum
ped
will
be
prop
ortio
nal t
o th
is cy
linde
r vol
ume.
34
56
78
910
1112
1314
1516
1718
1920
10.0
55
41
33
27
24
21
18
16
15
14
13
12
11
10
10
9
9
8
9.5
55
41
33
27
24
21
18
16
15
14
13
12
11
10
10
9
9
8
9.
0
55
41
33
27
24
21
18
16
15
14
13
12
11
10
10
9
9
8
8.5
55
41
33
27
24
21
18
16
15
14
13
12
11
10
10
9
9
8
8.
0
55
41
33
27
24
21
18
16
15
14
13
12
11
10
10
9
9
8
7.5
55
41
33
27
24
21
18
16
15
14
13
12
11
10
10
9
9
8
7.
0
55
41
33
27
24
21
18
16
15
14
13
12
11
10
10
9
9
8
6.5
55
41
33
27
24
21
18
16
15
14
13
12
11
10
10
9
9
8
6.
0
55
41
33
27
24
21
18
16
15
14
13
12
11
10
10
9
9
8
5.5
55
41
33
27
24
21
18
16
15
14
13
12
11
10
10
9
9
8
5.
0
55
41
33
27
24
21
18
16
15
14
13
12
11
10
10
9
9
8
4.5
55
41
33
27
24
21
18
16
15
14
13
12
11
10
10
9
9
8
4.
0
55
41
33
27
24
21
18
16
15
14
13
12
11
10
10
9
9
8
3.5
55
41
33
27
24
21
18
16
15
14
13
12
11
10
10
9
9
8
3.
0
55
41
33
27
24
21
18
16
15
14
13
12
11
10
10
9
9
8
2.5
54
.95
41.2
1
32
.97
27.4
8
23
.55
20.6
1
18.3
2
16
.49
14.9
9
13
.74
12.6
8
11
.78
10.9
9
10
.30
9.70
9.
16
8.68
8.
24
2.0
43
.96
32.9
7
26
.38
21.9
8
18
.84
16.4
9
14
.65
13.1
9
11
.99
10.9
9
10
.14
9.42
8.
79
8.24
7.
76
7.33
6.
94
6.59
1.
5
32.9
7
24
.73
19.7
8
16
.49
14.1
3
12
.36
10.9
9
9.
89
8.99
8.
24
7.61
7.
07
6.59
6.
18
5.82
5.
50
5.21
4.
95
1.0
21
.98
16.4
9
13
.19
10.9
9
9.
42
8.24
7.33
6.
59
5.99
5.
50
5.07
4.
71
4.40
4.
12
3.88
3.
66
3.47
3.
30
0.5
10
.99
8.24
6.
59
5.50
4.
71
4.12
3.
66
3.30
3.
00
2.75
2.
54
2.36
2.
20
2.06
1.
94
1.83
1.
74
1.65
0.1
2.
75
2.06
1.
65
1.37
1.
18
1.03
0.
92
0.82
0.
75
0.69
0.
63
0.59
0.
55
0.52
0.
48
0.46
0.
43
0.41
Aver
age
wav
e st
eepn
ess (
m/s
)3
45
67
89
1011
1213
1415
1617
1819
202.
5
0.83
0.
63
0.50
0.
42
0.36
0.
31
0.
28
0.25
0.
23
0.21
0.
19
0.18
0.
17
0.16
0.
15
0.14
0.
13
0.13
2.
0
0.67
0.
50
0.40
0.
33
0.29
0.
25
0.
22
0.20
0.
18
0.17
0.
15
0.14
0.
13
0.13
0.
12
0.11
0.
11
0.10
1.
5
0.50
0.
38
0.30
0.
25
0.21
0.
19
0.
17
0.15
0.
14
0.13
0.
12
0.11
0.
10
0.09
0.
09
0.08
0.
08
0.08
1.0
0.
33
0.25
0.
20
0.17
0.
14
0.13
0.11
0.
10
0.09
0.
08
0.08
0.
07
0.07
0.
06
0.06
0.
06
0.05
0.
05
0.5
0.
17
0.13
0.
10
0.08
0.
07
0.06
0.
06
0.05
0.
05
0.04
0.
04
0.04
0.
03
0.03
0.
03
0.03
0.
03
0.03
0.1
0.
04
0.03
0.
03
0.02
0.
02
0.02
0.
01
0.01
0.
01
0.01
0.
01
0.01
0.
01
0.01
0.
01
0.01
0.
01
0.01
Hs (m)
T p (s
)

187
diameter 0.2 m height 2.5 m
volume pumped per 2.5m wave 0.0785 m^3
kW = liters per minute * pressure (in bar)/600
pressure designed for 21 bar
We base our nominal output on 2.5 wave @ 8 seconds )shown in bold large font in the table).
Our seatrials conducted at California Polytechnic State University last summer demonstrated needed.
that average wave steepness of 0.1 m/s is required to produce the pressure rise
Therefore, in the chart below we exclude kW output for average steepness below 0.1 m/s.
- 10 20 30 40 50 60
3 5 7 9 11 13 15 17 19
kW
Period (Tp - sec)
Atmocean WEST Nominal Output: Hs from 0.5m to 2.5m
(above 2.5m same as 2.5m by design) 2.521.510.5

188

189
Company AW-Energy Oy Country Finland Web address www.aw-energy.com
Technology Name WaveRoller
Device Type ** A) Attenuator B) Point Absorber C) Oscillating Wave Surge Converter D) Oscillating Water Column E) Overtopping/Terminator Device F) Submerged Pressure Differential G) Other Designs
C.
Features / Design principle
WaveRoller sits invisible on the seabed. All techic is inside the foundation under
water, only electical cable come to the shore. Though, grid connection equipment are on shore
Development status *** TRL 1-3, TRL 4, TRL 5/6, TRL 7/8 or TRL 9
TRL7 soon
Description of any and all prototypes (including test facility used or location of testing, dates, and hours of operation)
Many small units in the seawater 2001 - 2005, Prototype in Portugal in 2007 and 2008, power
production 10 kW,
Next development steps Grid connected demonstration unit into the water in April 2012.
Power take off Hydraulic Dimensions 26 m wide,12 high, 15 m long Centerline device spacing for multiple devices (m) 50 m
Weight of super structure (ton) 100 t Weight of power take off equipment (ton) 5 t
Min installation depth (m) 10 m Max installation depth (m) 15 m Design lifetime (years) 20 a Rated power (kW) of commercial unit 500 kW
Wave energy absorption performance (kW) (before losses in conversion to electric power) as a function of significant wave height and peak wave period ****
The efficiency of the hydraulic system is about 60 % (depends of operating point), so 500 kWe unit
absorbs about 830 kW from the waves.
Our flap is controlled all the time wave after wave control loops control the PTO every second and
changes the controller output every second
Source of wave energy absorption performance (numerical simulations or random wave model tests)
Simulations and teank tests

190
Estimated date commercially available June 2015
Estimated production cost per rated unit (EUR) 3 Meur
Have environmental impact studies been performed Yes
Discuss the survivability of the device and whether or not it has been tested.
There are no large waves (freaks) in the depth of 12 m, a flap moves with the wave, the
system can be but put into free wheeling mode, if needed.
Technical publications Figures/photographs of device have been attached to reply Yes
Is it possible to combine this device with a fjord crossing that implements a suspension bridge, floating bridge, or submerged floating tunnel. If so, how?
No
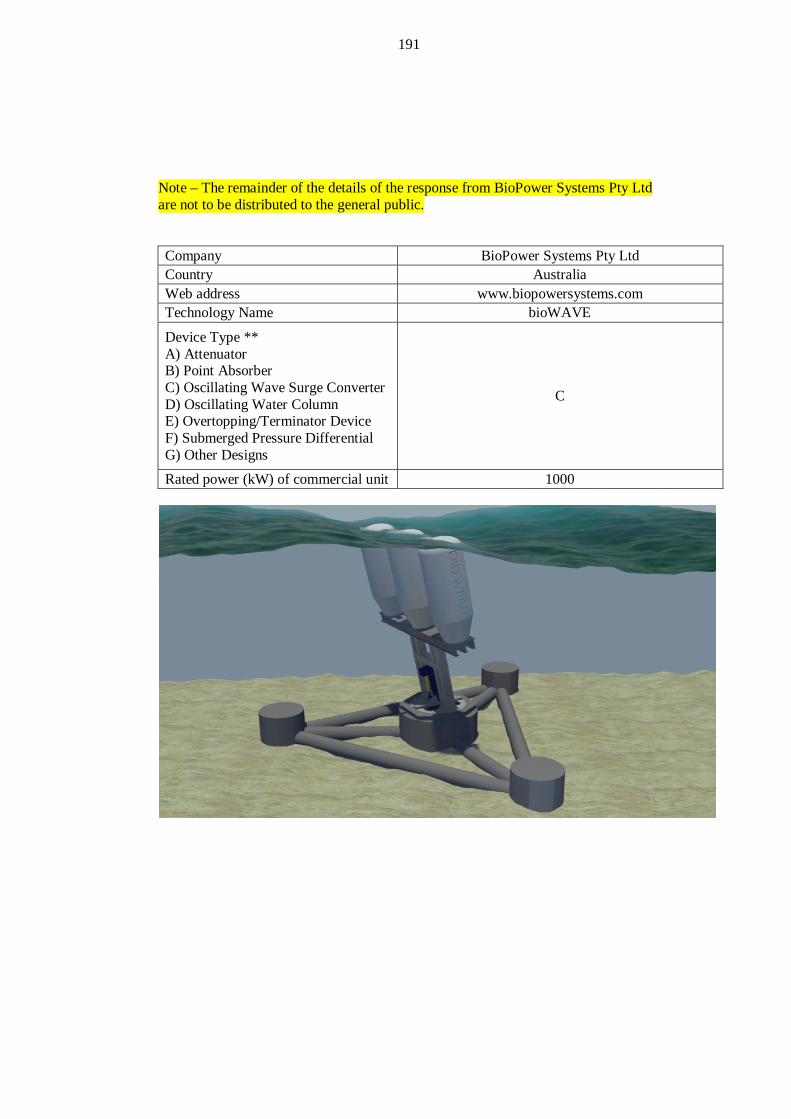
191
Note – The remainder of the details of the response from BioPower Systems Pty Ltd are not to be distributed to the general public.
Company BioPower Systems Pty Ltd Country Australia Web address www.biopowersystems.com
Technology Name bioWAVE
Device Type ** A) Attenuator B) Point Absorber C) Oscillating Wave Surge Converter D) Oscillating Water Column E) Overtopping/Terminator Device F) Submerged Pressure Differential G) Other Designs
C
Rated power (kW) of commercial unit 1000

192
Company Hann-Ocean Energy Pte Ltd Country Singapore Web address www.hann-ocean.com
Technology Name Drakoo
Device Type ** A) Attenuator B) Point Absorber C) Oscillating Wave Surge Converter D) Oscillating Water Column E) Overtopping/Terminator Device F) Submerged Pressure Differential G) Other Designs
G) Twin-Chamber Water Column
Features / Design principle
Drakoo is a patented twin-chamber wave energy convertor that captures both kinetic and potential water energy carried within incident ocean waves
using non-return checkerboard valves and then converts this energy to electricity by a hydro-turbine. Single directional and continuous flow of water goes through the hydro-turbine during entire wave period
and drives the linked permanent magnetic generator/alternator to produce stable electricity.
Development status *** TRL 1-3, TRL 4, TRL 5/6, TRL 7/8 or TRL 9
TRL 7/8
Description of any and all prototypes (including test facility used or location of testing, dates, and hours of operation)
A 1:20 scale model Darkoo-II was tested at NTU's wave flume in Aug-Sep 2010 for 5 days. Three
1:20 scale models were tested at Changi Beach of Singapore in 2009-2010. A full scale prototype was tested at Tuas View sea of Singapore in May 2011
for 14 days and Narec's 8m deep wave flume in July 2011 for 6 days.
Next development steps
We are conducting a 16kW Drakoo Type-B full scale prototyping supported by Singapore
governmental grant followed by further developing a 96kW Drakoo wave farm at Tuas View sea of Singapore. The 1st prototype is expected to be
deployed in July 2012 and the wave farm is expected to be completed in mid 2013.
Power take off Kaplan hydro turbine with single/double regulated impeller
Dimensions Drakoo Type-B: 3mx2.5mx2.5m (4kW); Drakoo Type-R: Dia22mx11m (1MW)
Centerline device spacing for multiple devices (m) 3/50
Weight of super structure (ton) 3.08/250 Weight of power take off equipment (ton) 0.12/5
Min installation depth (m) 1.35/12 Max installation depth (m) 300

193
Design lifetime (years) 20 Rated power (kW) of commercial unit 4/1000 Wave energy absorption performance (kW) (before losses in conversion to electric power) as a function of significant wave height and peak wave period ****
See Power Output Scatter Diagrams projected based on Narec test results
Source of wave energy absorption performance (numerical simulations or random wave model tests)
Narec wave flume tests
Estimated date commercially available Sep 2012
Estimated production cost per rated unit (EUR) 20,000(4kW)/1,800,000(1MW)
Have environmental impact studies been performed Yes
Discuss the survivability of the device and whether or not it has been tested.
A stress-relieving design allows the water to simply overtop into or overflow from the device. Drakoo therefore does not try to stand against the incident
waves or to withhold high internal hydrostatic pressure. Additionally, Drakoo’s structure makes use
of unique flexible valves instead of mechanical hinges structure and is thereby less susceptible to
breakdowns. The probability of breakdowns is further limited, as the many of the components integrated into the Drakoo system are readily
available in the market and therefore have a track record of performance. Drakoo is designed as a
modular system bringing together standard parts and subsystems from mature industries. Not the
components used to build Drakoo are unique, but rather the combination. This allows for a tremendous reduction in cost, while at the same time ensuring a
high quality standard. For instance, Drakoo’s impeller is a turbine type that has been used in hydro power plants for decades. Its gearbox and generator mirror those used in wind turbines. Additionally, the negative impact of a breakdown, should it occur, is
limited by Drakoo’s Plug-n-Run concept. This concept allows the major components, such as the
power take-off system and the Checkerboard Valves, to be replaced within a very short time span.
Technical publications Conference paper in International Symposium on
Low Carbon & Renewable Energy Technology 2011 in Korea
Figures/photographs of device have been attached to reply Yes
Is it possible to combine this device with a fjord crossing that implements a suspension bridge, floating bridge,
Yes. Drakoo utilises a twin chamber principle and does not have any moving parts outside its body.
The Drakoo 'box' can therefore simply be attached to

194
or submerged floating tunnel. If so, how?
other marine structures. Hann-Ocean is currently conducting a prototyping for total 75m floating jetty
with 24 Drakoo Type-B cells (4kW each).
Technical SpecificationProduct Type Type-BProduct Model No. B0004Dimensions 3m x 2.7m x 2.4mPeak Power Output 4 kWGross Weight 3.2 tPower Take-off System Kaplan Turbine
Wave energy conversion absorption performance (kW) as a function of significant wave height (Hs) and peak wave period (Tp)
Wave Height Hs \ Period Tp 1 2 3 4 5 6 7 8 9
1.3 0 1.25 5.83 8.61 8.60 6.78 4.92 3.23 01.2 0 1.25 5.83 8.61 8.60 6.78 4.92 3.23 01.1 0 1.25 5.83 8.61 8.60 6.78 4.92 3.23 01 0 1.25 5.83 8.61 8.60 6.78 4.92 3.23 0
0.9 0 1.01 4.73 6.97 6.96 5.49 3.98 2.61 00.8 0 0.80 3.73 5.51 5.50 4.34 3.15 2.07 00.7 0 0.61 2.86 4.22 4.21 3.32 2.41 1.58 00.6 0 0.45 2.10 3.10 3.09 2.44 1.77 1.16 00.5 0 0.31 1.46 2.15 2.15 1.70 1.23 0.81 00.4 0 0.20 0.93 1.38 1.38 1.08 0.79 0.52 00.3 0 0.11 0.53 0.77 0.77 0.61 0.44 0.29 00.2 0 0.05 0.23 0.34 0.34 0.27 0.20 0.13 0
Capture Width Ratio (CWR) 0.0% 25.5% 79.6% 88.1% 70.4% 46.3% 28.8% 16.5% 0.0%
All rights reserved by Hann-Ocean Energy Pte Ltd

195
Company MotorWave group Country Hong kong Web address www.motorwavegroup.com
Technology Name MotorWave Device Type ** A) Attenuator B) Point Absorber C) Oscillating Wave Surge Converter D) Oscillating Water Column E) Overtopping/Terminator Device F) Submerged Pressure Differential G) Other Designs
G
Features / Design principle MotorWave is composed of modules made of 2 floats.the up and down are transferred to a central
shaft that combines ennergy of all modules.transformation is made by hydrolic
converting into compressed air Development status *** TRL 1-3, TRL 4, TRL 5/6, TRL 7/8 or TRL 9
TRL 8
Description of any and all prototypes (including test facility used or location of testing, dates, and hours of operation)
1;1 scale model for 50cm wave was tested in HK harbor in 2005 1:1 scale for 20cm wave was tested in HKU lab in 2005,1:1 scale model for 1m wave
was tested at sea in hong Kong in 2006 Next development steps waiting for orders Power take off Hydrolic using sea water Dimensions each module is (for 2m) waves 6 m wide and 3 m
long.the final length is between 90 to 300 m Centerline device spacing for multiple devices (m) 1m
Weight of super structure (ton) 2 Weight of power take off equipment (ton) 1
Min installation depth (m) floating Max installation depth (m) floating Design lifetime (years) 50years or more Rated power (kW) of commercial unit 16Kw per module for 2m wave .81Kw for 3m wave Wave energy absorption performance (kW) (before losses in conversion to electric power) as a function of significant wave height and peak wave period ****
N(number of modules)H(wave height)*4/P(period)
Source of wave energy absorption performance (numerical simulations or random wave model tests)
test in wave tank in university
Estimated date commercially available 6 month after order

196
Estimated production cost per rated unit (EUR)
for 2m wave approx 20 000 Euro per module. For 3m wave approx 30 000 Euro per module.for 5m
Have environmental impact studies been performed NO
Discuss the survivability of the device and whether or not it has been tested.
the system is floating and design to take high energy wave
Technical publications see our website Figures/photographs of device have been attached to reply
Is it possible to combine this device with a fjord crossing that implements a suspension bridge, floating bridge, or submerged floating tunnel. If so, how?
Motorwave can be attached to any structure or anchor to any sea bed by cables
Source - www.motorwavegroup.com

197
Company Ocean Energy Industries. Inc. Country USA Web address http://www.oceanenergyindustries.com
Technology Name WaveSurfer
Device Type ** A) Attenuator B) Point Absorber C) Oscillating Wave Surge Converter D) Oscillating Water Column E) Overtopping/Terminator Device F) Submerged Pressure Differential G) Other Designs
B
Features / Design principle
WaveSurfer consists of two bodies, a buoyant body that floats on the surface of water and a submerged body suspended from the buoyant body. The submerged body consists of electric generators and horizontally-aligned rotors.
Development status *** TRL 1-3, TRL 4, TRL 5/6, TRL 7/8 or TRL 9 TRL9
Description of any and all prototypes (including test facility used or location of testing, dates, and hours of operation)
Full scale models are in commercial use for several years at locations around the
world Next development steps Optimization Power take off Rotation
Dimensions Variety of models and configurations.
At least 5 basic models of different sizes.
Centerline device spacing for multiple devices (m) Vary Weight of super structure (ton) Vary Weight of power take off equipment (ton) Vary Min installation depth (m) 25 Max installation depth (m) no strict max Design lifetime (years) Min 30 Rated power (kW) of commercial unit From 0.5kW to 10MW Wave energy absorption performance (kW) (before losses in conversion to electric power) as a function of significant wave height and peak wave period ****
Vary
Source of wave energy absorption performance (numerical simulations or random wave model tests)
real life tests
Estimated date commercially available 2006 Estimated production cost per rated unit (EUR) US $2,000 per kW capacity Have environmental impact studies been performed yes

198
Discuss the survivability of the device and whether or not it has been tested.
WaveSurfer's main power conversion and generation parts are completely
submerged at a depth where water is not affected by the waves. No matter how
significant is a wave action on the water surface, at the same time the water is
calm at a depth of around one-half wavelength of the prevailing waves in
the region. This design results in amazing
survivability of each unit during extreme storms without any damage
that would affect the unit's performance.
Technical publications None Figures/photographs of device have been attached to reply None
Is it possible to combine this device with a fjord crossing that implements a suspension bridge, floating bridge, or submerged floating tunnel. If so, how?
Can't be combined structurally. However the WaveSurfer device(s) can be installed in vicinity of the crossing if so required. Are there any waves in the fjord? Basically WaveSurfer is a deep,
open water system.

199
Source - http://www.oceanenergyindustries.com

200
Company Ocean Harvesting Technologies AB Country Sweden Web address www.oceanharvesting.com
Technology Name Ocean Harvester
Device Type ** A) Attenuator B) Point Absorber C) Oscillating Wave Surge Converter D) Oscillating Water Column E) Overtopping/Terminator Device F) Submerged Pressure Differential G) Other Designs
B
Features / Design principle
The Ocean Harvester captures energy from the rise of each wave with the use of a winch system, which provides sufficient length of stroke for the largest wave on the selected site. A patented mechanical PTO with a counterweight efficiently converts the highly fluctuating energy that is absorbed from the
waves into a smooth power and force through system. This way the PTO and power electronics can be sized for the average energy instead of the peak energy. The key advantage with this is considerable
reduction in the cost of the PTO, as well as high efficiency and load factor of the generator and power
electronics, all together resulting in low cost of energy.
Development status *** TRL 1-3, TRL 4, TRL 5/6, TRL 7/8 or TRL 9
TRL 4, design of 1/2 model of a 100 kW unit is completed, manufacturing will start in may 2012.
Description of any and all prototypes (including test facility used or location of testing, dates, and hours of operation)
Several scale 1:40 tests of simplified models have been performed in a water laboratory at DHI in
Hörsholm Denmark 2009 - 2011.
A 1:10 scale prototype of the PTO and control system has been tested in a test rig setup running
irregular waves. Power smoothing capabilities has been demonstrated with very promising results.
Karlskrona Sweden 2009-2011.
A 1:2 Scale sea trial model design of the Ocean Harvester is completed.
Next development steps
Manufacturing of the 1:2 scale model will start in Q2 2012 and sea trials is planned in 2013 at Risör in
co-operation with Fobox AS / Fred Olsen Ltd.
The design work for scaling up the system to full scale (100 kW) will be started in Q3 2012.
Power take off Patented mechanical PTO using a counterweight for powersmoothing.

201
Dimensions
The buoy of the 1:2 scale model is 12x5,6x1,4 (LWH).
The estimated size of the full scale model is thus
24x11,2x2,8 (LWH). Centerline device spacing for multiple devices (m) Approx. 50
Weight of super structure (ton) Approx. 85 Weight of power take off equipment (ton) Approx. 25
Min installation depth (m) Approx. 20 Max installation depth (m) Approx. 100 Design lifetime (years) 20 Rated power (kW) of commercial unit Approx. 100-150
Wave energy absorption performance (kW) (before losses in conversion to electric power) as a function of significant wave height and peak wave period ****
An unlimited power matrix has been provided in the wave performance tab. The device rated power is selected close to the most frequent sea state at the installation site rather than less frequent and more
energetic sea state. This is done in order to increase the electrical efficiency and load factor of the power
electronics, as well as reducing the cost of power electronics and cabling. The device rated power can be maintained in stronger sea states with the use of a clutch that operates in a way that limits the energy
capture.
It should be noted that one of the main challenges with wave power is to achive high efficiency in the process of converting the highly fluctuating energy
absorbed from the wave motion into electricity.
Numerical modeling of the Ocean Harvester efficiency have been done and shows that approx.
75% mechanical efficiency, 90% electrical efficiency and 60% load factor as an annual average
on a site with good wave conditions.
Please provide wave data for a more detailed analysis of the device performance at the intended
installation site. Source of wave energy absorption performance (numerical simulations or random wave model tests)
Numerical simulations and random wave model tests.
Estimated date commercially available 2016
Estimated production cost per rated unit (EUR)
Levelized cost of Energy presented as a learning curve included in the attached presentation.
Have environmental impact studies been performed No

202
Discuss the survivability of the device and whether or not it has been tested.
Winch systems reduce structural strain (end limits are never reached). The counterweight limits the mechanical peak loads/torque in the system in all
wave conditions. The Power take-off can be disengaged to put the wave energy converter in
standby/failsafe mode to survive the roughest sea states. Position moorings (secondary moorings) are
used to keep the position. Technical publications Figures/photographs of device have been attached to reply Yes
Is it possible to combine this device with a fjord crossing that implements a suspension bridge, floating bridge, or submerged floating tunnel. If so, how?
Mentioned submerged structures could be used as anchoring points for standalone units, reducing the cost of anchoring for the WEC array installation.
The PTO solution developed by OHT could also be
integrated into structures near the surface. This could make possible energy absorption in both rising and descending wave, which is an advantage compared to a stand-alone unit that only absorbs energy in the
rising wave.
OHT is open for discussion regarding both stand-alone units and integration of the WEC system into support structures located near the surface. We need
more information about the structures in order to present how this could be done in more detail.
Source - www.oceanharvesting.com
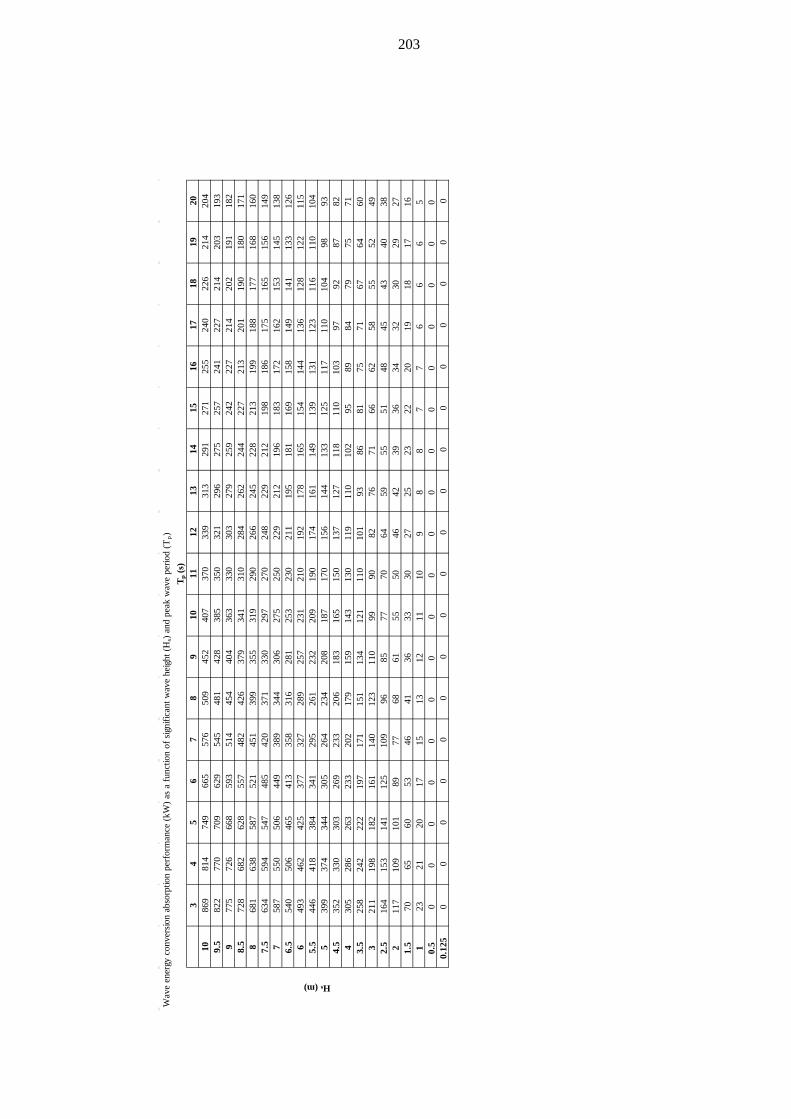
203
Wav
e en
ergy
con
vers
ion
abso
rptio
n pe
rfor
man
ce (k
W) a
s a
func
tion
of s
igni
fican
t wav
e he
ight
(Hs)
and
peak
wav
e pe
riod
(Tp)
34
56
78
910
1112
1314
1516
1718
1920
1086
981
474
966
557
650
945
240
737
033
931
329
127
125
524
022
621
420
49.
582
277
070
962
954
548
142
838
535
032
129
627
525
724
122
721
420
319
39
775
726
668
593
514
454
404
363
330
303
279
259
242
227
214
202
191
182
8.5
728
682
628
557
482
426
379
341
310
284
262
244
227
213
201
190
180
171
868
163
858
752
145
139
935
531
929
026
624
522
821
319
918
817
716
816
07.
563
459
454
748
542
037
133
029
727
024
822
921
219
818
617
516
515
614
97
587
550
506
449
389
344
306
275
250
229
212
196
183
172
162
153
145
138
6.5
540
506
465
413
358
316
281
253
230
211
195
181
169
158
149
141
133
126
649
346
242
537
732
728
925
723
121
019
217
816
515
414
413
612
812
211
55.
544
641
838
434
129
526
123
220
919
017
416
114
913
913
112
311
611
010
45
399
374
344
305
264
234
208
187
170
156
144
133
125
117
110
104
9893
4.5
352
330
303
269
233
206
183
165
150
137
127
118
110
103
9792
8782
430
528
626
323
320
217
915
914
313
011
911
010
295
8984
7975
713.
525
824
222
219
717
115
113
412
111
010
193
8681
7571
6764
603
211
198
182
161
140
123
110
9990
8276
7166
6258
5552
492.
516
415
314
112
510
996
8577
7064
5955
5148
4543
4038
211
710
910
189
7768
6155
5046
4239
3634
3230
2927
1.5
7065
6053
4641
3633
3027
2523
2220
1918
1716
123
2120
1715
1312
1110
98
87
76
66
50.
50
00
00
00
00
00
00
00
00
00.
125
00
00
00
00
00
00
00
00
00
T p (s
)
Hs (m)

204
Company OWWE - INNOVAKO Country Norway Web address www.owwe.net Technology Name Floating Bridge
Device Type ** A) Attenuator B) Point Absorber C) Oscillating Wave Surge Converter D) Oscillating Water Column E) Overtopping/Terminator Device F) Submerged Pressure Differential G) Other Designs
Features / Design principle
INNOVAKO has a floating bridge concept which can be of interest for Norwegian authorities.
A flexible joint can solve the problems of long distance floating bridges.
In principle there is no limit in length and the problem to solve is how long the sections between
the flexible joints can be. In addition to the flexible joint the bridge are anchored in the same way as floating quays.
If a floating bridge moves sideways the flexible joint open at one of the sides and the force to keep the
bridge straight increase. From 0 to 160 tons (the joint shown) when the
flexible joint open to its maximum of 1 m, which means an angle of 2.5 degrees.
Perhaps it is favorable to start with some stretch. Development status *** TRL 1-3, TRL 4, TRL 5/6, TRL 7/8 or TRL 9
TRL 1
Description of any and all prototypes (including test facility used or location of testing, dates, and hours of operation)
Next development steps Power take off Dimensions Centerline device spacing for multiple devices (m)
Weight of super structure (ton) Weight of power take off equipment (ton)
Min installation depth (m) Max installation depth (m) Swell is a bigger problem than depth.
Design lifetime (years) Concrete can stay at sea for a long time and quality of the concrete decides how long.
Rated power (kW) of commercial unit

205
Wave energy absorption performance (kW) (before losses in conversion to electric power) as a function of significant wave height and peak wave period ****
Source of wave energy absorption performance (numerical simulations or random wave model tests)
Estimated date commercially available
Estimated production cost per rated unit (EUR)
Have environmental impact studies been performed
Discuss the survivability of the device and whether or not it has been tested.
Technical publications Figures/photographs of device have been attached to reply 2 figures (jpg) is attached.
Is it possible to combine this device with a fjord crossing that implements a suspension bridge, floating bridge, or submerged floating tunnel. If so, how?

206
Company OWWE - INNOVAKO Country Norway Web address www.owwe.net Technology Name OWWE-Rig
Device Type ** A) Attenuator B) Point Absorber C) Oscillating Wave Surge Converter D) Oscillating Water Column E) Overtopping/Terminator Device F) Submerged Pressure Differential G) Other Designs
E
Features / Design principle
The main structure is a float with several basins. The float can be trimmed and the height above sea
desired the water pressure at the turbines. OWWE-Rig can be equipped with hinged walls to
make it more efficient. OWWE-Rig is constructed as a hybrid wind and
wave energy converter. The wind-turbines are of the type in normal use.
Development status *** TRL 1-3, TRL 4, TRL 5/6, TRL 7/8 or TRL 9
TRL 2
Description of any and all prototypes (including test facility used or location of testing, dates, and hours of operation)
A 1:20 scale model was made in 2005. The model has not been tested, due to lack of
founding.
Next development steps In search for funding the company participates at
conferences, and the next is the wave energy conference in Dublin 17th to 19th of October.
Power take off Low head turbines normally used in hydro electric power plants.
Dimensions The wave conditions will desired the dimensions,
and as a first step INNOVAKO seek founding for a North Sea Demonstrator of 110m.
Centerline device spacing for multiple devices (m)
Multiple OWWE-Rigs will be placed along a line(50 km from coast)
Weight of super structure (ton) Not calculated Weight of power take off equipment (ton) Not calculated
Min installation depth (m) 20m Max installation depth (m) No limit
Design lifetime (years) If concrete can be used as construction material it can be at sea for a long period, depending on the
quality of the concrete. Rated power (kW) of commercial unit 5000(North Sea Demonstrator) Wave energy absorption performance (kW) (before losses in conversion to
North Sea Demonstrator in 30 kW/m wave climate and 1 MW wind turbine and 0,3 power take of: 1300

207
electric power) as a function of significant wave height and peak wave period ****
kW
Source of wave energy absorption performance (numerical simulations or random wave model tests) No data Estimated date commercially available Depends on founding.
Estimated production cost per rated unit (EUR) 6.00E+06
Have environmental impact studies been performed No
Discuss the survivability of the device and whether or not it has been tested.
The main target for the North Sea Demonstrator is testing of survivability.
OWWE-Rig is an overtopping technology as Wave Dragon.
Wave Dragon has been tested as a 1 : 4,5 prototype in sea condition with good results.
Technical publications www.owwe.net Figures/photographs of device have been attached to reply
Abstract sent for the Dublin conference in October is attached (pdf).
Is it possible to combine this device with a fjord crossing that implements a suspension bridge, floating bridge, or submerged floating tunnel. If so, how?
The force in waves is a problem for floating bridges and should therefore be placed at places with no
swell. In fjords the wind climate is not the best and
therefore INNOVAKO is not in favor of combining either wave or wind technology with floating
bridges. INNOVAKO has a floating bridge concept where a
flexible joint is the key element. I therefore attached papers showing INNOVAKO`s
floating bridge.

208
Company OWWE - INNOVAKO Country Norway Web address www.owwe.net Technology Name Wave Pump-Rig
Device Type ** A) Attenuator B) Point Absorber C) Oscillating Wave Surge Converter D) Oscillating Water Column E) Overtopping/Terminator Device F) Submerged Pressure Differential G) Other Designs
B
Features / Design principle
Wave Pump-Rig is a pneumatically stabilized float with 16 cylinders open to the sea.
12 of the cylinders house a wave pump which pumps seawater to a reservoir where the turbine is placed.
The cylinder in each corner is for stabilization purposes.
Development status *** TRL 1-3, TRL 4, TRL 5/6, TRL 7/8 or TRL 9
TRL 2
Description of any and all prototypes (including test facility used or location of testing, dates, and hours of operation)
No scale model has been built and no tests have been done.
Next development steps In search for funding the company participates at
conferences, and the next is the wave energy conference in Dublin 17th to 19th of October.
Power take off Turbines normally used in hydro electric power plants.

209
Dimensions The wave conditions will determine the dimensions. Centerline device spacing for multiple devices (m)
Multiple Wave Pump-Rigs can be placed along the coastline or at open sea.
Weight of super structure (ton) Not calculated Weight of power take off equipment (ton) Not calculated
Min installation depth (m) 20m Max installation depth (m) No limit Design lifetime (years) Not calculated Rated power (kW) of commercial unit Depends of sea climate and the size of the rig built. Wave energy absorption performance (kW) (before losses in conversion to electric power) as a function of significant wave height and peak wave period ****
Not calculated
Source of wave energy absorption performance (numerical simulations or random wave model tests)
No data
Estimated date commercially available Depends on founding
Estimated production cost per rated unit (EUR) Not calculated
Have environmental impact studies been performed No
Discuss the survivability of the device and whether or not it has been tested.
Air moves freely inside a pneumatically stabilized platform and big waves will therefore have less
impact at the construction than an ordinary floats. Active wave pumps decide the impact.
Each corner must have a unit with sufficient bouncy for stabilizing the rig.
Technical publications www.owwe.net Figures/photographs of device have been attached to reply
Abstract sent for the Dublin conference in October is attached (pdf).
Is it possible to combine this device with a fjord crossing that implements a suspension bridge, floating bridge, or submerged floating tunnel. If so, how?
The force in waves is a problem for floating bridges and should therefore be at a place with no swell. INNOVAKO is not in favor of combining either wave or wind technology with floating bridges.
INNOVAKO has a floating bridge concept where a flexible joint is the key element.
I therefore attached papers showing INNOVAKO`s floating bridge.

210

211
Company OWECO Ocean Wave Energy Company Country USA Web address http://www.owec.com
Technology Name OWEC® Ocean Wave Energy Converter
Device Type ** A) Attenuator B) Point Absorber C) Oscillating Wave Surge Converter D) Oscillating Water Column E) Overtopping/Terminator Device F) Submerged Pressure Differential G) Other Designs
B
Features / Design principle
Any number of self-referencing, scalable modules form submerged open truss arrays permitting wave
regeneration there between. Reciprocation of modules' three large buoys/drive shafts counter-rotate generator components to increase relative speed/electrical output. Several quick-connected
modules' output is additively combined and terminates at load. Arrays provide high
module/mooring ratio. Development status *** TRL 1-3, TRL 4, TRL 5/6, TRL 7/8 or TRL 9
TRL 5/6; new PTO: TRL 3/4
Description of any and all prototypes (including test facility used or location of testing, dates, and hours of operation)
Three modules produced 4 hours electricity during 1982-05 tank tests at MIT, Cambridge, MA, USA.
One smallest, full scale (for 1m wave H)
linear/rotary converter and flywheel generator produced 3 days electricity during 1990-
05 "breadboard" tests at OWECO facility, Pawtucket, RI, USA.
Scaled experiments/virtualization are completed and planned at the OWECO facility in Portsmouth, RI,
USA.
Next development steps
Construct, and test experimental CR counter rotating generators, adjustable ballast, and sensor control
system. Construct and test 6 or 10 connected modules in waves to SS5.
Power take off
Direct drive linear/rotary converter additively combines buoyancy/gravity forces in counter
rotating generators. Proprioceptive PTO control is managed via multi-module sensor inputs.

212
Dimensions
Excluding largest modules for sea state 9, three sizes are scaled correspondent to regional average annual maximum sea state- significant wave height. Further
power detail is required for CR generator.
OWEC® size 1 2 3
Sea State (SWH) 0-4 5-6 7-8
Width 5.5 10.9 21.9
Height 7.9 15.8 31.7
Centerline device spacing for multiple devices (m) 5.51 10.93 22
Weight of super structure (ton) TBD- variable accordant with materials Weight of power take off equipment (ton) TBD- variable accordant with materials
Min installation depth (m) 15 Max installation depth (m) 6400
Design lifetime (years) 20-30/module. Unlimited for arrays via scheduled module service/replacement swap.
Rated power (kW) of commercial unit 1 2 3 average/module 30 250 2150
Wave energy absorption performance (kW) (before losses in conversion to electric power) as a function of significant wave height and peak wave period ****
See below
Source of wave energy absorption performance (numerical simulations or random wave model tests)
Numerical simulations partially based on tests
Estimated date commercially available
Estimated production cost per rated unit (EUR)
Have environmental impact studies been performed Yes (empirical). Detailed study required.
Discuss the survivability of the device and whether or not it has been tested.
The device is equipped with a remote operated survival system. When a storm is approaching, the
device automatically will detect that it should go into survival mode and portions will be filled with water so that they more deeply submerge until the storm has passed. Other portions will be electronically
locked in extended positions that assist flotation of the device, at greater depth, while also prohibiting
catastrophic sinking.
Technical publications Numerous general readership publications beginning 1981. Infra-academic engineering reports published
at various France universities, 2002 - 2006.

213
Figures/photographs of device have been attached to reply No. Images/descriptions available via web address.
Is it possible to combine this device with a fjord crossing that implements a suspension bridge, floating bridge, or submerged floating tunnel. If so, how?
While this device is best suited for offshore applications, it may be linearly deployed as breakwater adjacent to crossing structure.
Source - http://www.owec.com

214
The
oret
ical
wav
e en
ergy
con
vers
ion
abso
rptio
n pe
rfor
man
ce (k
W) o
f one
OW
EC®
siz
e 2
mod
ule
as fu
nctio
n of
sig
nific
ant w
ave
heig
ht (H
s) an
d pe
ak w
ave
perio
d (T
p).
Typ
ical
thre
e m
odul
e O
WEC
® tr
iads
pro
duce
trip
le a
s sh
own.
34
56
78
910
1112
1314
1516
1718
1920
100
00
00
00
00
00
00
00
00
09.
50
00
00
00
00
00
00
00
00
09
00
00
00
00
00
00
00
00
00
8.5
00
00
00
00
00
00
00
00
00
80
00
00
00
00
00
00
00
00
07.
50
00
00
00
00
00
00
00
00
07
00
00
00
00
00
031
829
727
926
224
923
422
36.
50
00
00
00
00
029
827
725
824
222
721
420
419
56
00
00
00
00
029
827
525
524
022
321
319
818
718
05.
50
00
00
00
029
727
224
923
321
820
419
418
117
216
55
00
00
00
030
027
224
923
121
420
018
717
716
715
715
04.
50
00
00
029
926
924
322
320
519
217
916
715
714
914
113
44
00
00
029
826
423
821
619
818
317
315
914
914
113
212
612
03.
50
00
029
926
323
120
818
917
316
015
013
913
012
311
611
010
43
00
029
825
522
319
818
016
215
013
712
812
011
210
510
094
892.
50
029
424
621
018
416
514
713
412
311
310
598
9287
8278
742
029
723
919
817
014
813
211
910
899
9285
7975
7066
6359
1.5
297
222
178
149
127
111
9989
8175
6964
6055
5350
4745
119
414
512
796
8374
6558
5349
4542
3937
3431
3029
0.5
00
00
00
00
00
00
00
00
00
0.12
50
00
00
00
00
00
00
00
00
0
T p (s
)
Hs (m)

215
Company Oceanlinx Ltd Country Australia Web address www.oceanlinx.com
Technology Name greenWAVE/ogWAVE/blueWAVE
Device Type ** A) Attenuator B) Point Absorber C) Oscillating Wave Surge Converter D) Oscillating Water Column E) Overtopping/Terminator Device F) Submerged Pressure Differential G) Other Designs
D
Features / Design principle
greenWAVE is a bottom mounted 1MW device. ogWAVE is a floating deepwater 500kW single
chamber device, blueWAVE is a large deepwater floating with rated capacity of our 2.5 MW device.
Development status *** TRL 1-3, TRL 4, TRL 5/6, TRL 7/8 or TRL 9
TRL7/8
Description of any and all prototypes (including test facility used or location of testing, dates, and hours of operation)
Oceanlinx have been using the Australian Maritime College, Southampton UK and other global facilities for over 10 years to conduct trials at their large wave
tank facilities.
Next development steps Commercial projects in Australia, Hawaii and Portugal
Power take off airWAVE turbine
Dimensions greenWAVE 20m x 20m x20m, ogWAVE 16m x
19m x 18m, blueWAVE 100m x 35m x 20m (Approx.)
Centerline device spacing for multiple devices (m) varies, site specific
Weight of super structure (ton) greenWAVE 2000t, ogWAVE 350t, blueWAVE 2000t (Approx.)
Weight of power take off equipment (ton) 35
Min installation depth (m) greenWAVE 10m, ogWAVE & blueWAVE 40m Max installation depth (m) greenWAVE 15m, ogWAVE & blueWAVE 200m Design lifetime (years) 25
Rated power (kW) of commercial unit greenWAVE 1000kW, ogWAVE 500kW, blueWAVE 2500kW
Wave energy absorption performance (kW) (before losses in conversion to electric power) as a function of significant wave height and peak wave period ****
Commercially sensitive
Source of wave energy absorption performance (numerical simulations Numerical simulations & random wave model tests

216
or random wave model tests)
Estimated date commercially available 2012
Estimated production cost per rated unit (EUR) Commercially sensitive
Have environmental impact studies been performed
Extensive environmental monitoring will be conducted during the first commercial project
Discuss the survivability of the device and whether or not it has been tested.
all devices are designed and tested in full size or scaled trials to design wave
Technical publications Figures/photographs of device have been attached to reply see email attachments
Is it possible to combine this device with a fjord crossing that implements a suspension bridge, floating bridge, or submerged floating tunnel. If so, how?
The greenWAVE device can be incorporated into the structure much like it would be incorporated into
a breakwater.
Source - www.oceanlinx.com

217
Source - www.oceanlinx.com
Source - www.oceanlinx.com

218
Company Perpetuwave Power Pty Ltd Country Australia Web address www.perpetuwavepower.com
Technology Name Wave Harvester
Device Type ** A) Attenuator B) Point Absorber C) Oscillating Wave Surge Converter D) Oscillating Water Column E) Overtopping/Terminator Device F) Submerged Pressure Differential G) Other Designs
A,B
Features / Design principle
The Perpetuwave Wave Harvester technology is based on a floating platform, with the elongated
Hybrid Float design incorporated beneath the deck. The Hybrid elongated floats operate from trailing
arms offering the most robust and light weight design possible. The key technical benefits of the
Hybrid float design are, • The elongated floats are rectangular in shape with the long side being parallel to the wave fronts. This
offers the highest possible buoyancy loading possible as the length of the float is immersed in a wave front at once and is then moved up over the wave. This design also offers the lightest weight floats possible with a working buoyancy load to
float/ trailing arm weight ratio of 4:1, which is much higher than any other design can offer.
• The angular motion of the floats offered by the
trailing lever arm is in the direction of wave travel as well as upwards. This also captures the substantial
horizontal directional component of the wave energy (the direction of wave travel) as well as the typically converted vertical energy component. Extracting the
horizontal directional energy component also minimises wave reflection, reduces impact loads of breaking waves on to the floats and structure, and allows a series of floats to be placed one behind
another in a commercially viable array.
• The trailing lever arm design which the floats are attached, and move from is by far the most robust design available. The specific design criteria is are similar to the case of a wheel of a moving vehicle that hits a pot hole. It is no coincidence then that nearly all vehicle suspension systems around the world use a similar trailing arm system. It is the
most robust design possible.

219
• The elongated floats easily extend wider to capture
more energy in the same vein as wind turbines increase blade length to increase capacity, with no
extra componentry required. Development status *** TRL 1-3, TRL 4, TRL 5/6, TRL 7/8 or TRL 9
TRL 6 completed, 7/8 planned
Description of any and all prototypes (including test facility used or location of testing, dates, and hours of operation)
A 1/3 scale proof of concept prototype was tested in the ocean off of Redcliffe between September 2005
and January 2009. The prototype included a complete direct drivetrain and generator so real
performance (electricity produced) could be accurately measured. In first testing the prototype proved actual electricity production to be slightly
below expectations but considering the state of the development at the time, was extremely
encouraging. A 60 % increase in electricity production was achieved over the course of the
testing campaign with a number of improvements being trialled during the period.
A 1/8 scale model was tested in a wave tank at The University of Queensland between April and June of
2010. Again a high level of authentication was sought with a complete direct drivetrain and
generator installed so real performance (electricity produced) could be accurately measured and averaged over a window of time for average electricity production. A number of further
improvements were trialled during the programme with a doubling of electricity production being
achieved by the end of the of the test program. At the end of the test programme average electricity
production readings of between 20% & 40% extraction/ conversion efficiency were recorded over
a range of wave height conditions.
Next development steps
The next stage in our development commercialisation pathway is to develop and test a
20kW Pilot Demonstration version of our Wave Harvester technology in the open ocean. The main
outcomes of this are to; • Authenticate the performance projections for
commercially sized units operating in the real case environment of the open ocean which is expected to
move the credibility of the technology towards bankable feasibility status.
• Manage the technical risk of the larger Stage 4 commercial demonstration vessel by using a
stepping stone incremental increase in the size of the Wave Harvester units. Feedback from the smaller

220
version will be designed into the larger unit to ensure full risk management of this process.
Power take off direct drive system, all components housed in a sealed environment for low O&M costs.
Dimensions An 850kW unit will be approximately 40m wide
Centerline device spacing for multiple devices (m)
100m apart for singluar units, if the units are placed side by side for a floating bridge design would make
them 40m apart Weight of super structure (ton) 580 ton Weight of power take off equipment (ton) 100 ton
Min installation depth (m) 5m
Max installation depth (m) yet to be determined, but using the experience of the
offshore oil and gas platforms, this could be thousands of metres.
Design lifetime (years) 30 Rated power (kW) of commercial unit 850kW before a 1,500kW unit is developed
Wave energy absorption performance (kW) (before losses in conversion to electric power) as a function of significant wave height and peak wave period ****
Initial numerical simulations were based on force over distance theory as this was considered to be
much more accurate than other forms of wave theory which have historically been shown to be very
inaccurate in predicting electricity produced. This is eveidenced in the EPRI reports that investigate both
the Pelamis and Energetec designs. Source of wave energy absorption performance (numerical simulations or random wave model tests)
Our wave energy absorption performance is based on actual mean electricity production over a window
of time to establish real conversion efficiency. Estimated date commercially available Jul-15
Estimated production cost per rated unit (EUR) $Euro 4.5M
Have environmental impact studies been performed No, planned for the next stage of development

221
Discuss the survivability of the device and whether or not it has been tested.
The Perpetuwave Wave Harvester technology is based on a floating platform which has proved to be be one of the most survivable designs known due to the extensive history and experience of the offshore oil and gas indsutry. A 1/4 scale prototype has been extensively tested in severe storm conditions in the ocean in Moreton Bay, Queensland Australia. The unit operated perfectly. A survival mode is planned to be tested in the next stage of development which will raise the floats from the water and for them to
be secured fast against the upper deck. Minimal frontal area, and minimal wave impact area of the floating platform design are key features that the design the most survival design ever produced.
Technical publications
Report prepared by Uniquest for The University of Queensland titled 'Tank Testing of the Perpetuwave Wave Harvester technology' by Associate Professor
Tom Baldock. Figures/photographs of device have been attached to reply please see attached
Is it possible to combine this device with a fjord crossing that implements a suspension bridge, floating bridge, or submerged floating tunnel. If so, how?
Yes, it is very possible to combine the device with a fjord crossing that implements a floating bridge or submerged tunnel, but not for a suspension bridge unless the suspension bridge was positioned much closer to the water than convenional suspension bridges to minimuise exaggeration of forces tha
occur with having an excessive radius arm(height of the bridge above the water). In the case of the
floating bridge, the energy extraction floats would be operated from the underside of the bridge, in the same manner as we have currently developed the technology to operate from the underside of the
platform. In the case of a submerged floating tunnel the floating platform design would offer the
buoyancy for the tunnel if required.
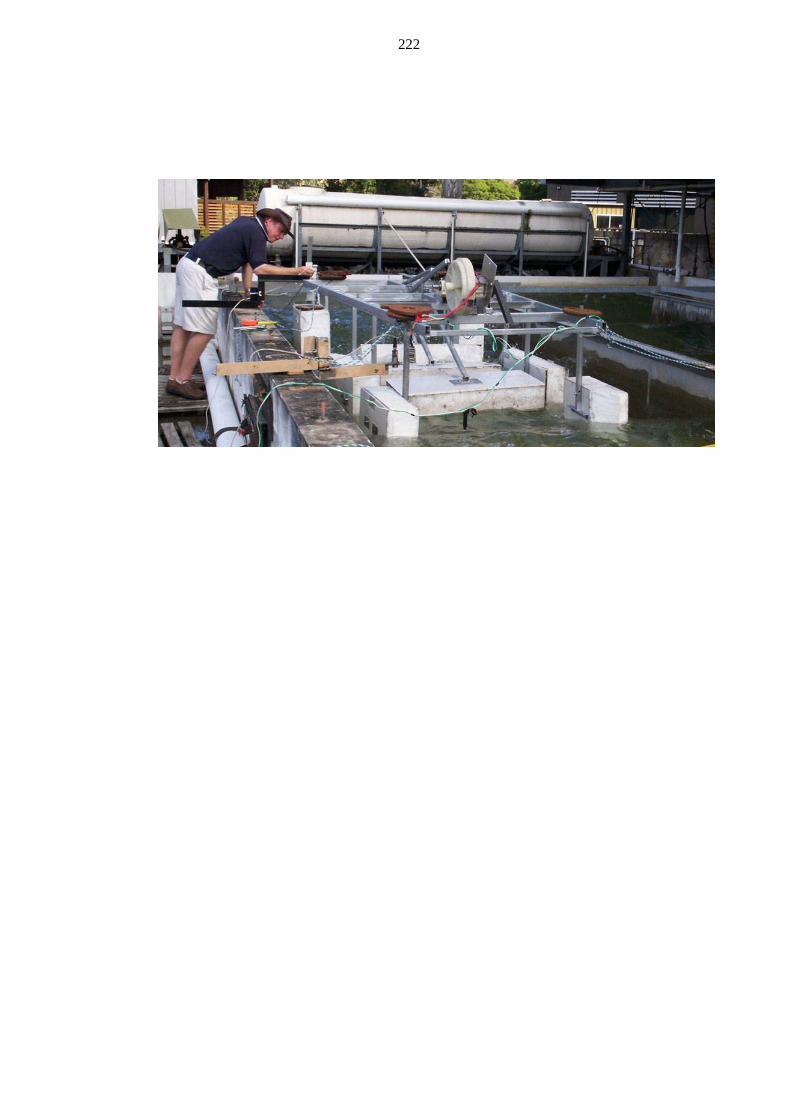
222

223
Wav
e en
ergy
con
vers
ion
abso
rptio
n pe
rfor
man
ce (k
W) a
s a
func
tion
of s
igni
fican
t wav
e he
ight
(Hs)
and
peak
wav
e pe
riod
(Tp)
34
56
78
910
1112
1314
1516
1718
1920
10 9.5 9 8.5 8 7.5 7 6.5 6 5.5 5 4.5 4 3.5 3
90.7
216
9.34
421
1.68
254.
016
296.
352
338.
688
381.
024
423.
3646
5.69
643
5.45
647
1.74
442
3.36
453.
638
7.07
241
1.26
432
6.59
234
4.73
624
1.92
2.5
6311
7.6
147
176.
420
5.8
235.
226
4.6
294
323.
430
2.4
327.
629
431
526
8.8
285.
622
6.8
239.
416
82
40.3
275
.264
94.0
811
2.89
613
1.71
215
0.52
816
9.34
418
8.16
206.
976
225.
792
209.
664
188.
1620
1.6
172.
032
182.
784
145.
152
153.
216
107.
521.
522
.68
42.3
3652
.92
63.5
0474
.088
84.6
7295
.256
105.
8411
6.42
412
7.00
811
7.93
610
5.84
113.
496
.768
102.
816
81.6
4886
.184
60.4
81
18.8
1623
.52
28.2
2432
.928
37.6
3242
.336
47.0
451
.744
56.4
4852
.416
47.0
450
.443
.008
45.6
9636
.288
38.3
0426
.88
0.5
4.70
45.
887.
056
8.23
29.
408
10.5
8411
.76
12.9
3614
.112
13.1
0411
.76
17.6
410
.752
11.4
249.
072
9.57
66.
720.
125
The
pro
ject
ed v
alue
s of
con
verte
d el
ectri
city
are
sho
wn
in th
e ta
ble
abov
e. T
he c
ut o
ff a
fter 3
m is
bas
ed o
n a
float
ing
brid
ge d
esig
n. E
lect
ricity
is e
xpec
ted
to b
e no
rmal
ly p
rodu
ced
past
5m
wav
e he
ight
but
th
is re
quire
s au
tom
atio
n eq
uipm
ent t
hat w
ould
not
be
suite
d to
a fl
oatin
g br
idge
des
ign.
T p (s
)
Hs (m)

224
Company RESEN ENERGY Country Denmark Web address www.Resen.dk and www.ResenWaves.com Technology Name LOPF wave energy buoys
Device Type ** A) Attenuator B) Point Absorber C) Oscillating Wave Surge Converter D) Oscillating Water Column E) Overtopping/Terminator Device F) Submerged Pressure Differential G) Other Designs
B
Features / Design principle
The Lever Operated Pivoting Float LOPF buoy is characterised by low weight, simple design with few
moving parts, direct electric drive output, unique pivoting float action which streamlines the float during storms when there is excessive pull in the mooring line and which limits the mooring line
forces. --Not the least, the LOPF buoys are already commercial in small scale because it is affordable.
+10 buoys have been sold already. Small buoys can be ordered today with a lead time of 5 months.
Development status *** TRL 1-3, TRL 4, TRL 5/6, TRL 7/8 or TRL 9
TRL 7/8 of small commercial 2 and 5 kW grid conected buoys
Description of any and all prototypes (including test facility used or location of testing, dates, and hours of operation)
Scale 1:25 fully instrumented LOPF buoy with power take off and measurement of mechanical and electric production in real time in North Sea wave
conditions of 16 kW/m was tested at Aalborg University in December 2011. Grid connected 2 and 5 kW buoys are available for open sea operation
during 2012. A full scale LOPF buoy of 300 kW for North Sea
Operation in 16 kW/m with 720.000 kWh/y (with 60% electric conversion efficiency)will be available in 2014 -15, depending on customer demand. 10 to 50 kW LOPF buoys are expected to be available in 2013. The activity will grow organically depending
on customer demand.
Next development steps We have test sites in Øresund and Nissum Bredning
and planned North Sea site in Hanstholm for late 2012
Power take off Direct electric drive -No hydraulics
Dimensions Full scale 300 kw buoy for North Sea is 15m x 20m x 2
Centerline device spacing for multiple devices (m) 60 m , depends on actual water depth
Weight of super structure (ton) 50 to 80
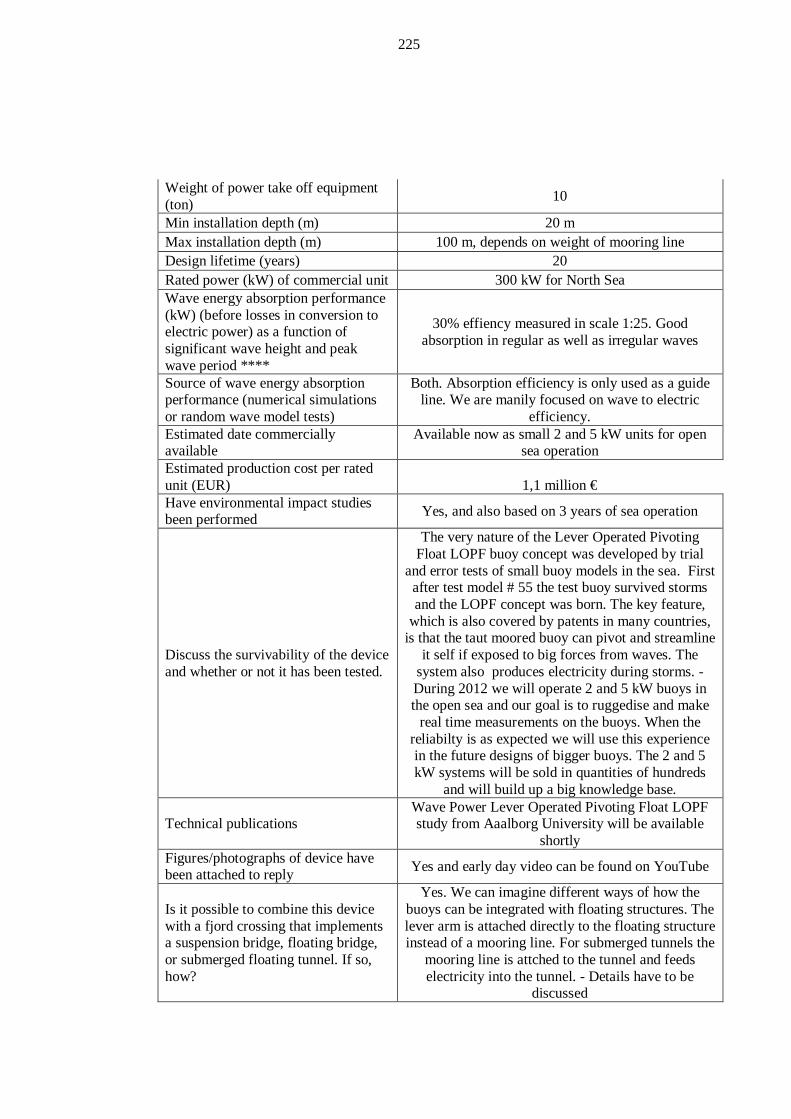
225
Weight of power take off equipment (ton) 10
Min installation depth (m) 20 m Max installation depth (m) 100 m, depends on weight of mooring line Design lifetime (years) 20 Rated power (kW) of commercial unit 300 kW for North Sea Wave energy absorption performance (kW) (before losses in conversion to electric power) as a function of significant wave height and peak wave period ****
30% effiency measured in scale 1:25. Good absorption in regular as well as irregular waves
Source of wave energy absorption performance (numerical simulations or random wave model tests)
Both. Absorption efficiency is only used as a guide line. We are manily focused on wave to electric
efficiency. Estimated date commercially available
Available now as small 2 and 5 kW units for open sea operation
Estimated production cost per rated unit (EUR) 1,1 million € Have environmental impact studies been performed Yes, and also based on 3 years of sea operation
Discuss the survivability of the device and whether or not it has been tested.
The very nature of the Lever Operated Pivoting Float LOPF buoy concept was developed by trial
and error tests of small buoy models in the sea. First after test model # 55 the test buoy survived storms and the LOPF concept was born. The key feature,
which is also covered by patents in many countries, is that the taut moored buoy can pivot and streamline
it self if exposed to big forces from waves. The system also produces electricity during storms. - During 2012 we will operate 2 and 5 kW buoys in the open sea and our goal is to ruggedise and make
real time measurements on the buoys. When the reliabilty is as expected we will use this experience in the future designs of bigger buoys. The 2 and 5 kW systems will be sold in quantities of hundreds
and will build up a big knowledge base.
Technical publications Wave Power Lever Operated Pivoting Float LOPF study from Aaalborg University will be available
shortly Figures/photographs of device have been attached to reply Yes and early day video can be found on YouTube
Is it possible to combine this device with a fjord crossing that implements a suspension bridge, floating bridge, or submerged floating tunnel. If so, how?
Yes. We can imagine different ways of how the buoys can be integrated with floating structures. The lever arm is attached directly to the floating structure instead of a mooring line. For submerged tunnels the
mooring line is attched to the tunnel and feeds electricity into the tunnel. - Details have to be
discussed
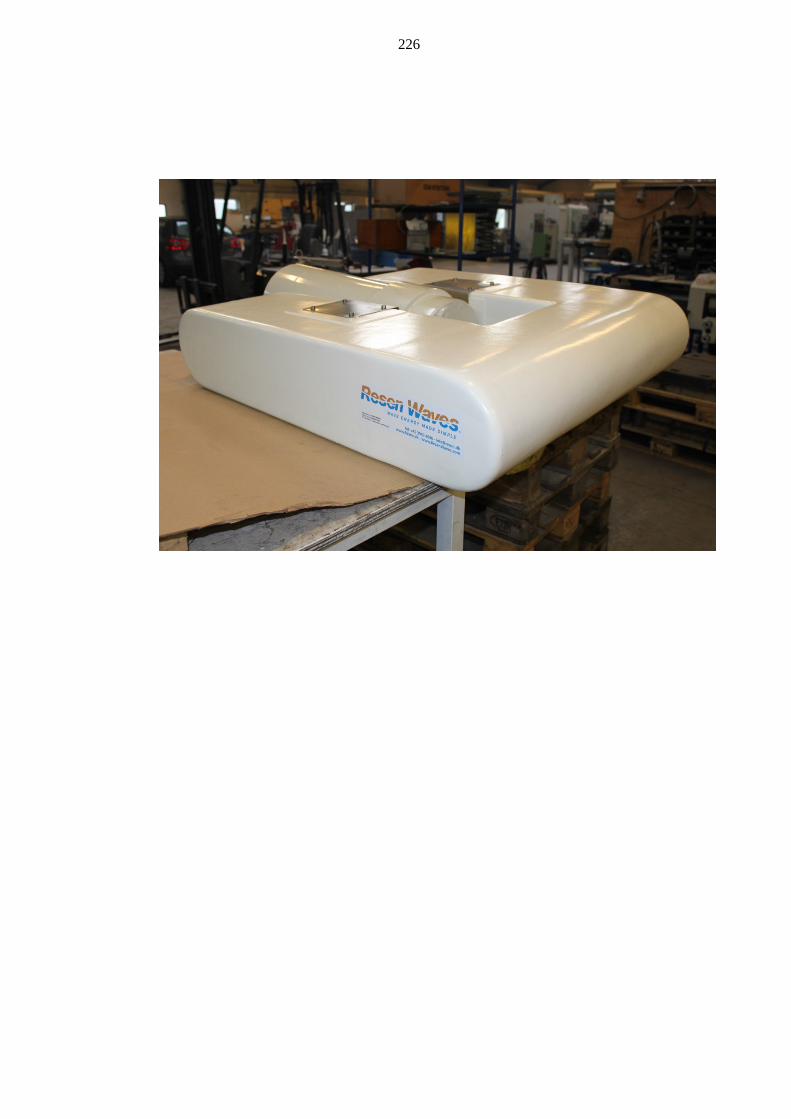
226

227
Company Resolute Marine Energy, Inc. Country USA Web address www.resolutemarine.com
Technology Name SurgeWECTM
Device Type ** A) Attenuator B) Point Absorber C) Oscillating Wave Surge Converter D) Oscillating Water Column E) Overtopping/Terminator Device F) Submerged Pressure Differential G) Other Designs
C
Features / Design principle Bottom-mounted hinged flap. Development status *** TRL 1-3, TRL 4, TRL 5/6, TRL 7/8 or TRL 9
TRL 6
Description of any and all prototypes (including test facility used or location of testing, dates, and hours of operation)
A scale-model prototype was tested in the BOEM wave tank (Ohmsett) June 2011. A scale-model
prototype was tested in the ocean at Jennette's Pier in North Carolina in December 2011.
Next development steps
We are planning two more rounds of ocean trials, both involving a full-scale prototype, in 2012. The latter of the two trials will incorporate the power
takeoff system we have been developing in parallel. Power take off Hydraulic using bio-degradeable hydraulic fluid
Dimensions The paddle of the full-sized SurgeWEC will be roughly 4m wide by 3m high.
Centerline device spacing for multiple devices (m) N.A.
Weight of super structure (ton) The tested prototype was appriximately 2 tons including ballast.
Weight of power take off equipment (ton) Not known.
Min installation depth (m) For full-scale device - preferrably no less than 5 meters
Max installation depth (m) For full-scale device - preferrably no more than 8 meters
Design lifetime (years) 20 Rated power (kW) of commercial unit 30 Wave energy absorption performance (kW) (before losses in conversion to electric power) as a function of significant wave height and peak wave period ****
Tests have shown an average of 40% at 80% water column coverage.
Source of wave energy absorption performance (numerical simulations or random wave model tests)
Wave tank tests.
Estimated date commercially 2013

228
available
Estimated production cost per rated unit (EUR)
We're estimating about $5,000/kW for first commercial prototype trending downwards as
manufacturing at scale begins. Have environmental impact studies been performed
Not yet - but are planned for next round of ocean trials.
Discuss the survivability of the device and whether or not it has been tested.
Survivability has not been specifically tested yet but it is important to note that bottom-mounted OWSC are not subject to loading conditions present at the
surface. In addition, to a degree not yet tested, OWSC naturally shed excessive energy when the
angular displacement of the paddle becomes extreme.
Technical publications We have not published results as yet other than in
our quarterly reports to the U.S. Department of Energy
Figures/photographs of device have been attached to reply Yes
Is it possible to combine this device with a fjord crossing that implements a suspension bridge, floating bridge, or submerged floating tunnel. If so, how?
SurgeWEC is designed to be bottom-mounted which means: a) it is not dependant upon another structure
for stability; and b) it is designed to be deployed near-shore in shallow water (it is actuated by
shallow-water waves) . Conversely, since it is fully submerged, SurgeWEC has no effect on view sheds.

229
Company Sea Power Ltd. Country Ireland Web address www.seapower.ie
Technology Name Sea Power Platform
Device Type ** A) Attenuator B) Point Absorber C) Oscillating Wave Surge Converter D) Oscillating Water Column E) Overtopping/Terminator Device F) Submerged Pressure Differential G) Other Designs
A) Attenuator
Features / Design principle
The Sea Power Platform consists of 2 pontoons - Forward and Main Pontoon. The Main pontoon consists of two floats joined by fixed beams that
work primarily in pitch mode. The forward pontoon consists of a single float which is acts primarily in
heave mode. see www.seapower.ie for animation of fullscale device. The pontoons are designed to
oscillate at resonant frequency relative to each other. This motion drives a syatem of a sea water pumps
(C pumps) controlled by a Sea Power designed linear damping system.
Development status *** TRL 1-3, TRL 4, TRL 5/6, TRL 7/8 or TRL 9
TRL 3/4
Description of any and all prototypes (including test facility used or location of testing, dates, and hours of operation)
A 4m (1:36) model has been built with a power take off system which includes a scaled down C pump and stepped linear damping system. A fullscale
design concept has been developed. Tank testing in Strathclyde in Mar 2010 indicated substantial power
outputs. A full-scale numerical model has been developed and fully validated by tank testing in the Hydraulic and Maritime Research Center in Cork Ireland. The power output matrix shows a device
capable of developing close to 4mw of power in the Belmullet test site off the coast of Ireland with an average annual power output in excess of 700kW.
Next development steps
The next devdelopment phase is to build a an approximately 1:9 scale device which will be
aqpproximately 15 meters long. This device will be used to validate the substatial power matrix
developed at the 4m scale, to test the sub systems, test the mooring design and carry out feasibility
testing. Power take off
Dimensions A totla length of 140m and a width of 29m - see
animation of a fullscale device on our website www.seapower.ie

230
Centerline device spacing for multiple devices (m) approximately 400m-500m
Weight of super structure (ton) 8500 Tonne Mostly concrete Weight of power take off equipment (ton) Estimate of 500 Tonne
Min installation depth (m) 25m Max installation depth (m) 200m Design lifetime (years) 25 Rated power (kW) of commercial unit 3.75MW Wave energy absorption performance (kW) (before losses in conversion to electric power) as a function of significant wave height and peak wave period ****
Source of wave energy absorption performance (numerical simulations or random wave model tests)
Numerical Modelling (Simulation) validated by tank testing of a 4m device with a scaled Power Take Off
and damping system. Estimated date commercially available 2017
Estimated production cost per rated unit (EUR) 12m
Have environmental impact studies been performed None
Discuss the survivability of the device and whether or not it has been tested.
Basic survivability testing of the 4m device has been carried out.
Technical publications None
Figures/photographs of device have been attached to reply
Copy of animation of the fullscale device and video of the device being tested in the HMRC in Cork
Ireland.
Is it possible to combine this device with a fjord crossing that implements a suspension bridge, floating bridge, or submerged floating tunnel. If so, how?
The device has a draft of approximately 4.5m so the minimum fjord depth is critical.1. Suspension
Bridge - yes - all the device needs is mooring points. 2. Floating bridge - depends on whether mooring
points are available. 3. Submerged Floating Tunnel - depends on the availability of mooring points.

231
Sea Power Platform
wave period - Tp (sec)6 7 8 9 10 11 12 13 14
2 41 112 183 255 280 299 297 269 2403 99 253 408 562 616 658 653 591 5284 199 454 709 964 1059 1133 1123 1017 9115 372 720 1067 1414 1569 1690 1674 1516 13596 625 1051 1477 1904 2136 2317 2294 2079 18637 971 1451 1931 2410 2740 2997 2964 2686 24098 1427 1921 2416 2911 3359 3708 3665 3322 2980
wave height - Hs (metres)
6 7 8 9 10 11 12 13 1412 34 65 144 248 318 322 312 297 2683 74 140 311 537 690 703 683 652 5904 129 239 531 917 1,183 1,210 1,178 1,129 1,0265 201 365 808 1,395 1,798 1,843 1,798 1,726 1,5726 289 515 1,133 1,952 2,517 2,585 2,527 2,431 2,2207 392 686 1,500 2,581 3,327 3,426 3,355 3,234 2,9628 509 876 1,905 3,271 4,217 4,353 4,272 4,126 3,7919 - - - - - - - - -
wave height - Hs (metres) - - - - - - - - -
Power Matrix - Physical Modelling
Power Matrix - Numerical Modellingwave period - Tp (sec)

232
Company Seatricity Ltd Country UK Web address www.seatricity.net
Technology Name Oceanus
Device Type ** A) Attenuator B) Point Absorber C) Oscillating Wave Surge Converter D) Oscillating Water Column E) Overtopping/Terminator Device F) Submerged Pressure Differential G) Other Designs
Attenuator/point absorber
Features / Design principle
Arrays of buoy actuated reciprocating pumps produce hugh pressure seawater which is then
transmitted ashore by pipeline and fed to a hydroelectric turbine.
Development status *** TRL 1-3, TRL 4, TRL 5/6, TRL 7/8 or TRL 9
TRL 7/8
Description of any and all prototypes (including test facility used or location of testing, dates, and hours of operation)
A full size prototype has been tested at sea in Antigua for 2 years. A 1 megawatt demonstration is
to be deployed at EMEC in May this year.
Next development steps We are developing a project to deploy a 10 MW wave farm off the UK coast in 2013
Power take off Hydraulic, seawater Dimensions Arrays of individual buoys, each 4.8 m dia. Centerline device spacing for multiple devices (m) 30
Weight of super structure (ton) 1.2 ton Weight of power take off equipment (ton) 0.5 ton
Min installation depth (m) 30 m Max installation depth (m) 100 m Design lifetime (years) 20 Rated power (kW) of commercial unit 30 kW per unit, 300 kW per sub array Wave energy absorption performance (kW) (before losses in conversion to electric power) as a function of significant wave height and peak wave period ****
Information can be provided under NDA
Source of wave energy absorption performance (numerical simulations or random wave model tests)
Prototype monitoring
Estimated date commercially available 2012/13

233
Estimated production cost per rated unit (EUR)
10c to 25c per kWh depending on wave climate, distance from shore, infrastructure requirements,
cost of capital Have environmental impact studies been performed
Discuss the survivability of the device and whether or not it has been tested.
The devices have limited buoyancy and submerge in storm conditions
Technical publications Documents can be provided subject to signing NDA. Patents have been granted for the technology.
Figures/photographs of device have been attached to reply See website
Is it possible to combine this device with a fjord crossing that implements a suspension bridge, floating bridge, or submerged floating tunnel. If so, how?
It is likely that a bridge crossing a Fjord would be constructed inshore from the most energetic wave
conditions, but it could be feasible in certain conditions.
Source - www.seatricity.net

234
Company Seawood Designs Inc Country Canada Web address [email protected]
Technology Name SurfPower
Device Type ** A) Attenuator B) Point Absorber C) Oscillating Wave Surge Converter D) Oscillating Water Column E) Overtopping/Terminator Device F) Submerged Pressure Differential G) Other Designs
B) Point Absorber
Features / Design principle
Employs a rectangular buoyant wing that is anchored by a long stroke seawater pump. The
system is designed to withstand rogue waves by submergence up to a depth of 10 m. Further,
horizontal structural loading under storm conditions can be reduced to 25% of the normal operating
conditions (this is an important consideration for bridge/tunnel mounting).
Development status *** TRL 1-3, TRL 4, TRL 5/6, TRL 7/8 or TRL 9
TRL 4/5
Description of any and all prototypes (including test facility used or location of testing, dates, and hours of operation)
A 1:10 scale model was tested at the Canadian National Research Council's Institute for Ocean
Technology located at Memeorial University, St. Johns, Newfoundland, Canada.
Next development steps
Seawood Drsigns Inc. is a member of a proposed program lead by the University of Victoria called
"The West Coast Wave Initiative" that is tasked with refining current knowledge of the wave resource off the west coast of Vancouver Island and conducting
studies as to how best to integrate wave energy devices. Seawood Designs plans to install a
demonstration system in one of the areas under study on completion of the program.
Power take off
High pressure seawater driving a pelton turbine on shore. Operating pressure is constant at 70 bar. The
turbine and alternator operate at constant speed thereby allowing for direct connection to the power
grid. Dimensions Length 24.36 m, Width 6.7 m, Height 0.74 - 0.9 m. Centerline device spacing for multiple devices (m) 32 m
Weight of super structure (ton) 21 metric tons Weight of power take off equipment (ton) not available
Min installation depth (m) 15 m Max installation depth (m) 25 m

235
Design lifetime (years) 50 years Rated power (kW) of commercial unit 300 kW
Wave energy absorption performance (kW) (before losses in conversion to electric power) as a function of significant wave height and peak wave period ****
See Executive Summary Seawood Designs uses real time data to forecast energy recovery. We believe this is the most accurate approach as opposed to
using modelled seastate conditions. In the event you wish to evaluate SurfPower further we would be
pleased to use real time data for your sites to predict annual performance.
Source of wave energy absorption performance (numerical simulations or random wave model tests)
See executive Summary
Estimated date commercially available 2015
Estimated production cost per rated unit (EUR) Under development
Have environmental impact studies been performed No
Discuss the survivability of the device and whether or not it has been tested.
The survivability of SurfPower has not been tested. Seawood Designs inc. believes Surfpower is highly
unique in this regard. The system is designed to withstand total submergence to a depth of 10 m. It
has the ability to cope with unexpected rogue waves by submergence. Further, the system has the ability
to adopt a storm mode of operation that greatly reduces storm structural loading and power. This is the subject of patentable concepts and therefore can
not be communicated at this time.
Technical publications
See Executive Summary Report Attached. Seawood Designs Inc. has contracted extensively with Dynamic Systems Analysis (Victoria, British
Columbia) who have produced a number of reports that are confidential and the National Research
Council of Canada has also produced a report that is confidential. These can all be made available should
the need arise. Figures/photographs of device have been attached to reply See Executive Summary
Is it possible to combine this device with a fjord crossing that implements a suspension bridge, floating bridge, or submerged floating tunnel. If so, how?
SurfPower is ideally suited for mounting on a submerged floating tunnel. High pressure seawater is bumped down a hollow piston rod that would deliver
the flow to the tunnel through a connection on the roof of the tunnel or at each side of the tunnel if the tunnel is wide enough to support a system on each
side. The system could also be adapted for mounting on a floating bridge. The system cost
would be reduced somewhat in that an allowance in pump stroke for tide would not be required. Also the pump could be anchored in a different way to make
bridge mounting more cost effective.
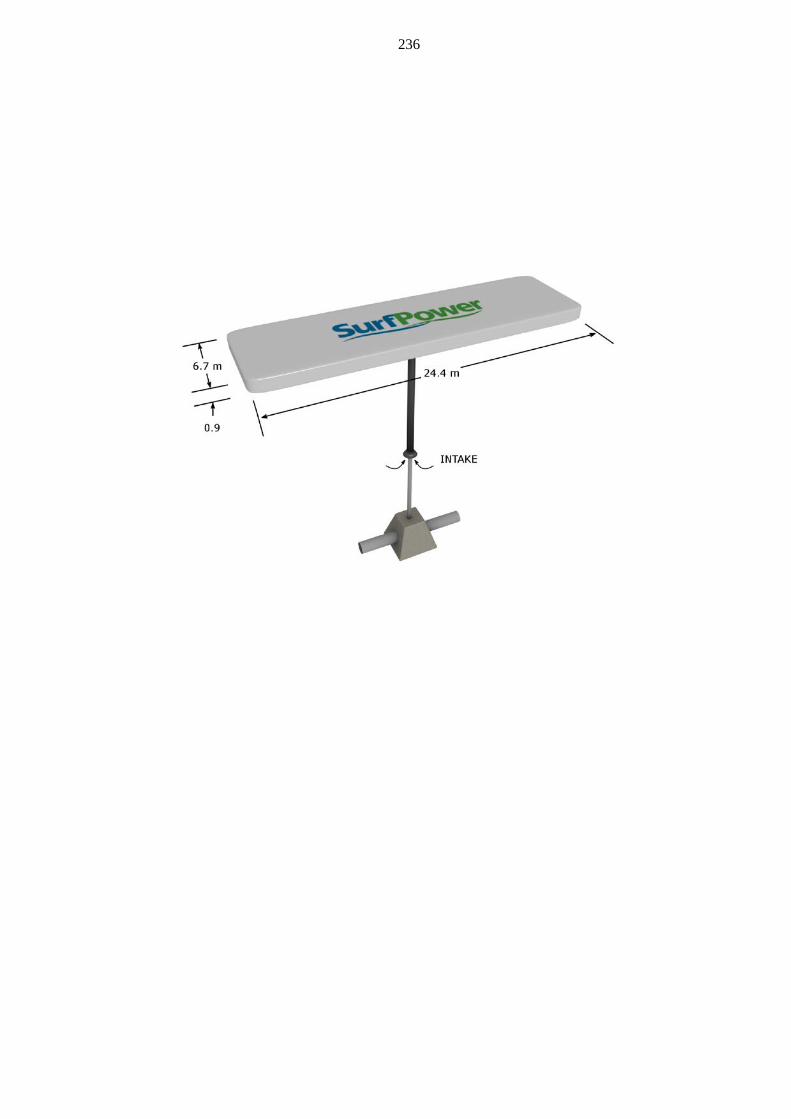
236

237
Company Shamil Ayntrazi Country USA Web address www.renewableenergypumps.com
Technology Name Wind, Wave, Tidal and Deep Sea Water Air Conditioning
Device Type ** A) Attenuator B) Point Absorber C) Oscillating Wave Surge Converter D) Oscillating Water Column E) Overtopping/Terminator Device F) Submerged Pressure Differential G) Other Designs
G
Features / Design principle
A Float following wave undulations transfers buoyant uplift to:Drive a pump to pump a small
quantity of water to high head; collect and feed it to a hydro-turbo generator; Drive an electric “Isosync”
VSG Generator precluding the need for rectifiers/chargers and invertors.
Development status *** TRL 1-3, TRL 4, TRL 5/6, TRL 7/8 or TRL 9
No Prototype is made as testing must be in the sea at site, using a "Construction Unit"
Description of any and all prototypes (including test facility used or location of testing, dates, and hours of operation)
Simple Engineering Principles are used that can be easily verigied. All equipment are on the market and
of best manugacture with proven performance.
Next development steps Depends upon Client Site requirements Power take off Direct Drive Dimensions Construction Unit measure 22x22.5 m Centerline device spacing for multiple devices (m) CU at 25 m centerline
Weight of super structure (ton) 40 Tons Weight of power take off equipment (ton) 5
Min installation depth (m) 15 Max installation depth (m) 100+ Design lifetime (years) 20
Rated power (kW) of commercial unit Per Construction Unit: Wind 1.5 MW, Wave 350 KW, Tidal 90 KW, Solar 118.8 KW
Wave energy absorption performance (kW) (before losses in conversion to electric power) as a function of significant wave height and peak wave period ****
Table Below
Source of wave energy absorption performance (numerical simulations or random wave model tests)
Numerical simulations
Estimated date commercially Immediate

238
available Estimated production cost per rated unit (EUR) EU 1,500 per KW
Have environmental impact studies been performed No Exceptional Impact
Discuss the survivability of the device and whether or not it has been tested.
The Construction Unit is anchored to the sea bed and can resist severe storms.
Technical publications Search the Internet for Shamil Ayntrazi Figures/photographs of device have been attached to reply Yes in attached files
Is it possible to combine this device with a fjord crossing that implements a suspension bridge, floating bridge, or submerged floating tunnel. If so, how?
NO
Table – 1 COEE ENERGY EXTRACTION per Kilometers
Present Wind Turbines Diam - m Wind V -m/s KW/Unit No/C.U. C.U./Km No/Km Total MW/Km
Wind Turbine 126 14 20,691 N/App N/App 4 82.77
Wind Turbine Actual Output According to Nameplate 20
COEE SystemWind Turbine 34 14 1,277 1 44 44 56.18Wave Energy, Float 2m Diam,
1m Hi
Wave
Hight m
No of P or
G/Set
KW/Set of
4
Sets of 4P or G /C. Unit
C.Units
per Km
Set/Km
Wave Energy 4 4 35.02 10 44 44 15.41
Tidal Turbines TT Dia. m Shroud D m V/sec m KW/TT No./C.U No/Km Total MW/KmTidal Turb. No Shroud 2 0 2 15 6 264 3.91
TT/Shroud - Recomend 2 6 2 133 6 264 35.23
TT With Shroud ?? 20 2 1,483 1 44 65.24
Solar Energy Area m2 E'gy KW/m2 Ex KW/m2 KW/C.U. C.U./Km No/Km Total MW/Km
Solar Energy 495 1.368 0.240 118.8 44 44.0 5.2272
System MW/Km KW-H/KmPower 5 MW Wind Turbines 82.77 40,000,000 Name Plate 4x5 MW each WT (20MWx2,000H/Year)Wind Turbine 56.18 112,359,392Wave Power 15.41 42,793,256Tidal Turbine 35.23 257,194,800 Highest due to availablity 20/24 hours per daySolar MW 5.23 15,263,424 Total COEE KW-Hour/Km 112.05 427,610,872As Compared to Wind Turbine 82.77 40,000,000

239
Table – 2 COEE WAVE GEAR DRIVE PERFORMANCE
Total REWGD-P System Effi'cy Total REWGD-G System Efficiency Wave
Heit m
Wave
Energy
Wave
Duration
Total Avge Avge Avge Avge Avge Avge Avge Avge 2-m
162 360 162 360 162 360 162 360 Pumps Gener Pumps Gener KW Hour/Y
8.00 0.769 0.4855 0.22 31,555 14,200 308.75 138.94 53.60 24.12 90.31 125.04 903.10 1,250 576.00 2.60
7.00 0.631 0.3951 0.18 25,678 11,555 251.26 113.06 56.97 25.64 73.49 101.76 734.92 1,018 441.00 9.10
6.00 0.494 0.3056 0.14 19,862 8,938 194.34 87.46 59.98 26.99 56.85 78.71 568.46 787 324.00 27.40
5.00 0.358 0.2179 0.10 14,165 6,374 138.61 62.37 61.60 27.72 40.54 56.14 405.42 561 225.00 141.30
4.00 0.227 0.1359 0.06 8,836 3,976 86.46 38.91 60.04 27.02 25.29 35.02 252.90 350 144.00 610.40
3.00 0.125 0.0727 0.03 4,726 2,127 46.24 20.81 57.08 25.69 13.52 18.73 135.25 187 81.00 1,965.60
2.00 0.054 0.0284 0.01 1,847 831 18.07 8.13 50.20 22.59 5.29 7.32 52.86 73 36.00 3,494.20
1.00 0.012 0.0036 0.00 232 105 2.27 1.02 25.27 11.37 0.67 0.92 6.65 9 9.00 2,345.80
0.75 0.006 0.0013 0.00 85 38 0.83 0.37 16.43 7.39 0.24 0.34 2.43 3 5.06 2.60
Avg Pow er/Km "CU" 1-m w ave 0.41 MW Total Generated per Year per Construction Unit - KWHAvg Pow er/Km "CU" 4-m w ave 15.41 MW Total Pumps or Generators/CU 40 Generation by 2,3,4 m waves
Avg Pow er/Km "CU" 8-m w ave 55.02 MW Foot Print per CU 22x22.5 m @ 2 m spacing
1-Set of 4 Units
Pow er Gen c/o Generator KW
Energy Gen'd / Const'n Unit
KWH / Year
3,251
9,260
10 Sets per CU
972,574
Energy Extr'd /4-Pump Kg-m
Energy Extr'd /4-Pump KW
Extraction Eff iciency %
Pow er Gen c/o Pumps &HT KW
Water Pumped / 4 Pumps cm @ 65 m TDH
65% 90%
21,566
79,319
213,740
368,090
255,728
21,611
9
86%

240
Company Trident Energy Limited Country UK Web address http://www.tridentenergy.co.uk
Technology Name Wave Energy technology
Device Type ** A) Attenuator B) Point Absorber C) Oscillating Wave Surge Converter D) Oscillating Water Column E) Overtopping/Terminator Device F) Submerged Pressure Differential G) Other Designs
A
Features / Design principle
Linear generator and integrated into a PowerPod product. Powerpods can be attached (co-located)
onto a range of fixed marine structures (platforms)above the water. The PowerPod
generator is driven by floats riding waves on the surface of the water. The linear generators convert
the movement directly into electricity without additional gearboxes or hydralics.
Development status *** TRL 1-3, TRL 4, TRL 5/6, TRL 7/8 or TRL 9
TRL5/6
Description of any and all prototypes (including test facility used or location of testing, dates, and hours of operation)
Two 1:6 scale model tests in wave tank at Narec in Blyth UK. 8 full scale generators built and fully test
on-shore. Tests have validated performance to system model. Planning sea trials in 2012 linked to
off-shore wind turbine structure.
Next development steps We are looking for partners to collaborate with us to complete sea trials.
Power take off Low cost, patented, direct drive linear generator.
Dimensions
Tailored to suit wave climate. Hydrodynamic toolkit developed (wave to wire system model) to optimise product sizing and system to maximise efficiency,
cost profile and IRR. Centerline device spacing for multiple devices (m) N/A
Weight of super structure (ton) N/A as typically Co-located technology Weight of power take off equipment (ton)
Configuarion dependent - more data available upon specific request.
Min installation depth (m) N/A Max installation depth (m) N/A Design lifetime (years) 25
Rated power (kW) of commercial unit PowerPod is available in three sizes; 40, 80 and 150Kw per unit.

241
Wave energy absorption performance (kW) (before losses in conversion to electric power) as a function of significant wave height and peak wave period ****
Site and PowerPod configuration dependent - more detailed information available upon request/specific
RFI
From the report, the annual mean significant wave height ranges from 1.6 to 2.6m (Fig 3.1), annual wave power from 15 to 50kW/m (Fig 3.5) and
annual mean wave energy period from 6.5 to 9s (Fig 3.7). This represents a large range of available wave
power for which we would need to use different sizes of PowerPod depending on the specific site.
Given that your intention is to install the wave
energy converters in fjords which are presumably relatively sheltered we assume that the available
wave power is most likely to be at the lower end of this range. We therefore estimate that our 80kW
model would be most suitable.
Trident Energy is developing the PowerPod technology through a rigorous R&D programme
involving numerical modelling, prototype construction and testing in laboratory and
operational conditions. Given our current level of understanding, we estimate that our 80kW
PowerPod device would capture approximately 230MWh/yr in wave climates at the lowest end of the range, increasing with the available resource.
Our 150kW PowerPod would be suited to sites in the medium to upper end of the stated range, capturing
up to 770MWh/yr. We understand that you are exploring the potential for co-locating renewable energy generation on highway infrastructure. We
would expect that many PowerPods could be deployed on such infrastructure at a packing density
of around one every 10metres. Hence, the total energy yield per year needs to be multiplied up by
the number of PowerPods deployed.
Source of wave energy absorption performance (numerical simulations or random wave model tests)
tested in sinusoidal and polychromatic wave. Electromagnetic PTO enables dynamic device tuning to increase power conversion efficiency
profile. Estimated date commercially available 2014
Estimated production cost per rated unit (EUR) €2mil per MW
Have environmental impact studies been performed Yes
Discuss the survivability of the device and whether or not it has been tested.
Patented self protection system. Linear generaor is used to automatically lift floats out of the water.
The self protection system has been tested

242
successfully at full scale.
Technical publications N/A Figures/photographs of device have been attached to reply
Yes (attached to wind turbine are schematic drawings)
Is it possible to combine this device with a fjord crossing that implements a suspension bridge, floating bridge, or submerged floating tunnel. If so, how?
Yes - keen to engage with technical knowledge transfer under NDA

243
Company Vigor Wave Energy AB Country Sweden Web address www.vigorwaveenergy.com
Technology Name Vigor Wave Energy Converter
Device Type ** A) Attenuator B) Point Absorber C) Oscillating Wave Surge Converter D) Oscillating Water Column E) Overtopping/Terminator Device F) Submerged Pressure Differential G) Other Designs
G
Features / Design principle
The main component is a floating hose which follows the movements of the ocean waves. Letting in water and air into the hose creates batches that “surf” inside the hose. The batches’ movements
create energy in the form of pressure. At the end of the hose, the water is pushed through a turbine,
driving a generator that converts the pressure into electrical energy.
Development status *** TRL 1-3, TRL 4, TRL 5/6, TRL 7/8 or TRL 9
TRL4
Description of any and all prototypes (including test facility used or location of testing, dates, and hours of operation)
Small scale test were done in 2005.
A CFD analysis follow up of these was done on a larger scale model.
A 1/8 scale model is being developed in our wave tank facility at Vigor Wave Energy Wave Lab in
Gothenburg.
Next development steps We have started to look for a installation location to test a 1/4 size prototype. Testing is exptect to begin
in 2013/2014
Power take off Electrical turbine powerd by pressuriezd water and air.
Dimensions The hose for the 1/4 size prototype is going to be
200 meter long, the conversion unit is about 8 cubic meters.
Centerline device spacing for multiple devices (m) 100
Weight of super structure (ton) 20 Weight of power take off equipment (ton) 5
Min installation depth (m) 20 Max installation depth (m) 200 Design lifetime (years) 20 Rated power (kW) of commercial unit From 3 up to 100 MW

244
Wave energy absorption performance (kW) (before losses in conversion to electric power) as a function of significant wave height and peak wave period ****
The effeciency is so not interresting for us, we want to produce high amounts of energy at low costs.
Contact us for more information.
Source of wave energy absorption performance (numerical simulations or random wave model tests)
CFD analysis and numerical simulation/calculation
Estimated date commercially available 2016
Estimated production cost per rated unit (EUR) 200000 - 800000
Have environmental impact studies been performed Initial brief studies have performed
Discuss the survivability of the device and whether or not it has been tested.
The device equiped with a remote operated survival system. When a storm is approaching, the device
automatically will detect that it should go into survival mode and will be filled with water so that it submerges until the storm has passed. This system
has not been tested.
Technical publications
Thorbergsson E. Modeling and simulation of the Vigor Wave Energy Converter,. University of
Gothenburg, Göteborg 2009
Thorbergsson E. Vigor Wave Energy Converter, Energy Output Estimation,. Vigor Wave Energy AB,
Göteborg 2010
Eskilsson C. CFD simulering av ett Vigor vågkraftverk med circular tvärsektion,. Chalmers
teknikska högskola, Göteborg 2010
Alfredson H. Tryckfall i rörsegment Vigor Wave Energy,. Epsilon Utvecklingscentrum Väst AB,
Göteborg 2010
Stensson C. Vigor Pressure drop calculations,. Epsilon Utvecklingscentrum Väst AB, Göteborg
2011 Figures/photographs of device have been attached to reply Yes
Is it possible to combine this device with a fjord crossing that implements a suspension bridge, floating bridge, or submerged floating tunnel. If so, how?
It should be possible to combine this device to a fjord crossing.

245
Source - www.vigorwaveenergy.com

246
Company Voith Hydro Wavegen Country Scotland Web address www.wavegen.com Technology Name
Device Type ** A) Attenuator B) Point Absorber C) Oscillating Wave Surge Converter D) Oscillating Water Column E) Overtopping/Terminator Device F) Submerged Pressure Differential G) Other Designs
D
Features / Design principle Nearshore fixed structure Oscillating Water Column with Wells Turbine power take-off
Development status *** TRL 1-3, TRL 4, TRL 5/6, TRL 7/8 or TRL 9
TRL 9
Description of any and all prototypes (including test facility used or location of testing, dates, and hours of operation)
in 2000 Wavegen built the LIMPET facility on the Scottish Island of Islay. Full scale prototype devices
have been tested and proven here delivering electricity to the National Grid for more than 70,000
turbine operating hours.
In November 2011 the Mutriku wave energy plant was handed over to the Basque Energy Board (EVE)
in Spain. THis plant contains 16 turbines and was the first commercially sold and operated wave
energy plant in the world and the only multi-unit plant operating in the world.
Next development steps
Voith Hydro Wavegen are developing the Siadar project on the Scottish island of Lewis. This is an up to 30MW project of which 4MW is currently fully
consented.
Power take off Wells Tubrine (Bi-directional air flow, single direction of rotation) air turbine
Dimensions Depends upon plant capacity which depends upon available wave resource at choisen location
Centerline device spacing for multiple devices (m) As above
Weight of super structure (ton) As above Weight of power take off equipment (ton) As above
Min installation depth (m) ≈7m Max installation depth (m) N/A Design lifetime (years) 25 years Rated power (kW) of commercial unit 18.5kW / 132kW

247
Wave energy absorption performance (kW) (before losses in conversion to electric power) as a function of significant wave height and peak wave period ****
I have specifically not completed the wave performance table. We are aware these tables are
used by some developers to describe the performance of their device however it is not an
approach we have utilised ourselves for a number of technical reasons (our Chief Technical Officer could explain more if required). We do however hope that
our proven track record and our ability to demonstrate annual energy yield (which is of far more importance to a project) would provide far more information than could be obtained from
completing this table. Source of wave energy absorption performance (numerical simulations or random wave model tests)
Proven deployment
Estimated date commercially available Now
Estimated production cost per rated unit (EUR) N/A
Have environmental impact studies been performed Yes, for all deployments
Discuss the survivability of the device and whether or not it has been tested.
Limpet has operated for over 11 years and has suffered no damage from severe weather.
Technical publications Wavegen's Chief Technical Officer Dr Tom Heath
has published many technical papers in the 20 years he has worked for Wavegen - too many to list
Figures/photographs of device have been attached to reply Yes
Is it possible to combine this device with a fjord crossing that implements a suspension bridge, floating bridge, or submerged floating tunnel. If so, how?
This device is best integrated into a civil engineering structure

248
Company Waveenergyfyn Country Danmark Web address http://www.Waveenergyfyn.dk
Technology Name Crestwing Device Type ** A) Attenuator B) Point Absorber C) Oscillating Wave Surge Converter D) Oscillating Water Column E) Overtopping/Terminator Device F) Submerged Pressure Differential G)atmospheric-suction pontoon absorber
G
Features / Design principle
The WEC has two pontoons which are fixed with hinges and the mechanical power take-off system is located above the hinge (PTO). During the up and
down movement of the pontoons the potential atmospheric pressure will be utilized through the
PTO system which generates electricity by a generator.
Development status *** TRL 1-3, TRL 4, TRL 5/6, TRL 7/8 or TRL 9
TRL 7/8
Description of any and all prototypes (including test facility used or location of testing, dates, and hours of operation)
1:30 scale proof-of-concept model was tested at AAU's wave laboratory in Ålborg Danmark 2008-9. 1:20 scale proof-of-concept including the proposed mooring system and PTO system model was tested
at DHI's wave laboratory in Hørsholm Danmark 2010-11.
1:5 scale model including the proposed mooring and PTO system is tested off- shore in Frederikshavn,
Danmark 2011-12
Next development steps A full scale model is will be tested on the west coast of Jutland , Hanstholm Danmark 2012-15.
Power take off Mechanical power take off
Dimensions Each of the two full scale sections is 13,5 m wide and has a length of 40 m, for a total
Centerline device spacing for multiple devices (m) 20 -40
Weight of super structure (ton) 70 Weight of power take off equipment (ton) 6
Min installation depth (m) 10 Max installation depth (m) 150 Design lifetime (years) 20 - 30 Rated power (kW) of commercial unit 200

249
Wave energy absorption performance (kW) (before losses in conversion to electric power) as a function of significant wave height and peak wave period ****
40% - 45%
Source of wave energy absorption performance (numerical simulations or random wave model tests)
irregular 3D waves
Estimated date commercially available 2017-01
Estimated production cost per rated unit (EUR) 5.00E+05
Have environmental impact studies been performed no
Discuss the survivability of the device and whether or not it has been tested.
The mooring system has gone through long-term test on DHI wave laboratory in Hørsholm Denmark
2010-11 and anchoring forces are tested under all possible conditions. The forces in the anchor chain of a North Sea installations will from Hs = 2m not
be increasing with wave height. Technical publications There are published seven reports of Test procedures Figures/photographs of device have been attached to reply
Is it possible to combine this device with a fjord crossing that implements a suspension bridge, floating bridge, or submerged floating tunnel. If so, how?
Very possible but energy content must remain at a reasonable level
Source - http://www.Waveenergyfyn.dk

250
Company Wavestar A/S Country Denmark Web address www.wavestarenergy.com
Technology Name wave star
Device Type ** A) Attenuator B) Point Absorber C) Oscillating Wave Surge Converter D) Oscillating Water Column E) Overtopping/Terminator Device F) Submerged Pressure Differential G) Other Designs
B
Features / Design principle
20 buoys fixed on rotated arms, based on a structure upside to the water line. The up and down movement
of the buoys is transformed in high hydraulic pressure and turns a generator
Development status *** TRL 1-3, TRL 4, TRL 5/6, TRL 7/8 or TRL 9
TRL 7/8-9
Description of any and all prototypes (including test facility used or location of testing, dates, and hours of operation)
1:40 scale tested at AAU in 2004 1:10 (ø1m flyder) scale installed at Nissum Bredning in 2006 2xø5 m flyder scale installed at Hanstholm in 2009 (part of the full scale model) 20xø6m flyder scale
full C6 section to be installed at Horn Reef 2 in 2014
Next development steps development and construction of the full version to HR2
Power take off hydraulic Dimensions 80x17x5 Centerline device spacing for multiple devices (m)
Weight of super structure (ton) 1600 Weight of power take off equipment (ton) 40
Min installation depth (m) 10 Max installation depth (m) 30 Design lifetime (years) 20 Rated power (kW) of commercial unit 600 kW Wave energy absorption performance (kW) (before losses in conversion to electric power) as a function of significant wave height and peak wave period ****
40-50%
Source of wave energy absorption performance (numerical simulations or random wave model tests)
numerical simulation and reallife test results from protype in Hanstholm
Estimated date commercially available 2014
Estimated production cost per rated 7 mio €
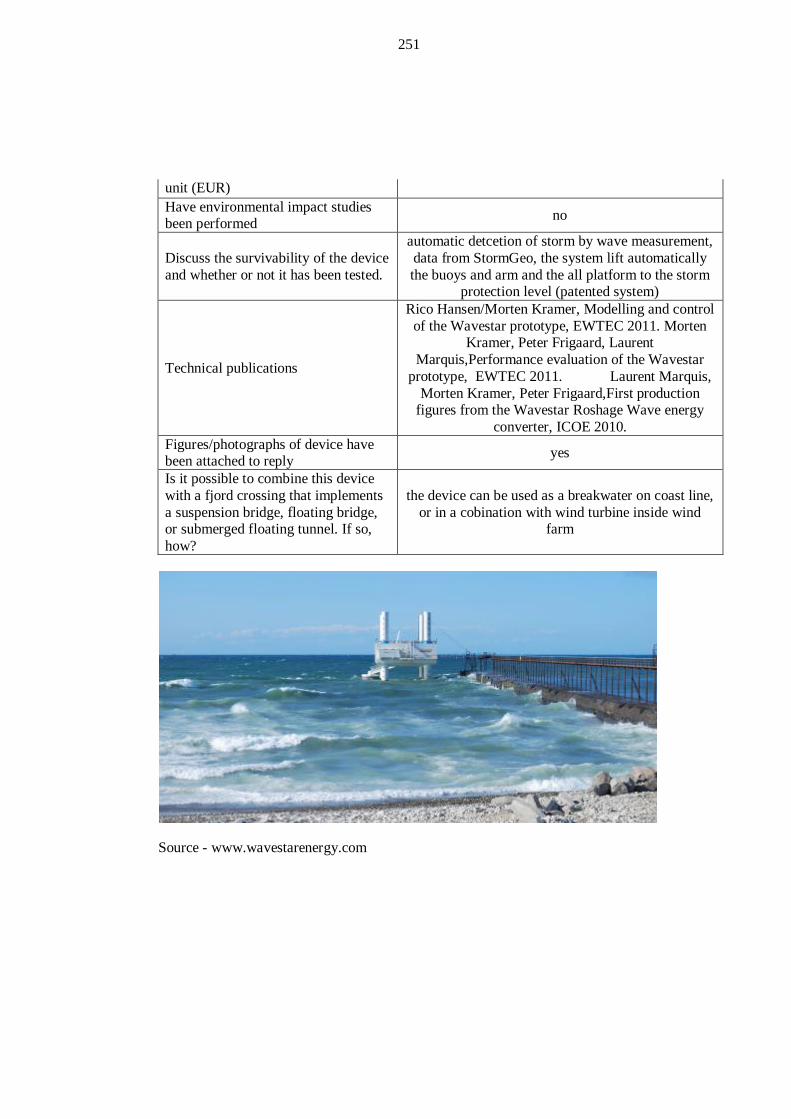
251
unit (EUR) Have environmental impact studies been performed no
Discuss the survivability of the device and whether or not it has been tested.
automatic detcetion of storm by wave measurement, data from StormGeo, the system lift automatically the buoys and arm and the all platform to the storm
protection level (patented system)
Technical publications
Rico Hansen/Morten Kramer, Modelling and control of the Wavestar prototype, EWTEC 2011. Morten
Kramer, Peter Frigaard, Laurent Marquis,Performance evaluation of the Wavestar
prototype, EWTEC 2011. Laurent Marquis, Morten Kramer, Peter Frigaard,First production
figures from the Wavestar Roshage Wave energy converter, ICOE 2010.
Figures/photographs of device have been attached to reply yes
Is it possible to combine this device with a fjord crossing that implements a suspension bridge, floating bridge, or submerged floating tunnel. If so, how?
the device can be used as a breakwater on coast line, or in a cobination with wind turbine inside wind
farm
Source - www.wavestarenergy.com
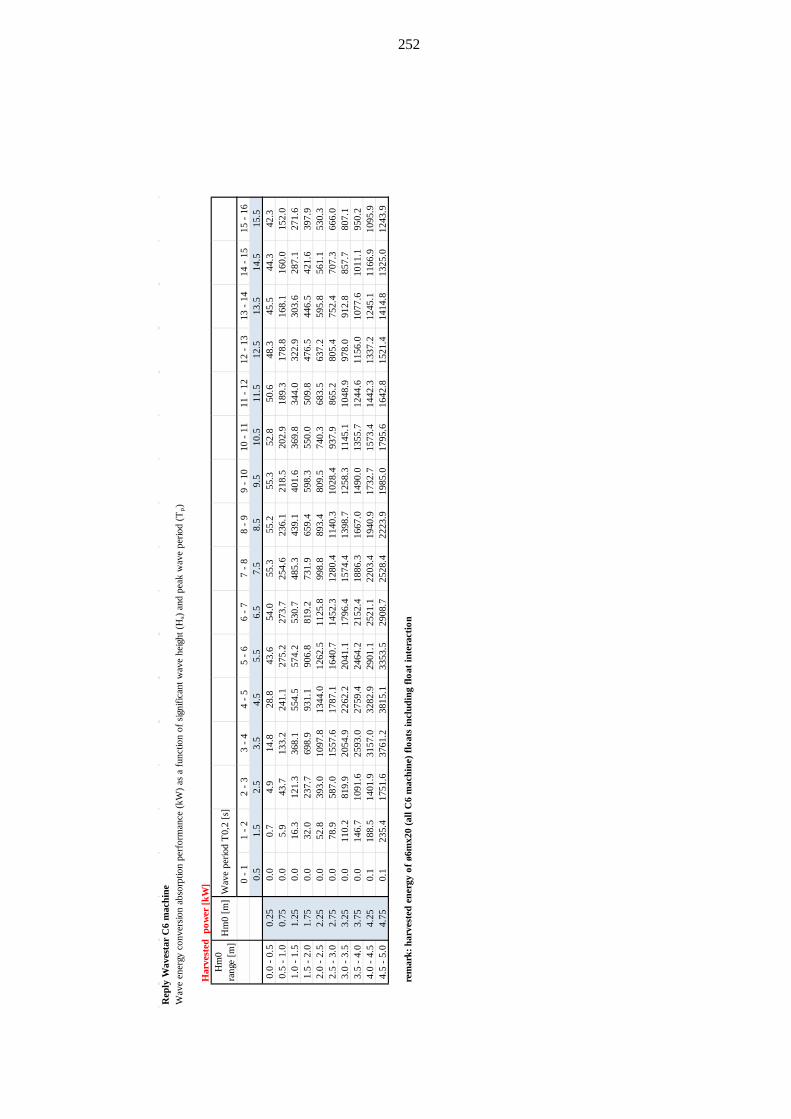
252
Rep
ly W
aves
tar
C6
mac
hine
Wav
e en
ergy
con
vers
ion
abso
rptio
n pe
rfor
man
ce (k
W) a
s a
func
tion
of s
igni
fican
t wav
e he
ight
(Hs)
and
peak
wav
e pe
riod
(Tp)
Har
vest
ed p
ower
[kW
]H
m0
rang
e [m
]H
m0
[m]
Wav
e pe
riod
T0,
2 [s
]
0 - 1
1 - 2
2 - 3
3 - 4
4 - 5
5 - 6
6 - 7
7 - 8
8 - 9
9 - 1
010
- 11
11 -
1212
- 13
13 -
1414
- 15
15 -
160.
51.
52.
53.
54.
55.
56.
57.
58.
59.
510
.511
.512
.513
.514
.515
.50.
0 - 0
.50.
250.
00.
74.
914
.828
.843
.654
.055
.355
.255
.352
.850
.648
.345
.544
.342
.30.
5 - 1
.00.
750.
05.
943
.713
3.2
241.
127
5.2
273.
725
4.6
236.
121
8.5
202.
918
9.3
178.
816
8.1
160.
015
2.0
1.0
- 1.5
1.25
0.0
16.3
121.
336
8.1
554.
557
4.2
530.
748
5.3
439.
140
1.6
369.
834
4.0
322.
930
3.6
287.
127
1.6
1.5
- 2.0
1.75
0.0
32.0
237.
769
8.9
931.
190
6.8
819.
273
1.9
659.
459
8.3
550.
050
9.8
476.
544
6.5
421.
639
7.9
2.0
- 2.5
2.25
0.0
52.8
393.
010
97.8
1344
.012
62.5
1125
.899
8.8
893.
480
9.5
740.
368
3.5
637.
259
5.8
561.
153
0.3
2.5
- 3.0
2.75
0.0
78.9
587.
015
57.6
1787
.116
40.7
1452
.312
80.4
1140
.310
28.4
937.
986
5.2
805.
475
2.4
707.
366
6.0
3.0
- 3.5
3.25
0.0
110.
281
9.9
2054
.922
62.2
2041
.117
96.4
1574
.413
98.7
1258
.311
45.1
1048
.997
8.0
912.
885
7.7
807.
13.
5 - 4
.03.
750.
014
6.7
1091
.625
93.0
2759
.424
64.2
2152
.418
86.3
1667
.014
90.0
1355
.712
44.6
1156
.010
77.6
1011
.195
0.2
4.0
- 4.5
4.25
0.1
188.
514
01.9
3157
.032
82.9
2901
.125
21.1
2203
.419
40.9
1732
.715
73.4
1442
.313
37.2
1245
.111
66.9
1095
.94.
5 - 5
.04.
750.
123
5.4
1751
.637
61.2
3815
.133
53.5
2908
.725
28.4
2223
.919
85.0
1795
.616
42.8
1521
.414
14.8
1325
.012
43.9
rem
ark:
har
vest
ed e
nerg
y of
ø6m
x20
(all
C6
mac
hine
) flo
ats
incl
udin
g flo
at in
tera
ctio
n

253
Company Waveberg Development Country USA Web address www.waveberg.com
Technology Name Waveberg
Device Type ** A) Attenuator B) Point Absorber C) Oscillating Wave Surge Converter D) Oscillating Water Column E) Overtopping/Terminator Device F) Submerged Pressure Differential G) Other Designs
A
Features / Design principle
Waveberg is an asymmetrical series of hinged floats driving pumps, which pressurize seawater for
delivery to shore via flexible pipes. The overall triangular shape in plan view assures each portion of
the device receives fresh wave crest. Development status *** TRL 1-3, TRL 4, TRL 5/6, TRL 7/8 or TRL 9
TRL 5/6
Description of any and all prototypes (including test facility used or location of testing, dates, and hours of operation)
1:15 scale model in tank tests, NRC Canada Newfoundland.
Same model in sea trials for 14 months, scaled equivalent 6 years.
1:4 model tested in Florida waters, survived storm.
Model was sabotaged.
1:32 model tested at HMRC in 2006, 2007 and 2009 in several configurations. The data from the latest is
used for the rest of this presentation.
Next development steps Seeking investment. Until EUR 2,300,000 is raised, no further steps. Following investment, two years to
completion of full-scale test at EMEC. Power take off Hydraulic using sea water Dimensions Triangle 53 m base by 53 m lengtht. Centerline device spacing for multiple devices (m) 100m
Weight of super structure (ton) 15 Weight of power take off equipment (ton) 1
Min installation depth (m) 15 Max installation depth (m) none Design lifetime (years) 12 Rated power (kW) of commercial unit 125 Wave energy absorption performance (kW) (before losses in conversion to electric power) as a function of
varies, typical 30% of wave energy absorbed across frequencies.
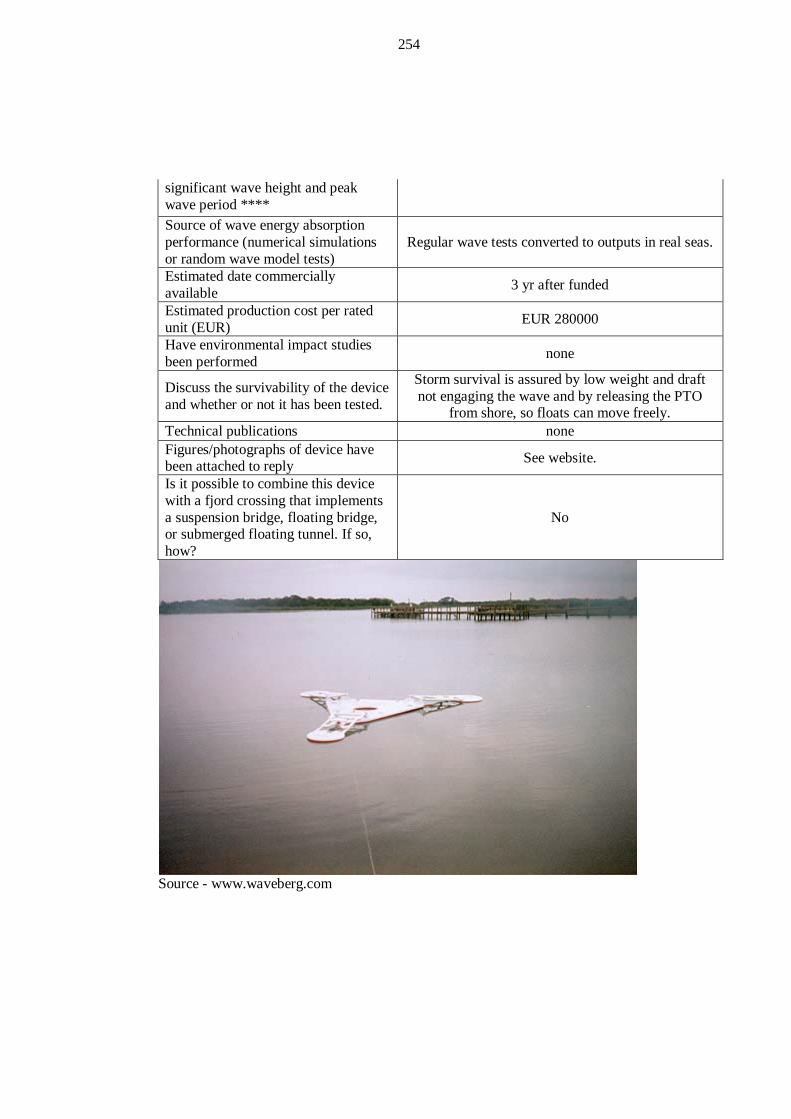
254
significant wave height and peak wave period **** Source of wave energy absorption performance (numerical simulations or random wave model tests)
Regular wave tests converted to outputs in real seas.
Estimated date commercially available 3 yr after funded
Estimated production cost per rated unit (EUR) EUR 280000
Have environmental impact studies been performed none
Discuss the survivability of the device and whether or not it has been tested.
Storm survival is assured by low weight and draft not engaging the wave and by releasing the PTO
from shore, so floats can move freely. Technical publications none Figures/photographs of device have been attached to reply See website.
Is it possible to combine this device with a fjord crossing that implements a suspension bridge, floating bridge, or submerged floating tunnel. If so, how?
No
Source - www.waveberg.com

255
Wav
e en
ergy
con
vers
ion
abso
rptio
n pe
rfor
man
ce (k
W) a
s a
func
tion
of s
igni
fican
t wav
e he
ight
(Hs)
and
peak
wav
e pe
riod
(Tp)
34
56
78
910
1112
1314
1516
1718
1920
1012
512
512
512
511
311
388
8888
9.5
125
125
125
125
125
110
110
8686
869
125
125
125
125
125
107
107
8484
848.
512
512
512
512
512
512
510
210
280
8080
812
512
512
512
512
512
512
596
9675
7575
7.5
125
125
125
125
125
125
119
9090
7070
707
125
125
125
125
125
125
125
110
8383
6565
656.
512
512
512
512
512
512
512
512
510
075
7559
5959
612
512
512
512
512
512
512
512
512
590
6868
5353
535.
512
512
512
512
512
512
512
512
512
511
179
6060
4747
475
125
125
125
125
125
125
125
112
121
8762
4747
3737
374.
512
512
512
512
512
512
511
610
211
179
5743
4334
3434
412
512
512
512
512
510
599
9097
7050
3838
2929
293.
512
512
512
512
512
511
411
311
011
985
6146
4636
3636
311
812
512
512
510
610
111
112
112
594
6751
5140
4040
2.5
117
125
125
125
9482
9084
9165
4735
3528
2828
286
121
115
9681
6757
5458
4230
2323
1818
181.
567
125
8867
4736
3025
2720
1411
118
88
138
8548
3422
1512
910
75
44
33
30.
59
2013
95
33
22
21
11
11
10.
125
11
11
00
00
00
00
00
00
Not
e: v
alue
s fo
r lon
g w
ave,
> 2
5 se
c. a
re c
rude
ly in
terp
olat
ed h
ere.
No
valu
es fo
r wav
es <
5 se
cs d
one
in ta
nk te
sts.
T p (s
)
Hs (m)

256
Company WavePiston ApS Country Denmark Web address http://www.wavepiston.dk Technology Name WavePiston
Device Type ** A) Attenuator B) Point Absorber C) Oscillating Wave Surge Converter D) Oscillating Water Column E) Overtopping/Terminator Device F) Submerged Pressure Differential G) Other Designs
Multiple attenuators mounted on the same string. G with strong elements of A
Features / Design principle
Wavepiston is a long (several wavelengths) load-bearing structure whereupon a large number of
vertical plates are mounted. The vertical plates are forced into horizontal movement by of the
oscillating wave movement. The most important feature of the WavePiston
system is the employment of force cancellation. As the elongated structure have a length of several wavelengths, each plate in the structure will be
subjected to a different load due to the stochastic nature of wave movement. Depending on the phase
of the waves acting on the individual plates the force will either be in the direction of the waves or against
the direction of the waves. Thus, the sum of the forces acting on all plates will be relatively small, as
the force on counter-moving plates will tend to cancel each other out.
To satisfy the need for robustness every sub-system in the WavePiston concept has been constructed with simplicity and robustness in mind. A prime example on this design philosophy is the power-
takeoff system. Although a system employing linear generators might prove more efficient, the power-takeoff system of WavePiston is based on simple,
reliable and rugged hydraulics operated at low pressure. This solution is cheap, robust and
completely impervious to ingress of seawater, hence promising a long lifetime without maintenance. An important additional benefit of having a very
long device is that large waves will only hit a small part of the structure at a time. Therefore this device
has an intrinsic ability to handle freak waves. Development status *** TRL 1-3, TRL 4, TRL 5/6, TRL 7/8 or TRL 9
TRL 5/6

257
Description of any and all prototypes (including test facility used or location of testing, dates, and hours of operation)
A 1:30 prototype has been extensively tested at the University of Aalborg, the leading Danish authority within the field of wavepower. The scale was given
by the depth of the test bassin, since a simulated water depth of 30 meters was the goal of the test.
The testing was highly successful and resulted in a subsequent M.Sc. project.
Next development steps
Currently negotiations are carried out between WavePiston ApS and GEDI, the leading Chinese authority on design of power systems. GEDI will
probably deploy a 1:1 prototype of the WavePiston system off the Chinese coast in 2012 or early 2013. WavePiston is also negotiating with a (anonymous)
Chinese producer of GFRP to start a joint development of a complete energy producing system using WavePiston technology. If this collaboration is
fruitful it will be possible to buy a plug'n play system directly from the producer.
Power take off
Hydraulic, using sea-water as working fluid. Seawater is environmentally neutral. If sea-water is
pumped to a reservoir instead of direct power production, this will allow for efficient storage until
the power is needed.
Dimensions
A very important advantage of the WavePiston principle is the complete flexibility to tailor the
system to any sea condition. The only dimension which is fixed is the length of the main string which should be at least one wavelength and preferably >2
wavelengths in order to take full advantage of the patented force cancellation principle. A fair guess on a system suitable for your purpose is strings having a
length of 300 m fitted with 15 pumps each. As for the width of the system, there is no real limit.
The system can be a narrow as one string and as wide as the entire cost-line if enough strings are
placed side by side. Note that the system operates almost fully
submerged and will be virtually invisible from the coast. If the limited visibility is a problem the buoys
placed in the end of the strings can be configured with a high visible cross-section.
Centerline device spacing for multiple devices (m)
The spacing between individual strings is dependent on the wanted efficiency of the system. For a high
efficiency system (40-50%) the strings will be placed with a distance of 20m. A low efficient, low impact system having an efficiency of about 20%
will have a string spacing of 50m. Note that the high efficiency system will comprise guidelines and side anchors to prevent clashing of the strings in erratic
wave conditions.

258
Weight of super structure (ton) No superstructure, system operating fully submerged. Generator is placed onshore.
Weight of power take off equipment (ton)
Depends again on the rated power of the system. For a 1MW system the estimated weight of turbine +
generator is 2 metric tonnes. Min installation depth (m) Outside surf-zone.
Max installation depth (m) No limitations, however anchoring in very deep waters might render the concept to costly.
Design lifetime (years)
Depends on design. 15 or 20 years is realistic for fully developed system. WavePiston relies on
standard mooring techniques developed for off-shore applications. The pumps will need service during the
20 years lifespan.
Rated power (kW) of commercial unit
The unit currently developed in collaboration with WavePiston and an (anonymous) Chinese producer
is intended for off-grid applications and have a rating of 30 kW. The design philosophy of
WavePiston is that systems should be specifically designed to the waters where it is depolyed, taking into account the locale wave climate. Due to the
modularity of the WavePiston system this customized design is extremely simple and will always result in the most cost efficient solution. WavePiston systems comprises a multitude of
strings all coupled to the same turbine/generator. For a grid-connected energy harvesting park a sensible unit size will be 1MW. (Unit = turbine/generator +
10 strings)
Wave energy absorption performance (kW) (before losses in conversion to electric power) as a function of significant wave height and peak wave period ****
No definite numbers can be given here as the performance depends (among other things) on the dimensions of the plates, the density of pumps, the operating pressure of the system and the length of
the strings which are all freely selectable. As a rule of thumb the design study of the
WavePiston system made for the North Sea has an average efficiency of 30%, where the efficiency @
lower wavestates is > 60% and the efficiency at high wavestates is < 20%. The wavestate dependent efficiency is a very desireable feature since this
allows some water movement in the waters behind the system since minimizing the environmental impact of the wave power system. Also, a 100%
efficiency at high wavestates would mean that the PTO system would be very expensive as it should be
able to handle very high energies for comparably small periods of time.

259
Source of wave energy absorption performance (numerical simulations or random wave model tests)
2D wave experiments was carried out by WavePiston ApS as well as by staff at the University of Aalborg. The measurements has formed the basis for a thesis on WavePiston. The thesis can be sent to
you upon request. Subsequently to the experiments WavePiston has
refined the (1D)numerical methods originally devised by Niras (Report can be found in the
document section of the WavePiston wavesite) The (1D)numerical method will form the basis for any initial design, however there is currently no substitute to wave-tank experiments if detailed
performance in real 2D waves is wanted. The claimed efficiencies is based on experimental
measurements.
Estimated date commercially available
Autumn 2013, however blueprints exist and work on first prototypes could start within 2 months from
decision. Estimated production cost per rated unit (EUR)
1 EUR / installed watt, excluding grid connction. Thus, a 1 MW system would cost 1 MEUR
Have environmental impact studies been performed
No, but there is really no reason that the system would have any environmental impact since this is a floating structure shunting some (but not all) of the
wave energy. The amount of shunted wave-energy is a design parameter and can be chosen freely.

260
Discuss the survivability of the device and whether or not it has been tested.
The WavePiston concept was specifically designed with survivability in mind, using the inventors profound knowledge on offshore requirements.
The WavePiston system is very long. Hence a freak wave hitting the system will only affect a small part of the system at the same time. Consequently, the
WavePiston system is immune to freak-waves which is the biggest threat to this type of systems.
The systems comprises pressure compensators which double as swim bladders. Upon filling the swim bladders with water the system can avoid
storms by submerging. The submerging system also allows ships to sail over the system. Every exposed component of the WavePiston system is kept simple
and waterproof.
The survivability has NOT been tested in real sea conditions.
The very concept has been designed with survivability in mind, by off-shore engineers for an
off-shore environment. First of all the elongated structure of the strings spanning over several
wavelengths make the system intrinsically resistant to freak waves (rouge waves). In fact, any structure other than elongated structures will always be very
vulnerable to these waves. Is a storm rises the system is designed to submerge
and hence run away from large waves. Due to the modularity of the system a pump may fail
without compromising the function of a string. A string may fail without compromising the function
of the whole system (a system comprises one turbine/generator unit and several strings)
Technical publications
Experimental Study on the WavePiston Wave Energy Converter. / Pecher, Arthur ; Kofoed, Jens Peter ; Angelelli, E..Aalborg : Aalborg University.
Department of Civil Engineering, 2010. 28 p. (DCE Contract Reports; 73).
Experiments on the WavePiston, Wave Energy Converter
Angelelli, E., Zanuttigh, B. et al. 9th ewtec 2011 University of Southampton 2011
Title: Robustness and Force Cancellation - the Keys
to Commercial Wave Power Generation Dr.Kristian Glejbol, Founding Parterners,
WavePiston ApS, Denmark LCES, Dalian 2011
Figures/photographs of device have been attached to reply Please see our homepage www.wavepiston.dk

261
Is it possible to combine this device with a fjord crossing that implements a suspension bridge, floating bridge, or submerged floating tunnel. If so, how?
This device is superbly fitted to attach to a suspension bridge or a floating bridge, where the
bridge can act as superstructure for the generator/turbine system.
This device could be fitted to a submerged floating tunnel hereby reducing the mooring costs.
Source - http://www.wavepiston.dk

262
Company W4P Waves4Power AB Country Sweden Web address www.waves4power.com
Technology Name WaveEL-buoy
Device Type ** A) Attenuator B) Point Absorber C) Oscillating Wave Surge Converter D) Oscillating Water Column E) Overtopping/Terminator Device F) Submerged Pressure Differential G) Other Designs
B
Features / Design principle
The WaveEL works by principle of a two body oscillating system. The buoy with the characteristic long vertical acceleration tube below and the water column in the tube. The movement of a the water column is dampened by a water piston which is connected to a hydraulic piston in a cylinder. By loading the hydraulic piston the relative motion
between the wave induced heave of the buoy/tube and the large water mass – that is still and not
affected by the wave motion – is dampened and a gigantic hydraulic pump is created which pumps oil
to a hydraulic motor which in turn rotates a generator.
Development status *** TRL 1-3, TRL 4, TRL 5/6, TRL 7/8 or TRL 9
TRL 7/8
Description of any and all prototypes (including test facility used or location of testing, dates, and hours of operation)
Smaller scale IPS-buoys were tested in the mid 1970-1980 by sister company IPS InterProject
Service. First fullscale test by IPS in 1980-81 west of Vinga. Waves4Power have tested a new full scale
version of an improved IPS-buoy - now called WaveEL-buoy - in the summer of 2010. W4P is now preparing tests of a third generation full scale buoy
and the building of a small grid connected pilot plant on the Swedish west coast.
Next development steps
A pilot plant off the coast of Bohuslän with 4 grid connected buoys and the testing of a larger buoy off
the coast of Norway or Portugal in the next two years.
Power take off Oil hydraulic
Dimensions Buoy diameter 4-10 meters. Acc. Tube 20 - 35 meters deep.
Centerline device spacing for multiple devices (m) 35
Weight of super structure (ton) 45 Weight of power take off equipment (ton) 5

263
Min installation depth (m) 50 Max installation depth (m) 150 Design lifetime (years) 25 Rated power (kW) of commercial unit 250kW Wave energy absorption performance (kW) (before losses in conversion to electric power) as a function of significant wave height and peak wave period ****
As the device dimensions will be optimized for the prevailing wave state, there is no relevant way to fill the Wave Performance sheet without having access to a scatter diagram for the particular site for which
the device is to be used. Source of wave energy absorption performance (numerical simulations or random wave model tests)
Numerical simulations
Estimated date commercially available 2018
Estimated production cost per rated unit (EUR) 200kEUR
Have environmental impact studies been performed No
Discuss the survivability of the device and whether or not it has been tested.
The device has been ocean tested but not in at hurricane level. The device is by its axisymmetric shape and small dimensions in relation to the wave length in which it operates gives it an inherent great survivability. Mooring systems have been tested in
wave tank, computer simulated and ocean tested but not in hurricane winds. The system is considered
safe. The buoy has a patented overload feature that prevents the energy conversion system from pushing
beyond its limits even in extreme waves.
Technical publications
There are more than a dozen independent white papers written on the IPS-buoy principle when used with different power take off systems, most well-known are the works of Prof. Antonio Falcao at
Institute Superior Technology in Lissabon and also work by B-O Sjöström at the department of Civil Engineering (Väg och Vatten Byggnad) at CTH.
Figures/photographs of device have been attached to reply
Is it possible to combine this device with a fjord crossing that implements a suspension bridge, floating bridge, or submerged floating tunnel. If so, how?
The WaveEL-buoy is free floating and can be moored to a floating or fixed structure as long as the
water depth is sufficient for the acceleration tube.

264
Source - www.waves4power.com

265
Company Wello Ltd. Country Finland Web address http://www.wello.eu/
Technology Name Penguin
Device Type ** A) Attenuator B) Point Absorber C) Oscillating Wave Surge Converter D) Oscillating Water Column E) Overtopping/Terminator Device F) Submerged Pressure Differential G) Other Designs
G
Features / Design principle
The Penguin is fully sealed floating generator platform with all moving parts inside the platform.
Wave energy is converted directly to electricity inside the floating equipment and connected to
national electricity network. Development status *** TRL 1-3, TRL 4, TRL 5/6, TRL 7/8 or TRL 9
TRL 7/8
Description of any and all prototypes (including test facility used or location of testing, dates, and hours of operation)
A 1:18 scale tested both in wave tank and at sea,Helsinki University of Technology 2008-11. A 1:8 scale model storm survivability tested in sea
condition at Baltic Sea 2011. Full scale tests starting spring 2012 in Orkney, Scotland.
Next development steps Full scale device installation ongoing in Orkney, Scotland.
Power take off Direct from motion to generator
Dimensions length 30m, width 15m, draught 7m and above water 1,8m.
Centerline device spacing for multiple devices (m) 100
Weight of super structure (ton) 1400 Weight of power take off equipment (ton) 65, included to superstructure
Min installation depth (m) 50 Max installation depth (m) 150 (- - 1500, adjusted mooring) Design lifetime (years) 25 Rated power (kW) of commercial unit 1000 Wave energy absorption performance (kW) (before losses in conversion to electric power) as a function of significant wave height and peak wave period ****
See below
Source of wave energy absorption performance (numerical simulations or random wave model tests)
Random wave model tests and numerical simulations
Estimated date commercially 2012-10

266
available Estimated production cost per rated unit (EUR) 5,000,000
Have environmental impact studies been performed Yes
Discuss the survivability of the device and whether or not it has been tested.
Mooring arrangement is verified by DNV. 1:8 scale model has survived 100-years storm
Technical publications Multiple patent applications
Figures/photographs of device have been attached to reply
Yes, see also: http://www.youtube.com/watch?v=FlCXnCUis8g,
http://www.youtube.com/watch?v=iljClsPvigs Is it possible to combine this device with a fjord crossing that implements a suspension bridge, floating bridge, or submerged floating tunnel. If so, how?
This device is best suited for offshore applications. Combining might be usefull for cable routing to ease
grid connection.
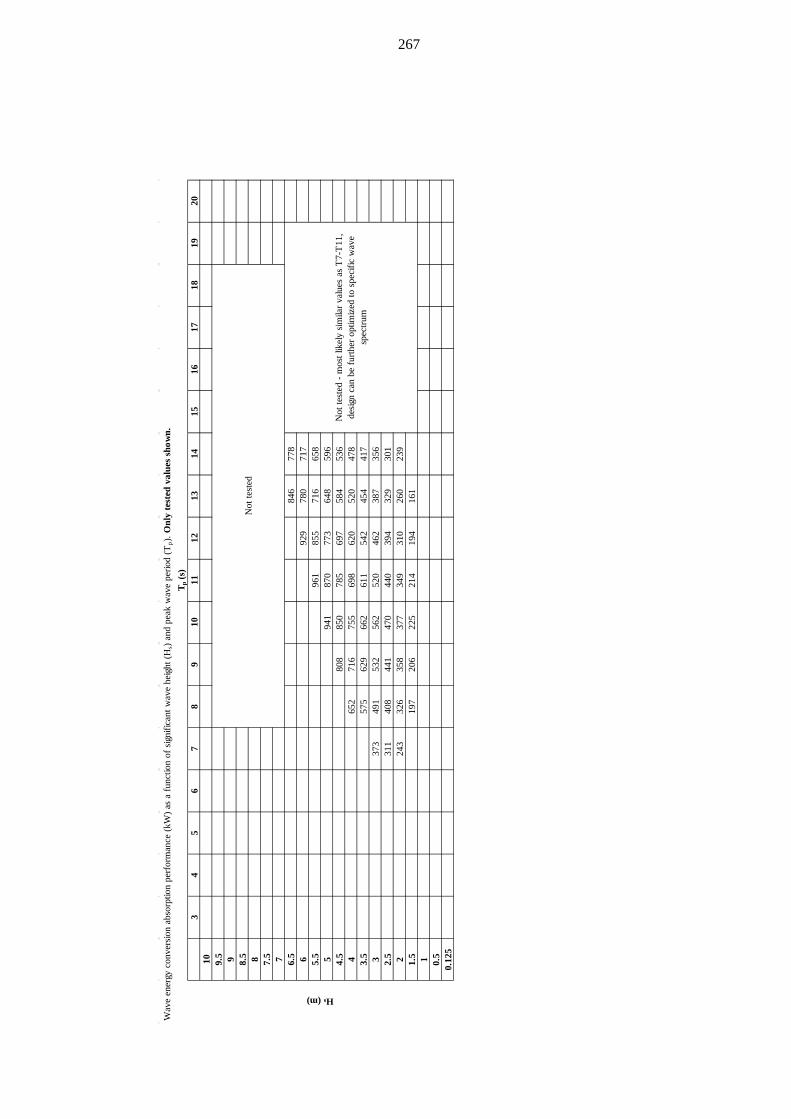
267
Wav
e en
ergy
con
vers
ion
abso
rptio
n pe
rfor
man
ce (k
W) a
s a
func
tion
of s
igni
fican
t wav
e he
ight
(Hs)
and
peak
wav
e pe
riod
(Tp)
. Onl
y te
sted
val
ues
show
n.
34
56
78
910
1112
1314
1516
1718
1920
10 9.5 9 8.5 8 7.5 7 6.5
846
778
692
978
071
75.
596
185
571
665
85
941
870
773
648
596
4.5
808
850
785
697
584
536
465
271
675
569
862
052
047
83.
557
562
966
261
154
245
441
73
373
491
532
562
520
462
387
356
2.5
311
408
441
470
440
394
329
301
224
332
635
837
734
931
026
023
91.
519
720
622
521
419
416
11 0.5
0.12
5
T p (s
)
Hs (m)
Not
test
ed -
mos
t lik
ely
simila
r val
ues
as T
7-T
11,
desig
n ca
n be
furth
er o
ptim
ized
to s
peci
fic w
ave
spec
trum
Not
test
ed

268
Appendix 7: Fjord crossing locations
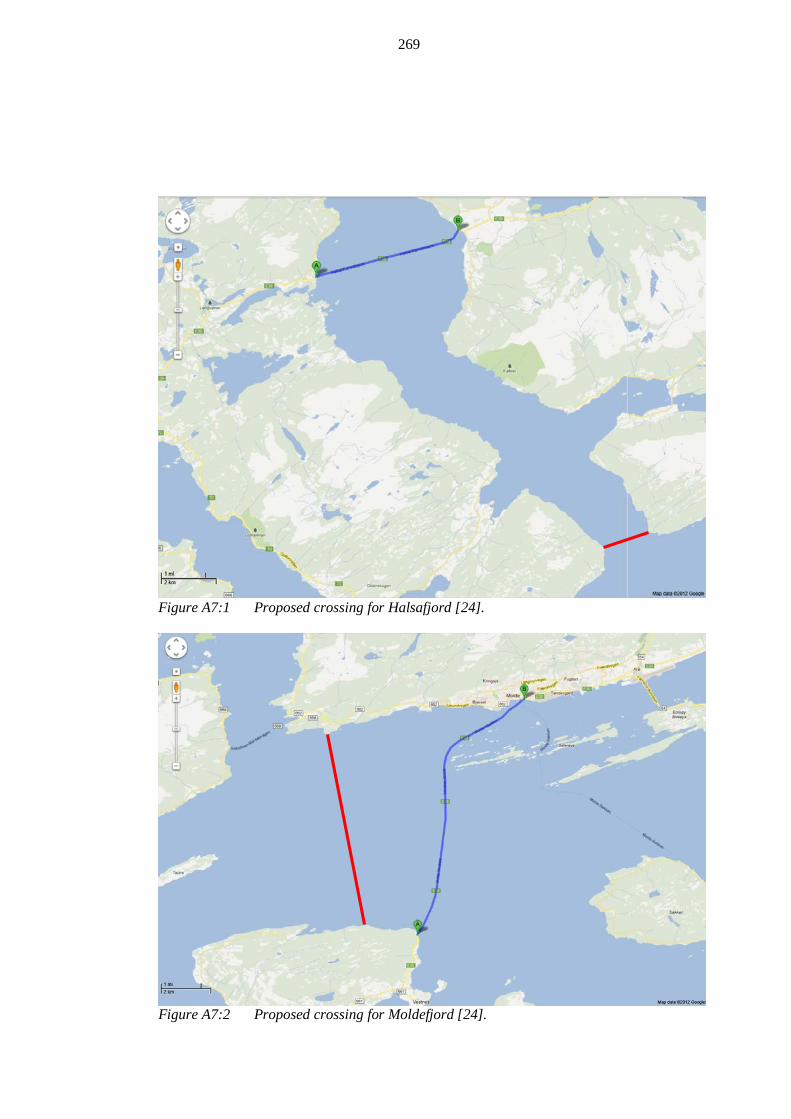
269
Figure A7:1 Proposed crossing for Halsafjord [24].
Figure A7:2 Proposed crossing for Moldefjord [24].

270
Figure A7:3 Proposed crossing for Storfjord [24].
Figure A7:4 Proposed crossing for Voldafjord [24].

271
Figure A7:5 Proposed crossing for Nordfjord [24].
Figure A7:6 Proposed crossing for Sognefjord [24].

272
Figure A7:7 Proposed crossings for Bjørnafjord a and Bjørnafjord b [24].
Figure A7:8 Proposed crossing for Boknafjord [24].

273
Appendix 8: Calculations of the number of TISEC devices

274
Table A8:1 Number of TISEC devices for the different fjord crossing locations.
Moldefjorden (Crossing # 2)
Voldafjord (Crossing # 4)
Nordfjord (Crossing # 5)
Boknafjord (Crossing # 8)
Technology Wdev (m)
Ldev (m)
Ntot_
sus/float Ntot_
SFT Ntot_
sus/float Ntot_S
FT Ntot_
sus/float Ntot_S
FT Ntot_
sus/float Ntot_
SFT Atlantis Resources Corp 18 18 282 239 59 50 47 40 296 251
BioPower Systems Pty Ltd 17 17 298 253 62 53 50 42 313 266
Hales Energy Ltd - - - - - - - - - - Hammerfest Strom Small 20 20 253 215 53 45 42 36 266 226
Hammerfest Strom Large 21 21 241 205 50 42 40 34 253 215
HPS AS 6 32 434 370 90 78 72 62 456 388 Hydro-Gen *) 3.57 3.57 2850 2422 600 510 484 410 2992 2544 Kepler Energy 10 120 60 51 12 10 10 8 64 54 Nautricity Ltd 14 14 362 308 76 64 61 52 381 323 Neptune Renewable Energy Ltd 11 11 462 392 97 82 78 66 485 412
Norwegian Ocean Power Small *) 12.65 12.65 401 341 84 71 67 57 421 358
Norwegian Ocean Power Large *) 22.36 22.36 226 192 47 40 38 32 238 202
Ocean Flow Energy Limited Small *) 5.08 5.08 2000 1700 420 358 338 288 2100 1784
Ocean Flow Energy Limited Large *) 16.0 16.0 317 269 66 56 53 45 333 283
Ocean Renewable Power Company 10 33 200 170 42 35 33 28 210 179
Tidal Energy Pty Ltd 1 1.5 1.5 16960 14415 3580 3045 2885 2450 17810 15135 Tidal Energy Pty Ltd 2 2.4 2.4 6357 5403 1341 1140 1080 918 6678 5676 Tidal Energy Pty Ltd 3 5 5 2034 1728 428 364 344 292 2136 1814 Tidal Energy Pty Ltd 4 7 7 1452 1234 306 260 246 208 1524 1296 Tidal Energy Pty Ltd 5 10 10 508 432 106 90 86 73 533 453 Tidal Generation Limited 18.2 18.2 278 237 58 49 46 39 292 249
Tidal Sails AS 10 10 508 432 106 90 86 73 533 453 Tide Tec AS 10 10 508 432 106 90 86 73 533 453 Tocardo BV 1 3.2 3.2 4767 4053 1005 855 810 687 5007 4254 Tocardo BV 2 6.4 6.4 1588 1350 334 284 268 228 1668 1418 Tocardo BV 3 4.6 4.6 2210 1878 466 396 374 318 2322 1972 Tocardo BV 4 9.2 9.2 552 469 116 98 93 79 580 493 Verdant Power Small 5 5 2034 1728 428 364 344 292 2136 1814 Verdant Power Large 10 10 508 432 106 90 86 73 533 453 Voith Hydro Small 13 13 390 332 82 69 66 56 410 348 Voith Hydro Large 16 16 317 269 66 56 53 45 333 283
*) Wdev and Ldev are approximated from the supplied data

275

276

277
Appendix 9: Calculations of the energy from TISEC devices

278
Table A9:1 Annual energy production for the different technologies and bridging structures for the different fjord crossing locations.
Moldefjorden (Crossing # 2)
Voldafjord (Crossing # 4)
Nordfjord (Crossing # 5)
Boknafjord (Crossing # 8)
Technology Prated (kW)
Esus/float (GWh/
yr)
ESFT (GWh/
yr)
Esus/float (GWh/
yr)
ESFT (GWh/
yr)
Esus/float (GWh/
yr)
ESFT (GWh/
yr)
Esus/float (GWh/
yr)
ESFT (GWh/
yr) Atlantis Resources Corp 1000 988 837 207 175 165 140 1037 880
BioPower Systems Pty Ltd 250 261 222 54 46 44 37 274 233
Hales Energy Ltd - - - - - - - - - Hammerfest Strom Small 300 266 226 56 47 44 38 280 238
Hammerfest Strom Large 1000 844 718 175 147 140 119 887 753
HPS AS 1000 1521 1296 315 273 252 217 1598 1360 Hydro-Gen 40 399 339 84 71 68 57 419 357 Kepler Energy 4600 967 822 193 161 161 129 1032 870 Nautricity Ltd 500 634 540 133 112 107 91 668 566 Neptune Renewable Energy Ltd 400 648 549 136 115 109 93 680 577
Norwegian Ocean Power Small 600 843 717 177 149 141 120 885 753
Norwegian Ocean Power Large 2500 1980 1682 412 350 333 280 2085 1770
Ocean Flow Energy Limited Small 35 245 208 52 44 41 35 258 219
Ocean Flow Energy Limited Large 1000 1111 943 231 196 186 158 1167 992
Ocean Renewable Power Company 180 126 107 26 22 21 18 132 113
Tidal Energy Pty Ltd 1 120 7131 6061 1505 1280 1213 1030 7489 6364 Tidal Energy Pty Ltd 2 300 6682 5680 1410 1198 1135 965 7020 5967 Tidal Energy Pty Ltd 3 1300 9265 7871 1950 1658 1567 1330 9730 8263 Tidal Energy Pty Ltd 4 2700 13737 11675 2895 2460 2327 1968 14418 12261 Tidal Energy Pty Ltd 5 5500 9790 8326 2043 1734 1657 1407 10272 8730 Tidal Generation Limited 1000 974 830 203 172 161 137 1023 872
Tidal Sails AS 10000 17800 15137 3714 3154 3013 2558 18676 15873
Tide Tec AS - - - - - - - - - Tocardo BV 1 86 1437 1221 303 258 244 207 1509 1282 Tocardo BV 2 43 239 203 50 43 40 34 251 214 Tocardo BV 3 174 1347 1145 284 241 228 194 1416 1202 Tocardo BV 4 87 168 143 35 30 28 24 177 150 Verdant Power Small 85 606 515 127 108 102 87 636 540 Verdant Power Large 500 890 757 186 158 151 128 934 794 Voith Hydro Small 1000 1367 1163 287 242 231 196 1437 1219 Voith Hydro Large 1000 1111 943 231 196 186 158 1167 992 Min Energy (GWh/yr) - 126 107 26 22 21 18 132 113
Max Energy (GWh/yr) - 17800 15137 3714 3154 3013 2558 18676 15873
Average Energy (GWh/yr) - 2875 2444 603 512 486 412 3019 2566
1000s of Homes Powered - 575 489 121 102 97 82 604 513

279
Appendix 10: Calculations of the number of WEC devices

280
Table A10:1 Number of WEC devices for the different fjord crossing locations for a suspension bridge or floating bridge design (Ntot_sus/float).
Technology Wspace (m) 1 2 3 4 5 6 7a 7b 8
Applied Technologies Company Ltd Varies - - - - - - - - -
AquaGen Technologies 15 470 2535 995 530 425 1130 395 1770 2665 Atargis Energy Corporation 0 - - - - - - - - - Atmocean 30 138 759 297 156 126 336 117 528 798 BioPower Systems Pty Ltd 100 13 75 29 15 12 33 11 52 79 Hann-Ocean Energy Pte Ltd 50 54 302 118 62 50 134 46 210 318 MotorWave group *) 7 203 1089 427 229 184 486 170 760 1144 Ocean Energy Industries, Inc. ? - - - - - - - - - Ocean Harvesting Technologies AB 50 54 302 118 62 50 134 46 210 318
OWWE - INNOVAKO Floating Bridge ? - - - - - - - - -
OWWE - INNOVAKO OWWE-Rig Varies - - - - - - - - -
OWWE - INNOVAKO Wave Pump-Rig Varies - - - - - - - - -
OWECO Ocean Wave Energy Company 1 5.51 3354 17992 7059 3783 3042 8021 2808 12558 18889
OWECO Ocean Wave Energy Company 2 10.93 903 4879 1911 1022 819 2170 756 3402 5124
OWECO Ocean Wave Energy Company 3 22 252 1384 540 288 232 616 212 964 1452
Oceanlinx Ltd Varies - - - - - - - - - PerpetuWave Power Pty Ltd 40 68 378 148 78 62 168 58 264 398 RESEN ENERGY 60 44 252 98 50 40 110 38 174 264 Sea Power Ltd 450 2 15 5 2 1 6 1 10 16 Seatricity 30 138 759 297 156 126 336 117 528 798 Seawood Designs Inc 32 129 711 276 147 117 315 108 495 747 Trident Energy Ltd Varies - - - - - - - - - Vigor Wave Energy AB 100 13 75 29 15 12 33 11 52 79 Voith Hydro Wavegen Varies - - - - - - - - - Waveenergyfyn 30 46 253 99 52 42 112 39 176 266 Wavestar A/S ? - - - - - - - - - WavePiston ApS 35 39 217 84 45 36 96 33 151 228 W4P Waves4Power AB 35 117 651 252 135 108 288 99 453 684 Wello Ltd. 100 13 75 29 15 12 33 11 52 79
*) Wdev and Ldev are approximated from the supplied data

281
Table A10:2 Number of WEC devices for the different fjord crossing locations for a submerged floating tunnel design (Ntot_SFT).
Technology Wspace (m) 1 2 3 4 5 6 7a 7b 8
Applied Technologies Company Ltd Varies - - - - - - - - -
AquaGen Technologies 15 400 2155 845 450 360 960 335 1505 2265 Atargis Energy Corporation 0 - - - - - - - - - Atmocean 30 117 645 252 132 105 285 99 450 678 BioPower Systems Pty Ltd 100 11 64 24 12 10 28 9 44 67 Hann-Ocean Energy Pte Ltd 50 46 256 100 52 42 114 38 178 270 MotorWave group *) 7 172 926 363 195 157 413 144 646 972 Ocean Energy Industries, Inc. ? - - - - - - - - - Ocean Harvesting Technologies AB 50 46 256 100 52 42 114 38 178 270
OWWE - INNOVAKO Floating Bridge ? - - - - - - - - -
OWWE - INNOVAKO OWWE-Rig Varies - - - - - - - - -
OWWE - INNOVAKO Wave Pump-Rig Varies - - - - - - - - -
OWECO Ocean Wave Energy Company 1 5.51 2847 15288 5993 3224 2587 6825 2392 10673 16055
OWECO Ocean Wave Energy Company 2 10.93 770 4144 1624 868 700 1848 644 2891 4354
OWECO Ocean Wave Energy Company 3 22 216 1176 460 244 196 520 180 820 1232
Oceanlinx Ltd Varies - - - - - - - - - PerpetuWave Power Pty Ltd 40 58 322 124 66 52 142 48 224 338 RESEN ENERGY 60 38 214 82 44 34 94 32 148 224 Sea Power Ltd 450 1 13 4 2 1 5 1 9 14 Seatricity 30 117 645 252 132 105 285 99 450 678 Seawood Designs Inc 32 111 603 234 126 99 267 93 420 636 Trident Energy Ltd Varies - - - - - - - - - Vigor Wave Energy AB 100 11 64 24 12 10 28 9 44 67 Voith Hydro Wavegen Varies - - - - - - - - - Waveenergyfyn 30 39 215 84 44 35 95 33 150 226 Wavestar A/S ? - - - - - - - - - WavePiston ApS 35 33 184 72 38 30 81 28 128 193 W4P Waves4Power AB 35 99 552 216 114 90 243 84 384 579 Wello Ltd. 100 11 64 24 12 10 28 9 44 67
*) Wdev and Ldev are approximated from the supplied data

282
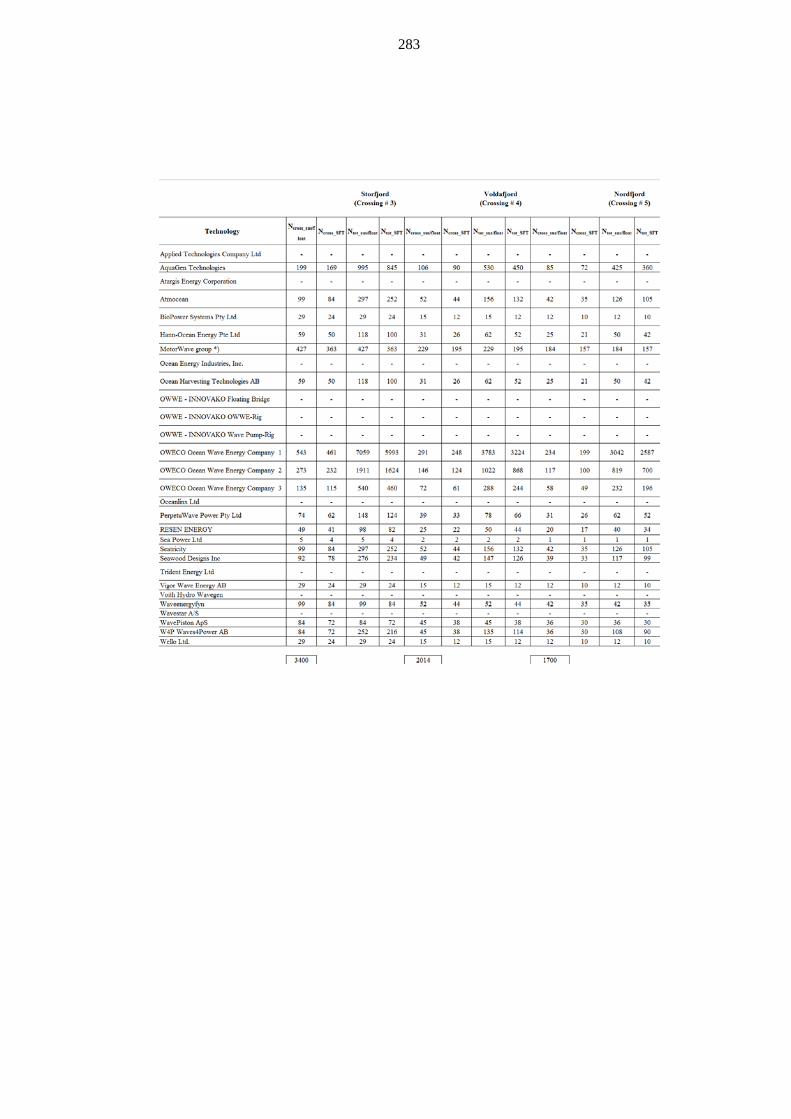
283
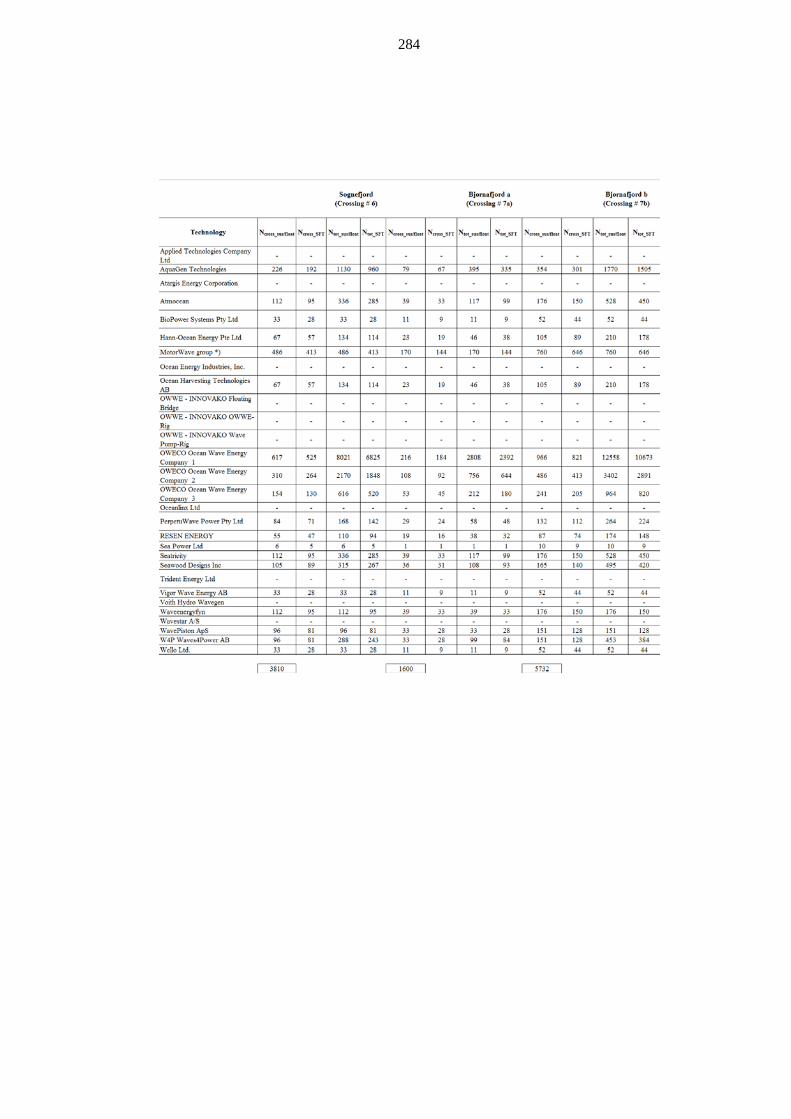
284

285

286
Appendix 11: Calculations of the energy from WEC devices

287
Table A11:1 Annual energy production for the different fjord crossings for a suspension bridge or floating bridge design (Esus/float).
Technology Prated (kW) 1 2 3 4 5 6 7a 7b 8
Applied Technologies Company Ltd 10-12000 - - - - - - - - -
AquaGen Technologies 100 165 888 349 186 149 396 138 620 934 Atargis Energy Corporation 5000 - - - - - - - - - Atmocean 20 10 53 21 11 9 24 8 37 56 BioPower Systems Pty Ltd 1000 46 263 102 53 42 116 39 182 277 Hann-Ocean Energy Pte Ltd 1000 189 1058 413 217 175 470 161 736 1114 MotorWave group 16 11 61 24 13 10 27 10 43 64 Ocean Energy Industries, Inc. 0.5-10000 - - - - - - - - -
Ocean Harvesting Technologies AB 150 28 159 62 33 26 70 24 110 167
OWWE - INNOVAKO Floating Bridge - - - - - - - - - -
OWWE - INNOVAKO OWWE-Rig 5000 - - - - - - - - -
OWWE - INNOVAKO Wave Pump-Rig - - - - - - - - - -
OWECO Ocean Wave Energy Company 1 30 353 1891 742 398 320 843 295 1320 1986
OWECO Ocean Wave Energy Company 2 250 791 4274 1674 895 717 1901 662 2980 4489
OWECO Ocean Wave Energy Company 3 2150 1898 10427 4068 2170 1748 4641 1597 7262 10939
Oceanlinx Ltd 500-2500 - - - - - - - - - PerpetuWave Power Pty Ltd 850 203 1126 441 232 185 500 173 786 1185
RESEN ENERGY 300 46 265 103 53 42 116 40 183 278 Sea Power Ltd 3750 26 197 66 26 13 79 13 131 210 Seatricity 30 15 80 31 16 13 35 12 56 84 Seawood Designs Inc 300 136 747 290 155 123 331 114 520 785 Trident Energy Ltd 40-150 - - - - - - - - - Vigor Wave Energy AB 100000 4555 26280 10162 5256 4205 11563 3854 18221 27682 Voith Hydro Wavegen 18.5-132 - - - - - - - - - Waveenergyfyn 200 32 177 69 36 29 78 27 123 186 Wavestar A/S 600 - - - - - - - - - WavePiston ApS 100 14 76 29 16 13 34 12 53 80 W4P Waves4Power AB 250 102 570 221 118 95 252 87 397 599 Wello Ltd. 1000 46 263 102 53 42 116 39 182 277 Min Energy (GWh/yr) - 10 53 21 11 9 24 8 37 56 Max Energy (GWh/yr) - 4555 26280 10162 5256 4205 11563 3854 18221 27682 Average Energy (GWh/yr) - 456 2571 998 523 419 1136 384 1786 2705 1000s of Homes Powered - 91 514 200 105 84 227 77 357 541

288
Table A11:2 Annual energy production for the different fjord crossings for a submerged floating tunnel design (ESFT).
Technology Prated (kW) 1 2 3 4 5 6 7a 7b 8
Applied Technologies Company Ltd 10-12000 - - - - - - - - -
AquaGen Technologies 100 140 755 296 158 126 336 117 527 794 Atargis Energy Corporation 5000 - - - - - - - - - Atmocean 20 8 45 18 9 7 20 7 32 48 BioPower Systems Pty Ltd 1000 39 224 84 42 35 98 32 154 235 Hann-Ocean Energy Pte Ltd 1000 161 897 350 182 147 399 133 624 946 MotorWave group *) 16 10 52 20 11 9 23 8 36 54 Ocean Energy Industries, Inc. 0.5-10000 - - - - - - - - - Ocean Harvesting Technologies AB 150 24 135 53 27 22 60 20 94 142
OWWE - INNOVAKO Floating Bridge - - - - - - - - - -
OWWE - INNOVAKO OWWE-Rig 5000 - - - - - - - - -
OWWE - INNOVAKO Wave Pump-Rig - - - - - - - - - -
OWECO Ocean Wave Energy Company 1 30 299 1607 630 339 272 717 251 1122 1688
OWECO Ocean Wave Energy Company 2 250 675 3630 1423 760 613 1619 564 2533 3814
OWECO Ocean Wave Energy Company 3 2150 1627 8860 3465 1838 1477 3917 1356 6178 9281
Oceanlinx Ltd 500-2500 - - - - - - - - - PerpetuWave Power Pty Ltd 850 173 959 369 197 155 423 143 667 1007 RESEN ENERGY 300 40 225 86 46 36 99 34 156 235 Sea Power Ltd 3750 13 171 53 26 13 66 13 118 184 Seatricity 30 12 68 26 14 11 30 10 47 71 Seawood Designs Inc 300 117 634 246 132 104 281 98 442 669 Trident Energy Ltd 40-150 - - - - - - - - - Vigor Wave Energy AB 100000 3854 22426 8410 4205 3504 9811 3154 15418 23477 Voith Hydro Wavegen 18.5-132 - - - - - - - - - Waveenergyfyn 200 27 151 59 31 25 67 23 105 158 Wavestar A/S 600 - - - - - - - - - WavePiston ApS 100 12 64 25 13 11 28 10 45 68 W4P Waves4Power AB 250 87 484 189 100 79 213 74 336 507 Wello Ltd. 1000 39 224 84 42 35 98 32 154 235 Min Energy (GWh/yr) - 8 45 18 9 7 20 7 32 48 Max Energy (GWh/yr) - 3854 22426 8410 4205 3504 9811 3154 15418 23477 Average Energy (GWh/yr) - 387 2190 836 430 352 963 320 1515 2295 1000s of Homes Powered - 77 438 167 86 70 193 64 303 459

SP Technical Research Institute of Sweden Box 857, SE-501 15 BORÅS, SWEDEN Telephone: +46 10 516 50 00, Telefax: +46 33 13 55 02 E-mail: [email protected], Internet: www.sp.se www.sp.se
SP Structural and Solid Mechanics SP Arbetsrapport :2012:06 ISBN ISSN 0284-5172
More information about publications published by SP: www.sp.se/publ
SP Technical Research Institute of Sweden Our work is concentrated on innovation and the development of value-adding technology. Using Sweden's most extensive and advanced resources for technical evaluation, measurement technology, research and development, we make an important contribution to the competitiveness and sustainable development of industry. Research is carried out in close conjunction with universities and institutes of technology, to the benefit of a customer base of about 9000 organisations, ranging from start-up companies developing new technologies or new ideas to international groups.

Statens vegvesenVegdirektoratet
PublikasjonsekspedisjonenPostboks 8142 Dep
0033 OSLOTlf: (+47 915) 02030
ISSN: 1893-1162