Integration of Weigh-in-Motion and Inductive Signature Technology for Advanced Truck Monitoring
17
Integration of Weigh-in-Motion and Inductive Signature Technology for Advanced Truck Monitoring Sarah Hernandez PhD Candidate Department of Civil and Environmental Engineering and Institute of Transportation Studies 4193 Anteater Instruction and Research Building (AIRB) University of California Irvine, CA 92697 (949) 737-6820 [email protected] Yeow Chern Andre Tok Postdoctoral Researcher Institute of Transportation Studies 4016 Anteater Instruction and Research Building (AIRB) University of California Irvine, CA 92697 (949) 824-5623 [email protected] Stephen G. Ritchie Professor Department of Civil and Environmental Engineering and Institute of Transportation Studies 4014 Anteater Instruction and Research Building (AIRB) University of California Irvine, CA 92697 (949) 824-8385 [email protected] Word count: 5,110 words + 9 tables/figures = 7,360 words Submitted to ABJ35 Committee on Highway Traffic Monitoring for publication and presentation at the Transportation Research Board 93 rd Annual Meeting and Transportation Research Record
Transcript of Integration of Weigh-in-Motion and Inductive Signature Technology for Advanced Truck Monitoring

Integration of Weigh-in-Motion and Inductive Signature Technology for Advanced Truck Monitoring
Sarah Hernandez PhD Candidate Department of Civil and Environmental Engineering and Institute of Transportation Studies 4193 Anteater Instruction and Research Building (AIRB) University of California Irvine, CA 92697 (949) 737-6820 [email protected] Yeow Chern Andre Tok Postdoctoral Researcher Institute of Transportation Studies 4016 Anteater Instruction and Research Building (AIRB) University of California Irvine, CA 92697 (949) 824-5623 [email protected] Stephen G. Ritchie Professor Department of Civil and Environmental Engineering and Institute of Transportation Studies 4014 Anteater Instruction and Research Building (AIRB) University of California Irvine, CA 92697 (949) 824-8385 [email protected]
Word count: 5,110 words + 9 tables/figures = 7,360 words
Submitted to ABJ35 Committee on Highway Traffic Monitoring for publication and presentation at the
Transportation Research Board 93rd Annual Meeting and Transportation Research Record

Hernandez, Tok, and Ritchie
Abstract Trucks have a significant impact on infrastructure, traffic congestion, energy consumption, pollution and quality of life. To better understand truck characteristics, comprehensive high resolution truck data is needed. Higher quality truck data can enable more accurate estimates of greenhouse gasses and emissions, allow for better management of infrastructure, provide insight to truck travel behavior, and enhance freight forecasting. Currently, truck traffic data is collected through limited means and with limited detail. Agencies can obtain or estimate truck travel statistics from surveys, inductive loop detectors (ILD) and weigh-in-motion (WIM) sites, or from manual counts, each of which have various limitations. Of these sources, WIM and ILD seem to be the most promising tools for capturing detailed truck information. Axle spacing and weight from existing WIM devices and unique inductive signatures indicative of body type from ILDs equipped with high sampling rate detector cards are complementary data sources that can be integrated to provide a synergistic resource that otherwise does not exist in practice, a resource that is able to overcome the drawbacks of the traditional truck data collection methods by providing data that is detailed, link specific, temporally continuous, up-to-date, and representative of the full truck population. This integrated data resource lends itself very readily toward detailed truck body classification which is presented as a case study. This body classification model is able to predict 35 different trailer body types for FHWA class 9 semi-tractors, achieving an 80 percent correct classification rate. In addition to the body classification model, the large data set resulting from the case study is itself a valuable and novel resource for truck studies.
Keywords: weigh-in-motion (WIM), inductive loop detector, inductive signature, truck monitoring, truck
body type, vehicle classification

Hernandez, Tok, and Ritchie
1
Introduction 1
At the national level, trucks account for approximately 10 percent of the annual vehicle distance 2 traveled (1). Although this represents a small portion of the total travel, the impacts of trucks on the 3 economy and freight transportation, air quality, traffic performance, pavement and infrastructure, and 4 safety are much more substantial than that of passenger vehicles. The economic impacts of trucks in 5 regard to freight transport are considerable. The Bureau of Transportation Statistics reported that 6 “trucking as a single mode (including for-hire and private use) was the most frequently used mode, 7 hauling an estimated 70 percent of the total value, 60 percent of the weight, and 34 percent of the 8 overall ton-miles” (1). In terms of environmental impacts, according to the California Air Resources 9 Board (CARB) Mobile Source Emissions Inventory, heavy-duty diesel trucks are the “single largest source 10 of nitrogen oxide emissions in California” as well as the “largest source of diesel particulate matter”, 11 both pollutants that have significant health impacts in addition to their contribution to environmental 12 degradation (2). Further, due to their large size and mass, medium and large commercial vehicles often 13 travel slower, possess lower acceleration rates and require much longer braking distances, leading to 14 moving bottlenecks which have adverse impacts on traffic performance (3). This concern has led to 15 investigations into traffic performance impacts such as increased congestion as well as potential 16 operational solutions like truck only lanes (4). Studies of commercial vehicle safety impacts have 17 confirmed that accidents involving large commercial vehicular traffic are often severe with higher 18 fatality rates, due to their larger profile and mass compared with passenger vehicles (5). 19
The availability of detailed truck data pales in comparison to the large impact trucks have on our 20 environment, health, and infrastructure. Agencies can obtain or estimate truck information from truck 21 Global Positioning Systems (GPS) data, paper-based surveys, vehicle detection stations (VDS) and weigh-22 in-motion (WIM) sites, or from manual counts. Truck GPS data is capable of providing origin destination 23 (OD) tracking and performance statistics (6) but it does not provide truck characteristics such as body 24 types or industry served and represents only subpopulations. Additionally, there are significant privacy 25 concerns that limit the availability of GPS data, and large commercially available datasets can be costly. 26 Paper based surveys, such as the Vehicle Inventory and Use Survey (VIUS), conducted by the US Census 27 Bureau (7), require expensive and time consuming data collection tasks like interviews, intercept surveys, 28 and mail-based surveys, and are only able to provide data from one point in time from a sub-sample of 29 the truck population and cannot be related to specific routes or links. A further drawback of VIUS is that 30 it was conducted only every five years, leaving a major data gap for years in between, and was 31 discontinued in 2002. Loop detector data from VDS, such as that provided by the Caltrans Performance 32 Measurement System (PeMS) in California cannot measure truck volumes directly and must rely on 33 estimation algorithms to estimate broad truck classes, and can only be used at aggregate levels (8). 34 Furthermore, while VDS are prevalent in metropolitan areas, they are limited outside of them, and may 35 not be ideal for capturing long haul truck traffic. WIM sites, on the other hand, are able to provide truck 36 counts by axle-based classes along with gross vehicle weights, but lack further detail about the cargo 37 type or distance traveled by trucks. Finally, manual counting entails recording truck traffic for short 38 sampling periods, and then extrapolating the sample counts to get an estimate for a whole year, i.e. 39 Annual Average Daily Truck Traffic (AADTT). AADTTs typically possess significant errors, as they depend 40 on short sampling periods which do not effectively capture the seasonal and diurnal trends of truck 41 travel patterns, even with the use of adjustment factors, due to the heterogeneous disposition of truck 42 travel patterns (8). Not surprisingly, the last method is discouraged by the USDOT (9). 43

Hernandez, Tok, and Ritchie
2
In this paper, we present a novel approach of integrating WIM and inductive signature data for building 1 more advanced models for monitoring truck travel. WIM and inductive signature data are exceptionally 2 complementary. WIM data provides information on a truck’s axle configuration and weights; however, 3 the axle-based information cannot be directly associated with a truck’s function or body configuration. 4 On the other hand, inductive signatures have the ability to distinguish trucks by body configuration, 5 although inductive signatures obtained from conventional loop sensors are not suited for obtaining 6 detailed axle configuration information (10). Furthermore, the location of axles from WIM data can be 7 used to partition signatures into body components in multi-unit trucks, allowing each component, such 8 as the drive unit and the trailer unit to be analyzed separately. 9
The detailed truck data provided by this integrated data resource can then be applied to obtain 10 classification and truck behavior through vehicle re-identification analyses. As demonstrated through 11 the case study presented in this paper, integration of WIM and inductive signature data can be used to 12 develop detailed body type classification models. Knowledge of body type permits many kinds of useful 13 analyses, such as calculating fees and cost allocations to highway users by class or associated industry, 14 spatial and temporal analysis of safety risks, energy efficiency and environmental impact of truck fleets 15 through VMT estimation, determining fuel demands, and linking between sampled/survey data and 16 population data. 17
Background 18
Conventionally, WIM technology is used to obtain axle-configuration-based classification of trucks, such 19 as the scheme used by the Federal Highway Administration (FHWA), while inductive loop sensors are 20 used to provide volume measures. However, the instrumentation of existing inductive loop sensors with 21 signature capability provides significant potential improvements in truck data. In this paper, we 22 integrate WIM data with inductive loop signature technology to provide a high resolution truck data 23 source. To the best of our knowledge there have not been any prior studies which integrate WIM data 24 with inductive loop signatures, thus the integration method described in this paper is quite novel. 25
Weigh-in-Motion Systems 26 WIM systems are implemented in many states for the purpose of reducing delay at static scales by pre-27 screening, and for collecting site specific continuous truck traffic information. WIM data can be used for 28 pavement studies, highway monitoring and capacity studies, accident rate calculations, and general 29 truck transport practices (11). There are a limited number of vendors of WIM systems that operate in 30 each state and for California all 106 WIM data stations are controlled by a single vendor, International 31 Road Dynamics (IRD) (11). In California, WIM sites are located throughout the state but concentrated in 32 urban regions (see Figure 1a). A typical WIM site includes bending plates straddled by square inductive 33 loop detectors in the outermost lanes and piezoelectric sensors straddled by inductive loops in the 34 innermost lanes (see Figure 1b). WIM sites collect vehicle arrival time and date, axle weights, gross 35 weight, axle spacing, overall vehicle length, and speed (12). Vehicle classification is determined from 36 these measures according to the truck specific classes of FHWA Scheme F which includes 13 axle-based 37 classes (14 classes for the State of California). Based on the axle spacing, length, and gross vehicle 38 weight the truck class is assigned by a predetermined table. 39
Hernandez, Tok, and Ritchie
3
1
(a) WIM sites in California 2
3
(b) WIM site configuration 4
Figure 1 WIM System Characteristics 5
Traffic Flow Traffic Flow
Inductive Loop
Sensors
Piezoelectric
Bending Plates
Configuration 1
Innermost Lane
Configuration 2
Outermost Lane

Hernandez, Tok, and Ritchie
4
Inductive Loop Detectors 1 Conventional loop detectors measure bivalent signals from inductive loops embedded in the pavement 2 and are capable of measuring aggregated volumes and occupancies. Unlike many other detector 3 systems such as imaging or acoustic sensors, loop detectors are inherently accurate, achieving the best 4 volume count accuracy compared with other common detection technologies, providing a good 5 technology platform to develop the proposed system. Finally, because magnetic inductance is invariant 6 to changes in temperature, lighting, visibility and humidity, ILDs are robust. Advanced inductive loop 7 detectors measure the inductance change in an inductive loop sensor at rates of up to 1200 samples per 8 second (13), producing analog waveform outputs, referred to as inductive signatures, for each traversing 9 vehicle. A significant advantage of advanced inductive loop detectors is their compatibility with existing 10 conventional bivalent ILDs. This allows existing conventional ILDs to be swapped with advanced ILDs 11 without suffering any loss in system functionality. 12
Integrating Data Sources 13
Given the complementary nature of the WIM and inductive signature data, along with the physical 14 embedded configuration of inductive loops within the WIM site, the two are ideally suited for 15 integration to provide a synergistic data resource. Implementation costs are not expected to be 16 significant because the integrated system does not require additional in-pavement infrastructure. Only 17 minor hardware adaptations are needed such as swapping the conventional detector cards for advanced 18 detector cards and deployment of a field computer, both of which are located within the roadside traffic 19 cabinet. The data integration procedure is presented in the following section in two parts: hardware 20 integration and data handling. Hardware integration involves replacing the existing bivalent inductive 21 loop module of the WIM controller with advanced inductive loop signature detector cards. Data 22 handling includes the pre-processing of inductive signatures and WIM records into a database structure 23 that is then accessed through a customized user interface. A third dimension of the integrated data 24 source that is necessary for model development, but not needed for actual implementation, is the 25 addition of still image capture hardware triggered by the loop detectors. This is to obtain detailed side 26 picture profiles of trucks which are incorporated into the database and user interface for later 27 identification of truck characteristics such as body type. 28
Hardware Integration 29 Two main types of WIM controllers are currently deployed in California: the earlier DOS-based IRD 1060 30 series controllers and the current Linux based IRD iSinc family of controllers. For our purposes, the main 31 distinction between the controllers is in their built-in ability to log inductive signature data. The loop 32 sensor module (LSM) of the 1060 WIM controllers is designed to obtain only conventional bivalent 33 inductive loop data whereas the LSM of the iSINC controllers have the ability to obtain inductive 34 signature data. The caveat for the iSINC controller however, is that inductive signature data is currently 35 designed only for diagnostic and troubleshooting purposes and is not currently available as an 36 operational feature within the system. Therefore, we could not readily use the iSinc system for our 37 purposes without further development by the product vendor. Furthermore, 1060 series controllers are 38 currently deployed at about 80 percent of current WIM sites within the California. Hence, despite their 39 age, a hardware integration solution with the 1060 series controllers would be applicable to a much 40 larger number of candidate sites currently available for deployment consideration. 41
A prototype LSM adapter was designed to adapt advanced inductive loop signature detector cards to 42 replace the 1060 WIM LSM. Inductive loop signature data was logged into a field processing unit via the 43 USB port located on the front panel of each signature detector card. Schematic layouts showing a 44

Hernandez, Tok, and Ritchie
5
comparison of the hardware setup for a standalone 1060 WIM controller and the proposed integration 1 with an advanced signature detector card are shown in Figure 2. With this set-up both inductive loop 2 signatures and WIM weight and axle spacing data can be collected at the WIM site. Lastly, in addition 3 to inductive loop signature and WIM data, still image data was collected for each passing vehicle by 4 connecting a digital SLR camera with a remote trigger to the loop detector card such that each loop 5 activation triggered the camera and a series of still images were captured for each passing vehicle at a 6 rate of three frames per second while the vehicle was over the loop. In the next section, the data 7 processing to join the data types and photos is described. 8
9
Figure 2 Comparison of Hardware Setup for Standalone 1060 WIM Controller (top) and 1060 WIM 10 Controller Integrated with Advanced Inductive Loop Signature Detector Cards for Inductive Signature 11 Data Logging 12 13 Data Handling 14 All inductive loop signature, WIM record, and photo data was stored in a relational database powered 15 by PostgreSQL. Currently, the 1060 WIM controller output is captured as a text file which is processed 16 and stored as individual vehicle records according to a unique vehicle identification number. Future 17 work will investigate the ability to replace the text file readout with binary data output from the serial 18 port of the WIM 1060 controller so that it can be directly inserted into the database without pre-19 processing. The inductive signature data is also pre-processed prior to insertion into the database 20 where each signature is stored according to a unique identification number. 21 22 A specially developed software user interface was developed in Visual Basic to efficiently integrate the 23 WIM data and signature data while also examining photos of each vehicle record for classification or 24 other desired purposes. The user interface was designed to communicate with the database and allow 25 the user to scroll through photos and select the vehicle class parameters while also linking inductive 26 loop signature records and WIM data records to the appropriate vehicle record. Figure 3 shows the user 27
1060 Controller
IST-222 LSM Adapter for WIM
lanes 1 & 2
1060 Controller
Loop Sensor Module
IST-222 Signature
Detector Card222 Input
File Interface
IST-222 Signature
Detector Card
WIM Lane #1
WIM Lane #2
Field Processing Unit
Null Modem Serial Cable
USB Cable
Custom Dual VGA-type 15-pin Interface
222 Interface
1060 Module Interface
WIM data logging
Ind
uct
ive
Sign
atu
re
dat
a lo
ggin
g
Scale Sensor ModuleModem
Standalone 1060
Integrated 1060
Replaces Loop Sensor Module

Hernandez, Tok, and Ritchie
6
interface for truck classification purposes. The rightmost image is the inductive loop signature and the 1 table below the signature is the list of vehicle signature records within the user-designated time window. 2 The center FHWA image based on the FHWA class predicted by the WIM controller and the table below 3 is the list of WIM vehicle records with the user-designated time window for the WIM data. The largest 4 table in the upper right is the list of vehicle records derived from the set of photos taken by the still 5 camera and grouped into vehicle records such that there may be one to five photos for each vehicle 6 record which the user can scroll through. The photo corresponding to the vehicle record, WIM record, 7 and inductive signature is show at the left. Lastly, since this interface was developed to classify vehicles 8 by body type, below the photo there is a selection region where the user designates the axle and body 9 configuration of the vehicle. 10
Classification is only one of the applications of this integrated data source and the method in which the 11 data is collected, pre-processed, and managed by the database can be applied for other uses for which 12 alternate user interfaces could be developed. For example, for vehicle re-identification, using the same 13 pre-processing techniques and database structure, the user interface could display signature and WIM 14 information from two sites which the user could then toggle through to find matched vehicle pairs. Also, 15 pairing of the WIM and signature data can be undertaken by a simple program that can map the 16 signature to its WIM record based on time, headways, and duration, for example. In the next section, 17 we present an application of the integrated data source for truck body classification. 18 19 20
21
Figure 3 Integrated Data System User Interface Example for Vehicle Classification 22
Hernandez, Tok, and Ritchie
7
Case Study: Body Classification 1
The integration of WIM and inductive loop signatures lends itself readily to detailed truck body 2 classification which is presented as case study of the integrated data source described in this paper. In 3 addition to the body classification model, the large data set resulting from the case study is itself a 4 valuable and novel resource for truck studies. 5
Background 6 Body classification data of commercial trucks can contribute significantly towards improved emissions 7 estimates, infrastructure and pavement management, and freight forecasting. Currently, the main truck 8 data available for emissions and freight models is limited to axle based classification from WIM, count 9 estimates from inductive loops, fleet size and commercial use from vehicle registration records, trip 10 patterns, commodity type, vehicle type, and trip lengths from state and national shipper/carrier surveys, 11 and vehicle miles traveled from AADTT counts. The data from these sources is commonly mapped to 12 the FHWA 13 class axle-based scheme, or simplified schemes based on weight classes which divide 13 trucks into medium, heavy, or light duty types. None of the sources are capable of providing body type 14 information, which can be a key indicator of the industry served by the truck as well as the travel 15 patterns of the truck. And while survey data is capable of providing origin-destination information and 16 truck or body type, surveys are limited by costs and cannot yet provide individual link or route level data. 17
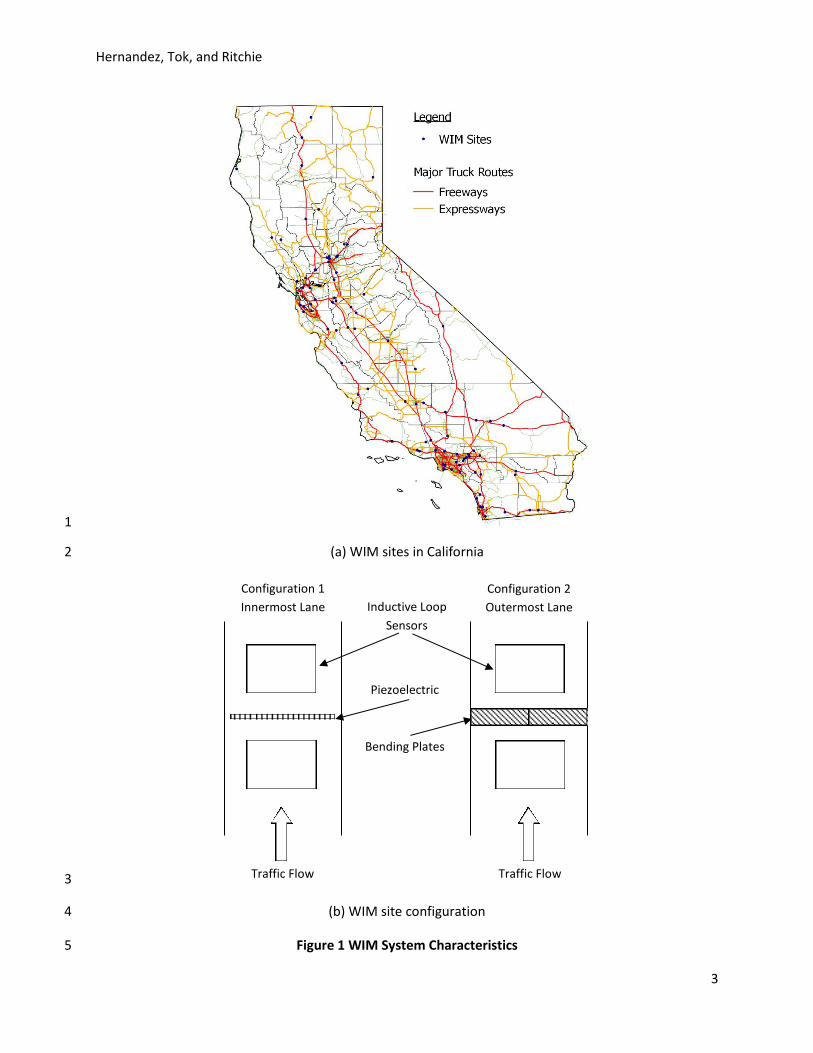
As an illustrative example of the lack of detail in axle-based classification, consider the most common 18 truck axle configuration, the five axle tractor trailer corresponding to FHWA class 9. Within class 9, there 19 exists a diverse distribution of trailer body types as shown in Figure 4, with the most common being 20 enclosed and refrigerated vans, platforms, and tanks. It is important to know the specific trailer type 21 because each trailer body type may have dissimilar travel patterns, unique emission rates, and distinct 22 effects on congestion and safety. For example, in relation to travel patterns, box containers travel 23 between ports and intermodal facilities whereas enclosed vans might be commercial delivery vehicles 24 traveling between regional distribution centers and businesses. The breakdown of class 9 into the wide 25 variety shown in Figure 4 clearly illustrates the significant amount of unknown information that exists in 26 existing truck monitoring data. 27
28
Figure 4 Trailer Body Type breakdown of FHWA Class 9 tractor-trailers 29

Hernandez, Tok, and Ritchie
8
1
In comparison to the previous classification methods which use inductive loop detectors (13-19), none 2 have been capable of distinguishing trucks into detailed body types shown in Figure 4. Even the most 3 detailed model by Tok and Ritchie (10) which focused on commercial vehicles contains only 10 trailer 4 unit types, and this level of detail required an advanced prototype loop detector to be installed in the 5 pavement. 6
As for body classification based on WIM data, there has only been one study by the FHWA (20), in which 7 data from WIM devices and truck characteristics from the 1992 Truck Inventory and Use Survey (TIUS) 8 were merged in an attempt to relate truck body type, weight, and cargo carried. The study examined 9 the potential of determining 11 distinctly defined body types from characteristics found in TIUS- the 10 total number of axles, the number of lift axles, total vehicle length, average gross vehicle weight (GVW), 11 the number of axles on trailers pulled by truck tractors, and the number of axles on trailers pulled by 12 straight trucks (20). The authors noted that “significant overlaps” were found in the body types that are 13 possible for a given set of variables and that using all five variables would provide the most accurate 14 inference on body type. The level of detail in body types achieved in this study is an improvement over 15 existing available data sources, but still lacks detail in the body type classification that are needed for 16 freight modeling. 17
Classification Scheme Development 18 A key component in the development of the body classification model was the creation of a 19 classification scheme that captured the diversity of truck bodies found in the data. The truck body type 20 classification scheme originally based on the 28 VIUS defined body classes was further refined to 35 21 trailer body types as revealed by the collected data and shown in Table 1. Definitions of each body type 22 including a photo and inductive signature example can be found online1. 23
1 Trailer Unit Body Type Dictionary: http://goo.gl/nACH7

Hernandez, Tok, and Ritchie
9
Table 1 Classification Scheme for Trailer Units 1
2 Study Locations and Data 3 Four sites were selected for data collection ranging geographically from urban centers in Southern 4
California to more rural areas in Northern California. Sites were selected to enhance the variety body 5
types collected. The location, site name, data type, date of collection, and number of collected truck 6
samples as well as the total number of FHWA Class 9 records are shown and summarized in Figure 5. 7
Figure 6 shows a typical data collection hardware setup at the southbound SR-99 Fresno WIM site. 8
Body Category Body Type
Vans
Enclosed
Reefer
Drop Frame
Curtain-side
Open Top
Agricultural
Open Agricultural Van
Platforms
Basic
Low Boy
Platform with devices
Tanks
Hot Product Tank
Deep Drop Tank
Food Grade Tank
Petroleum Tank
Chemical Tank
Crude Oil Tank
Air Compression Tank
Propane Tank
Pneumatic
Specialty
Hopper
Beverage
Pole/logging/pipe (with and without
platform)
Automobile Transport
Livestock
Dump
End Dump
Bottom Dump
Bulk Waste Transport
Containers
Container Chassis
40ft Box Container
20ft Box Container
20ft Box Container on 40ft Chassis
53ft Box Container
Small Trailers
Recreational Vehicle or ‘5th
Wheel’
Towed Passenger Vehicle
Small trailer or dolly

Hernandez, Tok, and Ritchie
10
1
Figure 5 WIM Data collection sites 2 3

Hernandez, Tok, and Ritchie
11
1 Figure 6 Data collection setup at SB SR-99 Fresno WIM site 2 3 Preliminary Body Classification Model 4 The body classification model developed in this case study focuses on the trailer portion of FHWA Class 5 9 semi-truck configurations since these represent the most commonly observed truck types and have a 6 very diverse set of trailer body types. A total of 5,667 FHWA class 9 truck records were fully processed, 7 i.e. still captured image, vehicle body configuration, inductive loop signature, and WIM-based vehicle 8 length, axle spacing and weight records were assigned to each vehicle record. The completed records 9 were used for model development and testing. The classification methodology was divided into two 10 parts: feature extraction and model development. 11 12 Feature Extraction 13 At the most primitive level, if inductive loop signature data is used to distinguish body type, then weight 14 data can be included to differentiate weight classes (i.e. medium-heavy, heavy, heavy-heavy, etc. as 15 used by the California Air Resources Board) by body type. A more enhanced method, and that adopted 16 here, was to use the WIM axle spacing and vehicle length data to parse the inductive loop signature of 17 each vehicle such that features are only extracted for the portion of the signature pertaining to the body 18 unit being distinguished. For example, given a signature from a semi-tractor-trailer combination, the 19 WIM axle spacing was used to break the signature into the tractor portion and the trailer portion which 20 would then be feed separately into classification models. Figure 7 shows an example of how the WIM 21 axle spacing data was used to parse the tractor and trailer portions of an inductive loop signature 22 resulting in change in magnitude between each pair of equally spaced interpolated magnitudes. 23
Still image camera
Inductive Signature Detector Cards
WIM Controller

Hernandez, Tok, and Ritchie
12
1
2
Figure 7 Data Fusion Approach for Combined WIM and Inductive Loop Signature Model 3 4
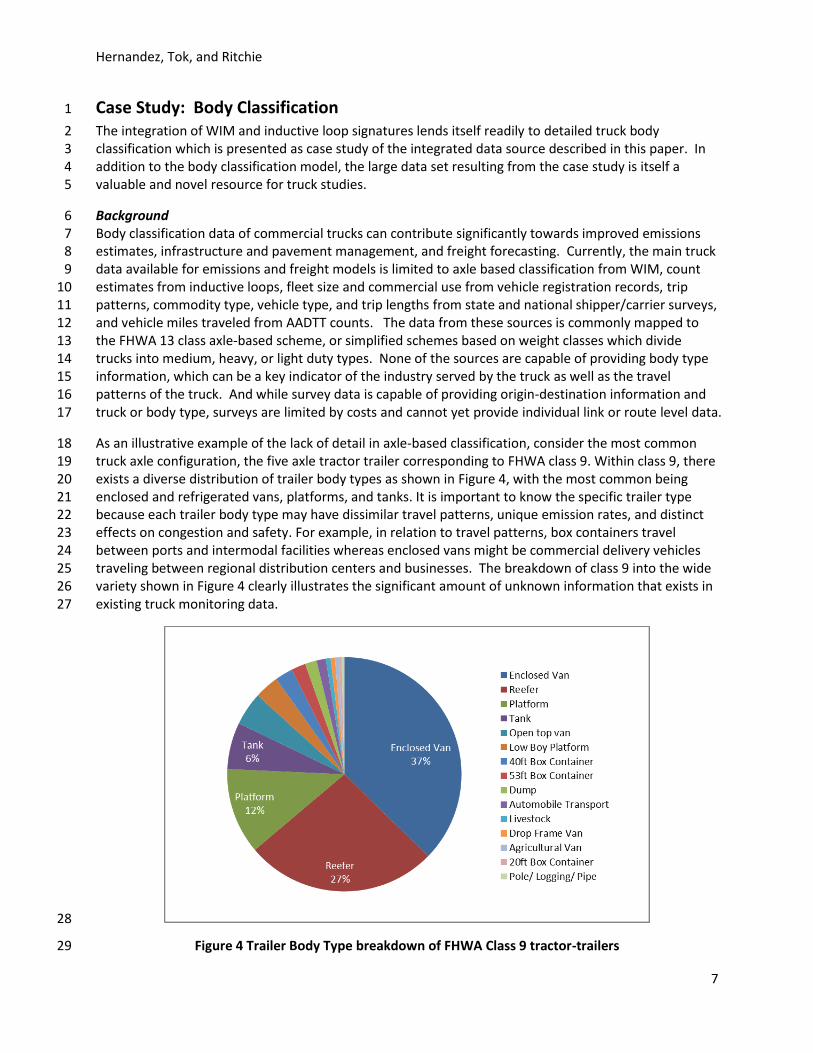
Model Development 5 The body classification model using the parsed features defined above was implemented as Feed 6 Forward Neural Network with a single hidden layer comprised on 15 neurons. A neural network 7 approach was chosen based on the previous success of this method with classifying inductive signatures 8 (10, 20) and the ease of implementation through Matlab. The simplicity and effectiveness of the model 9 implementation makes it ideal as a baseline reference. Each dataset was proportionally split by vehicle 10 body class into training (60% of the total samples), validation (20%), and testing (20%) sets. 11 12 Preliminary Body Classification Model Results 13 The Correct Classification Rate (CCR) by vehicle class, as well as the average CCR for the model is used as 14 the performance criteria for evaluating the classification model. CCR is defined as the number of 15 correctly matched vehicles divided by the total number of vehicles. The overall CCR for the Class 9 16 trailer body classification model was 75%. Figure 8 shows the confusion matrix for the collapsed set of 17 18 body classes with an overall CCR of 80%. Classes were collapsed based on body type group and 18 misclassification distribution. For FHWA Class 9 trailer body classes, individual class CCRs ranged 19 between 29 and 100%, for classes with more than five samples in the test dataset. Tank semi-trailers 20 had a low CCR (70%) and were commonly misclassified as basic platform semi-trailers. 53ft Box 21 Containers also had a low CCR (36%) and were commonly misclassified as enclosed van semi-trailers. On 22 the other hand, several classes showed high CCRs including basic and low boy platform semi-trailers, 23 enclosed van semi-trailers, open top van semi-trailers, 40ft box containers, automobile transport semi-24 trailers, livestock semi-trailers, and non-semi-trailers listed in the confusion matrix as ‘Single Trailers’. 25 26
Hernandez, Tok, and Ritchie
13
1 Figure 8 Cross-classification Matrix for FHWA Class 9 Trailer Body Classification Model Collapsed 2 Classes for Inductive Loop Signature and WIM 3
Conclusion 4
The integrated data source presented in this paper is a result of combining two highly complementary 5 technologies, WIM and inductive signatures, to create a synergistic resource that is highly detailed, link 6 specific, temporally continuous, up-to-date, and representative of the full truck population. The 7 integrated data is a valuable and novel resource that fills a significant gap in truck data sources and has 8 broader implications for emissions estimation and operations and monitoring in terms of safety, 9 pavement management, and enforcement. While this case study focuses on body type classification, the 10 integrated data source can also be leveraged to track truck OD patterns and travel times through truck 11 re-identification techniques. 12
In this paper, we described the hardware interface between inductive signature equipment and WIM 13 controllers which yielded a working configuration by which inductive signatures could be collected from 14 a WIM controller. In addition, we described the data handling and storage procedures that allow the 15 data to be easily joined to still images collected from a digital SLR camera triggered by vehicle presence 16 over the inductive loop sensor. Also, a specialized software user interface was established to link photo, 17 inductive loop signatures, and WIM data. 18
As a demonstration of the potential of the integrated data source, a truck body classification model was 19 developed from the dataset collected at four WIM sites in California. The truck body classification 20 scheme, initially based on VIUS, grew to include 35 trailer body types reflecting various body 21 configurations found in the collected data. Results were promising with a CCR of 80% for multi-unit 22 truck trailers consisting 18 trailer body classes. 23
Sin
gle
Trai
lers
Bas
ic P
latf
orm
Low
Bo
y P
latf
orm
Encl
ose
d V
ans
Ree
fer
Op
en T
op
Van
Dro
p F
ram
e V
an
Agr
icu
ltu
ral V
an
40
ft C
on
tain
er
20
ft
Co
nta
iner
53
ft
Co
nta
iner
Logg
ing
Au
to T
ran
spo
rt
Du
mp
Live
sto
ck
Pn
eum
atic
Tan
k
Tan
k
Oth
er
Co
un
t
CC
R
Single Trailers 2 2 0 0 0 1 0 0 0 0 0 0 0 0 0 0 1 0 6 33%
Basic Platform 0 232 7 7 4 4 1 0 6 0 2 0 0 0 0 0 4 0 267 87%
Low Boy Platform 1 2 60 0 0 0 0 0 0 1 0 0 0 1 1 0 1 1 68 88%
Enclosed Vans 1 9 1 370 51 6 0 2 1 0 1 0 0 2 0 0 1 1 446 83%
Reefer Van 0 6 0 43 246 1 0 0 1 0 2 0 1 0 0 0 0 0 300 82%
Open Top Van 0 3 0 2 2 64 1 0 2 1 0 0 1 0 0 0 1 0 77 83%
Drop Frame Van 0 0 0 1 1 0 13 0 0 0 0 0 1 0 0 0 0 0 16 81%
Agricultural Van 0 1 0 0 0 1 0 10 0 0 0 0 0 0 0 0 1 0 13 77%
40ft Container 0 3 0 1 0 1 0 0 39 0 0 0 0 1 0 0 0 0 45 87%
20 ft Container 0 1 0 1 1 0 0 0 1 2 0 0 0 1 0 0 0 0 7 29%
53 ft Container 0 2 0 25 1 0 0 0 0 0 16 0 0 0 0 0 0 0 44 36%
Logging 0 1 0 0 0 0 0 0 0 0 0 9 0 0 0 0 0 0 10 90%
Auto Transport 0 2 1 0 1 0 0 0 0 0 0 0 18 0 1 0 0 0 23 78%
Dump 1 0 1 2 0 2 0 4 1 0 0 0 0 11 0 0 6 0 28 39%
Livestock 0 0 0 0 0 0 0 0 0 0 0 0 0 0 18 0 0 0 18 100%
Pneumatic Tank 0 0 0 0 0 0 0 0 0 0 0 0 0 0 0 0 0 0 0 -
Tank 0 19 0 0 2 5 0 0 2 1 0 0 1 6 0 0 86 0 122 70%
Other 0 1 0 0 0 0 0 0 0 0 0 0 0 0 0 0 0 4 5 80%
1495 80%
Targ
et C
lass
es
Predicted Classes

Hernandez, Tok, and Ritchie
14
Acknowledgments 1
The research reported in this paper was performed under the sponsorship of the California Air 2 Resources Board. The authors gratefully acknowledge the assistance provided by Nesamani Kalandiyur 3 and other CARB staff and researchers, as well as Stan Norikane from Caltrans for his assistance in data 4 collection. The contents of this paper reflect the views of the authors who are responsible for the facts 5 and the accuracy of the data presented herein. The contents do not necessarily reflect the official views 6 or policies of CARB. This paper does not constitute a standard, specification, or regulation. 7
References 8
(1) Bureau of Transportation Statistics, Freight in America, January 2006, 9
http://www.bts.gov/publications/freight_in_america/, accessed online June 2012. 10
11
(2) California Air Resources Board, Mobile Source Emissions Inventory, Appendix G, Emissions Analysis 12
Methodology and Results: Medium-Heavy Duty Trucks, Heavy-Heavy Duty Diesel Trucks, and 13
Regulated Bus Categories, http://www.arb.ca.gov/regact/2010/truckbus10/truckbusappg.pdf, 14
accessed June 2012. 15
(3) Newell, G.F., A moving bottleneck, Transportation Research Part B: Methodological, Vol. 32, Issue 8, 16 November 1998, pp. 531-537. 17
(4) Douglas, J.G., Strategies for Managing Increasing Truck Traffic: A Synthesis of Highway Practice, 18 NCHRP Synthesis 314, 2003. 19
(5) Park, L. and Pierce, D., Large Truck Safety Trends, American Transportation Research Institute, May 20
2013. 21
22
(6) McCormack, E. and Hallenbeck, M., ITS Devices Used to Collect Truck Data for Performance 23
Benchmarks, Transportation Research Record: Journal of the Transportation Research Board, No. 24
1957, Transportation Research Board of the National Academies, Washington, D.C., 2006, pp. 43-50. 25
26
(7) Vehicle Inventory and Use Survey (Discontinued), U.S. Census Bureau, 2002 Economic Census. 27
(8) Kwon, J., Varaiya, P., and Skabardonis, A., Estimation of Truck Traffic Volume from Single Loop 28
Detectors with Lane-to-Lane Speed Correlation, Transportation Research Record, 1856, 2003, pp. 29
106-117. 30
(9) Traffic Monitoring Guide, US Department of Transportation, Federal Highway Administration Office 31
of Highway Policy Information, 2001. 32
33
(10) Tok, A. and Ritchie, S.G., Vector Classification of Commercial Vehicles using a High Fidelity Inductive 34
Loop Detection System, In proceedings of the 89h Annual Meeting of the Transportation Research 35
Board, Washington D.C, 2010. 36

Hernandez, Tok, and Ritchie
15
(11) Caltrans Truck Services, Data Weigh-in-Motion Webpage, 1
http://www.dot.ca.gov/hq/traffops/trucks/datawim/, accessed online June 2013. 2
(12) Lu, Q., Harvey, J., Le, J., Quinley, R., Redo, D., and Avis, J., Truck Traffic Analysis using Weigh-In-3
Motion (WIM) Data in California, Pavement Research Center, Institute of Transportation Studies, 4
University of California, Berkeley, CA, 2002. 5
(13) Zhang, G., Wang, Y., and Wei, H., Artificial Neural Network Method for length-Based Vehicle 6
Classification Using Single Loop Outputs, Transportation Research Record: Journal of the 7
Transportation Research Board, No. 1945, 2006, pp 100-108. 8
(14) Coifman, B., and Kim, S., Speed Estimation and Length Based Vehicle Classification from Freeway 9
Single Loop Detectors, Transportation Research: Part C, Vol. 17, No. 4, 2009, pp. 349-364. 10
(15) Sun C. and Ritchie, S.G., Inductive Classifying Artificial Network for Vehicle Type Categorization, 11
Computer-Aided Civil and Infrastructure Engineering, Vol. 18, 2003, pp. 161-172. 12
(16) Cheung, S.Y., Coleri, S., Dundar, B., Ganesh, S., Tan, CW., and Varaiya, P., Traffic Measurement and 13
Vehicle Classification with Single Magnetic Sensor, Transportation Research Record: Journal of the 14
Transportation Research Board, No. 1917, 2005, pp. 173-181. 15
(17) Ki, Y.K., Baik, D.K., 2006. Vehicle-Classification Algorithm for Single-Loop Detectors Using Neural 16
Networks, IEEE Transactions on Vehicular Technology 55(6). 17
(18) Jeng, S.T. and Ritchie, S.G., Real-time vehicle classification using inductive loop signature data, 18
Transportation Research Record No. 2086, 2008, pp 8-22. 19
(19) Liu, H., Tok, Y.C.A., and Ritchie, S.G., Development of a Real-Time On-Road Emissions Estimation and 20
Monitoring System, IEEE ITSC 2011 Conference Paper, October 5-7, 2011, Washington, D.C. 21
(20) Federal Highway Administration, Truck Characteristics Analysis, Washington, D.C. July 1999 22
23