Flexible polymeric ultrathin film for mesenchymal stem cell differentiation

ADVANCED DESIGN OF ULTRA-THIN BARRIER AlN/GaN HEMTS; A
STUDY OF DEVICE DESIGN, MODELING, AND ANALYSIS
A Dissertation
Submitted to the Graduate School
of the University of Notre Dame
in Partial Fulfillment of the Requirements
for the Degree of
Doctor of Philosophy
by
David A. Deen,
Huili Grace Xing, Director
Graduate Program in Electrical Engineering
Notre Dame, Indiana
April 2011

c© Copyright by
David A. Deen
All Rights Reserved

ADVANCED DESIGN OF ULTRA-THIN BARRIER AlN/GaN HEMTS; A
STUDY OF DEVICE DESIGN, MODELING, AND ANALYSIS
Abstract
by
David A. Deen
Of the III-Nitride family the AlN/GaN heterojunction has demonstrated the
largest combined polarization charge and energy band offsets available in the sys-
tem. Engineering the polarization fields through varying the AlN thickness leads
to two-dimensional electron gas densities (2DEGs) that may be tailored between
0.5 - 5 × 1013 cm−2. Furthermore, the ultra-thin (< 5 nm) barrier and excellent
transport properties of this all binary heterostructure make it well suited for high
electron mobility transistor applications where high frequency and high current
are required. This work encompasses various design aspects of GaN-based High
Electron Mobility Transistors (HEMTs) which ultimately result in the realization
of several generations that utilize the AlN/GaN heterostructure.
HEMTs fabricated from high-mobility, low sheet resistance heterostructures
have achieved drain current densities up to 2.3 A/mm and transconductance of
480 mS/mm, which set new benchmarks for GaN-based HEMTs. Ultra-thin pre-
metallization etching has been employed for the first time to reduce ohmic contact
resistance for AlN/GaN HEMTs and has enabled small signal frequency perfor-
mance in excess of 100 GHz. Moll’s method for delay time extraction has been uti-
lized to extract an effective electron velocity in the intrinsic region of the AlN/GaN
HEMT and was found to be ∼ 1.2 × 107 cm/s.

David A. Deen
By leveraging the allowable thickness window of the AlN barrier along with the
high density 2DEGs that result, several novel HEMT devices have been designed
and realized. High Al-content AlxGa1−xN back barriers have been employed for
improved 2DEG confinement in several new variations of the ultra-thin AlN/GaN
HEMT. A dual, parallel-channel AlN/GaN-based HEMT structure is designed and
realized for the first time as an epitaxial approach to mitigating DC-RF frequency
dispersion. These structures emphasize the facilitation of new device designs that
are made possible through the particular qualities the AlN/GaN heterostructure
possesses.

“... some things worth the tellin’
and you’d be right in guessin’
that each and every lesson,
they were hard won”
- Ray LaMontagne
ii

CONTENTS
FIGURES . . . . . . . . . . . . . . . . . . . . . . . . . . . . . . . . . . . . vi
TABLES . . . . . . . . . . . . . . . . . . . . . . . . . . . . . . . . . . . . xi
ACKNOWLEDGMENTS . . . . . . . . . . . . . . . . . . . . . . . . . . . xii
CHAPTER 1: INTRODUCTION . . . . . . . . . . . . . . . . . . . . . . . 11.1 III-Nitride HEMT applications . . . . . . . . . . . . . . . . . . . . 11.2 Polarization physics of the III-Nitride semiconductor system . . . 41.3 Background on the AlN/GaN heterostructure . . . . . . . . . . . 51.4 Scope of this work . . . . . . . . . . . . . . . . . . . . . . . . . . 101.5 Chapter 1 cited literature . . . . . . . . . . . . . . . . . . . . . . 11
CHAPTER 2: TRANSISTOR DESIGN CONSIDERATIONS . . . . . . . 132.1 The AlN/GaN HEMT structure . . . . . . . . . . . . . . . . . . . 142.2 Design considerations of the AlN/GaN HEMT . . . . . . . . . . . 17
2.2.1 Ohmic source-drain contacts . . . . . . . . . . . . . . . . . 182.2.2 Gate current suppression . . . . . . . . . . . . . . . . . . . 252.2.3 Gate capacitance model . . . . . . . . . . . . . . . . . . . 29
2.3 Chapter 2 cited literature . . . . . . . . . . . . . . . . . . . . . . 37
CHAPTER 3: THE SINGLE-HETEROJUNCTION AlN/GaN HEMT . . 413.1 The AlN/GaN HEMT . . . . . . . . . . . . . . . . . . . . . . . . 41
3.1.1 A comparative study on the thickness of the AlN barrier ondevice performance . . . . . . . . . . . . . . . . . . . . . . 42
3.1.2 AlN/GaN HEMTs grown by MBE on MOCVD GaN/SiCtemplates . . . . . . . . . . . . . . . . . . . . . . . . . . . 49
3.1.3 Ta2O5 insulated gate AlN/GaN HEMT . . . . . . . . . . . 513.1.4 First-generation insulated-gate AlN/GaN HEMTs . . . . . 56
3.2 Implications of peripheral resistance on HEMT intrinsic I-V char-acteristics . . . . . . . . . . . . . . . . . . . . . . . . . . . . . . . 59
iii

3.2.1 Ideal three-terminal current-voltage model . . . . . . . . . 603.2.2 Velocity saturation . . . . . . . . . . . . . . . . . . . . . . 633.2.3 External resistance . . . . . . . . . . . . . . . . . . . . . . 673.2.4 Experimental correspondence to model and its validity . . 69
3.3 Chapter 3 cited literature . . . . . . . . . . . . . . . . . . . . . . 76
CHAPTER 4: AlN/GaN HEMT SMALL-SIGNAL OPERATION . . . . . 804.1 Small signal model . . . . . . . . . . . . . . . . . . . . . . . . . . 814.2 De-embedding procedure . . . . . . . . . . . . . . . . . . . . . . . 884.3 Delay analysis of the insulated-gate AlN/GaN HEMT . . . . . . . 904.4 Points for improvement for RF operation of the AlN/GaN HEMT 1014.5 Chapter 4 cited literature . . . . . . . . . . . . . . . . . . . . . . 102
CHAPTER 5: HOT CARRIER EFFECTS IN SixNy-PASSIVATED Al-GaN/GaN HEMTS . . . . . . . . . . . . . . . . . . . . . . . . . . . . . 1055.1 Test Structure . . . . . . . . . . . . . . . . . . . . . . . . . . . . . 1065.2 Experimental Procedure: Chynoweth model . . . . . . . . . . . . 1075.3 Discussion of charge dynamics . . . . . . . . . . . . . . . . . . . . 1105.4 Chapter 5 cited literature . . . . . . . . . . . . . . . . . . . . . . 113
CHAPTER 6: NOVEL HEMT DESIGNS UTILIZING THE AlN/GaN HET-EROSTRUCTURE . . . . . . . . . . . . . . . . . . . . . . . . . . . . . 1156.1 Polarization-engineered AlxGaN back barriers . . . . . . . . . . . 1166.2 Design of a dual-channel charge-screening AlN/GaN HEMT; an
epitaxial approach to mitigate frequency dispersion . . . . . . . . 1256.2.1 Multi-channel heterostructure design . . . . . . . . . . . . 1286.2.2 A dual-channel AlN/GaN HEMT . . . . . . . . . . . . . . 133
6.3 Chapter 6 cited literature . . . . . . . . . . . . . . . . . . . . . . 141
CHAPTER 7: SUMMARY AND FUTURE WORK . . . . . . . . . . . . . 1447.1 Summary of this work . . . . . . . . . . . . . . . . . . . . . . . . 1447.2 Future work . . . . . . . . . . . . . . . . . . . . . . . . . . . . . . 1477.3 Chapter 7 cited literature . . . . . . . . . . . . . . . . . . . . . . 151
APPENDIX A: THE HETEROJUNCTION CAPACITOR;TERMAN’S METHOD . . . . . . . . . . . . . . . . . . . . . . . . . . 152A.1 Capacitance-Voltage Relationship . . . . . . . . . . . . . . . . . . 153
A.1.1 Ideal capacitive structure (Qit = 0) . . . . . . . . . . . . . 155A.1.2 Capacitive structure including interface traps (Qit 6= 0) . . 157A.1.3 Quantum capacitance . . . . . . . . . . . . . . . . . . . . . 160
A.2 Terman’s method for Dit determination . . . . . . . . . . . . . . . 161A.3 Discussion of Terman methodology . . . . . . . . . . . . . . . . . 163
iv

A.4 Appendix A cited literature . . . . . . . . . . . . . . . . . . . . . 165
APPENDIX B: DERIVATION OF CURRENT-VOLTAGE CHARACTER-ISTICS OF THE AlN/GaN HEMT BY GRADUAL CHANNEL AP-PROXIMATION . . . . . . . . . . . . . . . . . . . . . . . . . . . . . . 166B.1 Linear I-V functionality . . . . . . . . . . . . . . . . . . . . . . . 166B.2 Transconductance . . . . . . . . . . . . . . . . . . . . . . . . . . . 172B.3 Current saturation . . . . . . . . . . . . . . . . . . . . . . . . . . 174B.4 External resistance . . . . . . . . . . . . . . . . . . . . . . . . . . 175B.5 Validity of the GCA . . . . . . . . . . . . . . . . . . . . . . . . . 176B.6 Appendix B cited literature . . . . . . . . . . . . . . . . . . . . . 177
APPENDIX C: GENERAL AlN/GaN HEMT PROCESS . . . . . . . . . . 178
v

FIGURES
1.1 Energy gap versus lattice spacing for the various semiconductorsystems. Wavelength corresponding to the energy gap can be seenon the right with the color scale for the visible spectrum plottedagainst the various material systems. . . . . . . . . . . . . . . . . 2
1.2 Example of a standard Al0.3GaN/GaN HEMT’s drain characteris-tics with specific qualities pointed out that help define the HEMT’sapplication. . . . . . . . . . . . . . . . . . . . . . . . . . . . . . . 3
1.3 AlN/GaN heterojunction illustration showing the correspondingpolarization dipoles (a) and charge distributions (b) along with theenergy band diagram (c). . . . . . . . . . . . . . . . . . . . . . . . 6
1.4 2×2 µm atomic force micrographs of the surface of the AlN/GaNHEMTs for various AlN thicknesses. (images courtesy of Yu Cao,U. of Notre Dame) . . . . . . . . . . . . . . . . . . . . . . . . . . 7
1.5 2DEG properties of the AlN/GaN heterostructure. Images takenfrom reference [8]. . . . . . . . . . . . . . . . . . . . . . . . . . . . 8
2.1 Conduction band diagram for the insulator/AlN/GaN HEMT show-ing the charge distribution and the choice of electron wave function. 15
2.2 Current-voltage characteristics of the Zimmermann contacts takenfrom reference [15]. I-V characteristics of as-deposited contactsacross a 3 µm separation TLM structure for several different AlNthicknesses (left). Current level dependence on anneal temperaturefor the Zimmermann contact (right). . . . . . . . . . . . . . . . . 21
2.3 Current-voltage characteristics for pre-metallization etched contactsto AlN/GaN. Pre-etch to AlN/GaN (left) and the removal of theGaN cap on the GaN/AlN/GaN heterostructure (right). . . . . . 22
2.4 (left) Split wafer comparison of the effect of pre-etched contact ondrain characteristics. (right) Function of AlN thickness on contactresistance for various metal schemes attempted including the pre-metallization etched contacts. . . . . . . . . . . . . . . . . . . . . 23
vi

2.5 Effects of ALD and PECVD dielectrics on the AlN/GaN channelcharge characteristics µ and ns (left). Gated IV comparison of thedielectrics studied, taken on 100 µm diameter CV dots (right). . . 27
2.6 Modeled C-V dependence on various system parameters (left), andcalculated threshold voltage relationship dependance on the gatedielectric constant for varying AlN thicknesses (right). . . . . . . . 31
2.7 Modeled and measured C-V curves (bottom row) with the corre-sponding Dit spectrum (top row) for the insulated-gate AlN/GaNcapacitors. . . . . . . . . . . . . . . . . . . . . . . . . . . . . . . . 34
2.8 HR-TEM image of a GaN/AlN/GaN structure with an ALD Al2O3
layer deposited on the surface. Image courtesy of D. Smith, ArizonaState University. . . . . . . . . . . . . . . . . . . . . . . . . . . . 36
3.1 2 × 2 µm AFM scans of varied AlN barrier layers. . . . . . . . . . 43
3.2 Room temperature sheet resistance determined from Hall effectmeasurement for varied AlN barrier thickness. . . . . . . . . . . . 44
3.3 Drain current characteristics for varied AlN barrier thicknesses. . 46
3.4 Transfer characteristics for varied AlN barrier thicknesses (left),and two-probe I-V measurements of insulated C-V dots for the var-ious AlN barrier thicknesses (right). . . . . . . . . . . . . . . . . . 46
3.5 Measured sheet resistance (a), 2D charge density (b), mobility (c),contact resistance (d), maximum drain current density (e), andtransconductance (f) as a function of AlN barrier thickness. . . . 48
3.6 DC transfer (a) and drain (b) characteristics (left) and small signalfrequency characteristics (right) of the AlN/GaN HEMT grown onGaN/SiC templates. . . . . . . . . . . . . . . . . . . . . . . . . . 50
3.7 Drain characteristics of the Ta2O5/AlN/GaN HEMT (destructivebreakdown occurs at 96 V for VGS = -7 V). . . . . . . . . . . . . 53
3.8 (left) Drain and transfer characteristics and, (right) small signalfrequency performance of the Al2O3/AlN/GaN HEMT grown onGaN/SiC templates. . . . . . . . . . . . . . . . . . . . . . . . . . 55
3.9 Drain (left) and transfer (right) characteristics of the AlN/GaNHEMT grown and fabricated at U. of Notre Dame. . . . . . . . . 58
3.10 AlN/GaN HEMT I-V characteristics showing the effect when twodifferent mobilities are considered. . . . . . . . . . . . . . . . . . . 62
3.11 Electron velocity versus electric field for various common semicon-ducting systems. The scattering limited velocity approximation isillustrated for the GaN curve. . . . . . . . . . . . . . . . . . . . . 64
vii

3.12 AlN/GaN HEMT I-V characteristics showing the effect when ve-locity saturation is included. . . . . . . . . . . . . . . . . . . . . . 66
3.13 GCA model results of imposing external source and drain resis-tance on drain I-V characteristics (internal source and drain volt-ages shown with respect to the applied external VDS on the right). 68
3.14 Progression of the AlN/GaN I-V characteristics for the intrinsicdevice (left), the addition of the VLSA (middle), and the final ad-dition of external resistance. . . . . . . . . . . . . . . . . . . . . . 70
3.15 GCA model fit to data (a) taken from Fig. 3.3 showing the low-fielddeviation due to the SLVA (b). GCA fit to transfer characteristics(c). . . . . . . . . . . . . . . . . . . . . . . . . . . . . . . . . . . . 72
3.16 Qualitative illustration of the conduction band diagram along thechannel showing the Dit-influenced channel choke leading to IDScompression at forward gate-source bias voltages. (a) Cross sec-tional conduction band diagram in “flatband” or pinched off condi-tion and, (b) band diagram of the forward gate bias condition withQit influence. . . . . . . . . . . . . . . . . . . . . . . . . . . . . . 74
4.1 Transfer (left) and drain (right) characteristics of the Al2O3/AlN/GaNHEMT used for small signal model development. . . . . . . . . . . 82
4.2 Measured (circles) and modeled (lines) S-parameter data for boththe ColdFET (a) and maximum-gm (b) biasing regimes. . . . . . . 83
4.3 Schematic diagram of the small signal equivalent circuit model (a)showing the separation of the intrinsic, parasitic, and bond pad cir-cuits, “ColdFET” equivalent circuit model (b), and intrinsic circuitmodel (a) over-layed on a cross-sectional depiction of the insulatedgate HEMT. . . . . . . . . . . . . . . . . . . . . . . . . . . . . . . 85
4.4 Flow diagram for the Y-subtraction method for parameter de-embeddingof a HEMT. Toggling the measured S-parameters between Y andZ parameters allows convenient reduction of pad and/or parasiticcomponent influence. . . . . . . . . . . . . . . . . . . . . . . . . . 89
4.5 Small signal frequency performance as measured (gray circles), mod-eled (line), and after de-embedding (blue circles) bonding pad in-ductance and capacitance. . . . . . . . . . . . . . . . . . . . . . . 90
4.6 Transfer (left) and drain (right) characteristics of the Ta2O5/AlN/GaNHEMT used for the delay analysis. . . . . . . . . . . . . . . . . . 92
4.7 Unity current gain, ft, as a function of VDS (left) and IDS (right). 95
4.8 Total delay as a function of VDS (left) and IDS (right) showing thedelay for the corresponding measurement. . . . . . . . . . . . . . 96
viii

4.9 Comparison of delay times between the AlGaN/GaN and AlN/GaNHEMTs extracted by Moll’s method. . . . . . . . . . . . . . . . . 98
5.1 Device cross section showing the Schottky and four MIS gates (a)with the corresponding band diagram along the channel direction(b) showing the impact ionization process and the relation to theKink effect. . . . . . . . . . . . . . . . . . . . . . . . . . . . . . . 106
5.2 Transfer characteristics (left) of all gates on the HEMT prior to andafter bias-stress. Drain characteristics (right) of the AlGaN/GaNHEMT comparing the Schottky gate controlled (line) vs. the MISgate 2 controlled (open circles) family of curves. A clear kink inthe MIS gate controlled characteristics can be seen at ∼9 volts. . 109
5.3 (left) Gate current analysis for MIS gate 2 biased at VGS= -4 V.Linear character of the Ihole/IDS ratio indicates impact ionizationgenerated hole current. The inset shows the measured gate currentfor gate voltage steps of -2 V. (right) Time decay of the thresholdvoltage shift. . . . . . . . . . . . . . . . . . . . . . . . . . . . . . . 111
6.1 Layer structure and band diagram in equilibrium of the AlGaN/AlN/GaNcontrol sample. . . . . . . . . . . . . . . . . . . . . . . . . . . . . 117
6.2 Transfer (left) and drain (right) characteristics of the AlGaN/AlN/GaNHEMT control sample (without a back barrier). . . . . . . . . . . 119
6.3 (left) Layer structures, (center) band diagrams, and (right) 2×2µm2 AFM scans of the AlN surface for the AlGaN back barrierstructures. . . . . . . . . . . . . . . . . . . . . . . . . . . . . . . 120
6.4 (left) Calculated electron charge density from 1D Poisson Schrodingersolver, (middle) measured C-V data of the back barrier structures,and (right) calculated charge distribution from C-V data. . . . . . 122
6.5 drain (left) and transfer (right) characteristics comparison of backbarrier HEMTs . . . . . . . . . . . . . . . . . . . . . . . . . . . . 123
6.6 Virtual gate model showing the time plot of the surface charge andchannel depletion. . . . . . . . . . . . . . . . . . . . . . . . . . . . 127
6.7 Cross section and corresponding band diagrams for the design ofthe charge screening HEMT. . . . . . . . . . . . . . . . . . . . . . 129
ix

6.8 Threshold voltage comparison. The top horizontal curve is for afixed charge density of the lower channel with a fixed 3 nm bar-rier and is for comparison to the access region Vth. The set of 3lower curves show the calculated threshold voltage for the accessregion with the 2nd 2DEG distribution for screening. Access regionthreshold voltage becomes increasingly more negative for increasedupper 2DEG density and this increase in amplified for thicker GaNspacer layers. . . . . . . . . . . . . . . . . . . . . . . . . . . . . . 132
6.9 (right) 2×2 µm AFM scan of the AlN surface of the dual-channelstructure. . . . . . . . . . . . . . . . . . . . . . . . . . . . . . . . 134
6.10 C-V analysis of the Al2O3/AlN/GaN/AlN/GaN heterostructure ca-pacitor (left) and the associated approximate charge profile (right). 135
6.11 (left) Transfer characteristics of both the dual-channel and charge-screening HEMT, (middle) drain characteristics of the charge-screeningHEMT, and (right) drain characteristics of the dual-channel HEMT.137
6.12 Small signal frequency performance of the charge screening HEMT(left) and the dual channel HEMT (right). . . . . . . . . . . . . . 138
6.13 Time profiles of the pulsed-gate lag measurements for (a) the dualchannel HEMT, (b) the charge-screening HEMT, and (c) a standardsingle heterojunction AlN/GaN HEMT for comparison. . . . . . . 140
A.1 Band diagram including interface trap states. . . . . . . . . . . . 155
B.1 Illustration of the active region in a HEMT where the GCA applies.External resistances are included to depict the quasi-circuit underconsideration. . . . . . . . . . . . . . . . . . . . . . . . . . . . . . 167
B.2 Band diagram of the insulated gate AlN/GaN HEMT showing per-tinent parameters used for the GCA. . . . . . . . . . . . . . . . . 169
x

TABLES
2.1 PARAMETERS AFFECTING OPERATION OF THE AlN/GaNHEMT FOR THE DIELECTRICS CONSIDERED IN THIS WORK[40], [41]. . . . . . . . . . . . . . . . . . . . . . . . . . . . . . . . . 30
2.2 EXTRACTED VALUES OF INTERFACE TRAP DENSITY FORTHE DIELECTRICS EXPLORED IN THIS STUDY. . . . . . . . 36
4.1 EXTRACTED SMALL SIGNAL PARAMETERS FOR THE MOD-ELED INSULATED-GATE AlN/GaN HEMT . . . . . . . . . . . 86
4.2 EXTRACTED TIME DELAYS FOR THE Ta2O5 INSULATED-GATE AlN/GaN HEMT AND SCHOTTKY-GATED AlGaN/GaNHEMT. . . . . . . . . . . . . . . . . . . . . . . . . . . . . . . . . 97
xi

ACKNOWLEDGMENTS
The path I have followed during this work has been all but ordinary and I have
enjoyed the fellowship of many instructors and colleagues along the way. It is my
pleasure to acknowledge those individuals who have been influential to me during
my graduate tenure.
I want to thank my advisor, Huili Grace Xing for her continued effort to push
me to be a better researcher. Her support in my decision to continue my graduate
work while at the Naval Research Laboratory allowed me to pursue my own life
path while also expanding my technical knowledge and exposure to new topics.
My gratitude is owed to her for such support.
I want to thank David Storm for his technical support with the MBE growths
he performed for me as well as our almost daily conversations over morning coffee.
It was a pleasure to have both a colleague and a friend at NRL. Patrick Fay with
his expertise in high frequency measurements and device physics was an integral
part to my technical development.
One of the most influential people I have had the privilege to learn from and
work with is DJ. His intrinsic joy for understanding the physical nature of things
overflows to where one cannot help but share his sentiment when around him.
I am indebted to my cohorts at the Naval Research Laboratory to which I owe
many thanks. Steve Binari taught by example the value of experience and careful
consideration. I am grateful to David Meyer and Mario Ancona for our many
xii

discussions and friendship. I want to thank Bob Bass for his persistence with the
demands that come with electron beam lithography along with Scott Katzer and
Chip Eddy for their help with growth. A great deal of my gratitude is owed to
James Champlain; an artistic yet analytical minded fellow, mentor, and friend.
James served as a great resource of technical knowledge and always had endless
patience for explanation.
I am grateful toward my Notre Dame colleagues for their multi-dimensional
influence that never lacked to motivate. I want to thank Yu Cao for his help with
sample growth. I want to thank Gouwang, Yong, and Zongyang for their help
with growth and device processing assistance. I am ever grateful to have such
close friends in Robin Joyce and Joey Herzog, who are also fellow witnesses to
my graduate experience. I feel my time during graduate school would have lacked
richness and color had these two individuals not been part of it.
I want to thank my colleagues at the other institutions I had the privilege of
working with including Theodosia Gougousi at UMBC and Greg Snider at Notre
Dame.
The validation, support, and love my immediate and extended family gave to
me during my graduate days will remain a dear memory to me of this experience.
To my parents, John and Pam for their relentless support and love, I will never
forget. To Jerry and Karen for their encouragement and support. And last but
foremost, my wife Angela for her very being that orchestrates the beauty in my
life.
xiii

CHAPTER 1
INTRODUCTION
1.1 III-Nitride HEMT applications
With direct band gap energies (0.9 - 6.2 eV) corresponding to wavelengths (λ
= 200 - 1380 nm) that range the entire visible spectrum (Fig. 1.1) and built-in
polarization fields that are tailorable through heterostructure engineering the III-
Nitride system lends itself to an almost endless cache of applications including the
High Electron Mobility Transistor (HEMT) that has yielded some of its highest
invested returns. Premier attributes inherent to GaN of high intrinsic breakdown
field (3 MV/cm) and the extraordinarily large electron densities achievable without
impurity doping have been core motivations of GaN-based HEMT development
toward high frequency and power applications. In less than 20 years the GaN
HEMT went from a nascent state to obtaining the highest current and power
density of any transistor and are beginning to keep pace with their narrow band
gap FET counterparts in terms of cut-off frequency.
The DC drain characteristics can offer a preliminary estimate for the qual-
ity of a device’s RF and power operation. As seen in Fig. 1.2 for a standard
depletion-mode AlGaN/GaN HEMT, the combination of a high (> 30 volts) off-
state breakdown voltage with a high maximum current density is desired for power
requirements. Additionally, electron velocity must be appreciable in order to ob-
tain high operational frequencies based on the simple relationship: ft = ve/2πLG.
1

Figure 1.1. Energy gap versus lattice spacing for the varioussemiconductor systems. Wavelength corresponding to the energy gapcan be seen on the right with the color scale for the visible spectrum
plotted against the various material systems.
2

Figure 1.2. Example of a standard Al0.3GaN/GaN HEMT’s draincharacteristics with specific qualities pointed out that help define the
HEMT’s application.
As an estimate of the best power density that could potentially be achieved in a
device the DC current-voltage relationship for power P = (∆I × ∆V )/8 or the
more precise form found in Fig. 1.2 can be used. However, this value is much
more difficult to attain in actual RF operation due to charging effects, destructive
breakdown field limitations of the materials used, and other electrical constraints
involved with the design of the device.
Efficient channel pinch-off with low sub-threshold current is necessary to im-
plement GaN-based HEMTs in the high frequency large signal applications they
are intended for. This requires efficient carrier confinement and a gate barrier
layer with high-valued breakdown properties that can be sustained amidst the
high electric fields present under large signal operation. Poor pinch-off properties
3

reduce the efficiency of the device for converting input power to amplified out-
put power, better known as Power Added Efficiency (PAE). To achieve higher
operational frequencies the gate length needs to be short. An often occurrence
with deep sub-micron gate lengths is pronounced short-channel effects that limit
scalability by impairing RF performance. All these issues have been addressed by
numerous different approaches with the III-Nitride HEMTs setting frequency and
power records along the way.
1.2 Polarization physics of the III-Nitride semiconductor system
The following will serve as a brief overview of the origin, manifestation, and
implication of the polar nature of the III-Nitride semiconductor system in order
to lay a foundation on which the subsequent research is built. For a rigorous
development of the polar physics involved with the III-Nitride system the reader
is referred to reference [1]. The III-Nitride system owes its spontaneous polar
nature to the ionicity of the constituent atoms (N, Ga, Al, In) grown in the
wurtzite crystal structure. Considering the case for a Ga-polar crystal (group III
species terminates the surface with crystal lattice orientation of (0001)), when
a heterojunction is built by the growth of a different group III species on top of
GaN, the difference in in-plane lattice constant of the two layers causes an in-plane
tensile strain and perpendicular compressive strain in the top layer that manifests
an additional piezoelectric polarization field to that of the inherent spontaneous
polarization. Fig. 1.3 (a) shows the case for the AlN/GaN heterostructure. The
combination of the polarization field in the AlN and conduction band discontinuity
at the AlN/GaN interface set up favorable conditions for the migration of mobile
charge to accumulate in the GaN layer at the heterointerface. The current theory
4

maintains that a donor-like surface state is the primary contributor of the mobile
electrons that accumulate at the AlN/GaN interface [2]. The resultant band
diagram is shown in Fig. 1.3 (c) showing the localized 2 dimensional charge
distribution that serves as the HEMT channel. The maximum polarization charge
is determined by the mole fraction content of group III atoms in the barrier while
the physical thickness of the barrier determines how much of that charge is ionized
from the surface donor. Therefore, the surface donor energy and the thickness of
the barrier in an AlN/GaN HEMT play the dominant roles in the formation of
the 2D channel.
1.3 Background on the AlN/GaN heterostructure
The inception of the AlN/GaN heterostructure began with the immediate ap-
plication to a MESFET device by Binari in 1994 [3]. Though at that time the
understanding of polarization-induced channel charge was still six years too young
[2]. Several reports followed in the same vain of device [4],[5],[6] but it wasn’t until
2000 that a study on high crystalline quality un-doped AlN/GaN was reported by
Smorchkova [7]. This turning point ushered in the realization through empirical
evidence that a fully strained AlN barrier to unintentionally-doped GaN could
achieve several factors larger charge density than the AlxGa1−xN/GaN structure
with comparable channel mobilities for corresponding x = 0.2 - 0.3. Moreover, this
could be done with an ∼5× reduction in barrier thickness implying a means to
vastly enhance scalability in a device structure through atomically smooth growth.
The studies performed by Smorchkova have since been refined and expanded upon
by Cao who to date has demonstrated the highest 2D electron density achieved
in any single heterojunction leading to the lowest sheet resistance 2DEG in any
5

Figure 1.3. AlN/GaN heterojunction illustration showing thecorresponding polarization dipoles (a) and charge distributions (b) along
with the energy band diagram (c).
6

Figure 1.4. 2×2 µm atomic force micrographs of the surface of theAlN/GaN HEMTs for various AlN thicknesses. (images courtesy of Yu
Cao, U. of Notre Dame)
III-Nitride heterosystem [8]. This and a subsequent study have shown interesting
physics [9] that set aside the AlN/GaN HEMT structure as a means to harness
enhanced frequency/power operation in a conventional heterojunction FET struc-
ture through drastic down-scaling of device geometry. This physics will be the
subject of the following discussions.
AlN/GaN HEMT structures reported by Cao were grown on GaN templates
on Sapphire with a varied AlN barrier thickness between 2-7 nm [8]. The range
extremities were defined by the lack of 2DEG formation at the low end and strain
relaxation that led to cracking of the AlN barrier at the high end setting the
usable upper limit to ∼5 nm before mobility began to degrade. Atomic force mi-
croscopy (AFM) images for the various thicknesses are shown in Fig. 1.4 showing
micro-cracking beginning to occur for the 6 nm thick AlN originating at threading
dislocation centers. Clear cracks can be observed in the scan of the 8 nm thick
AlN.
Hall effect measurements on the series of samples with varied AlN thicknesses
reveal an increasing sheet charge density with increased AlN thickness (Fig. 1.5
7

Figure 1.5. 2DEG properties of the AlN/GaN heterostructure. Imagestaken from reference [8].
(a)). The charge density increase seems to persist up to the point of AlN lattice
relaxation with a maximum density very near the calculated charge polarization
limit which is dependent on the difference in polarization fields at the AlN/GaN
interface and assumes polarization from every atom at the interface [1]. Hall mo-
bility shows a maximum for smaller AlN thicknesses up to ∼5 nm where lattice
relaxation causes mobility of the 2DEG to begin to drop off (Fig. 1.5 (b)). The
combination of these trends show up in sheet resistance through the relationship
Rsh = 1/qµns for an n-type channel yielding a sheet resistance minima window
below 200 Ω/ for AlN thicknesses between 3 - 4 nm (inset to Fig. 1.5 (b)). Re-
cently, further growth refinements by Cao have led to a record low sheet resistance
of ∼100 Ω/ for a single junction AlN/GaN HEMT structure [12]
The AlN/GaN heterostructure being a binary junction eliminates the presence
of scattering from a disordered alloy such as in the case of an AlxGa1−xN barrier
and therefore greatly benefits the 2DEG low-field mobility. However, because
8

of the larger ∆Ec between AlN and GaN, 2DEG confinement is enhanced and
pushes the 2D electron charge distribution closer to the AlN/GaN interface. This
mechanism causes the atomic roughness at the interface to have an enhanced
effect on the 2DEG transport properties. The time for an electron to scatter from
its initial k -state to a different k -state due to its interaction with the atomically
rough interface is given by the following integral and has been calculated for the
AlN/GaN heterojunction by Cao as seen in Fig. 1.5 (d)
1
τIR=
∆2L2e4m∗
2ε2~3(ns
2
)2 ∫du
u4e−k2FL
2u2
(u+G(u) qTF
2kF)2√
1− u2
where the scattering potential for the rough interface is modeled as a coulombic
potential with a correlation length L and RMS roughness height ∆ [1]. The inte-
gration over this dimensionless integral gives the solution for the IR limiting com-
ponent to the momentum scattering time that can then be related to the IR scat-
tering limited mobility term through the Drude relationship by µIR = qτIR/m∗.
Other dominant scattering mechanisms that influence the total low-field mobility
are polar optical and acoustic phonon scattering. Cao demonstrated that IR scat-
tering is the dominant scattering mechanism at low temperature with combined
effects from PO and acoustic phonon contributions at room temperature, shown
in Fig. 1.5 (d). Therefore, it is expected that growth conditions are critical for
high mobility AlN/GaN structures and those that yield the smoothest AlN surface
(measurable by AFM) will subsequently demonstrate the highest mobility. The
final test for the AlN/GaN heterostructure is its implementation in a HEMT de-
vice. The integration of the high-quality, low-Rsh AlN/GaN heterostructure with
refined processing techniques will present HEMT technology with a candidate that
will surely rival if not surpass the best state-of-the-art HEMTs of today.
9

1.4 Scope of this work
This work explores the binary ultra-thin AlN/GaN heterostructure for the
purpose of HEMT devices that have operational frequencies up to 100’s of GHz.
All samples that will be discussed were grown by plasma-assisted molecular beam
epitaxy (MBE) at the Naval Research Laboratory unless otherwise noted.
Chapter 2 addresses the development of several key fundamental aspects in
the fabrication of AlN/GaN HEMTs. Namely, ohmic contacts and gate insulator
considerations as well as their implications on HEMT device operation.
Chapter 3 demonstrates the realization of the AlN/GaN HEMT through sev-
eral studies performed to analyze and improve DC and small signal RF perfor-
mance . The chapter concludes with an analytical discussion of the effects of
contact and access resistance on I-V characteristics as given by a physical model
based upon the gradual channel approximation found in Appendix B.
Chapter 4 develops a lumped element small signal model for the insulated-gate
AlN/GaN HEMT. Included in this chapter is transit and charging time analysis
following Moll’s method. Such analysis quantifies the limiting mechanisms in
small signal frequency performance and allows an extraction of saturated electron
velocity in the channel. Points of improvement for the small signal operation of
the AlN/GaN HEMT are also discussed.
Chapter 5 includes a separate study where charging effects of a thin SiN passi-
vation layer in the access regions of a typical AlGaN/GaN HEMT is investigated.
Through threshold voltage shifts after DC bias stressing the device, the concen-
tration of trapped charge is obtained.
Chapter 6 involves the exploitation of the thin AlN barrier in the development
of several novel HEMT device structures. Al-containing back barriers are explored.
10

A dual-channel AlN/GaN HEMT is designed and fabricated. The design aims to
leverage the high 2DEG density in the upper channel as a means to screen surface
potential fluctuations from the buried channel in an attempt to mitigate frequency
dispersion without the necessity of a passivation layer.
Chapter 7 concludes the work with closing remarks and suggestions for future
development utilizing the principles involved with the AlN/GaN HEMT.
1.5 Chapter 1 cited literature
1. D. Jena, “Polarization induced electron populations in III-V nitride semi-conductors; Transport, growth, and device applications,” Ph.D. dissertation,University of California, Santa Barbara, 2003.
2. J.P. Ibbetson, P.T. Fini, K.D. Ness, S.P. DenBaars, J.S. Speck, U.K. Mishra,“Polarization effects, surface states, and the source of electrons in AlGaN/GaNheterostructure field effect transistors,” App. Phys. Lett., no. 2, vol. 77,Jul. 2000.
3. S.C. Binari, L.B. Rowland, W. Kruppa, G. Kelner, K. Doverspike, D.K.Gaskill, “Mircrowave performance of GaN MESFETs,” Elec. Lett. vol. 30,no. 15, July 1994.
4. H. Kawai, M. Hara, F. Nakamura, S. Imanaga, “AlN/GAN insulated gateheterostructure FET with regrown n+GaN ohmic contact,” Elec. Lett no.6, vol. 34, Mar. 1998.
5. I. Daumiller, P. Schmid, E. Kohn, C. Kirchner, M. Kamp, K.J. Ebeling, L.L.Pond, C. Weitzel, “DC and RF characteristics of AlN/GaN doped channelheterostructure field effect transistor,” Elec. Lett. no. 18, vol. 35, Sept.1999.
6. E. Alekseev, A. Eisenbach, D. Pavlidis, “Low interface state density AlN/GaNMISFETs,” Elec. Lett. no. 24, vol. 35, Nov. 1999.
7. I.P. Smorchkova, S. Keller, S. Heikman, C.R. Elsass, B. Heying, P. Fini, J.Speck, U.K. Mishra, “Two-dimensional electron-gas AlN/GaN heterostruc-tures with extremely thin AlN barriers,” Appl. Phys. Lett. no. 24, vol. 77,2000.
11

8. Y. Cao, D. Jena, “High-mobility window for two-dimensional electron gasesat ultrathin AlN/GaN heterojunctions,” Appl. Phys. Lett. 90, 182112,2007.
9. Y. Cao, K. Wang, A. Orlov, H. Xing, D. Jena, “Very low sheet resistanceand Shubnikov-de-Haas oscillations in two-dimensional electron gasses atultrathin binary AlN/GaN heterojunctinos,” Appl. Phys. Lett. 92, 152112,2008.
10. I.P. Smorchkova, S. Keller, S. Heikman, C.R. Elsass, B. Heying, P. Fini, J.S.Speck, U.K. Mishra, “Two-dimensional electron-gas AlN/GaN heterostruc-tures with extrememly thin AlN barriers,” Appl. Phys. Lett. no. 24, vol.77, Dec. 2008.
11. I.P. Smorchkova, L. Chen, T. Mates, L. Shen, S. Heikman, B. Moran, S.Keller, S.P. DenBaars, J.S. Speck, U.K. Mishra, “AlN/GaN and (Al,Ga)N/AlN/GaNtwo-dimensional electron gas structures grown by plasma-assisted molecular-beam epitaxy,” J. Appl. Phys. no. 10, vol. 90, Nov. 2001.
12. C. Yu, “Study of AlN/GaN HEMTs: MBE growth, transport properties,and device issues,” Ph.D. dissertation, University of Notre Dame, 2010.
12

CHAPTER 2
TRANSISTOR DESIGN CONSIDERATIONS
The specific qualities afforded by the AlN/GaN heterostructure may be com-
bined in the HEMT structure to ultimately provide a technological vehicle to
access a high frequency amplification realm that is otherwise off-limits to the Al-
GaN/GaN HEMT. Owing to the thickness limitation set by strain relaxation of
the AlN barrier grown atop the GaN buffer, the AlN layer sets an upper limit in
barrier thickness of only 6 nm [13],[14]. This silver lining provides a means for
the reduction in gate-to-channel distance which ultimately sets a new benchmark
in feasibility of maximizing frequency metrics, ft and fmax through drastic barrier
scaling. Combined with a polarization charge limit of ∼6×1013 cm−2, a factor
of 3 higher than that of the AlxGaN/GaN heterostructure makes the AlN/GaN
HEMT a worthy candidate for a high frequency-power transistor.
While the III-Nitride system boasts many attractive qualities such as high
breakdown field (∼3 MV/cm), high peak electron velocity (∼2.5×107 cm/s), and
chemical stability all of which are results of its wide band gap nature, a number of
difficulties arise in their processing because of the same reason. The thin barrier
AlN/GaN HEMT seems to show enhanced difficulty at all the same design points
the AlGaN/GaN structure exhibits. The formation of low resistance (< 0.5 Ω-
mm) ohmic contacts remains elusive [15]. Schottky barrier gates to thin ( 2 nm)
AlN is exceedingly difficult due to the presence of high tunneling current through
the AlN barrier. Therefore, the insertion of a gate dielectric is required to suppress
13

gate current [16]. The proximity of the AlN surface to the 2DEG channel is only
a few nanometers. This provides a close charging surface that supports effective
gate length extension and current collapse during the RF operation of the HEMT.
Conventional passivation methods such as the deposition of a thick (∼100 nm)
PECVD SiN layer show improved RF performance but at the expense of a reduced
channel mobility due to plasma damage during the deposition. This ultimately
limits the maximum RF performance expected by such devices. These issues
amongst others serve as a reminder of the immature state of AlN/GaN HEMT
technology. This chapter addresses solutions to the problems listed toward the
advancement of the AlN/GaN HEMT.
2.1 The AlN/GaN HEMT structure
Shown in Fig. 2.1 is an illustration of the cross section of the AlN/GaN HEMT
device structure with the band diagram taken vertically through the insulated
gate region. By varying the AlN barrier thickness through atomically accurate
growth the polarization fields in the structure can be tailored to induce mobile
electron charge densities between the range of 5×10¹² to 5×1013 cm−2 [14] with
the corresponding mobility trend as discussed in chapter 1.3.
The combination of the charge distribution and conduction band offsets present
in the AlN/GaN heterostructure set up an asymmetric potential profile comprising
the channel of the HEMT (as seen in Fig. 2.1) that can be approximately char-
acterized by a triangular potential well at the first sub-band energy level (dashed
line). The common practice is to use Airy functions to represent the electron
wave function in the triangular well in order to describe the spatially distributed
quasi-2DEG. However, according to charge neutrality the electric field deep in
14

Figure 2.1. Conduction band diagram for the insulator/AlN/GaNHEMT showing the charge distribution and the choice of electron wave
function.
15

the GaN buffer must go to zero and therefore is not accurately modeled by an
infinite triangular well. The Fang-Howard (F-H) variational wave function may
alternatively be used [17], [18] which accurately describes the wave function fall-
off deeper in the UID GaN layer where the confining potential becomes finite and
constant. The FH wave function follows
Ψ(y) =
√b3
2ye−
by2 , (2.1)
where b is the variational parameter and y is the depth from the AlN/GaN inter-
face. The wave function is used to determine the functional form of the spatially
distributed mobile charge through the relationship ns(y) = |n3D||Ψ(y)|2. The
mobile charge distribution function is therefore,
ns(y) =|n3D|b3
2y2e−by. (2.2)
The wave function describing the HEMT 2DEG channel may be approximated
as a weighted delta function for qualitative considerations or for calculations that
require only a knowledge of charge density and centroid location, < y >. However,
for cases that require a precise physical description of the charge-voltage relation-
ship the wave-function is necessary to provide the means to analytically describe
the evolution of mobile charge (density and spatial variation) when a gate voltage
is applied. By considering the conduction band profile in Fig. 2.1 a voltage loop
can be traced that gives the Vg-Vs-ns relationship for the insulated-gate AlN/GaN
HEMT
−VGS + ΦB + Vox + ΦoA − VAlN −∆ECq
+Eoq
+(EF − Eo)
q= 0, (2.3)
16

where VGS = VG − VS is the gate-to-source voltage difference, ΦB is the barrier
height of the gate metal to dielectric, Vox is the voltage drop within the oxide layer,
ΦoA is the effective conduction band offset between the oxide and AlN layers, VAlN
is the voltage drop within the AlN layer, ∆EC is the conduction band discontinuity
between AlN and GaN, Eo is the first sub-band energy, and EF is the Fermi level
in the GaN quantum well (QW). This is the charge-control equation (CCE) for
the insulator/AlN/GaN heterostructure. This governing equation describing the
electrostatics of the insulator/AlN/GaN structure immediately beneath the gate
will take various forms in subsequent sections. For the case of the AlN/GaN
heterostructure without an oxide cap the Vox term may be eliminated from the
equation. For a detailed development of the I-V relationship of the AlN/GaN
HEMT utilizing the FH wave function see Appendix B. A discussion of the effects
of access and contact resistance on the intrinsic I-V characteristics can be found
in section 3.2 of the following chapter.
2.2 Design considerations of the AlN/GaN HEMT
The AlN/GaN heterostructure has its share of caveats that must be considered
before it inherits the form of a transistor. The mobility-charge density trends
with respect to AlN barrier thickness, shown in Fig. 1.5 demonstrate the limited
usable range of AlN thickness. Confined between 2 nm and 5 nm the AlN barrier
introduces a myriad of issues the device designer must be cognisant of. Such
a thin barrier causes gate leakage current to be a concern for a Schottky-gated
depletion-mode transistor due to tunneling. This issue will be discussed in more
detail in section 2.2 of this chapter but an obvious solution is the insertion of a
dielectric layer to suppress gate leakage current [19]. The choice of insulator used
17

for the gate dielectric layer has major implications on device performance.
The employment of the AlN barrier has shown its utility as a thin (1 nm) in-
sertion layer in the AlGaN/GaN HEMT in order to create an all binary interface
with a large barrier height that would eliminate alloy disorder scattering by push-
ing the electron wave function tail out of the alloyed AlGaN barrier [20]. High
contact resistance is enhanced dramatically when the AlN layer is several nanome-
ters thick [15]. This extrinsic resistance further impairs DC and RF performance.
In this work we show several techniques have been used to reduce ohmic contact
resistances in the (> 2 nm) AlN barrier HEMTs (section 2.1).
The points to be discussed are in fact rather fundamental with respect to
device design and fabrication. However, in that they are fundamental they have
profound influence on the operation of the HEMTs. Therefore, a careful approach
must be taken when making design decisions for the sake of utilizing the high
frequency capability the AlN/GaN heterostructure offers.
2.2.1 Ohmic source-drain contacts
By and large the metallurgy of ohmic contact formation to the wide band gap
III-N system tends to be more experimentally based than scientifically understood.
To date the best ohmic contacts to AlGaN/GaN HEMTs are an order of magnitude
more resistive than those of their narrow band gap counterpart [21], [22]. Because
of this additional resistance, DC and RF performance is severely limited and the
intrinsic functionality of GaN-based devices is only modestly utilized.
Thermally annealed ohmic contacts to the AlGaN/GaN heterostructure have
received the most intense exploration to date since this heterostructure showed
immediate promise and therefore most attention upon its inception in the mid-
18
1990’s. The contact metal scheme to the AlGaN/GaN structure has seen a
fair number of different metal attempts but have mostly converged on the Ti-
tanium/Aluminum combination at the contact-semiconductor mating interface.
M.E. Lin et al. showed specific contact resistance of 8×10⁻⁶ cm−2 to GaN using a
Ti/Al stack and compared it to Al, Au, and a Ti/Au combination [23]. Contacts
have since been improved upon but still rely on the Ti/Al component [21].
The prevailing theory behind the operation of an annealed ohmic contact to
GaN maintains that a TiN alloy forms at the mating interface thereby leaving
behind an excess of N-vacancies that provide a low resistance interfacial layer
the contacts ultimately rely upon [24], [25]. A competing theory approaches the
issue from the standpoint of differences in work functions between the metal and
semiconductor [24]. Given that the work function of GaN is 4.1 eV, very near
that of Al the Al-containing contacts are ohmic due to the low barrier between
the two materials. In either case it is evident that the Al-content plays a large
role in the formation of low resistance ohmic contacts. However, the history since
the first theory was proposed has given reason to suggest it is the best since cross
sectional TEM has shown the formation of TiN alloyed layers and spiking at the
contact-semiconductor annealed interface [26], [27].
The choice for constituent metals involved in the ohmic metal stack follows
some general logic though it is largely accepted that the detailed picture of an-
nealed ohmic contact formation is still somewhat of a black box [28]. As discussed,
the Ti/Al component plays the main role in forming contacts. However, both met-
als have a high propensity for oxidation under elevated temperature such as an
anneal. Therefore, a low-resistive inert metal must be used to avoid the increase
in contact resistance from oxidation as well as reduce the overall lateral resistance
19

of the contact. Au is an obvious solution however, Au has a low melting point,
easily diffuses through GaN, is a deep level state in GaN, and causes instabilities
in the contacts. The solution used is to include a Au diffusion barrier layer to
retain the Au as the protective top layer. Au diffusion barriers such as Ni, Pt, Mo,
Ti, Ag and others have been studied. While no standard contact scheme has been
substantiated a popular layer structure has been accepted that uses the metal
sequence, Ti/Al/Ni/Au. With additional processing tricks this metal structure
has achieved as low as ∼ 0.2 Ωmm contact resistance in an AlGaN/GaN HEMT
[21], [29].
While the metallization scheme is critical another factor in ohmic contact for-
mation is the thickness of the barrier the metal stack must penetrate during the
anneal. In Ga-polar III-N heterostructures the barrier thickness is proportional to
the 2DEG density. For ohmic contacts to form the barrier must be thick enough
that a 2DEG is present to make contact to, but simultaneously thin enough for suf-
ficient metal diffusion to occur at 800 - 900C anneal temperatures. One popular
method adopted in research and industry for various material systems is a pre-
metallization etch to thin the barrier immediately underneath the contact metal
for improved diffusion. Buttari et al. showed for AlGaN/GaN HEMTs with a 25
nm AlGaN barrier and a 1 nm AlN insertion layer that a 7 nm deep pre-etch re-
duced ohmic contact resistance of the structure from 0.45 Ω-mm for an un-etched
structure down to 0.27 Ω-mm for the 7 nm pre-etched structure [21]. It should
be noted that the 1 nm AlN insertion layer generally causes an increase in con-
tact resistance so the pre-ohmic metallization etch offers an attractive candidate
for lowing contact resistance in the multi-nanometer AlN/GaN heterostructure.
However, because the AlN barrier is only 6 nm at maximum thickness it leaves
20

Figure 2.2. Current-voltage characteristics of the Zimmermann contactstaken from reference [15]. I-V characteristics of as-deposited contacts
across a 3 µm separation TLM structure for several different AlNthicknesses (left). Current level dependence on anneal temperature for
the Zimmermann contact (right).
little tolerance for error during the pre-etch.
The AlN/GaN heterostructure introduces the necessity for some changes to
the conventional thought and practice of the Ti/Al-based ohmic contact. Indeed,
the AlN barrier is much thinner than the AlGaN barrier already discussed but
it also sports a much wider bandgap (6.2 eV) with a strained lattice constant
that of GaN (3.2 A) making the anneal-diffusion of the contact metals a slightly
different scenario. A notable difference between the AlGaN/GaN and AlN/GaN
heterostructures in terms of contacts is that as-deposited contact metal prior to
any annealing showed near-ohmic to ohmic behavior depending on the thickness
of the AlN barrier (Fig. 2.2) [15]. Upon annealing, the current-voltage (I-V) char-
acteristics improved toward lower resistance but the ideal annealing temperature
for the best I-V characteristics was lower (400C) for a 3 nm AlN barrier than
21

Figure 2.3. Current-voltage characteristics for pre-metallization etchedcontacts to AlN/GaN. Pre-etch to AlN/GaN (left) and the removal of
the GaN cap on the GaN/AlN/GaN heterostructure (right).
that of the 20 nm AlGaN barrier. Higher temperatures led to a reduced current,
presumably due to the degradation of the AlN/GaN interface where the 2DEG
resides. If mobility is used as the metric for the crystalline quality of the AlN it
can be seen in Fig. 2.2 that the higher mobility structures cause more difficulty
in forming low resistance ohmic contacts. We speculate this is because of thick-
ness variations in the structure that leads to thin regions the ohmic metal can
diffuse through more readily making a better ohmic contact to a lower quality
heterostructures.
A number of metallization schemes have been investigated and the two most
successful follow a similar design. The first, a Ti/Al/Ti/Ni/Au metal series that is
electron beam deposited with thicknesses of 20/200/20/60/10 nm, respectively was
proposed by Zimmermann et al. [15]. The second, a Ti/Al/Ni/Au (30/200/40/10
nm) proved to be identical in I-V characteristics and contact resistance compared
22

Figure 2.4. (left) Split wafer comparison of the effect of pre-etchedcontact on drain characteristics. (right) Function of AlN thickness oncontact resistance for various metal schemes attempted including the
pre-metallization etched contacts.
to the Zimmermann contact suggesting, but not surprisingly, that the Ti content
is a major factor in ohmic formation. These two metal schemes were exclusively
used in HEMT fabrication.
For the AlN/GaN heterostructure a low Rsh window exists for AlN barrier
thicknesses between 3 and 5 nm as shown by Cao [14]. Therefore, in order to take
advantage of the low sheet resistance window while simultaneously achieving sub-1
Ω-mm contact resistance, a pre-metallization etch offers a viable solution. Indeed,
the most successful process for ohmic contact formation to an AlN/GaN 2DEG
was the employment of a modified ohmic pre-metallization etch by a BCl3/Cl2
plasma. The metal scheme used was either of the variations discussed previously.
An Oxford Systems inductively-coupled plasma (ICP) etcher was used for the pre-
etch with a plasma chemistry of Ar/BCl3/Cl2 at 100/25 watts upper and lower
electrode power, respectively. These conditions gave an AlN etch rate of ∼ 0.53
23

A/sec determined by atomic force microscopy.
The comparative evolution of IV characteristics of a pre-etched ohmic contact
and a standard ohmic contact on a 5 nm AlN barrier before and after annealing
can be seen in Fig. 2.3. The as-deposited pre-etched ohmic contact current is
drastically lower than that of the non-etched contact. This is attributed to the
thinning of the AlN barrier from the etch, thereby reducing the 2DEG density
along with probable plasma-induced damage to the 2DEG. However, after a 30
second anneal at 800C the I-V slope of the pre-etched contact is much steeper
than the non-etched contact indicating a lower contact resistance. This is in fact
verified with TLM measurements that yield on average contact resistances of ∼0.7
Ω-mm for the pre-etched contact in contrast with ∼1.6 Ω-mm for the non-etched
contact for a 5 nm AlN barrier. While these results are attractive they are not
remiss of problems associated with such a shallow etch. Because of details about
the etch that are difficult to determine (incubation time and etch details of the
plasma, true depth of the etch, etc.) the repeatability of obtaining an accurately
specified contact resistance is somewhat troublesome. This is further frustrated
when working with more “sophisticated” heterostructures such as GaN/AlN/GaN
and it’s derivatives.
Due to surface sensitivity of AlN/GaN structures, GaN capping layers were
also explored. However, it offers an additional degree of uncertainty in etch depth
during the ohmic pre-etch discussed above. Nonetheless, etching of the GaN cap
is essential to forming a contact which has a linear I-V characteristic for cap
(> 2 nm) and barrier (> 3 nm) thicknesses. It can be seen in Fig. 2.3 that a
GaN capped structure without the removal of the cap still shows a non-linear I-V
character even after annealing at 800C for 30 seconds despite the conventional
24

understanding that GaN allows easy penetration for ohmic metal diffusion. On
the other hand, when the GaN cap is etched away leaving only the AlN surface,
the I-V characteristics measure linear with high current in close agreement to the
non pre-etched contacts in Fig. 2.3 on the left.
Fig. 2.4 shows contact resistance for various AlN thicknesses for the AlN
HEMTs fabricated. A trend of increasing RC is observed for increasing AlN thick-
ness in agreement with previous work [15]. The linear trend line is used only as a
guide to the eye. Work on Ti/Al/Mo/Au contacts to AlN/GaN by Wang is plot-
ted (open square) for comparison. The average RC values obtained through the
pre-metallization etched ohmic contacts were notably lower than their non-etched
counterpartes. Despite the 5.5 nm thick AlN the contact resistances of the pre-
etched contacts were consistently below 0.9 Ω-mm with the lowest value for the 5
nm barrier thickness being 0.5 Ω-mm. Up to the time of this writing this value is
the lowest RC reported for the AlN/GaN HEMT and moreover this was achieved
in a relatively thick AlN barrier structure. Therefore, the pre-metallization etch
provides a means to reliably reduce contact resistance in AlN/GaN HEMTs.
2.2.2 Gate current suppression
High leakage currents in Schottky barrier gated AlN/GaN HEMTs exist due
to a limited barrier thickness (less than 6 nm) combined with the capability of
high (up to 6×10⁻¹³ cm−2) 2DEG charge densities1 [14]. Therefore, it is necessary
to use an insulating layer in between the gate metal and AlN surface to suppress
these otherwise high gate leakage currents.
The choice of insulating material as well as the deposition method has a critical
1The dependence of Fowler-Nordheim tunneling current on charge density follows: Jt ∝∫dEfST (E)(1−fM ) [30]. This shows that the higher charge population of the 2DEG causes an
increase in F-N assisted tunneling transport and therefore more unwanted gate leakage current.
25

influence on the operation of the HEMT. Higashiwaki et al. demonstrated a 3
nm SiN gate insulator deposited by Catalytic-CVD that served the simultaneous
purpose to passivate surface states in the access regions of the HEMT [31]. CVD
SiN has been employed as a “passivation” dielectric for AlGaN/GaN HEMTs since
2000 [32] and with the GaAs system before that [33] making this choice an obvious
one to explore. HRL researchers reported on the use of a GaN cap for gate leakage
current suppression [34]. Zimmermann et al. employed an e-beam deposited 3 nm
thick Al2O3 layer which showed sufficient gate current suppression [35]. Though
adequate for modulation of the reported device, the e-beam deposited oxide is a
rather crude method for oxidation of a surface. Pearton et al. utilized a UV-ozone
treatment prior to gate metallization that partially consumed the AlN barrier and
formed a mixed AlOxN1−x of unknown concentration [36]. This provided sufficient
gate current suppression as well as a positive threshold voltage. An attractive and
more advanced method for ex-situ oxidation of the AlN surface was reported by
Dabiran et al. with an Atomic Layer Deposited (ALD) Al2O3 gate insulator 30 nm
thick on a 4 nm AlN thick AlN/GaN HEMT [37]. The ALD deposition method
inherently allows atomic accuracy of the oxide providing a dense amorphous oxide
making this method a highly attractive oxidation process.
In order to qualify the gate insulator varieties available several metrics where
employed. A comparison of the changes in sheet resistance components ns and
µ, MOS diode IV characteristics, Capacitance-Voltage (CV) analysis, and ellip-
sometry were used to analyze the individual dielectrics for gate insulators. The
insulators explored in this study were PECVD deposited SiN, ALD Al2O3, HfO2,
and Ta2O5.
SiN was deposited by plasma-enhanced CVD using an alternating high/low
26

Figure 2.5. Effects of ALD and PECVD dielectrics on the AlN/GaNchannel charge characteristics µ and ns (left). Gated IV comparison of
the dielectrics studied, taken on 100 µm diameter CV dots (right).
plasma frequency excitation that reduces strain in the deposited layer. A nominal
thickness of 5 nm was deposited. Higashiwaki showed the progressive increase of
sheet resistance with increased SiN thickness where 5 nm gave the optimal condi-
tion for appropriate insulation, which was the basis for the choice of SiN thickness
in this work [38]. Ta2O5, Al2O3, and HfO2 were deposited by ALD, a very sim-
ilar method to the CVD process. Al2O3 films were deposited by means of the
precursors Trimethylaluminum (TMA, Al(CH3)3) and DI H2O at an optimal stoi-
chiometric deposition temperature of 250C that yielded a deposition rate of 1.05
A/cycle. HfO2 films were deposited2 using the precursors tetrakis (ethylmethyl)
amino hafnium (TEMAHf) and DI H2O at an optimal deposition temperature
of 250C that yielded a deposition rate of 1.2 A/cycle. All film thicknesses were
targeted at a nominal 5 nm and blanket deposited across the entire sample surface.
2HfO2 and Ta2O5 films were deposited by Dr. Theodosia Gougousi at the University ofMaryland Baltimore County Physics Department.
27

Prior to all dielectric depositions ohmic contacts were formed and mesa iso-
lation was made which include a Van der Pauw test structure for on-wafer Hall
effect measurement. Hall measurements were taken before and after the deposi-
tion of dielectrics to monitor changes in sheet resistance due to the presence of
the dielectric. Results of these measurements can be seen in Fig. 2.5. For the 5
nm PECVD deposited SiN a negligible increase in 2D sheet density was observed
at the expense of a drastic (28%) reduction in mobility. This reduction in mobil-
ity is attributed to plasma damage from ion bombardment of the heterostructure
during the deposition since the plasma recipe was not optimized for such a thin
barrier. On the other hand, for the ALD processes a very minor (1.6-2%) reduc-
tion in mobility was measured with a notable increase in charge density of 7% and
12%, respectively. The specific mechanism for the increase in charge density is not
completely understood but the argument has been made that for SiN [31] it is the
satisfaction of dangling surface bonds that otherwise cause partial depletion of the
2DEG. It is speculated that either SiN, Ta2O5, Al2O3, or HfO2 will provide such
surface state passivation which could account for the increase in charge density of
the 2DEG. This has been reported by other groups as well [37].
After the insulator and gate metal had been deposited two-probe current-
voltage measurements were taken on capacitance-voltage test structures to com-
pare insulating properties of the dielectrics. Metal-AlN Schottky diodes were
fabricated as a reference for the comparison to the different dielectrics. The com-
parative results are shown in Fig. 2.5. For the applied voltage range appropriate
for a standard gate voltage range the HfO2 in this study appeared to be the best
insulating dielectric of those listed earlier with a current density of 2×10⁻⁶ A/µm2
at a reverse bias of -6V [39].
28

2.2.3 Gate capacitance model
From the thin AlN barrier comes the necessity of a gate insulator where high-κ
materials have shown promise. A high “intrinsic” gate capacitance is desired from
the transconductance standpoint where its relationship to gate capacitance can
be found through the definitions as follows,
gm =∂ID∂VGS
=∂
∂VGS(qnve) = q
(ve
∂n
∂VGS+ n
∂ve∂VGS
), (2.4)
noting that gm is maximized when the device is biased in the saturated-velocity
regime where ve = vsat and is constant. Also, recalling that Q = qn = CV which
leads to q ∂n∂V
= C therefore,
gm|ve=vsat → qvsat∂n
∂VGS= qvsatCG, (2.5)
where CG is given by equation A.12 for the insulated gate HEMT as CG =
(1/Cox + 1/CA + 1/CQ)−1. A more exact form for transconductance is developed
in Appendix B but Eq. 2.5 is adequate to demonstrate that the transconductance
of the HEMT is directly proportional to the gate capacitance and therefore the di-
electric constant of the gate insulator. However, if the gate dielectric is deposited
over the entire device surface as in the case of the transistors shown in the fol-
lowing chapter, its high-κ value causes the enhancement of parasitic capacitances
CGSp and CGDp which are inversely influential on frequency performance. Because
of this reason, the components of the gate structure have significant implications
on the circuit model of the device and warrants a discussion of their benefits and
detriments on capacitance, transconductance, and ultimately frequency perfor-
mance (given in chapter 4).
29

TABLE 2.1
PARAMETERS AFFECTING OPERATION OF THE AlN/GaN
HEMT FOR THE DIELECTRICS CONSIDERED IN THIS WORK
[40], [41].
Eg ∆EC χe φNiB VBD εκ(lit.) deposition
[eV ] [eV ] [eV ] [eV ] [MV/cm]
GaN 3.4 – 4.1 1.0 5 8.9 MBE
AlN 6.2 2.1 0.6 2.0 1.8 8.5 MBE
Si3N4 5.3 1.3 2.1 1.98 4 7 (7) PECVD
Al2O3 8.8 2.16 1.0 3.5 10 8 (11) ALD
HfO2 6.0 1.09 2.4 3.2 8 11.8 (24) ALD
Ta2O5 4.4 0.1 3.3 0.72 4 11.7 (26) ALD
The simplest model for the capacitance structure below the gate (which ne-
glects any leakage or charging paths through the insulator) is the series combina-
tion of capacitances associated with each layer structure given by Eq. A.12. Both
Cox and CA are constant for fixed layer thicknesses and CQ is the semiconductor or
“quantum” capacitance that changes with a change in applied gate voltage3. The
analytical form of CQ for the AlN/GaN heterostructure is given by Eq. A.23. This
goes to show the total gate capacitance is largely dependent on the insulator/oxide
thickness and dielectric constant. The various properties of the gate dielectrics
3By definition, quantum capacitance is the change in charge of a semiconductor or metal dueto a change in local potential [42].
30

Figure 2.6. Modeled C-V dependence on various system parameters(left), and calculated threshold voltage relationship dependance on the
gate dielectric constant for varying AlN thicknesses (right).
explored during this work are given in Table 2.1. In the table all relevant dielec-
tric parameters are referenced to AlN. These values are used for modeling the
capacitance-voltage (C-V) and threshold voltage (Vth) characteristics, as well as
the I-V characteristics which are derived in Appendix B.
The modeled C-V functionality for an ideal insulator/AlN/GaN capacitor with
an insulator dielectric constant of 2 and 10 are shown in Fig. 2.6. This shows
the effect of dielectric constant on total capacitance and Vth. If a fixed (positive)
charge distribution is included in the barrier the dotted line shows the effect on
the C-V curve (negative voltage shift). The same result occurs for a change in
barrier height (ΦB or ΦoA) between the different layers. This is expected since
work function engineering at the metal-insulator interface is a common method
for threshold voltage control and was recently reported in GaN-based HEMTs by
Li et al. [43]. On the other hand, if there is a distribution of electronic states (say
at the insulator/AlN interface) that can (dis)charge based on Fermi level position
31

and proximity to a mobile charge supply (e.g. the 2DEG or ohmic contact metal),
a different effect occurs on the C-V curve due to these states (commonly called
interface states). For a uniformly distributed (in energy) trapped electron charge
distribution a “stretch-out” of the depletion portion of the C-V curve is expected
(not shown) [44]. If the trap distribution is non-uniform the depletion stretch-out
of the C-V curve is also non-uniform in correspondence with the energy level(s)
of the trap distribution(s).
The influence of interface charge trapping on HEMT I-V characteristics will
be discussed in the following chapter, but for now attention is on the electrostatics
of the multi-stack gate capacitor. Fig. 2.6 (right) shows the calculated thresh-
old voltage as a function of dielectric constant of the insulator for various AlN
thicknesses. The functionality of the threshold voltage, Vth follows:
Vth = ΘB −Qπnet
(1
Cox+
1
CAlN
)+Qπ
AlN
(1
Cox
), (2.6)
where ΘB = φB + φoA −∆EC/q is the sum of conduction band offsets as defined
previously. Equation 2.6 may be recast in terms of the 2DEG charge density may
be recast as4
Vth = −qns(
1
Cox+
1
CA+π~m∗
)−(
9π~q2ns8κGεo
√8m∗
)2/3
, (2.7)
where ns is the equilibrium 2D electron charge density. It was assumed that at Vth
the Fermi level at the AlN/GaN interface was equal to the conduction band energy,
Ec. The first form of Eq. 2.6 shows the dependence of Vth on the band offsets
4This form comes from the difference of the results of two different imposed conditions onEq. 2.3. The first conditions being VGS = 0, and the second being VGS = Vth where ns → 0(i.e. “flatband”).
32

and fixed polarization charge involved, whereas the second form, Eq. 2.7 shows
the functionality of Vth with the 2DEG charge density and avoids the necessity
of knowing barrier height and band offsets which may be difficult to determine
accurately. Unsurprisingly, both forms depend on the capacitance contributions
from the oxide and AlN layers and assume no additional fixed or trapped charge.
An obvious point to make with respect to the Vth-trend in Fig. 2.6 (right) is
the effect the high-κ dielectric has on Vth. Based on boundary conditions at the
insulator/AlN interface, Gauss’s law (εoxFox = εAlNFAlN) shows that the higher
the dielectric constant (εox) of the insulator the smaller the electric field in the
insulator layer. Thus, the higher-κ of the insulator, the more electric field from the
gate voltage is spread across the AlN and GaN layers which ultimately causes Vth
to be less negative. The effect can also be seen in either Eq. 2.6 or 2.7 through the
C−1ox term. Equations 2.6 and 2.7, which lead to Fig. 2.6 slightly underestimate
Vth as compared to the linear extrapolation of the transfer characteristic. This is
because in the case of an extrapolated threshold voltage, there remains residual
charge in the mostly depleted channel whereas the condition, ns = 0 cm-2 is forced
on the calculated Vth in Fig. 2.6. Additional, mild inaccuracy arises for practical
considerations of Vth since φB and φoA are both non-constant for all gate metal on
any dielectric. Nonetheless, the functionality of Vth on εr in Fig. 2.6 is appreciated.
In the probable event that the insulator/AlN interface accommodates trap
states that are chargeable, Terman’s high-frequency method [45] has been adapted
(Appendix A) for the insulator/AlN/GaN HEMT structure to analyze interfacial
trapped charge. Applying this analysis to the four dielectrics explored can be seen
in Fig. 2.7. The tabulated values of the extracted Dit spectrum for the dielectrics
explored in this work may be seen in Table 2.2. The bottom row contains the
33

Figure 2.7. Modeled and measured C-V curves (bottom row) with thecorresponding Dit spectrum (top row) for the insulated-gate AlN/GaN
capacitors.
34

C-V data showing the modeled and measured curves for each dielectric. From the
derivative of the difference of the two curves the Dit spectrum can be determined
following Dit = Cox/qkT ×∂VGS/∂ηit as given in Appendix A. The top row shows
the corresponding result of the Terman analysis with Dit plotted as a function of
energy away from the conduction band of the AlN barrier.
In all cases Dit is found to be ∼1013 cm−2eV −1. These values for interface state
density are quite high. However, the trap states would not have any significant
influence on the C-V curve if the trap density were not of a similar order of
magnitude as that of the mobile 2DEG density. It is instructive to take in mind
that the interface is comprised of a low-temperature deposited amorphous oxide
that is not necessarily similar in atomic ordering as the crystalline AlN to which
it is adhered. Additionally, the value of Dit shown in Fig. 2.7 also contains any
trapped charge in the oxide or buffer, imaged to the oxide/AlN interface, which
can further skew the true interfacial value of Dit towards a higher density.
Two final qualitative comments are worthy of mention regarding the extracted
Dit spectra. First, the calculated energetic location that corresponds to Dit is as
questionable as the electric field in the barrier and band offset inaccuracies. This is
true since the energy spectra is calculated from Eq. A.4 which directly depends on
those quantities. The less known the offsets are, the more inaccurate the location
in energy the corresponding Dit becomes. Secondly, the energy ranges shown in
Fig. 2.7 are rather narrow, only ∼30% at most, of the band gap of AlN. Taking in
mind, this value corresponds to a much larger applied gate voltage range. Given
such a narrow accessible energy range, other methods must be employed to probe
states that may occur deep within the band. Deep level trap spectroscopy (DLTS)
is ideally suited for this application.
35

TABLE 2.2
EXTRACTED VALUES OF INTERFACE TRAP DENSITY FOR THE
DIELECTRICS EXPLORED IN THIS STUDY.
Dielectric < Dit > Dit Range
[cm−2eV−1] [cm−2] [eV]
SiN 2.0×10¹³ 3.0×10¹³ 1.7
Al2O3 1.0×10¹³ 0.9×10¹³ 0.8
HfO2 3.0×10¹³ 5.6×10¹³ 1.0
Ta2O5 1.0×10¹³ 1.7×10¹³ 0.5
Figure 2.8. HR-TEM image of a GaN/AlN/GaN structure with an ALDAl2O3 layer deposited on the surface. Image courtesy of D. Smith,
Arizona State University.
36

Figure 2.8 shows a high-resolution transmission electron microscope (HR-
TEM) micrograph of a GaN/AlN/GaN (2/3/1000 nm) heterostructure with an
ALD Al2O3 oxide layer deposited after MBE growth. The interesting point to
note is the Dit extracted and given in Table 2.2 with respect to the micrograph.
Dit of Al2O3/GaN was found to be the lowest of the dielectrics applied. This may
be due to the possibility of a ∼1 nm thick ordered oxide nucleation layer that
forms at the Al2O3/GaN interface which is suggested in the micrograph and may
allow a lower density of interfacial trap states.
2.3 Chapter 2 cited literature
13. I.P. Smorchkova, S. Keller, S. Heikman, C.R. Elsass, B. Heying, P. Fini, J.S.Speck, U.K. Mishra, “Two-dimensional electron-gas AlN/GaN heterostruc-tures with extrememly thin AlN barriers,” Appl. Phys. Lett. no. 24, vol.77, Dec. 2008.
14. Y. Cao, D. Jena, “High-mobility window for two-dimensional electron gasesat ultrathin AlN/GaN heterojunctions,” Appl. Phys. Lett. 90, 182112,2007.
15. T. Zimmermann, D. Deen, Y. Cao, D. Jena, H. Xing, “Formation of ohmiccontacts to ultra-thin channel AlN/GaN HEMTs,” Phys. Stat. Sol. (c), no.6, vol. 5, Apr. 2008.
16. H. Xing, D. Deen, Y. Cao, T. Zimmermann, P. Fay, D. Jena, “MBE-GrownUltra-shallow AlN/GaN HFET Technology,” ECS Trans. vol. 11, 2007.
17. D. Jena, “Polarization induced electron populations in III-V nitride semi-conductors; Transport, growth, and device applications,” Ph.D. dissertation,University of California, Santa Barbara, 2003.
18. Herbert Kroemer, “Quantum Mechanics for Engineering, Materials Science,and Applied Physics”, Prentice Hall, New Jersey, 1994.
19. D. Deen, T. Zimmermann, Y. Cao, D. Jena, H. Xing, “2.3 nm barrierAlN/GaN HEMTs with insulated gates,” Phys. Stat. Sol. (c), no. 6,vol. 5, 2008.
37
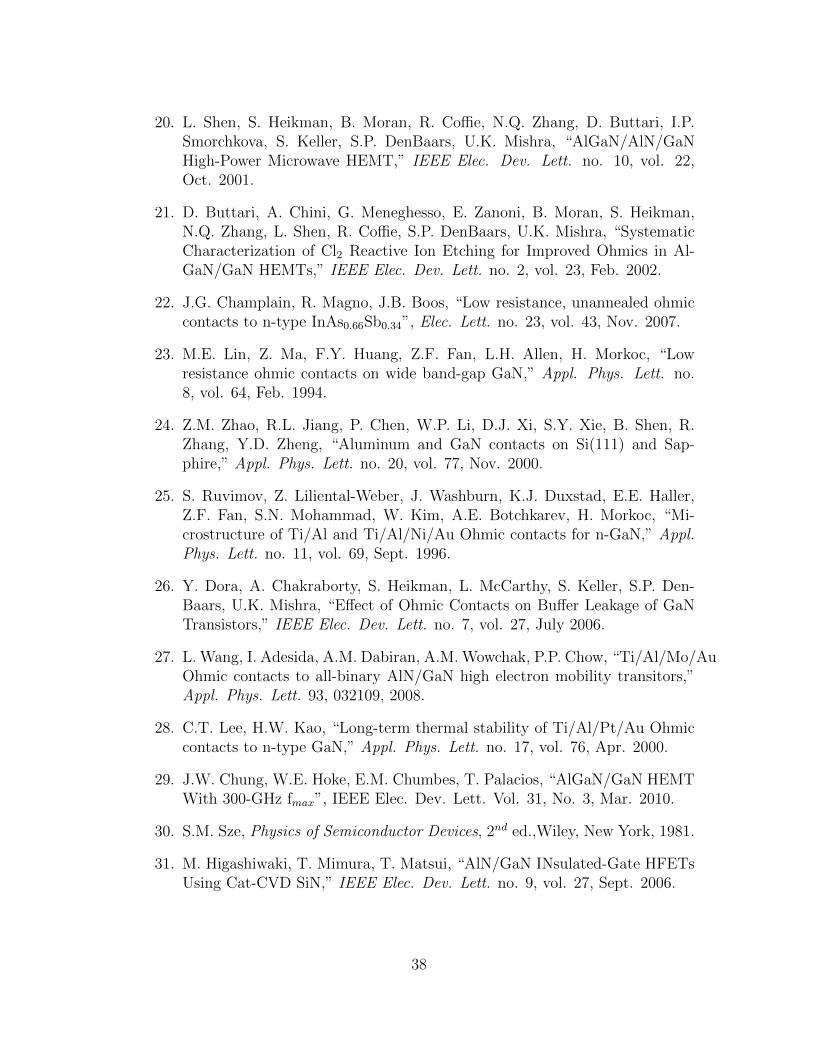
20. L. Shen, S. Heikman, B. Moran, R. Coffie, N.Q. Zhang, D. Buttari, I.P.Smorchkova, S. Keller, S.P. DenBaars, U.K. Mishra, “AlGaN/AlN/GaNHigh-Power Microwave HEMT,” IEEE Elec. Dev. Lett. no. 10, vol. 22,Oct. 2001.
21. D. Buttari, A. Chini, G. Meneghesso, E. Zanoni, B. Moran, S. Heikman,N.Q. Zhang, L. Shen, R. Coffie, S.P. DenBaars, U.K. Mishra, “SystematicCharacterization of Cl2 Reactive Ion Etching for Improved Ohmics in Al-GaN/GaN HEMTs,” IEEE Elec. Dev. Lett. no. 2, vol. 23, Feb. 2002.
22. J.G. Champlain, R. Magno, J.B. Boos, “Low resistance, unannealed ohmiccontacts to n-type InAs0.66Sb0.34”, Elec. Lett. no. 23, vol. 43, Nov. 2007.
23. M.E. Lin, Z. Ma, F.Y. Huang, Z.F. Fan, L.H. Allen, H. Morkoc, “Lowresistance ohmic contacts on wide band-gap GaN,” Appl. Phys. Lett. no.8, vol. 64, Feb. 1994.
24. Z.M. Zhao, R.L. Jiang, P. Chen, W.P. Li, D.J. Xi, S.Y. Xie, B. Shen, R.Zhang, Y.D. Zheng, “Aluminum and GaN contacts on Si(111) and Sap-phire,” Appl. Phys. Lett. no. 20, vol. 77, Nov. 2000.
25. S. Ruvimov, Z. Liliental-Weber, J. Washburn, K.J. Duxstad, E.E. Haller,Z.F. Fan, S.N. Mohammad, W. Kim, A.E. Botchkarev, H. Morkoc, “Mi-crostructure of Ti/Al and Ti/Al/Ni/Au Ohmic contacts for n-GaN,” Appl.Phys. Lett. no. 11, vol. 69, Sept. 1996.
26. Y. Dora, A. Chakraborty, S. Heikman, L. McCarthy, S. Keller, S.P. Den-Baars, U.K. Mishra, “Effect of Ohmic Contacts on Buffer Leakage of GaNTransistors,” IEEE Elec. Dev. Lett. no. 7, vol. 27, July 2006.
27. L. Wang, I. Adesida, A.M. Dabiran, A.M. Wowchak, P.P. Chow, “Ti/Al/Mo/AuOhmic contacts to all-binary AlN/GaN high electron mobility transitors,”Appl. Phys. Lett. 93, 032109, 2008.
28. C.T. Lee, H.W. Kao, “Long-term thermal stability of Ti/Al/Pt/Au Ohmiccontacts to n-type GaN,” Appl. Phys. Lett. no. 17, vol. 76, Apr. 2000.
29. J.W. Chung, W.E. Hoke, E.M. Chumbes, T. Palacios, “AlGaN/GaN HEMTWith 300-GHz fmax”, IEEE Elec. Dev. Lett. Vol. 31, No. 3, Mar. 2010.
30. S.M. Sze, Physics of Semiconductor Devices, 2nd ed.,Wiley, New York, 1981.
31. M. Higashiwaki, T. Mimura, T. Matsui, “AlN/GaN INsulated-Gate HFETsUsing Cat-CVD SiN,” IEEE Elec. Dev. Lett. no. 9, vol. 27, Sept. 2006.
38

32. R. Vetury, N.Q. Zhang, S. Keller, UlK. Mishra, “The impact of surface stateson the DC and RF characteristics of AlGAN/GaN HFETs,” IEEE Trans.Electron Devices no. 3, vol. 48, Mar. 2001.
33. Y.C. Chou, R. Lai, G.P. Li, J. Hua, P. Nam, R. Grundbacher, H.K. Kim, Y.Ra, M. Biedenbender, E. Ahlers, M. Barsky, A. Oki, D. Streit, “innovativeNitrided Passivated Pseudomorphic GaAs HEMTs,” IEEE Elec. Dev. Lett.no. 1, vol. 24, 2003.
34. A.L. Corrion, K. Shinohara, D. Regan, I. Milosavljevic, P. Hashimoto, P.J.Willadsen, A. Schmitz, D.C. Wheeler, C.M. Butler, D. Brown, S.D. Burn-ham, and M. Micovic, “Enhancement-Mode AlN/GaN/AlGaN DHFET With700-mS/mm gm and 112-GHz ft”, IEEE Elec. Dev. Lett. 31, 10, 2010.
35. T. Zimmermann, D. Deen, Y. Cao, J. Simon, P. Fay, D. Jena, H. Xing,“AlN/GaN Insulated-Gate HEMTs with 2.3 A/mm Output Current and480 mS/mm Transconductance,” IEEE Elec. Dev. Lett. 7, 29, 2008.
36. C.Y. Change, S.J. Pearton, C.F. Lo, F. Ren, I.I. Kravchenko, A.M. Dabiran,A.M. Wowchak, B. Cui, P.P. Chow, “Development of enhancement modeAlN/GaN high electron mobility transistors”, Appl. Phys. Lett., 94, 263505,2009.
37. A.M. Dabiran, A.M. Wowchak, A. Osinsky, J. Xie, B. Hertog, B. Cui, D.C.Look, P.P. Chow, “Very high channel conductivity in low-defect AlN/GaNhigh electron mobility structures,” Appl. Phys. Lett. 93, 082111, 2008.
38. M. Higashiwaki, T. Mimura, T. Matsui, “Enhancement-Mode AlN/GaNHFETs Using Cat-CVD SiN,” IEEE Trans. Elec. Dev. no. 6, vol. 54,June 2007.
39. D.A. Deen, S.C. Binari, D.F. Storm, D.S. Katzer, J.A. Roussos, J.C. Hack-ley, T. Gougousi, “AlN/GaN insulated gate HEMTs with HfO2 gate dielec-tric,” IEE Elec. Lett. no. 8, vol. 45, Apr. 2009.
40. web address: http://www.ioffe.rssi.ru/SVA/NSM/Semicond.
41. J. Robertson and B. Falabretti, “Band offsets of high K gate oxides on III-Vsemiconductors”, J. Appl. Phys. 100, 014111, 2006.
42. S. Luryi, “Quantum capacitance device”, Appl. Phys. Lett., 52, 6, 1988.
43. G. Li, T. Zimmermann, Y. Cao, C. Lian, X. Xing, R. Wang. P. Fay, H.G.Xing, D. Jena, “Threshold Voltage Control in AlGaN/AlN/GaN HEMTs byWork-Function Engineering”, IEEE Elec. Dev. Lett., Vol. X, No. X, 2010.
39

44. E.H. Nicollian and J.R. Brews, “MOS (Metal Oxide Semiconductor) Physicsand Technology”, Wiley-interscience, New York, 1982.
45. L. M. Terman, “An investigation of surface states at a silicon/silicon oxideinterface smploying metal-oxide-silicon diodes”, Sol. Stat. Elec., Vol. 5,285, 1962.
40

CHAPTER 3
THE SINGLE-HETEROJUNCTION AlN/GaN HEMT
3.1 The AlN/GaN HEMT
AlN/GaN HEMTs were realized through a multi-faceted approach as a way
to study various specific aspects of their design1. In particular, a study focusing
on heterostructure and HEMT performance dependence on the AlN thickness
spectrum was performed (section 3.1.1). HEMTs grown on GaN templates on
SiC were also explored and showed some of the best frequency performance to
date for the insulated-gate AlN/GaN HEMT (section 3.1.2). The comparison of
various gate dielectrics discussed in the previous chapter led to the development
of the first Ta2O5/AlN/GaN HEMT with record off-state breakdown voltage for
the AlN/GaN-based HEMT (section 3.1.3). The “first generation” AlN/GaN
HEMTs fabricated at Notre Dame yielded record setting drain current density
and transconductance which subsequently set a new benchmark for the AlN/GaN
HEMT and is discussed in (section 3.1.4). Lastly, a discussion on the physics that
govern the current-voltage functionality is given as a means to better understand
the intrinsic operation of the insulated-gate AlN/GaN HEMT and relies heavily
on the analytical development of the I-V characteristics given in Appendix B.
1Heterostructures used during these studies were grown by MBE at the Naval ResearchLaboratory unless otherwise noted.
41

3.1.1 A comparative study on the thickness of the AlN barrier on device perfor-
mance
In an effort to systematically characterize the influence of the AlN cap thickness
on HEMT performance, a series of samples were grown with varied AlN barrier
thicknesses that encompassed the low Rsh window reported by Cao [46]. A similar
study was reported by Higashiwaki for varied barrier thicknesses in AlGaN/GaN
HEMTs [47]. The samples were grown on HVPE GaN substrates provided by
Kyma Technologies which have been shown to allow a reduced dislocation density
(∼ 106 cm−2) owing to the lattice match between the substrate and epitaxial
layers. The layer structure followed a 1.5 nm AlN nucleation layer, a 1 µm Be-
doped GaN, 300 nm UID GaN, and an AlN cap. The AlN cap thicknesses were
1.5, 2.1, 3.0, 3.6, 4.5, 6.0, and 7.5 nm and were chosen to capture operation from
both extremes of the functional range of AlN thickness. The thin AlN nucleation
layer was chosen based off work by Cao that showed a reduced buffer current
which detrimentally acts as a parallel conduction path to the 2DEG channel [48].
Homo-epitaxy growth of UID GaN on HVPE GaN has been shown to have a
high Oxygen density which acts as a shallow level donor species thus causing
buffer leakage current to be high. To mitigate high buffer currents Be-doping
has been shown to be successful as a compensating dopant species for n-type
unintentionally-doped (UID) GaN for the reduction of inter-device isolation [49].
Devices were fabricated using standard lithographic techniques and included
a shallow pre-metallization etch prior to contact metallization for Rc reduction.
After mesa isolation a 7.4 nm thick blanket layer of ALD HfO2 was deposited and
1 µm long optical gates were applied. Room temperature on-wafer Hall measure-
ments were taken before and after HfO2 deposition and the results are shown in
42

Figure 3.1. 2 × 2 µm AFM scans of varied AlN barrier layers.
Fig. 3.2 alongside similar results reported by Cao [46]. Prior to HfO2 deposition
sheet resistance (Rsh), Hall mobility (µ), and sheet charge density (ns) were in
excellent agreement with previous reports [46], [50]. Namely, the 1.5 and 2.1 nm
AlN barrier samples show low charge density and mobilities that suffer from opti-
cal phonon, remote ionized impurity, and remote surface roughness scattering as
shown by Cao [51] which yield sheet resistances which were too high to accurately
measure. Additionally, lattice relaxation was observed through cracks observed
by AFM (Fig. 3.1) starting with the 4.5 nm AlN barrier and became worse for
thicker barriers causing a drastic reduction in mobility. Interestingly, after the
HfO2 was deposited a significant increase in 2DEG charge density was observed
for the 1.5 and 2.1 nm AlN barrier samples which allowed an appreciable reduction
in Rsh as shown by the arrows in Fig. 3.2. It appears this effect is in alignment
43

Figure 3.2. Room temperature sheet resistance determined from Halleffect measurement for varied AlN barrier thickness.
44

with the partial satisfaction of dangling surface bonds which cause depletion of
the 2DEG (e.g. surface state passivation). In both cases, before and after HfO2,
the low Rsh window was observed in very close agreement with Cao’s report. A
record low RT sheet resistance of 130 Ω/ (µ = 1800 cm2/Vs, ns = 2.3×10¹³
cm−2) was measured after HfO2 deposition within the window, specifically at the
3.0 nm AlN thickness. Moreover, both the mobility and sheet resistance trends
with AlN barrier thickness are in close agreement with Cao’s report with the only
notable exceptions being, 1) the upper limit for the Rsh window is ∼0.5 nm less
making the total window for the HVPE GaN sample set slightly narrower than
that shown by Cao and, 2) the maximum achieved mobilities for the samples
grown on HVPE GaN substrates are ∼100 cm2/Vs higher than Cao’s structures
grown on GaN/Sapphire templates. Both of these observations are speculated to
be due to the homo-epitaxial growth on HVPE GaN which results in a significantly
lower dislocation density in the buffer causing reduced dislocation scattering of
the 2DEG electrons but simultaneously less strain relief of the AlN/GaN hetero-
junction, causing precipitous cracking of the AlN barrier layer. Further study is
necessary to verify these mechanisms.
Drain current density characteristics for the five barrier thicknesses which most
closely encompassed the low Rsh window is shown in Fig. 3.3. Corresponding
transfer characteristics are shown in Fig. 3.4 (left). From the figures it is appar-
ent that the optimal AlN thickness for maximizing drain current and transconduc-
tance occurs at ∼ 3 nm where 2D charge density and mobility are both maximized.
However, if considering only extrinsic operation, contact resistance is also a prac-
tical consideration that serves to reduce extrinsic gm and forces a larger knee
voltage.
45

Figure 3.3. Drain current characteristics for varied AlN barrierthicknesses.
Figure 3.4. Transfer characteristics for varied AlN barrier thicknesses(left), and two-probe I-V measurements of insulated C-V dots for the
various AlN barrier thicknesses (right).
46

Figure 3.5 shows comparatively, the trends for various device parameters with
the varied AlN barrier thickness. Contact resistance scaled non-linearly with in-
creasing AlN barrier thickness in fair agreement for obtained RC values with the
ohmic contact study discussed in the previous chapter. Contact resistance has a
strong dependency on AlN thickness but is found to be slightly higher for thin-
ner as-grown barriers. This occurrence is speculated to be due to a lower 2D
charge density below the contacts for thinner barriers resulting in a higher RC
despite more favorable metal diffusion conditions. The combination of the RC
and Rsh-trends ultimately resulted in drain (Imax, Vknee) and transfer (V th, gm)
characteristics trends that followed similarly to RC-Rsh functionality. Therefore,
the 3 nm AlN barrier thickness offers a layer structure that is electronically opti-
mized for the highest current density and transconductance within the minimum
Rsh window.
It is interesting to note that gate leakage current was higher for the thicker
(4.5+ nm) barriers, causing a reduced gm and impairing drain I-V curves at forward
gate bias. This is thought to be due to cracking (i.e. lattice relaxation) in the
barrier layer for the thicker barriers which provide current paths through the
barrier along dislocation boundaries for increased gate current leakage despite the
HfO2 insulation. Besides mobility degradation, this mechanism is the cause for
an upper limit in the range of AlN barrier thicknesses when fabricating HEMTs
from these layer structures. Furthermore, two-probe I-V measurement results
of insulated C-V dots are shown in Fig. 3.4 (right). The 3.6 nm and 4.5 nm
barrier thicknesses showed an abrupt increase in reverse-bias gate current at -6V
suggesting that even though the total gate-to-channel thickness is increasing, the
gate current is a function of the cracking that occurs in the thicker AlN barriers.
47

Figure 3.5. Measured sheet resistance (a), 2D charge density (b),mobility (c), contact resistance (d), maximum drain current density (e),
and transconductance (f) as a function of AlN barrier thickness.
48

In terms of DC characteristics the final result is that the 3.0 nm AlN barrier
sample showed a current density of 1.8 A/mm and transconductance of nearly
300 mS/mm for 1 µm long gates (LSD = 5 µm). These values are the highest
of their kind for this gate length. It is worthwhile to note that Zimmermann et
al. [52] demonstrated comparable DC performance with a 4 nm thick AlN barrier
and 3 nm thick SiN gate insulation. This shows that by leveraging the high
charge density (∼ 3 × 1013 cm−2) and improvements in mobility (1800 cm2/Vs)
by homo-epitaxial growth on HVPE GaN substrates, the low sheet resistance
window demonstrated by Cao and Jena [46] can be exploited to yield exceptional
DC HEMT characteristics from the AlN/GaN HEMT.
3.1.2 AlN/GaN HEMTs grown by MBE on MOCVD GaN/SiC templates
The most typical substrates used for epitaxial growth are sapphire or SiC. SiC
has it’s advantage over sapphire from the standpoint that its thermal conductivity
is much higher than sapphire’s. This allows heat generated by the HEMT channel
during current conduction and high electric field to be transported away more
efficiently and subsequently the avoidance of the detrimental effect of self-heating
which causes unwanted negative output conductance (through a reduction in high-
T mobility/electron velocity) and a reduction of output power.
GaN was grown by MOCVD on a 2-inch 4H-SiC substrate and followed by
the growth of the AlN/GaN (3 / 234 nm) heterostructure by MBE2 as a way to
utilize the beneficial thermal properties of SiC. An 11 nm thick Al2O3 was blanket
deposited over the entire sample surface by ALD and both optical and e-beam
defined gates followed. Various gate lengths of 1.5 µm, 250, 200, and 145 nm were
2MBE growth was performed by Y. Cao at the University of Notre Dame and is gratefullyacknowledged.
49

Figure 3.6. DC transfer (a) and drain (b) characteristics (left) and smallsignal frequency characteristics (right) of the AlN/GaN HEMT grown on
GaN/SiC templates.
written by electron-beam lithography and electron-beam metal deposition. After
Al2O3 deposition the room-temperature Hall properties of the 2DEG were found
to be ns = 2.8 × 1013 cm−2, µ = 1770 cm2/Vs which yielded a sheet resistance of
Rsh = 165 Ω/. C-V analysis revealed a lower than expected relative dielectric
constant for the Al2O3 of 3.6. It is speculated that this occurred due to an aging
batch of TMA precursor used for the ALD deposition. Circular transmission line
method (CTLM) measurements showed Rc = 0.9 - 1.1 Ω-mm and Rsh values that
were commensurate with those of Hall measurements.
The outstanding Hall characteristics resulted in HEMT devices that showed
maximum drain current density of 1.5 A/mm and 325 mS/mm extrinsic transcon-
ductance (Fig. 3.6). Since the UID GaN buffer was grown homo-epitaxially on
the GaN-terminated template surface without a pseudomorphic nucleation layer,
the regrowth interface electrical properties (dislocation density, additional charge
distribution, etc.) were unknown. Although the gate current is sufficiently low, as
50

can be seen in Fig. 3.6, it does not match the drain current in sub-threshold which
indicates a rather large parallel conduction current through the buffer. Further
C-V analysis did not show a buried charge distribution at the regrowth interface.
Despite a low dielectric constant of the Al2O3 gate insulator, small signal
frequency performance was notable with ft/fmax of 92/115 GHz, respectively.
A ground-signal-ground open calibration with the geometry and layer structure
equivalent to the HEMTs measured, was simulated using ADS/Momentum3. From
the simulated S-parameters, data was fit using AWR Microwave Office to a 3-
capacitor circuit which signifies the pad parasitic capacitances CGSp, CGDp, and
CDSp [53]. These three components were de-embedded from the measured S-
parameter data which yielded values for ft and fmax of 104 and 115 GHz, re-
spectively. The pre and post results of de-embedding can be seen in Fig. 3.6
(right) which highlights the improvement in frequency performance from remov-
ing the bonding pad impedance. These values are demonstrative of some the best
frequency performance for an insulated-gate AlN/GaN HEMT to date [54], [55].
The resulting device performance is a testament to the quality of material and
geometric scalability which leads to the remarkable frequency performance capa-
bility of the AlN/GaN HEMT. Further improvement in DC and RF performance
is anticipates with the reduction of Rc and higher dielectric constant of the gate
insulator.
3.1.3 Ta2O5 insulated gate AlN/GaN HEMT
In order to take advantage of the outstanding current density capability of
these devices for high-power applications the accessible bias voltage range must
be increased. HEMTs designed with a thin (< 6 nm) AlN barrier require a gate
3S-parameter simulation was performed by Y. Tang at the University of Notre Dame.
51

insulator for gate leakage current suppression due to an otherwise prevalent tunnel-
ing current. Recent reports have demonstrated the use of atomic layer deposited
(ALD) Al2O3 or HfO2 for gate insulators to the AlN/GaN HEMT [56, 57]. Yet
the off-state breakdown voltage has remained low due primarily to gate insulator
failure leading to premature off-state breakdown. One of the highest breakdown
voltage reports to date for an AlN/GaN HEMT stated a maximum VDS of 45 V
and a resulting output power density of 850 mW/mm at 2 GHz with VDS = 15 V
[58]. However, the reported devices showed soft pinched-off characteristics and a
low drain current density of only 380 mA/mm.
One common technique used for increasing breakdown voltage in HEMTs is
the use of field plates.[59] However, metallurgical gate extensions drastically in-
crease parasitic capacitance in the device and thus hamper frequency performance.
Significant progress has been made with ALD oxides, including Ta2O5, for Si
and GaN-based metal-oxide-semiconductor test structures[60] since they provide
a high dielectric constant film and are electronically robust. However, Ta2O5 has
yet to be investigated for the purpose of gate insulation in GaN HEMT struc-
tures. In an effort to improve the range of applied bias voltage of an insulated-
gate AlN/GaN HEMT while simultaneously taking advantage of the structure’s
inherent scalability, a 6 nm thick ALD Ta2O5 film was deposited for gate current
suppression on an AlN/GaN structure with a 3.5 nm thick AlN cap (Fig. 1.2).
With an effective band-gap of ∼4.4 eV,[61] a relative dielectric constant value [60]
as high as 20, and a critical breakdown field of approximately 4 MV/cm, Ta2O5
appears favorable for gate insulation where vertical down-scaling imposes high
electric fields conditions.
III-Nitride epitaxial layers were grown by plasma assisted molecular beam
52

Figure 3.7. Drain characteristics of the Ta2O5/AlN/GaN HEMT(destructive breakdown occurs at 96 V for VGS = -7 V).
epitaxy (MBE) on a 2-inch semi-insulating 6H-SiC substrate using procedures
similar to those described previously [49]. Three cycles of Ga deposition and
desorption like that described by Brandt et al.,[62] were performed in the growth
chamber prior to growth. A 60 nm AlN nucleation layer was grown first, followed
by a 1 µm GaN buffer and a 3.5 nm AlN barrier layer. The AlN barrier thickness
was chosen on the basis of work by Cao et al. who showed a minimum in sheet
resistance in single heterostructure AlN/GaN for AlN thicknesses between 3 - 4.5
nm [46]. All layers were grown without interrupts or doping and at a substrate
temperature of 730 C.
Device processing was initiated by an ohmic-first sequence. Ohmic contacts
were formed by a shallow pre-metallization etch prior to the deposition of a
53

Ti/Al/Ni/Au metal stack and an 800 C anneal [63]. This process yielded a con-
tact resistance (Rc) of 0.7 Ω-mm as measured by the transmission line method. A
6 nm ALD Ta2O5 layer was blanket deposited following a 100 nm deep, Cl-based,
mesa isolation etch. Ta2O5 films were prepared using an ALD process utilizing
pentakis(dimethylamino)tantalum (PDMAT) and water as reagents at 250 C.
The films were deposited in a hot wall flow tube type reactor [64]. A constant
flow of ultrahigh purity N2 gas (15 sccm) was used to maintain a flow tube process-
pressure of 200 mTorr during deposition and a 30 second purge time was used to
separate the reagent pulses. Under these conditions linear growth was observed
and a growth rate of 0.6 A/cycle was measured using spectroscopic ellipsometry.
As-deposited films were found to be amorphous and slightly over-oxidized (O:Ta
= 3.0 ± 0.3) with a bonded carbon content of ∼5 at.%. Atomic force microscopy
of the Ta2O5 film deposited on the AlN surface had a RMS roughness of 0.58
nm for the 1 × 1 µm scan shown in Fig. 1.2 (RMS roughness of the as-grown
AlN surface was 0.45 nm). Ta2O5 films received no post-deposition thermal treat-
ments. Electron-beam lithographic definition of sub-micron gates with a T-profile
concluded the device processing. Pertinent geometric dimensions of the HEMTs
were source-drain separation (LSD) of 3 µm, gate width (Wg) of 2×25 µm, and
gate footprint length (Lg) of ∼150 nm.
On-wafer room-temperature Hall measurements were taken after the Ta2O5
deposition and sheet resistance was found to be 356 Ω/ with a 2D electron
density and mobility of 2.2 × 1013 cm−2 and 800 cm2/Vs, respectively.
Drain characteristics are shown in Fig. 3.7 with a maximum current density
of 1.37 A/mm at VGS = 4 V. Corresponding transfer characteristics were taken
at VDS = 8 V and shown in Fig. 3.8 (a). A maximum extrinsic transconductance
54

Figure 3.8. (left) Drain and transfer characteristics and, (right) smallsignal frequency performance of the Al2O3/AlN/GaN HEMT grown on
GaN/SiC templates.
(gm) was measured to be 315 mS/mm. Taking into account source contact (0.7
Ω-mm) and access (0.21 Ω-mm) resistance, this value corresponds to an intrinsic
gintm ∼ 450 mS/mm. Gate current was found to be the limitation in off-state drain
current (Fig. 3.8 (b)). Low (10−8 A/mm) parallel conduction in the buffer layer
was measured.
Off-state breakdown voltage is often defined by the criterion that 1 mA/mm
drain current density is reached in the sub-threshold state. According to this
metric, VBD ∼30 V. However, the Ta2O5-insulated devices ultimately sustained
drain-source voltages of up to 96 V under off-state gate-source bias (VGS = -7
V) before destructively breaking down (Fig. 3.7) demonstrating an ∼5X increase
of this particular characteristic over other reports [67], [55], [56], [54], [57]. It is
noted that after ∼60 V drain voltage sweep in off-state conditions, the device’s
low-voltage IDS and gm degraded by 30 - 50%. The pre-DBD degradation is
speculated to be the result of a localized breakdown of the AlN barrier at the
55

drain edge of the gate under reverse bias forcing the Ta2O5 to sustain the entire
voltage drop. This would still maintain transistor action after AlN breakdown
but with degraded transport across the gated region. It is therefore plausible
that DBD occurs after AlN breakdown when the local electric field is of sufficient
intensity to cause electrical failure of the Ta2O5 film.
Terman’s method implicitly probes interfacial charge states which are below
the ac perturbation frequency thus, fast states are not accounted for. These
“slow” states apparently do not impose deleterious effects on small signal fre-
quency performance as can be seen in Fig. 3.8 (b). Small signal S-parameter
characteristics were taken at the bias point that yielded maximum gm. Extrinsic
values of unity current gain frequency (ft) and maximum frequency of operation
(fmax) were measured to be 55 GHz and 115 GHz, respectively. By employing the
ColdFET and standard Y-subtraction technique,[65] pad parasitics were modeled
(table inset, Fig. 3.8 (b)) and the de-embedded value of ft was determined to be
75 GHz. According to these results, Ta2O5 may offer a nascent solution to enable
the insulated-gate AlN/GaN HEMT to perform at frequency levels dictated by
it’s scalability with power handling capability that can contend with that of the
AlGaN/GaN hetero-system.
3.1.4 First-generation insulated-gate AlN/GaN HEMTs
While the generational improvements at NRL are noteworthy, the caliber of
AlN/GaN device performance achieved at Notre Dame is of the highest reported
to date in terms of maximum current density and transconductance. As discussed
previously, the AlN/GaN HEMT has the highest polarization charge of the III-
Nitride HEMTs which lends itself to the highest 2D mobile electron densities.
56

Given appreciable mobility (∼1600 cm2/Vs) the 2D conductivity yields the lowest
of any III-Nitride heterojunction measured or modeled. With such low conductiv-
ity a very high current density is expected (see next section for discussion). The
highest current density to date by any FET is shared by two structures in the
III-Nitride system, the InAlN/GaN HEMT [66] and the AlN/GaN HEMT [67].
Results published in reference [67] are now discussed.
MBE growth of the structure was initiated by the growth of a 200 nm thick
UID GaN buffer on a GaN template on sapphire. Following buffer growth was
a 3.5 nm pseudomorphic AlN cap. The structure resulted in an as-grown sheet
resistance of 166 Ω/ (ns = 2.75×1013 cm−2, µ = 1367 cm2/Vs). Standard
lithographic and III-Nitride processing techniques were used and Ti/Al/Ni/Au
contacts were formed by rapid thermal annealing. Transmission line measurements
yielded values for Rc and Rsh of 1.1 Ω-mm and 171 Ω/, respectively. Sub-
micron gate (Lg = 250 nm) definition was defined through e-beam lithography
and a sequential oxide-metallization of Al2O3/Ni/Au was deposited by e-beam
evaporation. HEMT access regions were left un-passivated.
Shown in Fig. 3.9 are the drain (left) and transfer (right) characteristics of an
AlN/GaN HEMT device grown and fabricated at the University of Notre Dame
[67]. A maximum extrinsic transconductance of 480 mS/mm was measured with
a maximum current density of 2.3 A/mm for a LG = 250 nm HEMT. A conser-
vative estimate for intrinsic gm taking only source contact resistance into account
yielded ∼0.8 S/mm. Pulsed-drain I-V measurements (Fig. 3.9 (left)) showed only
minor self heating for the structures grown on GaN/sapphire templates although
the pulse width was rather long at 500 µs. A 3 nm thick electron beam deposited
Al2O3 gate dielectric was used for gate current insulation. A major caveat to
57

Figure 3.9. Drain (left) and transfer (right) characteristics of theAlN/GaN HEMT grown and fabricated at U. of Notre Dame.
this structure was the presence of a large buffer current that led to a high ∼200
mA/mm off-state current at VGS = -10 V and VDS = 8 V due to parallel con-
duction at the GaN re-growth interface which was located ∼200 nm below the
channel. This resulted in a larger negative threshold voltage in order to pinch off
the HEMT. This growth issue has since been resolved by a novel approach that
utilizes a dopant-free polarization engineered AlN nucleation layer [48]. Small
signal frequency performance was measured to yield an extrinsic ft = 52 GHz and
fmax = 60 GHz. These values are lower than expected when considering such high
transconductance and current density. It was found to be due to the gate bonding
pad positioned such that it was connected to the leaky buffer layer. Thus, the RF
gate signal was forced to modulate the HEMT channel as well as suffer from the
lossy buffer below it.
The AlN/GaN heterojunction has the capability to achieve a charge density
in excess of 2 times higher than its only contender, the InAlN/AlN/GaN het-
erostructure. Accompanied by a high mobility (1000 - 1800 cm2/Vs for devices
58

demonstrated in this work), the AlN/GaN HEMT has the capacity to supersede
all other III-N heterostructures in current density and transconductance. Cur-
rently, there is a medley of other issues (high contact resistance, gate insulation,
low breakdown voltage, etc.) that are hampering the AlN/GaN HEMT to come
to full technological maturity. Nonetheless, it is anticipated that upon resolve
of these issues, a full appreciation of this heterostructure for HEMT applications
may be realized, as has been partially demonstrated by the outstanding HEMT
device performance shown.
3.2 Implications of peripheral resistance on HEMT intrinsic I-V characteristics
Shockley’s 1952 theoretical development of the current-voltage operation for a
uniformly doped channel FET [68] was the first physical model-based analytical
assessment for a solid-state FET. In his work he utilized a gradually changing
potential profile along the transistor’s channel which allowed the simplification
of the mathematics involved and so termed it the gradual channel approximation.
Supporting work by Grebene and Ghandhi followed in 1969 with the generalization
of Shockley’s original theory by developing the pinched channel characteristics for
an arbitrary doping profile [69]. The combination of these two seminal works have
become the benchmark for understanding the physics of FET operation. It is
worthwhile to note that in both of these works the field effect device had a doped
channel from whence the mobile carriers were derived, which is in contrast to the
polarization-doped channel employed by the III-Nitride HEMT. This difference
does little to change the ultimate I-V functionality between the doped-channel
FET and polarization-doped HEMT but is significant with respect to the I-V
derivation for the HEMT which is presented in Appendix B.
59

The drift velocity of electrons in the channel is of fundamental importance as
it directly determines the current density and speed at which a transistor may
operate. A back of the envelope calculation for current density assuming typical
values for an AlN/GaN HEMT with charge density of 2.5× 1013 cm−2 and electron
velocity of 1 × 107 cm/s gives a current density (J = qnsve) of 4 A/mm. This
value is a factor of 2 higher than the highest value reported for a III-Nitride HEMT
based on today’s literature [67],[66]. Therefore, the question arises; from where
does this discrepancy originate? The following pedagogical discussion seeks to
shed light on this issue.
3.2.1 Ideal three-terminal current-voltage model
The basis for the analytical development of the polarization-doped HEMT be-
gins with Ohm’s law ( J = σF||) along the channel, in combination with Poisson’s
equation (O2V = σ/ε) approximated to 1D in the vertical dimension. The latter
approximation is based off the assumption that the change in potential along the
channel is much less than the change taken vertically through the gated region
(∂V/∂x << ∂V/∂y), and is the well known gradual channel approximation (GCA)
[70],[68],[69].
Poisson’s equation may be utilized to obtain a relationship for the charge
control relationship between applied voltage and charge below the gate. The
result has been given in Chapter 2 but is restated here in terms of the charges
present in the heterosystem
− VGS + V (x) +
(ΦB + ΦoA −
∆Ecq
)+QπA
Cox−Qπ
net
(1
Cox+
1
CAlN
)+ qns
(1
Cox− 1
CAlN+
π~qm∗
)+ (qns)
2/3
(9π~q
8εG√
8m∗
)2/3
= 0, (3.1)
60

where ΦB and ΦoA are the metal-oxide barrier and oxide-AlN offset, respectively,
∆Ec is the AlN/GaN conduction band discontinuity, εG = εrεo is the dielectric
constant of GaN, Cox and CAlN are the fixed capacitances per unit gate area asso-
ciated with the gate oxide and AlN barrier, respectively, m∗ is the effective mass,
QπA is the fixed polarization (spontaneous and piezoelectric) charge of the strained
AlN, Qπnet is the net polarization charge at the AlN/GaN interface, and qns is the
2D mobile charge comprising the channel. V (x) accounts for the distributed volt-
age drop across the channel due to the voltage difference between the source and
drain contacts. This relation is used to determine the I-V functionality in general.
Due to the cubic nature of ns the roots are difficult to handle and the final form
for the drain current, ID = f(VG, VD, VS) is most conveniently written in terms
of 2D charge density, ID = f(ns(VG, VD, VS)). For the “ideal” III-Nitride HEMT
(i.e. no external resistance, electron velocity limitation, charge unaccounted for)
the drain current density is written,
JDS =qµ
Lg
[q
2
(1
Cox+
1
CAlN+
π~qm∗
)n2s +
2
5
(9π~q2
8εG√
8m∗
)2/3
n5/3s
]ns,D
ns,S
, (3.2)
where JDS is the drain current per unit gate width, Lg is the metallurgical gate
length, µ is the two-dimensional mobility and is assumed to be constant, and the
drain-source-gate voltage functionality is contained in the determination of ns as
given in Eq. A.4.
Equation 3.2 shows linear dependency on mobility and gate length, as ex-
pected. The typical square law dependence of drain current on VGS found in the
doped long-channel HFET derivation is not clearly apparent for the polarization-
doped HEMT. Square law dependence is indeed contained in Eq. 3.2 through the
n2 term (when Eq. A.4 is also considered) but with the addition of the n5/3 term
61

Figure 3.10. AlN/GaN HEMT I-V characteristics showing the effectwhen two different mobilities are considered.
that arises from the integration of the charge of the first populated sub-band.
This second term frustrates the clarity of simple square law behavior but does not
diminish its functionality.
A comparison of simulated I-V characteristics is given in Fig. 3.10 showing the
result of two different mobilities, 1600 2/V s (left) and 800 cm2/V s (right). No
external resistance or velocity saturation was assumed. Other parameters used
were those typical of the AlN/GaN HEMT; Lg = 1 µm, oxide thickness of 10 nm,
AlN thickness of 3 nm, and a metal work function chosen such that a zero gate
bias 2D charge density of 2.13 × 1013 cm−2 was present in the channel. These
values will be used for the following representative simulations.
It is obvious that mobility simply scales current density. However, the values
shown for current density in Fig. 3.10 are far higher than the highest current
62

density for the AlN/GaN HEMT reported in literature [67],[52]. This is because
the derivation above is for the intrinsic portion of the HEMT which does not take
into account external resistance and is ideal from the standpoint that no limitation
on current transport (i.e. electron velocity saturation) is imposed other than the
fixed low field mobility. The following sections discuss the integration of these
necessary practicalities.
3.2.2 Velocity saturation
A key assumption made by Shockley [68] and also Grebene [69] is that drain
current saturation in a HEMT is the direct result of the electron drift velocity be-
coming limited (saturation) at a specified lateral electric field within the transistor
channel. Velocity saturation occurs when the measured electron drift velocity be-
gins to deviate from the linear low electric field relationship (ve = µF||). This
property is a phenomenological occurrence at high electric field that arises from
the various scattering elements within the crystal. When the electric field achieves
such a level that scattering prohibits further increases in velocity with higher fields,
velocity saturation has occurred. Figure 3.11 shows velocity-field curves for several
different semiconductor systems. The detriment that velocity saturation imposes
is that it prevents the “peak” electron velocity from being achieved (which has
been calculated to be as low as ∼1.5 × 107 cm/s for GaN [71]) and therefore
sets a restraint on current density, transconductance, and ultimately frequency
performance of a GaN-based transistor.
For GaN channels, the room temperature saturation velocity has been shown
to be reduced from theoretically calculated levels by the interplay between optical
phonon scattering and the hot phonon bottleneck restricting phonon decay [72, 73].
63

Figure 3.11. Electron velocity versus electric field for various commonsemiconducting systems. The scattering limited velocity approximation
is illustrated for the GaN curve.
This sets a “choke” on the attainable electron velocity. Assuming only optical
phonon scattering limited velocity, the saturation velocity is taken to be vsat ≈
µOPFcrit, where Fcrit is the critical electric field that dictates the onset of phonon-
limited velocity saturation. Taking the optical phonon scattering time to be τOP
= 0.3 ps sets an optical phonon limited mobility ceiling4 of ∼ 2600 cm2/Vs and a
scattering limited velocity saturation of ∼ 1.7 × 107 cm/s [73].
A common approximation made on the velocity-field characteristic is called
the scattering-limited velocity approximation (SLVA) [70],[74],[75] and is given by
4The “ceiling” is meant as if only optical phonons limited electron momentum scattering time.In reality, and according to the drude model, multiple scattering mechanisms add to further limitelectron drift velocity and subsequently mobility. The OP-limited ceiling is assumed here as azero-order approximation for velocity saturation in GaN.
64

ve =µF
1 + µFvsat
, (3.3)
where vsat is the saturated drift velocity and µ is the low field mobility. The ap-
proximation can be seen in Fig. 3.11 where the intersection of the low-field veloc-
ity tangent and the saturated velocity lines define the approximated velocity-field
curve. This approximation has been used to explain some short-channel and low
barrier aspect ratio effects [70],[74] where frequency performance deviates from
the typical long-channel rule, ft ∼ 1/Lg. The approximation seeks to give a phe-
nomenological functionality to electron velocity saturation and can be understood
by considering the case where the saturation velocity is very large compared to
the drift velocity (vsat >> µE). This is the low-field condition. Then the drift
velocity approximates to the low-field velocity. Conversely, when the electric field
is such that the drift velocity becomes comparable to vsat, the electron velocity
approaches the saturation velocity ceiling, as illustrated in Fig. 3.11.
By the inclusion of the SLVA in the GCA development of the drain current, a
modified low-field I-V functionality is obtained,
JDS =qµ
Lg + µVDS
vsat
[q
2
(1
Cox+
1
CAlN+
π~qm∗
)n2s +
2
5
(9π~q2
8εG√
8m∗
)2/3
n5/3s
].
(3.4)
From Eq. 3.4 the original form of Eq. 3.2 is maintained through the bracketed
term. However, it is now scaled by a term that amounts to an effective gate length
(Leff = Lg+µVDS/vsat) which is saturation velocity-dependent and arises directly
from the inclusion of the SLVA. Therefore, it is reasonable to expect a reduction
in drain current when a saturated velocity is assumed. This can be seen in Fig.
3.12 where ideal I-V curves are shown as before and compared to the vsat-limited
65

Figure 3.12. AlN/GaN HEMT I-V characteristics showing the effectwhen velocity saturation is included.
66

HEMT I-V characteristics where vsat was assumed to be 1.7 × 107 cm/s. A drastic
reduction in current is calculated and shown. Interestingly, by including the SLVA
the flat saturated current characteristic no longer maintains its constant value with
respect to an increasing VDS but rather demonstrates a “negative conductance”
nature. This is due to Leff being VDS-dependent and having a greater scaling effect
at higher VDS-bias. Based on this observation and taking in mind self-heating
being a common argument for negative drain conductance, it seems reasonable
that some portion of negative conductance observed in measured data may be
due to the physical manifestation of a saturated electron velocity rather than
strictly self heating.
3.2.3 External resistance
The occurrence of high contact resistance (Rc) has already been discussed from
a practical standpoint in Chapter 2 and is a major limitation for the GaN-based
HEMT from reaching its intrinsic potential. The primary effect of external source
and drain resistance is to form a voltage divider which causes a reduced voltage
drop across the intrinsic region of the HEMT and thus, a reduced drain-source
current for a given external VDS bias. However, since the intrinsic portion of the
device becomes non-linear around the knee voltage, a non-linear voltage division
occurs across the intrinsic device. This effect is exacerbated by the typical asym-
metry in source and drain access resistances that arise from an offset gate. Access
resistance is taken as the additive combination of contact (Rc) and sheet resis-
tance in the access region (Rsh) of the device. Therefore, source access resistance
follows RS,a = Rc + (LSG/WG)Rsh and drain access resistance follows RD,a =
Rc + (LDG/WG)Rsh, where LSG and LDG are the source-to-gate and drain-to-gate
67

Figure 3.13. GCA model results of imposing external source and drainresistance on drain I-V characteristics (internal source and drain
voltages shown with respect to the applied external VDS on the right).
distances, respectively.
The determination of the resistance-afflicted I-V characteristics is found nu-
merically since the I-V functionality becomes recursive when the intrinsic cur-
rent is determined by the voltage drop across the access resistance. This can
be understood by considering the voltage drops in the resistor-HEMT circuit:
V intDS = V ext
DS − IDS(RS,a +RD,a). Since IDS is found by applying V intDS , the I-V rela-
tionship cannot be found in closed form. Therefore, the values for V intD and V int
S
are found through an iterative calculation (Jacobi method) using the equations:
V intD = V ext
D −RD,aIDS (3.5a)
68

V intS = V ext
S −RS,aIDS (3.5b)
The result is the reduction of the voltage drop across the intrinsic portion of the
HEMT. Figure 3.13 shows the result of imposing symmetric source and drain re-
sistances of 0.5 Ω-mm to the ideal I-V characteristics previously discussed. The
intrinsic drain and source voltages calculated for this external resistance can been
seen in the rightmost plot. It is noted that VS does not maintain a linear change
with the applied external voltage as does VD. This is due to VS not being implicitly
dependent on VD,ext but rather increasing only as a function of VS,ext. The reduced
voltage drop across the intrinsic portion causes less current to be carried through
the device and an apparent drop in maximum current. Additionally, since the in-
trinsic source voltage has changed, the intrinsic VGS has changed correspondingly.
The effect of a changed channel potential causes the obvious knee-voltage walkout
as well as a reduction in ∆IDS/∆VGS (i.e. transconductance).
3.2.4 Experimental correspondence to model and its validity
Two strong limiting factors, electron velocity saturation and external resis-
tance, have been discussed individually with respect to their implications on
HEMT I-V characteristics. The integration of these effects into one complete
analytical model will give insight into how to improve the device based on specific
criteria. This is provided that good agreement is had between the model and
measured results. The primary goal, however, is to reconcile the discrepancy of
the AlN/GaN HEMT between the anticipated current density based off a simple
consideration of Ohm’s law and those obtained in practice.
Figure 3.14 demonstrates quantitatively, the progression of the I-V charac-
69

Figure 3.14. Progression of the AlN/GaN I-V characteristics for theintrinsic device (left), the addition of the VLSA (middle), and the final
addition of external resistance.
70

teristics of the AlN/GaN HEMT when each limiting component is added to the
model. The leftmost plot shows the familiar ideal I-V calculation, the middle plot
includes the VLSA, and the rightmost plot includes both the VLSA and symmet-
ric external drain and source resistances of 0.5 Ω-mm. It is apparent that the
inclusion of a saturated electron velocity drastically reduces the maximum satu-
rated drain current and further so does the addition of external resistances. The
latter also shifts the knee voltage of the drain characteristics to higher values. The
choice of reasonably realistic parameter values for µ, Rc, and vsat, albeit some-
what arbitrary, causes an ∼ 80% drop in extrinsic drain current density down
to a realistic range (∼3 A/mm). Therefore, the question now is if by including
only the two limitations discussed, does the model show correspondence with the
characteristics of a measured HEMT?
The GCA model with the SLVA is plotted with the measured data of the
HfO2/AlN/GaN HEMT with the 3 nm AlN cap (shown in Fig. 3.15). The pa-
rameter values used in the fit were vsat = 1.3 × 107 cm/s, µ = 1840 cm2/Vs, RD
= 0.7 Ω-mm, RS = 0.2 Ω-mm, and ΦB was adjusted such that at VGS = 0V, the
value of ns corresponded to that measured by Hall. It can be seen that the near-
threshold characteristics show close correspondence with the model’s current level
in the saturation regime. In this range, the modeled current levels show agreement
with the measured data and the point of threshold for the model and measured
data correspond well. However, two noticeable deviations are recognized. The
first and most apparent is the deviation of the family of curves at higher (less
negative) gate-source voltages. The second is the deviation in the linear regime of
the model from the measured data where the knee voltage is approximated to oc-
cur at higher drain-source voltages. The dotted lines in Fig. 3.15 (a) demonstrate
71

Figure 3.15. GCA model fit to data (a) taken from Fig. 3.3 showing thelow-field deviation due to the SLVA (b). GCA fit to transfer
characteristics (c).
the case when the SLVA maintains it’s bias voltage dependence beyond pinch-off.
The solid lines indicate a bias-independent SLVA beyond the knee voltage. The
latter allows a more accurate fit closer to threshold.
The model appears to over-estimate the drain current for less negative VGS
biases. The over-estimation may be a partial result of a mechanism referred to as
“source starvation” [76]. If the model transfer characteristic is considered (Fig.
3.15 (c)) it is observed that the model drain current continually rises without
ceasing when VGS increases positively. This is untrue for a practical device. One
possibility for this occurrence is that when the gate-source bias in a HEMT in-
creases positively, the energy barrier along the channel between the gate and
source decreases to a point that it allows free flow of electrons from the source
contact to the drain contact. Beyond this gate-source bias, any additional VGS
will only minimally increase the electric field between the source and gate that
72

is responsible for electron flow in that region. Thus, a “compression” in drain
current occurs for increases in VGS.
While source starvation has been shown to limit further increases of IDS in
HFETs the primary cause of the IDS compression shown in this work is suggested
to be the interplay between the high interface state density observed (Ch. 2) and
the physical proximity of the 2DEG to the charging surface in these extremely
shallow buried channel HEMTs. It is speculated that due to the large charging
capacity of the interface states at the oxide/AlN interface, the Fermi level under
and at the drain edge of the gate is quasi-pinned and the pinning is dictated by
both the 2DEG density as well as the interface trap state density. When the traps
fill, the charge densities are overwhelming and VGS no longer causes a sufficient
change in ns and subsequently, IDS no longer increases. This “choked channel”
mechanism is illustrated by the band diagram in Fig. 3.16. To add to the issue
source resistance also exacerbates IDS compression, further limiting maximum
drain current and causes severe transconductance fall-off in HEMTs.
The nature of the SLVA accounts for the phenomenological occurrence of ve-
locity saturation, but in doing so imposes a deviation of the ve-E slope at low field
(i.e. mobility) causing an apparent lower mobility than the true low-field mobility
in a HEMT. This causes a positive shift in knee voltage (or underestimation of
the drain current at Vknee) and the “fanning out” of the drain characteristics at
low field that is usually not observed in an actual HEMT. This is the cause of the
non-correspondence of the model to the measured data at low field approaching
pinch-off5. This deviation is a direct result of an inaccuracy of the SLVA. Numeri-
5The usage of the word “pinch-off” is taken as originally used by Shockley and indicates thetransition point of the channel from linear operation to saturated operation where the mobilecharge in the channel is minimized. This is in contrast to the loosely used terminology oftentaken to mean sub-threshold or off-state characteristic.
73

Figure 3.16. Qualitative illustration of the conduction band diagramalong the channel showing the Dit-influenced channel choke leading toIDS compression at forward gate-source bias voltages. (a) Cross sectionalconduction band diagram in “flatband” or pinched off condition and, (b)
band diagram of the forward gate bias condition with Qit influence.
74

cal methods for improving this inaccuracy can be performed but have no physical
meaning and therefore are not used here.
As discussed in Chapter 2, one reality that follows from using an ex-situ oxide
deposited on the terminal AlN surface is the presence of a high interface state
trap density at the oxide/AlN interface. These traps may have implications on
RF performance but they predominantly serve to cause a more gradual slope of
the DC transfer characteristic of a HEMT (i.e. DC transconductance). Trap
states were not accounted for in the model given.
The occurrence of self-heating or heat-reduced mobility/electron velocity from
internal power consumption an often widely used explanation for negative drain
conductance in GaN-based HEMTs. As stated in Appendix B, the model assumes
a constant mobility for simplicity and does not take into account the effect of self
heating.
The model does a decent job to reconcile near-threshold I-V characteristics of
the insulated-gate AlN/GaN HEMT using parametric values extracted from mea-
surements (e.g. mobility, sheet resistance, contact resistance, etc.). In doing, so
the model, by including only two constraints, provides reconciliation for the lesser-
than-expected current density compared with theoretical estimations. Therefore,
it is concluded that the GCA and SLVA are applicable as shown above, but under
the limitation that only near-threshold values for VDS and VGS are used.
Other mechanisms have been discussed that account for non correlations be-
tween the model and measured I-V characteristics. Through this discussion several
points for improvement have been touched upon for the AlN/GaN HEMT. Con-
tact resistance is a major limitation causing knee voltage walkout, reduction in
internal VDS and therefore IDS, and enhancement of IDS compression in the sat-
75

uration regime. Reduction of contact resistance will greatly benefit both DC and
RF extrinsic device performance. Interface trap states act to reduce the transfer
characteristic slope and thus peak transconductance as well as promote transcon-
ductance roll-off and thus, ft linearity. The minimization of trap density should
improve, gm. Maximum drain current is determined by channel charge density,
mobility, contact resistance, and electron velocity in the intrinsic channel (i.e. be-
low the gate). For the AlN/GaN HEMT it has been shown that charge density
may be increased up to the theoretical polarization limit [46] by increasing the
AlN barrier thickness. Therefore, this parameter is not easily improved since it is
already at a ceiling value. However, mobility (as a measure of electron velocity)
can be improved by growth methods. Cao et al. has shown the sensitivity of mo-
bility to growth parameters and barrier thickness of these ultra-shallow channel
structures [51]. Section 3.1 in this chapter demonstrated a preferred AlN window
with respect to processing considerations and a 3 nm AlN barrier was determined
to be ideal. Further improvements in growth (substrate crystal type, parameters)
should serve to further increase mobility and thus saturated electron velocity.
3.3 Chapter 3 cited literature
46. Y. Cao and D. Jena, “High-mobility window for two-dimensional electrongases at ultrathin AlN/GaN heterojunctions”, Appl. Phys. Lett., 90, 182112,2007.
47. M. Higashiwaki and T. Matsui, “Barrier Thickness Dependence of ElectricalProperties and DC Device Characteristics of AlGaN/GaN HeterostructureField-Effect Transistors Grown by Plasma-Assisted Molecular-Beam Epi-taxy”, Jap. J. Appl. Phys., Vol. 43, No. 9, 2004.
48. Y. Cao, T. Zimmermann, H. Xing, and D. Jena, “Polarization-engineeredremoval of buffer leakage for GaN transistors”, Appl. Phys. Lett., Vol. 96,No. 4, 042102, 2010.
76

49. D.F. Storm, D.S. Katzer, S.C. Binari, B.V. Shanabrook, L. Zhou, D.J.Smith, “Effect of Al/N ratio during nucleation layer growth on Hall mo-bility and buffer leakage of molecular-beam epitaxy grown AlGAN/GANheterostructures”, Appl. Phys. Lett. 85, 3786, 2004.
50. I.P. Smorchkova, S. Keller, S. Heikman, C.R. Elsass, B. Heying, P. Fini, J.S.Speck, U.K. Mishra, “Two-dimensional electron-gas AlN/GaN heterostruc-tures with extrememly thin AlN barriers”, Appl. Phys. Lett., 77, 24, 2008.
51. Y. Cao, “Study of AlN/GaN HEMTs: MBE Growth, Transport Properties,and Device Issues”, Ph.D. Dissertation, University of Notre Dame, 2010.
52. T. Zimmermann, Y. Cao, D. Jena, H.G. Xing, “4-nm AlN barrier all binaryHFET with SiNx gate dielectric”, Int. J. High Spd. Elec. Sys., 19, 153,2009.
53. L.F. Tiemeijer and R.J. Havens, “A Calibrated Lumped-Element De-EmbeddingTechnique for On-Wafer RF Characterization of High-Quality Inductors andHigh-Speed Transistors”, IEEE Trans. Elec. Dev., Vol. 50, No. 3, 2003.
54. N. Onojima, N. Hirose, T. Mimura, T. Matsui, “Ultrathin AlN/GaN het-erostructure field-effect transistors with deposition of Si atoms on AlN bar-rier surface”, Appl. Phys. Lett. 93, 223501, 2008.
55. M. Higashiwaki, T. Mimura, T. Matsui, “AlN/GaN Insulated-Gate HFETsUsing Cat-CVD SiN”, IEEE Elec. Dev. Lett., Vol. 27, No. 9, 2006.
56. A.M. Dabiran, A.M. Wowchak, A. Osinsky, J. Xie, B. Hertog, B. Cui, D.C.Look, P.P. Chow, “Very high channel conductivity in low-defect AlN/GaNhigh electron mobility transistor structures”, Appl. Phys. Lett., 93, 082111,2008.
57. D. Deen, S. Binari, D. Storm, D. Katzer, J. Roussos, J. Hackley, T. Gougousi,“AlN/GaN insulated gate HEMTs with HfO2 gate dielectric”, Elec. Lett.,45, 8, 2009.
58. S. Seo, G.Y. Zhao, D. Pavlidis, Elec. Lett. 44, 3 (2008).
59. H. Xing, Y. Dora, A. Chini, S. Heikman, S. Keller, U. Mishra, IEEE ElectronDevice Lett. 25, 161 (2004).
60. L. W. Tu, W. C. Kuo, K. H. Lee, P. H. Tsao, C. M. Lai, Appl. Phys. Lett.77, 3788 (2000).
61. J. Robertson and B. Falabretti, J. Appl. Phys. 100, 014111 (2006).
77

62. O. Brandt, R. Muralidharan, P. Waltereit, A. Thamm, A. Trampert, H. vonKiedrowski, and K.H. Ploog, Appl. Phys. Lett. 75, 4019 (1999).
63. D.A. Deen, D.F. Storm, D.S. Katzer, D.J. Meyer. S.C. Binari, “Depen-dence of ohmic contact resistance on barrier thickness of AlN/GaN HEMTstructures”, Sol. Stat. Elec. 54, 613, 2010.
64. J.C. Hackley, J.D. Demaree, T. Gougousi, “Nucleation of HfO2 atomic layerdeposition films on chemical oxide and H-terminated Si”, J. Appl. Phys.102, 034101, 2007.
65. G. Dambrine, A. Cappy, F. Heliodore, E. Playez, “A New Method for Deter-mining the FET Small-Signal Equivalent Circuit”, IEEE Trans. Elec. Dev.,Vol. 36, No. 7, 1988.
66. F. Medjdoub, J.F. Carlin, M. Gonschorek, E. Feltin, M.A. Py, D. Ducatteau,D. Gaquiere, N. Grandjean, and E. Kohn, “Can InAlN/GaN be an alter-native to high power/high temperature AlGaN/GaN devices?” in IEDMTech., pp. 1-4, 2006.
67. T. Zimmermann, D. Deen, Y. Cao, J. Simon, P. Fay, D. Jena, and H.G.Xing, “AlN/GaN Insulated-Gate HEMTs With 2.3 A/mm Output Currentand 480 mS/mm Transconductance”, IEEE Elec. Dev. Lett. Vol. 29, No.7, 2008.
68. W. Shockley, “A Unipolar ”Field-Effect” Transistor”, Proc. of I.R.E., pp.1365-1376, 1952.
69. A.B. Grebene, S.K. Ghandhi, “General theory for pinched operation of thejunction-gate FET”, Sol. Sta. Elec., vol. 12, pp. 573-589, 1969.
70. S.M. Sze, in Physics of Semiconductor Devices, 2nd ed., Wiley Publishers,1981.
71. A. Matulionis, J. Liberis, I. Matulioniere, M. Ramonas, L.F. Eastman, J.R.Shealy, V. Tilak, A. Vertiatchikh, “Hot-phonon temperature and lifetimein a biased AlxGa1−xN/GaN channel estimated from noise analysis”, Phys.Rev. B 68, 035338, 2003.
72. D. Jena, “Polarization induced electron populations in III-V nitride semi-conductors; Transport, growth, and device applications”, Ph.D. dissertation,University of California, Santa Barbara, 2003.
73. J. Khurgin, Y.J. Ding, D. Jena, “Hot phonon effect on electron velocitysaturation in GaN: A second look”, Appl. Phys. Lett. 91, 252104 (2007).
78

74. P. Gray, P. Hurst, S. Lewis, and R. Meyer, “Analysis and Design of AnalogIntegrated Circuits”, Fourth Ed., New York, John Wiley and Sons, 2001.
75. F. Ali and A. Gupta, “HEMT Device Physics and Models”, in HEMTs andHBTs: Devices, Fabrication, and Circuits, Artech House, Inc., Norwood,MA, 1991.
76. M.V. Fischetti, S. Jin, T.W. Tang, P. Asbeck, Y. Taur, S.E. Laux, M.Rodwell, N. Sano, “Scaling MOSFETs to 10 nm: Coulomb effects, sourcestarvation, and virtual source model”, J. Comp. Elec. 8, 60, 2009.
79

CHAPTER 4
AlN/GaN HEMT SMALL-SIGNAL OPERATION
The central tool used to analyze the ac-functionality of any transistor is
its small signal equivalent circuit model. The small signal equivalent circuit is
developed using the ColdFET technique and standard biasing regimes for the
insulated-gate AlN/GaN HEMT. From the measured ColdFET S-parameters the
bias-independent equivalent circuit parameters can be modeled. These parame-
ters provide a means to accurately de-embed the effects of bonding pad impedance
elements from the small signal frequency performance data using the standard S-
parameter reduction technique [77]. The small signal frequency metrics that are
most commonly used for RF and microwave transistor amplifiers are the unity
current gain frequency, ft, defined as the frequency at which the current gain
becomes unity and the unity power gain frequency, fmax, defined likewise for the
power gain of the transistor. A simple lumped element expression for ft in terms
of the equivalent circuit elements typically follows, ft = gm× (2π(CGS +CGD))−1,
but has been more accurately expressed [78] in terms of both intrinsic and extrinsic
elements by,
ft =gm/2π
[(CGS + CGD)(1 + (RS +RD)/RDS)] + gmCGD(RS +RD). (4.1)
The de-embedding of bonding pad impedances from measured data become
even more necessary when the electron-beam defined sub-micron gate length re-
80

duces intrinsic gate capacitance and causes the combination of bonding pad and
parasitic access capacitance to dominate RF operation. The presence of a confor-
mal high-κ Al2O3 in the access and inter-pad regions of the device further increases
these parasitic capacitances thus causing a pronounced effect. It is shown that for
120 nm long T-gates and a 10 nm thick blanket deposition of the Al2O3 dielectric,
bonding pad capacitance is enhanced and reduces extrinsic ft by 10-15 GHz.
The small signal unity current gain frequency, ft can be separated into a sum
of transit and charging times involved with the constituent components of the
HEMT. Further ac-analysis includes Moll’s method [79] for measuring these char-
acteristic times. By source and drain resistance extraction the transit times may
further be compartmentalized [80]. Such analysis provides a way to quantify
the specific ac-limiting components of the HEMT design and is performed on
insulated-gate AlN/GaN HEMTs with a 6 nm thick high-κ ALD Ta2O5 gate in-
sulator.
4.1 Small signal model
DC drain and transfer characteristics were first taken to establish a bias point
for small signal characterization that maximized DC transconductance. Figure
4.1 shows DC characteristics for a typical AlN/GaN HEMT (Lg = 120 nm, Wg
= 150 µm) with maximum current density of 1.3 A/mm at a forward-bias gate
voltage (VGS) of +4 V and a maximum transconductance of 225 mS/mm at VDS
= 10 V. Off-state breakdown (VGS = -8 V) for the devices occurred at a drain
bias (VDS) between 18 - 20 V and was a result of gate insulator breakdown. The
typical threshold voltage occurred at VGS = -6.5 V (VDS = 10 V) and maximum
DC gm occurred at VGS = -5.5 V which was the small signal bias point chosen to
81

Figure 4.1. Transfer (left) and drain (right) characteristics of theAl2O3/AlN/GaN HEMT used for small signal model development.
maximize ft.
Dambrine et al. introduced an alternative technique (“ColdFET”) to deter-
mine the bias-independent equivalent circuit parameters in the absence of on-wafer
calibration structures [77], which has become widely used [81]. The principle gov-
erning the ColdFET measurement follows that when the drain-source bias is held
at 0V and the gate is reverse-biased into deep pinch-off, the intrinsic device can be
modeled as a simple RC network, allowing an accurate calculation of the induc-
tance and capacitance associated with the device’s bonding pads. The ColdFET
technique is employed as the initial step in the modeling sequence for the AlN/GaN
HEMT. For the analytical modeling portion the commercial software Microwave
Office is used. Both ColdFET and standard S-parameter measurements were
taken with a frequency range over 0.2 - 50 GHz.
Shown in figure 4.2(a) is the measured (circles) and modeled (line) S-parameters
82

Figure 4.2. Measured (circles) and modeled (lines) S-parameter data forboth the ColdFET (a) and maximum-gm (b) biasing regimes.
for our HEMT under ColdFET bias (VDS = 0V, VGS = -8V) showing an ex-
cellent fit-agreement. The corresponding equivalent circuit parameter values ex-
tracted from this measurement fit, following after Dambrine [77], include the bias-
independent parameters: gate inductance (LG), drain inductance (LD), source
inductance (LS), extrinsic (bonding pad) gate-to-source capacitance (CGSp), ex-
trinsic (bonding pad) drain-to-source capacitance (CDSp), extrinsic (bonding pad)
gate-to-drain capacitance (CGDp), gate charging resistance RG, and the bias-
dependent intrinsic RC network parameters CA, CB, CC associated with the
pinched-off depletion region, source resistance (RS), and drain resistance (RD)
as is illustrated in Fig. 4.3 (b). The capacitive network set up by CA, CB, and CC
is the converted delta-wye representation of the pinched-off channel capacitances
CGS, CGD, and CDS. Dambrine originally proposed the equivalent ColdFET cir-
cuit where CA was not accounted for. White suggested a more accurate RC net-
83

work by introducing the third capacitor that accounts for source-drain depletion
and using symmetry arguments made the claim that all depletion capacitances
must be equal [82]. While the addition of a source-drain capacitance in the Cold-
FET model provides a more accurate determination of drain pad capacitance,
the requirement of equal depletion capacitances is not necessary. For vertically
scaled devices where the aspect ratio of the gate depletion region can be large and
therefore cause the source-drain depletion capacitance to be relatively large, an
inequality in depletion capacitances (CA = CB 6= CC) for the ColdFET bias is
more likely.
S-parameters taken at maximum gm (VGS = -4 V, VDS = 10 V, IDS = 51
mA) and used to model the small signal equivalent circuit are shown in Fig. 4.2
((a), circles). The S-parameters were modeled using the equivalent circuit shown
in Fig. 4.3(a) with fit criteria of 1% error in optimization goals for both phase
and magnitude of the modeled S-parameters. The corresponding fitted parameter
values are listed in Table 4.2. A modification to the intrinsic region equivalent
circuit is made for higher fit accuracy in S21. As can be seen in Fig. 4.2, the
modeled S-parameters show close agreement with the measured data indicating
very good model correspondence. Note that the modeled parameter values are
not unique and will vary with the geometry and layer structure of the HEMT
involved.
An accurate small signal model hinges on the intrinsic region of the HEMT.
Owing to GaN’s ability to sustain large lateral electric fields, the VDS-VGS bias in
the saturated velocity region causes the gate-drain depletion region of the HEMT
to take the form shown in Fig. 4.3 (c) [83]. The intrinsic region defined by the
gate boundaries is most accurately described by an RC network on the gate-to-
84

Figure 4.3. Schematic diagram of the small signal equivalent circuitmodel (a) showing the separation of the intrinsic, parasitic, and bondpad circuits, “ColdFET” equivalent circuit model (b), and intrinsic
circuit model (a) over-layed on a cross-sectional depiction of theinsulated gate HEMT.
85

TABLE 4.1
EXTRACTED SMALL SIGNAL PARAMETERS FOR THE
MODELED INSULATED-GATE AlN/GaN HEMT
parameter units value
LG [pH] 65
LS [pH] 0
LD [pH] 13
CGDp [pF] 0.018
CDSp [pF] 0.028
CGSp [pF] 0.019
RS [Ω] 7.1
RD [Ω] 300
RG [Ω] 5.5
Ri [Ω] 36
RDS [Ω] 320
CGS [pF] 63
CGD [pF] 6.5
CDS [pF] 8.7
gintm [S/mm] 0.49
86

source (G-S) end with the standard RC network in parallel with a gain element on
the drain end. Considering the compressed drain depletion width, the connective
nodes of this network can be seen in Fig. 4.3 (c) and have a significant effect
on the fitting of the model. The G-S RC network can be reduced by parallel
arguments with only slight loss of accuracy to a single RC network [84] where the
resistance and capacitance involved is the input resistance Ri and gate-to-source
capacitance CGS, respectively. For the HEMT discussed (Rsh > 400 Ω/), Ri =
39 Ω for the given bias conditions. Furthermore, it is speculated that because of
the curvature of the gate-drain depletion edge the reference voltage, VGS, must
be taken across both CGS and Ri of the intrinsic G-S network. For material
systems that offer lower sheet resistance, Ri reduces, the gate-drain depletion
region has milder curvature, and the intrinsic network then takes the form of the
conventional HFET network [81]. Such an equivalent circuit configuration has
implications on the behavior of |h21|. The presence of additional impedance in
the intrinsic network through a multi-pole circuit can be manifested in |h21| by a
deviation of the 20 dB/dec roll-off at higher operational frequencies and has been
discussed by Steer and Trew [85].
A consistency check on the modeled parameter values can be made based on
results of DC characterization, namely CTLM, Hall, CV, and drain characteristics.
Access resistance which is composed of both contact and channel sheet resistance
was calculated for the 150 µm wide HEMTs to be 4.4 Ω and 9.7 Ω, respectively.
Using these results as lower limits in a biased device the modeled RS (6.8 Ω) closely
agrees. Based on geometry and dielectric constant considerations the calculated
Cg ∼ 90 - 110 pF. Considering CGS and CGD along with the parasitic capacitances
CGSp and CGDp make up total gate capacitance, the combined measured values
87

agree relatively well with this calculated value. Finally, intrinsic transconductance
follows the relationship gintm = gextm /(1-RSgextm ), where RS is the source resistance
(RS ∼ RC+RshLSG/4WG), where the factor of 4 accounts for the gate offset closer
to the source contact edge. Intrinsic gm calculated from DC measurements is 460
mS/mm which agrees well with the modeled gm and verifies agreement with the
modeled |h21|.
4.2 De-embedding procedure
The widely conventional method for reducing the measured S-parameters by
the proportion of the pad impedance (i.e. de-embedding) is shown by the flow
diagram given in Fig. 4.4. By removing the detrimental influence of the probe
pad impedance a more realistic measure of the active device may be had. In the
ideal situation on-wafer calibration standards (open, short, and load) would be
available to measure side-by-side with the actual HEMT. This would provide the
most accurate measurement of the unknown pad parasitic impedance as well as the
specific influence of the underlying layer structure (buffer, nucleation, substrate,
etc.). However, in the case where on-wafer calibration standards are not available
the ColdFET provides an alternative means to measure the impedance and is the
method used here. The Y-subtraction method for de-embedding is the same for
both cases.
The result of de-embedding pad inductance and capacitance on small signal
frequency performance can be seen in Fig. 4.5 along with the modeled |h21| result.
The measured |h21| yielded an extrapolated ft of 45 GHz. Upon removing LG, LD,
LS, CGDp, CGSp, and CDSp through the de-embedding procedure mentioned pre-
viously, an extrapolated ft of 56 GHz was obtained. On average across the wafer,
88

Figure 4.4. Flow diagram for the Y-subtraction method for parameterde-embedding of a HEMT. Toggling the measured S-parameters betweenY and Z parameters allows convenient reduction of pad and/or parasitic
component influence.
89

Figure 4.5. Small signal frequency performance as measured (graycircles), modeled (line), and after de-embedding (blue circles) bonding
pad inductance and capacitance.
values for ft where found to be 10 - 15 GHz higher after removing bonding pad in-
fluences (LG, LD, LS, CGDp, CGSp, and CDSp). This discrepancy is expected to be
more exaggerated for devices capable of higher operational frequencies. A blanket
deposition of high-κ oxide causes the electronic coupling between bonding pads to
act as reactive “inertia” on channel modulation frequency for the insulated-gate
AlN/GaN HEMT.
4.3 Delay analysis of the insulated-gate AlN/GaN HEMT
III-Nitride based HEMTs quickly gained interest for high frequency and power
amplifiers due to the high critical breakdown field of GaN with the combined
advantage of a theoretical/simulated peak electron velocity (∼ 2.5 × 107 cm/s)
exceeding that of GaAs (2 × 107 cm/s) [86],[87]. However, the electron velocity
90

inferred from small signal cut-off frequency measurements (ftLg) of AlGaN/GaN
HEMTs show a discrepancy between it and the expected peak electron velocity
calculated from Monte Carlo simulation [86]. A clue to this discrepancy might be
found in the low-field 2D mobility. For the AlN/GaN heterostructure the dominant
scattering mechanisms at room temperature are optical (OP), acoustic phonons
(AP), and interface roughness (IR) as well as remote surface roughness (RSR)
[88] under certain conditions as discussed in Chapter 1. Assuming a low-field 2D
mobility of 1800 cm2/Vs the associated intrinsic scattering time for the AlN/GaN
HEMT would be 0.2 pico-seconds (τ = m∗µ/q) which would correspond to an
intrinsic ft of ∼800 GHz, almost an order of magnitude higher than any report to
date1 [89],[90],[91]. Therefore, the question remains: what mechanism is limiting
the saturated electron velocity in the AlN/GaN HEMT? Or reconsidering the
question: where in our interpretation of the inferred velocity from the ftLg product
may things be going awry? The following analysis based on cut-off frequency
measurements of a “short”-gate HEMT seeks to shed light on these questions.
The frequency performance metric, ft, can be used as an analysis tool for ex-
tracting the delay times associated with a HEMT’s design. The original methodol-
ogy was developed by Moll in 1988 [79] and has gained wide acceptance as a means
to further characterize fundamental transport properties such as the effective elec-
tron velocity, ve,eff, within a transistor. In the original work Moll demonstrated
that ft can be cast by the inverse sum of three distinct times: the drain delay (τdd)
which is the time an electron takes to traverse the drain depletion region of the
channel which may include the depletion extension due to the virtual gate effect,
the channel charging time (τr) which is an RC charging time associated with the
1This comparison is not entirely fair since any reported ft values invariably contain moredominant delay and charging times. This simplistic comparison is only to point out that low-field mobility is a measure of the electron saturation velocity.
91

Figure 4.6. Transfer (left) and drain (right) characteristics of theTa2O5/AlN/GaN HEMT used for the delay analysis.
resistance of the access regions and therefore the channel charge density, and the
intrinsic delay (τi) which is a charging time associated with the RC coupling of
the metal gate capacitance (parasitic and intrinsic). Bolognesi et al. [92, 93] and
in a separate work Inoue et al. [80] extended the delay analysis further for Al-
GaN/GaN HEMTs by acknowledging the series resistances of the access regions
play a significant role in GaN HEMTs. In Bolognesi’s first work [93] he referred to
Moll’s channel charging delay as τCH and intrinsic delay as the “transistor” delay,
τTR. His contribution however, was that he differentiated τTR into two constituent
delay components such that τTR = τ1 + τRSD where τRSD was again associated
with the access region channel charge and therefore is a function of contact and
access resistances RS and RD, and τ1 is the transit time across the intrinsic chan-
nel region under the gate. By this separation of terms the ft dependence on varied
92

access region lengths could be measured and τRSD determinable by extrapolation.
Finally, τ1 could be determined by self consistency of the total measurement which
yields an estimation for ve,eff by Lg/τ1.
In this work a slightly different notation is used for the delay time naming
convention. The drain delay is given by τdd, the channel charging time by τcc,
the intrinsic (Moll) or transistor (Bolognesi) delay by τRC , and a fourth charging
time, τpd which accounts for the frequency loss due to the bonding pad impedance
which is determined by ColdFET measurement and S-matrix reduction technique
discussed previously. Therefore, the extrinsic ft is given by ft = 1/2πτtot where
τtot = τdd + τcc + τRC + τpd. Since a variation in the access region separations, LGS
and LGD were not available at the time of measurement, τRC (τTR in Bologesi’s
work) could not be separated into the constituent times as was done by Bolognesi.
So as an approximate means to extract a meaningful value for ve,eff , the Cold-
FET model was used to determine both bonding pad impedance as well as the
access region resistances (RS and RD) which was then subsequently removed from
|h21| by S-matrix reduction. This method enabled the approximation of ve,eff
for the AlN/GaN HEMT as well as a generic AlGaN/GaN HEMT (via τRC), for
comparison under the assumption that RS and RD are indeed bias-independent.
One issue that perpetually arose was that of anomalous drain-current degrada-
tion for the NRL-deposited Al2O3 insulated-gate AlN/GaN HEMTs. Most often
times, the initial maximum drain current and threshold voltage would reduce af-
ter VDS was swept to 10V or higher. This degradation is very undesirable in such
devices and work is ongoing to improve the Al2O3 which is at this point the sus-
pect cause of the problem. This point is mentioned because it was observed that
when these devices went under test for delay analysis, their frequency performance
93

would degrade in-situ making it impossible to measure self-consistency between
the VDS and IDS bias sweeps. Therefore, HEMTs with a Ta2O5 gate oxide were
chosen for delay measurement and analysis since they were much less prone to
failure under the bias range needed (DC I-V characteristics shown in Fig. 4.6).
The following properties were measured for the Ta2O5/AlN/GaN HEMT: µ = 400
cm2/Vs, ns = 2.2 × 1013 cm−2, Rsh = 567 Ω/, Rc = 0.7 Ω-mm, LSD = 3 µm,
and Lg ∼150 nm. The data shown pertains to these HEMTs.
As a control sample, a standard heterostructure Al0.3GaN/GaN HEMT with a
barrier thickness of 25 nm was measured using the same measurement flow as the
AlN/GaN HEMT. This allowed a side-by-side comparison of a known structure
to that of the AlN/GaN HEMT. The pertinent properties of the AlGaN/GaN
HEMT were µRT = 1040 cm2/Vs, ns = 1.06 × 1013 cm−2, Rsh = 567 Ω/, Rc
= 0.35 Ω-mm, LSD = 3 µm, and Lg ∼160 nm. All measurements described that
were applied to the AlN/GaN HEMT were likewise applied to the AlGaN/GaN
HEMT for comparison.
Figure 4.7 shows the result of the ft trend as a function of VDS (left) and IDS
(right) for both the AlN/GaN and AlGaN/GaN HEMT after the pad impedances
were de-embedded. Clear maximums can be seen for both spectra. The occurrence
of the linearly decreasing ft with VDS and VGS biases is consistent with other
reports [79],[93],[94]. These trends yield the information sought (the reduction
in ft is undesirable in terms of amplifier frequency linearity). The unity current
gain frequency, ft = 1/2πτtot, where τtot is the total delay after de-embedding
pad impedance and is given by the sum of all the constituent delays (e.g. τtot =
τdd + τcc + τRC)2. By inverting the ft values shown in Fig. 4.7 and plotting
2The total delay as a sum of the constituent delays is similar to the work by Bolognesi [93].In his work the total delay was given by τtot = τD +τCH +τTR = 1/2πft where τTR = τ1+τRSD.
94

0 2 4 6 8 1 0 1 2 1 4 1 6 1 8 2 02 22 42 62 83 03 23 43 63 84 04 24 44 64 85 0
m a x i m u m e x t r i n s i c f t A l G a N / G a N A l N / G a N
A l G a N / G a N( V G S = - 2 . 5 V )
A l N / G a N( V G S = - 2 V )f t (G
Hz)
V D S ( V )0 . 0 0 0 . 0 1 0 . 0 2 0 . 0 3 0 . 0 4 0 . 0 5 0 . 0 60
1 0
2 0
3 0
4 0
5 0A l G a N / G a N( V D S = 1 0 V )
A l N / G a N( V D S = 7 V )
f t (GHz)
I D S ( A )
Figure 4.7. Unity current gain, ft, as a function of VDS (left) and IDS(right).
with respect to the channel voltage or inverse drain current density gives the
trends shown in Fig. 4.8. By removing the voltage drop through the contacts
the channel voltage may be obtained (Fig. 4.8 (left)). It is noted that there is
a minuscule difference in τtot,min for the two measurements and is due to slight
device degradation during the measurement however, the difference amounts to
less than 3 GHz in frequency performance and is therefore accepted.
The linear functionality of the τtot - Vch curve is associated with the increasing
drain depletion region. The linear extrapolation to Vch = 0 gives the total delay
excluding τdd. Therefore, the difference in the minimum total delay and the linear
extrapolation to Vch = 0 yields the drain delay component, τdd. Similarly, the
linear functionality of the τtot - WG/IDS curve is associated with the channel
charging delay, τcc. Therefore, the difference in the minimum total delay and the
linear extrapolation to WG/IDS → 0 yields the channel charging delay, τcc. Finally,
95

Figure 4.8. Total delay as a function of VDS (left) and IDS (right)showing the delay for the corresponding measurement.
since the total delay equals the sum of all constituent delays, the RC-charging
delay, which is the delay associated with the RC charging of the gate-to-channel,
may be found through the difference in total delay and the channel charging and
drain delay components. Self consistency may also be checked between the two
measurements since both involve the intrinsic delay component.
A separate de-embedding-oriented analysis was performed to give further in-
sight into the delay components involved with these HEMTs and the results are
included in Table 4.2. As discussed, the ColdFET measurement/fitting procedure
was originally developed for the purpose of extracting the bias-independent pa-
rameters which also include access resistances RS and RD. By further reducing
the measured S-parameters beyond simply the pad impedance through the same
Y-parameter subtraction technique discussed, by the amounts of the modeled ac-
cess resistances, an “intrinsic” delay, which is the delay associated with electron
drift across only the gated region may be inferred. This delay is denoted as τint
96

TABLE 4.2
EXTRACTED TIME DELAYS FOR THE Ta2O5 INSULATED-GATE
AlN/GaN HEMT AND SCHOTTKY-GATED AlGaN/GaN HEMT.
AlGaN/GaN AlN/GaN
parameter delay [ps] delay [ps] definition
τpd 0.948 0.768 bonding pad delay
τdd 0.322 0.681 drain depletion transit time (VDS)
τcc 0.428 0.466 channel charging delay (1/IDS)
τRC 2.752 2.565 transistor delay
τtot (no pads) 3.464 3.712 total delay excluding τpd
τtot (extrinsic) 4.413 4.521 total delay (= 1/2πft)
τRa 1.207 2.442 access resistance delay
τint 2.257 1.269 intrinsic region time
and the delay associated with the reduction of the access resistances is denoted
as τRa.
The collective delay totals are listed in Table 4.2 and plotted graphically in Fig.
4.9. It is apparent that the dominant delay limitation for both HEMTs resides
in the RC charging delay. However, it is also noted that the pad impedance
imposes a significant delay on both transistors as well. This being a necessary
detriment in order to probe the HEMTs to take such measurements. In both
cases the channel charging delays are comparable owing to similar sheet resistances
between the HEMTs. Interestingly, the AlN/GaN HEMT has a drain delay that is
97

Figure 4.9. Comparison of delay times between the AlGaN/GaN andAlN/GaN HEMTs extracted by Moll’s method.
a factor of 2 larger than that of its AlGaN/GaN counterpart. This is speculated
to be due to the successful mitigation of virtual gating by SiN passivation for
the AlGaN/GaN HEMT reducing the gate length extension and thus the time it
takes electrons to traverse this length. Pulsed gate-lag results of the AlN/GaN
HEMTs with the thin high-κ gate dielectric proved that such a thin layer does not
effectively passivate the AlN surface from the standpoint of large signal operation
(not shown). Although, the thin film deposition of the various high-κ oxides on
the AlN does cause a change in 2D channel charge, as previously discussed. SiN
passivation for the access regions of the AlN/GaN HEMT was observed to be
less effective by pulsed-gate lag measurements indicating a remaining virtual gate
extension issue. Therefore, a means to successfully passivate the AlN/GaN HEMT
remains a subject of further study.
98

The intrinsic delay, τint, is used as an approximate means at arriving at an
effective electron velocity. This being the velocity immediately below the gate if
one assumes the drift velocity to be constant throughout. This assumption is not
accurate given the changing electric field profile along the channel below the gate
but allows an approximate velocity to be obtained. This velocity is also taken to be
the effective saturation velocity since the data was taken while the HEMTs were in
their respective saturation regimes of bias. Taking the equality, ve,eff = Lg/τint, it
is found that ve,eff ∼ 0.7 × 107 cm/s and ∼ 1.18 × 107 cm/s for the AlGaN/GaN
and AlN/GaN HEMTs, respectively. These values are reasonable compared to
recent reports yet are lower than the peak electron velocity calculated by Monte
Carlo simulation. It is speculated that the lower electron velocities arise due to
more severe scattering as indicated by the lower valued mobilities in both HEMTs.
Moreover, it is noted that despite a higher room temperature mobility for the
AlGaN/GaN HEMT, the effective electron velocity in the AlN/GaN HEMT had
a higher extracted value. The cause of this disparity is still not well understood but
it is acknowledged that the procedure used to extract the effective velocities needs
refinement and may introduce some inexactness. The procedure relies on knowing
exact values for the pad impedance, RS, and RD while under bias which was in fact
not exactly known. Nonetheless, the values for parasitic and access impedances
were modeled with the accuracy that the ColdFET method can provide and gives
a fair estimation of these parameter values. In this light, it is interesting that
the AlN/GaN HEMT has the higher estimated ve,eff and is promising for this
heterostructure’s involvement in high frequency amplification. More investigation
is needed on this topic to iron out exact values for the electron velocity within the
intrinsic region in the AlN/GaN HEMT while under bias.
99

It is necessary to take in mind the caveats involved with using the ColdFET
modeling approach to approximate the bias-independent model parameters for
data extraction. The ColdFET fit as it was originally conceived by Dambrine
[77] used only two intrinsic capacitances, CGS and CGD. White argued that using
Dambrine’s circuit topology caused an over-estimation of the drain pad capac-
itance [82]. The answer to the problem was the inclusion of a third intrinsic
capacitance which aided in the proper capacitive partitioning during S-parameter
fitting of ColdFET data. White’s topology is used throughout this work.
A deficiency of the ColdFET measurement for extrinsic parameter determi-
nation lies in the assumption that RS and RD are bias-independent. It has been
argued by Palacios et al. that a differential RS occurs in AlGaN/GaN HEMTs that
is bias-dependent due to exterior gate velocity saturation. Palacios argues that
this causes a non-linear reduction in extrinsic transconductance and ft [94]. Fur-
thermore, DiSanto and Bolognesi demonstrated the occurrence of a RF-modulated
RS which caused subsequent error in the determination of the intrinsic small signal
parameters for AlGaN/GaN HEMTs. This further aided in the under-estimation
of RS for RF modulated HEMTs [92]. This under-estimation led to the under-
estimation of intrinsic gm, intrinsic ft, and subsequently the intrinsic delay com-
ponent which allows the estimation of saturated electron velocity in the HEMT
channel. Therefore, the implicit assumption of the ColdFET measurement, that
all extrinsic small signal elements are “static” when VDS = 0V and the gate is
sufficiently reverse-biased so that the intrinsic impedance from gate capacitance
becomes negligible, is shown to be untrue for the GaN-based HEMT. Subsequently,
the use of the ColdFET method for series access resistance determination leads to
an under-estimation of the detrimental influence RS has on the HEMT’s dc and
100

RF operation.
These deficiencies are acknowledged when considering the data shown above
and therefore some error is accepted in the results discussed. It is further noted
that the ideal scenario would be to have on-wafer calibration test structures (open,
short, through, and load), but were not available from the mask set used during
HEMT fabrication.
4.4 Points for improvement for RF operation of the AlN/GaN HEMT
The large delay time associated with the access region resistance indicates the
necessity to reduce this extraneous resistance as much as possible. After all, it
acts to essentially extend the resistance from the contact electrodes. Minimization
of this resistance will lead to significant improvement in ft. It is noted that for
the devices measured in this study, Rsh ∼ 450 Ω/ due to a low mobility of only
∼ 500 cm2/Vs for the AlN/GaN HEMT. Lower sheet resistance obtainable in
the AlN/GaN heterostructure are anticipated to lead to a reduced access region
charging time, τRa.
The delay time associated with RC and is a fractional portion of τRa is also
long and may be reduced by improving contact resistance. This issue has been
a bane for GaN-based HEMTs from their inception. Pre-metallization etching or
n+ ion-implanted contacts are anticipated to further lower RC and thus improve
ft. During the writing of this work the successful demonstrate of n+ regrown
contacts to an ultra-thin AlN/GaN HEMT was reported which had a measured
contact resistance of 50 Ω− µm [95].
Since low-field mobility gives a measure of electron velocity, the increase in
mobility will play a major role in improving ft through the delay components τint,
101

τcc, and τRC For GaN-based HEMTs if a choice must be made between increasing
2D charge density or mobility, mobility should be the choice made given that it
will yield the greatest improvement on RF performance since it affects more delay
components.
GaN-based HEMTs have long showed severe current collapse and frequency
dispersion owing to a highly charge-susceptible surface within the access regions
(particularly the drain edge of the gate). These issues necessitate the use of a
surface state passivation layer within the access regions of the HEMT. The blanket
deposition of a high-κ dielectric for gate insulation was often made in this study
for the AlN/GaN HEMT as it was more convenient during processing. It is also
favorable as a way to assist in the elimination of dispersion effects. However, the
byproduct of a blanket deposited high-κ dielectric is an enhanced RC charging
time, τRC , since parasitic CGS and CGD become large. It would therefore be
appropriate to utilize a process which allows the preferential deposition of a high-
κ dielectric only under the gate metal while in the access regions a low-κ dielectric
suitable to be used for a passivation layer. The mechanics of frequency dispersion
are discussed in Chapter 6 with a novel approach for the mitigation of DC-RF
dispersion.
4.5 Chapter 4 cited literature
77. G. Dambrine, A. Cappy, F. Heliodore, E. Playez, “A New Method for Deter-mining the FET Small-Signal Equivalent Circuit”, IEEE Trans. Elec. Dev.,Vol. 36, No. 7, 1988.
78. P.J. Tasker and B. Hughes, “Importance of Source and Drain Resistance tothe Maximum ft of Millimeter-Wave MODFET’s”, IEEE Elec. Dev. Lett.,Vol. 10, No. 7, 1989.
79. N. Moll, M.R. Hueschen, A. Fishcer-Colbrie, “Pulse-Doped AlGaAs/InGaAs
102

Pseudomorphic MODFETs”, IEEE Trans. Elec. Dev., Vol. 35, No. 7, 1988.
80. T. Inoue, Y. Ando, K. Kasahara, Y. Okamoto, T. Nakayama, H. Miyamoto,M. Kuzuhara, “Advanced RF Characterization and Delay-Time Analysis ofShort Channel AlGaN/GaN Heterojunction FETs”, IEICE Trans. Elec.,Vol. E86-C, No. 10, 2003.
81. S. Nuttinck, E. Gebara, J. Laskar, J. Shealy, M. Harris, “Improved RF Mod-eling Techniques for Enhanced AlGaN/GaN HFETs”, IEEE Micr. Wire.Comp. Lett., 13: 140, 2003.
82. P.M. White, R.M. Healy, “Improved Equivalent Circuit for Determinationof MESFET and HEMT Parasitic Capacitances from “Coldfet” Measure-ments”, IEEE Micr. Guid. Wave Lett. 3:12:453-454, 1993.
83. Karmalkar S, Mishra U, IEEE Trans. Elec. Dev. 48:8, 2001.
84. Ali F, Gupta A, HEMTs & HBTs: Devices, Fabrication, and Circuits,Artech House; 1991.
85. Steer M, Trew R, IEEE Elec Dev Lett 1986, 7:11.
86. TH. Yu, K.F. Brennan, “Monte Carlo calculation of two-dimensional elec-tron dynamics in GaN-AlGaN heterosturctures”, J. Appl. Phys., 91, 3730,2002.
87. Ioffe Institute: http://www.ioffe.ru/SVA/NSM//Semicond/
88. Yu Cao, “Study of AlN/GaN HEMTs: MBE growth, transport properties,and device issues”, Ph.D. dissertation, 2010.
89. T. Zimmermann, Y. Cao, D. Jena, H. Xing, “4-nm AlN barrier all binaryHFET with SiNx gate dielectric”, Int. J. High Speed Elec. and Syst., 19,153, 2008.
90. M. Higashiwaki, T. Mimura, T. Matsui, “AlN/GaN Insulated-Gate HFETsUsing Cat-CVD SiN”, IEEE Elec. Dev. Lett., Vol. 27, No. 9, 2006.
91. N. Onojima, N. Hirose, T. Mimura, T. Matsui, “Ultrathin AlN/GaN het-erostructure field-effect transistors with deposition of Si atoms on AlN bar-rier surface”, Appl. Phys. Lett. 93, 223501, 2008.
92. D.W. DiSanto, C.R. Bolognesi, “At-Bias Extraction of Access Parasitic Re-sistances in AlGaN/GaN HEMTs: Impact on Device Linearity and ChannelElectron Velocity”, IEEE Trans. Elec. Dev., Vol. 53, No. 12, 2006.
103

93. C.R. Bolognesi, A.C. Kwan, and D.W. DiSanto, “Transistor delay analysisand effective channel velocity extraction in AlGaN/GaN HFETs”, IEDMTech. Dig., pp. 879-886, 2002.
94. T. Palacios, S. Rajan, A. Chakraborty, S. Heikman, S. Keller, S. P. Den-Baars, U. K. Mishra, “Influence of the Dynamic Access Resistance in thegm and ft Linearity of AlGaN/GaN HEMTs”, IEEE Trans. On ElectronDevices, vol. 52, pp. 2117-2123, 2005.
95. A.L. Corrion, K.Shinohara, D. Regan, I. Milosavljevic, P. Hashimoto, P.J.Willadsen, A. Schmitz, D.C. Wheeler, S.M. Butler, D. Brown, S.D. Burn-ham, M. Micovic, “Enhancement-Mode AlN/GaN AlGaN DHFET with 700mS/mm gm and 112 GHz ft”, International Workshop on Nitride Semicon-ductors (IWN), 2010.
104

CHAPTER 5
HOT CARRIER EFFECTS IN SixNy-PASSIVATED AlGaN/GaN HEMTS
Hot carrier effects are a common degradation mechanism in FET technologies
that can compromise both performance and reliability. The literature on Si and
SOI technologies provide a wealth of information about such phenomena as impact
ionization, hot carrier injection, and electron and hole trapping [96],[97]. Fair et al.
demonstrated that bias-dependent hot-hole emission into a SiO2 gate oxide modi-
fied the threshold characteristics of the MOSFET [97]. Compound semiconductors
are also known to exhibit hot electron effects in the form of impact ionization and
hot carrier injection that cause back-gating and current-voltage nonlinearities that
impair performance [98],[99],[100]. Huang et al. showed negative charge trapping
at the surface and within the barrier region of a GaAs HEMT causing degrada-
tion in current-voltage characteristics [98]. In the GaN-based system, Mittereder
et al. demonstrated that short-term dc bias stress of AlGaN/GaN HEMTs can
induce trapping effects as manifested by current collapse [101]. Meneghesso et al.
recently related an anomalous kink in drain current in an AlGaN/GaN HEMT
to electron de-trapping [102] while Neuberger et al. showed electron trapping
within the passivation layer of an AlGaN/GaN HEMT [103]. This study investi-
gates hot carrier effects in III-Nitride HEMTs using a specialized multi-gate test
structure. In particular, evidence for hole trapping in SiN passivated HEMTs is
presented. Furthermore, it is asserted that the source of the holes arises from
impact ionization within the channel of the HEMT, implied by a kink in the drain
105

Figure 5.1. Device cross section showing the Schottky and four MISgates (a) with the corresponding band diagram along the channel
direction (b) showing the impact ionization process and the relation tothe Kink effect.
characteristics. Finally, a qualitative model has been developed to analyze aspects
of the trapped hole charge.
5.1 Test Structure
Sample growth was performed by RF-plasma assisted MBE on free-standing,
semi-insulating, HVPE-grown Fe:GaN [105]. The MBE-grown layer structure con-
sisted of a 1 µm thick 1019 cm−3 doped Be:GaN isolation layer, a 0.5 µm undoped
106

GaN buffer, and a 250 A AlxGa1−xN barrier, where x ∼0.27. The MBE growth
was performed in a Vacuum Generators V80H MBE system. The free-standing
GaN substrates were grown by HVPE at Kyma Technologies, Inc. Nominal dislo-
cation densities of the substrates were estimated by cathodoluminescence imaging
to be lower than 107 cm−2.
Processing was initiated by the photolithographic definition and deposition of
Ti/Al/Ni/Au contacts that were annealed at 860C for 30 seconds. This was fol-
lowed by a mesa isolation etch in a BCl3/Cl2 plasma. E-beam lithography was
used to define a 300 nm long gate located 1.85 µm from the source contact (LSG).
The Ni/Au gate metal stack was deposited by e-beam evaporation. A 50 nm SiN
layer was deposited by PECVD that employed an alternating high/low frequency
plasma assist. A set of four auxiliary Ni/Au-insulator-semiconductor (MIS) test
gates with gate lengths of 300 nm and period of 600 nm (LP ) were defined by e-
beam lithography 700 nm from the gate edge (Lsep). The source-drain separation
was nominally 6 µm (LSD in Fig. 5.1 (a)). Windows were opened in the SiN by a
SF6 plasma and an overlay metal stack of Ti/Pt/Au was deposited on all contact
pads for probing. Hall effect measurements were taken after the SiN deposition,
and a 2DEG charge density of 1 × 1013 cm−2 and a mobility of 1400 cm2/Vs at
room temperature were measured.
5.2 Experimental Procedure: Chynoweth model
Transfer characteristics were first measured for all gates (Schottky and MIS)
on the HEMT. Next the devices were subjected to a 2 hour bias stress in open
channel conditions via the Schottky gate (VDS = 20 V, VGS = +3 V, ID = 820
mA/mm). Immediately following bias stressing, transfer characteristics on all
107

gates were again taken. This history is shown in Fig. 5.2 (left). The threshold
voltage, Vth, is defined in the usual way by an extrapolation of the linear region of
the transfer characteristics. After bias stress the threshold voltage of the Schottky
gate remained the same as before stress, but the MIS gates all shifted to more neg-
ative voltages (∆Vth = 1.3 V) indicating the presence of positive trapped charge.
It is noted that this contrasts with Neuburger who observed a positive Vth shift,
indicative of negative trapped charge [103]. This discrepancy is not well under-
stood at this time. The transfer characteristics of both the Schottky and MIS gates
demonstrated similar slopes (transconductance) despite the additional 20 nm sep-
aration of the MIS gates by the SiN passivation layer. It is not well understood
at this time the origin of this but based off gate-to-gate current measurements it
is believed to be due to a degree of electronic coupling (conduction) between the
different electrodes. Attention is also drawn to the increased maximum current in
the MIS-gated transfer characteristics after bias stress. This increase in current
reflects the decreased access resistance as a result of the induced electron density
in the channel due to the trapped positive charge. That no shifts are observed
under the Schottky gate suggests the charge trapping affects only the access re-
sistance. Through successive measurements after bias stress of the MIS transfer
characteristics at room temperature the positive shifts were observed to return
slowly to unstressed levels with full recovery after ∼24 hours (Fig. 5.3 (right)).
Although the apparent buildup in positive charge could originate from electron
de-trapping [102], a more compelling hypothesis is that the increase in positive
charge is due to hole trapping. As to the source of the holes in these n-channel
devices, impact ionization is the likely origin. Strong evidence for this is found in
the kink observed in the drain current of the MIS-gated HEMT (Fig. 5.2 (right)).
108

Figure 5.2. Transfer characteristics (left) of all gates on the HEMT priorto and after bias-stress. Drain characteristics (right) of the AlGaN/GaNHEMT comparing the Schottky gate controlled (line) vs. the MIS gate 2controlled (open circles) family of curves. A clear kink in the MIS gate
controlled characteristics can be seen at ∼9 volts.
Such kinks are a known byproduct of impact ionization within the channel of the
HEMT, which arises from source-gate barrier lowering due to impact ionization-
generated hole accumulation in the source-gate region thereby abruptly increasing
channel conductivity (Fig. 5.1 (b)) [99],[100],[107],[108].
A second crucial piece of evidence that holes are not only being generated but
also are being injected into the gate barrier comes from the measurement of gate
current. As seen in the inset of Figure 5.3 (left) for the second MIS gate, there is
an additional current which adds to the already existing but minimal gate leakage
current (Itot = Ileak + Ihole). The VDS dependence of the extra current strongly
suggests that it is a hole current. For a more quantitative analysis we focus on
the corresponding gate current characteristics, specifically the VGS = -4 V curve
in the inset of Fig. 5.3 (left). Both leakage and hole currents can be extracted
from the measured gate current following the technique originally developed by
109

Chynoweth [104] and can be seen in Fig. 5.3. This technique has been used to
characterize the kink effect in GaAs MESFETs by Hui et al. [100] and also in
AlGaN/GaN HEMTs by Dyankonova et al. [106]. The gate hole current can be
approximated as a function of drain current (IDS) and the electric field in the high
field region ((VDS − Vsat)/Leff ) by
Ihole = αIDSLeffe−EiLeff
(VDS−Vsat) , (5.1)
where Vsat is the voltage at the onset of current saturation, Leff is the effective
gate length, and the electric field at the onset of impact ionization (Ei), where
the impact ionization coefficient, α is a constant for low fields. The gate leakage
current component is small compared to the hole current after onset, but most
notable is that the gate leakage current component is only a weak function of
VDS. Figure 5.3 shows the logarithmic gate current ratios as a function of recip-
rocal field. The region of interest is the linear regime on the logarithmic scale of
the hole current (Ihole/IDS) which validates impact ionization as the source of the
gate extracted hole current. From the slope of a linear fit, Ei can be extracted
for our system as ∼1 MV/cm. This value of the field needed for impact ioniza-
tion is slightly less than that reported in literature [107] and is exemplary of the
approximate nature of the analysis.
5.3 Discussion of charge dynamics
The band diagram seen in the inset of Fig. 5.2, is of the SiN/AlGaN/GaN
heterostructure cross section taken vertically through one of the MIS gates. The
relatively low valence band barrier and favorable fields inside the AlGaN support
the picture of hole injection. Furthermore, the fields in the SiN and AlGaN layers
110

Figure 5.3. (left) Gate current analysis for MIS gate 2 biased at VGS=-4 V. Linear character of the Ihole/IDS ratio indicates impact ionizationgenerated hole current. The inset shows the measured gate current forgate voltage steps of -2 V. (right) Time decay of the threshold voltage
shift.
combined with the valence band discontinuity suggests that holes will accumulate
in the vicinity of the SiN/AlGaN interface. From this we speculate the charge
becomes trapped at the SiN/AlGaN interface but is also possible that they remain
mobile. The relationship between the threshold voltage shift and trapped charge
is [109],
∆Vth =q
εoεSiN
∫ t
0
ypi(y)dy =qpiεo
(tSiNεSiN
), (5.2)
where the integral is over the combined SiN and AlGaN thicknesses (t), pi is
the 2D trapped hole charge density, tSiN is the SiN thickness, and εSiN is the
dielectric constant of SiN. The second equality follows if one assumes a delta
function distribution of trapped charge at the SiN/AlGaN interface. It is noted
that Neuburger’s formalism assumed a gaussian-type trapped charge distribution
that was displaced from the SiN/AlGaN interface within the passivation layer.
111

However, no reason was given for such an assumption therefore, it not used here.
Moreover, as discussed, the electric field profile shown in the inset in Fig. 5.2
suggests favorable conditions for the interface made by the SiN and AlGaN layers
to be the location where positive trapped charge would reside. Based on this
analysis, our measured results for MIS gate 2 of ∆Vth = 1.3 V from Fig. 5.2
(right), we find a trapped charge density of 9.6 × 1011 cm−2. The rightmost
plot in Fig. 5.3 shows the time-elapsed result of the threshold voltage shift as
the trapped charge was allowed to relax (i.e. all biases removed from the test
structure). It was observed that a long decay time constant occurred for the
trapped charge and followed an exponential relaxation as can be seen by the fit
line. The long decay time constant suggests that for time scales on the order of
operational frequencies, the trapping time constant imposes no direct deleterious
effects in terms of ac operation. This point is in agreement with the virtual gate
model which maintains that a charged length of the access region beyond the gate
cannot modulate at the same high frequency as the gate signal but acts to increase
access resistance within the gate-to-drain region. This topic will be discussed in
more detail in the following chapter. The inset to Fig. 5.3 shows the calculated
threshold voltage shift as a function of trapped positive charge density for various
thickness of SiN passivation layers since typical passivation layers are generally
thicker than those used in this study.
Lastly, we consider the magnitude of the threshold voltage shift of each of
the MIS gates. One could expect the individual shifts to differ due to a differing
trapped charge density in accord with the density and location of impact ionization
generated EHPs along the channel. This is indeed observed in the slight expansion
of the threshold voltage spread of the MIS gates after bias stress and is additional
112

support for our entire interpretation. However, because the MIS gates in the device
used in this study were grouped closely together, the voltage spreading does not
fully highlight the distribution of holes trapped along the channel direction in
comparison to if the MIS gates were positioned evenly between the Schottky gate
and drain, which is the eventual goal of this test structure.
5.4 Chapter 5 cited literature
96. N.S. Saks, P.L. Heremans, L. Van Den Hove, H.E. Maes, R.F. DeKeers-maecker, G.J. Declerck, “Observation of Hot-Hole Injection in NMOS Tran-sistors Using a Modified Floating-Gate Technique,” IEEE Trans. Elec. Dev.,vol. ED-33, no. 10, 1986.
97. R.B. Fair and R.C. Sun, “Threshold-Voltage Instability in MOSFET’s Dueto Channel Hot-Hole Emission,” IEEE Trans. Elec. Dev., vol. ED-28, no.1, 1981.
98. J.C. Huang, G.S. Jackson, S. Shanfield, A. Platzker, P.K. Saledas, C. We-ichert, “An AlGaAs/InGaAs Pseudomorphic High Electron Mobility Tran-sistor With Improved Breakdown Voltage for X- and Ku-Band Power Ap-plications,” IEEE Trans. on Microwave Theory and Tech., Vol. 41, No. 5,1993.
99. B. Brar and H. Kroemer, “Influence of Impact Ionization on the Drain Con-ductance in InAs-AlSb Quantum Well Heterostructure Field-Effect Transis-tors,” IEEE Elec. Dev. Lett., vol. 16, no. 12, 1995.
100. K. Hui, C. Hu, P. George, P.K. Ko, “Impact Ionization in GaAs MESFET’s,”IEEE Elec. Dev. Lett., vol. 11, no. 3, 1990.
101. J.A. Mittereder, S.C. Binari, P.B. Klein, J.A. Roussos, D.S. Katzer, D.F.Storm, D.D. Koleske, A.E. Wickenden, R.L. Henry, “Current collapse in-duced in AlGaN/GaN high-electron-mobility transistors by bias stress,”Appl. Phys. Lett., vol. 83, no. 8, 2003.
102. G. Meneghesso, F. Zanon, M.J. Uren, E. Zanoni, “Anomalous Kink Effectin GaN High Electron Mobility Transistors,” IEEE Elec. Dev. Lett., vol.30, no. 2, 2009.
113

103. M. Neuburger, J. Allgaier, T. Zimmermann, I. Daumiller, M. Kunze, R.Birkhahn, D.W. Gotthold, E. Kohn, “Analysis of Surface Charging Effectsin Passivated AlGaN-GaN FETs Using a MOS Test Electrode,” IEEE Elec.Dev. Lett., vol. 25, no. 5, 2004.
104. A.G. Chynoweth, “Ionization Rates for Electrons and Holes in Silicon”,Phys. Rev., Vol. 109, No. 5, 1958.
105. D.F. Storm, D.S. Katzer, J.A. Roussos, J.A. Mittereder, R. Bass, S.C. Bi-nari, Lin Zhou, David J. Smith, D. Hanser, E.A. Preble, and K.R. Evans,“Microwave performance and structural characterization of MBE-grwon Al-GaN/GaN HEMTs on low dislocation density GaN substrates,” J. Cryst.Growth, vol. 305, no. 340, 2007.
106. N. Dyankonova, A. Dickens, M.S. Shur, R. Gaska, J.W. Yang, “Temperaturedependence of impact ionization in AlGaN-GaN heterostructure field effecttransistors,” Appl. Phys. Lett., vol. 72, no. 20, 1998.
107. C.H. Lin, W.K. Wang, P.C. Lin, C.K. Lin, Y.J. Chang, Y.J. Chan, “Tran-sient pulsed Analysis on GaN HEMTs at Cryogenic Temperatures,” IEEEElec. Dev. Lett., vol. 26, no. 10, 2005.
108. S. Nuttinick, S. Pinel, E. Gebrara, J. Laskar, M. Harris, J.R. Shealy, “Floating-Body Effects in AlGaN/GaN Power HFETs,” in Gallium Arsenide applica-tions symp., Milano, 2002.
109. S.M. Sze, “JFET and MESFET” in Physics of Semiconductor Devices, 2nd
ed., New York, Wiley, 1981, ch. 6, pg. 319-322.
114

CHAPTER 6
NOVEL HEMT DESIGNS UTILIZING THE AlN/GaN HETEROSTRUCTURE
The ultra-thin AlN barrier heterostructure makes feasible an endless assort-
ment of novel HEMT designs depending on the desired application. In the past
10 years a collection of devices have been demonstrated that utilize some form of
the AlN/GaN heterostructure. Bayram et al. demonstrated double-barrier reso-
nant tunneling diodes [110]. Digital-alloy barriers have been utilized for HEMT
barriers [111]. Not to mention the plethora of HEMT designs already mentioned
[112], [113], [114].
This chapter highlights the realization of two independent but novel design
concepts that utilize the AlN/GaN heterostructure. First, a set of three varying
HEMT heterostructures that employ an AlxGaN back barrier for short channel
effect mitigation is presented. Such structures utilize 74 - 100% Al-containing top
barriers and an Al0.13GaN back barrier, the highest Al-containing back barrier in
a Ga-polar HEMT to date. Secondly, a dual-channel AlN/GaN HEMT design is
proposed and realized for the first time. Its purpose, to exploit the top channel as a
field-screening layer for surface potential fluctuations and is an epitaxial approach
for the mitigation of DC-RF dispersion. These new-generation AlN/GaN HEMTs
attest to the structure’s merit for advanced GaN HEMT designs.
115

6.1 Polarization-engineered AlxGaN back barriers
A distinctive characteristic of the GaN-based HEMT is that due to the very
wide band gaps involved and subsequently the large conduction band discontinu-
ities utilized in the constituent heterostructure along with the polarization sheet
charges that form, an energy back barrier is not necessary for sufficient 2DEG
confinement. However, there have been several reports, that have incorporated
several differing varieties of back barriers in a GaN-based HEMTs. Palacios pro-
posed and realized the use of a thin (∼1 nm) InGaN layer close to the AlGaN/GaN
interface on the GaN side. By utilizing the conduction band offset between GaN
and InGaN, an effective back barrier of ∼0.2 eV occurs [115]. Mikovic has utilized
an Al0.04GaN back barrier reporting improvements in device performance owing to
the incorporation of the low Al percentage back barrier [116]. This structure was
also used for a polarization-engineered enhancement-mode AlGaN/GaN HEMT
[117]. Rajan and co-workers have successfully demonstrated GaN/AlGaN HEMTs
fabricated from structures grown in the Nitrogen-face crystal polarity which in-
corporates a built-in Al0.3GaN back barrier [118], [119].
The value in such structures that incorporate some form of energetic back
barrier lies in the fact that the structure sets up a rigid interface that enhances
termination of the electron distribution and allows more efficient charge control
of the 2DEG by the gate bias voltage. It is also plausible that the incorporation
of an AlGaN buffer may reduce residual buffer charge from unintentional dopants
due to its wider band gap making the thermodynamics favorable for reduced
ionization, but this is speculative at this point. Jessen et al. suggested a gate
length to barrier thickness ratio of 15 for GaN HEMT technology in order to avoid
short channel effects, increasing the commonly accepted value of 3 - 6 from GaAs
116

Figure 6.1. Layer structure and band diagram in equilibrium of theAlGaN/AlN/GaN control sample.
technology by a factor of ∼3 [120]. While this stricter criterion is unfavorable, it
was statistically measured across a wide range of vendors’ devices and found to
be very systematic. One caveat to the study was that all GaN HEMTs measured
utilized the conventionally thick GaN buffer without the employment of a back
barrier. Based on the above argument, it is anticipated that the incorporation of
an energy back barrier will relax Jessen’s criterion, thus allowing a reduced aspect
ratio before short channel effects become an issue. It is this point that is at the
heart of the following study while simultaneously demonstrating some of the first
high Al-content AlGaN back barrier HEMTs.
During the time of this writing, HRL researchers reported on a similar device
consisting of a GaN/AlN/GaN multi-heterostructure that included a Al0.8GaN
back barrier grown on SiC. By also including n+ ohmic contact regrowth, enhancement-
mode HEMTs fabricated from this structure demonstrated outstanding small sig-
nal frequency performance of 120 GHz and 200 GHz for ft and fmax, respectively,
117

which set a record for the ultra-thin AlN/GaN HEMT [114]. Furthermore, a
forthcoming report will be presented on depletion-mode AlN/GaN HEMTs which
include an Al0.8GaN back barrier that have achieved record small signal perfor-
mance for both the ultra-thin AlN/GaN HEMT and the GaN-based HEMT in
general. Small signal performance of 220 GHz and 400 GHz for ft and fmax is
shown for 40 nm gate length HEMTs, respectively [121]. Such outstanding per-
formance is a testament to the capability of back barrier technology to mitigate
short-channel effects in deep sub-micron gate length transistors and the ultra-thin
AlN/GaN HEMT in general.
In this study three different structures were grown by plasma-assisted MBE at
the University of Notre Dame1. The first structure contained an Al0.72GaN/AlN/GaN
active layer without a back-barrier, similar to what has been reported elsewhere
[122] and was intended as a calibration and control sample for comparison to the
back barrier samples. The layer structure, band diagram, and AFM scan of the
AlGaN surface can be seen in Fig. 6.1. The additional structures include an
Al0.72GaN/AlN/GaN active layer and AlN/GaN active layer with both including
the Al0.13GaN back barrier. Schematic cross-sections of these structures including
their respective equilibrium band diagrams and surface AFM are shown in Fig.
6.3.
Processing followed the typical AlN/GaN process flow given in Appendix C
with the exception that the ohmic pre-etch times were all increased by a factor of
3 to account for material differences between U. Notre Dame and NRL. An ohmic
first process was employed with the mesa etch following which resulted in contact
resistances of 0.7 - 2.2 Ω-mm as measured by circular TLM. A blanket deposition
1Guowang Li is gratefully acknowledged for performing the epitaxial growth of these struc-tures.
118

Figure 6.2. Transfer (left) and drain (right) characteristics of theAlGaN/AlN/GaN HEMT control sample (without a back barrier).
of ALD Al2O3 of 5 nm thick was then deposited at the U. of Notre Dame. Finally,
gates were defined by optical lithography and deposited and a patterned buffered
HF etch was performed to open access regions to the ohmic contacts. Pertinent
device geometries include LSD = 5 µm, WG = 150 µm, and LG = 1 µm. Samples
are currently undergoing additional processing for the application of sub-micron
T-gates but were not available at the time of this writing.
Hall effect measurements were taken on the as-grown sample as well as after
Al2O3 deposition and results were found to change from 405 Ω/ (ns = 1.33 ×
1013 cm−2, µ = 1160 cm2/Vs) to 975 Ω/ (ns = 0.68 × 1013 cm−2, µ = 950
cm2/Vs), respectively. The reduction in 2D charge density is speculated to be due
to partial relaxation of the strained barrier layer from multiple anneals at 860 oC
in order to achieve low-resistance ohmic contacts. This also may explain the slight
119

Figure 6.3. (left) Layer structures, (center) band diagrams, and (right)2×2 µm2 AFM scans of the AlN surface for the AlGaN back barrier
structures.
120

reduction in mobility. Transfer and drain characteristics of the AlGaN/AlN/GaN
HEMTs without the back barrier are shown in Fig. 6.2. Maximum drain current
of 0.93 A/mm at VDS = 8 V and VGS = +7 V was achieved with an accompanying
extrinsic transconductance of ∼175 mS/mm. The higher contact resistance was
responsible for the lower than expected extrinsic transconductance. Nonetheless,
these characteristics demonstrate a factor of two improvement over similar devices
reported [122] in terms of drain current density and contact resistance as well as
comparable transconductance.
The two layer structures which include the AlxGaN back barrier are shown
schematically in Fig. 6.3 which also includes the respective equilibrium band
diagram and 2×2 µm2 AFM scan of the AlGaN and AlN as-grown surfaces. Figure
6.3(a) shows the Al0.72GaN/AlN/GaN structure including the 5 nm thick Al2O3
film while Fig. 6.3(b) shows the AlN/GaN structure. For the AlGaN/AlN/GaN
structure prior to oxide deposition the on-wafer RT Hall results yielded Rsh = 261
Ω/ (ns = 3.3 × 1013 cm−2, µ = 725 cm2/Vs) whereas after oxide deposition they
were found to be Rsh = 305 Ω/ (ns = 3.3 × 1013 cm−2, µ = 614 cm2/Vs). The
drop in mobility is not well understood at this time. For the AlN/GaN structure
prior to oxide deposition the RT Hall results yielded Rsh = 152 Ω/ (ns = 4.29
× 1013 cm−2, µ = 958 cm2/Vs) whereas after oxide deposition they were found to
be Rsh = 170 Ω/ (ns = 4.3 × 1013 cm−2, µ = 852 cm2/Vs).
Figure 6.4 shows (left) the electron charge density as a function of distance
from the AlN/GaN interface for the three heterostructures as calculated by a 1D
Poisson Schrodinger solver and (middle) the results of C-V measurements taken
at room temperature. The gray area in Fig. 6.4 (left and right) represents the
physical location of the GaN/AlGaN heterojunction that results in the energy
121

Figure 6.4. (left) Calculated electron charge density from 1D PoissonSchrodinger solver, (middle) measured C-V data of the back barrierstructures, and (right) calculated charge distribution from C-V data.
back barrier while the white region represents the GaN channel region. It can be
seen that without the back barrier (grey dashed line) the charge density profile is
calculated to persists deep within the GaN buffer but when the AlGaN back barrier
is present the charge density profiles quickly reduce below 1013 cm−2 before the
junction location. As expected, the AlN/GaN top heterojunction causes a higher
2D charge concentration in the GaN quantum well (channel) but still maintains
a more abrupt decrease by the inclusion of the back barrier.
C-V profiling is a convenient and often used technique for the determination
of the mobile charge “profile” and is an obvious tool to extract the effect of the
back barrier on the charge profile in these structures. Figure 6.4 (middle) shows
the comparative results between all three HEMT structures of room temperature
C-V measurements on 100 µm diameter dots with an oscillation frequency of 10
122

Figure 6.5. drain (left) and transfer (right) characteristics comparison ofback barrier HEMTs
MHz. A practical constraint that arose was the onset of phase reduction early
in the voltage sweep that prevented a clear depletion portion of the back barrier
structures. However, the control structure without a back barrier demonstrated a
very clear C-V curve with minuscule hysteresis (∼0.08 V) indicating a high quality
oxide without oxide charge. Shown in the right-most plot of Fig. 6.4 are the
resulting charge profiles as a function of distance from the top AlN/GaN interface
calculated from the C-V curves by the typical ns ∝ (∂C−2/∂V )−1 relationship.
It can be seen that the charge fall-off within the buffer region of the back-barrier
structures is much faster than the structure without the back barrier, as expected.
It is noted that the C-V profiling technique tracks the centroid of the mobile
charge density therefore the right-most and left-most plots in Fig. 6.4 are not to
be taken as equivalent but rather two different ways of viewing the charge profile
in the structure.
Comparative transfer and drain characteristics of the back barrier HEMTs are
shown in Fig. 6.5. The lower sheet resistance held by the AlN/GaN HEMT is rep-
123

resented in the higher maximum drain current of 1.2 A/mm over 1.15 A/mm of
the AlGaN/AlN/GaN HEMT. The higher charge density of the AlN/GaN HEMT
is manifested by a more negative threshold voltage seen in the transfer character-
istic. The AlN/GaN HEMT showed a higher extrinsic transconductance of ∼150
mS/mm over ∼120 mS/mm for the AlGaN/AlN/GaN HEMT despite the higher
contact resistance. Conservative estimates of intrinsic gm for the respective de-
vices was gintm ∼ 214 mS/mm (RS ≈ Rc = 2 Ω-mm) and gintm ∼ 155 mS/mm (RS
≈ Rc = 1.9 Ω-mm). Since the dielectric/barrier stacks were of comparable capac-
itance for both structures it is speculated that the higher gm for the AlN/GaN
HEMT is due to a higher saturation velocity as inferred by the higher low-field
mobility of the AlN/GaN HEMT than the AlGaN/AlN/GaN HEMT. This is left
to be confirmed by velocity extraction through a varied LG experiment that is to
be carried out after sub-micron gate application.
The successful demonstration of ultra-thin high Al-content AlGaN/AlN/GaN
and AlN/GaN HEMTs with Al0.13GaN back barriers has been presented for the
first time. Maximum drain current densities exceeded 1A/mm for all device struc-
tures. High contact resistance prevented the sub-10 nm barrier thickness to be
advantaged for improvement of extrinsic gm but still maintained respectable levels
greater than 100 mS/mm. It is further anticipated that these structures will allow
for a reduced gate length/barrier thickness ratio requirement below 15 which was
originally suggested for GaN HEMT technology that lacked the back barrier [120].
Through this particular advancement, GaN HEMT technology is expected to rival
if not surpass its GaAs contenders in frequency performance.
124

6.2 Design of a dual-channel charge-screening AlN/GaN HEMT; an epitaxial
approach to mitigate frequency dispersion
A number of multi-channel HEMT designs have been proposed and attempted,
usually as a means to increase drain current density [117], [115]. One of the more
unconventional and interesting multi-channel HEMT devices was developed by
Capasso [123]. In this work, two channels were present only below the gate and
showed a resonant tunneling peak in the transfer characteristic. The operation of
these designs are typically foiled by the difficulty of making ohmic contact to the
buried channel. Therefore, they have remained a research concept and have yet
to graduate to become practically useful devices.
Surface state passivation refers to the modification of the donor surface state
such that the surface is less prone to charging. The most popular method for
passivation of surface states is achieved by the deposition of a dielectric such as
SiN2 within the access regions of a FET but has also been achieved by the intro-
duction of Flourine ions [115] and other chemical treatments. However, another
issue becomes apparent when the surface is passivated by a dielectric. The surface
of the dielectric can act as a new charging surface which sets a minimum passi-
vation material thickness limit. Palacios suggests a SiN thickness of 100 nm [115]
while a recent study by Pei demonstrated improved power performance in an Al-
GaN/GaN HEMT using 120 nm SiN [124]. In either case it seems a SiN thickness
exceeding 80 nm is required. A common byproduct of the use of a passivation
material is the observation of an increase in 2DEG charge density. This was dis-
cussed previously in Chapter 2 for various dielectric materials on the AlN/GaN
heterostructure. However, this is not to say that an increase in 2DEG density as
2SiN has had a longer history in its role as a passivation dielectric for GaAs-based devices[125]. Largely because of this reason was it implemented with GaN-based devices.
125

a result of a deposited dielectric is indicative of a sufficiently passivated surface.
The primary reason for the implementation of surface passivation to HEMTs
is that it minimizes the deviation of the dynamic I-V characteristics of a transistor
from the DC I-V characteristics. This deviation between the two different opera-
tion regimes is commonly known as DC-to-RF dispersion, or simply dispersion and
is a major issue for the III-Nitride HEMT family. The detailed manner by which
surface charging causes the deviation between DC and RF characteristics can be
understood by considering the method by which a charge becomes trapped. If an
electron is introduced to a surface state that willingly accepts negative charge it
can then become “trapped” in that state. For it to be “de-trapped” requires a pre-
scribed amount of energy that can be gained thermally, electrically, or optically.
Despite the method there is a certain amount of time the trapped electron takes
to become un-trapped. If this amount of time exceeds the duration that energy
is supplied, the trapped charge stays trapped and vice versa. Therefore, during
DC operation trapped charges in a HEMT have a significant amount of time (and
energy) to become trapped and de-trapped but this is not the case for RF oper-
ation when the HEMT undergoes periodic voltage oscillations. These oscillations
can have too short of a period to de-trap charge thus causing the compression
of I-V characteristics which ultimately reduces the device’s achievable RF output
performance.
One model that has gained significant popularity for III-Nitride HEMTs is the
virtual gate model [126]. The concept of the virtual gate extension is illustrated
in Fig. 6.6 for the AlN/GaN HEMT. Three charged states can be defined during
a single gate pulse cycle as demonstrated in the figure. In state 1 the device is
biased under sub-threshold conditions with a drain-source bias applied. This state
126

Figure 6.6. Virtual gate model showing the time plot of the surfacecharge and channel depletion.
is given by the intentional depletion of the channel through the gate bias. Because
of the large fields encountered in this state the surface of an unpassivated device
becomes charged in a region between the gate and drain where the most intense
electric field occurs. This region causes the gate to look electronically longer and
is labeled “Leff” for “effective gate length” in Fig. 6.6. Once the gate voltage is
made to open the channel such as in stage 2, the drain current cannot respond
immediately due to the fact that it takes a discrete amount of time to discharge the
access region trap states. The charged region between the gate and drain remains
partially charged depending on the length of the gate voltage pulse. Herein lies
the reason for the “virtual gate extension” naming convention since this region
serves to keep the channel partially depleted along a length slightly larger than
the metallurgical gate length. Finally, the drain current reaches its full value for
the gate pulse width (stage 3) after a sufficient amount of time for the traps to
127

discharge.
The steps just outlined describing the concept behind the virtual gate model
also describes a measurement known as gate lag. Gate lag measures the ratio of
the deviation in the measured open channel DC drain current to that of a gate
pulsed drain current. A ratio less than 1 indicates the severity of surface charging
in the HEMT. Because of its simplicity, this measurement is widely used as a quick
informational feedback measurement indicating the degree to which large-signal
performance might be hindered. The time-dependent reduction in the GL ratio is
indicative of additional charging which could be due to oxide-AlN interface states.
This sinking in drain current with time under bias is indicative of trap charging
causing partial depletion and can be a severe detriment to the HEMT’s power
performance. This mechanism is a tell-tale sign of what is termed “power drift”
and a good qualitative explanation can be found in reference [127]. These issues
are at the heart of HEMT design for high frequency power performance.
6.2.1 Multi-channel heterostructure design
The first question sought to answer in the following study is whether the
formation of two parallel channels is achievable with an AlN/GaN/AlN/GaN het-
erostructure. If so, the second is whether the top channel can be successfully
exploited as a charge supply layer that will effectively screen the electric field
extension arising from surface charging near the drain edge of the gate. The
thicknesses of the active layers are of critical importance in the design and thus,
the band diagram is a necessary design tool.
Akin to the method used in Chapter 2 and the Appendices, a voltage loop may
be summed about the conduction band profile for an oxide/AlN/GaN/AlN/GaN
128

Figure 6.7. Cross section and corresponding band diagrams for thedesign of the charge screening HEMT.
multi-heterostructure (MH) which yields the following,
− VG + ΦB − VT −∆Ecq
+ V1 +∆Ecq− VB −
∆Ecq
+ E02 + (Ef − E02) + VS = 0, (6.1)
where V1 accounts for the voltage drop in the GaN spacer that harbors the upper
2DEG. Assuming single sub-band population of both quantum wells and using
Gauss’s Law, the voltage loop may be written in terms of the applied voltage and
129

charges in the structure,
VGS = (ΦB −∆Ecq
) + (9π~q
8εG√
8m∗)2/3[(qns1)
2/3 + (qns2)2/3]
−Qnet(tT + tBεA
) + qns1(tTεA
+π~2
m∗)
+ qns2(tT + tBεA
+tGεG
+π~2
m∗), (6.2)
where ΦB and ∆Ec are the metal-oxide barrier height and AlN/GaN conduction
band offsets, respectively; ns1 and ns2 are the top and bottom channel mobile
2DEG densities, respectively; Qnet is the net fixed polarization charge at the
AlN/GaN interface taking into account both spontaneous polarization of both
materials as well as piezoelectric polarization of the strained AlN lattice, tT is the
thickness of the top AlN cap, tB is the thickness of the bottom AlN layer, and the
relative dielectric constants of the respective layers take the form, εx = εr,xεo.
As per the discussion in the introduction of this section, the cause of DC-
RF frequency dispersion is commonly taken to be due to the virtual gate effect
or access region surface charing between the gate and drain of a HEMT. Based
on this principle, the design logos of the surface potential fluctuation screening
HEMT is to sacrifice the top 2DEG as a screening layer for the bottom channel
be protected from surface fluctuations in the gate-to-drain access region. This
sets the governing design criterion, the HEMT needs a more negative Vth in the
access region (Fig. 6.7 (b)) than in the gated intrinsic region (Fig. 6.7 (a)).
This will allow surface charging to have no effect on the underlying channel due
to the effective screening from the upper channel. Because the 2DEG density
is dependent on AlN thickness, device dimensions can be tailored to achieve the
desired effect.
130

The gated region will therefore require a recess etch through the top AlN and
GaN layers such that when a gate voltage is applied, it modulates only the bottom
channel. The gate voltage-2DEG charge dynamics are given in Chapter 2 by Eq.
2.6 or 2.7. Maintaining the original MH in the access regions will be necessary
in achieving the desired screening effect. In the access region on the drain side
of the gate Eq. 6.2 can be used to determine pinch-off of both channels. It is
assumed for the sake of simplicity that both wells are decoupled from each other
(in equilibrium both wells are simultaneously coupled to the same Fermi level).
Imposing flatband conditions on Eq. 6.2 and grouping charge terms the threshold
voltage in the access region can be simplified to,
Vth,access(ns) = −(
9π~q8εG√
8m∗
)2/3
[(qns1)2/3 + (qns2)
2/3]− qns1(tTεA
+π~2
qm∗
)− qns2
(tT + tBεA
+tGεG
+π~2
m∗
). (6.3)
It needs to be ensured that the access region threshold voltage is much more neg-
ative than underneath the gate. Shen discussed this design concept for thick GaN
capped AlGaN/GaN HEMTs in detail [128]. This condition allows a numerical
design constraint for the structure and can be written: Vth[Channel 2, (b)] <<
Vth[Channel 2, (a)]. Figure 6.8 shows a comparison between the threshold voltage
within the gated region versus the threshold voltage within the access region for
various GaN spacer thicknesses ranging between 10 to 20 nm. The horizontal
dashed line, indicating threshold voltage for the gated region, does not vary as
the lower AlN barrier is taken to be fixed at 3 nm (this threshold voltage is for
comparison). 2DEG charge density of the top channel is plotted along the x-axis
as an indicator of the top AlN cap thickness. Threshold voltage refers to complete
131

Figure 6.8. Threshold voltage comparison. The top horizontal curve isfor a fixed charge density of the lower channel with a fixed 3 nm barrierand is for comparison to the access region Vth. The set of 3 lower curvesshow the calculated threshold voltage for the access region with the 2nd
2DEG distribution for screening. Access region threshold voltagebecomes increasingly more negative for increased upper 2DEG density
and this increase in amplified for thicker GaN spacer layers.
132

2DEG charge elimination of both channels for the bottom three curves. Interface
trap state charging is not taken into account. It can be seen qualitatively, that
the total threshold voltage for the access region falls off very quickly in negative
voltage for increasing charge density (top AlN cap thickness) and more so for a
thicker GaN spacer. Based off these results a device has been designed, grown,
fabricated, and analyzed. The following section involves this study.
6.2.2 A dual-channel AlN/GaN HEMT
The dual-channel structures were grown by plasma-assisted MBE by David
Storm at the Naval Research Laboratory following similar growth details given
in Chapter 3. Semi-insulating HVPE GaN substrates were used as the template
for growth. After a 60 second nitridation clean of the substrate a 1.5 nm AlN
nucleation layer was grown followed by a 1.3 µm thick layer of Be-doped GaN as
a compensation dopant to oxygen impurities. These layers were followed by 200
nm unintentionally doped GaN, 3 nm AlN, 15 nm GaN, and the final 3 nm AlN
cap. All layers were grown without interrupts and the Ga shutter was left open
during all layer growths.
The as-grown structure after Ga-droplet removal resulted in a sheet resistance
of 210 Ω/ measured by a contactless sheet resistance measurement. AFM indi-
cated a smooth surface (RMS roughness = 0.64 nm for a 2 × 2 µm2 scan) without
indication of lattice relaxation of the AlN layers (Fig. 6.9). Sample processing
followed an ohmic first process however, during this stage the entire top AlN and
GaN layers were removed by a BCl3/Cl2 ICP/RIE etch. The design does not
require low resistance ohmic contact to the upper 2DEG since the main concern
is the threshold voltages referenced to the Fermi level deep into the GaN buffer.
133

Figure 6.9. (right) 2×2 µm AFM scan of the AlN surface of thedual-channel structure.
No sidewall protection was used during the e-beam deposition of the ohmic metal
stack. An 860 C rapid thermal anneal was performed for 30 seconds to diffuse
the contact metal and make contact with the lower channel. This resulted in
contact resistances of ∼2 Ω-mm as determined by circular TLM. A 50 nm deep
mesa isolation etch was performed in a Cl-based plasma. E-beam lithography was
used to define the 200 nm long gate recess etch lines in some of the devices where
others were left unwritten so that both the screening HEMT and a dual channel
HEMT could simultaneously be realized on the same wafer. After a ∼17 nm gate
recess etch the samples were sent to U. Notre Dame for ALD Al2O3 gate insulator
deposition and received a 7 nm thin film3. Finally, 300 - 400 nm long e-beam gates
were written and deposited using a Ni/Au metal stack and holes in the oxide were
etched in a buffered HF acid in order access the ohmic pads.
Post oxidation Hall effect measurements were performed and the sheet resis-
3Zongyang Hu is gratefully acknowledged for performing the ALD oxide depositions at theU. Notre Dame.
134

Figure 6.10. C-V analysis of the Al2O3/AlN/GaN/AlN/GaNheterostructure capacitor (left) and the associated approximate charge
profile (right).
135

tance and constituent parameters were determined to be Rsh = 180 Ω/, ns =
2.3 × 1013 cm−2, µ ∼ 1500 cm2/Vs. The measured 2DEG density is lower than
expected if one assumes a 2X increase in the single 3 nm thick AlN barrier het-
erojunction. However, given the thick GaN spacer, second AlN layer, and the
ensuing polarization charge densities, it is assumed that the lower 2DEG density
is small. C-V measurements on 100 µm diameter dots at 10 MHz showed two dis-
tinct plateaus indicating two separate charge distributions in the heterostructure
(Fig. 6.10). The plot shows three curves with corresponding sweep directions.
Curve (1) was the initial sweep while curve (2) followed in the same direction and
curve (3) swept from low to high gate bias voltage. The curve evolution from (2)
to (3) shows some hysteresis indicating oxide charge or possibly confined mobile
charge in the GaN layer. It is hard to say the origin of the hysteresis in this
structure given its complexity.
A clear deviation is seen between curves (1) and subsequent curves and is
speculated to be due to a “burn in” effect that may amount to simply the charging
of interface and other traps in the hetero-system. Nonetheless, it is assumed that
the first curve gives the best evidence of the pristine heterostructure. Thus, the
integration of the smaller capacitance plateau yields a charge density of 1.5 × 10¹³
cm−2 associated with the lower 2DEG. The integration of the second capacitance
plateau yields a combined charge density of 2.6 × 1013 cm−2 which is in decent
agreement with the charge density measured by Hall effect. The difference tells
the upper 2DEG density and was found to be 1.1 × 1013 cm−2. It is noted that
this is the first demonstration of two parallel 2DEG channels that are formed in
an all binary AlN/GaN heterostructure.
Both dual-channel HEMTs and charge screening HEMTs were fabricated on
136

Figure 6.11. (left) Transfer characteristics of both the dual-channel andcharge-screening HEMT, (middle) drain characteristics of the
charge-screening HEMT, and (right) drain characteristics of thedual-channel HEMT.
the same wafer and their DC transfer (left) and drain (right) characteristics are
shown in Fig. 6.11. Interestingly, the dual channel HEMT appeared to have
a maximum drain current of ∼2X that of the charge screening HEMT which
indicates there was in fact efficient contact made to the etched sidewalls of the
top channel. Therefore, it as taken that both channels are contacted by the source
and drain contacts and may pass current to some extent. The quality of contact
to the upper channel is unknown. The dual channel HEMT was anticipated to
shown a dual region transfer characteristic based on the C-V results but little if
any was observed. However, the charge screening HEMT showed peculiar transfer
characteristics in its lack of a well defined maximum current density and non-
linear characteristic. A multi-peaked gm was observed, although unexpected. It is
speculated that there is potential communication between channels in the access
137

Figure 6.12. Small signal frequency performance of the charge screeningHEMT (left) and the dual channel HEMT (right).
regions that frustrate the typical linear transfer characteristic, but this is yet to
be determined. Nonetheless, the measured transfer and drain characteristics show
modulating channels that may be biased into a sub-threshold regime. Therefore,
a test for DC-RF dispersion is warranted and can be carried out through pulsed
gate lag measurements as discussed above.
Small signal performance was measured up to 50 GHz of both the dual channel
HEMT and the charge screening HEMT and is shown in Fig. 6.12. With gate
lengths being ∼ 300 nm in length for both device structures, ft and fmax were
measured to be 27 GHz and 46 GHz, respectively for the charge screening HEMT
and 48 GHz and 60 GHz, respectively for the dual channel HEMT. The cause for
the dual channel HEMT having better frequency performance is not well under-
stood but is likely to be due, at least in part, to a lower access resistance from
138

the two parallel channels. Nonetheless, the frequency performance measured is
respectable for these “first of their kind” devices and demonstrates the potential
of these designs for high frequency amplification.
The results of pulsed gate lag measurements are shown in Fig. 6.13 for the (a)
dual channel AlN/GaN HEMT, the (b) charge-screening HEMT, and (c) a stan-
dard single channel AlN/GaN HEMT for comparison. The dual channel HEMT in
(a) demonstrated a gate lag ratio (GLR) of 0.74 which reduced over time while the
HEMT was biased in sub-threshold to 0.67 for subsequent pulses. It is assumed
that this reduction is mainly due to surface state charging and corresponding de-
pletion of the upper channel since it was shown that the upper channel makes up
a large portion of the total drain current for these dual-channel HEMTs. After
restarting the measurement the open channel drain current was found to have
diminished by 82 mA/mm which is indicative of 2DEG channel depletion and
possibly some buffer trapping. The charge-screening HEMT in (b) demonstrated
an unchanging GLR of 0.86 for all pulses. While a GLR ratio of 1.0 is indica-
tive of no channel depletion and is preferred, there was some charging that led
to channel depletion as evidenced by the 1.0 GLR. The origin of this trapping
is unknown at this time but could be due to interface trap state charging of the
GaN spacer/AlN interface of the lower channel since the upper channel 2DEG
could act as a charge supply for this interface traps. This condition is very un-
desirable since it would trump the very purpose of the design. However, it is
only speculated at this time whether this interface is the source of trapping. An
important positive result of the charge-screening HEMT is that after the GLR
sequence was stopped and restarted, it was found that the drain current density
had not diminished in the slightest. The constant GLR of 0.86 is relatively good
139

Figure 6.13. Time profiles of the pulsed-gate lag measurements for (a)the dual channel HEMT, (b) the charge-screening HEMT, and (c) a
standard single heterojunction AlN/GaN HEMT for comparison.
140

given no passivation other than a thin 7 nm Al2O3 layer was deposited. As well as
no slump in the open channel drain current [127]. It is therefore concluded that
the method of employing a sacrificial charge screening layer for the mitigation of
DC-RF frequency dispersion is a novel design that has indeed shown promise in its
functionality through proof-of-concept devices shown here. Further refinements
in the contacts, gating process, and layer structure are anticipated to advance the
design to perfectly remove the detrimental frequency dispersion observed in these
ultra-shallow channel AlN/GaN HEMTs.
6.3 Chapter 6 cited literature
110. C. Bayram, Z. Vashaei, M. Razeghi, “AlN/GaN double-barrier resonanttunneling diodes grown by metal-organic chemical vapor deposition”, Appl.Phys. Lett. 96, 042103, 2010.
111. S. Yagi, X.-Q. Shen, Y. Kawakami, T. Ide, M. Shimizu, “Demonstrationof Quasi-AlGaN/GaN HFET Using Ultrathin GaN/AlN Superlattices as aBarrier Layer”, IEEE Elec. Dev. Lett. 31, 9, 2010.
112. T. Zimmermann, D. Deen, Y. Cao, J. Simon, P. Fay, D. Jena, and H.G.Xing, “AlN/GaN Insulated-Gate HEMTs With 2.3 A/mm Output Currentand 480 mS/mm Transconductance”, IEEE Elec. Dev. Lett. Vol. 29, No.7, 2008.
113. C.Y. Chang, S.J. Pearton, C.F. Lo, F. Ren, I.I. Kravchenko, A.M. Dabiran,A.M. Wowchak, B. Cui, P.P. Chow, “Development of enhancement modeAlN/GaN high electron mobility transistors”, Appl. Phys. Lett. 94, 263505,2009.
114. A.L. Corrion, K. Shinohara, D. Regan, I. Milosavljevic, P. Hashimoto, P.J.Willadsen, A. Schmitz, D.C. Wheeler, C.M. Butler, D. Brown, S.D. Burn-ham, M. Micovic, “Enhancement-Mode AlN/GaN/AlGaN DHFET with 700mS/mm gm and 112 GHz ft”, International Workshop on Nitride Semicon-ductors, 2010.
115. T. Palacios, ”Optimization of the High Frequency Performance of Nitride-Based Transistors,” Ph.D. Dissertation, University of California, Santa Bar-bara, 2006.
141

116. M. Micovic, P. Hashimoto, M. Hu, I. Milosavljevic, J. Duvall, P.J. Willadsen,W.-S. Wong, A.M. Conway, A. Kurdoghlian, P.W. Deelman, J.-S. Moon, A.Schmitz, M.J. Delaney, “GaN Double Heterojunction Field Effect TransistorFor Microwave and Millimeterwave Power Applications”, IEEE IEDM 4,807, 2004.
117. R. Chu, Z. Chen, S.P. DenBaars, U.K. Mishra, “V-Gate GaN HEMTs WithEngineered Buffer for Normally Off Operation”, IEEE Elec. Dev. Letts.,Vol. 29, No. 11, 2008.
118. S. Rajan, M. Wong, Y. Fu, F. Wu, J.S. Speck, U.K. Mishra, “Growth andElectrical Characterization of N-face AlGaN/GaN Heterostructures”, Jap.J. of Appl. Phys., Vol. 4, No. 49, 2005.
119. S. Rajan, “Advanced Polarization Engineering for GaN-based Transistors”,Ph.D. Dissertation, University of California Santa Barbara, 2006.
120. G.H. Jessen, R.C. Fitch, J.K. Gillespie, G. Via, A. Crespo, D. Langley, D.J.Denninghoff, M. Trejo, E.R. Heller, “Short-Channel Effect Limitations onHigh-Frequency Operation of AlGaN/GaN HEMTs for T-Gate Devices”,IEEE Trans. Elec. Dev., Vol., No. 2007.
121. K. Shinohara, A. Corrion, D. Regan, I. Milosavljevic, D. Brown, S. Burn-ham, P.J. Willadsen, C. Butler, A. Schmitz, D. Wheeler, A. Fung, M. Mi-covic, “220 GHz ft and 400 GHz fmax in 40-nm DH-HEMTs with Re-grownOhmic”, International Electron Devices Meeting, San Francisco, CA 2010.
122. G. Li, T. Zimmermann, Y. Cao, C. Lian, X. Xing, R. Wang, P. Fay, H.G.Xing, D. Jena, “Threshold Voltage Control in Al0.72Ga0.28N/AlN/GaN HEMTsby Work-Function Engineering”, IEEE Elec. Dev. Letts., Vol. 31, No. 9,2010.
123. F. Capasso, S. Sen, F. Beltram, A.Y. Cho, “Resonant Tunneling Gate FieldEffect Transistor”, IEE Elec. Lett, No. 5, Vol. 23, 1987.
124. Y. Pei, S. Rajan, M. Higashiwaki, Z. Chen, S.P. DenBaars, U.K. Mishra, “Ef-fect of Dielectric Thickness on Power Performance of AlGaN/GaN HEMTs”,IEEE Elec. Dev. Lett. No. 4, Vol. 30, 2009.
125. Y.C. Chou, R. Lai, G.P. Li, J. Hua, P. Nam, R. Grundbacher, H.K. Kim, Y.Ra, M. Biedenbender, E. Ahlers, M. Barsky, A. Oki, D. Streit, “InnovativeNitride Passivated Pseudomorphic GaAs HEMTs”, IEEE Elec. Dev. Lett.No. 1, Vol. 24, 2003.
142

126. R. Coffie, “Characterizing and Suppressing DC-to-RF Dispersion in Al-GaN/GaN High Electron Mobility Transistors”, Ph.D. dissertation, Uni-versity of California Santa Barbara, 2003.
127. J.C.M. Hwang, “Relationship between gate lag, power drift, and powerslump of pseudomorphic high electron mobility transistors”, Sol. Stat. Elec.,Vol. 43, pp. 1325-1331, 1999.
128. L. Shen, “Advanced Polarization-Based Design of AlGaN/GaN HEMTs”,Ph.D. Dissertation, University of California, Santa Barbara, 2004.
143

CHAPTER 7
SUMMARY AND FUTURE WORK
7.1 Summary of this work
This work has sought to develop and advance GaN-based HEMT technology
through the ultra-thin barrier AlN/GaN HEMT along with some novel deriva-
tives. Furthermore, several methodical adaptions have been developed as theo-
retical contributions which assist to better understand the various aspects of the
AlN/GaN HEMT.
The work in Chapter 2 laid the foundation for the design of several detailed
points of the AlN/GaN HEMT. An ultra-shallow pre-metallization etch was de-
veloped for the reduction of Rc. This method allowed the reduction of contact
resistance down to ∼0.3 Ω-mm, the lowest values for post-growth processed con-
tacts. A variety of gate insulators were investigated and their performance was
gauged by several standard metrics. In particular, Terman’s high frequency C-V
method for Dit extraction at the oxide/semiconductor interface was adapted for
the heterojunction capacitor and applied to the oxide/AlN/GaN heterostructure
capacitors under comparison. It was found that a high Dit was determined for
as-deposited films.
A gamut of insulated-gate AlN/GaN HEMT experiments were carried out and
in the process, several records were set for different performance metrics. In partic-
ular, the highest drain current density at the time of its inception of 2.3 A/mm by
144

a GaN-based HEMT was obtained by the AlN/GaN HEMT. The off-state break-
down voltage for the ultra-thin barrier AlN/GaN HEMT was extended to 96V by
the employment of an ALD Ta2O5 gate dielectric. A question that has persisted
regarding the maximum theoretical drain current density of the AlN/GaN HEMT
was addressed. Given such high 2DEG density with an accompanying high mobil-
ity, it can be calculated the a maximum drain current density well above 4 A/mm
is theoretically obtainable, yet no such current has been shown. The gradual chan-
nel approximation has been adapted for the insulated-gate AlN/GaN HEMT with
the inclusion of two practical mechanisms, that of contact resistance and electron
velocity saturation. It was shown that both mechanisms working together may
act to reduce drain current to the level achieved in the presented devices.
A simple lumped-element small signal model was developed based on con-
ventional FET circuit topology which allowed the modeling and de-embedding
of selected parameters from the measured S-parameters. It was found that the
removal of the pad impedance from the S - Z parameters yielded a 10 - 15 GHz
increase in unity current gain, ft. Accompanying the small signal modeling, de-
lay analysis was performed on the AlN/GaN HEMT based off Moll’s method. It
was found that the RC charging time of the gate-to-channel capacitances was the
dominant delay for AlN/GaN HEMTs. The results were compared to those of the
AlGaN/GaN HEMT. Furthermore, a conjoined method utilizing the Y-subtraction
de-embedding procedure to remove modeled extrinsic parameters allowed the ap-
proximation of effective electron velocity in the channel and was found to be ∼1.18
× 107 cm/s for the AlN/GaN HEMT in agreement with values reported in liter-
ature for its contemporary, the AlGaN/GaN HEMT. Points of improvement were
highlighted based on the given analysis.
145

A temporary digression from the AlN/GaN HEMT was made in Chapter 5 with
a specially designed test structure that was used to monitor trapped charge in a
SiN passivation layer for a conventional AlGaN/GaN HEMT. Negative threshold
voltage shifts of MIS gates within the gate-drain access region after bias-stressing
the HEMTs was observed and indicated the occurrence of either electron de-
trapping or hole trapping. A qualitative model was developed for the mechanism
involved which suggested hole trapping was cause based on gate current measure-
ments following Chynoweth’s model.
Finally, several multi-heterostructure devices were designed based off quali-
tative performance goals and corresponding proof-of-concept devices were fabri-
cated. A set of samples that explored an Al0.13GaN back barrier were fabricated
and analyzed. These device structures were the first of their kind. Additionally, a
multi-heterostructure dual-channel AlN/GaN HEMT was designed and fabricated
with the aim to exploit the ultra-thin barrier structure for increased drain current
density and mitigation of RF-DC dispersion.
The evolution from improved component design of the AlN/GaN HEMT to
the sophistication of multi-heterostructure based devices has been demonstrated.
From in-depth examinations of various aspects of the ultra-thin AlN/GaN HEMT
its potential has been emphasized and several records have been set in the pro-
cess. Moreover, several novel designs that utilize the AlN/GaN HEMT have been
proposed and realized. All of which have contributed to the advancement of III-
Nitride HEMT technology based on the extraordinary AlN/GaN HEMT structure.
146

7.2 Future work
The HEMT devices in this work show some of the best operation in terms
of standard performance metrics, or are the first of their kind. However, there
are many issues that burden the AlN/GaN HEMT from obtaining its theoretical
capabilities. Despite ohmic contact resistance as low as ∼0.2 - 0.5 Ωmm, achieved
through ultra-shallow pre-metallization etching, the formation of low resistance
ohmic contacts to AlN/GaN heterostructures remains difficult. As shown through
the GCA modeling of the AlN/GaN HEMT in Chapter 3, contact resistance is a
major factor in reducing transconductance and subsequently extrinsic frequency
performance. Recently, researchers at HRL demonstrated extremely low contact
resistance of 0.05 Ωmm to AlN/GaN heterostructures through an n+ regrowth
[129]. This method may be one of the better avenues for low contact resistance
but sacrifices processing simplicity. Ion implanting, advanced lithography and
etching techniques, as-grown n+ caps, and so on are all methods which have yet
to be tried and may offer other ways to reduce contact resistance for the AlN/GaN
HEMT.
The variety of options for dielectrics used for gate insulation is growing and
some have more favorable properties than others for the use in gate insulation
of the AlN/GaN HEMT. Atomic layer deposition of dielectrics has proven to be
convenient and produce high quality oxides. Very little has been explored in the
way of improvement of the oxide-semiconductor interface or the bulk oxide itself
by post-deposition thermal annealing. It is anticipated that vast improvements
may be made to the HEMT’s charge control and thereby transconductance and
frequency performance simply by removing or controlling the interfacial charge
states or mobile oxide charge in the layer structure.
147

Power performance of AlN/GaN HEMTs is as of yet unexplored. The pre-
dominant reason for this is the premature breakdown due to gate insulator failure
typically observed in these ultra-thin barrier HEMTs. However, there is ample
reason to pursue the advancement of power performance through the AlN/GaN
HEMT since the heterostructure has demonstrated that it can generate the high-
est mobile 2DEGs of any single heterostructure in any III-V system, and therefore,
potentially provide the highest current density of them as well. Several issues need
to be address in order to enable the AlN/GaN HEMT to be applicable for power
FET applications.
The application of field plated gates to the AlN/GaN HEMT are as of yet
unexplored. While some measure of frequency performance is given up when a
metallurgical gate extension is included, it is conceivable that for these ultra-thin
barrier AlN/GaN HEMTs there is ample frequency bandwidth to sacrifice as a
trade-off for improved power performance through increasing off-state breakdown
voltage by field plate design.
Terman’s method was developed for the oxide/heterojunction III-Nitride ca-
pacitor in Appendix A and applied to the oxide/AlN/GaN capacitor stack in
Chapter 2. The method allows for the extraction of the Dit spectrum provided
band discontinuities are well known and all other charge is accounted for. How-
ever, a number of caveats remain. Only a single sub-band was assumed in the
derivation which will lead to some error for high charge densities. Conduction
band non-parabolicity was not considered but is a likely occurrence for 2DEGs
since their associated energy level is further away from the conduction band edge.
Band non-parabolicity accounts for the softer “rolling off” of the C-V curve as
the 2DEG begins to deplete. Therefore, not accounting for band non-parabolicity
148

causes an increased ∆VGS and subsequently an over estimation of Dit near the
conduction band edge for sufficient non-parabolicity.
Termination of the AlN crystal leaves dangling surface bonds and a termination
of the assumed infinite periodic potential at the crystal boundary which has been
shown to cause increased surface state density near band edge [130] which can
amount to a band gap reduction. This mechanism has not been accounted for. A
reduction in barrier band gap, Eg, can occur for pseudomorphically-strained layer
structures [131] but is not included in the derivation given in Appendix A since
it amounts to a simple scaling of Eg and subsequently, ∆Ec. However, it is noted
that this is an important aspect to consider depending on the hetero-system under
analysis and by not taking energy barrier reduction into account, the result can
lead to misleading values in corresponding energy for the Dit spectrum. This is
particularly true for the III-Nitride system.
Regarding the noted improvements that may be had with the modification of
Terman’s method, it is noted that the development of the method does not ac-
count for the reality of the Fermi-Dirac (F-D) distribution of states to spread with
temperature. The development as given essentially “collapses” the F-D distribu-
tion to the Fermi level. Therefore, an artificial spreading of the trap distribution
occurs due to the mathematics in the method not accounting for this thermal dis-
tribution spreading of states. Therefore, this suggests that C-V measurements at
cryogenic temperatures be taken on the oxide/AlN/GaN heterostructure capaci-
tor to impose the condition on the system that more closely matches the assumed
mathematical distribution.
Surface state charging leading to current collapse and power slump is a partic-
ularly pressing issue with these ultra-shallow channels. Considering the feasibility
149

of fabricating AlN/GaN HEMTs with barriers as thin as 1.5 nm, and recalling the
propensity of the electron wave function to tunnel through thin barriers as well
as the proven generation of hot electrons in GaN channels, a question becomes
apparent of the possibility that these ultra-thin channel HEMTs may inherently
be inferior for power performance applications where high frequencies are also
required. The possibility that the high density 2DEG can efficiently communi-
cate with trap states at the AlN surface and act as a source of charge for those
traps may be to the HEMT’s own demise if the AlN surface can not be effectively
passivated. No theoretical consideration has been done along these lines of consid-
eration and may serve as part of the answer to this question. Although experiment
is the best final judge, to which the device structure proposed in Chapter 5 applied
to the AlN/GaN HEMT would be an ideal method for measuring such an effect.
Finally, regarding the development of the gradual channel approximation for
the AlN/GaN HEMT, the intrinsic region as it is analyzed in the given work is
taken only as a single region where the approximation is held valid. However,
this is certainly not a realistic picture and is likely in gross error for GaN-based
HEMTs, in particular. Since GaN may sustain such large electric fields before
critical breakdown, the intrinsic depletion region becomes very exaggerated near
the drain edge of the gate where the highest intensity fields exist. In this region,
all mobile charge is nearly depleted and fixed ionization centers are filled, thus
making the mathematics follow Laplace’s equation closer than Poisson’s equation.
Grebene and Ghandhi showed that the solution in this region is the linear super-
position of hyperbolic cosine functions when their fixed ionized donors were left
[132]. The picture for GaN channels differs in that the depletion region is the same
region responsible for conduction of current at the onset of the saturated current
150

characteristic (i.e. pinch-off) rather than the un-depleted portion of the channel
responsible in the doped-channel MESFET. Based on this consideration it would
be an interesting problem to see the effect of solving Laplace’s equation in the
depleted yet conducting region of a GaN channel. Furthermore, a question arises
based off the considerations of electron velocity saturation, that of the possibility
that channel pinch-off occurs before the onset of velocity saturation and not simul-
taneously as Shockley assumed. This may lead to a better understanding of the
I-V characteristic in the transition region between the low-field (linear) operation
regime and the high-field (saturated) regime.
7.3 Chapter 7 cited literature
129. A.L. Corrion, K. Shinohara, D. Regan, I. Milosavljevic, P. Hashimoto, PlJ.Willadsen, A. Schmitz, D.C. Wheeler, C.M. Butler, D. Brown, S.D. Burn-ham, M. Micovic, “Enhancement-Mode AlN/GaN/AlGaN DHFET with 700mS/mm gm and 112 GHz ft”, International Workshop on Nitride Semicon-ductors, 2010.
130. C. Kittel, Introduction to Solid State Physics ; 8th ed., John Wiley and Sons,New Jersey, 2005.
131. B.K. Ridley, W.J. Schaff, L.F. Eastman, J. Appl. Phys. 94, 3972, 2003.
132. A.B. Grebene, S.K. Ghandhi, “General theory for pinched operation of thejunction-gate FET”, Sol. Sta. Elec., vol. 12, pp. 573-589, 1969.
151

APPENDIX A
THE HETEROJUNCTION CAPACITOR;TERMAN’S METHOD
Terman’s method for the determination of interface-state trap density spec-
trum is adapted here from its original application (oxide/semiconductor junction)
[133] to one applicable to the polarization-doped insulator/AlN/GaN layer struc-
ture. A few points are worthy of mention as a preface for the derivation given
below. Terman’s method is a high-frequency C-V technique that hinges on the
trap time constant being too slow to respond to the ac voltage signal that rides on
the dc voltage sweep. Rather, the dc sweep voltage is adequately slow for the trap
to populate or de-populate. Therefore, the interfacial trap charge manifests itself
by a “smearing” of the C-V curve within the depletion zone as the trap states are
(de)populated when the fermi level is swept through the trap state energy (via
capacitor plate voltage, VGS). It is necessary, then, to have a foreknowledge of
the C-V operation of the structure if it were completely absent of any traps (such
a condition is considered “ideal”) in order to quantify the C-V smearing. Such is
the foundation of the method. This also imposes the constraint, that any trapped
charge that is extracted from the measurement is inherently below the ac signal
frequency. Therefore, traps that have a response time faster than this ac signal
frequency cannot be measured by Terman’s method. Interfacial trap states may
be donor or acceptor like. A donor-like trap is one in which the removal of an
electron from the state causes the state to become neutral or positively charged.
152

An acceptor-like trap is one in which the capture of an electron results in the state
becoming neutral or negatively charged.
A primary assumption is made in the following derivation, that all trapped
charge occurs from trap states at the insulator/AlN interface. This assumption
is fair considering the III-Nitride terminal surface is laden with dangling atomic
bonds as well as a surface polarization charge density. However, it is reasonable
that the insulator may also have trap states dispersed throughout it as well with
an unknown distribution. Terman’s method handles these traps by imaging any
such insulator trapped charge to the insulator/AlN interface. The same goes for
traps in the buffer layer.
The following development includes four parts. First, the ideal heterojunction
capacitance configuration is found (A.1.1) followed by the capacitance configura-
tion including trap states (A.1.2). The form for Dit is then given (A.2) and lastly,
a few remarks regarding the extent of the Terman methodology (A.3).
A.1 Capacitance-Voltage Relationship
The capacitance-voltage functionality of the dielectric/heterojunction capaci-
tor may be understood by employing the charge control model within the gated
region and considering the charge distribution shown in Fig. B.2. The voltage loop
equation (2.3) remains the same and the additional charge manifests itself through
the voltage-electric field relationship. By charge neutrality Qπnet = Qπ
AlN − QπGaN
and Qm = QπAlN + Qπ
net + Qit + Qw. Qπnet is the net polarization charge at the
AlN/GaN interface. QπAlN is the fixed polarization (spontaneous + piezoelectric)
charge of the AlN cap strained to the GaN lattice and QπGaN is the fixed polariza-
tion (spontaneous) charge of the GaN. The charge on the metal, Qm, is the metal’s
153

response to maintain charge neutrality and therefore is equal to the sum of charge
in the structure. Qw = −qns is the charge associated with the 2DEG and Qit is
the charge associated with the interfacial traps. Recalling the definition of capac-
itance (C = ∂Q/∂V ) it is noted that the total capacitance of the structure will be
the change in (image) charge on the metal gate, Qm, with respect to the change
in applied voltage, VGS. Given the above charge equations the magnitudes1 of
the local electric fields may be found by Gauss’ law and the associated boundary
conditions at the respective interfaces. The fields may be written in terms of the
charge on the metal following,
Fox =−Qm
εox, (A.1)
FA =QπAlN −Qit +Qm
εA(A.2)
The charge control equation, Eq. (2.3), may be written including terms of the
local electric fields in each layer
−VGS +
(ΦB + ΦoA −
∆Ecq
)+ kTηw −
Qm
εoxtox −
(QπAlN −Qit +Qm)
εAtAlN = 0,
(A.3)
where all quantities were previously defined and ηw = (EF − EC)/kT is the local
field normalized to kT that accounts for the conduction band bending which forms
the quantum well. The Fermi level deep in the GaN layer is taken to be held at
a voltage, VS. Grouping like capacitive terms and re-writing Eq. A.3,
−VGS +
(ΦB + ΦoA −
∆Ecq
)+ kTηw −
(QπAlN −Qit +Qm)
CA− Qm
Cox= 0. (A.4)
1The electric fields, F, are vector quantities but are written here simply as magnitudes sincethe vertical direction is inferred by the structure under analysis.
154

Figure A.1. Band diagram including interface trap states.
In this form the derivative with respect to VGS may be applied which allows the
determination of the capacitive relationship of the structure.
A.1.1 Ideal capacitive structure (Qit = 0)
Considering first, the ideal case where no trapped charge exists (Qit = 0),
taking the derivative of Eq. A.4 with respect to VGS gives
−1 +∂
∂VGS(kTηw) +
(1
CA+
1
Cox
)∂Qm
∂VGS= 0. (A.5)
Since Qm reflects the total charge involved with the heterostructure, it is reason-
able that the total capacitance of the structure is the derivative of Qm with respect
155

to VGS. The question follows, what does the ∂η/∂V term reflect in the structure?
CT =∂Qm
∂VGS(A.6)
∂
∂VGS
kTηwq
=1
q
∂(kTηw)
∂Qm
∂Qm
∂VGS. (A.7)
Following Eq. A.7 the derivative may be separated as shown above. It may be
further simplified by recalling the charge equality of Qm,
q
kT
∂Qm
∂ηw=
q
kT
∂
∂ηw(Qπ
G + qns) =q
kT
∂(qns)
∂ηw= CQ, (A.8)
where CQ is referred to as the “semiconductor” or “quantum” capacitance [134]
and is the response of the charge in the semiconductor due to a change in local
potential (ηw). Therefore, the outcome of the unknown capacitance of Eq. A.7 is
found to be
∂(kTηw)
∂VGS=CTCQ
, (A.9)
and finally an equation for the entire heterostructure without trapped charge may
be gained from the application of Eq. A.9 after some re-arranging and is found to
be
1
CT=
1
Cox+
1
CAlN+
1
CQ(A.10)
where CT is the total structure capacitance, Cox is the fixed oxide capacitance,
CAlN is the fixed AlN capacitance, and CQ is the quantum capacitance as de-
fined previously. It is apparent from Eq. A.10 that without trapped charge the
heterostructure capacitance is simply the series combination of capacitances asso-
ciated with each layer in the structure, which is to be expected.
156

A.1.2 Capacitive structure including interface traps (Qit 6= 0)
Considering the case where an interfacial trapped charge distribution exists at
the insulator/AlN interface. It is further assumed that no charge (mobile or fixed)
exists in the insulator. By imposing the derivative with respect to VGS as before,
the following capacitive relation results
−1 +kT
q
∂ηw∂VGS
+
(1
Cox+
1
CA
)CT +
1
CA
∂Qit
∂VGS, (A.11)
where again CT = ∂Qm/∂VGS is the total structure capacitance. Considering the
derivative ∂ηw/∂VGS and expanding,
∂Qm
∂VGS
∂(kT/q)ηw∂Qm
= CT∂(kT/q)ηw
Qm
. (A.12)
Recalling Qm = QπG − qns −Qit further expansion gives
∂
∂Qm
(kT/q)ηw =∂(kT/q)ηw
∂QπG︸ ︷︷ ︸
=0
+∂(kT/q)ηw
∂qns︸ ︷︷ ︸=1/CQ
+∂(kT/q)ηw
∂Qit
, (A.13)
where the first bracketed term falls out and the second is equal to 1/CQ. This
gives the desired relationship
∂(kT/q)ηw∂VGS
= CT
(1
CQ− ∂(kT/q)ηw
∂Qit
), (A.14)
157

Similarly, considering the derivative ∂Qit/∂VGS by expanding it,
∂Qit
∂Qm
∂Qm
∂VGS=∂Qit
∂Qm
CT
→ ∂Qm
∂Qit
=∂Qπ
G
∂Qit
+∂(qns)
∂Qit
− ∂Qit
∂Qit
=∂qns∂Qit
− 1
=∂(qns)
∂(kT/q)ηw
∂(kT/q)ηw∂Qit
− 1 (A.15)
where ∂(qns)/∂(kT/q)ηw = CQ. Therefore, the resulting capacitive relationship
results
∂Qit
∂VGS= CT
(CQ
(kT/q)ηw∂Qit
− 1
)−1. (A.16)
The unknown term links the local potential in the GaN well to the population of
trapped charge at the insulator/AlN interface. In other words, it is the 2DEG’s
response to the addition of the trapped charge density, Qit, at the insulator/AlN
interface. It may be understood by reconsidering the voltage loop between the
energy level of the trap state and the Fermi level within the well. As can be seen
in Fig. B.2 the voltage loop equation follows,
(Eit − EF,i)− qEAlN tAlN −∆Ecq
+ (EF,w − EC,w) = 0
→ ηit =EAtAkT
+∆EcqkT
− ηw + Eo (A.17)
where ηit = (Eit − EF )/kT is the local change in potential normalized to kT at
the insulator/AlN interface, EF,i is the Fermi level at the insulator/AlN interface,
Eit is the interface reference energy level, EF,w is the Fermi level in the quantum
well, and Ec,w is the conduction band energy in the GaN quantum well. By setting
Eit = EC,A then EF will be allowed to sweep through the top of the AlN conduction
band through any trap states at and below EC,A. Although in practical terms, the
158

range in which EF is swept through the barrier specifically will be only a fraction
of the full band gap. This is due to Fermi level pinning deep within the buffer
layer, limitations of EF,i sweep when ns → 0 for wide Eg semiconductors, as well
as electric field limitations the barrier layer(s) are able to sustain. Including the
trapped charge the field in the AlN, EAlN tAlN , is given by (QπA − Qπ
G − qns)/εA
and the derivative may be taken,
∂ηit∂ηw
= − 1
CA
∂qns∂kTηw
− 1 = −(
1 +CQCA
)(A.18)
which leads to the simplification of Eq. A.16
∂Qit
∂(kT/q)ηw= Cit
∂ηit∂ηw
= −Cit(
1 +CQCA
)→ ∂Qit
∂VGS= CT
(1
CQ( 1−Cit(1+CQ/CA)
)− 1
), (A.19)
where Cit is the capacitance associated with the (dis)charging of the interface
traps. The other term in Eq. A.11 that is under question may similarly be
considered,
∂(kT/q)ηw∂VGS
= CT
(1
CQ− ∂(kT/q)ηw
∂Qit
)= CT
1/CitCQ1/Cit + (1/CA + 1/CQ)
. (A.20)
159

Finally, Eq. A.11 describing the total capacitance may be re-written with the
above results included to yield
− 1 + CT1/CitCQ
1/Cit + (1/CA + 1/CQ)+
(1
Cox+
1
CA
)CT
− CTCA
Cit
Cit + (CQCA
CQ+CA)
= 0 (A.21)
Solving for the total capacitance of the system, CT , including trapped charge, and
after some algebraic manipulation CT may finally be written in a form that may
be easily interpreted,
1
CT=
(1
Cox+
1
Cit + ( 1CA
+ 1CQ
)−1
)(A.22)
This form shows the capacitance configuration of the system including trapped
charge at the insulator/AlN interface. It can be seen that CA and CQ are se-
ries connected and subsequently in parallel with the trap capacitance, Cit. This
capacitance block is finally in series with the oxide capacitance, Cox. This configu-
ration is reasonable in that if no traps were present (Cit → 0) the series connected
capacitance configuration of Eq. A.10 would result.
A.1.3 Quantum capacitance
The capacitances associated with the thin films (Cox and CA) are fixed since
their electronic boundaries are fixed for all VGS. However, the “quantum” or
“semiconductor” capacitance of the system is a strong function of VGS through
the normalized potential of the GaN QW, ηw. The functional form of the quantum
capacitance may be found by considering the quasi-2D charge distribution within
160

the GaN quantum well as given by Eq. 2.2 and taking the derivative, ∂ns/∂ηw as
shown below
∂ns∂ηw
=qNeff
kT
∂
∂ηw[ln(1 + eηw)]→ CQ(ηw) =
qNeff
kT
(1
1 + e−ηw
)(A.23)
whereNeff = m∗kT/π~ is the effective conduction band density of states assuming
single subband population in the quasi-2D system. This is the functional form
with respect to ηw which is used in combination with the derivation above. If
desired, the quantum capacitance may be re-casted as a function of VGS through
the VGS − ηw relationship given by the CCE in Eq. A.4.
A.2 Terman’s method for Dit determination
The method Terman proposed was to compare an “ideal” capacitor (i.e. band
discontinuities known, no extraneous fixed charge, no traps, etc.) which is achieved
through modeling the structure, to the measured equivalent capacitor laden with
interfacial traps. The comparison is made through the difference in the measured
and ideal C-V curves. This can be seen by taking the derivative of Eq. A.4 with
respect the normalized energy, ηit,
∂VGS∂ηit
− kT
q
∂ηw∂ηit− 1
CA
∂Qit
∂ηit−(
1
CA+
1
Cox
)∂Qm
∂ηit= 0 (A.24)
where several of the quantities have already been found and are stated again for
161

convenience,
∂ηw∂ηit
=−1
1 + CQ/CA(A.25)
∂Qit
∂ηit=kT
qCit (A.26)
and the quantity, ∂Qm/∂ηit can be found by the derivative separation,
∂Qm
∂ηit=∂qns∂ηit
− ∂Qit
∂ηit= −∂Qit
∂ηit+∂qns∂ηw
∂ηw∂ηit
= −kTqCit +
kT
qCQ
(−1
1 + CQ/CA
). (A.27)
Putting these equalities together, Eq. A.24 can be re-written in terms of the
constituent capacitances and re-arranged to yield a relationship for the capacitance
associated with the interfacial trapped charge, Cit,
∂VGS∂ηit
=kT
q
(CitCox
+1
1/CQ + 1/CA(
1
Cox+
1
CA+
1
CQ)
)→ Cit =
q
kTCox
∂VGS∂ηit
− Cox1/CQ + 1/CA
(1
Cox+
1
CA+
1
CQ
)(A.28)
The capacitance difference can be written,
Cit − Cit|ideal =q
kTCox
(∂VGS,meas∂ηit
− ∂VGS,ideal∂ηit
), (A.29)
where it is assumed that ηit in both the measured and ideal systems are identical.
The relationship between capacitance and density of charge states (D = C/q2)
162

can be derived from the Cit difference and is written as
Dit =CoxqkT
∂∆VG∂ηit
∣∣∣Cmeas=Cideal
(A.30)
where ∆VG = VGS,meas − VGS,ideal taken at a common capacitance. Since ηit is
not a measurable quantity, it may be found through the relationship given by Eq.
A.4 which is a function of the measurable quantity, VGS. The form of Dit in Eq.
A.30 has a distinct likeness to that of the SiO2/Si system [135] with the exception
that the derivative is with respect to the normalized local potential, qηit, which is
spatially displaced from the mobile 2DEG.
A.3 Discussion of Terman methodology
Terman’s method to measure interface trap density (Dit) of the SiO2/Si sys-
tem has been adapted for a multilayer heterojunction capacitor as given above.
The keystone principle behind the method is to compare the measured C-V char-
acteristic of the real structure to the C-V character of an electronically ideal (no
unknown or unintentional charge) structure with the same layer properties. The
comparison is made through the derivative of the difference in voltage values that
correspond to the same capacitance, with respect to the local potential, η.
A few comments are worthy of mention regarding the intricacies of Terman’s
method. It is noted the energy scale that corresponds with Dit depends on barrier
height and band offsets and thus, accurate values of these material parameters
are necessary for the estimation of ηit with respect to VGS. Inaccuracies in these
quantities result in errors in the corresponding energy of the interface states. If
an inaccuracy in band alignment occurs or fixed charge exists in the oxide the
measured C-V will deviate by a simple shift in voltage. This will have no effect
163

on the calculation of Dit since the derivative of the difference will differentiate out
any simple voltage shift. However, if there are trap states distributed throughout
the oxide layer, Terman’s method accounts for this charge by “imaging” it to the
interface. This will lead to an over estimation of Dit. For a “pure” oxide without
imbedded trap states, this issue does not exist. It is assumed in the derivation that
the oxide/AlN interface is dominantly responsible for charge trapping given the
density of inhomogeneous atomic bonding of the crystalline surface with the oxide.
If there is mobile oxide charge present, this will also cause a skewing of the C-V
which will be interpreted as interfacial traps, further causing an overestimation
of Dit. It has also been argued at length that Terman’s method becomes too
inaccurate for Dit below 1010 cm−2eV −1 dictated by resolution limitations of the
test equipment [135]. While this may be true, the use of deposited, non-annealed
oxides in this work has led to Dit values far in excess of the claimed lower limitation
and therefore are believed to be true.
Considering the current theory that III-Nitride crystals have the property of a
dominant surface donor state [136] there exists the propensity of the Terman anal-
ysis to track the donor states as one of the interface states. A typical occurrence
when extracting Dit is an abrupt increase in the trap density near the band edges.
This character arises from two potentially indistinguishable mechanisms that are
both ultimately due to charge that is not accounted for in the ideal structure but
manifested in the C-V curve. The first being the sensing of the thermal popula-
tion of charge in the conduction band at the oxide/semiconductor interface that
occurs due to thermal spreading. Secondly, an increase in surface state density
occurs within the band gap due to the termination of the periodic crystal at the
surface [137]. Such states can have higher densities near the band edges and will
164
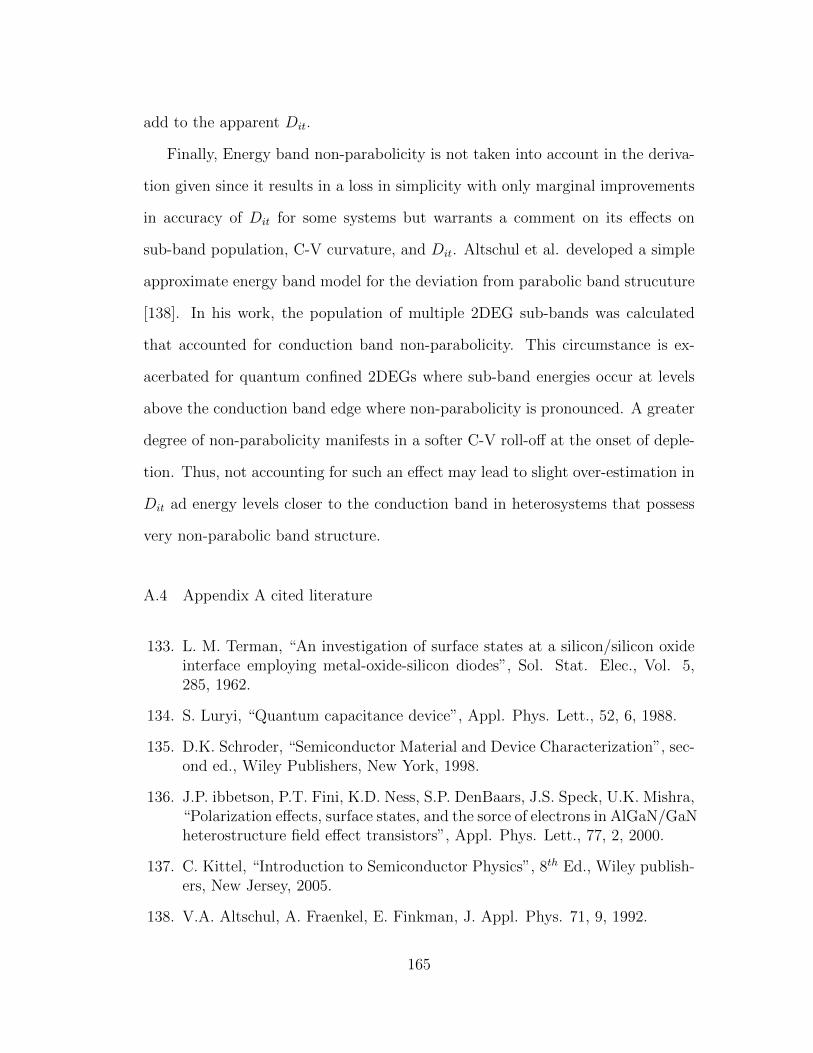
add to the apparent Dit.
Finally, Energy band non-parabolicity is not taken into account in the deriva-
tion given since it results in a loss in simplicity with only marginal improvements
in accuracy of Dit for some systems but warrants a comment on its effects on
sub-band population, C-V curvature, and Dit. Altschul et al. developed a simple
approximate energy band model for the deviation from parabolic band strucuture
[138]. In his work, the population of multiple 2DEG sub-bands was calculated
that accounted for conduction band non-parabolicity. This circumstance is ex-
acerbated for quantum confined 2DEGs where sub-band energies occur at levels
above the conduction band edge where non-parabolicity is pronounced. A greater
degree of non-parabolicity manifests in a softer C-V roll-off at the onset of deple-
tion. Thus, not accounting for such an effect may lead to slight over-estimation in
Dit ad energy levels closer to the conduction band in heterosystems that possess
very non-parabolic band structure.
A.4 Appendix A cited literature
133. L. M. Terman, “An investigation of surface states at a silicon/silicon oxideinterface employing metal-oxide-silicon diodes”, Sol. Stat. Elec., Vol. 5,285, 1962.
134. S. Luryi, “Quantum capacitance device”, Appl. Phys. Lett., 52, 6, 1988.
135. D.K. Schroder, “Semiconductor Material and Device Characterization”, sec-ond ed., Wiley Publishers, New York, 1998.
136. J.P. ibbetson, P.T. Fini, K.D. Ness, S.P. DenBaars, J.S. Speck, U.K. Mishra,“Polarization effects, surface states, and the sorce of electrons in AlGaN/GaNheterostructure field effect transistors”, Appl. Phys. Lett., 77, 2, 2000.
137. C. Kittel, “Introduction to Semiconductor Physics”, 8th Ed., Wiley publish-ers, New Jersey, 2005.
138. V.A. Altschul, A. Fraenkel, E. Finkman, J. Appl. Phys. 71, 9, 1992.
165

APPENDIX B
DERIVATION OF CURRENT-VOLTAGE CHARACTERISTICS OF THEAlN/GaN HEMT BY GRADUAL CHANNEL APPROXIMATION
B.1 Linear I-V functionality
Considering the 3 dimensional block of unintentionally doped GaN that com-
prises the channel immediately below the gate region in Fig. B.1, Ohm’s law may
be employed as the foundation for current flow functionality. Knowing electric
field is equal to the gradient of potential, Ohm’s law1 (J = σF ) can be integrated
along the channel
JLg = −qµ∫ VD
VS
ns dV, (B.1)
where J is the electron current flux (per unit gate width) passing through the plane
of width, Wg, Lg is the length of the channel immediately below the gate (or gate
length) and ns is the 2 dimensional current carrying electron charge density within
the channel. The mobility, µ, is assumed to be constant with depth (y-direction)
although in reality the scattering mechanisms involved in determining the effec-
tive mobility differ with depth and cause the mobility to be depth-dependent.
Nonetheless, the assumption of a constant mobility greatly reduces complexity in
the derivation with little loss of accuracy in the overall product. The electron flux
is a vector quantity as is the the differential, dV. For simplicity, these quantities
will from here on assume no special vector designation since the directions are
1Some clarity may be gained in the following derivation through the expansion of Ohm’s lawby the Drude model: J = (q2nτ/m∗)F .
166

Figure B.1. Illustration of the active region in a HEMT where the GCAapplies. External resistances are included to depict the quasi-circuit
under consideration.
understood. Furthermore, the current density is taken as the opposite direction
as the electron flux and therefore Eq. B.1 will written as a positive quantity.
The charge in the channel is a function of the voltage applied to the gate
metal above. The charge-potential relationship may be found through Poisson’s
equation, 52V = ρ/ε. The equation contains 3D dependency of potential on
charge but may be reduced to a 1D dependency by imposing two conditions,
1. charge is constant along the width of the gate (z-direction).
2. the change in electric field vertically (y-direction), which is responsible for
the confinement of the 2D channel charge, is much larger than along the
channel (∂F/∂y >> ∂F/∂x) and thus,
∂2V
∂x2+∂2V
∂y2∼ ∂2V
∂y2
167

The second condition is well known as the gradual channel approximation [139],[140].
Imposing these conditions, Poisson’s equation reduces to
∂2V
∂y2=ρ
ε. (B.2)
From this form of Poisson’s equation the energy profile of the conduction band
taken vertically below the gate can be traced to yield a relationship between the
electric potential and charge that is given in section 2.1 by
−VG + ΦB + Vox + ΦoA − VAlN −∆ECq
+Eoq
+(EF − Eo)
q+ VS = 0, (B.3)
which may be rewritten in terms of the fields present in the heterostructure
−VGS +
(ΦB + ΦoA −
∆ECq
)+ Foxtox − FAtA +
Eoq
+(EF − Eo)
q= 0, (B.4)
where Eo is the energy of the lowest occupied sub-band and (EF − Eo) is the
difference in energy between the Fermi level and the lowest sub-band. Note that
the conduction band is taken as the zero-energy reference in this derivation. These
quantities may be found by an approximate solution to Airy’s equation for the
triangular well [142],[143],
Eo '(
9π~q2ns8εGεo
√8m∗
)2/3
, (B.5a)
EF − Eo =π~2
m∗ns. (B.5b)
The integration of the RHS of Ohm’s law requires the 2D charge density, n, to
168

Figure B.2. Band diagram of the insulated gate AlN/GaN HEMTshowing pertinent parameters used for the GCA.
169

be a function of the changing potential along the channel (V(x) due to VG, VS,
and VD). Equation B.4 can again be rewritten in terms of the charge involved in
creating the fields (Gauss’s law)
− VGS + V (x) +
(ΦB + ΦoA −
∆Ecq
)+QπAlN
Cox−Qnet
(1
Cox+
1
CAlN
)+ qns
(1
CAlN+
1
Cox+
π~qm∗
)+ (qns)
2/3
(9π~q
8εGεo√
8m∗
)2/3
= 0, (B.6)
where V(x) is the channel voltage that varies along the gate length, QG is the GaN
spontaneous polarization charge, and Qnet is the net polarization charge between
the strained AlxGaN layer and GaN where x = 1 for AlN. These charge densities
are given below, respectively
QπAlN = q(Psp + Ppz)AlN , (B.7a)
Qnet = QπAlxGaN = ∆Psp + 2
(e31(x)− e33(x)
c13(x)
c33(x)
)×(a(x)− aGaN
aGaN
). (B.7b)
For convenience, equation B.6, can be written −V (x) + VGS = α + βns + γn2/3s
so that the V(x)-ns functionality can be seen. Referring back to equation (B.1),
the current integral must be solved by integrating the charge in the channel by
the the differential voltage slice, dV , from the voltage at the source to the voltage
at the drain. This operation may be performed by first writing dV in terms of a
differential charge slice, dn. Therefore, differentiating equation B.6 with respect
170

to ns allows the desired transformation of the element, dV ,
d
dns[−V (x) + VGS = α + βns + γn2/3
s ]
−→ dV (x) = −dns(β + 2/3γn−1/3s ), (B.8)
which allows the re-writing of equation B.1
I =qµWg
Lg
[β
∫nsdns +
2
3γ
∫n2/3s dns
](B.9)
where β = q(1/Cox + 1/CA +π~2/m∗) and γ = (9π~q2/8εrεo√
8m∗)2/3. The upper
integration bound, which is given by the charge at the drain side of the gate set
up by VD, is given by a root of the third order polynomial (in ns) of equation B.6.
Performing this integration and re-inserting values for the place holders β and γ
the final form for the drain current can be written
IDS =qµWg
Lg
[q
2
(1
Cox+
1
CAlN+
π~qm∗
)n2s +
2
5
(9π~q2
8εG√
8m∗
)2/3
n5/3s
]ns,D
ns,S
.
(B.10)
The voltage functionality is contained in the ns terms through Eq. B.6. This I(ns)
relationship is for the linear region of the HEMT characteristic where channel
pinch-off has yet to occur and the gradual channel approximation remains valid.
It is assumed that at a specific voltage, Vknee, the lateral field below the gate
is sufficient to cause scattering-limited velocity saturation. In this condition any
additional voltage beyond Vknee, current is limited from increasing. In Silicon
technology the knee voltage is called the pinch-off voltage since drain depletion is
significant enough to “pinch off” the conduction channel. This voltage is defined
as VGS for which the charge density below the gate, ns = 0. Through equation
171

B.6 the knee voltage may be found,
Vknee = Vpo =
(ΦB + ΦoA −
∆ECq
)−Qnet
(1
Cox+
1
CAlN
)+QπAlN
CAlN. (B.11)
It is assumed that there is no parallel conduction (from residual buffer charge or
poor 2D confinement) or self-heating effects that occur such that there is neither
positive or negative drain conductance within the saturation regime. This assump-
tion forces a non-changing drain current with any additional drain voltage thereby
making IDS within the saturation regime constant. This a poor assumption that
forces an ideality on the saturated drain characteristics but allows the simplifica-
tion of the I-V functionality for ease of understanding fundamental physics behind
the HEMT.
B.2 Transconductance
Transconductance is defined by gm = ∂IDS/∂VGS at a fixed value of VDS usually
taken in the saturated current regime. Considering the scenario above where IDS
is a function of ns the derivative may be expanded as follows;
gm =∂IDS∂qns
∂qns∂VGS
=CGq
∂IDS∂ns
, (B.12)
where CG = ∂qns/∂VGS and was given by equation A.10 and takes the form,
CG = (1/Cox + 1/CA + 1/CQ)−1. The derivative of the current is easily found;
∂IDS∂ns
=qµWG
LG
(βns +
2
3γn2/3
s
), (B.13)
172

thus, making the transconductance
gm =µWG
LGCG
(βns +
2
3γn2/3
s
). (B.14)
Recalling β and γ the full form of the transconductance follows,
gm =µWG
LGCG
[q
2
(1
Cox+
1
CAlN+
π~qm∗
)ns +
2
3
(9π~q2
8εG√
8m∗
)2/3
n2/3s
]. (B.15)
The typical form the transconductance takes for HFETs and HEMTs as given in
Chapter 2 follows, gm = qvsatCG. Taking this in mind in combination with the
definition of current, J = qnsve, it can be seen that a charge-dependent velocity
term applicable in the linear regime of operation is present in the equation for
transconductance
ve =µWG
LG(βns +
2
3γn2/3
s ), (B.16)
which can be verified by considering the current density J = qnve where ∂J/∂qns =
ve which leads to
ve =∂J
∂qns=µWG
LG
(βns +
2
3γn2/3
s
), (B.17)
which shows agreement. Up until now it has been assumed that the velocity hits
a maximum (saturation velocity) without proof or reason. The following section
discusses the nature and implications of the occurrence of velocity saturation.
173

B.3 Current saturation
The scattering-limited velocity saturation approximation (SLVA) is given by
ve =µE
1 + µEvsat
, (B.18)
where vsat is the saturated electron drift velocity. The approximation seeks to
give a phenomenological explanation to the occurrence of electron velocity satura-
tion. Taking into account the SLV approximation in combination with the GCA
development given above, the current density may be written in compact form
J =qµns
∂V∂x
1 + µ∂V/∂xvsat
. (B.19)
By working out the integration for the current density by the same method as
shown above (Eq. B.10), the modified current density is found to be
JDS =qµ
Lg + µVDS
vsat
[q
2
(1
Cox+
1
CAlN+
π~qm∗
)n2s +
2
5
(9π~q2
8εG√
8m∗
)2/3
n5/3s
].
(B.20)
The inclusion of the SLVA introduces a scaling term (Lg + µVDS/vsat) which is
taken as a VDS-dependent “effective gate length” since it always adds to Lg an
amount determined from the electric field in the channel. Therefore, a saturated
electron velocity serves to reduce the drain current density by a proportion of VDS
and vsat while maintaining equivalent ns functionality as in the ideal form of Eq.
B.10.
The transconductance may be found in the same was as the development of
Eq. B.15. Again, using the definition of transconductance (gm = CG
q× ∂IDS/∂ns)
174

the SLVA-modified transconductance is written
gm =qµCg
Lg + µVDS
vsat
[q
2
(1
Cox+
1
CAlN+
π~qm∗
)ns +
2
3
(9π~q2
8εG√
8m∗
)2/3
n2/3s
].
(B.21)
The SLVA reduces the transconductance in the same way as it does the current
density JDS, by the scaling of the vsat-dependent effective gate length.
B.4 External resistance
External resistance acts to reduce the intrinsic voltage drop in the channel, thus
causing a reduced drain current as well as shifting the I-V characteristics so that
they occur at higher applied voltages (due to the imposed voltage division). The
internal voltages in the resistor-HEMT circuit: V intDS = V ext
DS−IDS(RS,a+RD,a) must
be found numerically. Since IDS is found by applying V intDS , the I-V relationship
cannot be written in closed form. Therefore, the values for V intD and V int
S are found
through an iterative calculation using the equations:
V intD = V ext
D −RD,aIDS, (B.22a)
V intS = V ext
S −RS,aIDS. (B.22b)
In this work, the Jacobi method for numerical calculation is used for a faster
convergence of intrinsic voltage values. The equations above are modified to take
the form
V intD = (1− α)V ext
D − αRD,aIDS, (B.23a)
175

V intS = (1− α)V ext
S − αRS,aIDS. (B.23b)
The damping term, α, is used to prevent the iterative calculation from swinging
to the extrinsic rail values and also forces a faster convergence on the intrinsic
voltage values. Once the internal source and drain voltages are known for given
external resistances, the three-terminal transistor functionality is obtained (along
with Vg).
The common lumped-element approach to extract intrinsic transconductance
functionality is through considering the HEMT as a two-element resistance/conductance
circuit (1/gext = RS + 1/gint) where g = 1/R such that the intrinsic/extrinsic re-
lationship may be written
gm,int =gm,ext
1 +RSgm,ext, (B.24)
where RS = RC + Ra,S, RC is the contact resistance of the source contact, and
Ra,S is the source access resistance due to the biased gate-to-source channel re-
gion. Typically, for GaN-based HEMTs RC >> Ra,S such that RS ' RC and is
especially true for the AlN/GaN HEMT given its very low sheet resistance and
high contact resistance.
B.5 Validity of the GCA
The condition that defines the GCA is that the change in potential energy along
the channel is much less than taken vertically through the structure (∂V/∂y >>
∂V/∂x) such that Poisson’s equation can be accurately approximated to a single
dimension in y. Therefore, the GCA remains valid along the gate up to the drain
176

depletion region under certain bias conditions. Under certain conditions (pinch-off
in current saturation) the requirement that a constant current flows from source
to drain (under constant on-state bias) requires that the electric field in the drain
region under the gate increases (laterally and vertically) such that the lateral
change in field is comparable to the vertical chance forcing the GCA to no longer
remain valid. Grebene argued that an infinitesimal thin conducting “filament”
was left responsible to maintain current flow in the saturated portion of field effect
transistor I-V characteristics and used superposition in the x and y directions to
solve Laplace’s equation for the saturated characteristic (see appendix in Ref.
[140]). In this work it is assumed, as it is in Shockley’s work, that once pinch-off
conditions are reached, drift velocity saturation simultaneously occurs and pins
the drain current at a constant value.
B.6 Appendix B cited literature
139. W. Shockley, “A Unipolar “Field-Effect” Transistor”, Proc. of I.R.E., pp.1365-1376, 1952.
140. A.B. Grebene, S.K. Ghandhi, “General theory for pinched operation of thejunction-gate FET”, Sol. Sta. Elec., vol. 12, pp. 573-589, 1969.
141. S.M. Sze, in Physics of Semiconductor Devices, 2nd ed., Wiley Publishers,1981.
142. J.H. Davies, “The physics of low-dimensional semiconductors”, Cambridgepress, 1998.
143. D. Jena,“Polarization induced electron populations in III-V nitride semi-conductors; Transport, growth, and device applications” Ph.D. dissertation,University of California, Santa Barbara, 2003.
177

APPENDIX C
GENERAL AlN/GaN HEMT PROCESS
I. Ohmic level
• Ohmic lithography:
- Sample clean: ACE, METH, IPA, DI rinse and N2 blow dry
- Dehydration bake at 105 oC for 30 sec
- Spin LOR-5, ramp 5 sec at 500 RPM + 30 sec at 3000 RPM
- Bake at 180 oC for 5 min
- Spin 1805, ramp 5 sec at 500 RPM + 30 sec at 3000 RPM
- Bake at 105 oC for 60 sec
- Alignment and exposure (intensity = 7 mW/cm2 for 5 sec)
- Develop in 353 for 90 sec
- DI rinse and N2 dry
• Ohmic metal deposition and lift-off:
- O2 plasma descum for 1 min (Pressure = 900 mT, Power = 10 W, T= 25 oC)
- Ohmic pre-metallization ICP etch according to target depth (leave ¡2 nm AlN remaining), (Pressure = 5 mT, ICP/RIE Power = 100/25 W, T= 25 oC, Ar/BCl3/Cl2 flow rates = 10/10/20 sccm) NOTE: rate in OxfordICP is ∼ 0.53 A/sec
- NH4OH:H2O (1:10) dip for 15 sec, DI rinse
- E-beam deposit ohmic metal stack: Ti/Al/Ni/Au (300/2000/400/200A)
- Lift off metal by spraying with ACE followed by IPA, DI rinse, N2 blowdry. NOTE: verify metal thickness by profilometry.
Comment 1: Minimize time between pre-metallization etch, NH4OH dip,and insertion into evaporation chamber (no more than 15 min. maximum).
178

Comment 2: Measure as-deposited metal 2-point I-V on 4 µm separationCTLM for evolutionary data of contacts. Result will further dictate neces-sary anneal temperature.
• Ohmic contact anneal:
- Anneal sample at 800 oC for 30 sec in AET RTA using recipe: 80030.
II. Mesa level
• Mesa isolation lithography:
- Sample clean: ACE, METH, IPA, DI rinse and N2 blow dry
- Dehydration bake at 105 oC for 30 sec
- Spin 1811, ramp 5 sec at 500 RPM + 30 sec at 4000 RPM
- Bake at 105 oC for 60 sec
- Alignment and exposure (intensity = 7 mW/cm2 for 20 sec)
- Develop in 353 for 45 sec
- DI rinse and N2 dry
- Hard bake at 120 oC for 60 sec
Comment: Measure device characteristics: 2-point I-V on 4 µm separationCTLM, buffer isolation I-V, Hall effect, TLM, open channel I-V.
• Mesa isolation etch:
- Etch 500 Awith Trion ICP (Pressure = 5 mT, ICP/RF Power =100/25W, T = 25 oC, Ar/BCl3/Cl2 flow rates = 10/10/20 sccm)
- Remove PR in solvents: ACE, Meth, IPA, DI rinse and N2 blow dry
- Measure step height by profilometry
III. Gate level
• Oxide deposition:
- NH4OH:H2O (1:10) dip for 15 sec, DI rinse
- Blanket deposit oxide of choice (optimized deposition conditions varywith oxide variety)
• Gate lithography (Lg = 1 µm)
- Sample clean: ACE, METH, IPA, DI rinse and N2 blow dry
- Dehydration bake at 105 oC for 30 sec
179

- Spin LOR-5, ramp 5 sec at 500 RPM + 30 sec at 3000 RPM
- Bake at 180 oC for 5 min
- Spin 1805, ramp 5 sec at 500 RPM + 30 sec at 3000 RPM
- Bake at 105 oC for 60 sec
- Alignment and exposure (intensity = 7 mW/cm2 for 5 sec)
- Develop in 353 for 90 sec
- DI rinse and N2 dry
Comment: Check for over exposure/development of PR in microscope.
• Gate metal deposition and lift-off:
- O2 plasma descum for 1 min (Pressure = 900 mT, Power = 10 W, T= 25 oC)
- NH4OH:H2O (1:10) dip for 15 sec, DI rinse
- E-beam deposit ohmic metal stack: Ni/Au (200/3000 A)
- Lift off metal by spraying with ACE followed by IPA, 1165 (LORremoval), IPA, DI rinse, N2 blow dry. NOTE: verify metal thickness byprofilometry.
IV. Overlay level
• Overlay lithography:
- Sample clean: ACE, METH, IPA, DI rinse and N2 blow dry
- Dehydration bake at 105 oC for 30 sec
- Spin LOR-5, ramp 5 sec at 500 RPM + 30 sec at 3000 RPM
- Bake at 180 oC for 5 min
- Spin 1805, ramp 5 sec at 500 RPM + 30 sec at 3000 RPM
- Bake at 105 oC for 60 sec
- Alignment and exposure (intensity = 7 mW/cm2 for 5 sec)
- Develop in 353 for 90 sec
- DI rinse and N2 dry
• Overlay etch:
- O2 plasma descum for 1 min (Pressure = 900 mT, Power = 10 W, T= 25 oC)
180

- Over-etch oxide in Trion ICP using SiN recipe (Pressure = 50 mT, ICPPower = 40 W, T = 25 oC, Bias = 0 V, SF6 flow rate = 26 sccm)
- Remove PR in solvents: ACE, Meth, IPA, 1165 (LOR removal), IPA,DI rinse and N2 blow dry
Comment 1: Measure device characteristics: buffer isolation I-V, Hall effect,transfer and drain characteristics, off-state breakdown, gate lag, C-V.
Comment 2: Measure device characteristics for sub-micron gate length de-vices: transfer and drain characteristics, off-state breakdown, small signalS-parameters, gate lag, large signal (if GLR warrants).
181

This document was prepared & typeset with pdfLATEX, and formatted withnddiss2ε classfile (v3.0[2005/07/27]) provided by Sameer Vijay.
182
Copyright © 2022 FDOKUMEN