Adsorption of methylamine on mackinawite (FeS) surfaces: A density functional theory study
9
Adsorption of methylamine on mackinawite (FES) surfaces: A density functional theory study N. Y. Dzade, A. Roldan, and N. H. de Leeuw Citation: J. Chem. Phys. 139, 124708 (2013); doi: 10.1063/1.4822040 View online: http://dx.doi.org/10.1063/1.4822040 View Table of Contents: http://jcp.aip.org/resource/1/JCPSA6/v139/i12 Published by the AIP Publishing LLC. Additional information on J. Chem. Phys. Journal Homepage: http://jcp.aip.org/ Journal Information: http://jcp.aip.org/about/about_the_journal Top downloads: http://jcp.aip.org/features/most_downloaded Information for Authors: http://jcp.aip.org/authors Downloaded 30 Sep 2013 to 128.40.76.3. This article is copyrighted as indicated in the abstract. Reuse of AIP content is subject to the terms at: http://jcp.aip.org/about/rights_and_permissions
Transcript of Adsorption of methylamine on mackinawite (FeS) surfaces: A density functional theory study

Adsorption of methylamine on mackinawite (FES) surfaces: A densityfunctional theory studyN. Y. Dzade, A. Roldan, and N. H. de Leeuw Citation: J. Chem. Phys. 139, 124708 (2013); doi: 10.1063/1.4822040 View online: http://dx.doi.org/10.1063/1.4822040 View Table of Contents: http://jcp.aip.org/resource/1/JCPSA6/v139/i12 Published by the AIP Publishing LLC. Additional information on J. Chem. Phys.Journal Homepage: http://jcp.aip.org/ Journal Information: http://jcp.aip.org/about/about_the_journal Top downloads: http://jcp.aip.org/features/most_downloaded Information for Authors: http://jcp.aip.org/authors
Downloaded 30 Sep 2013 to 128.40.76.3. This article is copyrighted as indicated in the abstract. Reuse of AIP content is subject to the terms at: http://jcp.aip.org/about/rights_and_permissions

THE JOURNAL OF CHEMICAL PHYSICS 139, 124708 (2013)
Adsorption of methylamine on mackinawite (FES) surfaces: A densityfunctional theory study
N. Y. Dzade, A. Roldan,a) and N. H. de Leeuwb)
Department of Chemistry, University College London, London WC1H 0AJ, United Kingdom
(Received 18 June 2013; accepted 21 August 2013; published online 30 September 2013)
We have used density functional theory calculations to investigate the interaction between methy-lamine (CH3NH2) and the dominant surfaces of mackinawite (FeS), where the surface and adsorptionproperties of mackinawite have been characterized using the DFT-D2 method of Grimme. Our calcu-lations show that while the CH3NH2 molecule only interacts weakly with the most stable FeS(001),it adsorbs relatively strongly on the FeS(011) and FeS(100) surfaces releasing energies of 1.26 eVand 1.51 eV, respectively. Analysis of the nature of the bonding reveals that the CH3NH2 moleculeinteracts with the mackinawite surfaces through the lone-pair of electrons located on the N atom.The electron density built up in the bonding region between N and Fe is very much what one wouldexpect of covalent type of bonding. We observe no significant adsorption-induced changes of theFeS surface structures, suggesting that amine capping agents would not distort the FeS nanoparticlesurfaces required for active heterogeneous catalytic reactions. The vibrational frequencies and the in-frared spectra of adsorbed methylamine have been calculated and assignments for vibrational modesare used to propose a kinetic model for the desorption process, yielding a simulated temperature pro-grammed desorption with a relative desorption temperature of <140 K at the FeS(011) surface and<170 K at FeS(100) surface. © 2013 AIP Publishing LLC. [http://dx.doi.org/10.1063/1.4822040]
I. INTRODUCTION
Metal and metal sulfide or oxide nanocrystals have beensynthesized in various shapes using wet chemistry tech-niques, including reducing metal precursors in the presenceof surface-capping agents.1 These nanoscale materials exhibitlarge surface areas and size-dependent distinct electronic, op-tical, magnetic, chemical, and thermal properties comparedto the bulk materials and thus are of significant scientific andtechnological interest.2, 3 The surface-capping agents stabilizeand passivate the nanoparticle surfaces, thereby improvingthe stability of the nanoparticles against temperature and pos-sible oxidation that would result in degradation. For exam-ple, capping agents are used in the synthesis of nanoparticlesof, for example, CdS,4–6 CdSe,7 CdTe,8, 9 ZnS,10 Cu2S,11 andAg,12 Au,13, 14 Pd,15 and Pt,16 to control the particle size andmorphology.
Metal sulfides are abundant minerals with a wide rangeof applications owing to their interesting physical and chem-ical properties, making them strong candidates for tech-nological applications such as solar cells,17–19 solid-statebatteries,20 and as catalyst materials.21, 22 For example, FeS2,MoS2, and PbS have been considered as possible mate-rial for photovoltaic solar cells owing to their semicon-ducting properties.20, 23 Organic surface capping agents, forexample, amine groups are used as stabilisers to prevent ag-gregation and to control the shapes and morphologies ofnanoparticles for heterogeneous catalysis.15, 24 These cappingagents, however, need to be removed to produce the acces-sible surfaces required for heterogeneous catalytic reactions.
a)[email protected])[email protected]
However, complete removal of these capping agents is rarelyachieved and the molecules on a surface often interfere in thecatalytic reaction, with either negative or, less often, positiveeffects. The interplay between adequately protecting the sur-faces during synthesis, but subsequently desorbing to allowthe catalytic reactions to take place, suggests that the cappingagents should not bind too strongly to the surface, but not tooweakly either. The interaction of the amine functional groupwith iron sulfide surfaces is, therefore, of practical interest.As such, the adsorption and grafting of organic compoundscontaining amine groups on particle surfaces has received sig-nificant attention in the literature due to their important appli-cations in corrosion inhibition, surface coating, adhesion, andcatalysis.25, 26
Methylamine (CH3NH2) is the simplest primary amine,and therefore well suited to address the interaction of theamine functional group with metal surfaces. The adsorp-tion behaviour of CH3NH2 on several low-index transitionmetal surfaces such as Ni(100),27 Ni(111),28, 29 Cr(111),27
Cu(110),30 Ru(001),31 Rh(111),32 Pd(111),31, 33 W(100),34
and Pt(111)35, 36 has been investigated both theoretically andexperimentally and the interaction of CH3NH2 on transitionmetal oxides has also been reported in the literature.37 Forexample, Borck et al. have carried out first-principles den-sity functional theory calculations to analyse and compare themolecular adsorption of methylamine on the α-Al2O3(0001)and α-Cr2O3(0001) surfaces and showed that methylaminein both cases binds to the exposed surface cations via the Nlone-pair orbital.37 The desorption temperature of multilayermethylamine was predicted to be below 150 K at Ni3Al(111)and NiAl(110) surfaces,38 similar to what is reported for othermetallic surfaces.28, 30–34
0021-9606/2013/139(12)/124708/8/$30.00 © 2013 AIP Publishing LLC139, 124708-1
Downloaded 30 Sep 2013 to 128.40.76.3. This article is copyrighted as indicated in the abstract. Reuse of AIP content is subject to the terms at: http://jcp.aip.org/about/rights_and_permissions

124708-2 Dzade, Roldan, and de Leeuw J. Chem. Phys. 139, 124708 (2013)
Among the naturally occurring iron sulfides reported,mackinawite (FeS) is a known precursor to all other iron sul-fides including greigite and pyrite.39–41 Mackinawite has thecomposition FeS1−x with 0 ≤ x ≤ 0.07, where Fe and S are ina tetrahedral distribution to form a multilayer material.40 Dueto the structural similarity between mackinawite and the (Ni,Fe)S catalytic centres found in modern-day enzymes, e.g.,carbon monoxide dehydrogenase (CODH), which is capableof catalysing the conversion of carbon dioxide (CO2) and car-bon monoxide (CO) into a range of organic molecules,42 tran-sition metal-doped iron sulfides are considered promising po-tential catalysts for CO2 conversion.39, 43 The structural andphysico-chemical properties of the mackinawite surfaces arestill relatively unexplored; although an earlier computationalstudy on the stability of mackinawite surfaces by Devey et al.showed that the FeS(001) is the most stable surface, provid-ing a plate-like morphology to mackinawite nanoparticles.44
Computational techniques based on the Density FunctionalTheory (DFT) have become an important tool in surface sci-ence to unravel at the atomic level the interaction of ad-sorbates with substrates. The present study presents the re-sults of DFT calculations of the adsorption of CH3NH2 ona number of mackinawite FeS surfaces, identifying the pref-erential adsorption modes of the molecule and its bindingstrengths to the different surfaces. We have also determinedsimulated temperature programmed desorption (TPD) resultsfor CH3NH2 desorption from the FeS surfaces.
II. COMPUTATIONAL DETAILS
The calculations in this study have been performed usingthe Vienna Ab-initio Simulation Package (VASP) with plane-wave basis set.45–47 To account for long range dispersionforces, we have adapted the implementation of the DFT-D2approach described by Grimme, which accurately describesthe interaction between organics and solid surfaces.48 TheDFT-D2 method adds a semi-empirical dispersion potentialto the conventional Kohn-Sham DFT energy which describeslong range interactions resulting from dynamical correlationsbetween fluctuating charge distributions. In these calcula-tions, we have used the projector-augmented-wave method(PAW)49, 50 in conjunction with Generalized Gradient Ap-proximation (GGA) density functionals, using the exchange-correlation functional of Perdew-Wang 91 (PW91)51 and thespin interpolation formula by Vosco et al.52 The Brillouinzone was sampled using 11 × 11 × 11 and 5 × 5 × 1Monkhorst-Pack53 mesh k-points for bulk and surface calcu-lations, respectively. Such dense grids and a truncation kineticenergy of 400 eV for the plane waves ensured an accurate de-scription of properties that are influenced by sharp features inthe density of states. A total energy convergence better than10−5 eV is reached and the interatomic forces are minimizedup to 0.01 eV/Å for structural relaxation calculations.
The bulk FeS was modelled in the tetragonal unit cellconsisting of two Fe and two S atoms. The spin arrange-ment of FeS electrons is unclear and matter of discussiondue to experimental results are not conclusive and computa-tional studies provide both magnetic54, 55 and non-magnetic44
behaviours. In any case, the magnetism is not relevant for
the CH3NH2 adsorption trend and hence we have used non-magnetic materials for our simulations. The slab model wasbuilt by adding a vacuum region of 12 Å to prevent the slabfrom interacting with its periodic images in the surface nor-mal direction. The adsorption calculations were carried out ona p(2 × 2) supercell of the different FeS surfaces in such a waythat the effective coverage was 0.25 ML, where a monolayer(ML) is defined as one methylamine molecule per surfacecation. The minimum distance between adsorbate moleculesand their images in the neighbouring cells on these surfacesis ∼5 Å, thus minimizing interactions between molecules. Todetermine the optimum adsorption sites and geometries, theadsorbate was placed initially in high-symmetry sites on oneside of the slab, after which the atoms of the adsorbate and thetwo topmost surface layers of the slab were allowed to relax.We did not include symmetry constraints in the structural op-timization, and, in particular, the adsorbate was free to moveaway laterally from the initial adsorption site or reorient itselfto find the minimum energy adsorption structure. The adsorp-tion energy per molecule was calculated from the relation
Eads = Esurf +mol − (Esurf + Emol), (1)
where Esurf+mol is the total energy of the adsorbate-substratesystem, Esurf is the energy of the naked surface slab, andEmol is the energy of the isolated methylamine molecule.Within this definition, a negative adsorption energy indicatesan exothermic process. The isolated molecule was modelledin the centre of a cell with lattice constants of 15 Å, samplingonly the �-point of the Brillouin zone. Vibrational frequenciesand the infrared spectra of the adsorbed methylamine were de-termined in order to propose an assignment for the observedfeatures of the adsorbed methylamine vibrational modes.
III. RESULTS AND DISCUSSION
A. FeS bulk properties
Mackinawite is a layered material with a tetragonal unitcell with lattice parameters a = b = 3.674 Å, c = 5.033 Å,c/a = 1.370; α = β = γ = 90.40, 41 The iron atoms are atthe corners and at the centre of the square faces on oppo-site sides of the unit cell as shown in Figure 1(a). The sul-fur atoms are positioned on the elongated sides of the unitcell. The long axis of the cell corresponds to the direction inwhich the iron sulfide layers stack, resulting in layers heldtogether by long range van der Waals (vdW) forces and giv-ing a perfect (001) cleavage. The above experimental latticeparameters were used as starting point for our VASP calcula-tions. We first carried out geometry optimizations of the FeSstructure without accounting for the vdW forces (i.e., DFTonly) and found it to overestimate the interlayer spacing. Thelattice parameters after a full geometry optimization convergeto a = b = 3.588 Å, c = 5.484 Å, and c/a ratio = 1.528 Å,which is 11.4%-11.6% larger than the c/a ratios reported byLennie40 and Berner.41 The drastic overestimation of the c-parameter and associated c/a ratio suggests that the vdW cor-rection might be essential to improve the c-parameter. Stan-dard DFT-based methods often result in a poor estimationof the inter-layer spacing of most layered structures. For
Downloaded 30 Sep 2013 to 128.40.76.3. This article is copyrighted as indicated in the abstract. Reuse of AIP content is subject to the terms at: http://jcp.aip.org/about/rights_and_permissions

124708-3 Dzade, Roldan, and de Leeuw J. Chem. Phys. 139, 124708 (2013)
FIG. 1. Schematic illustration of (a) the tetragonal structure of mackinawiteand (b) the total and partial density of state of bulk mackinawite. (Colourscheme: Fe = grey, S = yellow).
example, the c-parameter for layered MoS2 and NbSe2 struc-tures has been overestimated by 20% and 10% within the stan-dard DFT calculation.56 We have, therefore, implemented theDFT-D2 method of Grimme to account for the weak disper-sion forces and found it to predict the c-parameter in closeagreement with experiment.40, 41 After a full geometry opti-mization of the structure within the DFT-D2 scheme, the lat-tice parameters relax to a = b = 3.587 Å, c = 4.908 Å, and c/aratio = 1.368 Å. The calculated structural parameters of FeSare summarized in Table I. Since the dispersion-corrected cal-culations predicted the inter-layer separation distance in closeagreement with available data, and dispersion forces are also
TABLE I. Optimized structural parameters of mackinawite (FeS). The ex-perimental unit cell parameters a = b, c, and the c/a ratio are also given forcomparison.
Experiment40, 41 This work
Lennie Berner DFT DFT-D2
a = b (Å) 3.674 3.679 3.588 3.587c (Å) 5.033 5.047 5.484 4.908c/a (Å) 1.369 1.372 1.528 1.368dFe–S (Å) 2.256 2.255 2.162 2.262dFe–Fe (Å) 2.598 2.588 2.537 2.536
important in the adsorption of organic molecules on materialssurfaces,57–59 all further calculations were performed withinthe DFT-D2 method of Grimme.
The electronic structure of FeS given by the projecteddensity of states (pDOS) is shown in Figure 1(b). Spin po-larization has been tested on the pDOS and found not to haveany significant effect. The antiparallel spin DOS shows the al-pha and beta states to be symmetric with respect to the x-axis,indicating a behaviour that is independent of the spin orienta-tion. The pDOS with and without spin polarization indicates ametallic nature, with the dominant contribution near the Fermienergy coming from Fe 3d states as a result of direct interlayerFe–Fe interactions. The Fermi energy is seen to cut a band ofthe Fe d-orbital roughly in the centre of a local minimum, in-dicating a partial localization with regard to the S atoms butstill metallic, in agreement with the metallic nature deducedby Vaughan and Ridout60 and also consistent with earlier the-oretical investigations44, 54, 55 that showed that the Fe plane inthe mineral contributes most of the electron density near theFermi energy. This result is consistent with the general DOSfeatures of layer-type tetragonal Fe compounds.61–63
B. FeS surface structures
The FeS surfaces were prepared by cutting the bulk struc-ture to create the (001), (100), and (011) surfaces. Due to thecrystal symmetry of mackinawite in the “a” and “b” direc-tions, the (100) and (010) surfaces and the (011) and (101)surfaces are equivalent. The surface energy, i.e., the energyper unit area that is required to form the crystal surface rela-tive to the bulk, is calculated using the relation
γ = Es − nEb
2A, (2)
where Es represents the energy of the surface slab, Eb repre-sents the energy of the equivalent number (n) of the bulk FeSunits, and A is the surface area of each side of the slab. Themost stable surface is calculated to be the (001), in agreementwith an earlier computational study of mackinawite surfacesby Devey et al.,44 whereas high-resolution transmission elec-tron microscopy (HRTEM) images of mackinawite nanocrys-tals often identify the (001) as the predominant surface.64, 65
The creation of this surface involves breaking only the weakvdW interactions between the sulfide layers. Upon relaxationof the FeS(001) without the vdW correction, a negative sur-face energy (−0.01 Jm−2) was obtained, implying that thesurface is more stable than the bulk material, which is notrealistic. However, when we introduced the vdW correction,we recovered a positive surface energy of 0.19 Jm−2, confirm-ing the significant role the van der Waals’ interactions play inholding mackinawite layers together. The clean FeS(001) sur-face undergoes only minimal relaxation, with the Fe−S andFe−Fe bond distances in the same top-layer remaining almostidentical to that of the bulk mackinawite Fe−S bond length(2.164 Å) and Fe−Fe distance (2.550 Å). The next most sta-ble surfaces of mackinawite are the equivalent (011) and (101)planes, which are terminated by Fe atoms and have a calcu-lated surface energy of 0.95 Jm−2. The Fe−S and Fe−Fe bonddistances of the FeS(011) surface are also almost identical to
Downloaded 30 Sep 2013 to 128.40.76.3. This article is copyrighted as indicated in the abstract. Reuse of AIP content is subject to the terms at: http://jcp.aip.org/about/rights_and_permissions

124708-4 Dzade, Roldan, and de Leeuw J. Chem. Phys. 139, 124708 (2013)
TABLE II. Surface properties of mackinawite, the surface energies (γ ),work function (�), and the internal bond distances given.
FeS(001) FeS(011) FeS(100)
γ (Jm−2) 0.19 0.95 1.40� (eV) 4.72 3.86 4.08dFe–S (Å) 2.165 2.165 2.183dFe–Fe (Å) 2.554 2.553 2.553
those in the bulk indicating that this surface undergoes littlerelaxation. The FeS(100) surface which is equivalent to theFeS(010) surface terminates in both S and Fe atoms and has acalculated surface energy of 1.40 Jm−2. Again, the FeS(100)surface undergoes little relaxation between the first and thesecond Fe layer, with the Fe−S and Fe−Fe bond distancesin the same layer retaining their bulk character (see Table II).Figure 2 shows the slab model of the FeS(001), FeS(011), andthe FeS(100) surfaces used for the adsorption calculations.
C. Methylamine molecule
The isolated fully relaxed CH3NH2 structure is accu-rately reproduced by DFT-D2, with both the internal bondlengths and characteristic angles in good agreement withavailable experimental data (see Table III).66 The molecularorbitals are also well represented. For instance, Figure 3(a)shows the highest occupied molecular orbital (HOMO) whichis a non-bonding lone-pair orbital dominated by the 2p char-acter of the nitrogen atom. CH3NH2 has Cs point group sym-metry, possessing a mirror plane along the C−N bond thatbisects the H−N−H plane. In the equilibrium, staggered con-formation one methyl group hydrogen atom (Hip) lies in themirror plane at a distance dC-Hip = 1.106 Å from the C atom,while the other two hydrogen atoms (Hop) are out-of-plane ata distance of dC-Hop = 1.098 Å from the C. The iso-surface ofthe electron density of CH3NH2 is shown in Figure 3(b).
FIG. 2. Schematic illustration of the slab models of (a) the FeS(001), (b) theFeS(011), and (c) the FeS(100) surfaces used for the adsorption calculations.The vacuum size is 12 Å. (Colour scheme: Fe = grey and S = yellow).
TABLE III. Comparison of calculated and experimental structural parame-ters of CH3NH2 molecule. In the staggered conformation one methyl grouphydrogen (Hip) atom lies in the mirror plane at a distance dCHip from the Catom, while the other two hydrogen (Hop) atoms are out-of-plane at a distanceof dCHop from the C.
Experiment66 This work
dN–H (Å) 1.031 1.022dC–N (Å) 1.472 1.470dC–Hip (Å) 1.112 1.106dC–Hop (Å) 1.112 1.098<CNH (◦) 111.5 110.1<HNH (◦) 106.0 106.4<HCH (◦) 108.4 107.9
D. Methylamine adsorption
The CH3NH2 molecule was introduced onto the variousFeS surfaces in several different initial orientations to deter-mine the preferred adsorption sites and binding modes afterstructure optimization. The molecule was first placed on themost stable (001) surface where it interacted only weakly withan adsorption energy of −0.05 eV. Furthermore, during thegeometry optimization, the CH3NH2 molecule moved awayperpendicularly (z-direction) from the surface, up to a dis-tance of 3.195 Å and hence considered as a non-interactingsystem. Moreover, no structural changes were observed inbond lengths and angles and no charge transfer occurs be-tween the substrate and the molecule at the FeS(001) surface.This interaction behaviour can be attributed to the electro-static repulsion between the methylamine molecule and thetopmost S atoms in the FeS(001) surface.
The CH3NH2 molecule, however, adsorbs relativelystrongly on both the FeS(011) and FeS(100) surfaces withadsorption energies of −1.26 eV and −1.57 eV, respectively.Although no significant structural changes are observed in theadsorbed CH3NH2 molecule, an electronic re-arrangementhas taken place between the CH3NH2’s HOMO and the in-teracting FeS surfaces, as discussed in Sec. III E. The C−N,C−Hop, C−Hip, and N−H distances when the methylamineis adsorbed at the FeS(100) surface are 1.479 Å, 1.104 Å,1.097 Å, 1.025 Å, respectively, similar to the gas phase dis-tances. The CH3NH2 on the FeS(100) rotates through an
FIG. 3. Schematic representation of (a) the highest occupied molecular or-bital (HOMO) of CH3NH2 dominated by the 2p character of the nitrogenatom and (b) the Iso-surfaces of the electron density of CH3NH2.
Downloaded 30 Sep 2013 to 128.40.76.3. This article is copyrighted as indicated in the abstract. Reuse of AIP content is subject to the terms at: http://jcp.aip.org/about/rights_and_permissions
124708-5 Dzade, Roldan, and de Leeuw J. Chem. Phys. 139, 124708 (2013)
TABLE IV. Calculated adsorption energies and selected parameters ofCH3NH2 adsorption on FeS(001), FeS(011), and FeS(100) surfaces.
∑q de-
notes the total charge transferred from the CH3NH2 molecule unto the surfaceand M denotes CH3NH2 molecule.
M/FeS(001) M/FeS(011) M/FeS(100)
Eads (eV) − 0.054 − 1.263 − 1.512dN–Fe (Å) 3.195 2.107 2.094dC–N (Å) 1.470 1.481 1.479dC–Hip (Å) 1.106 1.101 1.104dC–Hop (Å) 1.098 1.100 1.097dN–H (Å) 1.022 1.023 1.025<HNH (◦) 106.3 107.0 105.8∑
q (/e−) 0.00 0.06 0.08
angle of 30o normal to the surface Fe atom to which it binds,such that one of the amine’s H atoms tilts towards the sur-face sulfur atom forming a weak hydrogen bond at S–H dis-tance of 2.321 Å; the N−Fe bond distance is calculated to be2.094 Å. Such H-surface bonds have been observed formolecular methylamine adsorption on oxide surfaces.67, 68
The Fe atom, to which CH3NH2 is bound, is slightly dis-placed upwards in the z-direction by 0.09 Å. Similarly, at theFeS(011) surface, the N-atom of the methylamine binds nor-mal to the surface Fe atom (N−Fe bond distance of 2.107 Å)without the adsorbate undergoing any significant changes inits bond distances and angles. There is, however, no H-bondformation between the amine’s H atoms and the surface atomsat the FeS(011). The C−N, C−Hop, C−Hip, and N−H dis-tances are 1.481 Å, 1.101 Å, 1.100 Å, and 1.023 Å, re-spectively. The surface Fe atom to which the methylaminebinds at the FeS(011) is also slightly displaced upwards inthe z-direction by 0.07 Å compared to its position in thenaked surface. A summary of the adsorption energies andrelevant structural parameters for the adsorbed CH3NH2 onthe FeS surfaces are given in Table IV. It is worth notingthat the geometry of the adsorbed CH2NH3 molecule changesonly marginally upon adsorption and there are no significantadsorption-induced changes to the surface geometry. The op-timized adsorption structures of the CH3NH2 adsorbed onthe FeS surfaces are shown in Figure 4. Similar adsorptiongeometries have been reported for methylamine on metallicsurfaces.37, 38, 67–69
FIG. 5. Induced charge density for CH3NH2 on (a) FeS(100) and(b) FeS(011), plotted for an isovalue of ±0.02 e/Å3, where red denotes (+)and blue (−). The accumulation of electron density within the bonding re-gions can clearly be seen.
E. Bonding mechanism
Our calculations show that the CH3NH2 molecule inter-acts with the FeS(011) and FeS(100) surfaces through the lonepair of electrons located on the N atom which is in agree-ment with earlier theoretical investigations of methylamineadsorption on metal surfaces.37, 38, 67–69 The electron densitybuilt up in the bonding region between N and Fe is very muchwhat one would expect for a covalent type of bonding.70 Wehave carried out Bader charge analysis to quantify the lackof ionicity in the molecular methylamine adsorption. Whilethere may be local orbital rearrangements, the overall chargetransfer from the molecule to the surface is very small indeed(<0.1 e−), and is within the order of DFT error. Insight intothe local charge rearrangement within the CH3NH2/FeS sys-tems can be gained further from the electron density differ-ence (�ρ) obtained by subtracting from the charge density ofthe total adsorbate system the sum of the charge densities ofthe molecule and the clean surface:
�ρ = ρsurf +mol − (ρsurf + ρmol). (3)
The latter two quantities of Eq. (3) were calculated usingthe same geometry as the total surface-adsorbate system. InFigure 5, an isovalue of ±0.02 e/Å3 has been used to showthat there is an accumulation of charge density within theN−Fe bond regions at both the FeS(011) and FeS(100) sur-faces consistent with the formation of a chemical bond. Atthe FeS(100) surface one can also see the interaction of the
FIG. 4. Schematic illustration of the adsorption geometry of CH3NH2 on (a) FeS(001), (b) FeS(011), and (c) FeS(100) surfaces. (Colour scheme: Fe = grey,S = yellow, N = blue, C = green, and H = white).
Downloaded 30 Sep 2013 to 128.40.76.3. This article is copyrighted as indicated in the abstract. Reuse of AIP content is subject to the terms at: http://jcp.aip.org/about/rights_and_permissions

124708-6 Dzade, Roldan, and de Leeuw J. Chem. Phys. 139, 124708 (2013)
amine’s hydrogen with the surface sulfur atom. The chargetransfer, as estimated by the space partitioning scheme ofBader, is small. Approximately 0.08 e− and 0.06 e− are trans-ferred from the adsorbate to the FeS(100) and FeS(011) sur-faces, respectively, indicating that the bond is mainly of cova-lent character.
F. Vibrational properties
In order to propose an assignment for the vibrationalmodes of the adsorbed methylamine we have computed thewavenumbers of the normal modes at the FeS(011) andFeS(100) surfaces. In Table V, we present our calculated andthe experimental values (in brackets)71 of the free molecule,which agree well. The vibrational frequencies for the ad-sorbed methylamine at the FeS surface with their correspond-ing assigned vibrational modes are also summarized. Thesimulated IR spectra for methylamine adsorbed at theFeS(011) and FeS(100) surfaces (see Figure 6) predict that theNH2 scissors peak at 1586 cm−1 and 1566 cm−1, respectively.The NH2 symmetric and asymmetric stretching frequenciescan be assigned to 3641cm−1 and 3576 cm−1 at the FeS(011)surface and to 3401cm−1 and 3263 cm−1 at the FeS(100) sur-face. The peaks within the regions of 2900-3100 cm−1 can beassigned to CH3 deformation modes. The C−N stretching fre-quencies are predicted to be 1006 cm−1 and 1011 cm−1 at theFeS(011) and FeS(100) surfaces, respectively. The calculatedC−N stretching frequency is in good agreement with ear-lier theoretical and experimental investigations of the vibra-tional frequencies of gas phase CH3NH2.27–30, 71–73 The peaksaround 1300 cm−1 can be assigned to the NH2 twisting modeand the peak at 1100 cm−1 is assigned to the CH3 rockingmode. It is to be noted that the NH2 symmetric and asymmet-ric stretching modes are red-shifted relative to the gas-phasemolecule at the FeS(100) but blue shifted at the FeS(011) sur-face (see Table V) suggesting a stronger interaction betweenthe methylamine with the FeS(100) surface than the FeS(011),
TABLE V. Molecular vibrational frequencies (in cm−1) of methylamine ad-sorbed at FeS surfaces. The calculated and experimental values (given inbrackets)71 of the gas phase methylamine are also given (M = methylamine,a = asymmetric, and s = symmetric stretching).
Vibration No. Free CH3NH2 M/FeS(011) M/FeS(100) Mode type
υ1 3450.2 (3427) 3640.9 3400.6 NH2 a-stretchingυ2 3365.9 (3361) 3575.5 3262.9 CH3 s-stretchingυ3 3033.1 (2985) 3021.9 3109.9 CH3 stretchingυ4 2995.9 (2961) 3013.9 3037.1 CH3 stretchingυ5 2932.6 (2820) 2959.5 2964.4 CH3 deformationυ6 1604.9 (1623) 1585.6 1565.8 NH2 scissorsυ7 1463.2 (1473) 1474.1 1458.8 CH3 deformationυ8 1441.4 (1473) 1454.7 1453.5 CH3 deformationυ9 1401.9 (1430) 1403.5 1412.2 CH3 rockingυ10 1303.1 (1419) 1306.6 1300.1 NH2 twistingυ11 1126.1 (1130) 1179.0 1198.0 CH3 rockingυ12 937.0 (780) 985.6 1026.3 NH2 waggingυ13 1033.7 (1044) 1006.2 1011.3 CN stretchingυ14 792.9 (780) 951.4 978.3 NH2 waggingυ15 311.5 (268) 383.9 586.6 Torsion
FIG. 6. Simulated infra-red spectra of methylamine adsorbed at the (011)and (100) surfaces of mackinawite.
in agreement with the larger adsorption energy calculated atthe FeS(100) surface compared to the FeS(011) surface.
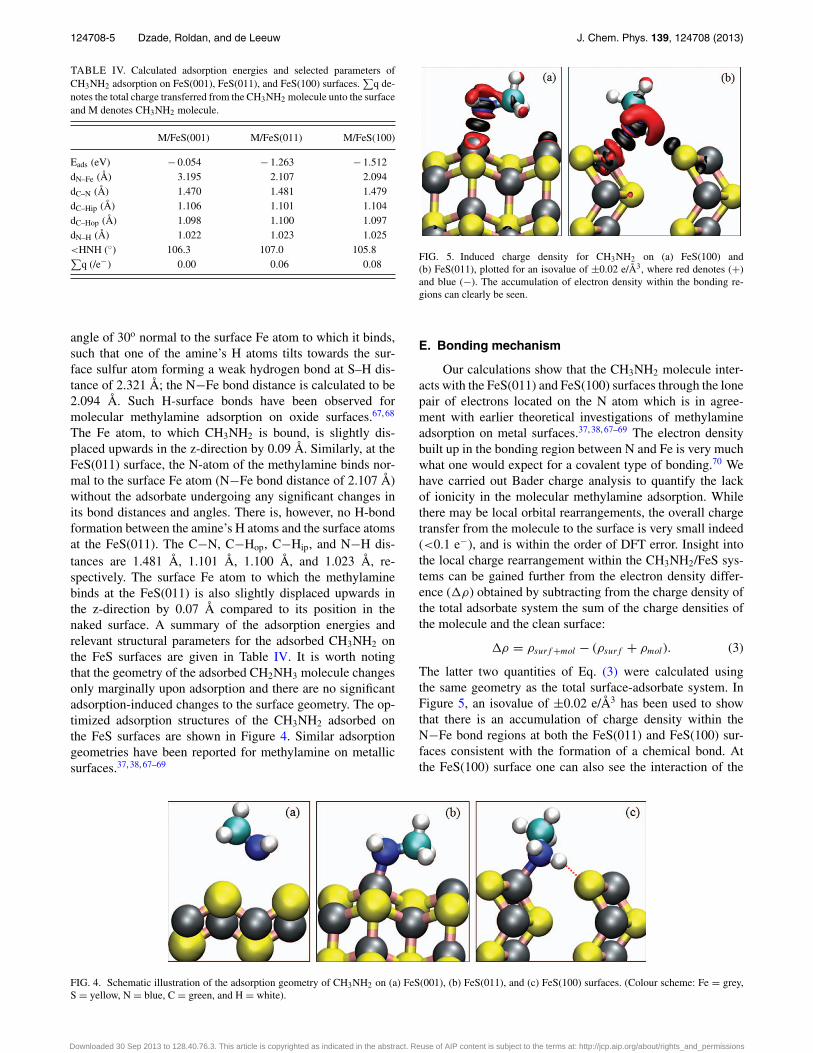
G. Temperature programmed desorption
Experimentally, TPD data for methylamine on FeS showthe maximum temperature (at a given pressure) at whichthe synthesis of the FeS particles should take place if themethylamine is used as a capping agent. Above the desorp-tion temperature the methylamine will not be retained at thesurfaces and, therefore, will not act as a capping agent. Inorder to simulate the CH3NH2 temperature programmed des-orption from the different FeS surfaces, we propose a kineticmodel which suppresses the molecule adsorption process stepto mimic an experimental batch reactor with a high pump-ing speed to avoid re-adsorption of the CH3NH2 molecule.The result of the DFT calculations employed in the TPD sim-ulation includes the optimized stable structure of the nakedFeS surfaces and that of the methylamine-FeS systems, aswell as the total energies and vibrational frequencies, fromwhich pressure- and temperature-dependent parameters werederived. The CH3NH2 pressure and coverage as a function oftime are governed by the following differential equations:
dPCH3NH2
dt= k · θCH3NH2 = −dθCH3NH2
dt,
where θ is the coverage in ML, t is the time, and k isthe rate of desorption. As previously applied successfully,74
the desorption rate constant may be estimated from the
Downloaded 30 Sep 2013 to 128.40.76.3. This article is copyrighted as indicated in the abstract. Reuse of AIP content is subject to the terms at: http://jcp.aip.org/about/rights_and_permissions
124708-7 Dzade, Roldan, and de Leeuw J. Chem. Phys. 139, 124708 (2013)
FIG. 7. Schematic illustration of the simulated TPD kinetic model ofCH3NH2 on FeS(011) and FeS(100) surfaces. The CH3NH2 desorption tem-peratures are 135 K and 165 K at the (011) and (100) surfaces, respectively.
conventional classical harmonic transition state theory ofEvans-Polanyi-Eyring,75 where one assumes that the transi-tion state is infinitely close to the desorbed state. In practice,the free molecule’s partition function has two degrees of free-dom for the activated species, as the third is taken as the re-action coordinate. The methodology ensures that the distancebetween molecules is at least 5 Å. We have carried out a setof kinetic calculations in order to determine the methylaminedesorption temperatures and compare these with previousbenchmark desorption temperatures at other surfaces. TheTPD simulations start with a pre-adsorbed CH3NH2 on theFeS(011) and FeS(100) surfaces with coverage (θCH3NH2) be-tween 0.1 and 0.9 ML, where we consider that a ML hasbeen reached when all equivalent sites are occupied. Wehave considered a temperature range between 100 and 400 Kwith an increment of 5 K/s, measuring the pressure every sec-ond. Raising the temperature leads to an increment of theCH3NH2 pressure as plotted and shown in Figure 7. Thedesorption processes of methylamine show the maximumrate at 135 K and 165 K at the FeS(011) and the FeS(100)surfaces, respectively. Similar desorption temperatures havebeen reported for methylamine at Ni(111),28, 29 Cu(110),30
Ru(001),31 Rh(111),32 Pd(111),33 and W(100).34
IV. SUMMARY AND CONCLUSIONS
We have carried out a systematic long range interactionsDensity Functional Theory study to characterize the (001),(100), and (011) surfaces of mackinawite and unravel the ad-sorption behaviour of CH3NH2 on these surfaces. Our dis-persion corrected DFT-D2 method of Grimme predicts thec-parameter of mackinawite in close agreement with those ob-tained experimentally. The most stable surface is predicted tobe the (001) surface whose creation involves only the break-ing of weak FeS interlayer van der Waals bonding.
The CH3NH2 adsorption studies show that while theCH3NH2 molecule does not interact significantly with theFeS(001), it adsorbs relatively strongly, although associa-tively, at the FeS(011) and FeS(100) surfaces, with adsorptionenergies of −1.26 eV and −1.51 eV, respectively. There are,
however, no significant adsorption-induced changes to eitherthe molecule or the FeS surface structures, therefore tenta-tively suggesting that amine capping agents could help pro-duce the clean FeS nanoparticle surfaces that are essential foractive heterogeneous catalytic reactions. The stronger bindingby methylamine to the (011) and (100) surfaces rather thanthe (001) plane indicates that these surfaces should becomemore prominent in the crystal morphology in the presence ofmethylamine; Crystal growth will be hindered onto the (011)and (100) surfaces compared to the (001) surface, which doesnot interact significantly with the surfactant. As such, the FeSmoiety could grow much more rapidly perpendicular to the(001) surface, rather than extend the (001) surface horizon-tally and this surface is, therefore, expected to become lessdominant in the morphology with respect to the other sur-faces, as is found in many crystals grown in the presence ofgrowth-modifying moieties.76, 77 The greater prominence ofthe more reactive surfaces in the particle grown in the pres-ence of methylamine or similar surfactants should also en-hance the catalytic performance of the FeS nanoparticles.
Analysis into the bonding nature reveals that theCH3NH2 molecule interacts with the mackinawite surfacesthrough the lone-pair electrons located on the N atom. Theelectron density built up in the bonding region between N andFe is very much what one would expect for a covalent type ofbonding. The vibrational frequencies and the infrared spectraof adsorbed methylamine have been calculated and assign-ments for vibrational modes are proposed.
From a macroscopic point of view, our simulatedTPD process shows relatively low desorption temperatures,<140 K at the FeS(011) surface and <170 K at the FeS(100)surface, which are comparable to experimental desorptiontemperatures predicted at metallic surfaces. These low tem-peratures of desorption imply that a small molecule such asmethylamine is desorbed too easily to act as an effective cap-ping agent under the kind of ambient conditions where othercapping agents may work, for example, a long chain aminesuch as oleylamine. However, this study shows the selectivityof the methylamine functional group towards capping differ-ent FeS surfaces in a range of temperatures, thereby favouringthe expression of more reactive surfaces in the particle mor-phology. The low desorption temperature does of course meanthat the molecule is removed easily to produce the accessiblesurfaces required for heterogeneous catalytic reactions.
ACKNOWLEDGMENTS
N.Y.D. acknowledges the University College London foran Overseas Research Scholarship and N.H.dL. acknowl-edges Engineering and Physical Sciences Research Consul(United Kingdom) (EPSRC(GB)) for funding (Grant No.EP/H046313/1). This work made use of the facilities of HEC-ToR, the UK’s national high-performance computing servicevia our membership of the UK’s HPC Materials ChemistryConsortium, which is funded by the EPSRC (EP/F067496).The authors also acknowledge the use of the UCL@LegionHigh Performance Computing Facility, and associated sup-port services, in the completion of this work.
Downloaded 30 Sep 2013 to 128.40.76.3. This article is copyrighted as indicated in the abstract. Reuse of AIP content is subject to the terms at: http://jcp.aip.org/about/rights_and_permissions
124708-8 Dzade, Roldan, and de Leeuw J. Chem. Phys. 139, 124708 (2013)
1Y. M. Sui, W. Y. Fu, H. B. Yang, Y. Zeng, Y. Y. Zhang, Q. Zhao, Y. E. Li,X. M. Zhou, Y. Leng, M. H. Li, and G. T. Zou, Cryst. Growth Des. 10, 99(2010).
2B. Wiley, Y. G. Sun, B. Mayers, and Y. N. Xia, Chem.-Eur. J. 11, 454(2005).
3C. N. R. Rao, A. Müller, and A. K. Cheetham, in The Chemistry of Nano-materials (Wiley-VCH Verlag GmbH & Co., KGaA, 2004), pp. 1.
4N. V. Deshmukh, J. Electron. Mater. 36, 634 (2007).5N. V. Deshmukh, T. M. Bhave, A. S. Ethiraj, S. R. Sainkar, V. Ganesan,S. V. Bhoraskar, and S. K. Kulkarni, Nanotechnology 12, 290 (2001).
6N. V. Hullavarad and S. S. Hullavarad, Photonics Nanostruct. Fundam.Appl. 5, 156 (2007).
7I. Sondi, A. Siiman, and E. Matijevic, J. Colloid Interface Sci. 275, 503(2004).
8N. Gaponik, D. V. Talapin, A. L. Rogach, K. Hoppe, E. V. Shevchenko,A. Kornowski, A. Eychmuller, and H. Weller, J. Phys. Chem. B 106, 7177(2002).
9Q. Liu, C. L. Ren, J. F. Sun, J. H. Li, J. Ren, and X. G. Chen, Mater. Res.Innovations 13, 32 (2009).
10G. Kremser, T. Rath, B. Kunert, M. Edler, G. Fritz-Popovski, R. Resel, I.Letofsky-Papst, W. Grogger, and G. Trimmel, J. Colloid Interface Sci. 369,154 (2012).
11Y. Y. Kim and D. Walsh, Nanoscale 2, 240 (2010).12A. Kora, S. Beedu, and A. Jayaraman, Bioorg. Med. Chem. Lett. 2, 17
(2012).13A. Quintanilla, V. C. L. Butselaar-Orthlieb, C. Kwakernaak, W. G. Sloof,
M. T. Kreutzer, and F. Kapteijn, J. Catal. 271, 104 (2010).14D. P. Stankus, S. E. Lohse, J. E. Hutchison, and J. A. Nason, Environ. Sci.
Technol. 45, 3238 (2011).15P. D. Burton, T. J. Boyle, and A. K. Datye, J. Catal. 280, 145 (2011).16C. Kim, S. S. Kim, S. Yang, J. W. Han, and H. Lee, Chem. Commun. 48,
6396 (2012).17A. Ennaoui and H. Tributsch, Solar Cells 13, 197 (1984).18A. Ennaoui, S. Fiechter, H. Goslowsky, and H. Tributsch, J. Electrochem.
Soc. 132, 1579 (1985).19A. Ennaoui, S. Fiechter, W. Jaegermann, and H. Tributsch, J. Electrochem.
Soc. 133, 97 (1986).20S. S. Wang and R. N. Seefurth, J. Electrochem. Soc. 134, 530 (1987).21P. G. Moses, B. Hinnemann, H. Topsoe, and J. K. Norskov, J. Catal. 248,
188 (2007).22S. Yin, Z. C. Wang, and E. R. Bernstein, Phys. Chem. Chem. Phys. 15,
4699 (2013).23G. C. Chen, J. M. Zen, F. R. F. Fan, and A. J. Bard, J. Phys. Chem. 95, 3682
(1991).24O. C. Compton and F. E. Osterloh, J. Am. Chem. Soc. 129, 7793 (2007).25S. Lawrence, Properties and Applications (Cambridge University,
Cambridge, 2004), Vol. 19, p. 207.26K. F. Khaled and M. M. Al-Qahtani, Mater. Chem. Phys. 113, 150
(2009).27A. G. Baca, M. A. Schulz, and D. A. Shirley, J. Chem. Phys. 83, 6001
(1985).28I. Chorkendorff, J. N. Russell, and J. T. Yates, J. Chem. Phys. 86, 4692
(1987).29D. E. Gardin and G. A. Somorjai, J. Phys. Chem. 96, 9424 (1992).30F. Maseri, A. Peremans, J. Darville, and J. M. Gilles, J. Electron Spectrosc.
Relat. Phenom. 54–55, 1059 (1990).31D. F. Johnson, Y. Q. Wang, J. E. Parmeter, M. M. Hills, and W. H.
Weinberg, J. Am. Chem. Soc. 114, 4279 (1992).32S. Y. Hwang, A. C. F. Kong, and L. D. Schmidt, J. Phys. Chem. 93, 8327
(1989).33J. J. Chen and N. Winograd, Surf. Sci. 326, 285 (1995).34K. A. Pearlstine and C. M. Friend, J. Am. Chem. Soc. 108, 5842 (1986).
35S. Y. Hwang, E. G. Seebauer, and L. D. Schmidt, Surf. Sci. 188, 219(1987).
36M. E. Bridge and J. Somers, Vacuum 38, 317 (1988).37O. Borck, P. Hyldgaard, and E. Schroder, Phys. Rev. B 75, 035403 (2007).38O. Borck, I. H. Svenum, L. E. Walle, T. H. Andersen, K. Schulte, and A.
Borg, J. Phys. Condens. Matter 22, 395004 (2010).39D. Rickard and G. W. Luther, Chem. Rev. 107, 514 (2007).40A. R. Lennie, S. A. T. Redfern, P. F. Schofield, and D. J. Vaughan, Mineral.
Mag. 59, 677 (1995).41R. A. Berner, Science 137, 669 (1962).42J. H. Jeoung and H. Dobbek, Science 318, 1461 (2007).43W. Martin, J. Baross, D. Kelley, and M. J. Russell, Nat. Rev. Microbiol. 6,
805 (2008).44A. J. Devey, R. Grau-Crespo, and N. H. de Leeuw, J. Phys. Chem. C 112,
10960 (2008).45G. Kresse and J. Hafner, Phys. Rev. B 47, 558 (1993).46G. Kresse and J. Hafner, J. Phys.: Condens. Matter 6, 8245 (1994).47G. Kresse and J. Furthmüller, Phys. Rev. B 54, 11169 (1996).48S. Grimme, J. Comput. Chem. 27, 1787 (2006).49G. Kresse and D. Joubert, Phys. Rev. B 59, 1758 (1999).50P. E. Blöchl, Phys. Rev. B 50, 17953 (1994).51J. P. Perdew, J. A. Chevary, S. H. Vosko, K. A. Jackson, M. R. Pederson,
D. J. Singh, and C. Fiolhais, Phys. Rev. B 46, 6671 (1992).52S. H. Vosko, L. Wilk, and M. Nusair, Can. J. Phys. 58, 1200 (1980).53H. J. Monkhorst and J. D. Pack, Phys. Rev. B 13, 5188 (1976).54K. D. Kwon, K. Refson, S. Bone, R. M. Qiao, W. L. Yang, Z. Liu, and G.
Sposito, Phys. Rev. B 83, 064402 (2011).55A. Subedi, L. J. Zhang, D. J. Singh, and M. H. Du, Phys. Rev. B 78, 134514
(2008).56T. Bucko, J. Hafner, S. Lebegue, and J. G. Angyan, J. Phys. Chem. A 114,
11814 (2010).57P. G. Moses, J. J. Mortensen, B. I. Lundqvist, and J. K. Norskov, J. Chem.
Phys. 130, 104709 (2009).58S. D. Chakarova-Kack, O. Borck, E. Schroder, and B. I. Lundqvist, Phys.
Rev. B 74, 155402 (2006).59K. Johnston, J. Kleis, B. I. Lundqvist, and R. M. Nieminen, Phys. Rev. B
77, 121404 (2008).60D. J. Vaughan and M. S. Ridout, J. Inorg. Nucl. Chem. 33, 741 (1971).61S. Ishibashi, K. Terakura, and H. Hoson, J. Phys. Soc. Jpn. 77, 053709
(2008)62Y. F. Li, L. F. Zhu, S. D. Guo, Y. C. Xu, and B. G. Liu, J. Phys. Condens.
Matter 21, 115701 (2009).63D. J. Singh and M. H. Du, Phys. Rev. Lett. 100, 237003 (2008).64H. Y. Jeong, J. H. Lee, and K. F. Hayes, Geochim. Cosmochim. Acta 72,
493 (2008).65H. Ohfuji and D. Rickard, Earth Planet. Sci. Lett. 241, 227 (2006).66T. Iijima, H. Jimbo, and M. Taguchi, J. Mol. Struct. 144, 381 (1986).67O. Borck and E. Schroder, J. Phys. Condens. Matter 18, 10751 (2006).68H. E. Sanders, P. Gardner, and D. A. King, Surf. Sci. 331–333, 1496 (1995).69C. Oliva, C. van den Berg, M. H. Niemantsverdriet, and D. Curulla-Ferre,
J. Catal. 248, 38 (2007).70P. Coppens, X-Ray Charge Densities and Chemical Bonding (Oxford Uni-
versity Press, USA, 1997).71T. Shimanouchi, Tables of Molecular Vibrational Frequencies (National
Bureau of Standards, 1972), Vol. 1.72R. Hoffmann, Rev. Mod. Phys. 60, 601 (1988).73H. Wolff and H. Ludwig, J. Chem. Phys. 56, 5278 (1972).74A. Roldan, G. Novell, J. M. Ricart, and F. Illas, J. Phys. Chem. C 114, 5101
(2010).75K. J. Laidler and M. C. King, J. Phys. Chem. 87, 2657 (1983).76T. G. Cooper and N. H. de Leeuw, Mol. Simul. 28, 539 (2002).77T. G. Cooper and N. H. de Leeuw, J. Cryst. Growth 294, 137 (2006).
Downloaded 30 Sep 2013 to 128.40.76.3. This article is copyrighted as indicated in the abstract. Reuse of AIP content is subject to the terms at: http://jcp.aip.org/about/rights_and_permissions