Adhesion and coalescence of ductile metal surfaces and nanoparticles
17
Acta Materialia 51 (2003) 31–47 www.actamat-journals.com Adhesion and coalescence of ductile metal surfaces and nanoparticles Norma A. Alcantar a , Chad Park b , Jian-Mei Pan c , Jacob N. Israelachvili a,∗ a University of California, Department of Chemical Engineering, Materials and Materials Research Laboratory, Santa Barbara, CA 93106, USA b University of Arizona, Department of Biochemistry and Molecular Biophysics, Tucson, AZ 85721, USA c Rockwell Science Center, Thousand Oaks, CA, 91360, USA Received 13 April 2002; accepted 24 June 2002 Abstract Much more is known about material failure, such as fracture and crack propagation, than the reverse effect of material formation, i.e., how bulk materials form or consolidate during material processing or crack healing. Using the Surface Forces Apparatus, optical interferometry, optical and scanning probe microscopy, and x-ray diffraction, we have studied how gold and platinum films sinter or cold-weld at the nano-scale to form continuous bulk films when two initially rough surfaces composed of nanometer-scale asperities are pressed together. We find that coalescence of these ductile materials occurs abruptly, like a first order phase transition, once a critical local pressure or interparticle separation is reached. Simple thermodynamic and kinetic considerations suggest that it may be a more general phenomenon for ductile materials interacting at the nano-scale. We also make some qualitative comparisons with the very different behavior observed with hard, brittle materials. 2002 Acta Materialia Inc. Published by Elsevier Science Ltd. All rights reserved. Keywords: Metallic adhesion; Coalescence; Cold-welding; Interfaces; Nanoparticles 1. Introduction The adhesion and associated deformations of ideal (molecularly smooth, elastic) surfaces have been well studied and are now well understood both experimentally and theoretically [1,2]. For such surfaces, continuum theories have been found to hold surprisingly well both at the macroscopic ∗ Corresponding author. Tel.: +1-805-893-8407; fax: +1- 805-893-7870. E-mail address: [email protected] (J. Israelachvili). 1359-6454/03/$22.00 2002 Acta Materialia Inc. Published by Elsevier Science Ltd. All rights reserved. doi:10.1016/S1359-6454(02)00225-2 and microscopic length scales [3–5]. Today, there is great interest on the physical interactions of “real” or “engineering” surfaces, i.e., rough or pat- terned surfaces, ultra-thin films and nano-particles, and surfaces that do not deform reversibly (elastically) but plastically or viscoelastically. In such studies, experiment and theory have tended to focus on failure mechanisms, i.e., how new sur- faces are created when a material breaks, cracks or fractures; and there is now significant understand- ing of different failure mechanisms at both the macroscopic and molecular scales [6,7]. Here we describe results on what could be con-
Transcript of Adhesion and coalescence of ductile metal surfaces and nanoparticles

Acta Materialia 51 (2003) 31–47www.actamat-journals.com
Adhesion and coalescence of ductile metal surfaces andnanoparticles
Norma A. Alcantara, Chad Parkb, Jian-Mei Panc, Jacob N. Israelachvilia,∗
a University of California, Department of Chemical Engineering, Materials and Materials Research Laboratory, Santa Barbara,CA 93106, USA
b University of Arizona, Department of Biochemistry and Molecular Biophysics, Tucson, AZ 85721, USAc Rockwell Science Center, Thousand Oaks, CA, 91360, USA
Received 13 April 2002; accepted 24 June 2002
Abstract
Much more is known about materialfailure, such as fracture and crack propagation, than the reverse effect of materialformation, i.e., how bulk materials form or consolidate during material processing or crack healing. Using the SurfaceForces Apparatus, optical interferometry, optical and scanning probe microscopy, and x-ray diffraction, we have studiedhow gold and platinum films sinter or cold-weld at the nano-scale to form continuous bulk films when two initiallyrough surfaces composed of nanometer-scale asperities are pressed together. We find that coalescence of these ductilematerials occurs abruptly, like a first order phase transition, once a critical local pressure or interparticle separation isreached. Simple thermodynamic and kinetic considerations suggest that it may be a more general phenomenon forductile materials interacting at the nano-scale. We also make some qualitative comparisons with the very differentbehavior observed with hard, brittle materials. 2002 Acta Materialia Inc. Published by Elsevier Science Ltd. All rights reserved.
Keywords:Metallic adhesion; Coalescence; Cold-welding; Interfaces; Nanoparticles
1. Introduction
The adhesion and associated deformations ofideal (molecularly smooth, elastic) surfaces havebeen well studied and are now well understoodboth experimentally and theoretically [1,2]. Forsuch surfaces, continuum theories have been foundto hold surprisingly well both at the macroscopic
∗ Corresponding author. Tel.:+1-805-893-8407; fax:+1-805-893-7870.
E-mail address:[email protected] (J. Israelachvili).
1359-6454/03/$22.00 2002 Acta Materialia Inc. Published by Elsevier Science Ltd. All rights reserved.doi:10.1016/S1359-6454(02)00225-2
and microscopic length scales [3–5]. Today, thereis great interest on the physical interactions of“real” or “engineering” surfaces, i.e., rough or pat-terned surfaces, ultra-thin films and nano-particles,and surfaces that do not deform reversibly(elastically) but plastically or viscoelastically. Insuch studies, experiment and theory have tendedto focus onfailure mechanisms, i.e., how new sur-faces are created when a material breaks, cracks orfractures; and there is now significant understand-ing of different failure mechanisms at both themacroscopic and molecular scales [6,7].
Here we describe results on what could be con-

32 N.A. Alcantar et al. / Acta Materialia 51 (2003) 31–47
sidered the reverse of “ failure” , i.e., when twoinitially rough, deformable surfaces are brought orpressed together until they coalesce to form ahomogeneous bulk material. Such effects occurduring material processing, cold welding and crackhealing, but the fundamental mechanisms occur-ring at the molecular level, e.g., the transport anddiffusion mechanisms of atoms in the bulk and onsurfaces, are still not well understood [8]. Wedescribe experiments that have directly probed theinteraction forces, microscopic deformations andnano-scale (atomic) structural rearrangements oftwo initially rough surfaces of gold and platinumas they are pressed together until they fullycoalesce.
2. Experimental techniques
2.1. Sample preparation
Films of gold (Au), platinum (Pt), silica (SiO2)and silicon nitride (Si3N4) of varying thicknessranging from 5 nm to 100 nm were deposited on~2 µm-thick molecularly smooth mica substratesheets, or bare silica substrates in the case of Si3N4
[9], using a variety of deposition techniques to pro-duce either smooth or rough surfaces. The depo-sitions were carried out by electron beam evapor-ation (EBE) for gold and platinum [10,11] andplasma enhanced chemical vapor deposition(PECVD) for silica and silicon nitride [12]. Someof our results on these materials are compared withthose on previously studied spherical or rod-likenanoparticles of gold [13], tungsten disulfide WS2
[14,15] and BaCrO4 [16] with diameters andlengths in the range 5–10 nm and 20–50 nm,respectively. These nanoparticles were preparedusing standard techniques [13,17,18], and werestudied either in solution or after being depositedto form a dry layer on mica surfaces by solutionevaporation [14].
2.2. Surface and thin film imaging andcharacterization
The surfaces were imaged and characterized byAtomic Force Microscopy (AFM) using a Digital
Instruments Dimension 3000 AFM, Scanning Tun-neling Microscopy (STM) using a Digital Instru-ments Dimension 5000 and a Multimode Nano-scope III, and high-angle x-ray scattering using anXpert diffractometer. Some of the AFM images ofthe coated surfaces obtained soon after depositionand before they had been pressed into contact witheach other, are shown in Fig. 1.
2.3. Measurement of inter-surface forces anddeformations
The forces between the surfaces were measuredwith a Surface Forces Apparatus (SFA, Mk II andIII) [19,20] at the same time as the surfaces werevisualized with Multiple Beam Interferometry(MBI) using Fringes of Equal Chromatic Order(FECO) [21,22] as well as direct visualizationusing a normal optical microscope. The combinedSFA–optical interferometry technique allows forthe applied load and adhesion forces F to bedirectly measured as a function of the surface sep-aration or film thickness D with 1A (0.1 nm) resol-ution from large separations (microns) to contact,while simultaneously visualizing the shape (e.g.,surface radius R or flattened contact radius a) andother deformations of the surfaces in situ and inreal time at the nano-scale during an interaction(Fig. 2). The range of force-measuring spring con-stants used were varied from K = 300 to 2600 Nm–1, and the surface radii varied from R = 0.93 to2.1 cm.
2.4. Experimental procedure
In a typical experiment, two metal-coated sur-faces are brought towards each other as the forceF between them, which could be attractive orrepulsive, is measured as a function of their separ-ation D. During the approach the surfaces werecontinually visualized by recording the MBI–FECO fringes on a video camera, which could beused for later analysis of the deformations at differ-ent stages of the “ interaction” . After adhesive con-tact, coalescence, or non-adhesive closeapproach—which depended on the nature of thesurfaces, on whether the short-range force wasattractive or repulsive and on how much the sur-

33N.A. Alcantar et al. / Acta Materialia 51 (2003) 31–47
Fig. 1. AFM images of various surfaces before being brought into contact with each other in a Surface Forces Apparatus. The 100nm bar scale shown at the bottom is the same for all six images. (A) Uncoated mica surfaces before and/or after mica–mica contact(the featureless images are indistinguishable); (B, C) two gold-coated mica surfaces of average thickness 5.0 nm prepared undersimilar conditions showing asperities that are typically 2–10 nm high, 5–10 nm wide, and with an RMS roughness of ~0.7 nm perasperity; (D) platinum-coated mica surfaces; (E) silica surfaces, and (F) silicon nitride films.
faces were pressed together—the surfaces wereseparated and the mode of separation was alsorecorded (e.g., ‘mode one’ failure mechanism inthe case of adhesive contacts). Particular attentionwas given to instabilities occurring during theapproach and separation, where surfaces suddenlyjumped in or out (towards or away from eachother) by some finite distance �D. In situ imagingof the surfaces during an interaction was doneusing MBI–FECO interferometry and direct opticalmicroscopy; ex situ imaging and characterizationof the surfaces was done both before and after theSFA measurements as described above.
3. Results
3.1. Two gold-coated surfaces approaching eachother
Fig. 2 (A and B) shows images of two gold-coated mica surfaces as they are brought togetherin the SFA prior to coalescing. Each surface iscoated with a layer of gold of mass average thick-ness T = 5.0 ± 0.2 nm. The FECO images (rightcolumn in Fig. 2) show that the curved mica sub-
strates are smooth on the micro-scale, but the AFMimages (Fig. 1 B and C) show that the depositedgold films themselves are very rough on the nano-scale: the RMS roughness being of the same orderas the average film thickness. The left column inFig. 2 is a schematic of the gold system based onthe AFM and FECO images.
We first show some measured force–distancecurves or “ force profiles” where, by convention,the force F is normalized by the local surfaceradius R (typically 1–2 cm in these experiments).This is done because most intersurface force lawsor potential functions scale linearly with R [1] sothat by plotting F/R vs D one can compare theresults of different experiments or experimentaltechniques where the surface radii R may be verydifferent. On bringing two gold-coated surfacestogether (Fig. 3) a complex rate- and time-depen-dent repulsive force is measured that is also irre-versible: subsequent approaches and separationsbeing different from the first. The repulsion musttherefore be due to the plastic compression of indi-vidual asperities on the gold surfaces which aresoft and ductile, as shown schematically in Fig. 2B.The repulsive force is approach-rate-dependent andexhibits inward “creep” . At close separations, the

34 N.A. Alcantar et al. / Acta Materialia 51 (2003) 31–47
Fig. 2. Schematic and interference fringe (FECO) images ofthe interacting surfaces, and definition of measurable parameters.(A) left column: schematic of geometry of two cylindricallycurved coated surfaces in the “crossed-cylinder” configuration(equivalent to a sphere of radius R approaching a flat surface)in SFA experiments. The deposited films had either smooth orrough surfaces, or were composed of isolated islands or nanopar-ticles. Typical values: R – initial undeformed microscopic radiusof surfaces (R�1 cm); r – radius of local nano-junction(estimated from AFM and STM images to be r�1�10 nm); a –radius of molecular contact circle; D – smallest mica–mica dis-tance between two curved surfaces, or the separation (uniformfilm thickness) between two flat surfaces (D = 0 to �1 µm); T –mean deposited film thickness per surface (T�5�100 nm); �T –root mean square smoothness or asperity height distribution asdetermined by AFM or STM (�T�0.1�10 nm); F – normalforce or externally applied load. (A) right column: correspond-ing FECO image of two well-separated (D�100 nm) gold-coatedmica surfaces of mean layer thickness: T = 5.0 ± 0.2 nm persurface. The shape and sharpness of the smooth rounded fringesindicate uniformly smooth surfaces at the micro-scale eventhough they are rough at the nano-scale (cf. Fig. 1 B, C). Dueto the presence of the light-absorbing gold layers, the FECOfringe patterns (FECO images) have alternate bright and darkregions (16). (B) left column: gold-coated surfaces as in A undera compressive force just before jumping into first metal–metalcontact (coalescence) from a surface separation of DJ�20 nmto D0 � 10 nm, as shown in panel C. (B) right column: corre-sponding FECO image of gold-coated surfaces prior to spon-taneous coalescence. Note the absence of any significant defor-mation or flattening of the local microscopic (in contrast to thenanoscopic) radius R. (C) left column: gold-coated surfaces incontact after spontaneous coalescence. (C) right column: corre-sponding FECO image showing perfectly flat (uniformly thick)film of thickness D0 � 10 nm and diameter 2a � 50 µm.
surfaces slowly creep towards each other at a rateof the order of nm/sec even when the externallyapplied force F is kept constant. Close examinationof the inwardly drifting fringes showed that theirmotion was of the stick–slip or “creep–slip” type—involving small inward jumps in addition to steadycreep. This is precisely the type of behavior thatwould be expected when the compressive pressuresat the tips of the contacting asperities exceed theiryield strength. For example, at point P in Fig. 3Bwhere the normalized force F/R is � 10Nm�1, theforce itself is F � 10 × R � 0.1N (since R = 0.93cm in this case). If all of this force were concen-trated at N junctions constituting the outermostnano-asperities each having a flattened contactradius of r = 5 nm (a typical value for the asperitydimensions as determined from the AFM imagesshown in Fig. 1), then the local pressure at eachjunction would be of orderP�F /Npr2�1015 /N Nm�2 � 106 /N GPa. Thus,even if 1000 nano-junctions were contacting withinthe micro-junction, the local average pressure oneach would still be of order 1000 GPa, which gre-atly exceeds even the maximum theoretical yieldstrength of crystalline, defect-free gold of 12GPa [23].
One of the effects of creep is that the forceneeded to bring the surfaces into contact decreasesas the approach rate is decreased, i.e., the measuredrepulsive force profile is rate- or time-dependent,and therefore not the true equilibrium force–dis-tance function. This can be readily seen by com-paring the repulsive force curves of Fig. 3 A, Band C, where a roughly tenfold decrease in theapproach rate reduced the force needed to bringthe surfaces into contact by more than an order ofmagnitude. Such large variations are never seen inmeasurements of non-contact interactions betweensurfaces, for example, in measurements of long-range van der Waals or electrostatic forces [1]. Norwere they seen in force measurements betweenhard, brittle surfaces, discussed below.
3.2. Jump instability into “ contact”
Independently of the samples tested and theirapproach rate, at some well-defined critical separ-ation, DJ, there is an abrupt turn-around in the

35N.A. Alcantar et al. / Acta Materialia 51 (2003) 31–47
repulsive force as the two surfaces spontaneously“ jump-in” from DJ to strongly adhesive contact atD0. Just before the jump the surfaces are stillrounded, as determined from the FECO patterns(Fig. 2B), but after the jump they become com-pletely flat throughout the entire contact area (Fig.2C). Quantitatively, this uniform flatness impliesthat the thickness D0 of the collapsed film is alsouniform to within a few angstroms across the entirecontact area of diameter 50–100 µm. Significantly,the spontaneous jump-in and flattening takes afinite time of ~1.0 sec, as ascertained by monitor-ing the changing shape of the video-recordedFECO fringes with time (at 50 fps correspondingto 0.02 sec intervals). Typically, the jump-in takesabout 0.1 sec, followed by an even slower growthof the flattened (contact) region that takes a further0.5 sec. Both of these events are very much slowerthan when two molecularly smooth surfaces jumpinto contact due to, for example, van der Waalsforces in air or even in a liquid medium such aswater. For the later case, the viscous dampingslows down the jump-in and adhesive flattening,but the whole process is over in less than one videoframe (0.02 s) [24]. As discussed below, the dis-tance DJ and magnitude F/R of the forces at whichthe surfaces jump into adhesive contact are alsoinconsistent with a van der Waals attraction.
Fig. 3D shows the very different force profilesobtained with rough silica surfaces in dry air wherethe force was monotonically repulsive at all separ-ations, largely reversible and creep-free, and withno measurable adhesion (in humid air, capillarycondensation of water around the contacting hyd-rophilic asperities gives rise to an adhesive forcedue to the Laplace pressure and resolved surfacetension of the water bridges). Similar monoton-ically repulsive force profiles are observed betweenother rough but hard, brittle material surfaces suchas alumina (Al2O3), Si3N4 and SiO2, as has beenpreviously reported in the literature [9,25,26], indi-
Fig. 3. A, B, C: Measured force–distance curves, F(D)/R, onfirst approach showing a spontaneous “ jump in” from DJ to con-tact at D0 and a “ jump out” on separation for a number of differ-ent gold-coated surfaces of radius R = 0.02 or 0.0093 m meas-ured at decreasing approach–separation (loading–unloading)rates. D: Monotonically repulsive force measured between two
rough (and porous) silica surfaces [12,47].
36 N.A. Alcantar et al. / Acta Materialia 51 (2003) 31–47
cating that the “contact mechanics” and “adhesionmechanics” of such materials and surfaces must becompletely different.
Fig. 4 is a schematic that summarizes the essen-tial features of the force profiles measured betweensurfaces of gold, as well as between platinum in air(described below) and between iron oxide surfacestotally immersed in aqueous solutions as pre-viously reported without comment [25,26]. In allof these cases the forces at the jumps into adhesive“contact” are much stronger than can be accountedfor the long-ranged van der Waals attractionbetween the surfaces. We suggest that Fig. 4 maybe considered to be the generic qualitative forceprofile for ductile materials and surfaces, where thequantitative magnitudes of the forces and distanceswill depend on the material properties, the size ofthe surface nano-asperities, and on the approach orcompression rate.
Fig. 4. Schematic of typical force–distance curves measuredbetween gold- and platinum-coated surfaces in air, and ironoxide-coated surfaces in water, showing some of the criticalparameters in the force–distance curves on approach and separ-ation.
3.3. Two gold surfaces in contact
The gold film that is now trapped between thetwo mica surfaces has all the characteristics of thebulk material: the film is uniformly thick through-out the whole macroscopic contact area with athickness of D0 = 10.5 ± 0.5 nm that is exactly orvery slightly more than twice the mean thickness2T = 10.0 nm of the originally deposited layers onthe mica surfaces. The slightly thicker coalescedfilm is attributed to the trapping of highly com-pressed sub-microscopic air bubbles within the“cold-welded” fi lm (Fig. 2C). Such bubbles couldsometimes be seen near the edge of a contact zonein the optical microscope images (see Fig. 6Clater). Further properties of such films wereobtained after the surfaces were separated usingAFM and STM imaging, and x-ray scattering, asdescribed later.
These results, and others yet to be described,indicate that the two films have coalesced ratherthan simply come into adhesive contact, as illus-trated in Fig. 2C. “Adhesive contact” is heredefined and distinguished from “coalescence” asfollows: in adhesive contact the original surfacesremain distinguishable from the bulk at the contactinterface, for example, by a grain boundary or anoxide layer, and subsequent separation usuallyoccurs at this interface. Coalescence implies thecomplete disappearance of the original surfaces orany memory of the initial contact interface. Sub-sequent separation or failure can occur anywherewithin the material. Similar qualitative obser-vations of coalescence or cold welding by gold sur-faces and films have been reported by Knarr et al.[27] and by Ferguson et al. [8] who also com-mented on the “ remarkable effect” of the coldwelding of gold surfaces at low loads under ambi-ent conditions. One may also mention the well-known malleability of gold, which has been usedfor centuries to produce uniform gold films andgold plate by simple cold rolling or pressing cleangold particles [28].
Further quantitative insights into the micro- andnano-scale “contact mechanics” and “adhesionmechanics” of these systems were obtained by car-rying out loading–unloading cycles or “JKR plots”on each sample when the surfaces were in contact.
37N.A. Alcantar et al. / Acta Materialia 51 (2003) 31–47
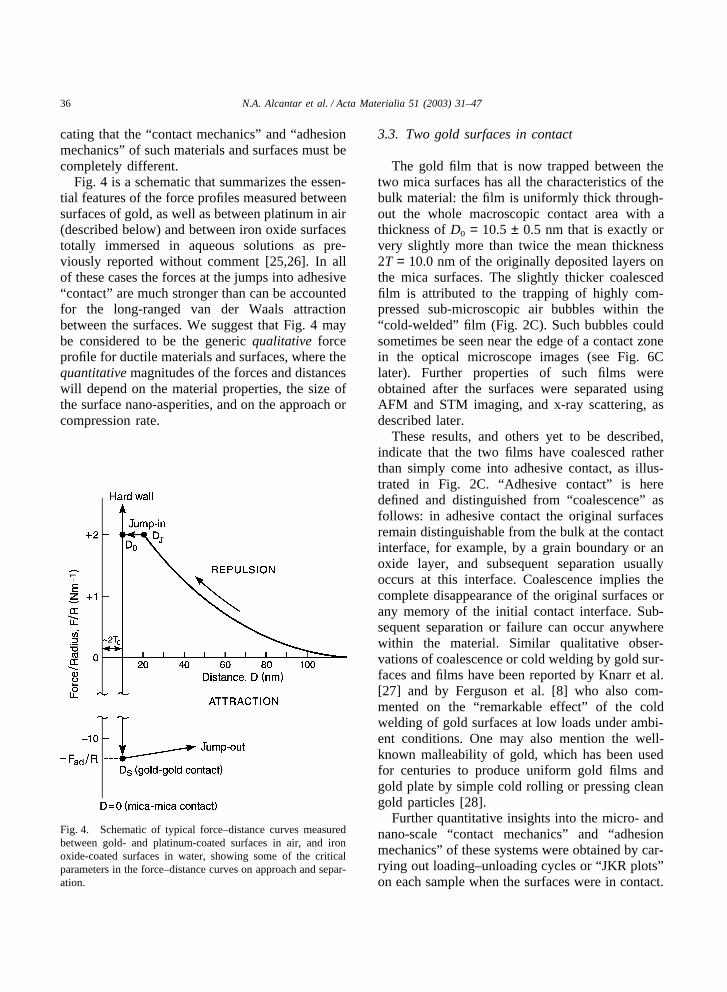
Fig. 5. “JKR plots” giving the first loading–unloading paths for the contact radius a versus applied load F for a number of differentcoalesced gold surfaces of initially undeformed radii R at different approach (loading) and separation (unloading) rates. Three differentcurves reflect the change observed in the separation process from sudden failure at high rates (A) to near JKR-like peeling at lowrates (C). (A)–(C): Same sample pair studied at different surface locations and decreasing rates. (D): Different sample (with differentsurface radii R) studied at an intermediate rate between (B) and (D). Solid lines in (C) and (D): best fit theoretical curves based onthe JKR equation, Eq. (1). At the lowest rate (curve C) the JKR fit to the unloading branch yielded γ=0.43 J m–2. On the other hand,the jump-out at F=Fad occurred at a value corresponding to g � Fad /3pR � 0.029/3pR � 0.33Jm�2 when calculated using Eq. (2).
In the Johnson–Kendall–Roberts (JKR) theory ofcontact mechanics [2], under ideal, elasticallyreversible conditions the loading and unloadingbranches of a versus F are the same (reversible)and given by [1,2]:
a3 �RK
[F � 6pRg � �12pRgF � (6pRg)2] (1)
and the adhesion or pull-off force Fad on separ-ation is given by
Fad � �3pRg (2)
where R is the initial, undeformed radii of the sur-faces, a the contact radius and F the applied load,as before, and where g is the surface energy or sur-
face tension, and K is the Young’s Modulus of thematerials. Eqs. (1) and (2) have been well verifiedon molecularly smooth elastic surfaces of knownsurface energies [22,27].
Fig. 5 shows a few representative JKR plotsobtained on different gold-coated samples and atdifferent loading–unloading rates. As in the caseof the non-contact long-range repulsive forces ofFig. 3, the loading–unloading curves for surfaces incontact were also highly rate-dependent, exhibitingqualitatively similar (creep) behavior in the sensethat faster rates exhibited higher pull-off forces Fad.Lower approach-separation rates resulted in morereversible and more “JKR-like” curves, describableby Eq. (1). However, other factors also appeared

38 N.A. Alcantar et al. / Acta Materialia 51 (2003) 31–47
Fig. 6. Various images of two gold-coated surfaces in contactin the SFA (each image corresponds to a different experimentor contact location): (A) Optical microscope interference imageusing monochromatic light (Newton’s rings). (B) FECO fringesusing white light (similar to Fig. 2C but for a differentexperiment). (C) Normal optical microscope image using whitelight of a compressed contact region showing the boundariesimmediately after initial coalescence (inner rim) and afterfurther slow compression (outer rim).
to influence the magnitude and hysteresis in thesecurves, including the maximum load applied dur-ing a cycle, variations in the sample preparationmethods, and natural aging (over periods of days).Concerning the latter, the longer the time betweendeposition and contact—during which time thesamples were generally kept in an evacuated desic-cator—the higher was the pressure needed toinduce coalescence. This effect is attributed to theprogressive accumulation of organic contaminantson the surfaces even when stored in a relativelyclean environment (AFM imaging showed no obvi-ous change in the nano-scale morphology of thesurfaces with time). Freshly prepared samples werealso found to coalesce much faster and over largerareas than aged samples. Fig. 6 shows differentviews (images) of contact zones after coalescence,showing that the contacts are generally round andthat the coalesced films have a uniform thicknesswithin a few angstroms throughout, as previouslyillustrated schematically in Fig. 2C.
Regardless of the experimental conditions, noneof the measured loading–unloading curves exhib-ited classic, reversible JKR behavior: for each sam-ple the unloading curve is well above the loadingcurve, indicating that a much higher force isneeded to separate the surfaces or break the filmthan to form it. At high approach rates (�1000A/s) neither the loading or unloading curves couldbe fitted by the JKR equation, Eq. (1). The loadingbranches tended to be steep, indicating that thecontact area, once formed, did not increase withload as rapidly as would be expected from the JKRtheory. However, the pull-off force Fad was oftenclose to the value given by Eq. (2) for surfaceshaving the surface tension of gold, as describedin the next section. The unloading and separationmechanisms are described in more detail the nextsection.
3.4. Two gold surfaces being separated fromeach other
Two coalesced surfaces could be separated byreducing the externally applied load F to highnegative values until separation or “pull-off”occurred at F = Fad when the surfaces spon-taneously jumped apart. In classic JKR behavior,

39N.A. Alcantar et al. / Acta Materialia 51 (2003) 31–47
spontaneous separation is characterized by a two-step process that occurs at the end of the unloading(reversible peeling) curve: a sudden and rapiddecrease in the contact radius (irreversible peeling)followed by the detachment (jump-out) of the sur-faces. In the present case, the process does notappear to occur via an initial reversible peelingapart of the surfaces except at very low separationrates (cf. Fig. 5C). Instead, on unloading, the areaof the contact circle does not initially fall, or itfalls much less rapidly than expected from the JKRequation, until just before pull-off when it dropsprecipitously (cf. Fig. 5 A, B).
The abrupt, non-JKR-like drop in the contactradius a just before rapid separation is indicativeof a discontinuous reduction in the effective sur-face or adhesion energy γ.1 This can be understoodby considering the boundary as a “crack tip” thatmoves from the high-energy gold–gold interface tothe lower energy gold–mica interface, as discussedmore fully later and illustrated in Fig. 7 C→E. Wemay note that the surface energy of gold is 1.14–1.41 J m–2, while the value for the mica–gold inter-face is estimated to be in the range 0.18–0.29J m–2 [29]. Apparently, the separation occurs viatwo stages: (i) crack-like failure of the gold filmat the rim (the “crack tip” in Fig. 7C), followed by(ii) the peeling of gold from mica, which has amuch lower surface energy (Fig. 7D) until the sur-faces finally detach (Fig. 7E). The dominant stagedepends on the unloading or separation rate as canbe seen in the JKR plots of Fig. 5 and sche-matically in Fig. 7. Thus, at highseparation/unloading rates, rupture occurred at thegold–gold boundary, the contact radius a at pull-off was high, and the adhesion force was determ-ined by the higher gold–gold adhesion energy (Fig.5A and B, and Fig. 7 C→E). In contrast, at lowerseparation rates, the gold–gold boundary brokemore readily and early on in the unloading cycle(presumably due to creep) after which the separ-ation proceeded via a peeling of gold from mica
1 Even though γ can be denoted by Gc (stress energy releaserate) during a fractal process, we are using rate to describe thechange of energy per time. For the same energy process, wefound different mechanisms due to a change ofloading/unloading rate.
Fig. 7. Proposed modes of coalescence and separationdepending on the approach and separation rates, resulting in thesame configuration contact (C) as well as after separation (E)where the gold film remains firmly attached to one of the twosurfaces. The critical geometry just before the collapse insta-bility occurs at (B) where the local radius of curvature rc, givenby 1/rc � 1 /ru � 1/r�1/r (for ra � r) has fallen to a valuewhere Eq. (3) is satisfied.
(Fig. 5C and Fig. 7 C→D→E). Under these con-ditions, pull-off occurred at a smaller contactradius and the adhesion force was determined bythe lower gold–mica adhesion energy.
For example, at the “ low” separation rate of 31nm/sec (Fig. 5C), Fad~0.029 N (~29 mN). This cor-responds to a surface energy of g �Fad / 3pR�0.33 Jm�2, which is only slightly
higher than the surface energy of the gold–micainterface (0.18–0.29 J m–2) but much lower thanthe surface energy of gold. In comparison, at the“high” separation rate of 260 nm/sec (Fig. 5A), theadhesion force and corresponding effective surfaceenergy at pull-off were Fad = 0.12 N and g = 1.4J m–2, respectively, which is four times larger and

40 N.A. Alcantar et al. / Acta Materialia 51 (2003) 31–47
close to the value for bulk gold.2. The increasedirreversibility (hysteresis) in the loading–unloadingcurves at higher separation rates and maximumapplied loads, accompanied by the increased rup-ture force, is consistent with previous rate-depen-dent adhesion studies on viscoelastic polymer sur-faces [30].
At pull-off, the two surfaces jump out abruptlyand rapidly from “contact” at D = D0, i.e., there isno creeping out or thickening of the film prior toseparation, although dangling or bridging goldflakes due to tearing were sometimes observed nearthe boundaries which also affected the final pull-off (cf. boundary tearing in Fig. 3C and Fig. 5C).Inspection of the separated surfaces using a varietyof techniques shows that the gold film remains tot-ally attached to one of the mica surfaces, leavingthe other surface clean and gold-free, as shown inFig. 8.
Fig. 8 also shows that the gold films, while hav-ing uniform thickness and bulk density aftercoalescence, are atomically smooth even thoughthey are totally featureless (non-crystalline), sug-gesting that they are amorphous or at least highlypolycrystalline. To pursue this question further, weperformed x-ray measurements on our as-depositedand coalesced gold films. Fig. 9 shows that boththe rough (pre-coalescing) 5 nm-thick gold filmsand the smooth (post-coalescing) 10 nm-thick filmsare polycrystalline at the nano-scale, with a meangrain size of 2.6 nm. Since this size is smaller thanthe original mean asperity dimensions (cf. Fig. 1B, C), it is likely that each asperity is polycrystal-line and that on coalescence these condense intothe bulk material while maintaining their originalgrain size. If so, this has important implications forthe coalescence mechanism as discussed below.
2 The “ recommended” values for the surface tension of goldat its bulk melting point of 1064 °C are γSV = 1.41 J/m2 (N/m)for the solid–vapor interface and γLV = 1.14 J/m2 (N/m) forthe liquid–vapor interface. The value at room temperature,where the experiments were conducted, is unknown althoughone value of γSV = 1.175 ± 0.093 J/m2 (N/m) has been meas-ured at 50 °C [29]
3.5. Subsequent approaches and separations
As could be expected, after the first separation,the forces and deformations on the second and sub-sequent approaches are totally different from thefirst one, since the two surfaces are now com-pletely different from the original rough but sym-metrical surfaces. Fig. 10 shows images of sub-sequent “contacts” that illustrate this point.
Fig. 8. Various images of different parts of the contact regionof the two gold-coated surfaces after separation and removal ofthe surfaces from the SFA chamber. The bottom surface hasthe gold layer, as shown schematically in Fig. 7E. (A) Opticalmicroscope image of the top surface, and (B) complementarybottom surface; (C) AFM tapping mode image of bottom mica-gold surface after separation showing the round boundary separ-ating the smooth mica surface from the uncoalesced rough 5nm-thick gold film (cf. Fig. 1 B and C); (D) AFM image oftop mica-gold surface showing a 10 nm-thick gold mesa; (E)AFM image of 10 nm-thick bottom gold surface showingregions of torn up mica nano- flakes of thickness 2.0 nm corre-sponding to the crystallographic layer thickness (distancebetween cleavage planes) of the mica lattice; (F) high-resol-ution STM image of bottom, conducting gold surface using thesame instrument and tip as in G showing a featureless butsmooth gold surface (STM images obtained with the help ofBede Pittenger of DI-Veeco Corp., Santa Barbara, CA). Thecomplementary top surface was nonconducting due to theabsence of the gold layer and produced no STM image. (G)“control” high resolution STM image of graphite surface usingthe same tip as in (F).

41N.A. Alcantar et al. / Acta Materialia 51 (2003) 31–47
Fig. 9. Wide-angle x-ray spectra of freshly deposited gold onmica sheets before and after they were brought into contactunder a light force (pressure �1 atm) for a few seconds beforebeing separated. The two sheets, typically 5 cm × 5 cm in size,were cut from the same coated sheet and were brought intocontact over about half of their area. After contact and separ-ation, large dark areas (cf. Fig. 8B) of average dimensions 10mm × 10 mm of gold could seen on one of the surfaces withcomplementary bright areas (cf. Fig. 8A) on the other. In thecase of surfaces that had coalesced under zero or minimalapplied pressure the boundaries between the bright and darkregions were often identified to be located at steps in the micabasal plane. (A) X-ray spectrum of gold-coated mica surfacethat had not been brought into contact with the other gold-coatedsurface (average T=5.0 nm). (B) Dark gold-coated mica surfaceafter contact and separation. The doubling of the gold peak rela-tive to that in (A) indicates twice the surface coverage. The goldpeak was totally absent from uncoated mica surfaces, and a verysmall gold peak was sometimes discernable on complementary(bright) surfaces after separation. The x-rays penetrated about1 µm into each sheet and therefore sampled both the 5–10 nmgold layers and underlying mica substrates. The mica peaks (notshown) are sharp, indicative of a highly ordered crystallinematerial, while the gold peaks at 2q � 38�C are broad, with ahalf-width of �q � 1.5�, indicative of highly polycrystallinefilms with an average grain size of ~26 A (C. Safinya, privatecommunication) both before and after coalescence.
Fig. 10. Images of surfaces after multiple contacts and separ-ations. (A) Gold films after several contacts; (B) platinum filmsafter several contacts; (C, D) FECO fringes after multiple con-tacts, showing non-uniform films; (E, F) optical microscopeimage of complementary contact regions showing materialtransfer on both surfaces after multiple contacts; (G, H) AFMimages of complementary surfaces after multiple contactsshowing the same effects as in E and F but at 100 timeshigher magnification.
3.6. Other ductile metal surfaces: platinum inair and iron oxide in water
We have obtained qualitatively similar resultswith EBE-deposited films of platinum in air, andPECVD-deposited films of iron oxide, Fe2O3 orFe3O4, in water [31], both of which are ductileunder these conditions. Some of the images andforces obtained on these surfaces were brieflydescribed, e.g., in Fig. 8B and in ref. [25], butneither of these materials was studied in the samedetail as the gold surfaces.

42 N.A. Alcantar et al. / Acta Materialia 51 (2003) 31–47
3.7. Brittle surfaces: silica, alumina, inorganicnanoparticles
With hard, brittle, rough, surfaces of α-alumina(sapphire) deposited by thermal evaporation [32],amorphous silica deposited by PECVD [12], andSi3N4 surfaces [9], no spontaneous adhesion orcoalescence is observed: the long-range forces aremonotonically repulsive at all separations, becom-ing increasingly more repulsive, rather than attract-ive, at smaller separations. These surfaces neveradhered to each other, or only very weakly, evenwhen pressed together under a large force for along time (hours at room temperature), and theforce curves were fairly reversible.
3.8. Nature of the long-range repulsive force
For all the rough surfaces studied, the repulsivelong-range forces were found to be smooth andmonotonic even when the AFM and FECO imagesshowed that the surfaces were highly disordered or“unstructured” . Clearly, some very effective “aver-aging” must be occurring to result in the highlysmooth force curves observed on these and otherrough systems. In most cases the forces are foundto increase either exponentially as a function of thesurface separation (cf. ref. [17] and Fig. 3D)although linear force–distance profiles have alsobeen observed [15]. The reasons and implicationsof these apparently generic interaction forces arediscussed below.
4. Discussion and analysis
4.1. Coalescence mechanism of ductile materials
The apparent complexity of the results obtainedwith ductile surfaces appears to have a very simplethermodynamic explanation that is both qualitativeand quantitative, and that should apply to otherductile materials and coalescence phenomena. Wefirst summarize our main findings on gold whichare based on 12 separate measurements in four dif-ferent experiments (i.e., an average of three differ-ent contacts per sample pair of gold-coated
surfaces3). In each case, irrespective of theapproach rate, the repulsive force, and force-meas-uring spring constant K, the spontaneous jump-indistance from DJ to D0 (cf. Fig. 4) was consistentlythe same at �D � DJ�D0 � 10.0 ± 0.5 nm.
Now, a turn-around in any long-range repulsiveforce at small separations between two smooth sur-faces may be expected to occur due to the long-range attractive van der Waals force (cf. Ref. [2],Chapters 11 and 12). However, in the present casethe attractive force needed to overcome the repul-sion at a surface separation of �D � DJ�D0 �10nm is far too strong to be accounted for by the
van der Waals interaction, given by F /R � �A /6�D2 , where the Hamaker Constant A for met-als is typically A�5 × 10�19J. Thus, at a surfaceseparation of ~10 nm the attractive van der Waalsforce is expected to be of order F /R��10�3 Nm,which is far too low to account for the measuredjumps into contact from such separations (cf.forces at DJ in Fig. 3). Moreover, the jump-in dis-tance did not vary from sample to sample, and wasconsistently the same even when (i) the repulsiveforce was different, e.g., due to creep, (ii) the sur-faces had different radii R (between 0.9 and 2.1cm), and (iii) the force-measuring springs had dif-ferent stiffnesses (between 300 and 2600 N/m), allof which should have affected the point of insta-bility DJ and jump-in distance DJ–D0.
On the other hand, �D is well accounted for bythe separation, 2r, at which the (negative) LaplacePressure of a concave surface, P � g /r 4 reachesthe tensile strength S (also known as the ultimate
3 The crossed-cylinder geometry used in the SFA experi-ments allows the study of different contact positions using thesame pair of surfaces in any particular experiment. This is achi-eved by relocating (reclamping) the top and bottom surfaceslaterally in the x and y directions, respectively, after eachmeasurement before repeating the measurement between two“ fresh” positions. Such relocations cannot be done in experi-ments between two spheres or a sphere (tip) and a flat surfaceunless one or both surfaces are also rotated between successivemeasurements, which is technically much more difficult to do.
4 In general, the Laplace Pressure is given in terms of thetwo orthogonal radii of curvature by P � g[1 /r1 � 1/r2]. In thepresent geometry, after the asperities have been compressed,the second radius is likely to be much larger than r (cf. Fig.1b) and so may be ignored in this approximate analysis.

43N.A. Alcantar et al. / Acta Materialia 51 (2003) 31–47
strength or breaking stress) of gold. We havealready shown that the gold asperities or nanopart-icles are polycrystalline and that the local pressuresat the contacting nano-junctions must be extremelyhigh—estimated above to be of order 1000 GPa.This high local pressure will result in a local elasticor plastic flattening (Fig. 7A) followed by coalesc-ence or cold welding (Fig. 7B) once the surfacesbreak through any layer of adsorbed water ororganic molecules that may be trapped betweenthem. On further compression, as the film thins, thediameter of the coalesced junctions will increase.Concurrently, based on our observations, slowcreep may also occur even under a constant exter-nal force, which further drives the surfaces togetherand spreads out the junctions. At some point, thelocal concave radius r of the junctions (Fig. 7Binset) reaches a small enough value such that thenegative (i.e., tensile) Laplace Pressure γAu/r willexceed the tensile strength of gold SAu.5 At thiscritical point, the junction(s) will spread outindefinitely, causing the whole film to collapse(coalesce) into a single continuous layer. And thejump distance �D � DJ�D0 will be simply 2r. Ingeneral, we should expect an instability to occurat a critical distance �Dc defined by
�Dc � 2rc�2g /S (3)
which gives the condition when the local tensilepressure between two contacting asperities equalsthe tensile strength. For bulk gold, using g �1.14Jm�2 [33]6 and S � 225 ± 25 MPa [34], we
obtain 2g /S � 10.1 ± 1.0 nm. This is preciselywithin the narrow range of the measured jump-indistances �D of 10.0 ± 0.5 nm.
5 Strictly, the local radius of curvature is given by 1 /rc �1/ra � 1 /r. However, for well spread-out junctions we have
ra�r, so that rc is effectively the same as r, which in turn isdirectly proportional to the collapse distance �D.
6 Unless stated otherwise, values quoted for γ refer to thebulk liquid state γLV at the melting point of 1064 °C (cf. Foot-note 2). The value at room temperature, where the experimentswere conducted, is unknown although one value of gSV �1.175 ± 0.093 Jm�2 (N/m) has been measured at 50 °C, which
is essentially the same as the value of γLV at the melting point.The surface energies of platinum and ductile iron at 25 °C are:gSV � 1.95 Jm�2 and gLV � 1.80 Jm�2 for platinum, andgSV � 1.91 Jm�2 and gLV � 1.86 Jm�2 for ductile iron.
We now analyze some of the assumptionsinherent in the above, purely thermodynamic, pro-cess or mechanism. These include (i) the effectivevalue of γ, (ii) the effective value of the tensilestrength S, (iii) the role of the local geometry ofthe asperities or nano-junctions in determining theeffective value of r and the collapse distance �D,and (iv) the dynamics of the collapse.
1. Adsorbed organic contaminants on the gold sur-face is expected to decrease the effective γ, butthe effect is expected to be small because thesurface energies of organic materials are usuallyvery low in comparison to those of metals. Forexample, if a thin layer of organic material hav-ing a typical surface energy of 30 mJ m–2 ispresent on the gold surface, this does not meanthat the surface energy of the whole surface fallsto this value, which would imply a decrease of97%. When the surface area changes, both theorganic–vapor and the metal–organic interfaceschange their areas, and the net energy change(per unit area) of this “duplex” surface will beapproximately the same as that of a single cleangold surface. This effect can be quantified byconsidering a surface to be composed of a solid–film interface and a film–vapor surface of sur-face energies γsf and γfv, respectively. The netinterfacial energy γtot of the duplex surface willtherefore be γsf + γfv, which can be split into thefollowing components [1]: gtot � gsf � gfv �(gsv � gfv�Wsf) � gfv. Now, the work of
adhesion, Wsf, of a metal–organic surface (invapor) is typically of order 0.1 mJ m–2 [35,36],so that for γsv = 1.14 J m–2 and γfv = 0.03 J m–
2, we obtain gtot�1.10Jm�2, which is only 3.5%less than the value for a clean gold surface.7
2. The x-ray spectra obtained on the gold-coatedsurfaces (Fig. 9), both before and after coalesc-
7 A similar situation arises when a thin liquid layer (ofmolten solid) covers a solid surface, as often occurs at a metal–vapor surface that actually consists of a metal–melt and a melt–vapor interface. For example, for gold, the solid–melt interfacehas a surface energy of 0.15–0.29 J m–2 [29,35], while the melt–vapor interface has a surface energy of 1.14 J m–2. These addup to 1.29–1.41 J m–2 which is the same or only slightly belowthe value for the solid–vapor surface of 1.41 J m–2 [29].

44 N.A. Alcantar et al. / Acta Materialia 51 (2003) 31–47
ence, show that the films were highly polycrys-talline with a mean grain size of 2.6 nm, whichis smaller than the radius of the surfaceasperities. The AFM and STM images (Fig. 8)showed completely featureless surfaces, consist-ent with the x-ray data. For such films the bulktensile strength would therefore be the appropri-ate value to use in Eq. (3). More perfectly crys-talline surfaces or asperities would be expectedto have significantly higher values, e.g., of order12 GPa for gold [36], and for this reason (aswell as others mentioned below) we would notexpect such behavior to be observed for allmaterials or even for the same materials pre-pared under different conditions.
3. Based on the results of different experimentsreported here, the asperity geometry appears toplay little role in determining the critical col-lapse distance �Dc although it plays animportant role in determining the range andmagnitude of the repulsive force before and atthe instability. Eq. (3) shows that no instabilityor collapse is expected to occur so long as thelocal surface radius of curvature r remainsgreater than the critical radius rc � l /S. Fig. 7(insets A→B) shows how a local radius thatfalls below rc may still not cause an instabilityif the coalesced region can grow laterally, i.e.,reduce its curvature via surface or bulk dif-fusion, as discussed below, until the radiusreaches or exceeds rc. thereby relaxing the ten-sile pressure to below S. But once the surfacesare closer than 2rc, further relaxation of the localpressure via outward growth at constant D is nolonger possible, and the surfaces are now forcedto come together. Thus, once the interacting sur-faces can no longer relax their high local stresstheir collapse will proceed to completion, andwhen this occurs the collapse distance �D willbe equal to 2rcrit. This proposed instabilitymechanism is depicted in Fig. 7 and appears toexplain the near constancy of the collapse dis-tance independently of the surface roughness,approach rate, repulsive force, and other experi-mental and sample differences.
4. The thermodynamic argument on which Eq. (3)is based should be generally valid to allmaterials (liquids or solids) at any temperature,
but it only describes the equilibrium situationwhich tells us nothing about the rate at whichcollapse is expected to occur. This is determinedby other factors such as the viscosity, bulk andsurface diffusion coefficients, and the tempera-ture. It may seem surprising that a pure metalsuch as gold can flow, apparently like a liquid,so far below its melting point of 1064 °C (allthe experiments were done at roomtemperature). As already stated, the collapse ratewas about 10 nm per 0.1 sec, and even faster forcleaner, freshly coated surfaces. The transport ofmaterial during the collapse could be due tobulk flow or, more likely, to surface diffusion,or a combination of both. If surface diffusion isthe dominant mode of transport our results sug-gest a surface diffusion coefficient of D=10–15
m2 s–1 based on the standard equation: x2 �Dt, and where a distance of x=10 nm is covered
in t=0.1 sec. We now briefly discuss the differ-ent flow scenarios, bearing in mind that theinitial surfaces were both rough and highlypolycrystalline.
For rough and nano-particle surfaces, bothexperiments and theories (computer simulations)on noble and other ductile metals such as gold, sil-ver, and copper, either free in space or depositedon surfaces, have shown that they have greatlyreduced melting points and can be in the liquidstate (i.e., as liquid droplets) at room temperature[37,38]. Small asperities on rough surfaces may beexpected to behave likewise. Closely related to thisare reports that the deformation, plastic flow, andcreep rates of thin metal films are often very highcompared with the bulk materials [39]. The effectsof a reduced melting point and enhanced surfacediffusion rates are due to (i) the changed thermo-dynamic properties of small systems [40], (ii) thelikely presence of a molecularly thin (�1 nm) layerof liquid on the solid metal surfaces [41], (iii) thehigh local curvatures that drive the diffusing atomsso as to lower the local curvature; in other words,the diffusion is forced in a certain direction ratherthan being passive, and finally (iv) at the nanos-cale, not many atoms or molecules have to changepositions for large structural changes to occur.Unfortunately, measured (passive) surface dif-

45N.A. Alcantar et al. / Acta Materialia 51 (2003) 31–47
fusion coefficients on (flat) gold have variedwidely, between 10–45 and 10–6 m2 s–1 [42], whichspan the value of 10–15 m2 s–1 estimated from ourresults. The large variations have been attributedto the presence of contaminant layers [43].
As an example of these effects in a very differ-ent system, Fig. 11 shows some very recent TEMimages of ~18 nm gold nano-particles in solutionthat have rapidly coalesced (cold welded) at roomtemperature. All the bridging necks have equilib-rated at a concave radius of about 5 nm, which isthe same as critical collapse/instability radius rc inour studies. These necks, too, could havedeveloped either via bulk flow or surface diffusion.Molecular dynamics computer simulations of asolid gold AFM tip approaching a nickel surface,as well as a nickel tip approaching a gold surface,show a gold wetting meniscus developing at thecontact boundary as a result of surface diffusion or
Fig. 11. TEM image of 18.0 nm Au nano-particles in aqueoussolution at room temperature that have coalesced after theaddition of 0.1 M amino-ethanothiol, showing that completecoalescence has occurred with no definable separation betweenparticles. The formation of a continuous material having a sin-gle monolithic interface is further supported by optical absorp-tion data. (Figure courtesy of Geoff Strouse).
atomic hopping between surface lattice sites [38].Similar “fi lling in” of pits on gold surfaces by sur-face-diffusing gold atoms have recently beenobserved by TEM, which clearly show rapid sur-face diffusion and restructuring even when theunderlying (bulk) structure is crystalline and at 200and 280 °C [44].
It is clear from our studies, and those of others,that rapid surface restructuring can occur on goldsurfaces, most likely via atomic hopping, wherebyhighly curved cavities become “fi lled in” so as tolower the curvature. The thermodynamic drivingforce for this process may be considered to be thereduction of the capillary (Laplace) pressure, 2γ/r,which reduces the free energy or chemical poten-tial of a molecule at a curved surface. It shouldtherefore be correct to consider “capillary wetting” ,“cold welding” and “sintering” as different mani-festations of the same basic process, where onlythe time and length scales may be different, andwhether the reduction in the free energy is achi-eved via surface diffusion or bulk flow.
4.2. Coalescence of other, including brittle,materials
Our SFA results with rough platinum surfacesin air and iron oxide surfaces in water were quali-tatively very similar to those described here forgold—manifested by a repulsion on approach anda sudden change into an attraction with a largejump-in distance to flattened, strongly adhesivecontact. The jump-in distances were �D~10 nm forplatinum (results not shown), for which 2g /S �2 × 1.80/3.5 × 108 � 10 nm [33,34], and �D~5
nm for iron oxide [25]. Again, both of these valuesare very much larger than can be accounted for byvan der Waals forces, and close to 2γ/S for thesematerials (the exact value for iron oxide in wateris unknown, but for ductile iron 2γ/S lies in therange 4.3–8.6 nm [33,34, 45]).
However, no such instabilities were observedwith alumina, silica, and silicon nitride surfaces[9,32,46], consistent with the absence of any reportof these hard, brittle materials exhibiting ductility,malleability, flow, or other liquid-like behavior atroom temperature. However, thermodynamically,all materials should exhibit a collapse instability at

46 N.A. Alcantar et al. / Acta Materialia 51 (2003) 31–47
some point or critical radius, but this radius maybe very small and the time for the “spontaneous”collapse to occur may be so long that it is neverseen in practice (like the slow rearrangements ofgrain boundaries in solids).
4.3. Implications of the monotonic long-rangeforces before coalescence
It is also instructive to ask what the long-rangeforce profiles look like for rough or nano-particle-covered surfaces in general, and why. We have car-ried out a number of direct force–distancemeasurements on a number of different systems,both ductile and brittle [9,25,32,46], and find thatmost of these systems exhibit an exponentiallyrepulsive force regime following the initial, weaklyadhesive, contact (determined by the initial touch-ing of the outermost asperities). The reason for theapparently generic exponential behavior for verydifferent types of rough surfaces is unknown. Atheory by Greenwood [47], based on averaging theHertzian deformations of surface micro-asperitieshaving an exponential height distribution, doesproduce an exponentially repulsive force law.However, this theory is too model-dependent toaccount for the very different types of systemswhere such behavior has been observed; althoughit is possible that the theory is indeed more general,i.e., that the assumptions are not crucial to the finalresult. Apart from its effect on adhesion andcoalescence, the existence of a universalexponential long-range force law has importantimplications for other areas of materials science,for colloidal systems and for tribology [25]. Forexample, the density or volume of granularmaterials have long been known to have anapproximately logarithmic dependence on thepressure. It is a simple matter to show that an expo-nentially repulsive force between any two grainswill lead to a Density log(Pressure) relationshipin a first approximation. In some cases the forceprofiles appear to be linear rather than exponential,although again the curves are surprisingly smoothgiven that the surfaces contain relatively largenano- or even micro-asperities. Clearly, there issome efficient averaging going on in such systems
that have yet to be theoretically explained, bothqualitatively and quantitatively.
In conclusion, these results should provide adeeper understanding of the mechanisms ofcoalescence, cold welding, sintering, and crackhealing, and may have additional implications forthe processing of materials via pressuredensification or colloidal processing.
Acknowledgements
We thank Professors Ed Kramer, Fred Lange,Bob McMeeking and Jim Langer for their con-structive comments on this manuscript, Bede Pit-tenger of Veeco-DI for his help with the STMmeasurements (Fig. 8, F and G), Geoff Strouse forallowing us to show his TEM picture of coalescedgold nanospheres (Fig. 11), Cyrus Safinya forinterpreting the x-ray spectra of Fig. 8, and DottieMcLaren for the artwork. This work was supportedby grants NAG3-2115 from NASA, the Office ofNaval Research grant N00014-00-1-0214, andmade use of facilities at the Materials ResearchLaboratory at UCSB (NSF grant DMR 91-23048).Jian-Mei Pan was supported by Rockwell ScienceCenter, Thousand Oaks, CA.
References
[1] Israelachvili JN. Intermolecular and surface forces, 2nded. Londons: Academic Press, 1992.
[2] Johnson KL. Contact mechanics. Cambridge UniversityPress: Cambridge UK, 1985.
[3] Horn RG, Israelachvili JN, Pribac F. Journal of Colloidand Interface Science 1987;115(2):480–92.
[4] Luedtke WD, Landman U. Computational MaterialsScience 1992;1(1):1–24.
[5] Landman U., Luedtke, W.D., Ringerm E.M., Fundamen-tals of friction: macroscopic and microscopic processes.in North Atlantic Treaty Organization. Scientific AffairsDivision. 1992. Dordrecht ; Boston: Kluwer Academic.
[6] Baljon ARC, Robbins MO. Science1996;271(5248):482–4.
[7] Lawn BR. Fracture of brittle solids. Cambridge UK: Cam-bridge University Press, 1993.
[8] Ferguson GS, Chaudhury MK, Sigal GB, Whitesides GM.Science 1999;253(5021):776–8.
[9] Golan Y, Alcantar NA, Kuhl TL, Israelachvili J. Langmuir2000;16(17):6955–60.

47N.A. Alcantar et al. / Acta Materialia 51 (2003) 31–47
[10] Hass G, Heaney JB, Hunter WR. Physics of Thin Films1982;12(1).
[11] Hunter WR, Angel DW, Hass G. Journal of the OpticalSociety of America 1979;69(12):1695–9.
[12] Alcantar NA, Aydil ES, Israelachvili JN. Effect of waterplasma on silica surfaces. In: Little C, editor. Fundamentaland applied aspects of chemically modified surfaces. Cam-bridge, UK: The Royal Society of Chemistry; 1999.
[13] Kim F, Kwan S, Akana J, Yang PD. Journal of the Amer-ican Chemical Society 2001;123(18):4360–1.
[14] Drummond C, Alcantar N, Israelachvili J, Tenne R, GolanY. Advanced Functional Materials 2001;11(5):348–54.
[15] Golan Y, Drummond C, Homyonfer M, Feldman Y,Tenne R, Israelachvili J. Advanced Materials1999;11(11):934–7.
[16] Evans DM, Katz L. Acta Crystallographica Section B—Structural Crystallography and Crystal Chemistry B1972;28:1219.
[17] Nan J, Silcox J. Journal of Applied Physics2000;87(8):3768–76.
[18] Tenne R, Margulis L, Hodes G. Advanced Materials1993;5(5):386–8.
[19] Israelachvili JN, Adams GE. Journal of the ChemicalSociety—Faraday Transactions I 1978;74:975.
[20] Israelachvili JN, McGuiggan PM. Journal of MaterialsResearch 1990;5(10):2223–31.
[21] Israelachvili JN. Journal of Colloid and Interface Science1973;44(2):259–72.
[22] Heuberger M, Luengo G, Israelachvili J. Langmuir1997;13(14):3839–48.
[23] Barrett CR, Nix WD, Tetelman AS. The principles ofengineering materials. Englewood Cliffs, NJ: Prentice-Hall, 1973.
[24] Raviv U, Laurat P, Klein J. Nature 2001;413(6851):51–4.[25] Israelachvili J., Giasson S., Kuhl T., Drummond C.,
Berman A., Luengo G., Pan J.M., Heuberger M., DuckerW., Alcantar N.A., Thinning films and tribological inter-faces, in Tribology Series. 2000, Elsevier.
[26] Israelachvili J. Fundamentals of Tribology — Bridging thegap between the macro-, micro- and nano-scales. In: Bhu-shan B, editor. NATO Advanced Science Institute Series.Dordrecht: Kluwer Academic Publishers; 2001. p. 631–50.
[27] Knarr RF, Quon RA, Vanderlick TK. Langmuir1998;14(22):6414–8.
[28] “History of development of stamping foil.” Swift M. &Sons Inc., Conn., USA.
[29] Lipkin DM, Israelachvili JN, Clarke DR. PhilosophicalMagazine—a Physics of Condensed Matter StructureDefects and Mechanical Properties 1997;76(4):715–28.
[30] Luengo G, Pan JM, Heuberger M, Israelachvili JN. Lang-muir 1998;14(14):3873–81.
[31] Campbell S.E., Interactions at interfaces, in Dept. Chem.Eng. 1998, University of California: Santa Barbara.
[32] Berman A, Steinberg S, Campbell S, Ulman A, Israelach-vili J. Tribology Letters 1998;4(1):43–8.
[33] Kumikov VK, Khokonov KB. Journal of Applied Physics1983;54(3):1340–6.
[34] Kaye GWC, Laby TH. Tables of physical and chemicalconstants, 13th ed. London: Longmans, 1971.
[35] Miedema AR, Denbroeder FJA. Zeitschrift Fur Met-allkunde 1979;70(1):14–20.
[36] Utigard T., Surf & Interfacial Eng of Metals, Ref to metal-organic adhesion energy on p. 13
[37] Li TX, Ji YL, Yu SW, Wang GH. Solid State Communi-cations 2000;116(10):547–50.
[38] Landman U, Luedtke WD, Burnham NA, Colton RJ.Science 1990;248(4954):454–61.
[39] Brotzen FR. Int Mater Rev 1994;39(1):24–5.[40] Blakely JM. Journal of Applied Physics
1964;35(6):1756–8.[41] Buffat P, Borel JP. Physical Review A (General Physics)
1976;13(6):2287–98.[42] Taylor L. Metals handbook. Properties and selection of
metals, Vol. 1. Metals Park, OH: American Society forMetals, 1996.
[43] Blakely JM. Transactions of the Faraday Society1961;57(8):1164–8.
[44] Radetic R., Danhmen, U., Microstructure and coarseningin mazed bicrystal films of Au grown on Ge substrates.in Symposium P: Growth, Evolution, and Properties ofSurfaces, Thin Films, and Self-Organized Structures.2000. MRS Fall Meeting Proceedings.
[45] Green RE. Machinery handbook, 25th edition. New York:Industrial Press Inc, 1996.
[46] Alcantar N.A., Aydil E.S., Israelachvili J.N., J Vac SciTechnol B, In preparation.
[47] Greenwood JA. Tribology International 1997;30(3):235–7.