village of winfield, illinois comprehensive annual financial ...
Upload
khangminh22Category
view
3download
0
For the fiscal year ending December 31, 2003
2003Addendum toComprehensive Annual Financial Report
Illinois Municipal Retirement Fund

Illinois Municipal Retirement FundInvestment Portfolio as of December 31, 2003
Asset descriptionInterest
RateMaturity
date Par Value Cost Value Market Value
FIXED INCOMEU.S. SecuritiesCorporate Bonds
1st Un Corp Sub Nt 6.550% 10/15/2035 2,175,000 2,277,421 2,344,7811st Un Natl Bk N C Charlotte Mtn 7.800% 08/18/2010 2,500,000 2,979,075 3,016,1785th 3rd Bancorp Nt 4.500% 06/01/2018 3,530,000 3,517,751 3,277,111Adelphia Communications Corp In Default 0.000% 06/15/2011 1,420,000 1,249,513 1,299,300Adelphia Communications Corp Sr 0.000% 12/31/2040 135,000 75,813 125,550Adelphia Communications Corp Sr Nt 10.250% 11/01/2006 370,000 206,275 329,300Advanta Revolving Home Eqty Ln Tr 1.391% 08/25/2024 1,494,317 1,492,916 1,490,748AES Corp 8.875% 02/15/2011 109,000 104,368 118,810AES Corp Sr Nt 8.750% 06/15/2008 91,000 87,588 97,598AES Corp Sr Nt 9.500% 06/01/2009 586,000 555,664 649,728AES Corp Sr Nt 9.375% 09/15/2010 215,000 209,088 238,381AES Eastn Energy L P 9.670% 01/02/2029 2,910,000 2,898,857 3,215,899Agco Corp Del Sr Nt 9.500% 05/01/2008 200,000 211,500 219,000Ahold Fin U 6.250% 05/01/2009 945,000 718,875 947,363Ahold Fin U 8.250% 07/15/2010 2,040,000 1,607,360 2,223,600Ak Stl Corp Gtd Sr Nt 7.750% 06/15/2012 2,220,000 1,791,364 1,898,100Alamosa Del Inc Sr 0.000% 07/31/2009 1,178,256 944,419 1,060,430Alamosa Del Inc Sr 11.000% 07/31/2010 653,250 617,085 708,776Allegy Ludlum Corp Nt 6.950% 12/15/2025 475,000 365,750 403,750Allegy Technologies Inc Nt 8.375% 12/15/2011 430,000 363,350 421,400Alliant Techsystems Inc Sr Sub Nt 8.500% 05/15/2011 1,525,000 1,551,471 1,677,500Allied Waste N Amer Inc Sr Nt 7.625% 01/01/2006 200,000 163,000 210,500Allied Waste N Amer Inc Sr Nt 8.500% 12/01/2008 68,000 65,323 75,650Allied Waste N Amer Inc Sr Nt 7.875% 01/01/2009 1,750,000 1,592,813 1,824,375Allied Waste N Amer Inc Sr Secd Nt 8.875% 04/01/2008 529,000 545,829 592,480Altria Group Inc 7.000% 11/04/2013 750,000 763,759 800,096Americredit Automobile Receivables Tr 1.310% 11/06/2006 3,994,361 3,994,361 3,994,191Americredit Automobile Receivables Tr 1.490% 06/06/2007 1,100,000 1,100,000 1,099,569Ameripath Inc Sr Sub Nt 10.500% 04/01/2013 1,835,000 1,877,426 1,954,275Ameriquest Mtg Secs Inc 1.551% 02/25/2033 6,905,611 6,913,973 6,914,339Ameriquest Mtg Secs Inc 1.491% 05/25/2033 5,734,434 5,734,434 5,733,074Ameriquest Mtg Secs Inc 2003-Ar3 Ast Bkdpassthru Ctf A 1.511% 07/25/2033 6,055,231 6,055,231 6,056,738Amerisourcebergen Corp Sr Nt 8.125% 09/01/2008 189,000 200,726 213,098Amern Airls Pass Thru Tr Passthru Ctf 7.800% 04/01/2008 410,000 410,000 370,577Amern Color Graphics Inc Sr 2nd Secd 10.000% 06/15/2010 435,000 435,000 445,875Amern Elec Pwr Inc Sr 6.125% 05/15/2006 2,580,000 2,826,825 2,780,174Amern Express Co Bd 4.875% 07/15/2013 3,416,000 3,405,923 3,423,208Amern Express Co Nt 3.750% 11/20/2007 3,360,000 3,426,117 3,422,647Ami Semiconductor Inc Sr Sub Nt 10.750% 02/01/2013 610,000 610,000 727,425Amkor Tech Inc Sr Nt 9.250% 02/15/2008 100,000 107,525 113,500Amkor Tech Inc Sr Nt 7.750% 05/15/2013 2,835,000 2,743,638 3,040,538Amkor Tech Inc Sr Sub Nt 10.500% 05/01/2009 30,000 31,650 32,025Anadarko Fin Co Sr Nt 6.750% 05/01/2011 460,000 470,695 521,470Anadarko Fin Co Sr Nt 7.500% 05/01/2031 1,500,000 1,735,305 1,757,220Anadarko Pete Corp Nt 6.125% 03/15/2012 2,540,000 2,904,762 2,749,423Anadarko Pete Corp Sr Nt 5.375% 03/01/2007 1,250,000 1,217,463 1,336,325ANR Pipeln CO 9.625% 11/01/2021 1,220,000 1,350,000 1,450,275ANR Pipeln Co 7 Deb 7.000% 06/01/2025 420,000 413,700 427,350ANR Pipeln Co Deb 7.375% 02/15/2024 840,000 788,175 848,400ANR Pipeln Co Sr Nt 8.875% 03/15/2010 350,000 345,513 393,750AOL Time Warner Inc 6.875% 05/01/2012 675,000 611,140 759,581AOL Time Warner Inc 7.625% 04/15/2031 3,530,000 3,353,638 4,072,803AOL Time Warner Inc AOL Time Warner Inc 6.150% 05/01/2007 145,000 139,471 157,764AOL Time Warner Inc Deb 7.700% 05/01/2032 6,745,000 7,506,295 7,872,130AOL Time Warner Inc Nt 5.625% 05/01/2005 1,300,000 1,296,145 1,360,831Applied Extrusion Technologies Inc Sr Nt 10.750% 07/01/2011 1,390,000 1,073,775 1,153,700Arvinmeritor Inc Nt 6.625% 06/15/2007 800,000 792,000 840,000Assoc Corp N Amer 6.875% 11/15/2008 2,250,000 2,149,583 2,556,540Ast Backed Secs Corp Home Eqty Ln Tr Ast Backed 1.370% 11/15/2031 2,649,597 2,648,769 2,649,833AT&T Broadband Corp Nt 8.375% 03/15/2013 913,000 1,013,788 1,117,101AT&T Corp 7.250% 11/15/2006 5,220,000 5,423,262 5,772,464
1

Illinois Municipal Retirement FundInvestment Portfolio as of December 31, 2003
Asset descriptionInterest
RateMaturity
date Par Value Cost Value Market Value
FIXED INCOMEU.S. SecuritiesCorporate Bonds
AT&T Corp 8.750% 11/15/2031 2,520,000 2,930,105 2,944,779AT&T Wireless Svcs Inc Nt 8.125% 05/01/2012 280,000 325,069 329,266AT&T Wireless Svcs Inc Sr Nt 7.350% 03/01/2006 5,400,000 5,991,543 5,905,062Autonation Inc Del Sr 9.000% 08/01/2008 1,055,000 1,187,875 1,210,613Avaya Inc Sr Nt 11.125% 04/01/2009 1,695,000 1,702,259 1,983,150Bally Total Fitness Hldg Corp Sr Sub 9.875% 10/15/2007 705,000 630,413 641,550Bankboston N A Sub 7.000% 09/15/2007 1,000,000 1,098,590 1,131,550Barneys Inc Sr Secd 9.000% 04/01/2008 910,000 773,500 864,500BE Aerospace Inc 8.000% 03/01/2008 925,000 614,688 867,188BE Aerospace Inc Sr Sub Nt 9.500% 11/01/2008 135,000 106,621 131,288BE Aerospace Inc Sr Sub Nt 8.875% 05/01/2011 1,750,000 1,202,250 1,640,625Bear Stearns Cos Inc Global Nt 5.700% 01/15/2007 1,330,000 1,426,864 1,442,319Beazer Homes USA Inc Sr Nt 8.625% 05/15/2011 900,000 902,246 990,000Bio Rad Labs Inc Sr Sub Nt 7.500% 08/15/2013 580,000 580,000 638,000Bk 1 Corp 4.125% 09/01/2007 440,000 439,331 454,399Bk 1 Corp 6.000% 08/01/2008 1,210,000 1,208,863 1,328,507Bk 1 Corp Nt 2.625% 06/30/2008 6,170,000 5,835,479 5,933,010Bk Amer Corp Bk of Amer Corp 5.250% 02/01/2007 500,000 501,654 534,732Bk Amer Corp Global Nt 7.800% 02/15/2010 880,000 1,028,405 1,046,496Bk Amer Corp Sr Global Nt 3.250% 08/15/2008 6,700,000 6,681,028 6,618,602Bk Amer Corp Sr Nt 3.875% 01/15/2008 1,500,000 1,499,730 1,529,280Bk Amer Corp Sr Nt 4.375% 12/01/2010 4,700,000 4,671,800 4,711,844Bk Amer Corp Sub Nt 7.400% 01/15/2011 860,000 921,060 1,008,634Boeing Cap Corp Nt 7.375% 09/27/2010 1,155,000 1,211,574 1,327,625Bottling Group Llc Sr 5.000% 11/15/2013 1,730,000 1,718,720 1,752,750Bristol Myers Squibb Co Nt 4.750% 10/01/2006 6,150,000 6,519,743 6,503,336Bristol Myers Squibb Co Sr Deb 6.875% 08/01/2097 1,141,000 1,261,638 1,248,699Brown Tom Inc/Brown Tom Res Fdg Corp 0.073% 09/15/2013 200 200,000 211,500Browning Ferris Inds Inc 9.250% 05/01/2021 3,000,000 2,793,750 3,318,750Bstn Pptys Ltd Partnership Sr Nt 6.250% 01/15/2013 3,460,000 3,493,334 3,712,718Bway Corp Sr Sub 10.000% 10/15/2010 220,000 220,000 239,800Ca Stl Inds Inc Sr 8.500% 04/01/2009 415,000 431,400 435,231Caithness Coso Fdg Corp Sr Secd Nt 9.050% 12/15/2009 1,735,101 1,627,883 1,882,585Calpine Corp 8.500% 02/15/2011 1,031,000 938,407 815,779Calpine Corp Sr Nt 8.250% 08/15/2005 420,000 375,625 406,350Calpine Corp Sr Nt 7.625% 04/15/2006 540,000 410,175 477,900Calpine Corp Sr Nt 8.750% 07/15/2007 460,000 328,113 377,200Calpine Corp Sr Nt 7.750% 04/15/2009 200,000 80,298 154,000Calpine Corp Sr Nt 8.625% 08/15/2010 630,000 460,688 491,400Cb Richard Ellis Svcs Inc Sr Sub Nt 11.250% 06/15/2011 2,790,000 2,748,931 3,152,700Cedar Brakes II L L C Sr Secd Bd 9.875% 09/01/2013 3,440,434 3,395,896 3,707,068Centennial Communications Corp 10.125% 06/15/2013 2,130,000 2,159,875 2,337,675Charter Comm Hldgs Llc/Cap Corp Sr Disc 0.000% 04/01/2011 1,425,000 827,768 1,218,375Charter Comm Hldgs Llc/Charter Comm Hldgcap Corp Sr Disc0.000% 01/15/2010 3,853,000 2,129,018 3,140,195Charter Comm Hldgs Llc/Charter Comm Hldgcap Corp Sr Nt10.000% 04/01/2009 1,390,000 864,250 1,237,100Charter Communications Hldgs Llc Sr 11.750% 05/15/2011 60,000 33,901 40,200Chase Cr Card Owner Tr 1.273% 02/15/2011 13,750,000 13,750,000 13,763,211Chase Fdg Tr 2000-3 Mtg Ln Ast Bkd Ctf 1.361% 10/25/2030 945,734 945,734 946,636Ches Energy Corp Sr Nt 8.125% 04/01/2011 61,000 63,898 67,710Chevrontexaco Cap Co Chevrontexaco 3.500% 09/17/2007 300,000 296,993 305,543Chiquita Brands Intl Inc Sr Nt 10.560% 03/15/2009 1,325,000 1,390,713 1,467,438Chrysler Corp 7.450% 03/01/2027 705,000 706,526 750,268Circus Circus Enterprises Inc 7.000% 11/15/2036 560,000 562,950 593,600Cit Group Inc Sr Nt 6.500% 02/07/2006 830,000 858,652 898,882Citibank Cr Card Issuance Tr Cccit 1.471% 03/07/2008 7,000,000 7,000,000 7,011,457Citigroup Inc 6.500% 01/18/2011 2,000,000 2,043,940 2,254,960Citigroup Inc 5.875% 02/22/2033 1,855,000 1,902,060 1,823,113Citigroup Inc 6.000% 10/31/2033 700,000 707,441 699,930Citigroup Inc Global Sr Nt 5.750% 05/10/2006 1,440,000 1,503,144 1,549,771Citigroup Inc Nt 6.200% 03/15/2009 1,500,000 1,639,380 1,669,890Citigroup Inc Sub Nt 7.250% 10/01/2010 4,645,000 5,234,476 5,414,026
2

Illinois Municipal Retirement FundInvestment Portfolio as of December 31, 2003
Asset descriptionInterest
RateMaturity
date Par Value Cost Value Market Value
FIXED INCOMEU.S. SecuritiesCorporate Bonds
Clear Channel Communications Inc 4.250% 05/15/2009 1,660,000 1,658,041 1,664,266CMO Amern Airls Pass Thru Tr Passthru 7.379% 11/23/2017 194,770 138,940 138,610CMO Amern Airls Pass Thru Tr Passthru 7.377% 05/23/2019 1,481,435 963,235 1,068,812CMO Banc Amer Fdg Corp 2003-1 Mtg 6.000% 05/20/2033 1,833,516 1,876,775 1,854,570CMO Bear Stearns Arm Tr 2003-7 Mtg 4.871% 01/25/2033 13,353,787 13,065,846 13,689,191CMO Contl Airls Pass Thru Trs 8.388% 05/01/2022 35,339 25,974 30,745CMO Cr Suisse 1st Bstn Mtg Secs Corp 6.300% 11/11/2030 5,620,000 6,148,412 6,230,234CMO Gmac Coml Mtg Sec Inc Mtg Pass Thru Ctf 1999-c 6.175% 05/15/2033 2,505,000 2,452,963 2,764,646CMO Gmac Coml Mtg Sec Inc Mtg Passthru 6.945% 09/15/2033 7,990,000 9,285,254 9,057,671CMO Gs Mtg Secs Corp II 6.135% 10/18/2030 6,174,059 6,820,166 6,654,634CMO Gs Mtg Secs Corp II Coml Mtg Pass 6.620% 10/18/2030 5,305,000 6,103,029 5,877,788CMO Impac Cmb Tr 2002-2 Coll Ast Bkd Bd 1.421% 01/25/2032 3,481,871 3,481,327 3,484,623CMO Impac Cmb Tr 2003-5 Coll Ast Bkd Nt 1.471% 08/25/2033 5,248,376 5,248,376 5,245,889CMO Lb-UBS Coml Mtg Tr 2003-c 5.124% 11/15/2032 10,325,000 10,376,311 10,518,327CMO Morgan Stanley Cap I Inc Morgan 6.530% 03/15/2031 6,000,000 6,582,891 6,695,213CMO Morgan Stanley Cap I Passthru Ctf 6.480% 11/15/2030 4,975,000 5,360,757 5,540,148CMO Morgan Stanley Dean Witter Cap I Tr 7.180% 02/23/2034 3,050,994 3,455,169 3,377,460CMO Regal Tr Iv 3.409% 09/29/2031 2,221,676 2,210,871 2,266,110CMO Sequoia Mtg Tr 1.599% 12/20/2032 6,579,093 6,579,093 6,540,527CMO Structured Ast Mtg Invts Inc 3.229% 03/25/2032 8,307,064 8,384,943 8,394,036CMO Wa Mut Mtg Secs Corp 2002-ms 6.500% 05/25/2032 1,201,005 1,234,408 1,237,913CMO William Str Fdg Corp 1.470% 04/23/2006 3,100,000 3,100,000 3,104,535CMS Energy Corp CMS Energy Corp 8.500% 04/15/2011 950,000 710,200 1,026,000Coastal Corp 6.500% 06/01/2008 425,000 349,638 386,219Coastal Corp 6.375% 02/01/2009 340,000 285,600 303,450Coastal Corp Coastal Corporation Deb 7.750% 10/15/2035 250,000 164,748 210,000Coastal Corp Nt 6.500% 05/15/2006 510,000 405,646 488,963Coastal Corp Nt 7.750% 06/15/2010 3,515,000 2,968,829 3,317,281Columbia / HCA Healthcare Corp 7.250% 05/20/2008 85,000 88,363 93,330Columbia / HCA Healthcare Corp 7.500% 11/15/2095 2,370,000 2,036,138 2,269,868Columbia /HCA Healthcare Corp 6.910% 06/15/2005 300,000 305,250 316,011Comcast Cable Communications Inc 8.875% 05/01/2017 310,000 346,844 398,812Comcast Cable Communications Inc Nt 6.375% 01/30/2006 605,000 575,371 651,313Comcast Corp New Nt 6.500% 01/15/2015 8,870,000 9,271,341 9,624,136Comed Transitional Fdg Tr 5.630% 06/25/2009 5,025,000 5,022,560 5,401,875Compass Minerals Group Inc Gtd Sr Sub Nt 10.000% 08/15/2011 910,000 946,075 1,019,200Compass Minerals Intl Inc Sr Disc 12.750% 12/15/2012 1,145,000 626,696 904,550Comwlth Alum Corp 10.750% 10/01/2006 1,260,000 1,185,975 1,285,200Conoco Inc Nt 6.950% 04/15/2029 3,590,000 3,850,800 4,071,201Conocophillips Nt 4.750% 10/15/2012 380,000 380,000 381,599Conocophillips Nt 5.900% 10/15/2032 220,000 227,342 220,583Cons Nat Gas Co Cons Nat'l Gas 5.375% 11/01/2006 1,485,000 1,484,079 1,591,935Conseco Fin Securitizations Corp 2000-5 Mfg Hsg Sr/Sub Ctf A7.700% 02/01/2032 1,200,000 1,277,969 1,218,912Continental Airls Pass 6.545% 08/02/2020 1,796,676 1,643,114 1,775,708Continental Airls Pass Thru Trs 8.321% 11/01/2006 45,000 38,925 43,873Continental Airls Pass Thru Trs Ctf 6.748% 09/15/2018 67,373 50,530 55,597Continental Airls Pass Thru Trs Ctf 6.795% 02/02/2020 474,817 425,076 400,864Contl Airl Inc Escr 0.000% 09/02/1996 1,440,000 - 1Contl Airls 6.541% 09/15/2009 91,784 76,639 86,222Contl Airls 6.900% 07/02/2018 603,846 465,469 505,665Contl Airls Pass Thru Trs 8.312% 10/02/2012 528,636 377,843 455,382Contl Airls Pass Thru Trs Ctf 6.800% 07/02/2009 62,802 54,010 60,040Contl Cablevision Inc 8.300% 05/15/2006 720,000 806,551 807,250Corn Prods Intl Inc Corn Products Intl 8.450% 08/15/2009 205,000 210,613 229,088Countrywide Home Lns Inc Note 5.500% 08/01/2006 5,520,000 5,761,700 5,896,232Cox Communications Inc New 7.125% 10/01/2012 890,000 984,402 1,026,538Cox Communications Inc New Nt 4.625% 06/01/2013 310,000 308,013 298,871Cox Communications Inc Nt 7.875% 08/15/2009 1,050,000 1,227,692 1,240,617Cr Suisse 1st Bstn USA Inc 6.125% 11/15/2011 1,070,000 1,119,644 1,164,941Cr Suisse 1st Bstn USA Inc Csfb 4.625% 01/15/2008 700,000 709,687 728,703Cr Suisse 1st Bstn USA Inc Nt 3.875% 01/15/2009 1,785,000 1,773,790 1,782,876
3

Illinois Municipal Retirement FundInvestment Portfolio as of December 31, 2003
Asset descriptionInterest
RateMaturity
date Par Value Cost Value Market Value
FIXED INCOMEU.S. SecuritiesCorporate Bonds
Crescent Real Estate Eq Ltd Partnesr Nt 9.250% 04/15/2009 3,440,000 3,440,000 3,784,000Crown Castle Intl Corp Sr Nt 10.750% 08/01/2011 850,000 788,569 956,250Crown Castle Intl Corp Sr Nt 9.375% 08/01/2011 1,230,000 874,594 1,365,300Crown Castle Intl Corp Sr Nt 9.500% 08/01/2011 135,000 108,675 147,150Crown Cork & Seal Inc 8.000% 04/15/2023 490,000 346,050 458,150Crown Cork & Seal Inc 7.375% 12/15/2026 695,000 472,175 628,106CSC Hldgs Inc 7.875% 02/15/2018 310,000 286,708 330,925CSC Hldgs Inc 7.625% 07/15/2018 2,606,000 2,491,040 2,736,300Cwabs Inc 2002-S3 Ast Bkd Ctf 1.311% 06/25/2017 205,314 205,378 205,360D R Horton Inc 7.875% 08/15/2011 410,000 392,575 465,350D R Horton Inc Sr 8.000% 02/01/2009 520,000 509,906 587,600D R Horton Inc Sr Nt 5.875% 07/01/2013 111,000 111,000 111,000D R Horton Inc Sr Sub Nt 9.750% 09/15/2010 335,000 329,975 398,650Daimler Chrysler N Amer Hldg Corp 4.750% 01/15/2008 2,530,000 2,522,027 2,588,544Daimler Chrysler N Amer Hldg Corp Sr Gblbd 7.300% 01/15/2012 280,000 301,664 311,765Daimlerchrysler N Amer Hldg Corp 8.500% 01/18/2031 1,425,000 1,775,735 1,702,562Daimlerchrysler N Amer Hldg Corp Gtd 4.050% 06/04/2008 5,785,000 5,795,278 5,745,613Daimlerchrysler N Amer Hldg Corp Nt 6.500% 11/15/2013 2,360,000 2,358,032 2,486,048Dana Corp 9.000% 08/15/2011 1,955,000 2,015,300 2,355,775Dana Corp 7.000% 03/01/2029 630,000 480,375 626,063Dana Corp Nt 10.125% 03/15/2010 550,000 560,080 640,750Dean Foods Co Sr Nt 6.625% 05/15/2009 180,000 162,850 189,000Dean Foods Co Sr Nt 6.900% 10/15/2017 955,000 829,800 988,425Deere John Cap Corp Nt 7.000% 03/15/2012 2,490,000 2,917,890 2,868,455Delta Air Lines Inc Del Equip Tr Ctf 8.540% 01/02/2007 137,149 132,691 122,577Delta Air Lines Inc Del Nt 7.700% 12/15/2005 1,230,000 1,102,063 1,160,813Delta Air Lines Inc Del Nt 7.900% 12/15/2009 125,000 82,300 101,094Delta Air Lines Inc Del Nt 8.300% 12/15/2029 4,460,000 3,475,652 2,949,175Delta Air Lines Inc Del Pass Thru Trs 7.779% 05/18/2007 625,000 523,938 574,951Delta Air Lines Inc Del Pass Thru Trs 7.299% 03/18/2008 115,000 99,475 103,780Delta Air Lines Inc Del Pass Thru Trs 7.570% 05/18/2012 145,000 142,100 150,212Delta Air Lines Inc Del Pass Thru Trs 7.920% 05/18/2012 1,150,000 1,043,031 1,041,242Delta Air Lines Inc Del Pass Thru Trs 6.619% 09/18/2012 299,701 301,299 303,467Delta Air Lines Inc Del Pass Thru Trs 10.060% 01/02/2016 230,000 222,525 172,213Delta Air Lines Inc Del Passtrs 6.718% 07/02/2024 792,305 793,796 847,843Delta Air Lines Inc Del Pt Trs Ctf 7.711% 03/18/2013 135,000 109,100 118,125Delta Air Lines Inc Tranche 9.250% 12/27/2007 370,000 306,175 317,738Det Edison CO 6.125% 10/01/2010 1,250,000 1,249,775 1,371,336Deutsche Mtg&Ast Receiving Co Coml Pstructf 6.538% 06/15/2031 5,130,000 5,779,065 5,618,268Devon Energy Coporation 7.950% 04/15/2032 1,320,000 1,539,302 1,591,606Devon Fing Corp U L C Deb 7.875% 09/30/2031 960,000 1,039,094 1,146,816Devon Fing Corp U L C Nt 6.875% 09/30/2011 2,520,000 2,996,248 2,857,491Dex Media Inc Disc 9.000% 11/15/2013 410,000 263,687 289,050Directv Hldgs Llc / Directv Fing Inc Sr Nt 8.375% 03/15/2013 2,565,000 2,675,531 2,975,400DJ Orthopedics Llc / Dj Orthopedics Cap Sr Sub Nt 12.625% 06/15/2009 726,000 750,110 809,490Doane Pet Care Co Sr Nt 10.750% 03/01/2010 660,000 652,080 683,100Doane Pet Care Co Sr Sub Nt 9.750% 05/15/2007 980,000 874,316 877,100Dominion Res Inc Del 6.750% 12/15/2032 795,000 794,754 849,855Dominion Res Inc Del Nt 5.700% 09/17/2012 810,000 847,869 853,441Dominion Res Inc Del Sr 5.125% 12/15/2009 1,100,000 1,095,083 1,148,169Dominion Res Inc Va New Dominion Res 4.125% 02/15/2008 230,000 229,710 234,346Dow Chem CO 7.375% 11/01/2029 2,910,000 3,088,469 3,253,817Dow Chem Co Dow Chem 5.750% 12/15/2008 1,000,000 999,940 1,072,180Dow Chem Co Nt 6.125% 02/01/2011 175,000 175,819 188,298Dr Stuctured Fin Corp 7.600% 08/15/2007 1,125,837 794,641 652,985Dresser Inc Sr Nt 9.375% 04/15/2011 665,000 681,625 723,188Dte Energy Co Dte Energy CO 6.450% 06/01/2006 1,650,000 1,693,252 1,783,551Duke Energy Corp Sr Nt 5.625% 11/30/2012 645,000 651,748 670,679Dynegy Hldgs Inc Sr Nt 8.750% 02/15/2012 1,010,000 906,793 1,018,838Eastman Kodak CO 7.250% 11/15/2013 250,000 249,698 262,309Echostar Dbs Corp 4.405% 10/01/2008 349,000 355,793 363,396
4

Illinois Municipal Retirement FundInvestment Portfolio as of December 31, 2003
Asset descriptionInterest
RateMaturity
date Par Value Cost Value Market Value
FIXED INCOMEU.S. SecuritiesCorporate Bonds
Echostar Dbs Corp Sr Nt 10.375% 10/01/2007 25,000 25,073 27,406Echostar Dbs Corp Sr Nt 9.125% 01/15/2009 168,000 149,745 187,950El Paso Corp El Paso Energy Corp 7.000% 05/15/2011 1,935,000 1,431,278 1,785,038El Paso Corp Nt 7.875% 06/15/2012 1,525,000 1,130,193 1,441,125El Paso Energy Corp Del Sr Nt 6.750% 05/15/2009 1,525,000 1,158,000 1,454,469El Paso Energy Corp Medium Term Nts 6.950% 12/15/2007 355,000 236,075 341,244El Paso Energy Corp Medium Term Nts 7.800% 08/01/2031 1,060,000 934,093 902,325El Paso Energy Corp Medium Term Nts # Tr 7.375% 12/15/2012 180,000 142,875 165,600El Paso Energy Corp Medium Term Nts Beo # Tr 8.050% 10/15/2030 170,000 99,875 147,900El Paso Energy Corp Mtn Booktranche # Tr 7.750% 01/15/2032 610,000 596,062 520,025El Paso Energy Partners L P / El Paso 8.500% 06/01/2011 717,000 660,042 806,625El Paso Nat Gas Co Deb 8.625% 01/15/2022 405,000 371,588 421,706El Paso Nat Gas Co Deb 7.500% 11/15/2026 1,430,000 1,254,931 1,358,500El Paso Nat Gas Co Mtn 7.625% 08/01/2010 1,025,000 1,011,337 1,053,188El Paso Nat Gas Co Nt 8.375% 06/15/2032 400,000 399,578 408,800Electr Data Sys Corp Nt 6.850% 10/15/2004 1,200,000 1,260,192 1,241,832Encore Acqstn Co Sr Sub Nt 8.375% 06/15/2012 890,000 894,256 963,425Energy Corp Amer 9.500% 05/15/2007 1,165,000 896,176 932,000Energy Partners Ltd Sr Nt 8.750% 08/01/2010 1,130,000 1,130,000 1,175,200Entercom Radio Llc / Entercom Cap Inc 7.625% 03/01/2014 105,000 106,500 112,744Entravision Communications Corp Sr Sub 8.125% 03/15/2009 1,090,000 1,101,770 1,166,300Eop Oper Ltd Partnership Eop Oper Lp 7.750% 11/15/2007 2,050,000 2,351,330 2,350,059Eop Oper Ltd Partnership Eop Oper Lp 5.875% 01/15/2013 2,930,000 3,122,021 3,058,771Equistar Chemicals / Equistar Fdg Cor 10.125% 09/01/2008 2,405,000 2,420,075 2,633,475Equistar Chemicals L P Deb 7.550% 02/15/2026 375,000 283,125 326,250Equistar Chemicals Lp / Equistar Fdg 10.625% 05/01/2011 780,000 770,200 861,900Ethyl Corp Sr Nt 8.875% 05/01/2010 820,000 820,000 877,400Exelon Corp 6.750% 05/01/2011 525,000 539,501 586,378Fd Amern Cos Inc Gtd Sr Nt 5.875% 05/15/2013 800,000 855,488 809,696Fdg Corp 2003cb2 Ast Bkd Ctf 1.251% 04/25/2021 2,755,854 2,755,854 2,755,099Finova Group Inc Sr Secd Nt 7.500% 11/15/2009 2,195,000 1,271,375 1,317,000Firstenergy Corp 5.500% 11/15/2006 220,000 229,770 227,885Firstenergy Corp 6.450% 11/15/2011 40,000 39,627 41,458Firstenergy Corp 7.375% 11/15/2031 3,005,000 2,997,785 3,074,047Fisher Scientific Intl Inc Sr Sub Nt 8.125% 05/01/2012 1,360,000 1,407,207 1,458,600Fl Pwr Corp Fl Pwr Corp 1st Mtg 6.650% 07/15/2011 1,250,000 1,248,213 1,413,438Fleet Home Eqty Ln Tr 1.399% 01/20/2033 8,866,540 8,867,829 8,859,468FMC Corp Sr Secd Nt 10.250% 11/01/2009 70,000 69,140 81,900Foamex L P/Foamex Cap Corp Sr Secd Nt 10.750% 04/01/2009 135,000 76,663 128,588Ford Mtr Co Del Global Landmark 7.450% 07/16/2031 1,600,000 1,483,177 1,616,834Ford Mtr Cr Co Ford Mtr Cr CO 7.250% 10/25/2011 800,000 781,779 867,651Ford Mtr Cr Co Global Landmark 6.875% 02/01/2006 7,380,000 7,739,707 7,876,733Ford Mtr Cr Co Global Landmark 7.875% 06/15/2010 240,000 248,314 268,166Ford Mtr Cr Co Global Landmark 7.375% 02/01/2011 2,260,000 2,343,155 2,463,264Ford Mtr Cr Co Nt 5.800% 01/12/2009 380,000 348,445 391,343Ford Mtr Cr Co Nt 7.375% 10/28/2009 520,000 521,176 571,044Forest Oil Corp Sr 8.000% 12/15/2011 480,000 483,261 524,400Fountain View Inc 0.000% 08/19/2008 1,690,392 - 1,673,488Freeport-Mcmoran Copper & Gold Inc Sr Nt 10.125% 02/01/2010 880,000 885,085 1,014,200Fremont Gen Corp Sr Nt 7.875% 03/17/2009 1,010,000 987,275 996,113Fresenius Med Care Cap Tr Iv Tr Pfd Secs 7.875% 06/15/2011 310,000 284,800 334,800Frontiervision Hldgs L P Bstep Up 11.875% 12/31/2040 1,915,000 1,735,469 2,029,900Frontiervision Hldgs Lp/frontiervision 11.875% 12/31/2040 1,325,000 1,189,813 1,404,500Frontiervision Oper Partners L P / Front11 10-15-06/10-15-01 Reg Bd In Default11.000% 12/31/2040 500,000 485,888 535,000Ga Pac Corp 8.125% 05/15/2011 1,511,000 1,465,423 1,662,100Ga Pac Corp 9.500% 12/01/2011 46,000 47,605 53,360Ga Pac Corp 7.700% 06/15/2015 40,000 36,600 41,600Ga Pac Corp 7.250% 06/01/2028 1,865,000 1,594,906 1,788,069Ga Pac Corp 8.875% 05/15/2031 1,144,000 1,134,370 1,258,400Ga Pac Corp Deb 7.375% 12/01/2025 1,690,000 1,237,225 1,641,413Ga Pac Corp Deb 7.750% 11/15/2029 178,000 155,003 177,555
5

Illinois Municipal Retirement FundInvestment Portfolio as of December 31, 2003
Asset descriptionInterest
RateMaturity
date Par Value Cost Value Market Value
FIXED INCOMEU.S. SecuritiesCorporate Bonds
Ga Pac Corp Sr Nt 8.875% 02/01/2010 626,000 621,994 713,640Ga Pac Corp Sr Nt 9.375% 02/01/2013 2,095,000 2,121,281 2,409,250Gannett Co Inc Nt 5.500% 04/01/2007 2,690,000 2,683,705 2,915,691Gen Chem Indl Prods Inc Sr Sub Nt 10.625% 05/01/2009 1,500,000 1,162,500 270,000Gen Elec Cap Corp Medium Term Nts Beo 6.125% 02/22/2011 4,240,000 4,539,469 4,664,509Gen Elec Cap Corp Medium Term Nts Bo 3.500% 12/05/2007 10,742,000 10,724,920 10,843,082Gen Elec Cap Corp Medium Term Nts Bo 4.250% 01/15/2008 5,500,000 5,625,724 5,687,990Gen Elec Cap Corp Medium Term Nts Bo 6.000% 06/15/2012 1,020,000 1,020,704 1,106,142Gen Elec Cap Corp Medium Term Nts Bo 5.450% 01/15/2013 2,365,000 2,369,967 2,460,373Gen Elec Cap Corp Medium Term Nts Bo 6.750% 03/15/2032 650,000 716,729 719,628Gen Elec Cap Corp Mtn Bo Tranche # Tr 5.875% 02/15/2012 4,110,000 4,492,367 4,417,140Gen Elec CO 5.000% 02/01/2013 9,485,000 9,530,480 9,592,467Gen Mls Inc Gen Mls 6.000% 02/15/2012 2,740,000 3,069,677 2,930,068Gen Mls Inc Nt 5.125% 02/15/2007 1,225,000 1,250,958 1,301,269Gen Mtrs Accep Corp Genl Motors Accept 6.125% 09/15/2006 6,000,000 6,222,717 6,421,500Gen Mtrs Accep Corp Global Bd 7.250% 03/02/2011 1,385,000 1,403,784 1,519,497Gen Mtrs Accep Corp Gm 8.000% 11/01/2031 2,130,000 2,163,927 2,391,922Gen Mtrs Accep Corp Nt 6.750% 01/15/2006 645,000 676,561 692,439Gen Mtrs Accep Corp Nt 7.750% 01/19/2010 321,000 336,331 363,873Gen Mtrs Accep Corp Nt 6.875% 09/15/2011 5,170,000 5,059,392 5,568,752Gen Mtrs Corp Sr Nt 8.375% 07/15/2033 3,720,000 3,700,440 4,318,224Gilroy Cal Un Hi Sch Dist Gilroy 10.000% 09/30/2014 1,452,527 1,456,444 1,452,527Gmac Coml Mtg Secs Inc Mtg Passthru Ctf 1998-c 6.700% 05/15/2030 2,200,000 2,375,984 2,461,268Gnt Prideco Inc Sr 9.000% 12/15/2009 208,000 208,328 229,320Gnt Prideco Inc Sr Nt 9.625% 12/01/2007 630,000 621,250 705,600Goldman Sachs Group Inc 6.600% 01/15/2012 1,990,000 2,191,933 2,223,885Goldman Sachs Group Inc 6.125% 02/15/2033 4,265,000 4,362,695 4,295,038Goldman Sachs Group Inc For Future Eqty Use 38143u 5.250% 10/15/2013 3,875,000 3,872,598 3,912,200Goldman Sachs Group Inc For Future Eqty Use 38143u Nt 7.625% 08/17/2005 2,000,000 2,145,840 2,185,912Goldman Sachs Group Inc Nt 7.350% 10/01/2009 500,000 580,305 583,140Goldman Sachs Group Inc Nt 6.875% 01/15/2011 615,000 692,958 698,400Goodyear Tire & Rubr CO 8.500% 03/15/2007 560,000 493,500 550,200Goodyear Tire & Rubr Co Goodyear Tire 7.857% 08/15/2011 960,000 754,975 837,600Green Tree Finl Corp 1992-2 Mfd Hsg 9.150% 01/15/2018 595,895 580,338 570,867Green Tree Finl Corp Green Tree Finl 8.100% 07/15/2027 322,419 76,409 111,235Gulfterra Energy Partners Lp 8.500% 06/01/2010 518,000 518,000 587,930Gulfterra Energy Partners Lp / Gulfterrasr Sub 10.625% 12/01/2012 175,000 173,674 217,000Halliburton Co Deb 8.750% 02/15/2021 1,075,000 1,006,469 1,341,740Hanger Orthopedic Group Inc Sr Nt 10.375% 02/15/2009 400,000 423,000 454,000Hanover Compressor Co Sr Nt 8.625% 12/15/2010 240,000 240,000 249,600Hanover Compressor Co Sub 0.000% 03/31/2007 690,000 478,218 507,150Harrahs Oper Inc Gtd Sr Sub Nt 7.875% 12/15/2005 246,000 255,409 267,525Harrahs Oper Inc Harrahs Ent Mke Whle 7.500% 01/15/2009 2,400,000 2,790,949 2,733,576HCA Inc Description Not Avail 6.750% 07/15/2013 1,705,000 1,687,530 1,808,153HCA Inc Formerly Hca-Healthcare Co Nt 6.300% 10/01/2012 1,410,000 1,399,862 1,453,738HCA Inc Nt 6.950% 05/01/2012 1,440,000 1,436,112 1,543,982HCA-Healthcare Co HCA 7.125% 06/01/2006 160,000 164,350 173,349Healthsouth Corp Sr Nt 6.875% 06/15/2005 970,000 868,399 928,775Herbalife Intl Inc Sr Sub 11.750% 07/15/2010 900,000 888,444 1,048,500Herbst Gaming Inc Sr Secd Nt 10.750% 09/01/2008 270,000 282,150 303,750Hilton Head Communications Term B 5.250% 12/31/2007 1,200,000 988,892 1,196,016Hilton Hotels Corp Nt 8.250% 02/15/2011 885,000 903,543 1,019,963Hilton Hotels Corp Nt 7.625% 12/01/2012 680,000 680,000 764,150Hmh Pptys Inc Sr 7.875% 08/01/2008 1,800,000 1,603,446 1,872,000Hockey Co Sr Secd 0.113% 04/15/2009 890 896,671 1,015,713Hollinger Intl Pubg Inc Gtd Sr 9.000% 12/15/2010 520,000 525,531 552,500Hollinger Partn Tr Sr 12.125% 11/15/2010 1,759,834 1,178,159 2,089,803Hollywood Entmt Corp Sr Sub Nt 9.625% 03/15/2011 320,000 320,000 344,000Host Marriott L P Sr 9.500% 01/15/2007 460,000 465,376 511,750Host Marriott L P Sr 9.250% 10/01/2007 60,000 60,900 67,050Houghton Mifflin Co Nt 7.200% 03/15/2011 920,000 802,038 987,850
6

Illinois Municipal Retirement FundInvestment Portfolio as of December 31, 2003
Asset descriptionInterest
RateMaturity
date Par Value Cost Value Market Value
FIXED INCOMEU.S. SecuritiesCorporate Bonds
Houghton Mifflin Co Sr Nt 8.250% 02/01/2011 1,800,000 1,890,000 1,926,000Houghton Mifflin Co Sr Sub Nt 9.875% 02/01/2013 505,000 501,061 555,500Hsehd Affinity Cr Card Master Tr I 03-3 Ast Bkd Ctf 1.390% 08/15/2008 7,000,000 7,000,000 7,000,000Hsehd Fin Corp 6.500% 01/24/2006 330,000 344,837 356,887Hsehd Fin Corp 7.875% 03/01/2007 900,000 955,296 1,028,502Hsehd Fin Corp 6.750% 05/15/2011 1,665,000 1,843,652 1,874,359Hsehd Fin Corp Crp Hi 7.000% 05/15/2012 540,000 613,984 615,800Hsehd Fin Corp Hsbc 4.125% 12/15/2008 2,400,000 2,393,112 2,420,976Hsehd Fin Corp Hsehd Fin Glbl Cpn 6.375% 11/27/2012 2,370,000 2,461,339 2,600,009Hsehd Fin Corp Nt 6.375% 10/15/2011 7,665,000 7,698,979 8,440,558Hsehd Fin Corp Nt 4.750% 07/15/2013 25,000 23,109 24,315Hsehd Fin Corp Nts 7.625% 05/17/2032 725,000 950,366 876,583Hsehd Fin Corp Sr Nt 5.875% 02/01/2009 665,000 581,443 722,163Hsehd Pvt Label Cr Card Master 1.550% 06/16/2008 2,000,000 1,997,500 1,992,586Huntsman Advanced Matls Llc Sr Secd 9.230% 07/15/2008 605,000 595,775 629,200Huntsman Ici Chems Llc Sr Sub Nt 10.125% 07/01/2009 1,660,000 1,604,125 1,709,800Huntsman Intl Hldgs Llc Sr Disc 0.000% 12/31/2009 1,220,000 589,175 588,650I/O CMO Conseco Fin Securitizations Corpser2002-a 7.250% 07/15/2004 3,151,659 377,486 70,723I/O Omi Tr 6.000% 08/15/2009 4,640,000 1,075,011 887,043ICO Global Communications Hldgs Ltd 0.153% 08/01/2005 1,563 - 1Il Pwr Co Mtg Bd 11.500% 12/15/2010 1,305,000 1,276,174 1,566,000Il Pwr Co New Mtg Bd 7.500% 06/15/2009 35,000 36,969 38,500Imc Global Inc 7.625% 11/01/2005 3,000 2,747 3,075Imc Global Inc Sr 10.875% 06/01/2008 416,000 448,181 457,600Imc Global Inc Sr 11.250% 06/01/2011 327,000 343,487 359,700Impac Cmb Tr 2003-4 Coll Ast Bkd Bd Cl 1.461% 10/25/2033 5,147,195 5,147,195 5,142,068In Default Pvtpl Secs Enhanced Rt 10.098% 06/30/2008 2,196,013 1,652,500 220Insight Midwest L P / Insight Cap Inc Srnt 10.500% 11/01/2010 1,850,000 1,859,757 2,011,875Interline Brands Inc Sr Sub Nt 11.500% 05/15/2011 1,150,000 1,150,000 1,267,875Intl Lease Fin Corp- Mtn Nm Fin Crp Be 4.000% 01/17/2006 2,790,000 2,787,377 2,876,378Intl Paper CO 5.500% 01/15/2014 280,000 279,336 281,040Intl Paper Co Nt 6.750% 09/01/2011 2,630,000 2,623,820 2,923,966Ipc Acqstn Corp Sr Sub Nt 11.500% 12/15/2009 1,400,000 1,430,500 1,526,000Isle Capri Casinos Inc Sr Sub Nt 8.750% 04/15/2009 1,175,000 1,191,156 1,233,750ITT Corp 6.750% 11/15/2005 21,000 21,000 22,050ITT Corp 7.375% 11/15/2015 1,687,000 1,463,216 1,805,090J Crew Inter Llc Sr Disc Contingent Prinnt 16.000% 05/15/2008 745,000 555,256 592,275J Crew Oper Corp Sr Sub Nt 10.375% 10/15/2007 1,315,000 1,338,750 1,342,944J P Morgan Chase & Co Global Sr Nt 3.625% 05/01/2008 1,550,000 1,517,293 1,553,116J P Morgan Chase & Co Global Sub Nt 5.750% 01/02/2013 2,160,000 2,205,295 2,277,694J P Morgan Chase & Co Jp Morgan Chase Cont 5 1 4 Due 5.250% 05/30/2007 725,000 769,051 773,880J P Morgan Chase & Co Nt 6.750% 02/01/2011 1,675,000 1,828,861 1,888,713J P Morgan Chase & Co Sr Nt 4.500% 11/15/2010 2,000,000 1,995,340 2,015,900Jacobs Entmt Inc Sr Secd Nt 11.875% 02/01/2009 650,000 647,746 728,000Jostens Hldg Corp Sr Disc 10.250% 12/01/2013 360,000 218,455 225,900K Mart Corp Pass Thru Tr 8.540% 01/02/2015 1,053,016 586,542 515,978KB Home 8.625% 12/15/2008 650,000 659,750 728,000KB Home KB Home 9.500% 02/15/2011 1,500,000 1,512,857 1,672,500Kellogg Co Nt 6.600% 04/01/2011 2,860,000 2,925,407 3,205,176Kinder Morgan Energy Partners L P 7.125% 03/15/2012 2,553,000 2,648,503 2,924,827Kinder Morgan Energy Partners L P Sr 7.300% 08/15/2033 1,155,000 1,305,693 1,312,415Knowles Elec Hldgs Inc Formerly Sr Sub 13.125% 10/15/2009 1,020,000 966,213 1,026,375Kraft Foods Inc Global Nt 5.625% 11/01/2011 6,635,000 6,691,310 6,990,968Kraft Foods Inc Nt 6.250% 06/01/2012 1,470,000 1,657,160 1,602,096Kroger Co Nt 7.500% 04/01/2031 400,000 445,364 460,908Kroger Co Sr 7.700% 06/01/2029 1,750,000 1,773,258 2,043,388Ks Cy Southn Ry Co Sr Nt 9.500% 10/01/2008 573,000 621,286 636,030Ks Cy Southn Ry Co Sr Nt 7.500% 06/15/2009 1,990,000 2,001,400 2,039,750La Quinta Pptys Inc Sr Nt 8.875% 03/15/2011 145,000 154,788 160,406Lamar Media Corp Sr Sub Nt 7.250% 01/01/2013 408,000 408,000 438,600LBI Media Inc Sr Sub Nt 10.125% 07/15/2012 990,000 990,000 1,123,650
7

Illinois Municipal Retirement FundInvestment Portfolio as of December 31, 2003
Asset descriptionInterest
RateMaturity
date Par Value Cost Value Market Value
FIXED INCOMEU.S. SecuritiesCorporate Bonds
Lehman Abs Manufactured Hsg Cont Tr 4.350% 05/15/2014 3,202,138 3,201,638 3,105,722Lehman Abs Manufactured Hsg Cont Tr 6.467% 08/15/2028 3,202,138 3,202,138 3,245,003Lehman Bros Hldgs Inc Global Nt 6.250% 05/15/2006 2,255,000 2,333,372 2,449,832Lehman Bros Hldgs Inc Lehman Bor Hldg 7.000% 02/01/2008 295,000 329,589 333,185Lehman Bros Hldgs Inc Lehman Bros Hldg 4.000% 01/22/2008 970,000 965,994 989,346Levi Strauss & Co New 7.000% 11/01/2006 895,000 670,738 575,038Levi Strauss & Co New Sr Nt 12.250% 12/15/2012 1,585,000 1,374,429 1,030,250Liberty Media Corp 8.250% 02/01/2030 10,000 11,267 11,965Liberty Media Corp New Liberty Media 5.700% 05/15/2013 95,000 94,647 96,070Liberty Media Corp New Nt 3.500% 09/25/2006 3,380,000 3,379,696 3,396,890Liberty Media Corp New Sr 2.670% 09/17/2006 2,565,000 2,570,998 2,592,882Lockheed Martin Corp 7.650% 05/01/2016 2,520,000 2,921,031 3,061,593Lockheed Martin Corp Bd 8.500% 12/01/2029 800,000 1,054,456 1,048,296Lodgenet Entmt Corp Sr Sub Nt 9.500% 06/15/2013 605,000 605,000 662,475Long Beach Mtg Ln Tr 2002-1 Ast Bkd Ctf Cl Ii-A1 Fltg 1.461% 05/25/2032 4,421,028 4,421,028 4,424,661Loral Corp 7.000% 09/15/2023 315,000 315,992 345,672Loral Cyberstar Inc Sr Nt 10.000% 07/15/2006 2,595,000 931,350 1,920,300Louisiana-Pac Corp Sr Sub Nt 10.875% 11/15/2008 175,000 208,756 208,250Lucent Technologies Inc 7.250% 07/15/2006 490,000 466,725 497,350Lucent Technologies Inc 5.500% 11/15/2008 355,000 305,300 330,150Lucent Technologies Inc 6.500% 01/15/2028 105,000 80,175 82,163Lucent Technologies Inc Deb 6.450% 03/15/2029 6,565,000 4,460,417 5,161,731Lumbermens Mut Cas CO 9.150% 12/31/2040 3,490,000 730,216 122,150Lyondell Chem Co Sr Nt 11.125% 07/15/2012 1,080,000 1,096,525 1,198,800Lyondell Chem Co Sr Secd 9.625% 05/01/2007 305,000 292,800 323,300Lyondell Chem Co Sr Secd 9.875% 05/01/2007 635,000 614,363 669,925Lyondell Chem Co Sr Secd Nt 9.500% 12/15/2008 530,000 518,075 553,850Lyondell Chem Co Sr Secd Nt 9.500% 12/15/2008 650,000 630,500 679,250Lyondell Chem Co Sr Secd Nt 10.500% 06/01/2013 215,000 209,088 234,350Manor Care Inc 7.500% 06/15/2006 845,000 845,000 916,825Manor Care Inc New Sr Nt 8.000% 03/01/2008 170,000 179,174 192,100Mark Iv Inds Inc 7.500% 09/01/2007 3,330,000 2,382,684 2,880,450MBNA Amer Bk Natl Assn Medium Term Sr 5.375% 01/15/2008 2,680,000 2,762,419 2,849,510MCI Communications Corp 6.500% 04/15/2010 75,000 58,688 60,375MCI Communications Corp 8.250% 01/20/2023 220,000 172,275 177,100MCI Communications Corp 7.750% 03/23/2025 100,000 78,250 80,500MCI Communications Corp 7.125% 06/15/2027 730,000 571,225 587,650MCI Communications Corp Sr Deb 7.750% 03/15/2024 620,000 487,638 499,100Meadwestvaco Corp Nt 6.850% 04/01/2012 620,000 647,405 681,986Medianews Group Inc 6.875% 10/01/2013 490,000 485,752 498,575Medpartners Inc 7.375% 10/01/2006 2,180,000 2,026,526 2,343,500Merrill Lynch & Co Inc Medium Term Nts 3.375% 09/14/2007 870,000 869,643 881,239Metris Cos Inc 10.000% 11/01/2004 60,000 41,700 51,600Metris Cos Inc Sr Nt 10.125% 07/15/2006 200,000 139,075 172,250MGM Mirage Formerly Mgm Grand Inc 8.500% 09/15/2010 355,000 370,937 407,363MGM Mirage Formerly Mgm Grand Inc 8.375% 02/01/2011 562,000 621,074 636,465MGM Mirage Inc Gtd Sr Sub Nt 9.750% 06/01/2007 114,000 125,515 129,960Millennium Amer Inc Sr Deb 7.625% 11/15/2026 1,710,000 1,141,425 1,590,300Millennium Amer Inc Sr Nt 9.250% 06/15/2008 425,000 426,100 463,250Mirant Americas Generation Llc 8.500% 12/31/2040 505,000 248,550 426,725Mirant Americas Generation Llc Sr Nt 9.125% 05/01/2031 1,265,000 593,100 1,068,925Mirant Corp Revolver 0.000% 07/17/2005 394,394 - 394,394Mohegan Tribal Gaming Auth Sr Nt 8.125% 01/01/2006 74,000 77,368 79,735Mohegan Tribal Gaming Auth Sr Sub Nt 6.375% 07/15/2009 1,770,000 1,770,000 1,827,525Mohegan Tribal Gaming Auth Sr Sub Nt 8.375% 07/01/2011 80,000 83,600 87,200Morgan Stanley Abs Cap I Inc Tr 2002-Nc6cl A2 Fltg 1.391% 11/25/2032 5,012,120 5,014,665 5,014,462Morgan Stanley Dean Witter & CO 5.800% 04/01/2007 1,375,000 1,494,969 1,494,598Morgan Stanley Dean Witter & Co Global 6.750% 04/15/2011 2,205,000 2,468,913 2,494,781Morgan Stanley Global Nt 6.100% 04/15/2006 3,940,000 4,337,646 4,263,553Morgan Stanley Global Nt 5.300% 03/01/2013 1,160,000 1,175,764 1,184,946Mountain St Tel & Tel CO 7.375% 05/01/2030 645,000 609,525 645,000
8

Illinois Municipal Retirement FundInvestment Portfolio as of December 31, 2003
Asset descriptionInterest
RateMaturity
date Par Value Cost Value Market Value
FIXED INCOMEU.S. SecuritiesCorporate Bonds
N W Airls Corp N W Airli 9.875% 03/15/2007 3,390,000 2,778,270 3,084,900N W Airls Inc Nt 8.520% 04/07/2004 335,000 268,997 336,675N W Airls Pass Thru Trs 1999-1 Pass Thructf Cl 1a 6.810% 02/01/2020 290,400 269,134 252,523N W Airls Pass Thru Trs 2001-1 Passthru Ctf Cl 1b 7.691% 10/01/2018 45,862 41,198 38,089N W Pipeln Corp Deb 6.625% 12/01/2007 330,000 262,350 346,500N W Pipeln Corp Sr Nt 8.125% 03/01/2010 330,000 330,000 366,300N.W Airls Pass Thru Trs 1997-1 Pass 7.248% 07/02/2014 421,593 364,678 311,789N.W Airls Pass Thru Trs 1999-2 Mtg 7.575% 09/01/2020 229,494 223,697 236,555N.W Airls Pass Thru Trs 2001-1 Passthru Ctf Cl 1c 7.626% 10/01/2011 828,620 737,472 703,575N.W Airls Pass Thru Trs 99-2 Mtg Ctf 7.950% 09/01/2016 45,966 37,002 39,853N.W Airls Pass Thru Trs 99-2 Mtg Ctf Cl C 8.304% 03/01/2012 343,748 311,843 297,019Natl Rural Utils Coop Fin Corp 7.250% 03/01/2012 2,530,000 2,949,866 2,947,923New Eng Tel & Tel Co 40 Yr 7.875% 11/15/2029 775,000 1,019,699 926,451Newfield Expl Co Beo 7.625% 03/01/2011 110,000 119,900 122,650Newfield Expl Co Sr Sub Nt 8.375% 08/15/2012 110,000 121,000 123,200News Amer Inc Gtd Sr Deb 7.300% 04/30/2028 810,000 873,877 904,572News Amer Inc Gtd Sr Deb 7.625% 11/30/2028 875,000 1,083,189 1,013,556News Amer Inc Sr Deb 7.280% 06/30/2028 1,600,000 1,475,424 1,783,587Nextel Communications Inc Sr 9.500% 02/01/2011 1,235,000 806,657 1,395,550Nextel Communications Inc Sr Nt 7.375% 08/01/2015 5,515,000 5,450,217 5,928,625Nextmedia Oper Inc Sr Sub Nt 10.750% 07/01/2011 585,000 577,353 663,975Nisource Fin Corp Bd 5.400% 07/15/2014 2,990,000 2,825,371 3,027,366Nortek Hldgs Inc Sr Disc 10.000% 05/15/2011 540,000 366,385 390,150Northrop Grumman Corp Nt 7.125% 02/15/2011 1,165,000 1,227,898 1,347,427Nuevo Energy Co Sr Sub 9.500% 06/01/2008 238,000 240,083 249,305NV Pwr Co Gen & Ref Mtg 10.875% 10/15/2009 220,000 207,339 255,475NWA Tr 10.230% 06/21/2014 251,585 209,759 227,055Olympus Cable Hldgs Llc / Adelphia Co Weolympus Cable Term Ln B6.250% 09/30/2010 1,560,000 1,253,968 1,482,000Omega Healthcare Invs Inc Nt 6.950% 08/01/2007 1,621,000 1,328,518 1,608,843Omnicare Inc Sr Sub 8.125% 03/15/2011 219,000 229,315 239,258On Semiconductor Corp / Semiconductor 13.000% 05/15/2008 1,225,000 1,085,611 1,424,063On Semiconductor Corp / Semiconductor 12.000% 03/15/2010 620,000 591,895 739,350Oncor Elec Delivery Co Sr Nt 7.250% 01/15/2033 470,000 463,279 534,663Oncor Elec Delivery Co Sr Secd Nt 6.375% 01/15/2015 955,000 1,061,646 1,038,209Orion Pwr Hldgs Inc Sr 12.000% 05/01/2010 236,000 214,108 286,740Owens Ill Inc 7.800% 05/15/2018 1,630,000 1,400,500 1,685,013Owens-Brockway Glass Container Inc Gtd 7.750% 05/15/2011 885,000 885,000 950,269Owens-Brockway Glass Container Inc Gtd 8.250% 05/15/2013 1,200,000 1,200,000 1,288,500Owens-Brockway Glass Container Inc Sr 8.875% 02/15/2009 3,940,000 4,024,685 4,319,225Owens-Brockway Glass Container Inc Sr 8.750% 11/15/2012 1,190,000 1,190,000 1,325,363P/O CMO Ml Tr Xxix 0.000% 05/01/2013 160,850 115,289 152,650Pac Gas & Elec CO 7.050% 03/01/2024 295,000 244,850 298,688Pacificare Hlth Sys Inc Del Sr Nt 10.750% 06/01/2009 613,000 609,255 723,340Panamsat Corp New 6.375% 01/15/2008 803,000 760,263 833,113Panamsat Corp New Sr Nt 8.500% 02/01/2012 1,814,000 1,818,375 2,013,540Parker & Parsley Pete Co Del 8.875% 04/15/2005 30,000 31,650 32,107Parker & Parsley Pete Co Del Sr Nt 8.250% 08/15/2007 70,000 72,100 80,851Parker Drilling Co Sr 10.125% 11/15/2009 895,000 897,238 948,700Paxson Communications Corp Sr Sub 0.000% 01/15/2009 3,850,000 2,392,082 3,378,375Peabody Energy Corp Sr Nt 6.875% 03/15/2013 757,000 767,504 798,635Pegasus Satellite Communications Inc Sr Sub Disc 0.000% 03/01/2007 835,000 499,363 706,619PEI Hldgs Inc Gtd Sr 11.000% 03/15/2010 835,000 851,500 968,600Pemex Proj Fdg Master Tr Mtn Gtd Nt 7.875% 02/01/2009 3,710,000 3,824,056 4,188,590Penn Natl Gaming Inc Sr Sub Nt 8.875% 03/15/2010 1,235,000 1,217,773 1,339,975PG&E Gas Transm N W Corp Sr Nt 7.100% 06/01/2005 1,195,000 1,226,069 1,209,938PG&E Natl Energy Group Inc Sr Nt 10.375% 05/16/2011 2,660,000 1,654,084 1,862,000PHH Corp 6.000% 03/01/2008 2,990,000 2,988,888 3,217,120Philip Morris Cos Inc 7.750% 01/15/2027 570,000 612,324 615,012Phillips Pete Co Nt 8.750% 05/25/2010 1,010,000 1,174,802 1,261,693Phoenix Color Corp Sr Sub Nt 10.375% 02/01/2009 1,535,000 1,165,800 1,368,069Pioneer Nat Res Co Sr Nt 9.625% 04/01/2010 131,000 141,082 163,019
9

Illinois Municipal Retirement FundInvestment Portfolio as of December 31, 2003
Asset descriptionInterest
RateMaturity
date Par Value Cost Value Market Value
FIXED INCOMEU.S. SecuritiesCorporate Bonds
Pk Pl Entmt Corp Sr Sub Nt 8.125% 05/15/2011 340,000 339,325 381,225Plains Expl & Prodtn Co L P / Plains E &P Co Sr Sub Nt 8.750% 07/01/2012 2,180,000 2,148,947 2,395,275Pope & Talbot Inc Sr Nt 8.375% 06/01/2013 1,385,000 1,196,848 1,381,538Progress Energy Inc Sr Nt 7.100% 03/01/2011 1,090,000 1,153,841 1,228,020Prot 1 Alarm Monitoring Inc Sr Nt 7.375% 08/15/2005 1,780,000 1,358,820 1,637,600Protective Life Secd Trs Secd Medium 3.700% 11/24/2008 2,125,000 2,120,963 2,118,243Prudential Finl Inc Medium Term Nts Bookentry Bd 5.750% 07/15/2033 965,000 957,400 911,462Psychiatric Solutions Inc Sr Sub Nt 10.625% 06/15/2013 210,000 210,000 235,725Pulte Homes Inc Sr Nt 7.875% 08/01/2011 5,220,000 6,178,102 6,152,449Pvtpl 1st USA Secd 2.050% 11/20/2006 3,500,000 3,503,828 3,502,508Pvtpl Acc Escr Corp Sr 10.000% 08/01/2011 860,000 860,000 958,900Pvtpl AES Corp 2nd Prty Sr Secd 8.750% 05/15/2013 2,777,000 2,805,525 3,103,298Pvtpl AES Corp Bd1 44a 9.000% 05/15/2015 4,340,000 4,344,788 4,904,200Pvtpl AES Corp Sr Secd 10.000% 12/12/2005 236,348 238,711 240,484Pvtpl Air 2 US Enhanced Equip 8.027% 10/01/2020 330,565 167,348 281,172Pvtpl Allegy Energy Sup Co Llc 8.750% 04/15/2012 1,620,000 1,338,152 1,526,850Pvtpl Amern Color Graphics Inc Sr 2nd 10.000% 06/15/2010 950,000 951,650 973,750Pvtpl Amern Gen Instl Cap A Cap Secs 7.570% 12/01/2045 900,000 1,014,336 1,070,631Pvtpl Amern Gen Instl Cap B Cap Secs 8.125% 03/15/2046 1,480,000 1,503,147 1,887,444Pvtpl Amern Intl Group Inc 2.875% 05/15/2008 3,420,000 3,365,750 3,327,899Pvtpl Amsted Inds Inc Sr 10.250% 10/15/2011 1,505,000 1,505,000 1,663,025Pvtpl Anz Cap Tr I Tr Secs 144a 4.484% 01/15/2010 2,205,000 2,205,000 2,222,618Pvtpl Anz Cap Tr I Tr Secs 144a 5.360% 12/15/2013 3,355,000 3,354,866 3,348,995Pvtpl Arch Westn Res Llc Sr 6.750% 07/01/2013 910,000 910,000 935,025Pvtpl Ardent Hlth Svcs Inc Sr Sub 10.000% 08/15/2013 1,505,000 1,505,000 1,640,450Pvtpl Asif Global Fing Xxiii Sr 3.900% 10/22/2008 2,415,000 2,410,339 2,437,411Pvtpl Bally Total Fitness Hldg Corp Sr 10.500% 07/15/2011 1,110,000 1,110,000 1,115,550Pvtpl Bayview Finl Ast Tr 2001-D Ast Bkdctf 1.521% 11/25/2031 4,091,186 4,082,876 4,095,769Pvtpl Be Aerospace Inc Sr 8.500% 10/01/2010 700,000 700,000 750,750Pvtpl Blue Ridge Paper Prods Inc Sr 9.500% 12/15/2008 230,000 230,000 230,000Pvtpl Bristol Myers Squibb Co Bristol 5.250% 08/15/2013 1,600,000 1,575,808 1,649,856Pvtpl Cadbury Schweppes US Finanace Llc Gtd Sr 5.125% 10/01/2013 760,000 755,714 755,052Pvtpl Calpine Constr Fin Co L P / Ccfc 9.690% 08/26/2011 1,075,000 1,053,500 1,119,344Pvtpl Calpine Corp 2nd Prty Sr Secd 8.500% 07/15/2010 3,005,000 2,797,919 2,929,875Pvtpl Calpine Corp 2nd Prty Sr Secd 8.750% 07/15/2013 3,420,000 3,114,838 3,334,500Pvtpl Camp Pendleton & Quantico Hsg Llc 2003a 144a 5.937% 10/01/2043 800,000 800,000 783,776Pvtpl Cbre Escr Inc Sr 9.750% 05/15/2010 1,090,000 1,090,000 1,209,900Pvtpl CCH II Llc / Cch II Cap Corp Sr 10.250% 09/15/2010 4,250,000 3,459,358 4,462,500Pvtpl CCO Hldgs Llc / Cco Hldgs Cap Corpcharter Comm Llc 144a8.750% 11/15/2013 970,000 970,000 986,975Pvtpl Chukchansi Econ Dev Auth Sr 14.500% 06/15/2009 545,000 498,544 662,175Pvtpl Cin Bell Inc New Sr 7.250% 07/15/2013 430,000 429,063 451,500Pvtpl Cin Bell Inc New Sub 8.375% 01/15/2014 420,000 420,000 451,500Pvtpl CMO Bear Stearns Coml Mtg Secs Incctf 2002-Home 144a1.770% 12/03/2013 4,900,000 4,900,000 4,886,417Pvtpl CMO Cc Mtg Fdg Corp 2003-1 Mtg 1.720% 02/25/2034 6,705,887 6,705,887 6,705,887Pvtpl CMO Chase Coml Mtg Secs Corp 144a 1.390% 12/15/2013 1,454,148 1,454,035 1,453,637Pvtpl CMO Coml Cap Access 1 Inc Coml Mtgser 2 Cl I 144a1200.000% 11/15/2027 9,144 575,757 478,729Pvtpl CMO Cr Suisse 1st Bstn Mtg Secs 1.370% 04/15/2008 6,400,000 6,391,000 6,400,109Pvtpl CMO Cwabs Inc 2003-S&D1 Ast Bkd 1.831% 12/25/2032 1,352,347 1,354,546 1,357,418Pvtpl CMO Dlj Mtg Accep Corp Tr Ctf 6.340% 05/28/2028 255,016 262,666 257,566Pvtpl CMO Istar Ast Receivables Tr 1.369% 08/28/2022 6,130,997 6,130,997 6,132,836Pvtpl CMO Lehman Bros Comlmtg Tr 1.340% 03/14/2004 4,400,402 4,401,090 4,400,305Pvtpl CMO Summit Mtg Tr 6.080% 12/28/2012 112,310 106,308 355,510Pvtpl CMS Energy Corp 144a 7.750% 08/01/2010 1,600,000 1,578,688 1,682,000Pvtpl Colbs Mckinnon Corp N Y Sr Secd Nt144a 10.000% 08/01/2010 120,000 120,000 127,800Pvtpl Comwlth Brands Inc Sr Secd 9.750% 04/15/2008 1,125,000 1,082,936 1,237,500Pvtpl Comwlth Brands Inc Sr Sub 10.625% 09/01/2008 1,020,000 1,010,035 1,122,000Pvtpl Crum & Forster Hldgs Corp Sr 10.375% 06/15/2013 1,410,000 1,367,489 1,566,863Pvtpl Csc Hldgs Inc Sr Nt 7.625% 04/01/2011 1,618,000 1,554,153 1,702,945Pvtpl Cummins Inc Formerly Cummins 9.500% 12/01/2010 320,000 320,000 368,000Pvtpl Dayton Superior Corp 10.750% 09/15/2008 925,000 907,314 948,125Pvtpl Dex Media Inc 8.000% 11/15/2013 1,405,000 1,410,719 1,475,250
10

Illinois Municipal Retirement FundInvestment Portfolio as of December 31, 2003
Asset descriptionInterest
RateMaturity
date Par Value Cost Value Market Value
FIXED INCOMEU.S. SecuritiesCorporate Bonds
Pvtpl Dobson Communications Corp Okla 8.875% 10/01/2013 890,000 890,000 901,125Pvtpl Dominos Inc Sr Sub 8.250% 07/01/2011 430,000 426,895 460,638Pvtpl Dr Structured Fin Corp 8.375% 08/15/2015 222,893 121,476 127,049Pvtpl Dynegy Hldgs Inc 2nd Prty Sr Secd 9.875% 07/15/2010 1,530,000 1,520,376 1,721,250Pvtpl Dynegy Hldgs Inc Secd 10.125% 07/15/2013 750,000 789,375 862,500Pvtpl Eaglepicher Inc Sr 9.750% 09/01/2013 910,000 902,720 982,800Pvtpl Echostar Dbs Corp 6.375% 10/01/2011 3,270,000 3,270,000 3,351,750Pvtpl El Paso Prodtn Hldg Co Sr 7.750% 06/01/2013 2,795,000 2,715,381 2,753,075Pvtpl Equinox Hldgs Inc Sr 9.000% 12/15/2009 120,000 120,000 123,900Pvtpl Equistar Chemicals Lp/Equistar Fdgcor Equistar Chem Fdg10.625% 05/01/2011 1,620,000 1,695,897 1,790,100Pvtpl Erac USA Fin Co Gtd 7.350% 06/15/2008 1,940,000 2,210,203 2,216,469Pvtpl Ga Pac Corp Ga Pac Corp 144a 8.000% 01/15/2024 3,045,000 3,045,000 3,105,900Pvtpl Gaylord Entmt Co New Sr 8.000% 11/15/2013 1,030,000 1,033,063 1,086,650Pvtpl Gemstone Inv Ltd/Gemstone Inv Inc Gtd Sr 7.710% 10/31/2004 960,000 862,350 969,600Pvtpl Gen Cable Corp Del New Sr 9.500% 11/15/2010 230,000 230,000 246,100Pvtpl Genesis Healthcare Corp Sr Sub 8.000% 10/15/2013 190,000 190,000 198,075Pvtpl Globix Corp Sr Secd 11.000% 05/01/2008 1,047,664 854,463 921,944Pvtpl Granite Broadcasting Corp Sr Secd 9.750% 12/15/2010 1,125,000 1,117,013 1,122,188Pvtpl Great Lakes Dredge & Dock Corp 7.750% 12/15/2013 460,000 460,000 473,225Pvtpl Haights Cross Oper Co Sr 11.750% 08/15/2011 1,090,000 1,090,000 1,122,700Pvtpl Hines Nurseries Inc Sr 10.250% 10/01/2011 210,000 210,000 228,900Pvtpl Hm Pubg Corp Sr Disc 0.000% 10/15/2013 3,395,000 1,995,001 2,147,338Pvtpl Huntsman Advanced Matls Llc Sr 11.000% 07/15/2010 485,000 489,025 535,925Pvtpl Jacuzzi Brands Inc Sr Secd 9.625% 07/01/2010 1,035,000 1,079,850 1,138,500Pvtpl Johnsondvrsy Hldgs Inc Sr Disc 0.000% 05/15/2013 1,885,000 1,250,631 1,442,025Pvtpl Keystone Automotive Operations 9.750% 11/01/2013 210,000 210,000 225,750Pvtpl Kraton Polymers Llc/kraton 8.125% 01/15/2014 150,000 150,000 156,000Pvtpl L A Arena Fdg Llc Rev Ast Bkd 7.656% 12/15/2021 1,880,984 1,985,026 1,979,736Pvtpl Level 3 Fing Inc Gtd 10.750% 10/15/2011 2,540,000 2,541,575 2,686,050Pvtpl Levi Strauss & Co New Levi 11.625% 09/29/2009 550,000 567,487 564,439Pvtpl Lumbermens Mut Cas Co Surp 8.300% 12/31/2040 615,000 170,663 21,525Pvtpl Mariner Hlth Care Inc Sr Sub 8.250% 12/15/2013 410,000 410,000 414,100Pvtpl Massey Energy Co Sr 6.625% 11/15/2010 480,000 480,000 492,000Pvtpl MBNA Abs 1.963% 07/15/2004 3,500,000 3,479,082 3,500,000Pvtpl Michael Foods Inc New 144a 8.000% 11/15/2013 230,000 230,000 239,775Pvtpl Micron Tech Inc Custody Rcpt 6.500% 09/30/2005 1,000,000 980,000 990,000Pvtpl Millennium Amer Inc 144a 9.250% 06/15/2008 105,000 106,050 114,450Pvtpl Mirage Resorts 7.250% 10/15/2006 140,000 150,325 150,850Pvtpl Morris Pubg Group Llc / Morris 7.000% 08/01/2013 1,705,000 1,705,000 1,730,575Pvtpl Mortons Restaurant Grp Inc 7.500% 07/01/2010 655,000 581,825 615,700Pvtpl Msw Energy Hldgs II Llc / Msw 7.375% 09/01/2010 630,000 630,000 658,350Pvtpl Nalco CO 7.750% 11/15/2011 520,000 520,000 556,400Pvtpl Nalco CO 8.875% 11/15/2013 530,000 530,000 561,800Pvtpl Nationsrent Cos Inc Sr Secd 9.500% 10/15/2010 440,000 440,000 473,000Pvtpl Natl Beef Packing Co Llc / Nb Fin Corp Sr 10.500% 08/01/2011 2,970,000 3,008,700 3,059,100Pvtpl Natl Nephrology Assocs Inc Sr Sub 9.000% 11/01/2011 985,000 993,684 1,031,788Pvtpl Nrg Energy Inc 2nd Prty Sr Secd Nt144a 8.000% 12/15/2013 985,000 985,000 1,035,481Pvtpl Ny Life Ins Co 144a Nt 5.875% 05/15/2033 1,100,000 1,150,837 1,093,268Pvtpl Ormet Corp Sr Secd 11.000% 08/15/2008 2,035,000 1,748,676 529,100Pvtpl Owens Corning Bk Dbt Fd Rev PP 0.010% 03/31/2004 1,630,025 1,096,745 1,141,017Pvtpl Pac Gas & Elec Co Sr 9.625% 11/01/2005 1,570,000 1,595,938 1,577,850Pvtpl Parker Drilling CO 9.625% 10/01/2013 1,015,000 1,015,000 1,055,600Pvtpl Pegasus Aviation Lease Secur 8.370% 03/25/2030 1,660,000 972,325 991,984Pvtpl Pegasus Satellite Communications 11.250% 01/15/2010 550,000 610,452 489,500Pvtpl Petrozuata Fin Inc 8.220% 04/01/2017 230,000 172,500 211,600Pvtpl Phibro Animal Hlth Corp Unit 13.000% 12/01/2007 715 734,238 743,600Pvtpl Prin Life Global Fdg I Global 5.250% 01/15/2013 1,900,000 2,067,219 1,924,491Pvtpl Provident Equip Lease Tr 2000-A Cla 144a Fltg Var Rt1.441% 11/25/2011 4,909,119 4,909,119 4,914,553Pvtpl Prudential Ins Co Amer Sr Nt 6.375% 07/23/2006 1,600,000 1,701,232 1,742,912Pvtpl Quintiles Transnational Corp Sr 10.000% 10/01/2013 2,130,000 2,130,000 2,300,400Pvtpl Qwest Corp 9.125% 03/15/2012 6,595,000 6,524,101 7,567,763
11

Illinois Municipal Retirement FundInvestment Portfolio as of December 31, 2003
Asset descriptionInterest
RateMaturity
date Par Value Cost Value Market Value
FIXED INCOMEU.S. SecuritiesCorporate Bonds
Pvtpl Qwest Svcs Corp Sr Sub Secd 13.000% 12/15/2007 1,190,000 1,590,325 1,398,250Pvtpl Qwest Svcs Corp Sr Sub Secd 13.500% 12/15/2010 705,000 850,384 856,575Pvtpl Qwest Svcs Corp Sr Sub Secd 14.000% 12/15/2014 3,226,000 3,662,965 4,105,085Pvtpl R H Donnelley Fin Corp I Sr 8.875% 12/15/2010 360,000 360,000 405,000Pvtpl R H Donnelley Fin Corp I Sr Sub 10.875% 12/15/2012 570,000 570,000 676,163Pvtpl Rabobank Cap Fdg Tr II Bd 144a 5.260% 12/29/2049 800,000 800,000 801,104Pvtpl Reliant Res Inc Sr 9.250% 07/15/2010 890,000 744,900 943,400Pvtpl Rent-Way Inc Sr Secd 11.875% 06/15/2010 1,075,000 1,056,209 1,198,625Pvtpl Saks Inc 7.000% 12/01/2013 1,434,000 1,288,520 1,462,680Pvtpl Salt Hldgs Corp Sr Sub Disc 12.000% 06/01/2013 1,580,000 879,697 1,090,200Pvtpl Seabulk Intl Inc Sr 9.500% 08/15/2013 1,330,000 1,330,000 1,383,200Pvtpl Sealy Corp Jr Sub Prom 10.000% 12/18/2008 3,599,180 1,674,000 3,125,528Pvtpl Semiconductor 0.000% 08/04/2011 230,000 247,250 247,250Pvtpl Seminis Vegetable Seeds Inc Sr 10.250% 10/01/2013 585,000 585,000 628,875Pvtpl Sensus Metering Sys Inc Sr Sub 8.625% 12/15/2013 430,000 430,000 441,288Pvtpl Shaw Group Inc Sr 10.750% 03/15/2010 1,405,000 1,411,819 1,489,300Pvtpl Simmons Co Sr Sub 7.875% 01/15/2014 220,000 220,000 221,100Pvtpl Sl Coml Mtg Tr 6.875% 07/25/2004 131,761 132,982 132,942Pvtpl Southn Energy Inc N Y Sr 7.400% 07/15/2004 670,000 416,088 432,150Pvtpl Southn Pwr Co Southn Pwr 4.875% 07/15/2015 2,700,000 2,692,926 2,573,343Pvtpl Stl Dynamics Inc 9.500% 03/15/2009 70,000 76,300 77,700Pvtpl Stratus Technologies Inc Sr 10.375% 12/01/2008 595,000 595,488 631,444Pvtpl Sun Life Cda U S Cap Tr I Cap Secs144a 8.526% 07/14/2027 1,625,000 1,691,804 1,901,250Pvtpl Swift & Co Sr Sub Nt 12.500% 01/01/2010 1,185,000 1,180,781 1,267,950Pvtpl Telex Communications Inc Sr Secd 11.500% 10/15/2008 935,000 964,400 993,438Pvtpl Tiverton Pwr Assocs Ltd Part & 9.000% 07/15/2018 2,860,000 2,860,000 2,373,800Pvtpl Triad Hosps Inc Sr Sub 7.000% 11/15/2013 1,090,000 1,090,000 1,098,175Pvtpl Unvl Cy Dev Partners Ltd / Ucdp F Sr 11.750% 04/01/2010 3,030,000 2,994,670 3,545,100Pvtpl Vertis Inc Sr 9.750% 04/01/2009 1,045,000 1,017,276 1,135,131Pvtpl Viasystems Inc Sr Sub 10.500% 01/15/2011 1,380,000 1,420,500 1,473,150Pvtpl Vought Aircraft Inds Inc Sr 8.000% 07/15/2011 665,000 666,181 679,131Pvtpl Waterford Gaming L L C /wtrfrd 8.625% 09/15/2012 386,000 389,200 409,160Pvtpl Westn & Southn Finl Group Inc Sr 5.750% 07/15/2033 2,330,000 2,324,465 2,195,862Pvtpl Westport Res Corp New 144a 8.250% 11/01/2011 58,000 61,480 63,800Pvtpl Young Broadcasting Inc Sr 8.500% 12/15/2008 460,000 491,786 494,500Quadramed Corp Sr Secd 10.000% 04/01/2008 1,074,224 1,051,522 934,575Qwest Communications Intl Inc Sr Nt 7.500% 11/01/2008 325,000 307,938 333,938Qwest Corp Term B 6.950% 06/30/2010 1,150,000 1,131,002 1,148,083R J Reynolds Tob Hldgs Inc 7.750% 05/15/2006 700,000 734,545 735,000Radio 1 Inc Sr Sub Nt 8.875% 07/01/2011 2,525,000 2,550,229 2,783,813Radio Unica Corp Sr Disc 11.750% 08/01/2006 2,665,000 1,723,788 1,792,213Range Res Corp Sr Sub Nt 7.375% 07/15/2013 430,000 422,570 430,000Raytheon Co Deb 6.000% 12/15/2010 40,000 42,356 42,750Raytheon Co Nt 5.500% 11/15/2012 20,000 20,235 20,289Raytheon Co Raytheon Co Bd 5.375% 04/01/2013 240,000 238,451 240,412Regal Cinemas Corp Sr Sub Nt 9.375% 02/01/2012 2,885,000 2,977,595 3,260,050Resdntl Ast Mtg Prods Inc 2003-Rs2 Mtg 1.481% 03/25/2033 5,380,295 5,381,136 5,379,117Resdntl Ast Sec Corp Mtg Pa 2003-ks 1.451% 12/25/2033 8,063,568 8,063,568 8,071,228Resdntl Fdg Mtg Secs II Inc 8.090% 03/25/2020 206,304 221,027 209,490Resolution Performance Prods Llc / Rpp 9.500% 04/15/2010 275,000 270,463 279,125Resorts Inc Sr Sub Nt 8.750% 05/15/2009 1,010,000 947,943 1,065,550Revlon Cnsmr Prods Corp Sr Secd 12.000% 12/01/2005 2,830,000 2,803,392 2,830,000Ryland Group Inc Sr 8.000% 08/15/2006 - - -S C G Hldg Corp / Semiconductor 12.000% 08/01/2009 720,000 763,200 774,000Salton Sea Fdg Corp Sr Secd 7.370% 05/30/2005 916,251 862,560 946,029SBC Communications Inc Sbc Communicatio 5.875% 08/15/2012 300,000 295,428 318,529Sears Cr A/C Master Tr II 2002-5 Tr Ctf 1.543% 11/17/2009 8,550,000 8,550,000 8,556,561Sequa Corp Sr 9.000% 08/01/2009 1,825,000 1,853,000 2,012,063Sequa Corp Sr Nt 8.875% 04/01/2008 1,345,000 1,290,875 1,459,325Sequoia Mtg Tr 2003-5 Mtg Passthru Ctf 1.459% 09/20/2033 1,440,576 1,440,576 1,439,434Sesi L L C Gtd Sr Nt 8.875% 05/15/2011 80,000 75,600 87,200
12

Illinois Municipal Retirement FundInvestment Portfolio as of December 31, 2003
Asset descriptionInterest
RateMaturity
date Par Value Cost Value Market Value
FIXED INCOMEU.S. SecuritiesCorporate Bonds
Shaw Communications Inc Bd 7.200% 12/15/2011 92,000 87,230 99,475Simon Ppty Group L P Simon Ppty Group Lp 6.375% 11/15/2007 6,050,000 6,515,057 6,671,982SLM Corp Medium Term Nts Book Entry 5.625% 08/01/2033 1,725,000 1,604,043 1,636,421SLM Corp Medium Term Nts Book Entry Nt 5.050% 11/14/2014 1,859,000 1,835,818 1,836,748SLM Corp Medium Term Nts Tr 3.625% 03/17/2008 2,930,000 2,935,069 2,917,495Smithfield Foods Inc Sr 8.000% 10/15/2009 76,000 76,000 80,180Solutia Inc In Default 7.375% 10/15/2027 3,325,000 2,050,263 1,130,500Solutia Inc In Default 6.720% 10/15/2037 205,000 183,576 68,675Sonat Inc 6.750% 10/01/2007 250,000 217,500 235,000Sonat Inc Nt 7.625% 07/15/2011 2,150,000 2,014,802 1,991,438Southn Cal Edison CO 7.250% 03/01/2026 200,000 180,500 205,000Southn Cal Edison Co 1st & Ref Mtg 7.125% 07/15/2025 70,000 62,300 71,575Southn Nat Gas CO 7.350% 02/15/2031 2,765,000 2,355,619 2,730,438Southn Nat Gas Co Southn Nat Gas CO 8.000% 03/01/2032 460,000 438,188 474,950Southn Nat Gas Co Sr Nt 8.875% 03/15/2010 410,000 404,744 461,250Sovereign Specialty Chemicals Inc Sr Subnt 11.875% 03/15/2010 1,595,000 1,567,088 1,595,000Spanish Broadcasting Sys Inc Sr Sub Nt 9.625% 11/01/2009 165,000 175,963 176,138Speedway Motorsports Inc Sr Sub Nt 6.750% 06/01/2013 500,000 500,000 516,250Sprint Cap Corp Gtd 6.000% 01/15/2007 5,600,000 5,928,130 5,981,063Sprint Cap Corp Nt 7.900% 03/15/2005 2,770,000 2,992,824 2,950,792Sprint Cap Corp Nt 8.375% 03/15/2012 205,000 202,707 239,399Sprint Cap Corp Nt 8.750% 03/15/2032 2,590,000 2,965,187 3,059,800SPX Corp Sr Nt 6.250% 06/15/2011 46,000 46,000 47,265SPX Corp Sr Nt 7.500% 01/01/2013 1,929,000 1,991,250 2,097,788Sr Hsg Pptys Tr Sr Hsg 8.625% 01/15/2012 1,470,000 1,469,143 1,602,300Starwood Hotels & Resorts Worldwide Inc Sr Nt 7.375% 05/01/2007 1,200,000 1,163,125 1,296,000Starwood Hotels & Resorts Worldwide Inc Sr Nt 7.875% 05/01/2012 720,000 758,475 810,000Std Pac Corp New Sr Sub Nt 9.250% 04/15/2012 415,000 411,680 462,725Stl Dynamics Inc Sr Nt 9.500% 03/15/2009 70,000 72,363 77,700Stone Container Corp 8.375% 07/01/2012 660,000 660,000 716,100Stone Container Corp Sr Nt 9.750% 02/01/2011 2,485,000 2,633,495 2,745,925Stone Energy Corp Sr Sub Nt 8.250% 12/15/2011 2,590,000 2,590,000 2,823,100Stoneridge Inc Sr Nt 11.500% 05/01/2012 35,000 32,463 41,300Structured Ast Mtg Invts Inc 2003-ar 1.520% 10/19/2033 9,816,282 9,816,282 9,811,497Suntrust Bk Atl Ga Mt Sub Bk Nts Be Tr #sb 6.375% 04/01/2011 1,920,000 1,927,066 2,149,521Svc Corp Intl Nt 7.700% 04/15/2009 1,500,000 1,281,857 1,601,250Swift & Co, Sr Nt 10.125% 10/01/2009 1,005,000 939,474 1,065,300Target Corp 4.000% 06/15/2013 1,515,000 1,431,607 1,416,148Target Corp Nt 6.350% 01/15/2011 2,610,000 2,772,029 2,912,421TCI Communications Inc 7.875% 02/15/2026 2,650,000 3,081,355 3,098,274TCI Communications Inc 7.125% 02/15/2028 920,000 913,117 997,731Team Hlth Inc Sr Sub 12.000% 03/15/2009 920,000 966,613 993,600Teco Energy Inc 7.200% 05/01/2011 1,440,000 1,411,531 1,497,600Tenet Healthcare Corp 7.375% 02/01/2013 2,316,000 2,326,115 2,327,580Tenet Healthcare Corp Sr Nt 5.375% 11/15/2006 200,000 193,500 197,000Tenet Healthcare Corp Sr Nt 6.375% 12/01/2011 676,000 655,478 648,960Tenet Healthcare Corp Sr Nt 6.875% 11/15/2031 725,000 645,250 648,875Tenneco Automotive Inc Sr Nt 10.250% 07/15/2013 645,000 639,375 733,688Tenneco Automotive Inc Sr Sub 11.625% 10/15/2009 145,000 152,250 156,600Terex Corp New Sr Sub Nt 10.375% 04/01/2011 51,000 52,785 57,120Terra Cap Inc Sr Secd Nt 12.875% 10/15/2008 1,950,000 1,976,485 2,301,000Texaco Cap Inc 8.625% 06/30/2010 2,500,000 2,956,850 3,144,175Texaco Cap Inc 9.750% 03/15/2020 2,150,000 2,832,367 3,126,229Time Warner Companies 7.570% 02/01/2024 2,485,000 2,730,275 2,810,187Time Warner Companies Inc 9.150% 02/01/2023 750,000 873,780 970,125Time Warner Entmt Co L P 8.375% 03/15/2023 1,410,000 1,565,805 1,747,145Time Warner Entmt Co L P Sr Sub Deb 8.375% 07/15/2033 10,000 11,509 12,698Time Warner Inc Deb 6.625% 05/15/2029 1,490,000 1,348,771 1,531,243Titan Wheel Intl Inc Sr Sub Nt 8.750% 04/01/2007 1,120,000 645,400 862,400
13

Illinois Municipal Retirement FundInvestment Portfolio as of December 31, 2003
Asset descriptionInterest
RateMaturity
date Par Value Cost Value Market Value
FIXED INCOMEU.S. SecuritiesCorporate Bonds
Tn Gas Pipeln CO 7.500% 04/01/2017 1,090,000 1,060,475 1,125,425Tn Gas Pipeln CO 7.000% 10/15/2028 690,000 575,863 655,500Tn Gas Pipeln CO 8.375% 06/15/2032 1,630,000 1,535,606 1,729,838Tn Gas Pipeln Co Deb 7.000% 03/15/2027 660,000 623,700 684,750Tn Gas Pipeln Co Deb 7.625% 04/01/2037 610,000 616,100 600,850Tosco Corp 7.625% 05/15/2006 2,410,000 2,636,323 2,685,246Town Sports Intl Inc Sr Nt 9.625% 04/15/2011 470,000 470,000 502,900Transdigm Inc Sr Sub Nt 8.375% 07/15/2011 350,000 350,000 372,313Trcntntl Gas Pipe Line Corp 7.000% 08/15/2011 1,125,000 890,350 1,198,125Trcntntl Gas Pipe Line Corp Nt 6.125% 01/15/2005 465,000 427,800 472,556Trcntntl Gas Pipe Line Corp Nt 6.250% 01/15/2008 1,235,000 1,009,988 1,272,050Trcntntl Gas Pipe Line Corp Sr Deb 7.250% 12/01/2026 880,000 796,400 902,000Trcntntl Gas Pipe Line Corp Sr Nt 8.875% 07/15/2012 310,000 292,150 366,575Triad Hosps Inc Sr 8.750% 05/01/2009 804,000 872,340 871,335Tricon Global Restaurants Inc 8.500% 04/15/2006 33,000 35,269 36,713TRW Automotive Acqstn Corp 9.375% 02/15/2013 3,090,000 3,157,188 3,530,325TRW Automotive Acqstn Corp 11.000% 02/15/2013 1,320,000 1,342,963 1,554,300TSI Telecommunications Svcs Inc Sr Sub 12.750% 02/01/2009 1,620,000 1,584,101 1,777,950TXU Corp Sr Nt 6.375% 06/15/2006 130,000 137,120 137,475TXU Energy Co Llc Sr Nt 7.000% 03/15/2013 3,455,000 3,541,323 3,821,216Tyco Intl Group S A 6.375% 06/15/2005 815,000 813,009 857,788U S Bancorp 3.125% 03/15/2008 520,000 518,991 512,793U S Bancorp Book Entry 3.950% 08/23/2007 475,000 474,449 488,732U S W Com Inc Deb 6.875% 09/15/2033 590,000 540,231 560,500U S W Communications Inc 5.625% 11/15/2008 455,000 426,113 450,450U S W Communications Inc 7.500% 06/15/2023 140,000 132,650 140,000U S W Communications Inc 7.250% 09/15/2025 655,000 555,800 655,000U S W Communications Inc 8.875% 06/01/2031 280,000 253,450 294,000U S W Communications Inc 7.250% 10/15/2035 345,000 319,625 343,275U S W Communications Inc Deb 7.200% 11/10/2026 400,000 311,063 394,000U S W Communications Inc Nt 7.200% 11/01/2004 625,000 561,417 639,063UBS Pfd Fdg Tr I Gtd Tr Pfd Secs 8.622% 10/29/2049 3,600,000 4,381,761 4,437,432Ucar Fin Inc Gtd Sr Nt 10.250% 02/15/2012 1,530,000 1,290,493 1,759,500Un Pac Corp Deb 7.000% 02/01/2016 370,000 387,343 424,290Un Pac Corp Un Pac Corp 6.650% 01/15/2011 1,020,000 1,037,177 1,137,524Unisys Corp Sr Nt 8.125% 06/01/2006 705,000 681,524 761,400URS Corp New Sr Nt 11.500% 09/15/2009 1,630,000 1,559,494 1,843,938URS Corp New Sr Sub Nt 12.250% 05/01/2009 325,000 313,625 347,344US Awys Pass Thru Trs 6.850% 01/30/2018 228,266 199,404 218,406US Unwired Inc Sr Sub Disc 0.000% 11/01/2009 2,070,000 1,038,667 1,500,750USA Ed Inc Medium Term Nts Book Entry 5.625% 04/10/2007 540,000 577,919 585,176USA Waste Svcs Inc 7.000% 07/15/2028 2,000,000 1,855,180 2,152,660Utd Airls Pass Thru Trs 2001-1 Passthru Ctf 6.201% 03/01/2010 1,700,000 1,700,000 1,485,947Utd Auto Group Inc Sr Sub Nt 9.625% 03/15/2012 1,500,000 1,571,250 1,680,000Utd Components Inc Sr Sub Nt 9.375% 06/15/2013 240,000 240,000 262,200Utd Rentals N Amer Inc Sr Nt 10.750% 04/15/2008 1,890,000 2,039,575 2,126,250Utd Sts Stl Corp Sr Nt 10.750% 08/01/2008 1,455,000 1,367,214 1,702,350Vail Resorts Inc Sr Sub Nt 8.750% 05/15/2009 605,000 567,827 638,275Vanderbilt Mtg & Fin Inc 8.150% 04/07/2026 156,236 159,556 151,390Vanderbilt Mtg & Fin Inc 7.600% 07/07/2028 1,491,000 1,483,545 1,447,904Vanderbilt Mtg & Fin Inc 1997b Mfd Hsg 8.155% 10/07/2026 100,000 101,375 95,768Vanderbilt Mtg & Fin Inc 1997c Mfd Hsg 7.830% 08/07/2027 160,000 161,100 162,256Ventas Rlty Ltd Partnership / Ventas 9.000% 05/01/2012 20,000 20,000 22,200Ventas Rlty Ltd Partnership / Ventas Capcorp Sr 8.750% 05/01/2009 50,000 50,000 54,875Verizon Global Fdg Corp 4.000% 01/15/2008 6,370,000 6,397,017 6,489,756Verizon Global Fdg Corp Global Nt 7.375% 09/01/2012 2,495,000 2,535,349 2,891,101Verizon Global Fdg Corp Nt 4.375% 06/01/2013 800,000 788,424 755,753Verizon Global Fdg Corp Nt 7.750% 12/01/2030 1,600,000 1,690,039 1,879,536Verizon Penn 5.650% 11/15/2011 5,040,000 4,997,844 5,286,103Vertis Inc Sr Nt 9.750% 04/01/2009 840,000 817,715 912,450Viacom Inc 5.625% 08/15/2012 480,000 479,290 510,762
14

Illinois Municipal Retirement FundInvestment Portfolio as of December 31, 2003
Asset descriptionInterest
RateMaturity
date Par Value Cost Value Market Value
FIXED INCOMEU.S. SecuritiesCorporate Bonds
Vintage Pete Inc Sr Nt 8.250% 05/01/2012 2,762,000 2,763,900 3,003,675Vintage Pete Inc Sr Sub Nt 7.875% 05/15/2011 210,000 210,251 221,550Von Hoffmann Corp Sub Exchange Deb 13.500% 05/15/2009 1,957,454 1,185,087 1,781,283Wa Mut Bk Fa Chatsworth Cal Gl # Sr 1.500% 05/14/2004 1,000,000 996,600 1,001,240Wa Mut Inc Sr Nt 5.625% 01/15/2007 2,690,000 2,962,793 2,899,185Wal-Mart Stores Inc 7.550% 02/15/2030 1,325,000 1,633,566 1,630,664Waste Mgmt Inc Del Sr Nt 6.375% 11/15/2012 5,230,000 5,709,043 5,676,841Wells Fargo & Co New Global Nt 5.900% 05/21/2006 2,330,000 2,596,389 2,519,112Wells Fargo & Co New Sub Global Nt 6.375% 08/01/2011 2,000,000 2,005,680 2,229,948Wells Fargo & Co Nt 3.500% 04/04/2008 2,800,000 2,774,520 2,808,938Wells Fargo Bk Na San Fran Cal Sub Nt 7.800% 06/15/2010 2,150,000 2,338,082 2,320,495Westn Res Inc 7.125% 08/01/2009 1,010,000 901,163 1,058,066Westn Wireless Corp Sr Nt 9.250% 07/15/2013 930,000 930,000 981,150Westport Res Corp New Sr Sub Nt 8.250% 11/01/2011 405,000 446,671 445,500Weyerhaeuser CO 6.950% 10/01/2027 1,015,000 1,097,248 1,047,561Weyerhaeuser Co Deb 6.875% 12/15/2033 1,255,000 1,309,714 1,289,738Weyerhaeuser Co Nt 6.750% 03/15/2012 650,000 645,107 709,111Williams Cos Inc 7.125% 09/01/2011 2,795,000 1,694,550 2,955,713Williams Cos Inc 7.750% 06/15/2031 800,000 693,240 827,000Williams Cos Inc Nt 8.125% 03/15/2012 890,000 498,681 987,900Williams Cos Inc Nt 7.625% 07/15/2019 740,000 508,425 774,225Williams Cos Inc Nt 8.750% 03/15/2032 1,420,000 1,435,186 1,604,600Williams Cos Inc Sr Nt 8.625% 06/01/2010 1,391,000 1,396,395 1,561,398Williams Scotsman Inc Sr Secd 10.000% 08/15/2008 1,245,000 1,245,000 1,364,831Worldspan L P 9.625% 06/15/2011 1,505,000 1,441,031 1,550,150Wynn Las Vegas Llc / Wynn Las Vegas Cap 2nd Mtg 12.000% 11/01/2010 1,350,000 1,252,706 1,589,625Xerox Corp Sr Nt 7.125% 06/15/2010 1,110,000 1,110,000 1,187,700Xerox Corp Sr Nt 7.625% 06/15/2013 1,860,000 1,847,856 2,008,800XTO Energy Inc Sr Nt 7.500% 04/15/2012 83,000 83,000 93,790XTO Energy Inc Sr Nt 6.250% 04/15/2013 542,000 554,387 570,455Ziff Davis Media Inc Sr Sub Comp 0.000% 08/12/2009 1,415,131 1,539,627 1,346,143
Total Corporate Bonds 1,355,588,757 1,320,836,102$ 1,390,419,408 Less Estimated Disposition Costs (2,085,629) Total Fair Value 1,388,333,779$
FIXED INCOMEU.S. SecuritiesGovernment & Government Agency Securities
Alameda Corridor Transn Auth Cal Rev 6.600% 10/01/2029 1,725,000 1,720,291 1,883,372Ca St Dept Wtr Res Pwr Sup Re Taxble 3.975% 05/01/2005 2,250,000 2,249,753 2,294,078Fhlb 0.0103 01/14/2004 11345000 11,336,000 11,341,597Fhlb 2.250% 05/15/2006 4,930,000 4,912,449 4,931,528Fhlb 3.625% 11/14/2008 550,000 549,967 553,160Fhlb 3.785% 11/21/2008 11,275,000 11,275,000 11,292,589Fhlb 3.925% 11/28/2008 6,550,000 6,555,240 6,566,375Fhlb 3.830% 11/28/2008 7,125,000 7,125,000 7,138,395Fhlb 4.500% 09/16/2013 2,800,000 2,783,340 2,758,552Fhlb 0.0103 01/09/2004 11000000 10,992,447 10,997,800FHLMC 10.000% 07/01/2005 69,072 72,979 71,926FHLMC 9.500% 11/01/2005 102,441 107,995 105,954FHLMC 9.500% 11/01/2005 26,870 28,573 28,140FHLMC 3.500% 04/01/2008 6,350,000 6,375,959 6,328,156FHLMC 7.000% 03/15/2010 2,450,000 3,058,061 2,858,856FHLMC 4.500% 11/01/2010 6,242,700 6,353,898 6,345,767FHLMC 6.000% 06/15/2011 9,035,000 10,055,724 10,028,850FHLMC 5.125% 08/20/2012 4,280,000 4,301,272 4,281,327FHLMC 4.750% 10/11/2012 3,800,000 3,772,740 3,740,644FHLMC 6.000% 09/01/2013 260,120 258,494 273,204
15

Illinois Municipal Retirement FundInvestment Portfolio as of December 31, 2003
Asset descriptionInterest
RateMaturity
date Par Value Cost Value Market Value
FIXED INCOMEU.S. SecuritiesGovernment & Government Agency Securities
FHLMC 5.000% 09/01/2013 5,073,365 5,187,516 5,191,118FHLMC 6.000% 01/01/2014 325,712 335,890 342,173FHLMC 6.000% 01/01/2018 595,180 613,779 624,558FHLMC 4.000% 05/01/2018 4,407,622 4,194,128 4,311,051FHLMC 6.000% 01/01/2029 198,078 201,173 205,518FHLMC 6.000% 05/01/2029 215,549 218,917 223,246FHLMC 7.000% 10/01/2029 79,452 83,859 84,128FHLMC 6.500% 10/01/2030 44,821 46,515 46,948FHLMC 7.000% 03/01/2031 100,569 106,148 106,407FHLMC 6.000% 10/01/2031 224,103 227,605 231,680FHLMC 7.000% 10/01/2031 54,020 57,016 57,156FHLMC 7.000% 01/01/2032 28,419 29,995 30,402FHLMC 6.000% 01/01/2032 22,522 22,874 23,284FHLMC 6.500% 02/01/2032 26,080 27,067 27,320FHLMC 6.000% 04/01/2032 76,799 77,999 79,396FHLMC 7.000% 05/01/2032 694,026 732,523 734,314FHLMC 7.000% 06/01/2032 582,365 610,846 616,182FHLMC 7.000% 07/01/2032 30,797 32,505 32,585FHLMC 6.500% 07/01/2032 33,433 34,697 35,022FHLMC 7.000% 07/01/2032 41,925 44,251 44,359FHLMC 6.000% 11/01/2032 907,676 921,859 938,365FHLMC 6.000% 12/01/2032 744,631 756,266 769,807FHLMC 6.000% 12/01/2032 4,033,360 4,099,424 4,169,728FHLMC 6.000% 01/01/2033 166,755 169,361 172,393FHLMC 6.000% 01/01/2033 496,005 503,755 512,775FHLMC 6.000% 03/01/2033 4,931,772 5,008,830 5,098,663FHLMC 6.000% 03/01/2033 312,551 317,435 323,128FHLMC 6.000% 03/01/2033 142,052 144,271 146,859FHLMC 6.000% 04/01/2033 409,122 415,515 422,955FHLMC 6.000% 04/01/2033 269,911 274,129 279,045FHLMC 6.000% 04/01/2033 2,119,524 2,155,531 2,191,185FHLMC 5.000% 07/01/2033 7,943,332 7,913,545 7,844,755FHLMC 5.500% 09/01/2033 991,109 980,423 1,003,587FHLMC 5.500% 09/01/2033 5,846,400 5,787,936 5,920,006FHLMC 5.500% 09/01/2033 398,292 394,310 403,307FHLMC 5.500% 09/01/2033 2,599,209 2,565,338 2,631,933FHLMC 6.000% 09/01/2033 6,153,230 6,249,374 5,998,976FHLMC 5.000% 10/01/2033 4,178,553 4,092,370 4,126,697FHLMC 15 Years Gold Single Family 5.500% (15,000,000) (15,459,375) (15,539,100)FHLMC 15 Yr Gold Partn Ctf (pc) 6.000% 01/01/2014 (1,800,000) (1,877,906) (1,885,500)FHLMC 15 Yr Gold Partn Ctf (pc) 5.000% 01/15/2019 37,430,000 37,722,422 38,120,209FHLMC 30 Yr Gold Partn Ctf (pc) 6.000% (2,400,000) (2,452,125) (2,479,512)FHLMC 30 Yr Gold Partn Ctf (pc) 6.500% 7,600,000 7,910,234 7,958,644FHLMC Deb 1.750% 05/15/2005 3,600,000 3,601,692 3,609,000FHLMC Gold 5.500% 03/01/2011 631,684 582,235 658,089FHLMC Gold 5.500% 06/01/2011 225,169 209,917 234,619FHLMC Gold 5.500% 07/01/2011 252,344 235,252 262,892FHLMC Gold 6.000% 01/01/2012 819,114 796,717 860,488FHLMC Gold 7.000% 04/01/2029 755,909 797,839 800,659FHLMC Gold 7.000% 01/01/2030 118,270 124,830 125,231FHLMC Gold 7.500% 05/01/2030 7,999 7,909 8,590FHLMC Gold 7.500% 05/01/2030 1,578 1,560 1,694FHLMC Gold 7.000% 09/01/2030 200,430 211,548 212,069FHLMC Gold 7.000% 01/01/2031 43,015 45,401 45,513FHLMC Gold 6.500% 02/01/2031 818,196 849,134 857,012FHLMC Gold 6.500% 04/01/2031 25,262 26,217 26,461FHLMC Gold 7.000% 06/01/2031 142,057 149,004 150,303FHLMC Gold 7.000% 08/01/2031 399,336 421,487 422,517FHLMC Gold 7.000% 09/01/2031 356,966 374,424 377,695FHLMC Gold 7.000% 10/01/2031 105,387 111,233 111,505FHLMC Gold 7.000% 04/01/2032 529,375 558,739 560,116
16

Illinois Municipal Retirement FundInvestment Portfolio as of December 31, 2003
Asset descriptionInterest
RateMaturity
date Par Value Cost Value Market Value
FIXED INCOMEU.S. SecuritiesGovernment & Government Agency Securities
FHLMC Gold 7.000% 04/01/2032 233,977 241,929 247,564FHLMC Gold 6.000% 11/01/2032 2,376,147 2,413,275 2,456,485FHLMC Gold 6.000% 12/01/2032 413,028 419,482 426,993FHLMC Gold 6.000% 01/01/2033 1,779,885 1,807,694 1,840,063FHLMC Gold C 7.000% 01/01/2030 69,651 73,514 73,751FHLMC Gold C 6.500% 06/01/2031 23,995 24,903 25,134FHLMC Gold C 6.500% 06/01/2031 26,373 27,370 27,624FHLMC Gold C 6.500% 09/01/2031 52,845 54,843 55,352FHLMC Gold C 7.000% 01/01/2032 1,663,405 1,744,756 1,759,965FHLMC Gold C 6.000% 01/01/2032 148,954 151,282 153,990FHLMC Gold C 6.000% 01/01/2032 798,867 811,350 825,877FHLMC Gold C 6.000% 02/01/2032 118,425 120,275 122,429FHLMC Gold C 7.000% 03/01/2032 56,439 59,569 59,716FHLMC Gold C 7.000% 04/01/2032 22,911 24,182 24,241FHLMC Gold C 7.000% 06/01/2032 72,050 76,046 76,234FHLMC Gold C 6.500% 07/01/2032 51,867 53,828 54,331FHLMC Gold C 6.000% 01/01/2033 942,350 957,074 974,211FHLMC Gold C 6.000% 02/01/2033 856,543 869,926 885,528FHLMC Gold E 6.000% 08/01/2013 268,600 256,361 282,110FHLMC Gold E 5.500% 02/01/2017 247,823 252,314 257,047FHLMC Gold E 6.000% 06/01/2017 141,739 143,434 148,735FHLMC Gold E 5.500% 09/01/2017 326,737 335,314 338,898FHLMC Gold E 5.500% 09/01/2017 4,108,776 4,216,632 4,261,705FHLMC Gold E 5.500% 10/01/2017 2,912,690 2,989,148 3,020,255FHLMC Gold E 5.500% 10/01/2017 739,399 758,808 766,919FHLMC Gold E 5.500% 10/01/2017 4,040,830 4,146,902 4,191,230FHLMC Gold E 5.500% 10/01/2017 2,155,014 2,211,583 2,235,223FHLMC Gold E 5.500% 11/01/2017 921,211 945,393 955,498FHLMC Gold Gold Pool 7.000% 10/01/2029 94,981 96,985 100,572FHLMC Gold Group 6.000% 04/01/2014 3,808,520 3,565,727 3,998,489FHLMC Gold Group 6.000% 01/01/2029 11,852 10,959 12,268FHLMC Gold Group 7.500% 01/01/2030 13,377 13,227 14,365FHLMC Gold Group 6.500% 02/01/2030 48,957 50,808 51,280FHLMC Gold Group 7.500% 09/01/2030 2,175 2,158 2,335FHLMC Gold Group 7.500% 09/01/2030 1,690 1,677 1,815FHLMC Gold Pool 6.000% 05/01/2014 3,901,136 3,652,439 4,095,725FHLMC Gold Pool 6.000% 05/01/2014 262,150 245,438 275,226FHLMC Gold Pool 6.000% 12/01/2014 9,049 8,503 9,500FHLMC Gold Pool 7.000% 04/01/2029 331,751 350,153 351,391FHLMC Gold Pool 7.500% 11/01/2029 2,962 2,929 3,182FHLMC Gold Pool 6.500% 01/01/2030 33,650 34,923 35,247FHLMC Gold Pool 7.000% 02/01/2030 91,078 96,130 96,367FHLMC Gold Pool 6.500% 02/01/2030 20,433 21,206 21,414FHLMC Gold Pool 7.500% 05/01/2030 1,470 1,453 1,578FHLMC Gold Pool 7.500% 05/01/2030 1,675 1,656 1,799FHLMC Gold Pool C 7.000% 04/01/2031 5,990 6,083 6,338FHLMC Gold Pool E 6.000% 05/01/2016 484,080 499,207 507,930FHLMC Gold Single Family 5.500% 01/15/2033 10,200,000 10,200,000 10,321,176FHLMC Gold Single Family 5 30 Years 5.000% 01/15/2033 48,930,000 48,079,533 48,287,874FHLMC Group #d 6.500% 02/01/2027 105,319 108,775 110,548FHLMC Group #e 6.000% 04/01/2013 168,029 166,979 176,481FHLMC Mtn 6.250% 07/15/2032 2,100,000 2,517,837 2,283,775FHLMC Multiclass 1.550% 12/15/2031 3,893,189 3,886,497 3,909,896FHLMC Nt 3.625% 09/15/2008 700,000 699,902 704,592FHLMC Nt 6.875% 09/15/2010 16,960,000 19,434,881 19,700,058FHLMC Nt 4.500% 12/16/2010 25,125,000 24,986,813 25,109,423FHLMC Nt 4.625% 05/28/2013 4,700,000 4,704,406 4,608,961FHLMC Preassign 2.875% 11/03/2006 3,840,000 3,839,002 3,841,190FHLMC Preassign 4.375% 02/04/2010 11,035,000 11,071,962 11,028,158FHLMC Preassign 5.125% 11/07/2013 1,810,000 1,798,271 1,803,008FHLMC Prin Pmt On 2.875% 12/15/2006 4,000,000 3,999,800 4,028,676
17

Illinois Municipal Retirement FundInvestment Portfolio as of December 31, 2003
Asset descriptionInterest
RateMaturity
date Par Value Cost Value Market Value
FIXED INCOMEU.S. SecuritiesGovernment & Government Agency Securities
FHLMC Tranche # Tr 4.750% 12/08/2010 20,445,000 20,535,541 20,662,330FNMA 4.250% 07/15/2007 11,200,000 11,640,496 11,697,056FNMA 5.750% 02/15/2008 6,000,000 6,667,680 6,590,640FNMA 6.000% 11/01/2009 8,416,323 8,511,006 8,862,135FNMA 6.000% 12/01/2009 1,393,794 1,395,318 1,467,623FNMA 7.250% 01/15/2010 3,700,000 4,425,718 4,362,522FNMA 7.125% 06/15/2010 19,030,000 22,440,668 22,372,239FNMA 6.625% 11/15/2010 3,775,000 4,421,431 4,337,702FNMA 6.000% 07/01/2011 1,484,522 1,521,635 1,561,776FNMA 8.500% 09/01/2011 1,623,227 1,667,866 1,779,479FNMA 6.000% 10/01/2011 1,733,075 1,763,946 1,822,034FNMA 5.000% 11/01/2012 4,192,674 4,293,561 4,334,177FNMA 6.000% 02/01/2013 603,439 604,099 634,311FNMA 5.000% 06/01/2013 2,550,454 2,605,050 2,633,650FNMA 5.000% 08/01/2013 3,754,006 3,861,347 3,876,462FNMA 5.000% 10/01/2013 2,653,059 2,710,265 2,739,601FNMA 5.500% 02/01/2014 2,356,869 2,294,265 2,453,878FNMA 5.500% 02/01/2014 201,082 184,807 209,146FNMA 5.500% 03/01/2014 345,145 317,210 358,985FNMA 5.500% 05/01/2014 296,400 272,411 308,286FNMA 5.500% 06/01/2014 198,734 182,649 206,704FNMA 5.500% 08/01/2014 280,600 257,889 291,852FNMA 5.500% 08/01/2014 263,992 242,625 274,857FNMA 5.500% 09/01/2014 10,252 10,312 10,674FNMA 7.000% 02/01/2015 130,216 137,948 139,260FNMA 6.000% 03/01/2015 30,645 29,050 32,204FNMA 7.000% 03/01/2015 197,474 193,401 211,131FNMA 7.000% 07/01/2015 566,216 599,835 605,653FNMA 7.000% 12/01/2015 2,875,161 3,045,874 3,075,416FNMA 10.350% 12/10/2015 320,000 508,426 479,999FNMA 6.000% 01/01/2016 4,303,992 4,494,982 4,522,937FNMA 7.000% 03/01/2016 111,133 117,732 118,910FNMA 5.500% 05/01/2016 28,060 28,225 29,114FNMA 6.500% 07/01/2016 407,652 411,330 432,527FNMA 6.500% 08/01/2016 10,458 10,577 11,097FNMA 5.500% 02/01/2017 122,814 122,603 127,403FNMA 6.500% 05/01/2017 40,325 40,073 42,697FNMA 4.000% 10/01/2018 99,585 96,380 97,168FNMA 1.380% 12/26/2021 4,630,426 4,630,426 4,630,565FNMA 7.000% 08/01/2023 12,101 11,910 12,876FNMA 6.000% 11/01/2023 2,476,678 2,267,321 2,576,785FNMA 6.000% 11/01/2023 3,735,324 3,426,576 3,880,927FNMA 7.000% 04/01/2024 189,951 194,166 201,840FNMA 6.500% 09/01/2028 269,606 273,440 282,733FNMA 6.000% 11/01/2028 121,020 112,208 125,376FNMA 6.000% 11/01/2028 78,749 73,015 81,584FNMA 7.000% 01/01/2029 81,235 79,953 86,109FNMA 7.000% 03/01/2029 876,749 876,338 929,363FNMA 7.000% 04/01/2029 140,042 144,244 148,446FNMA 6.500% 06/01/2029 6,957 7,056 7,281FNMA 6.500% 06/01/2029 17,142 17,386 17,939FNMA 7.000% 07/01/2029 214,493 220,928 227,292FNMA 6.500% 07/01/2029 168,320 170,713 176,143FNMA 6.500% 07/01/2029 264,240 249,789 276,522FNMA 6.500% 07/01/2029 10,605 10,755 11,097FNMA 6.500% 07/01/2029 16,096 16,325 16,844FNMA 6.500% 08/01/2029 219,532 222,653 229,735FNMA 6.500% 08/01/2029 15,975 16,202 16,717FNMA 7.000% 08/01/2029 103,097 99,167 109,249FNMA 7.000% 09/01/2029 8,973 9,445 9,508FNMA 6.500% 11/01/2029 25,070 25,427 26,235
18

Illinois Municipal Retirement FundInvestment Portfolio as of December 31, 2003
Asset descriptionInterest
RateMaturity
date Par Value Cost Value Market Value
FIXED INCOMEU.S. SecuritiesGovernment & Government Agency Securities
FNMA 7.000% 11/01/2029 60,155 59,206 63,745FNMA 7.000% 01/01/2030 20,961 20,631 22,212FNMA 7.000% 03/01/2030 99,831 95,884 105,703FNMA 7.500% 06/01/2030 2,446 2,356 2,614FNMA 7.000% 01/01/2031 39,651 41,757 41,983FNMA 7.000% 01/01/2031 1,090,476 1,097,973 1,154,596FNMA 6.500% 01/01/2031 1,927 1,954 2,015FNMA 6.500% 05/01/2031 6,292 6,381 6,580FNMA 7.000% 05/01/2031 599,366 616,364 634,621FNMA 7.000% 08/01/2031 2,165,364 2,226,773 2,292,731FNMA 7.000% 08/01/2031 55,543 57,209 58,809FNMA 7.000% 08/01/2031 8,163 8,408 8,643FNMA 6.000% 09/01/2031 23,770 23,406 24,582FNMA 6.000% 09/01/2031 366,560 360,604 379,071FNMA 6.500% 10/01/2031 1,556,086 1,546,118 1,627,495FNMA 6.500% 10/01/2031 24,493 24,631 25,617FNMA 7.000% 11/01/2031 26,547 27,343 28,108FNMA 7.000% 03/01/2032 385,050 405,506 407,691FNMA 7.000% 05/01/2032 1,571,702 1,662,566 1,664,276FNMA 7.000% 05/01/2032 4,443,445 4,696,860 4,705,164FNMA 6.500% 06/01/2032 1,018,043 1,029,655 1,064,863FNMA 6.500% 06/01/2032 1,142,534 1,154,673 1,195,079FNMA 7.000% 06/01/2032 240,504 247,719 254,669FNMA 7.000% 06/01/2032 1,738,919 1,794,890 1,841,341FNMA 6.500% 07/01/2032 3,698,779 3,740,927 3,868,886FNMA 7.000% 07/01/2032 486,898 512,498 515,527FNMA 6.500% 09/01/2032 6,503,849 6,725,386 6,802,310FNMA 6.000% 11/01/2032 12,737,281 12,704,310 12,754,664FNMA 6.000% 03/01/2033 20,904,223 21,518,285 21,617,266FNMA 6.000% 01/01/2034 12,415,000 12,863,104 12,838,972FNMA 15 Yr Pass-throughs 5.500% 28,610,000 29,479,640 29,638,231FNMA 15 Yr Pass-Throughs 5 15 Years 5.000% 01/15/2018 87,235,000 88,319,518 88,952,559FNMA 15 Yr Pass-Throughs 7 15 Years 7.000% 01/15/2019 1,500,000 1,597,500 1,603,125FNMA 30 Yr Pass-throughs 5.500% 45,045,000 45,166,143 45,622,073FNMA 30 Yr Pass-throughs 6.500% 01/01/2034 106,360,000 110,562,011 111,214,567FNMA 30 Yr Pass-Throughs 6 30 Years 6.000% (6,800,000) (6,947,187) (7,027,392)FNMA 30 Yr Pass-Throughs 7 30 Years 7.000% 01/15/2034 75,530,000 79,703,264 79,967,388FNMA 6 TBA Pool 15yr Jan 6.000% 01/15/2019 16,700,000 17,441,270 17,508,922FNMA Bd 1.750% 06/16/2006 2,925,000 2,914,265 2,880,218FNMA Disc 03/24/2004 3,230,000 3,215,806 3,222,642FNMA FNMA 6.000% 05/15/2011 12,865,000 14,455,282 14,260,081FNMA Nt 5.250% 04/15/2007 4,075,000 4,459,130 4,385,719FNMA Nt 3.750% 09/15/2008 5,300,000 5,306,678 5,296,714FNMA Nt 6.625% 09/15/2009 3,750,000 4,301,171 4,287,900FNMA Nt 6.125% 03/15/2012 100,000 111,973 111,378FNMA Nt 4.375% 07/17/2013 6,280,000 6,167,148 6,011,153FNMA Nt 4.625% 10/15/2013 5,485,000 5,419,483 5,445,964FNMA Preassign 2.000% 01/15/2006 2,880,000 2,877,235 2,879,983FNMA Preassign 4.000% 09/02/2008 1,100,000 1,097,825 1,114,091FNMA Preassign 3.375% 12/15/2008 1,460,000 1,452,218 1,447,678FNMA Preassign 4.000% 12/15/2008 1,620,000 1,619,109 1,616,029FNMA Preassign 6.022% 11/25/2010 5,675,000 6,637,755 6,223,456FNMA Preassign 4.750% 02/21/2013 3,600,000 3,596,940 3,543,768FNMA Single Family Mtg 4.500% 01/15/2018 17,000,000 16,904,375 17,015,946FNMA TBA Pool 6.500% 01/01/2019 900,000 949,547 953,718GNMA 6.000% 08/15/2008 66,127 63,544 69,981GNMA 6.000% 09/15/2008 352,940 339,153 373,509GNMA 6.000% 09/15/2008 225,841 217,019 239,002GNMA 6.000% 10/15/2008 506,515 486,729 536,034GNMA 6.000% 10/15/2008 548,599 527,170 580,572GNMA 6.000% 10/15/2008 466,649 448,420 493,845
19

Illinois Municipal Retirement FundInvestment Portfolio as of December 31, 2003
Asset descriptionInterest
RateMaturity
date Par Value Cost Value Market Value
FIXED INCOMEU.S. SecuritiesGovernment & Government Agency Securities
GNMA 6.000% 10/15/2008 290,310 278,970 307,229GNMA 6.000% 10/15/2008 275,320 264,566 291,366GNMA 6.000% 10/15/2008 253,793 243,880 268,585GNMA 6.000% 11/15/2008 612,638 588,707 648,343GNMA 6.000% 11/15/2008 264,485 254,154 279,900GNMA 6.000% 11/15/2008 363,063 348,881 384,222GNMA 6.000% 11/15/2008 52,973 50,904 56,061GNMA 6.500% 05/15/2028 64,475 66,802 68,084GNMA 6.000% 09/15/2028 483,833 448,226 503,617GNMA 6.000% 10/15/2028 311,030 290,595 323,748GNMA 6.000% 11/15/2028 1,030,225 954,407 1,072,351GNMA 6.000% 11/15/2028 211,249 197,369 219,887GNMA 6.000% 11/15/2028 743,803 747,987 774,217GNMA 6.000% 12/15/2028 175,279 163,763 182,446GNMA 6.000% 12/15/2028 1,108,887 1,026,469 1,154,229GNMA 6.000% 12/15/2028 1,091,438 1,011,115 1,136,067GNMA 6.000% 12/15/2028 342,287 319,798 356,283GNMA 6.500% 01/15/2029 34,481 35,726 36,392GNMA 6.500% 03/15/2029 167,912 162,534 177,216GNMA 6.500% 04/15/2029 378,028 364,325 398,975GNMA 6.500% 05/15/2029 32,872 31,819 34,703GNMA 7.000% 01/15/2030 19,947 21,016 21,270GNMA 7.000% 03/15/2030 4,103 4,323 4,375GNMA 7.500% 12/15/2030 827,353 845,710 887,990GNMA 6.500% 02/15/2031 3,768,407 3,748,387 3,975,067GNMA 6.500% 04/15/2031 6,926 7,176 7,305GNMA 6.500% 05/15/2031 6,536 6,772 6,895GNMA 7.000% 05/15/2031 161,391 170,822 172,057GNMA 6.500% 05/15/2031 5,332,565 5,372,560 5,626,502GNMA 6.500% 06/15/2031 866,089 897,350 913,586GNMA 6.500% 08/15/2031 6,792 7,037 7,164GNMA 7.000% 09/15/2031 601,593 633,835 641,509GNMA 6.500% 10/15/2031 2,535,815 2,567,909 2,674,879GNMA 6.500% 10/15/2031 556,145 576,218 586,822GNMA 6.000% 10/15/2031 1,998,855 1,962,800 2,078,889GNMA 6.500% 11/15/2031 2,297,586 2,323,434 2,423,585GNMA 6.000% 12/15/2031 800,755 790,870 832,777GNMA 6.000% 03/15/2032 183,299 189,371 190,697GNMA 6.500% 03/15/2032 1,993,805 1,986,017 2,102,049GNMA 6.000% 03/15/2032 5,480,806 5,407,158 5,702,011GNMA 6.500% 03/15/2032 2,877,522 3,026,344 3,033,743GNMA 7.500% 03/15/2032 353,761 371,781 379,586GNMA 6.500% 05/15/2032 2,777,860 2,816,490 2,928,670GNMA 6.000% 05/15/2032 545,635 539,156 567,657GNMA 7.500% 05/15/2032 729,799 766,061 783,075GNMA 6.500% 05/15/2032 659,975 667,916 695,805GNMA 6.500% 06/15/2032 449,292 465,509 473,684GNMA 7.000% 06/15/2032 4,448,463 4,728,578 4,740,683GNMA 7.000% 07/15/2032 1,969,099 2,095,860 2,098,449GNMA 6.500% 09/15/2032 595,902 617,411 628,254GNMA 6.500% 09/15/2032 824,112 853,857 869,471GNMA 6.500% 10/15/2032 813,600 842,967 857,771GNMA 6.000% 10/15/2032 191,117 197,508 198,831GNMA 6.500% 11/15/2032 436,033 451,771 459,980GNMA 6.500% 11/15/2032 730,974 757,358 771,207GNMA 6.500% 12/15/2032 435,072 450,775 458,692GNMA 7.000% 01/15/2033 5,438,736 5,755,712 5,798,671GNMA 6.500% 04/15/2033 358,856 371,808 378,345GNMA 5.500% 06/15/2033 6,974,980 6,911,769 7,098,367GNMA 5.500% 07/15/2033 398,767 395,153 405,821GNMA 6.500% 09/15/2033 303,366 314,315 319,841
20

Illinois Municipal Retirement FundInvestment Portfolio as of December 31, 2003
Asset descriptionInterest
RateMaturity
date Par Value Cost Value Market Value
FIXED INCOMEU.S. SecuritiesGovernment & Government Agency Securities
GNMA I 30 Yr Single Family Pass-Throughs(sf) 6 30 Years Settles Jan6.000% 01/01/2034 43,000,000 44,497,888 44,679,669GNMA I Single Family Mtg 5 30 Years 5.000% 01/15/2034 31,100,000 30,674,625 30,808,438GNMA Remic 2001-47 Cl Fa Fltg 1.500% 09/16/2031 4,026,142 4,037,465 4,036,983GNMA TBA Arm 5.500% 01/15/2034 12,500,000 12,574,219 12,707,025GNMA TBA Pool 6.500% 01/15/2029 55,760,000 58,581,456 58,757,100Il St Taxable-pension 5.100% 06/01/2033 12,450,000 12,369,393 11,387,766AID - Israel Note 5.500% 09/18/2023 6,700,000 6,778,324 6,778,457Resolution Fdg Corp Cpn Strips 0.000% 07/15/2018 1,725,000 635,318 783,236Resolution Fdg Corp Fed Book Entry Cpn Sgeneric Int Pmt 0.000% 10/15/2018 1,725,000 625,037 769,298SLM Stud Ln Tr 2001-4 Ln Bkd Nt 1.220% 01/25/2011 5,106,093 5,107,090 5,107,539SLM Stud Ln Tr 2003-3 Ln Bkd Ctf 1.190% 06/15/2010 9,585,790 9,585,790 9,585,790Tob Settlement Auth Ia Tob Settlem 5.300% 06/01/2025 335,000 259,973 289,128Tob Settlement Auth Ia Tob Settlement 5.600% 06/01/2035 935,000 711,180 782,586Tob Settlement Fing Corp N J 6.375% 06/01/2032 150,000 127,484 143,612Tob Settlement Fing Corp N J 6.250% 06/01/2043 750,000 598,861 686,798Tob Settlement Fing Corp N J Ast Bkd 6.000% 06/01/2037 115,000 90,398 102,635Tob Settlement Fing Corp Rhode Is Ast 6.125% 06/01/2032 495,000 408,825 451,910US Treas Bd Stripped Prin Pmt 0.000% 05/15/2018 6,350,000 2,356,358 3,027,807US Treas Bd Stripped Prin Pmt 0.000% 11/15/2018 6,350,000 2,285,175 2,929,509US Treas Bd Stripped Prin Pmt 0.000% 08/15/2022 5,360,000 1,843,894 1,951,469US Treas Bd Stripped Prin Pmt 0.000% 11/15/2022 12,915,000 5,096,253 4,630,157US Treas Bd Stripped Prin Pmt 0.000% 08/15/2027 610,000 145,308 166,231US Treas Bd Stripped Prin Pmt Strip Prinpmt 0.000% 11/15/2021 15,820,000 5,635,293 6,030,283US Treas Bds 10.375% 11/15/2012 16,770,000 21,837,264 21,397,514US Treas Bds 12.000% 08/15/2013 24,420,000 34,059,070 33,737,695US Treas Bds 9.250% 02/15/2016 6,625,000 9,565,445 9,508,929US Treas Bds 8.125% 08/15/2019 31,495,000 39,841,081 42,547,855US Treas Bds 8.500% 02/15/2020 21,625,000 28,991,111 30,200,610US Treas Bds 8.000% 11/15/2021 19,170,000 25,560,324 25,890,896US Treas Bds 6.250% 08/15/2023 20,775,000 22,625,543 23,678,180US Treas Bds 6.000% 02/15/2026 25,565,000 30,068,370 28,353,119US Treas Bds 6.750% 08/15/2026 6,000,000 7,088,440 7,261,860US Treas Bds 6.125% 11/15/2027 13,110,000 15,092,555 14,780,502US Treas Bds 5.375% 02/15/2031 71,173,000 74,039,765 74,221,492US Treas Bds Bd 5.250% 11/15/2028 2,000,000 2,022,114 2,014,454US Treas Bds Inflation Index Linked 4.361% 04/15/2029 30,120,000 39,876,356 43,859,213US Treas Bills - 06/17/2004 57,900,000 57,621,919 57,642,171US Treas Bills 01-22-2004 Preassign - 01/22/2004 1,016,000 1,013,532 1,015,492US Treas Infl Indexed Bonds 1.889% 07/15/2013 5,770,000 5,707,651 5,768,587US Treas Infl Indexed Bonds 3.572% 04/15/2032 530,000 537,159 681,886US Treas Nts 1.625% 01/31/2005 5,395,000 5,405,116 5,415,231US Treas Nts 1.625% 04/30/2005 16,180,000 16,162,105 16,228,669US Treas Nts 2.000% 08/31/2005 19,320,000 19,337,194 19,446,739US Treas Nts 1.625% 10/31/2005 93,030,000 92,764,835 92,884,873US Treas Nts 1.875% 11/30/2005 1,900,000 1,892,875 1,903,572US Treas Nts 2.375% 08/15/2006 16,130,000 16,259,437 16,215,650US Treas Nts 3.250% 08/15/2007 1,890,000 1,917,169 1,927,800US Treas Nts 3.000% 11/15/2007 710,000 708,636 716,102US Treas Nts 3.000% 02/15/2008 40,850,000 40,639,056 41,039,871US Treas Nts 2.625% 05/15/2008 21,246,000 21,435,450 20,927,310US Treas Nts 3.250% 08/15/2008 3,000,000 2,972,109 3,018,750US Treas Nts 3.125% 09/15/2008 790,000 784,539 789,537US Treas Nts 3.125% 10/15/2008 22,140,000 22,052,456 22,098,370US Treas Nts 3.375% 11/15/2008 1,280,000 1,276,787 1,290,150US Treas Nts 3.375% 12/15/2008 29,925,000 30,203,433 30,130,884US Treas Nts 5.500% 05/15/2009 7,200,000 7,549,803 8,007,768US Treas Nts 4.673% 01/15/2010 1,900,000 2,411,238 2,429,112US Treas Nts 5.000% 08/15/2011 12,620,000 13,790,450 13,507,312US Treas Nts 4.375% 08/15/2012 16,510,000 16,972,808 16,837,624US Treas Nts 4.000% 11/15/2012 10,930,000 10,877,567 10,824,088US Treas Nts 4.250% 08/15/2013 5,850,000 5,843,594 5,857,313
21

Illinois Municipal Retirement FundInvestment Portfolio as of December 31, 2003
Asset descriptionInterest
RateMaturity
date Par Value Cost Value Market Value
FIXED INCOMEU.S. SecuritiesGovernment & Government Agency Securities
US Treas Nts 4.250% 11/15/2013 15,337,000 15,331,241 15,321,718US Treas Nts Bd 1.625% 09/30/2005 10,000,000 9,996,875 9,996,900US Treas Nts Bd 2.625% 11/15/2006 4,910,000 4,911,728 4,953,236US Treas Nts Inflation-Indexed Nt 3.720% 01/15/2011 5,000,000 5,405,862 5,976,771US Treas Nts Nt 1.250% 05/31/2005 52,260,000 51,940,952 52,121,197US Treas Sec Stripped Int Pmt 0.000% 05/15/2020 6,450,000 2,491,700 2,691,521US Treas Sec Stripped Int Pmt 0.000% 08/15/2020 6,450,000 2,529,884 2,643,017Wi St Gen Fd Annual Appr 5.700% 05/01/2026 1,225,000 1,221,215 1,235,327Wi St Gen Rev Txb 4.800% 05/01/2013 3,020,000 3,009,672 3,017,554Total Government and Government Agency Securities 2,067,675,047 2,122,232,189$ 2,141,785,508 Less Estimated Disposition Costs (3,212,678) Total Fair Value 2,138,572,830$
U.S. SecuritiesFixed Income Funds
NTI Lehman Aggregate Bond Index 0.004% 5,532,958 1,925,918,771 1,684,404,016
Less Estimated Disposition Costs (2,526,606) Total Fair Value 1,681,877,410$
International SecuritiesAustralia
CMO Liberty Fdg Pty Ltd 1.571% 12/10/2034 5,800,000 5,800,000 5,869,716CMO Medallion Tr 2003-1g Mtg Backed Fltgrate Nt 1.360% 12/21/2033 10,774,144 10,774,144 10,774,144CMO Puma Global Tr No 2 Mtg Backed 1.330% 03/25/2034 9,906,498 9,906,498 9,974,605CMO Smhl Global Fd No 5 Nt 1.390% 05/09/2030 6,600,000 6,600,000 6,600,000Pvtpl Burns Philp Cap Pty Ltd / Burns 9.500% 11/15/2010 440,000 440,000 477,400Pvtpl Burns Philp Cap Pty Ltd / Burns 10.750% 02/15/2011 1,665,000 1,600,499 1,814,850Rio Tinto Fin USA Ltd Nt 2.625% 09/30/2008 2,690,000 2,689,408 2,565,972
Bahamas
Sun Intl Hotels Ltd / Sun Intl North 8.875% 08/15/2011 2,115,000 2,179,473 2,310,638
Belgium
Pvtpl Telenet Group Hldg Nv Sr Disc 0.000% 06/15/2014 1,180,000 676,116 743,400Pvtpl Telenet Group Hldg Nv Sr Disc 11.500% 06/15/2014 2,000,000 1,194,108 1,260,000Telenet Communications Nv Crpbd 9.000% 12/15/2013 570,000 702,953 747,728
Bermuda
Montpelier Re Hldgs Ltd Sr Nt 6.125% 08/15/2013 2,010,000 2,000,292 2,045,999Pvtpl Ship Fin Intl Ltd Sr 8.500% 12/15/2013 1,480,000 1,480,000 1,465,200Sea Containers Ltd 7.875% 02/15/2008 2,025,000 1,290,455 1,994,625
Brazil
Brazil(fed Rep Of) Do Not Use See 8.000% 04/15/2014 1,755,000 1,871,445 2,124,169Brazil Federative Rep 11.000% 08/17/2040 1,445,000 1,115,164 1,589,500Brazil Federative Rep Global Bd 11.500% 03/12/2008 1,000,000 1,067,977 1,160,000Brazil Federative Rep Global Bd 12.000% 04/15/2010 960,000 890,074 1,152,000
22

Illinois Municipal Retirement FundInvestment Portfolio as of December 31, 2003
Asset descriptionInterest
RateMaturity
date Par Value Cost Value Market Value
FIXED INCOMEInternational SecuritiesBrazil
Brazil Federative Rep Sovereign 14.500% 10/15/2009 440,000 472,471 575,300Brazil(fed Rep Of) 12.250% 03/06/2030 800,000 851,900 994,000Brazil(fed Rep Of) Frn 2.063% 04/15/2009 550,000 252,995 336,782Brazil(fed Rep Of) Frn 2.063% 04/15/2012 610,000 436,658 546,438Brazil(fed Rep Of) Var% Bds 8.000% 04/15/2014 250,000 249,168 299,387Fed Rep of Brazil Soverign 2.188% 04/15/2012 1,130,000 819,188 1,022,650
Bulgaria
Bulgaria Rep 8.250% 01/15/2015 1,218,000 1,173,571 1,428,105Bulgaria(nat Rep) 8.250% 01/15/2015 1,585,000 1,796,213 1,878,225Bulgaria(nat Rep) Fxd-frn 1.938% 07/28/2012 725,000 547,976 613,661
Canada
360networks Inc Sr Nt 13.000% 05/01/2008 2,225,000 2,096,931 223Abitibi-Consolidated Inc Deb 8.550% 08/01/2010 38,000 41,082 42,317Abitibi-Consolidated Inc Deb 8.500% 08/01/2029 15,000 15,701 15,639Alcan Inc Nt 6.125% 12/15/2033 900,000 920,070 905,481Algoma Stl Inc Secd 11.000% 12/31/2009 1,878,000 4,109 1,840,440Anderson Expl Ltd Nt 6.750% 03/15/2011 240,000 264,794 266,158Baytex Energy Ltd Sr Sub Nt 9.625% 07/15/2010 450,000 294,092 474,750Call-Net Enterprises Inc Cb D 10.625% 12/31/2008 1,303,779 1,919,560 1,298,890Calpine Cda Energy Fin Ulc Gtd Sr Nt 8.500% 05/01/2008 2,085,000 1,901,491 1,662,788Canwest Media Inc Sr Nt 7.625% 04/15/2013 375,000 375,000 410,625Cascades Inc Sr Nt 7.250% 02/15/2013 411,000 424,095 433,605Cdn Natl Ry Co Nt 6.900% 07/15/2028 730,000 722,386 815,614Cdn Pac Ry Co New Nt 6.250% 10/15/2011 1,075,000 1,071,818 1,181,425Conoco Fdg Co Nt 6.350% 10/15/2011 1,770,000 1,871,181 1,984,452Corus Entmt Inc Sr Sub Nt 8.750% 03/01/2012 1,530,000 1,561,869 1,683,000Doman Inds Ltd Sr Secd 12.000% 07/01/2004 1,820,000 1,598,300 1,911,000Hydro Que 7.500% 04/01/2016 590,000 663,862 727,215Hydro-Quebec Que Hydro 6.300% 05/11/2011 860,000 894,644 969,914Livent Inc Sr Nt 9.375% 10/15/2004 2,090,000 2,149,875 418,000Luscar Coal Ltd Sr Nt 9.750% 10/15/2011 920,000 955,750 1,041,900Norske Skog Cda Ltd Sr 8.625% 06/15/2011 180,000 179,156 189,000Nortel Networks Ltd Formerly Nortel 6.125% 02/15/2006 885,000 698,209 896,063Pvtpl Gerdau Ameristeel Corp / Gusap 10.375% 07/15/2011 745,000 767,100 823,225Pvtpl Hollinger Inc 144a 11.875% 03/01/2011 1,085,000 1,117,678 1,178,581Pvtpl Imax Corp Sr 9.625% 12/01/2010 1,030,000 1,030,000 1,082,788Pvtpl Millar Westn Fst Prods Ltd Sr 7.750% 11/15/2013 210,000 210,000 217,875Pvtpl Videotron Ltee Sr 6.875% 01/15/2014 310,000 307,150 320,075Que Prov Cda Deb 7.500% 07/15/2023 1,945,000 2,452,325 2,385,154Que Prov Cda Medium Term Nts Book Entry Mtn 7.380% 04/09/2026 875,000 1,136,179 1,044,995Quebecor Media Inc Sr Disc 0.000% 07/15/2011 1,920,000 984,230 1,692,000Rogers Cablesystem Ltd 11 Bd 11.000% 12/01/2015 1,475,000 1,622,500 1,703,625Rogers Wireless Inc Sr Secd Nt 9.625% 05/01/2011 1,555,000 1,436,446 1,858,225Shaw Communications Inc Sr Nt 8.250% 04/11/2010 66,000 66,887 74,745Shaw Communications Inc Sr Nt 7.250% 04/06/2011 80,000 84,000 86,500Suncor Energy Inc 5.950% 12/01/2034 740,000 735,641 734,568Tembec Inds Inc Gtd Sr Nt 8.625% 06/30/2009 325,000 305,500 334,750Tembec Inds Inc Sr Nt 7.750% 03/15/2012 505,000 456,163 502,475Westn Oil Sands Inc Sr Secd Nt 8.375% 05/01/2012 180,000 185,500 204,975
23

Illinois Municipal Retirement FundInvestment Portfolio as of December 31, 2003
Asset descriptionInterest
RateMaturity
date Par Value Cost Value Market Value
FIXED INCOMEInternational SecuritiesCayman Islands
Bsch Issuances Ltd 7.625% 11/03/2009 2,476,000 3,078,021 2,911,182Hutchison Whamp 6.500% 02/13/2013 350,000 360,157 363,878NII Hldgs Inc Rts NII Holdings Step Up 0.000% 11/01/2009 1,137,840 680,167 1,160,597Pdvsa Fin Ltd Pdvsa Fin Ltd 8.500% 11/16/2012 990,000 948,075 960,300Pvtpl Csn Is Viii Corp Gtd 9.750% 12/15/2013 1,535,000 1,535,000 1,573,375Pvtpl Pac Lifecorp Sr 6.600% 09/15/2033 740,000 739,312 781,507Pvtpl Redwood Cap II Ltd Prin At Risk Ntgrls Var Rt 144a 3c4.160% 01/01/2004 300,000 300,000 300,000Seagate Tech Hdd Hldgs Sr 8.000% 05/15/2009 690,000 690,000 743,475Vestel Electronics 11.500% 05/14/2007 300,000 331,500 341,646
Chile
Celulosa Arauco Y Constitucion 5.125% 07/09/2013 2,640,000 2,544,981 2,582,712Chile Rep Bd 5.500% 01/15/2013 570,000 564,819 586,245Pvtpl Corporacion Nacional Del Cobre De Chile Codelco Inc 6.375% 11/30/2012 275,000 273,779 297,506
Colombia
Colombia Rep 10.500% 07/09/2010 590,000 619,702 661,390Colombia Rep Global Bd 11.750% 02/25/2020 835,000 870,116 1,006,175Colombia Rep Nt 10.000% 01/23/2012 750,000 781,637 821,250Pvtpl Bavaria 8.875% 11/01/2010 350,000 344,050 358,750
Croatia
Croatia(rep Of) Frn 2.000% 07/31/2006 750,000 308,885 308,797
France
Crown European Hldgs SA 9.500% 03/01/2011 2,870,000 2,895,213 3,250,275Crown European Hldgs SA 10.875% 03/01/2013 1,815,000 1,887,275 2,134,894Fimep SA 10.500% 02/15/2013 1,810,000 1,813,575 2,135,800Pvtpl Vivendi Unvl S A 9.250% 04/15/2010 4,040,000 4,228,269 4,787,400Vivendi Unvl S A 6.250% 07/15/2008 715,000 715,000 757,006
Germany
Germany(fed Rep) 3.750% 01/04/2009 2,505,000 2,808,948 3,189,225Germany(fed Rep) 5.500% 01/04/2031 9,050,000 10,252,884 12,369,529Germany(fed Rep) 5% Bds 5.000% 01/04/2012 9,100,000 10,511,197 12,176,164
Ireland
Depfa Acs Bk Ast Covered Secs 144a 3.625% 10/29/2008 5,400,000 5,419,564 5,406,481Eircom Fdg 8.250% 08/15/2013 260,000 263,250 287,950
Italy
Pvtpl Telecom Italia Cap Gtd Sr Global 5.250% 11/15/2013 3,585,000 3,575,524 3,592,138Sumitomo Mitsui Bk Corp Sub 8.000% 06/15/2012 620,000 619,436 740,556
24

Illinois Municipal Retirement FundInvestment Portfolio as of December 31, 2003
Asset descriptionInterest
RateMaturity
date Par Value Cost Value Market Value
FIXED INCOMEInternational SecuritiesJersey, Channel Islands
Pvtpl Hsbc Cap Fdg Dlr 2 L P Perp Pfd 4.610% 12/29/2049 600,000 600,000 564,690
Luxembourg
Dunlop Std Aerospace Hldgs Plc Sr Nt 11.875% 05/15/2009 185,000 195,860 197,950Mobile Telesys Fin 9.750% 01/30/2008 350,000 384,055 378,988Pvtpl Millicom Intl Cellular 10.000% 12/01/2013 2,060,000 2,060,000 2,173,300Tyco Intl Group 5.875% 11/01/2004 50,000 43,000 51,375Tyco Intl Group 6.375% 02/15/2006 4,570,000 4,341,371 4,867,050Tyco Intl Group 5.800% 08/01/2006 770,000 657,700 814,275Tyco Intl Group 6.125% 11/01/2008 140,000 109,600 149,800Tyco Intl Group 6.125% 01/15/2009 1,220,000 1,094,550 1,305,400Tyco Intl Group 6.750% 02/15/2011 1,180,000 1,046,308 1,289,150Tyco Intl Group 6.375% 10/15/2011 1,245,000 1,033,409 1,330,594Tyco Intl Group 6.875% 01/15/2029 5,209,000 4,410,148 5,339,225Tyco Intl Group S A 7.000% 06/15/2028 1,711,000 1,403,640 1,777,301
Malaysia
Petronas Capital 7.875% 05/22/2022 300,000 342,819 355,119Pvtpl Petronas Cap Ltd Euro Gtd 7.875% 05/22/2022 430,000 427,988 509,531
Marshall Islands
Gen Maritime Corp Sr 10.000% 03/15/2013 1,160,000 1,142,171 1,309,350Pvtpl Sr 7.625% 12/01/2013 360,000 360,000 363,150Teekay Shipping Corp Sr Nt 8.875% 07/15/2011 2,353,000 2,455,001 2,670,655
Mexico
Jafra Cosmetics Intl Inc 10.750% 05/15/2011 1,065,000 1,065,000 1,168,838Mexico(utd Mex St) 8.375% 01/14/2011 650,000 767,550 767,348Mexico(utd Mex St) 8.125% 12/30/2019 650,000 747,281 726,700Mexico-United Mexican Sts 11.500% 05/15/2026 4,775,000 6,281,331 6,911,813Mexico-United Mexican Sts Global Bd 8.125% 12/30/2019 1,135,000 1,262,688 1,268,363Pemex Proj Fdg Master Tr Nt 8.500% 02/15/2008 300,000 324,876 341,782Pvtpl Innova S De R L 9.375% 09/19/2013 1,115,000 1,117,275 1,144,269Telefonos De Mex S A 4.500% 11/19/2008 1,790,000 1,786,116 1,792,721TFM 10.250% 06/15/2007 2,400,000 2,160,000 2,508,000TFM 11.750% 06/15/2009 3,435,000 2,660,993 3,529,463Transportacion Maritima Mexicana 10.250% 12/31/2040 1,040,000 803,125 1,060,800Utd Mexican Sts Medium Term Nts Book 4.625% 10/08/2008 1,250,000 1,242,525 1,265,625Utd Mexican Sts Medium Term Nts Book 8.375% 01/14/2011 5,215,000 5,540,217 6,192,813Utd Mexican Sts Medium Term Nts Book 6.375% 01/16/2013 2,770,000 2,804,492 2,873,875Utd Mexican Sts Medium Term Nts Book 5.875% 01/15/2014 1,580,000 1,557,643 1,560,250Utd Mexican Sts Medium Term Nts Book 8.000% 09/24/2022 3,725,000 3,659,058 4,075,150Utd Mexican Sts Medium Term Nts Book 8.300% 08/15/2031 425,000 432,368 479,188
Multi-National Agencies Region
African Dev Bk African Dev Bk 3.250% 08/01/2008 3,155,000 3,152,097 3,125,185Intl Fin Corp Medium Term Nts Beomorgan Gty Tranche # Tr7.125% 04/06/2005 1,600,000 1,636,720 1,709,248
25

Illinois Municipal Retirement FundInvestment Portfolio as of December 31, 2003
Asset descriptionInterest
RateMaturity
date Par Value Cost Value Market Value
FIXED INCOMEInternational SecuritiesNetherlands
Deutsche Telekom Intl Fin B V 9.250% 06/01/2032 2,240,000 2,891,821 3,073,591Deutsche Telekom Intl Fin B V Gtd Nt 8.500% 06/15/2010 445,000 500,297 538,058Deutsche Telekom Intl Fin B V Gtd Nt 8.750% 06/15/2030 1,865,000 2,209,526 2,382,407Deutsche Telekom Intl Fin B V Nt 5.250% 07/22/2013 1,245,000 1,236,669 1,257,723Dutch Govt 4.250% 07/15/2013 5,700,000 7,055,759 7,189,695Mobifon Hldgs B V Sr Nt 12.500% 07/31/2010 1,880,000 1,872,648 2,171,400Parmalat Finance C 6.250% 02/07/2005 210,000 53,374 50,328Royal Kpn Nv 8.000% 10/01/2010 2,420,000 2,917,877 2,894,966Diageo Fin 3.000% 12/15/2006 1,300,000 1,299,597 1,306,799
Norway
Pete Geo-Svcs Asa New Sr 8.000% 11/05/2006 354,525 245,837 358,070Pete Geo-Svcs Asa New Sr 10.000% 11/05/2010 1,057,839 767,853 1,131,888
Panama
Panama Rep 9.625% 02/08/2011 950,000 1,068,388 1,086,373Panama Rep 10.750% 05/15/2020 520,000 570,148 624,000Panama Rep Global Bd 9.375% 07/23/2012 280,000 274,403 319,200Panama Rep Global Bds 9.625% 02/08/2011 840,000 941,209 970,200Pvtpl Mcdermott J Ray 11.000% 12/15/2013 1,065,000 1,033,732 1,118,250
Peru
Peru Rep 9.875% 02/06/2015 140,000 163,100 162,400Peru Rep Global Bd 8.750% 11/21/2033 330,000 326,728 330,000Peru Rep Gtd Blobal Bd 9.125% 02/21/2012 820,000 919,449 914,300Peru(rep Of) Step-Up Nts 4.500% 03/07/2017 525,000 434,670 465,938Peru(rep Of) Var Rte 5.000% 03/07/2017 1,730,000 1,246,850 1,508,302
Philippines
Philippines Rep 9.875% 01/15/2019 820,000 793,629 867,150Philippines Rep Global Bd 10.625% 03/16/2025 45,000 48,255 50,063
Romania
Romania(rep Of) 10.625% 06/27/2008 525,000 537,874 815,808
Russia
Russian Federation 8.250% 03/31/2010 200,000 208,314 223,750Russia(govt Of) 11% Bds 11.000% 07/24/2018 200,000 274,000 271,500Russia(govt Of) 3% Bds 3.000% 05/14/2006 380,000 301,684 373,654Russian Federation Stp-Up Bonds 5.000% 03/31/2030 2,320,000 1,800,523 2,224,300Russian Fedn 5.000% 03/31/2030 1,380,000 494,916 1,328,250Tyumen Oil 11% Bds 11.000% 11/06/2007 350,000 402,500 402,747
South Africa
S Africa Rep Rep of S Africa 7.375% 04/25/2012 825,000 883,229 926,063
26

Illinois Municipal Retirement FundInvestment Portfolio as of December 31, 2003
Asset descriptionInterest
RateMaturity
date Par Value Cost Value Market Value
FIXED INCOMEInternational SecuritiesSweden
Ab Spintab Swedmor 5.750% 06/15/2005 9,000,000 886,853 1,294,170Statens Bostadsfin 5.500% 03/15/2006 3,600,000 350,956 520,074Swedish Expt Cr Corp-Ab Svensk -medium 2.875% 01/26/2007 2,275,000 2,267,857 2,286,239
Ukraine
Ukraine(rep Of) 11% Bds 11.000% 03/15/2007 1,275,000 948,386 927,763
United Kingdom
Avecia Group Plc Sr 11.000% 07/01/2009 1,900,000 1,611,500 1,710,000Brit Telecommunications P L C Nt 8.875% 12/15/2030 3,550,000 4,412,839 4,641,989Brit Telecommunications P L C Variable 8.375% 12/15/2010 1,310,000 1,441,707 1,594,108CMO Granite Mtgs 03-1 Plc 1.310% 01/20/2020 235,000 235,477 235,139CMO Granite Mtgs 03-2 Plc 1.280% 01/01/2020 18,600,000 18,600,000 18,602,156Colt Telecom Group Plc Euro Sr 2.000% 03/29/2006 560,000 284,201 773,460Danka Business Sys Plc Sr 11.000% 06/15/2010 790,000 771,514 784,075Hsbc Hldgs Plc Sub 5.250% 12/12/2012 975,000 1,055,984 998,459Marconi Corporation Plc 8.000% 04/30/2008 333,538 471,399 316,861Marconi Corporation Plc 8.000% 04/30/2008 500,000 480,000 508,977Marconi Corporation Plc 10.000% 10/31/2008 118,675 162,734 129,949Medallion Tr Mtg Bkd 1.370% 12/18/2031 5,528,734 5,528,734 5,528,679Pvtpl Barclays Bk Plc 144a Var Rate 8.550% 09/29/2049 4,675,000 5,521,373 5,743,658Telewest Communications New Plc Sr Disc 9.250% 04/15/2009 2,085,000 359,963 1,084,200Telewest Communications New Plc Sr Nt 11.250% 11/01/2008 515,000 195,489 330,888Telewest Communications New Plc Sr Nt 9.875% 02/01/2010 600,000 296,652 369,000Telewest Communications Plc New Disc 11.375% 02/01/2010 780,000 120,115 382,200Telewest Plc Sr Disc 11.000% 10/01/2007 2,787,000 863,963 1,762,778Vodafone Airtouch Plc Nt 7.750% 02/15/2010 2,200,000 2,755,544 2,607,440Vodafone Group Plc New 5.000% 12/16/2013 5,855,000 5,773,303 5,830,819Xl Cap Fin Europe Plc Xl Cap Fin Glbl 6.500% 01/15/2012 2,785,000 3,036,965 3,048,305
Total International Securities 321,952,572 305,677,698$ 329,660,645 Less Estimated Disposition Costs (494,491)Total Fair Value 329,166,154$
Total Fixed Income 5,674,664,760$ 5,537,950,173$
27

Illinois Municipal Retirement FundInvestment Portfolio as of December 31, 2003
Asset description Shares Cost Value Market Value
EQUITIESU.S. SecuritiesCommon Stock
1st Hlth Group Corp 100,250 2,529,648 1,950,8651st Horizon Pharmaceutical Corp 235,950 2,422,915 2,642,6401st Indl Rlty Tr Inc 50,000 1,353,000 1,687,5001st Tenn Natl Corp 30,000 1,168,197 1,323,0003M CO 153,400 8,810,531 13,043,6025th 3rd Bancorp 87,500 4,879,670 5,171,25099 Cents Only Stores 109,333 2,102,554 2,977,138Aaipharma Inc 54,800 895,672 1,376,576Abbott Lab 234,600 12,088,171 10,932,360Accredo Hlth Inc 26,750 949,025 845,568Adaptec Inc 539,000 3,940,008 4,759,370ADC Telecommunications Inc 332,400 3,588,512 987,228Adobe Sys Inc 84,575 2,157,620 3,323,798Advanced Fibre Communications Inc 48,400 984,445 975,260Advanced Marketing Svcs Inc 120,000 1,405,367 1,368,000Advanced Micro Devices Inc 82,700 1,752,521 1,232,230Advanced Neuromodulation Sys Inc 22,700 976,617 1,043,746Advancepcs 48,000 1,231,388 2,527,680Aeropostale 15,300 485,884 419,526AES Corp 93,500 648,280 882,640Aetna Inc 71,700 4,449,617 4,845,486AFLAC Inc 336,250 9,613,239 12,165,525Agilent Technologies Inc 69,900 1,956,326 2,043,876Air Prod & Chem Inc 57,600 2,232,434 3,043,008Airtran Hldgs Inc 93,300 1,086,628 1,110,270Akzo Nobel N V 85,000 2,606,397 3,247,000Alberto-Culver Co Common 14,000 700,804 883,120Albertson S Inc 237,112 6,436,426 5,370,587Alcoa Inc 266,004 7,781,239 10,108,152Allegheny Energy Inc 30,000 1,214,962 382,800Allegy Technologies Inc 19,400 525,996 256,468Allergan Inc 210,750 14,161,267 16,187,708Alliance Data Sys Corp 143,200 2,690,432 3,963,776Allied Cap Corp 109,200 2,423,201 3,044,496Allied Waste Inds Inc 72,100 958,759 1,000,748Allstate Corp 263,008 9,585,805 11,314,604Alltel Corp 74,300 4,700,850 3,460,894Altera Corp 56,900 1,215,426 1,291,630Altiris Inc 34,100 480,407 1,243,968Altria Group Inc 385,600 15,814,358 20,984,352Amazon Com Inc 41,000 2,052,702 2,158,240Ambac Fncl Group 25,450 1,450,207 1,765,976Amer Elec Pwr Co Inc 151,120 4,910,468 4,610,671Amer Express CO 193,000 7,189,961 9,308,390Amer Finl Group Inc Oh 86,400 2,029,730 2,286,144
28

Illinois Municipal Retirement FundInvestment Portfolio as of December 31, 2003
Asset description Shares Cost Value Market Value
EQUITIESU.S. SecuritiesCommon Stock
Amer Greetings Corp 15,700 348,238 343,359Amer Movil ADR 311,499 4,318,686 8,516,383Amer Svc Group Inc 65,000 1,331,252 2,009,085Amerada Hess Corp 119,100 6,505,903 6,332,547Ameren Corp 38,600 1,501,169 1,775,600Amerisourcebergen Corp 69,500 4,392,223 3,902,425Amern Axle & Mfg Holdings Inc 100,000 2,486,063 4,042,000Amern Banknote Corp 3,895 - 1,597Amern Eagle Outfitters Inc 27,200 424,108 446,080Amern Healthways Inc 76,000 938,695 1,814,120Amern Intl Group Inc 930,285 70,583,236 61,659,290Amern Italian Pasta CO 91,400 3,524,575 3,829,660Amern Pwr Conversion Corp 50,800 641,032 1,242,060Amern Std Cos Inc 44,000 4,121,962 4,430,800Ametek Inc 75,000 1,747,415 3,619,500Amgen Inc 707,872 41,424,061 43,746,490Amli Resdntl Pptys Tr 100,000 2,446,154 2,680,000Ampex Corp Del 1,780 46,050 1,210Amsouth Bancorporation 247,650 5,085,074 6,067,425Anadarko Petro Corp 171,233 7,904,215 8,734,595Analog Devices Inc 131,700 5,918,633 6,012,105Andrew Corp 36,600 595,799 421,266Anheuser Busch Cos Inc 122,200 5,378,728 6,437,496Anntaylor Stores Corp 109,000 2,244,943 4,251,000Ansys Inc 100,000 1,303,124 3,970,000Anthem Inc 33,000 2,121,334 2,475,000Aon Corp 74,550 2,629,166 1,784,727Apache Corp 38,601 1,738,451 3,130,541Apollo Group Inc 280,500 14,103,010 19,074,000Apple Computer Inc 91,000 2,918,189 1,944,670Applera Corp - Applied Biosystems Group 49,800 1,007,634 1,031,358Applera Corp Com Celera Genomics Group 20,000 277,352 278,200Applied Materials Inc 540,200 10,870,208 12,127,490Applied Micro Circuits Corp 72,600 923,840 434,148Apria Healthcare Group Inc 205,000 4,205,465 5,836,350Apt Invt & Mgmt CO 22,400 817,074 772,800Aptargroup Inc 150,000 3,597,654 5,850,000Archer-Daniels-Midland CO 239,375 2,868,711 3,643,288Arena Brands Hldg Corp 36,445 1,472,014 1Armor Hldgs Inc 200,000 3,238,146 5,262,000Arris Group Inc 243,300 1,305,124 1,761,492Artesyn Technologies Inc 207,100 1,459,464 1,764,492Artisan Components Inc 104,300 1,750,785 2,138,150Ashland Inc 16,300 603,424 718,178Ask Jeeves Inc Oc 68,900 771,016 1,248,468Asta Fdg Inc 11,500 265,712 393,875
29

Illinois Municipal Retirement FundInvestment Portfolio as of December 31, 2003
Asset description Shares Cost Value Market Value
EQUITIESU.S. SecuritiesCommon Stock
Astoria Finl Corp 74,900 2,032,240 2,786,280Asyst Technologies Inc 192,100 2,771,052 3,332,935AT&T Corp 549,232 17,924,355 11,149,410AT&T Wireless Svcs Inc 1,102,126 16,227,522 8,805,987Atmi Inc 68,800 1,744,902 1,592,032Auto Data Processing Inc 160,600 7,754,602 6,361,366Autodesk Inc 17,700 432,190 435,066Autoliv Inc 58,000 1,220,850 2,183,700Autonation Inc 360,000 4,119,175 6,613,200Autozone Inc 37,500 2,911,669 3,195,375Avaya Inc 165,200 1,150,756 2,137,688Avery Dennison Corp 16,700 855,952 935,534Avi Biopharma Inc 168,000 1,004,556 683,760Avon Prod Inc 114,200 6,213,051 7,707,358Axcelis Technologies Inc 42,600 427,947 435,372Baker Hughes Inc 190,400 6,056,484 6,123,264Baldor Elec CO 43,000 801,559 982,550Ball Corp 8,500 377,810 506,345Bank N.Y. Co Inc 191,700 4,737,960 6,349,104Bank One Corp 566,600 22,519,972 25,831,294Bard C R Inc 7,800 553,287 633,750Barnes & Noble Inc 99,900 1,885,221 3,281,715Barr Pharmaceuticals Inc 53,850 1,842,341 4,143,758Bausch & Lomb Inc 48,400 2,026,337 2,511,960Baxter Intl Inc 91,600 4,299,799 2,795,632Bb&T Corp 128,700 4,343,245 4,972,968Bear Stearns Cos Inc 75,377 4,347,998 6,026,391Beasley Broadcast Group Inc 80,900 1,194,537 1,329,187Beckman Coulter Inc 210,700 8,852,299 10,709,881Becton Dickinson & CO 144,800 5,383,334 5,957,072Bed Bath Beyond Inc 412,900 14,604,322 17,899,215Belden Inc 180,000 3,458,549 3,796,200Bellsouth Corp 574,900 22,023,135 16,269,670Bemis Co Inc 12,700 470,313 635,000Benchmark Electrs Inc 47,250 969,506 1,644,773Bentley Pharmaceuticals Inc 132,300 1,141,152 1,759,590Berkley W R Corp 141,497 3,988,716 4,945,320Best Buy Inc 48,600 1,334,789 2,538,864Big Lots Inc 27,800 559,167 395,038Bio Rad Labs Inc 85,000 1,706,443 4,901,950Biogen Idec Inc 123,780 4,791,480 4,552,628Biomarin Pharmaceutical Inc 206,500 2,070,184 1,604,299Biomet Inc 40,050 1,251,962 1,458,221BJ Svcs CO 41,500 1,504,686 1,489,850BJs Whsl Club Inc 105,400 1,947,275 2,419,984Bk Amer Corp 536,500 33,261,779 43,150,695
30

Illinois Municipal Retirement FundInvestment Portfolio as of December 31, 2003
Asset description Shares Cost Value Market Value
EQUITIESU.S. SecuritiesCommon Stock
Bk Haw Corp 71,200 2,172,469 3,004,640Black & Decker Corp 12,100 507,400 596,772Block H & R Inc 90,400 3,351,665 5,005,448Blockbuster Inc 93,200 1,528,137 1,672,940Blue Rhino Corp 102,900 1,148,459 1,429,281BMC Software Inc 98,300 2,186,134 1,833,295Boeing CO 199,500 7,904,184 8,406,930Boise Cascade Corp 23,100 746,647 759,066Bombay Inc 168,800 1,425,402 1,374,032Borg Warner Inc 85,000 3,713,367 7,230,950Bottomline Technologies Del Inc 184,300 1,479,766 1,658,700BP P L C 39,400 1,552,549 1,944,390Brasil Telecom Participacoes ADR 78,744 4,325,233 2,976,523Briggs & Stratton Corp 35,600 1,484,358 2,399,440Brinks CO 75,700 1,418,418 1,711,577Bristol Myers Squibb CO 372,800 15,981,973 10,662,080Broadcom Corp 181,800 5,018,840 6,197,562Brown-Forman Inc 9,100 659,594 850,395Brunswick Corp 21,600 477,380 687,528Bstn Scientific Corp 197,800 3,297,811 7,271,128Buca Inc Oc-com 120,000 1,681,647 817,200Buckle Inc 50,100 924,660 1,109,715Burl Northn Santa Fe Corp 354,800 9,825,836 11,477,780Burl Res Inc 86,350 3,818,468 4,782,063C D I Corp 32,100 809,766 1,051,275C D W Corp 50,500 2,150,614 2,916,880C&D Technologies Inc 100,000 2,099,324 1,917,000Callaway Golf CO 139,300 1,703,940 2,347,205Calpine Corp 108,600 1,276,225 522,366Cambrex Corp 198,900 4,242,772 5,024,214Campbell Soup CO 185,600 4,552,895 4,974,080Cap 1 Fncl 610,400 32,396,168 37,411,416Cardinal Hlth Inc 159,950 9,835,664 9,782,542Career Ed Corp 64,600 1,527,628 2,588,522Caremark Rx Inc 68,100 1,833,269 1,724,973Carmax Inc 139,800 3,014,426 4,324,014Caterpillar Inc 85,300 4,314,910 7,081,606Cbrl Group Inc 170,000 4,402,951 6,504,200Ccc Information Svcs Group Inc 38,100 574,830 643,890Celadon Group Inc 93,500 921,175 1,327,700Cell Therapeutics Inc 110,800 1,907,850 963,960Cemex ADR 399,183 9,127,297 10,458,595Cendant Corp 813,239 13,410,131 18,110,833Centerpoint Energy Inc 72,900 1,844,647 706,401Centex Constr Products Inc 50,000 1,636,653 3,013,500Centex Corp 127,100 5,458,753 13,682,315
31

Illinois Municipal Retirement FundInvestment Portfolio as of December 31, 2003
Asset description Shares Cost Value Market Value
EQUITIESU.S. SecuritiesCommon Stock
Centrais Eletr Bras Electrobras ADR Each Repr 50 Prf Or Comm ADR1,278,040 16,020,245 10,742,565Centurytel Inc 174,300 5,789,792 5,685,666Ceridian Corp 10,300 184,088 215,682Charles Riv Lab Intl Inc 56,400 1,852,615 1,936,212Charlotte Russe Hldg Inc 140,900 3,443,978 1,952,874Charter 1 Fincl Inc 53,787 1,198,707 1,858,341Checkfree Corp 83,200 1,043,488 2,300,480Cheesecake Factory Inc 101,375 1,463,030 4,463,541Chevrontexaco Corp 402,278 32,702,547 34,752,796Chgo Pizza & Brewery Inc 163,800 1,312,538 2,443,896Childrens Pl Retail Stores Inc 90,600 2,055,672 2,421,738Chippac Inc 299,100 746,643 2,270,169Chiron Corp 28,100 1,112,191 1,601,419Christopher & Banks Corp 98,550 1,438,719 1,924,682Chubb Corp 70,200 4,684,051 4,780,620Ciena Corp 122,900 1,518,207 816,056Cigna Corp 58,800 4,199,817 3,381,000Cin Fncl Corp 38,200 1,469,098 1,599,816Cinergy Corp 42,300 1,279,171 1,641,663Cintas Corp 25,700 1,149,201 1,288,341Circuit Cy Stores Inc 49,800 1,126,258 504,474Cisco Sys Inc 3,337,800 43,391,052 81,075,162Cit Group Inc 75,000 2,030,990 2,696,250Citigroup Inc 2,278,641 91,490,494 110,605,234Citizens Communications CO 67,800 992,384 842,076Citrix Sys Inc 231,900 3,572,697 4,918,599Claires Stores Inc 24,900 292,259 469,116Clarcor Inc 100,000 2,068,610 4,410,000Clear Channel Communications Inc 274,900 14,525,127 12,873,567Clorox CO 31,600 1,309,395 1,534,496Clssic Holdco Com Unit 846 21,767 -CMS Energy Corp 34,300 962,344 292,236Coach Inc 81,600 2,301,898 3,080,400Coca Cola CO 538,000 26,279,521 27,303,500Coca Cola Enterprises Inc 107,800 2,351,816 2,357,586Colgate-Palmolive CO 85,900 4,970,775 4,299,295Colonial Bancgroup Inc 161,100 2,470,202 2,790,252Com Kroll Inc 39,800 765,599 1,034,800Comcast Corp 742,712 28,768,226 24,412,943Comcast Corp 293,900 7,824,993 9,193,192Comerica Inc 41,800 2,325,011 2,343,308Coml Fed Corp 54,400 1,260,234 1,453,024Commscope Inc 200,000 3,409,129 3,266,000Compania Anonima Nacional Telefonos De Venezuela 175,498 3,955,220 2,678,099Compass Bancshares Inc 155,000 4,300,568 6,093,050Computer Assoc Intl Inc 138,000 2,609,347 3,772,920
32

Illinois Municipal Retirement FundInvestment Portfolio as of December 31, 2003
Asset description Shares Cost Value Market Value
EQUITIESU.S. SecuritiesCommon Stock
Computer Sci Corp 175,700 7,571,761 7,771,211Compuware Corp 281,200 1,795,579 1,698,448Comverse Tech Inc 122,300 2,191,438 2,151,257Conagra Foods Inc 134,200 3,082,393 3,541,538Concord Efs Inc 116,600 1,628,611 1,730,344Conmed Corp 128,000 2,584,203 3,046,400Conocophillips 372,788 20,205,955 24,443,709Cons Edison Inc 84,700 3,420,658 3,642,947Constellation Energy Group Inc 39,800 1,338,851 1,558,568Convergys Corp 186,600 3,361,215 3,258,036Cooper Cameron Corp 6,600 297,636 307,560Cooper Tire & Rubber CO 17,600 304,989 376,288Coors Adolph CO 8,700 502,485 488,070Corinthian Colleges Inc 115,000 676,544 6,389,400Corning Inc 596,300 6,403,980 6,219,409Costco Whsl Corp 145,000 5,533,935 5,391,100Countrywide Finl Corp 161,600 6,400,632 12,257,360Covance Inc 112,600 1,462,269 3,017,680Covenant Trans Inc Nev 81,300 1,346,621 1,545,513Coventry Hlth Care Inc 83,800 2,926,789 5,404,262Crane CO 14,100 347,986 433,434Cray Inc 101,400 668,490 1,006,902Credence Sys Corp 30,000 365,331 394,800Crown Castle Intl Corp 40,200 450,110 443,406CSG Sys Intl Inc 41,100 511,954 513,339CSX Corp 51,000 1,720,497 1,832,940Cubist Pharmaceuticals Inc 115,500 1,839,879 1,404,480Cummins Inc 9,900 400,400 484,506Cuno Inc 39,000 860,576 1,756,170CVB Finl Corp 151,250 1,315,849 2,917,613CVS Corp 94,100 2,827,803 3,398,892Cyberguard Corp 227,700 2,151,761 1,985,544Cypress Semiconductor Corp 32,500 691,181 694,200Cytyc Corp 205,000 2,164,424 2,820,800D R Horton Inc 158,664 1,172,718 6,863,805Dade Behring Hldgs Inc 23,000 551,838 822,020Dana Corp 35,400 1,193,188 649,590Danaher Corp 38,400 2,551,166 3,523,200Darden Restaurants Inc 39,200 814,249 824,768Davita Inc 112,900 2,828,361 4,403,100Dbs Group Hldgs 1,687,000 8,849,159 14,592,550Dean Foods CO 265,500 7,135,125 8,726,985Deere & CO 58,500 2,524,405 3,805,425Dell Inc 1,675,100 51,099,520 56,886,396Delphi Corp 536,600 4,555,860 5,478,686Delta & Pine Ld CO 57,900 1,290,514 1,470,660
33

Illinois Municipal Retirement FundInvestment Portfolio as of December 31, 2003
Asset description Shares Cost Value Market Value
EQUITIESU.S. SecuritiesCommon Stock
Delta Air Lines Inc 34,900 1,548,199 412,169Deluxe Corp 59,700 2,418,608 2,467,401Dentsply Intl Inc 140,000 2,333,868 6,323,800Devon Energy Corp 55,300 2,940,930 3,166,478Diebold Inc 88,000 1,988,254 4,740,560Dillards Inc 19,900 410,616 327,554Disney Walt Co Disney 499,200 15,841,482 11,646,336Dollar Gen Corp 311,700 5,808,963 6,542,583Dollar Tree Stores Inc 172,600 3,316,452 5,188,356Dominion Res Inc Va 81,251 4,167,330 5,186,251Donaldson Inc 71,000 2,916,373 4,200,360Donnelley R R & Sons CO 80,000 2,050,500 2,412,000Dover Corp 48,300 2,020,463 1,919,925Dow Chem CO 273,300 8,648,033 11,361,081Dow Jones & Co Inc 12,300 601,974 613,155Dte Energy CO 40,100 1,540,592 1,579,940Du Pont E I De Nemours & CO 149,500 6,357,547 6,860,555Duane Reade Inc 83,700 1,333,732 1,416,204Duke Energy Corp 317,800 8,376,438 6,499,010Dynegy Inc 89,300 3,970,361 382,204E Piphany Inc 161,800 1,132,754 1,166,578Eastman Chem CO 35,000 1,472,774 1,383,550Eastman Kodak CO 230,800 9,573,489 5,924,636Eaton Corp 17,900 1,223,313 1,932,842Ebay Inc 794,900 41,260,207 51,342,591Ecolab Inc 148,900 2,949,894 4,075,393Ed Mgmt Corp 100,678 2,306,449 3,125,045Edison Intl 294,100 3,868,129 6,449,613EGL Inc 132,700 2,966,044 2,330,212El Paso Corp 143,106 5,646,386 1,172,038Electr Arts 202,340 7,687,778 9,667,805Electr Data Sys Corp 445,700 11,960,454 10,937,478Eli Lilly & CO 301,750 21,585,504 21,222,078Embarcadero Technologies Inc 134,500 1,040,456 2,145,275EMC Corp 1,172,500 14,163,732 15,148,700Emerson Elec CO 63,700 3,215,185 4,124,575EMS Technologies Inc 100,000 1,776,297 2,054,000Encore Cap Group Inc 106,300 1,196,167 1,578,555Endo Pharmaceuticals Hldgs Inc 17,500 297,862 337,050Energizer Hldgs Inc 45,300 1,454,495 1,701,468Engelhard Corp 74,900 1,724,339 2,243,255Entegris Inc 279,000 2,825,020 3,585,150Entercom Communications Corp 75,100 2,235,206 3,977,296Entergy Corp 148,800 5,742,304 8,500,944EOG Resources Inc 27,400 1,156,908 1,265,058Eqty Office Pptys Tr REIT 208,700 6,005,721 5,979,255
34

Illinois Municipal Retirement FundInvestment Portfolio as of December 31, 2003
Asset description Shares Cost Value Market Value
EQUITIESU.S. SecuritiesCommon Stock
Eqty Resdntl Eff 122,200 3,502,383 3,606,122Equifax Inc 21,200 484,860 519,400Equinix Inc 23,500 470,000 662,700Equitable Res Inc 100,000 1,219,250 4,292,000Esco Technologies Inc 51,000 1,685,688 2,226,150Euronet Worldwide Inc 144,600 1,308,864 2,602,800Exelon Corp 291,100 15,992,744 19,317,396Express Scripts Inc 31,300 1,992,201 2,079,259Extreme Networks Inc 137,200 1,072,924 989,212Exxon Mobil Corp 2,142,350 82,740,261 87,836,350F P L Group Inc 45,900 2,533,694 3,002,778Factset Resh Sys Inc 44,000 292,742 1,681,240Family Dlr Stores Inc 25,900 764,083 929,292Fedex Corp 107,800 5,695,007 7,276,500Fedt Dept Stores Inc 195,400 7,275,859 9,209,202Fedt Investors Inc 16,406 451,183 481,680FHLMC 187,300 9,982,035 10,923,336Fid Natl Finl Inc 169,875 4,744,993 6,587,753Finlay Enterprises Inc 127,200 1,470,101 1,797,336First Data Corp 603,400 22,583,176 24,793,706Firstenergy Corp 77,597 2,291,596 2,731,414Fiserv Inc 310,964 5,476,363 12,286,188Fleetboston Finl Corp 257,760 9,526,656 11,251,224Fluor Corp 56,500 1,930,441 2,239,660FNMA 391,150 28,826,790 29,359,719Ford Mtr Co Del 562,360 14,252,137 8,997,760Forest Lab Inc 139,700 7,039,653 8,633,460Fortune Brands Inc 34,600 1,226,832 2,473,554Fox Entmt Group Inc 95,700 2,734,879 2,789,655Freeport Mcmoran C & G 132,400 4,918,680 5,578,012Frkln Res Inc 63,000 2,337,895 3,279,780FTI Consulting Inc 117,000 3,017,133 2,734,290Furniture Brands Intl Inc 85,000 1,334,941 2,493,050Ga Pac Corp 60,450 3,131,447 1,854,002Gables Resdntl Tr 140,000 3,739,843 4,863,600Gannett Inc 64,300 4,256,714 5,732,988Gap Inc 338,600 6,214,135 7,858,906Gateway Inc 77,200 3,753,806 355,120Gen Dynamics Corp 47,000 3,693,945 4,248,330Gen Elec CO 2,998,450 106,130,985 92,891,981Gen Mills Inc 160,500 7,315,591 7,270,650Genentech Inc 235,000 20,315,936 21,988,950General Motors Corp 429,900 20,792,876 22,956,660Genesis Healthcare Corp 82,500 1,007,741 1,879,350Gentex Corp 63,000 2,392,066 2,782,080Genuine Parts CO 119,700 3,511,666 3,974,040
35

Illinois Municipal Retirement FundInvestment Portfolio as of December 31, 2003
Asset description Shares Cost Value Market Value
EQUITIESU.S. SecuritiesCommon Stock
Genzyme Corp 177,900 8,475,408 8,777,586Gilead Sci Inc 66,600 3,665,259 3,872,124Gillette CO 151,800 4,626,386 5,575,614Global Imaging Sys Inc 32,800 926,053 1,041,400Global Pmts Inc 17,000 636,528 801,040Global Pwr Equip Group Inc 172,300 2,011,268 1,150,964Globix Corp 109,863 199,237 439,452Golden W. Fncl Corp 70,900 4,552,215 7,316,171Goldman Sachs Group Inc 185,850 14,747,629 18,348,971Goodrich Corporation 28,000 855,127 831,320Goodyear Tire & Rubber CO 41,800 1,335,192 328,548Goodys Family Clothing Inc 146,000 1,177,371 1,366,560Grainger W W Inc 21,800 898,934 1,033,102Gray T.V Inc 96,600 1,230,196 1,460,592Great Lakes Chem Corp 12,000 431,665 326,280Greenpoint Fncl Corp 82,500 2,443,688 2,913,900Griffon Corp 150,000 1,605,223 3,039,000Gtech Hldgs Corp 88,600 3,151,367 4,384,814Guidant Corp 118,600 4,622,023 7,139,720Halliburton CO 104,400 1,406,972 2,714,400Hancock Fabrics Inc 100,000 960,130 1,448,000Hancock John Finl Svcs Inc 68,900 2,701,147 2,583,750Hanmi Finl Corp 77,466 814,451 1,531,503Harland John H CO 199,500 4,684,585 5,446,350Harley Davidson Inc 495,700 18,301,023 23,560,621Harman Intl Inds Inc 157,200 1,372,334 11,629,656Harrah S Entmt Inc 26,200 733,624 1,303,974Harris & Harris Group Inc 100,000 800,000 1,153,000Hartford Finl Svcs Group Inc 69,600 4,101,713 4,108,488Hasbro Inc 41,450 814,173 882,056HCA Inc 234,800 7,612,984 10,087,008Hecla Mng CO 56,100 430,320 465,069Heico Corp 239,100 2,678,006 3,366,528Heinz H J CO 52,800 1,939,990 1,923,504Henry Jack & Assoc Inc 56,200 1,003,390 1,156,596Hercules Inc 16,700 171,088 203,740Hershey Foods Corp 36,300 2,545,276 2,794,737Hewlett Packard CO 1,302,175 38,178,157 29,910,960Hilton Hotels Corp 90,000 924,423 1,541,700Hlth Mgmt Assoc Inc 61,800 1,140,341 1,483,200Hollis-Eden Pharmaceuticals Inc 76,500 1,424,915 842,265Hologic Inc 124,700 1,177,718 2,161,051Home Depot Inc 776,650 25,218,699 27,563,309Honeywell Intl Inc 281,250 11,572,843 9,402,188Horizon Offshore Inc 296,800 2,094,213 1,305,920Hughes Sup Inc 150,000 3,650,597 7,443,000
36

Illinois Municipal Retirement FundInvestment Portfolio as of December 31, 2003
Asset description Shares Cost Value Market Value
EQUITIESU.S. SecuritiesCommon Stock
Human Genome Sciences Inc 58,700 729,494 777,775Humana Inc 257,500 4,688,836 5,883,875Huntington Bancshares Inc 363,519 6,778,061 8,179,178Hydril CO 72,300 1,548,318 1,730,139Hyperion Solutions Corp 107,225 2,267,480 3,231,762ICO Global Communications Hldgs Ltd Del 93,959 888,689 43,221I-Flow Corp 143,800 1,167,438 2,000,258Igate Corp 73,900 282,235 580,115Ill Tool Wks Inc 76,400 5,072,879 6,410,724Imation Corp 130,000 3,703,240 4,569,500Imclone Sys Inc 33,800 1,337,717 1,340,508Impac Mtg Hldgs Inc 34,400 610,698 626,424IMS Hlth Inc 36,100 807,884 897,446Insight Enterprises Inc 102,000 1,626,698 1,917,600Insituform Technologies Inc 85,000 1,195,160 1,402,500Integrated Circuit Sys Inc 84,800 2,255,745 2,415,952Integrated Device Tech Inc 132,700 2,097,402 2,278,459Integrated Silicon Solution Inc 155,600 3,378,956 2,438,252Intel Corp 2,318,600 56,079,526 74,658,920Intercontinental Hotels Group Plc ADR 115,000 943,302 1,100,550Interpublic Group Companies Inc 271,500 3,785,100 4,235,400Intl Business Machs Corp 274,500 28,692,825 25,440,660Intl Flavors & Fragrances Inc 14,200 443,864 495,864Intl Game Tech 158,600 4,051,876 5,662,020Intl Paper CO 150,650 6,887,354 6,494,522Intl Speedway Corp 70,800 2,859,684 3,161,928Introgen Therapeutics Inc 158,800 1,387,840 1,343,448Intuit 29,800 1,308,678 1,576,718Invacare Corp 45,700 1,117,179 1,844,909Investors Finl Svcs Corp 130,000 2,770,747 4,993,300Invitrogen Corp 75,000 4,341,226 5,250,000Invt Tech Group Inc 133,800 2,183,432 2,160,870ITT Edl Svcs Inc 29,000 789,755 1,362,130ITT Inds Inc 69,100 4,506,965 5,127,911Ixia 125,000 1,010,182 1,462,500J P Morgan Chase & CO 985,536 33,130,398 36,198,737Jabil Circuit Inc 47,400 1,601,384 1,341,420Jakks Pac Inc 160,000 2,560,946 2,105,600Janus Cap Group Inc 57,000 1,395,906 935,370JDA Software Group Inc 10,600 174,125 175,006JDS Uniphase Corp 340,900 13,033,484 1,244,285Jefferies Group Inc 104,600 626,085 3,453,892Jefferson-Pilot Corp 33,800 1,537,693 1,711,970Jetblue Awys Corp 16,005 452,646 424,453Johnson & Johnson 910,350 47,816,729 47,028,681Johnson Ctl Inc 82,600 6,292,992 9,591,512
37

Illinois Municipal Retirement FundInvestment Portfolio as of December 31, 2003
Asset description Shares Cost Value Market Value
EQUITIESU.S. SecuritiesCommon Stock
Jones Apparel Group Inc 30,200 1,010,537 1,063,946Juniper Networks Inc 77,000 1,457,827 1,438,360K.V Pharmaceutical 53,700 1,057,318 1,369,350KB Home 12,500 400,623 906,500Kellogg CO 61,200 1,882,511 2,330,496Kemet Corp 200,000 2,458,250 2,738,000Kerr Mcgee Corp 24,035 1,308,711 1,117,387Keycorp 100,300 2,794,320 2,940,796Keyspan Corp 37,800 1,328,391 1,391,040Kimberly-Clark Corp 119,400 7,008,858 7,055,346Kinder Morgan Inc 29,400 1,395,073 1,737,540King Pharmaceuticals Inc 57,500 1,167,152 877,450Kla-Tencor Corp 28,700 1,223,277 1,683,829Knight-Ridder Inc 12,100 827,519 936,177Knology Inc (673) (6,144) (6,070)Kohls Corp 296,750 16,560,236 13,335,945Korea Elec Pwr Corp 223,555 3,237,242 2,322,736Korn / Ferry Intl 76,900 1,025,373 1,025,846Krispy Kreme Doughnuts Inc 133,000 5,409,523 4,867,800Kroger CO 185,500 2,779,374 3,433,605KT Corp 511,386 11,443,736 9,752,131Kvh Inds Inc 22,300 672,370 612,581Labor Ready Inc 225,900 1,750,345 2,959,290Lafarge N Amer Inc 39,400 1,261,050 1,596,488Landstar Sys Inc 87,200 2,720,649 3,317,088Lasalle Hotel Pptys 108,200 1,389,493 2,007,110Laserscope 119,100 947,201 1,856,769Lattice Semiconductor Corp 82,500 650,602 798,600Lauder Estee Cos Inc 104,625 3,991,976 4,107,578Lear Corp 39,000 1,672,167 2,391,870Learning Tree Intl Inc 72,700 1,626,904 1,264,253Leggett & Platt Inc 45,894 957,264 992,687Lehman Bros Hldgs Inc 114,300 6,824,346 8,826,246Lennar Corp 19,140 1,444,233 1,837,440Lennar Corp 3,500 158,710 319,900Lexmark Intl Inc 45,675 2,715,874 3,591,882Liberty Media Corp New 235,750 2,583,412 2,803,068Lifecell Corp 203,600 1,431,315 1,264,356Lightbridge Inc 181,300 1,609,990 1,649,830Lincoln Natl Corp 42,400 1,894,672 1,711,688Linear Tech Corp 155,500 6,279,981 6,541,885Liz Claiborne Inc 208,900 5,066,277 7,407,594Lockheed Martin Corp 111,300 3,876,848 5,720,820Loews Corp 137,400 5,901,174 6,794,430Louisiana-Pacific Corp 29,500 425,197 527,460Lowes Cos Inc 712,800 33,717,319 39,481,992
38

Illinois Municipal Retirement FundInvestment Portfolio as of December 31, 2003
Asset description Shares Cost Value Market Value
EQUITIESU.S. SecuritiesCommon Stock
LSI Logic Corp 307,500 3,399,631 2,727,525Ltd Brands 124,300 1,742,524 2,241,129LTX Corp 117,500 694,752 1,766,025Lubrizol Corp 57,600 1,769,196 1,873,152Lucent Technologies Inc 638,400 959,784 1,813,056M D C Hldgs Inc 121,000 1,645,244 7,804,500Macdermid Inc 150,000 2,078,814 5,136,000Manor Care Inc 21,200 366,283 732,884Manpower Inc 48,000 2,253,706 2,259,840Marathon Oil Corp 441,000 11,172,910 14,592,690Marconi Plc New 46,276 734,260 937,089Markel Corp Holding CO 1,400 354,820 354,914Marriott Intl Inc 55,500 2,098,667 2,564,100Marsh & Mclennan Co's Inc 95,400 4,836,218 4,568,706Marshall & Ilsley Corp 54,200 1,625,826 2,073,150Masco Corp 174,900 4,318,339 4,794,009Matsushita Elec Indl Ltd ADR 188,900 2,218,074 2,633,266Mattel Inc 106,900 2,075,731 2,059,963Maxim Integrated Prods Inc 156,300 6,561,726 7,783,740Maximus Inc 147,200 5,101,149 5,759,936May Dept Stores CO 176,800 5,008,229 5,139,576Maytag Corp 11,800 361,943 328,630MBIA Inc 183,350 8,217,611 10,859,821MBNA Corp 1,107,550 23,562,529 27,522,618Mc Cormick & Co Inc 21,000 538,576 632,100Mc Donalds Corp 488,200 8,891,354 12,122,006Mcgraw Hill Companies Inc 28,800 1,645,699 2,013,696Mckesson Corp 78,000 1,952,546 2,508,480Meadwestvaco Corp 47,756 1,494,270 1,420,741Medco Hlth Solutions Inc 103,400 2,848,638 3,514,566Medimmune Inc 57,700 1,487,939 1,465,580Medquist Inc 106,000 1,799,446 1,702,360Medtronic Inc 868,625 31,622,704 42,223,861Mellon Finl Corp 102,600 2,907,171 3,294,486Men S Wearhouse Inc Commom 130,000 3,184,251 3,251,300Mentor Graphics Corp 350,000 3,165,332 5,089,000Merck & Co Inc 359,300 22,628,181 16,599,660Mercury Interactive Corp 13,000 491,010 632,320Meredith Corp 7,500 306,505 366,075Meritage Corp 28,400 1,516,589 1,883,204Merrill Lynch & Co Inc 460,000 22,958,196 26,979,000Metal Mgmt Inc 63,000 1,278,793 2,326,590Metlife Inc 656,200 19,595,932 22,094,254MGIC Invt Corp 64,300 4,008,846 3,661,242Micrel Inc 73,900 768,613 1,151,362Micron Tech Inc 145,400 5,064,050 1,958,538
39

Illinois Municipal Retirement FundInvestment Portfolio as of December 31, 2003
Asset description Shares Cost Value Market Value
EQUITIESU.S. SecuritiesCommon Stock
Microsemi Corp 99,000 1,445,895 2,433,420Microsoft Corp 3,686,050 114,744,623 101,513,817Millennium Pharmaceuticals Inc 32,500 525,385 606,775Millipore Corp 60,700 2,454,339 2,613,135Mills Corp 50,000 860,700 2,200,000Mindspeed Technologies Inc 177,700 720,992 1,217,245Minerals Technologies Inc 95,000 3,869,506 5,628,750MKS Instrs Inc 13 377 377Mohawk Inds Inc 62,300 2,276,112 4,394,642Moldflow Corp 15,900 160,750 180,465Molex Inc 45,600 1,077,707 1,590,984Monarch Casino & Resort Inc 88,500 1,087,620 976,155Monsanto CO 62,400 985,308 1,795,872Monster Worldwide Inc 16,900 335,016 371,124Moodys Corp 162,300 8,357,974 9,827,265Morgan Stanley 485,300 26,975,643 28,084,311Motorola Inc 912,086 19,199,040 12,833,050Mykrolis Corp 185,900 1,488,360 2,989,272Mylan Lab Inc 77,700 1,398,293 1,962,702N V R Inc 3,900 1,357,094 1,817,400N W Pipe CO 42,000 609,000 559,440N. Fork Bancorporation Inc 20,800 813,644 841,776Natco Group Inc 85,600 856,000 649,704National-Oilwell Inc 114,800 2,320,722 2,566,928Natl Cy Corp 283,900 7,986,419 9,635,566Natl Semiconductor Corp 27,400 1,061,956 1,079,834Navigant Consulting Inc 46,000 701,605 867,560Navigant Intl Inc 125,500 1,695,761 1,738,175Navistar Intl Corp 11,400 394,658 545,946NCO Group Inc 72,100 1,528,012 1,641,717NCR Corp 145,900 4,025,075 5,660,920Ndchealth Corp 237,500 4,897,099 6,084,750Neighborcare Inc 165,000 1,937,888 3,258,750Nektar Therapeutics 35,400 462,172 481,794Neon Communications Inc Com Accd Invs W Stockholder 184,460 36,987 230,575Network Appliance Inc 51,600 699,540 1,059,348Networks Assoc Inc 30,100 434,879 452,704New York Times CO 22,500 932,755 1,075,275Newell Rubbermaid Inc 123,850 3,678,465 2,820,065Newmont Mining Corp 104,200 2,558,951 5,065,162Newport Corp 20,800 334,431 343,824Nextel Communications Inc 320,400 6,030,904 8,990,424Nicor Inc 62,900 2,149,655 2,141,116NII Hldgs Inc 25,323 1,590,301 1,889,855Nike Inc 103,500 5,604,213 7,085,610Nisource Inc 62,600 1,460,013 1,373,444
40

Illinois Municipal Retirement FundInvestment Portfolio as of December 31, 2003
Asset description Shares Cost Value Market Value
EQUITIESU.S. SecuritiesCommon Stock
Nokia Corp 367,525 7,006,427 6,247,925Nordstrom Inc 85,800 1,978,360 2,942,940Norfolk Southn Corp 93,000 2,105,230 2,199,450Northeast Utilities 141,400 2,101,550 2,852,038Northn Tr Corp 98,250 4,157,559 4,560,765Northrop Grumman Corp 43,653 3,826,262 4,173,227Novell Inc 56,700 536,807 596,484Novellus Sys Inc 37,600 1,846,730 1,581,080NS Group Inc 253,000 3,219,453 2,454,100Ntl Europe Inc 19,300 2,262,180 193Ntl Inc 46,462 2,099,146 3,240,725Nucor Corp 18,600 876,716 1,041,600Nvidia Corp 41,200 863,037 957,900Nyfix Inc DE 167,500 1,188,497 1,331,625O Charleys Inc 125,000 2,401,832 2,243,750Occidental Pete Corp 310,700 8,729,803 13,123,968Oceaneering Intl Inc 140,000 2,397,816 3,920,000Office Depot Inc 73,900 987,654 1,234,869Oil Co Lukoil 84,500 5,715,811 7,858,500Old Rep Intl Corp 90,450 1,774,862 2,293,812Olin Corp 100,000 1,821,210 2,006,000Omnicare Inc 160,000 1,877,868 6,462,400Omnicom Group Inc 55,950 3,864,578 4,886,114Oracle Corp 937,500 13,561,856 12,375,000Overland Storage Inc 75,900 1,395,752 1,426,920Owens Ill Inc 119,900 1,778,768 1,425,611P F Changs China Bistro Inc 60,200 885,210 3,062,976Pac Sunwear Cal Inc 63,250 608,629 1,335,840Paccar Inc 29,100 1,037,814 2,476,992Pacificare Hlth Sys Inc 62,400 1,812,213 4,218,240Pactiv Corp 37,500 735,000 896,250Pall Corp 29,600 604,534 794,168Pan Pac Retail Pptys Inc 100,000 2,093,332 4,765,000Papa Johns Intl Inc 53,900 1,453,203 1,799,182Parametric Tech Corp 30,800 115,731 121,352Parexel Intl Corp 86,100 1,214,257 1,399,986Parker-Hannifin Corp 28,200 1,129,906 1,677,900Paychex Inc 56,600 1,936,474 2,105,520PC Mall Inc 89,500 1,264,363 1,445,425PDF Solutions Inc 124,000 934,081 1,847,600Peabody Energy Corp 118,000 3,807,919 4,921,780PEC Solutions Inc 39,900 440,170 676,305Penn Va Corp 65,000 1,711,945 3,617,250Penney J.C Co Inc 64,700 1,609,847 1,700,316Peoples Energy Corp 8,700 318,868 365,748Peoplesoft Inc 92,400 1,601,543 2,106,720
41

Illinois Municipal Retirement FundInvestment Portfolio as of December 31, 2003
Asset description Shares Cost Value Market Value
EQUITIESU.S. SecuritiesCommon Stock
Pepsi Bottling Group Inc 63,800 1,343,617 1,542,684Pepsiamericas Inc 161,500 2,212,412 2,764,880Pepsico Inc 368,395 16,248,138 17,174,575Perkinelmer Inc 282,200 4,935,697 4,817,154Perrigo CO 72,600 922,072 1,141,272Petco Animal Supplies Inc 28,800 712,581 876,960Petroleo Brasileiro Sa Petrobas ADR 491,503 6,095,296 13,103,470Petroleo Brasileiro Sa Petrobras ADR 116,800 2,312,143 3,415,232Pfizer Inc 2,588,540 94,260,159 91,453,118PG& E Corp 103,100 2,634,434 2,863,087Phelps Dodge Corp 21,190 1,004,759 1,612,347Photronics Inc 125,000 1,587,263 2,490,000Pier 1 Imports Inc 225,000 2,820,382 4,918,500Pinnacle W. Cap Corp 21,800 840,810 872,436Pitney Bowes Inc 222,300 7,943,893 9,029,826Pk Pl Entmnt 245,000 2,619,004 2,653,350Pkwy Pptys Inc REIT 40,000 1,202,400 1,664,000Plexus Corp 23,400 390,644 401,778Plum Creek Timber Co Inc 43,600 1,327,819 1,327,620PMC Sierra Inc 26,500 577,228 533,975PNC Financial Services Group 66,800 3,585,497 3,655,964Polo Ralph Lauren Corp 66,100 2,016,685 1,903,680Polycom Inc 86,000 1,226,310 1,678,720Power-One Inc 247,200 1,804,052 2,677,176Pozen Inc 222,900 2,400,330 2,273,580PPG Ind Inc 40,500 2,225,608 2,592,810PPL Corp 42,100 1,289,889 1,841,875Praxair Inc 48,800 1,416,822 1,864,160Precision Castparts Corp 39,002 1,767,571 1,771,081Prentiss Pptys Tr 176,600 4,305,560 5,826,034Price T Rowe Group Inc 19,400 716,881 919,754Prin Finl Group Inc 247,100 7,713,492 8,171,597Procter & Gamble CO 348,400 27,369,414 34,798,192Progress Energy Inc 58,000 2,346,426 2,625,080Progressive Corp Oh 139,500 9,038,287 11,660,805Prologis 42,770 1,173,085 1,372,489Proquest CO 141,500 4,047,637 4,167,175Prosperity Bancshares Inc 150,000 2,203,695 3,378,000Protective Life Corp 190,000 5,793,091 6,429,600Provide Comm Inc 122,100 1,753,652 1,852,257Providian Finl Corp 69,200 239,532 805,488Prudential Finl Inc 274,600 8,964,171 11,470,042Psychiatric Solutions Inc 149,200 1,516,066 3,118,280Pub Service Enterprise Group Inc 54,000 2,091,456 2,365,200Pulte Homes Inc 64,700 1,812,607 6,057,214Pvtpl ACP Hldg CO 249,290 389,922 124,645
42

Illinois Municipal Retirement FundInvestment Portfolio as of December 31, 2003
Asset description Shares Cost Value Market Value
EQUITIESU.S. SecuritiesCommon Stock
Pwr Integrations Inc 74,800 1,059,153 2,502,808Qad Inc 147,000 1,382,756 1,802,220Qlogic Corp 14,200 650,251 732,720Quaker Chem Corp 85,000 1,401,102 2,613,750Qualcomm Inc 451,200 29,347,690 24,333,216Quest Diagnostics Inc 25,100 1,466,437 1,835,061Quidel Corp 239,100 1,969,757 2,587,062Quixote Corp 120,000 2,272,681 2,929,200Qwest Communications Intl Inc 320,700 1,561,357 1,385,424Radian Group Inc 105,100 2,023,197 5,123,625Radioshack Corp 47,800 1,322,398 1,466,504Ralcorp Hldgs Inc 99,000 2,819,408 3,104,640Raymond James Fncl Inc 147,445 1,884,293 5,558,677Raytheon CO 99,200 3,685,830 2,979,968Reckson Assocs Rlty Corp REIT 100,000 2,079,438 2,430,000Red Hat Inc 438,700 5,775,152 8,234,399Red Robin Gourmet Burgers Inc 75,100 1,150,564 2,286,044Reebok Intl 14,100 251,937 554,412Regions Fncl Corp 151,800 4,854,111 5,646,960Reins Group Amer Inc 61,000 1,942,567 2,357,650Remington Oil & Gas Corp 45,500 773,332 895,895Rent-Way Inc 229,500 1,261,954 1,879,605Rep Svcs Inc 344,000 5,836,638 8,816,720Rex Stores Corp 247,700 2,791,249 3,507,432Reynolds R J Tob Hldgs Inc 20,100 1,159,504 1,168,815Rio Tinto Plc ADR 24,000 2,035,583 2,671,440Rite Aid Corp 10,100 60,108 61,004Robert Half Intl Inc 25,700 568,309 599,838Rockwell Automation 44,000 806,472 1,566,400Rockwell Collins Inc 27,100 676,486 813,813Rohm & Haas CO 103,014 3,937,159 4,399,728Rowan Companies Inc 26,600 598,551 616,322Ruby Tuesday Inc 93,700 2,258,620 2,669,513Rudoplh Technologies Inc 55,100 997,619 1,352,154Russ Berrie & Co Inc 41,900 1,037,223 1,420,410Ryanair Hldgs Plc 75,200 2,572,179 3,808,128Ryder Sys Inc 15,100 354,462 515,665Ryland Group Inc 90,000 1,133,507 7,977,600S.W. Airl CO 186,650 2,688,725 3,012,531Sabre Hldgs Corp 34,200 594,336 738,378Safeco Corp 33,000 1,021,171 1,284,690Safeway Inc 105,200 4,346,884 2,304,932Sanmina-Sci Corp Formerly Sanmina Hldgs 193,700 3,369,661 2,442,557Sap Aktiengesellschaft 31,400 1,272,081 1,304,984Sapient Corp 122,300 619,970 684,880Sara Lee Corp 117,200 2,501,297 2,544,412
43

Illinois Municipal Retirement FundInvestment Portfolio as of December 31, 2003
Asset description Shares Cost Value Market Value
EQUITIESU.S. SecuritiesCommon Stock
SBC Communications Inc 945,700 34,020,821 24,654,399Schering-Plough Corp 697,225 12,693,375 12,124,743Scholastic Corp 66,500 1,277,223 2,263,660Schwab Charles Corp 322,800 3,497,340 3,821,952Scientific-Atlanta Inc 35,500 778,895 969,150Scottish Pwr Plc 32,300 751,106 877,914Scripps E.W Inc 32,400 2,652,052 3,050,136Sealed Air Corp 12,800 561,258 692,992Sears Roebuck & CO 60,600 2,329,391 2,756,694Sempra Energy Inc 185,555 4,302,944 5,577,783Semtech Corp 159,300 1,535,161 3,620,889Shaw Group Inc 101,000 1,649,373 1,375,620Sherwin-Williams CO 133,900 3,724,169 4,651,686Shopko Stores Inc 250,000 6,169,238 3,812,500Siebel Sys Inc 123,900 973,741 1,718,493Sigma-Aldrich Corp 10,400 505,130 594,672Simon Ppty Group Inc 47,800 1,747,904 2,215,052Sirenza Microdevices Inc 337,300 2,294,002 1,619,040Sky Finl Group Inc 90,000 2,024,127 2,334,600SLM Corp 121,950 3,936,856 4,595,076Snap-On Inc 13,900 409,093 448,136Sohu Com Inc 105,190 3,658,488 3,156,752Solectron Corp 197,800 6,336,607 1,168,998Sonus Networks Inc 274,400 1,487,958 2,074,464Sony Corp Amer Depy Rcpt For ADR 112,700 3,450,739 3,907,309Sourcecorp Inc 44,100 1,079,308 1,130,283Southern CO 173,600 3,210,323 5,251,400Southtrust Corp 448,400 9,073,714 14,676,132Sovereign Bancorp Inc 518,000 8,349,514 12,302,500Spartech Corp 200,000 3,831,758 4,928,000Spatialight Inc 262,000 1,421,354 1,406,940Spherion Corp 156,930 2,956,769 1,536,345Spinnaker Expl CO 53,300 1,752,711 1,719,991Sprint Corp Com (fon Group) 1,053,100 20,704,333 17,291,902Sprint Corp Pcs 156,100 3,804,464 877,282St Jude Med Inc 58,700 2,745,162 3,601,245St Mary Ld & Expl CO 144,100 3,440,814 4,106,850St Paul Cos Inc 158,100 6,117,864 6,268,665St Str Corp 79,300 3,391,077 4,129,944Staar Surgical CO 253,300 2,515,438 2,852,158Stancorp Finl Group Inc 25,900 1,320,621 1,628,592Stanley Wks 20,300 703,415 768,761Staples Inc 308,100 7,676,668 8,411,130Starbucks Corp 598,700 17,196,793 19,793,022Starwood Hotels & Resorts Worldwide Inc 48,000 1,587,229 1,726,560Steak N Shake CO 153,600 2,113,320 2,741,760
44

Illinois Municipal Retirement FundInvestment Portfolio as of December 31, 2003
Asset description Shares Cost Value Market Value
EQUITIESU.S. SecuritiesCommon Stock
Steris Corp 5,400 120,258 122,040Sterling Bancorp 48,450 832,166 1,380,825Stl Dynamics Inc 33,800 450,586 793,962Stone Energy Corp 60,000 3,044,149 2,547,000Storage Tech Corp 134,200 3,080,271 3,455,650Stratex Networks Inc 166,500 1,415,047 707,625Strayer Ed Inc 6,600 435,399 718,278Stryker Corp 114,000 8,248,690 9,691,140Sun Microsystems Inc 787,000 4,224,785 3,533,630Sun Tr Banks Inc 69,800 4,328,258 4,990,700Sungard Data Sys Inc 68,000 1,624,548 1,884,280Sunoco Inc 62,900 2,236,942 3,217,335Super Valu Inc 31,900 675,503 912,021Superior Energy Svcs Inc 243,400 2,379,982 2,287,960Support Soft Inc 219,500 1,757,441 2,886,425Swift Transn Inc 315,450 5,219,561 6,630,759Sylvan Learning Sys Inc 28,900 645,658 832,031Symantec Corp 171,050 3,042,368 5,926,883Symbol Technologies Inc 55,000 1,020,474 928,950Symmetricom Inc 150,000 949,820 1,092,000Syngenta Ag 70,000 781,694 943,600Synovus Finl Corp 154,900 3,969,092 4,479,708Sysco Corp 97,100 2,642,990 3,615,033Taiwan Semiconductor Mfg Co Ltd ADR 1,279,668 12,379,018 13,103,800Target Corp 563,275 21,352,678 21,629,760Tech Data Corp 112,200 1,616,925 4,453,218Tech Olympic USA Inc 82,700 2,149,437 2,276,731Teco Energy Inc 44,700 1,062,402 644,127Tekelec 141,000 1,558,476 2,192,550Tektronix Inc 20,200 458,381 638,320Tele Celular Sul Participacoes ADR 1,760 11,442 25,256Tele Centro Oeste Celular ADR 19,533 297,300 192,400Tele Nordeste Celular Participacoes ADR 880 4,848 24,587Tele Norte Celular Participacoes S Asponsored ADR Repstg Pfd ADR352 2,190 3,844Telefonica ADR 126,388 6,008,812 5,585,086Telefonos De Mex ADR 318,299 6,276,342 10,513,416Teleleste Celular Participacoes ADR 352 3,836 4,882Telemig Celular Participacoes ADR 880 9,590 28,248Tellabs Inc 156,900 1,838,406 1,322,667Temple Inland Inc 12,900 670,248 808,443Tenet Healthcare Corp 110,600 1,699,137 1,775,130Teradyne Inc 30,500 718,809 776,225Teva Pharmaceutical Inds Ltd ADR 166,500 7,751,563 9,442,215Textron Inc 119,900 6,003,211 6,841,494Thermadyne Hldgs Corp 54,308 492,086 667,988Thermo Electron Corp 103,700 2,094,470 2,613,240
45

Illinois Municipal Retirement FundInvestment Portfolio as of December 31, 2003
Asset description Shares Cost Value Market Value
EQUITIESU.S. SecuritiesCommon Stock
Thomas & Betts Corp 13,900 453,209 318,171T-Hq Inc 102,400 1,259,550 1,731,584Tier Technologies Inc 234,000 3,724,564 1,911,780Tiffany & CO 186,900 7,187,132 8,447,880Time Warner Inc 1,660,500 61,985,827 29,872,395TJX Cos Inc 75,700 1,348,309 1,669,185Toll Bros Inc 105,200 1,219,781 4,182,752Torchmark Corp 102,000 3,672,889 4,645,080Toro CO 100,400 1,594,944 4,658,560Toys R US Inc 56,300 985,774 711,632Travelers Ppty Cas Corp 240,057 4,678,980 4,073,767Triad Gty Inc 50,000 1,406,111 2,517,500Triad Hosps Inc 39,000 1,286,263 1,297,530Tribune CO 74,800 3,127,314 3,859,680Trimble Nav Ltd 151,400 2,642,583 5,638,136Triquint Semiconductor Inc 63,400 449,808 448,238Tupperware Corp 8,800 179,902 152,592Tweeter Home Entmt Group Inc 126,200 1,466,662 1,192,590Tx Instrs Inc 626,400 16,927,502 18,403,632TXU Corp 366,700 9,619,849 8,698,124Tyson Foods Inc 183,500 2,064,124 2,429,540UCBH Hldgs Inc 130,000 656,888 5,066,100UGI Corp 68,000 1,993,202 2,305,200Ultimate Software Group Inc 145,100 1,369,798 1,272,527Ultralife Batteries Inc 223,600 2,732,894 2,768,168Ultratech Inc Eff 60,000 844,283 1,762,200Un Pac Corp 139,300 7,916,458 9,678,564Un Planters Corp 46,700 1,208,465 1,470,583Unilever N V Ny Shs ADR 58,000 3,347,411 3,764,200Unionbancal Corp DE 61,300 2,528,545 3,527,202Unisys Corp 208,300 2,288,144 3,093,255Unit Corp 100,000 1,766,117 2,355,000United Parcel Svc Inc 241,100 15,581,735 17,974,005Unitedglobalcom 621,739 4,848,342 5,272,346Unitedhealth Group Inc 378,600 12,777,200 22,026,948Univision Communications Inc 75,700 2,997,531 3,004,533Unocal Corp 151,600 4,818,814 5,583,428Unumprovident Corp 120,530 2,660,126 1,900,758US Bancorp 917,223 20,700,384 27,314,901US Oncology Inc 427,700 5,270,127 4,602,052UST Inc 25,100 794,260 895,819Utd Defense Inds Inc 25,300 702,284 806,564Utd Sts Stl Corp 27,200 645,628 952,544Utd Technologies Corp 200,100 14,220,813 18,963,477V F Corp 136,300 4,968,439 5,893,612Valeant Pharmaceuticals Intl 76,900 1,593,252 1,934,035
46

Illinois Municipal Retirement FundInvestment Portfolio as of December 31, 2003
Asset description Shares Cost Value Market Value
EQUITIESU.S. SecuritiesCommon Stock
Valero Energy Corp 90,005 3,337,424 4,170,832Varco Intl Inc 121,616 2,063,833 2,508,938Verint Sys Inc 51,800 1,157,177 1,168,608Veritas Software Corp 270,800 8,446,628 10,062,928Verizon Communications 1,025,300 42,159,091 35,967,524Viacom 930,400 40,387,712 41,291,152Viasys Healthcare Inc 77,300 1,557,666 1,592,380Virage Logic Corp 134,400 1,458,843 1,366,848Visteon Corp 31,138 476,390 324,147Vital Signs Inc 80,000 2,106,529 2,616,000Vitesse Semiconductor Corp 302,000 890,392 1,772,740Vodafone Group Plc New 213,000 4,093,313 5,333,520Vulcan Materials CO 24,200 1,071,541 1,151,194W Coast Bancorp Ore 153,200 1,617,853 3,269,288Wa Mut Inc 373,350 11,441,712 14,978,802Wachovia Corp 2nd 512,600 19,258,094 23,882,034Waddell & Reed Finl Inc 123,300 2,397,249 2,892,618Walgreen CO 594,225 20,323,038 21,617,906Wal-Mart Stores Inc 1,332,950 70,555,939 70,712,998Waste Connections Inc 43,900 1,168,629 1,658,103Waste Mgmt Inc Del 141,200 2,554,358 4,179,520Waters Corp 128,025 3,703,524 4,245,309Watson Pharmaceuticals Inc 137,100 4,890,685 6,306,600WCI Cmntys Inc 50,700 1,040,976 1,044,927Webex Inc 79,700 1,362,940 1,601,970Webster Fncl Corp Waterbury Conn 56,600 2,034,653 2,595,676Weight Watchers Intl Inc 215,600 8,999,238 8,272,572Wellpoint Hlth Networks Inc 71,000 4,239,814 6,886,290Wells Fargo & CO 479,800 21,828,927 28,255,422Wendy S Intl Inc 27,000 704,793 1,059,480West Corp 170,000 3,260,945 3,949,100Westn Digital Corp 272,700 1,970,089 3,215,133Westport Res Corp 182,150 3,306,540 5,438,999Weyerhaeuser CO 52,200 3,006,149 3,340,800Whirlpool Corp 74,200 4,198,528 5,390,630Williams Co Inc 123,500 4,237,726 1,212,770Williams Sonoma Inc 207,800 1,706,193 7,225,206Wilson Greatbatch Technologies Inc 77,100 1,685,065 3,259,017Wind Riv Sys Inc 109,100 1,783,426 955,716Winn-Dixie Stores Inc 33,600 481,805 334,320Winnebago Inds Inc 19,400 750,300 1,333,750Wireless Facs Inc 13,272 244,736 197,222Woodhead Inds Inc 100,000 1,551,029 1,690,000Worthington Inds Inc 20,500 280,898 369,615Wrigley Wm Jr CO 33,700 1,711,386 1,894,277Wyeth 224,800 11,587,605 9,542,760
47

Illinois Municipal Retirement FundInvestment Portfolio as of December 31, 2003
Asset description Shares Cost Value Market Value
EQUITIESU.S. SecuritiesCommon Stock
Xcel Energy Inc 95,015 2,168,226 1,613,355Xerox Corp 539,800 6,147,018 7,449,240Xilinx Inc 124,400 4,471,616 4,819,256XTO Energy Inc 192,450 3,830,240 5,446,335Yahoo Inc 410,300 13,842,162 18,533,251Yukos ADR 24,200 1,091,476 1,016,400Yukos Corp 110,600 5,614,018 4,711,560Yum Brands Inc 309,600 9,811,059 10,650,240Zebra Technologies Corp 40,462 1,341,427 2,685,463Zimmer Hldgs Inc 93,720 4,639,560 6,597,888Zions Bancorp 21,400 1,216,110 1,312,462
Total U.S. Common Stock 4,539,230,647$ 5,099,401,645 Less Estimated Diposition Costs (15,298,205) Total Fair Value 5,084,103,440$
Convertible & Preferred Securities
Adelphia Communications Corp Conv Sub Nt6 02-15-2006/04 Beo Defaulted1,765,000 1,071,672 781,013Alamosa Hldgs Inc Pfd Conv 2,488 304,133 858,208Amern Annuity Group Cap Tr II Cap Tr Pfdsecs 2,043 2,191,415 1,736,550At Home Corp Bd In Default 150,000 - 12,000At Home Corp In Default Sub 7,830,000 3,706,990 1,096,200Atmel Corp Sub 3,370,000 1,214,600 1,441,215Ciena Corp 1,235,000 871,853 1,130,766Cin Bell Inc New Depos Sh Repstg Pfd 1,600 47,053 65,600Cnet Inc Sub 2,270,000 1,263,897 2,184,875Companhia De Bebidas Das Amers ADR 74,300 1,506,295 1,895,393El Paso Corp Zero Cpn Conv 530,000 220,129 243,524Fresenius Med Care Cap Tr II Gtd Tr Pfd Secs 770 679,761 823,900Fresenius Med Care Cap Tr II Gtd Tr Pfd Secs 120 126,450 128,400Liberty Media Corp Sr Exchangeable 60,000 29,100 39,131Lincare Hldgs Inc Sr 775,000 778,456 778,168Loews Corp Sub Nt 1,450,000 1,263,250 1,401,063LSI Logic Corp Sub 1,710,000 1,442,768 1,675,287News Corp Ltd 192,700 4,927,815 5,829,175Ntl Europe 10 Pfd 58 3,761 435Paxon Communications (fractional Shares) 13,750 - 13Paxson Communications Corp 32 236,875 296,800Pfd Ziff Davis Holdings 60,000 - -PMA Cap Corp Sr 635,000 470,638 481,806Premiere Technologies Inc Sub 456,000 389,681 453,720Providian Finl Corp Conv Sr Nt 1,220,000 852,475 1,155,950Pvtpl Delta Air Lines Inc Del Sr 620,000 617,855 559,525Pvtpl Home Own Fdg Corp II Pfd Step Down 280 186,178 140,700
48

Illinois Municipal Retirement FundInvestment Portfolio as of December 31, 2003
Asset description Shares Cost Value Market Value
EQUITIESU.S. SecuritiesConvertible & Preferred Securities
Pvtpl Home Own Fdg Corp Pfd Step Down 400 265,852 200,325Pvtpl Lincare Hldgs Inc Sr 375,000 376,848 373,594Pvtpl Neon Communications Inc 20,101 226,142 226,136Pvtpl Riverstone Networks Inc Conv 144a 1,115,000 787,988 1,064,825Pvtpl Sovereign Real Estate Invt Tr 2,435 2,175,738 3,640,325Pvtpl Spanish Broadcasting Sys Inc Pfd 790 794,700 823,575Qwestdex Bk Debt-term 223,593 208,795 223,221Tele Norte Leste Participacoes ADR 678,593 9,545,508 10,470,690Telecomunicacoes Brasileiras ADR 58,600 2,802,169 1,981,852Vertex Pharmaceuticals Inc Sub 1,340,000 1,022,866 1,189,250Ziff Davis Hldgs Inc Pfd 393 2,288 8,646
Total Convertible and Preferred Securities 42,611,994$ 45,411,856 Less Estimated Disposition Costs (136,236) Total Fair Value 45,275,620$
Rights and Warrants
Amern Banknote Corp 1,341 - 1Amern Banknote Corp 1,341 - 1ICO Global Communications Hldgs Ltd Del $60 Wt Exp 23,601 3,718 118Neon Communications Inc Wt Pur Pfd Exp 184,460 36,987 1,845Ntl Inc Del Wt 22,516 2,639,132 219,531Ntl Inc New Rt 24,383 544,004 1Pegasus Communications Corp Wt Exp 1,291 - 1Pvtpl Acp Hldg Co Wt Exp 144a 474,112 1,876 237,056Pvtpl Barneys Inc Wt Exp 910 - 27,300Pvtpl Exide Wt 1,758 - 1Pvtpl Neon Communications Inc Pfd Wt Exp 120,645 443,759 -Pvtpl Neon Communications Inc Wt Exp 100,544 370,317 125,680Pvtpl Quadramed Corp Wt 144a Exp 167,966 3,478 443,430Pvtpl Ziff Davis Hldgs Inc Wt Exp 72,160 420,434 -
Total Rights and Warrants 4,463,705$ 1,054,965 Less Estimated Disposition Costs (3,165) Total Fair Value 1,051,800$
49

Illinois Municipal Retirement FundInvestment Portfolio as of December 31, 2003
Asset description Shares Cost Value Market Value
EQUITIESU.S. SecuritiesU.S. Stock Funds
DFA Small Cap Value Fund 235,779 119,686,230 165,655,961DFA U.S Micro Cap Fund 61,172 93,966,401 135,071,292Fidelity Small Co Growth Fund 2,190,414 87,541,170 311,498,832NTI US Marketcap Equity Index 53,396,340 1,459,781,125 1,184,704,595
Total U.S. Stock Funds 1,760,974,926$ 1,796,930,680 Less Estimated Disposition Costs (5,390,792) Total Fair Value 1,791,539,888$
Total U.S. Equities 6,347,281,272$ 6,921,970,748$
International SecuritiesAustralia
Macquarie Bank 159,100 2,227,898 4,262,716Natl Australia Bk 132,382 1,285,188 2,987,309News Corporation 1,088,472 8,178,892 9,833,110Perpetual Tst Aust 40,100 1,240,868 1,287,088Sigma Company Ltd 230,300 1,006,436 1,216,372Toll Hldgs 499,700 2,203,244 3,106,116Virgin Blue Hldgs 918,300 1,688,949 1,646,706Westpac Bkg Corp 249,032 1,729,864 3,000,254Wmc Resources Ltd 490,800 1,882,169 2,081,936
Austria
Erste Bank Der Ost 46,320 3,098,403 5,723,969
Belgium
Interbrew 586,600 13,444,189 15,656,451
Bermuda
Accenture Ltd Bermuda Cls A 171,000 3,916,732 4,500,720Cooper Ind Inc 21,900 911,882 1,268,667Esprit Holdings 2,225,000 6,670,025 7,408,451Ingersoll-Rand CO 40,800 1,731,656 2,769,504Jardine Matheson 1,316,771 7,759,188 11,949,697Johnson Elec Hldgs 1,071,000 1,500,340 1,365,720Li & Fung 3,500,300 4,487,579 5,996,444
50
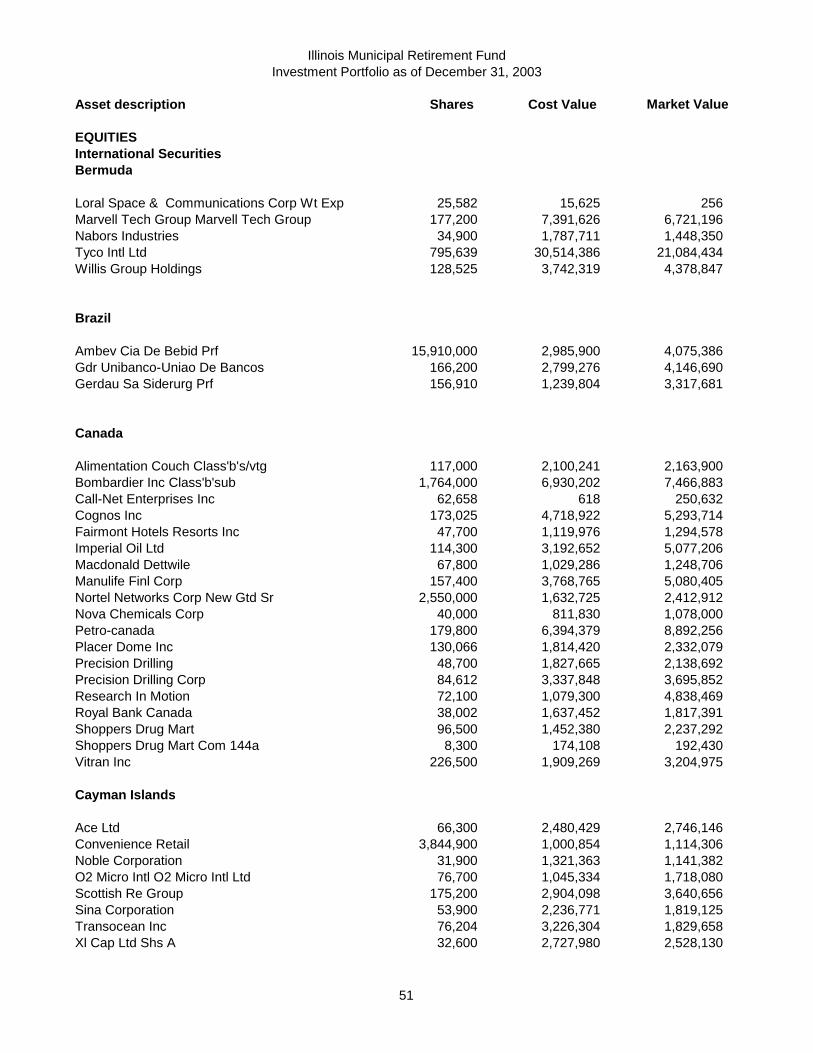
Illinois Municipal Retirement FundInvestment Portfolio as of December 31, 2003
Asset description Shares Cost Value Market Value
EQUITIESInternational SecuritiesBermuda
Loral Space & Communications Corp Wt Exp 25,582 15,625 256Marvell Tech Group Marvell Tech Group 177,200 7,391,626 6,721,196Nabors Industries 34,900 1,787,711 1,448,350Tyco Intl Ltd 795,639 30,514,386 21,084,434Willis Group Holdings 128,525 3,742,319 4,378,847
Brazil
Ambev Cia De Bebid Prf 15,910,000 2,985,900 4,075,386Gdr Unibanco-Uniao De Bancos 166,200 2,799,276 4,146,690Gerdau Sa Siderurg Prf 156,910 1,239,804 3,317,681
Canada
Alimentation Couch Class'b's/vtg 117,000 2,100,241 2,163,900Bombardier Inc Class'b'sub 1,764,000 6,930,202 7,466,883Call-Net Enterprises Inc 62,658 618 250,632Cognos Inc 173,025 4,718,922 5,293,714Fairmont Hotels Resorts Inc 47,700 1,119,976 1,294,578Imperial Oil Ltd 114,300 3,192,652 5,077,206Macdonald Dettwile 67,800 1,029,286 1,248,706Manulife Finl Corp 157,400 3,768,765 5,080,405Nortel Networks Corp New Gtd Sr 2,550,000 1,632,725 2,412,912Nova Chemicals Corp 40,000 811,830 1,078,000Petro-canada 179,800 6,394,379 8,892,256Placer Dome Inc 130,066 1,814,420 2,332,079Precision Drilling 48,700 1,827,665 2,138,692Precision Drilling Corp 84,612 3,337,848 3,695,852Research In Motion 72,100 1,079,300 4,838,469Royal Bank Canada 38,002 1,637,452 1,817,391Shoppers Drug Mart 96,500 1,452,380 2,237,292Shoppers Drug Mart Com 144a 8,300 174,108 192,430Vitran Inc 226,500 1,909,269 3,204,975
Cayman Islands
Ace Ltd 66,300 2,480,429 2,746,146Convenience Retail 3,844,900 1,000,854 1,114,306Noble Corporation 31,900 1,321,363 1,141,382O2 Micro Intl O2 Micro Intl Ltd 76,700 1,045,334 1,718,080Scottish Re Group 175,200 2,904,098 3,640,656Sina Corporation 53,900 2,236,771 1,819,125Transocean Inc 76,204 3,226,304 1,829,658Xl Cap Ltd Shs A 32,600 2,727,980 2,528,130
51

Illinois Municipal Retirement FundInvestment Portfolio as of December 31, 2003
Asset description Shares Cost Value Market Value
EQUITIESInternational SecuritiesChina
China Life Insuran 'h'cny 4,489,000 2,394,759 3,671,641China Oilfield 3,250,000 844,044 1,151,206Huaneng Power Intl 'h' Cny 2,174,000 1,959,300 3,766,333Sinopec Corp 'h'cny 10,832,000 3,103,460 4,848,421
Denmark
A.P Moller-Maersk Ser'b'dkk 631 4,220,196 4,553,603
Estonia
Hansapank Eek 49,100 1,253,511 1,325,351
Finland
Nokia Oyj 305,162 5,564,346 5,277,199Nokian Renkaat Oyj E 26,000 1,661,133 1,964,426
France
Alcatel E 905,100 23,113,788 11,656,224Aventis Sa E 148,944 7,347,392 9,844,415Axa 0% 21/12/04 E 13,801 205,243 278,352Axa E 509,730 11,279,136 10,910,826Bonduelle E 17,600 1,121,848 1,608,373Christian Dior E 136,200 4,719,340 8,251,355Credit Agricole Sa E 119,400 2,760,073 2,850,956France Telecom E 111,283 2,712,869 3,180,712Groupe Danone E 15,500 2,228,243 2,529,890Klepierre E 33,600 1,312,750 2,021,591Lafarge E 200,582 13,872,258 17,862,089Michelin (cgde) E 214,000 8,265,897 9,820,013Nexans E 96,600 2,195,455 3,230,148Orpea E 82,000 1,326,645 1,727,293Renault(regie Ntl E 130,300 5,952,184 8,990,158Rodriguez Group 22,800 827,087 1,274,014Total Sa E 81,008 9,061,092 15,061,249
52

Illinois Municipal Retirement FundInvestment Portfolio as of December 31, 2003
Asset description Shares Cost Value Market Value
EQUITIESInternational SecuritiesGermany
Bayer Ag 119,586 5,154,754 3,502,500Bayer Hypo-vereins 533,823 10,591,125 12,349,012Bayer Motoren Werk E 293,967 10,307,420 13,626,726Daimlerchrysler Ag 273,500 8,799,673 12,764,231Deutsche Bank Ag 116,218 7,206,012 9,631,066Deutsche Telekom 798,170 17,767,225 14,608,257E.On Ag 483,005 24,982,471 31,521,991Hypo Real Estate 133,455 2,126,352 3,331,319Metro Ag 65,700 2,723,885 2,896,331Puma Ag 18,000 1,042,640 3,178,602Sap Ag 53,200 4,611,074 8,934,873Siemens Ag 146,900 8,871,624 11,766,061Stada Arzneimittel 48,625 2,267,038 3,016,364T-Online Intl 273,252 2,902,154 3,550,064Volkswagen Ag 228,100 8,817,107 12,702,570
Greece
Coca-Cola Hell Bot 178,300 2,320,855 3,715,326Folli Follie 75,000 1,173,311 2,111,500
Hong Kong
Cheung Kong(hldgs) 480,000 4,660,898 3,817,816China Insurance In 1,722,000 985,695 876,127Denway Motors Ltd 1,644,000 745,665 1,746,999Henderson Land Dev 678,000 2,910,980 2,995,440Sun Hung Kai Prop 696,000 6,155,552 5,759,957Swire Pacific 'a' 2,298,231 11,144,182 14,179,667Techtronic Industr 1,179,170 1,122,733 3,273,110
India
Dr Reddys Labs Inr 62,000 1,162,913 1,942,010Hdfc Bank Inr10(demat T5) 239,000 1,246,207 1,912,524Housing Devel Fin Inr 203,800 1,332,023 2,883,575Infosys Technologi Inr 37,688 2,887,386 4,596,656Ing Vysya Bank Ltd Inr 96,000 940,722 1,159,049Mphasis Bfl Ltd Inr 120,000 887,551 1,998,904
53

Illinois Municipal Retirement FundInvestment Portfolio as of December 31, 2003
Asset description Shares Cost Value Market Value
EQUITIESInternational SecuritiesIndonesia
Bk Central Asia Idr 6,050,500 2,252,484 2,388,592Telekomunikasi Ind Ser'b'idr 6,991,000 3,895,388 5,602,760Unilever Indonesia Idr 3,950,000 810,035 1,700,059
Ireland
Anglo Irish Bank 258,000 1,608,996 4,071,108CRH 161,252 2,170,699 3,305,469Grafton Group Uts( 187,200 1,185,251 1,291,602
Israel
Radware Ltd 64,600 1,050,280 1,760,350
Italy
Banco Populare Di 250,800 3,951,927 4,245,371Bca Intesa 3,736,502 9,803,618 14,610,413Eni E 454,761 5,614,531 8,581,247Merloni Elettrodom 146,400 1,613,406 2,760,691Pirelli &C Real E 45,300 1,351,227 1,439,335Sanpaolo Imi Spa E 270,000 3,300,894 3,521,437Telecom Italia 6,309,071 15,583,335 18,701,174
Japan
Acom CO 32,630 3,048,155 1,479,722Advantest 34,200 2,757,372 2,712,513Askul Corp 42,200 1,136,543 2,071,214Calsonic Kansei 317,000 2,057,087 2,505,356Canon Inc 531,600 19,416,451 24,752,113Cawachi Limited 17,000 1,183,657 1,134,179Chiyoda Corp 326,000 1,511,954 2,001,568Daiichi Pharm CO 433,000 6,071,585 7,801,838Fanuc 211,600 11,310,008 12,675,861Funai Electric CO 14,700 1,863,668 2,017,701Hino Motors 604,300 3,146,219 4,307,971Hitachi 3,336,000 19,320,738 20,108,762Hitachi Cons Machi 220,000 2,380,144 3,331,716Honda Motor CO 189,400 7,219,034 8,412,280Hoya Corp 108,800 7,083,403 9,989,661Ito-Yokado CO 95,000 3,675,933 2,987,310
54

Illinois Municipal Retirement FundInvestment Portfolio as of December 31, 2003
Asset description Shares Cost Value Market Value
EQUITIESInternational SecuritiesJapan
Jafco 20,300 1,310,567 1,594,905Japan Tobacco Inc 1,052 7,284,222 7,705,701Jsr Corp 85,000 1,431,811 1,899,552Kappa Create CO 19,900 1,224,098 1,680,461Keyence Corp 27,200 4,508,831 5,733,396Komatsu 950,000 4,899,697 6,027,806Komeri CO 51,900 1,396,710 1,201,008Matsushita Elc Ind 1,277,000 16,954,004 17,658,990Millea Holdings In 969 10,531,845 12,658,393Misumi Corporation 36,500 1,198,970 1,621,163Mitsubishi Est CO 652,000 6,048,473 6,181,133Mitsubishi Hvy Ind 2,867,000 11,736,516 7,972,063Mitsubishi Tokyo F 3,004 27,271,940 23,433,274Mitsui Sumitomo In 968,000 7,841,161 7,948,493Mizuho Finl Gp 1,327 1,604,269 4,024,214Nakanishi Inc 21,000 882,423 910,189Nippon Oil Corp 1,118,000 4,404,489 5,695,885Nippon Tel&Tel Cp 4,491 23,818,931 21,665,084Nissan Motor CO 498,800 3,735,438 5,696,848Nitori CO 28,500 1,443,621 1,773,771Nitto Denko Corp 149,800 5,328,753 7,967,342Nomura Holdings 972,000 12,575,172 16,552,207Ntt Docomo 679 464,366 1,539,582Oki Electric Ind 739,000 2,384,690 2,889,251Olympus Corp 255,000 5,509,743 5,532,099Ono Pharmaceutical 92,000 3,030,382 3,459,550Oracle Corp Japan 54,800 2,434,278 2,837,921Orix Corp 53,100 3,881,026 4,389,904Pasona Inc 218 1,089,107 1,448,316Pioneer Corp 145,600 3,105,757 4,021,424Point Inc 6,500 151,035 168,004Ricoh CO 121,000 2,188,958 2,387,935Rohm CO 22,800 3,414,083 2,672,091Sankyo Company Ltd 674,900 9,565,553 12,689,405Sawai Pharm Co Ltd 34,100 1,285,572 1,190,016Seiko Epson Corp 111,500 4,103,439 5,202,015Seiyu 522,000 1,774,752 1,768,088Sharp Corp 342,300 3,550,503 5,401,039Shin-Etsu Chem CO 147,500 5,377,055 6,028,273Shionogi & CO 96,000 1,705,852 1,787,963SMC Corp 44,200 4,506,265 5,501,801Softbank Corp 125,200 4,417,781 3,831,819Sompo Japan Insurance Inc 622,000 4,097,470 5,113,203Sparx Asset Mgt CO 13 147,323 162,545Stanley Electric 195,400 3,387,842 3,783,288Sumitomo Mitsui Gr 4,106 14,270,966 21,876,701
55

Illinois Municipal Retirement FundInvestment Portfolio as of December 31, 2003
Asset description Shares Cost Value Market Value
EQUITIESInternational SecuritiesJapan
Sumitomo Tst&bank 1,176,000 4,613,769 6,913,129Suzuki Motor Corp 385,600 5,392,053 5,706,463Takeda Chemical In 87,900 2,836,655 3,485,817TDK Corp 140,400 6,813,629 10,113,726Ufj Holdings 1,087 2,978,170 5,223,523USS Co Ltd 29,000 1,247,883 2,051,134Yamada Denki 85,900 2,164,813 2,885,509Yaskawa Elec Corp 424,000 1,900,275 2,789,213
Mexico
Gf Bbva Bancomer Ser'b'npv 2,972,700 2,329,999 2,539,582Wal-Mart De Mexico Ser'c'npv 1,249,500 2,791,350 3,362,467
Netherlands
Abn-Amro Hldgs Nv 833,322 13,935,012 19,498,103Aegon Nv 249,400 3,135,741 3,690,031Ahold(kon)nv 1,622,141 14,977,922 12,358,368Akzo Nobel Nv E 422,800 13,657,659 16,318,942Asml Hldg 256,765 3,463,667 5,091,245Core Lab Nv N 111,800 2,262,283 1,865,942Eads(euro Aero Def E 337,000 4,033,709 8,012,662Heineken Nv E 48,081 2,003,213 1,830,932Ing Groep Nv Cva 985,052 16,802,800 22,973,738James Hardie Comstk 199,302 915,494 1,033,129Philips Elec(kon) 635,809 17,604,402 18,565,782Qiagen Nv 175,500 2,333,429 2,153,900Reed Elsevier Nv 286,592 3,546,472 3,560,704Tpg Nv 105,965 1,491,433 2,482,047Unilever Nv Cva N 171,400 9,986,066 11,209,730Vnu Nv 58,691 2,474,412 1,854,449Wolters Kluwer Cva 435,100 5,613,352 6,805,286Schlumberger Ltd 87,800 4,150,411 4,804,416
New Zealand
Telecom Corp of Nz 2,759,078 9,742,271 9,727,608
Norway
Petroleum Geo Svs Nok 20,054 598,161 783,736
56

Illinois Municipal Retirement FundInvestment Portfolio as of December 31, 2003
Asset description Shares Cost Value Market Value
EQUITIESInternational SecuritiesPanama
Carnival Corp Com Paired 227,300 7,238,052 9,030,629
Poland
Bk Pekao Pln 90,500 2,467,308 2,611,344
Portugal
Portugal Tcom Sgps E 664,922 6,520,387 6,692,821
Singapore
Dbs Group Hldgs Sgd 990,457 7,641,313 8,573,113Flextronics Intl Ltd 477,000 6,971,473 7,078,680Hyflux Sgd 1,131,250 696,531 1,059,111O/Seas Chinese Bk Sgd 690,000 4,369,650 4,916,093Osim International Sgd 1,071,000 715,834 744,144Singapore Airlines Sgd0.50(1000 Board 336,000 2,074,817 2,215,863Unisteel Technolog Sgd 1,649,000 449,822 1,233,133Utd O/S Bank Sgd 268,000 2,105,749 2,083,024Venture Corp Ltd Sgd 724,600 6,689,494 8,533,239
South Africa
Edgars Consd Store Zar 92,700 1,108,593 1,770,674Mtn Group Ltd Zar 850,000 1,509,845 3,622,846Network Healthcare Zar 2,542,700 722,329 1,927,500
South Korea
Daewoo Heavy I & M 765,030 5,033,040 6,266,633Kookmin Bank 73,300 2,629,167 2,746,828Korea Deposit Insu 813,000 816,066 917,755Korea Elec Power 273,862 6,044,430 4,918,713Kt Corporation 53,920 2,193,473 2,018,323Nhn Corp 14,770 2,280,272 1,713,146Posco 25,128 3,079,269 3,437,569Samsung Electronic 47,523 14,013,565 17,988,144Samsung Electronic Gdr Rep 35,317 5,790,543 6,639,596
57

Illinois Municipal Retirement FundInvestment Portfolio as of December 31, 2003
Asset description Shares Cost Value Market Value
EQUITIESInternational SecuritiesSpain
Bbva(bilb-viz-arg) 1,281,485 11,547,268 17,699,591Bco Popular Esp 50,300 2,086,290 3,000,991Bco Sant Cent Hisp 945,213 7,029,254 11,195,175Grupo Ferrovial Sa E 65,000 1,573,479 2,277,620Prosegur Seguridad 82,400 1,227,637 1,340,765Repsol Ypf Sa E 792,721 12,552,388 15,458,432Telefonica Sa E 1,493,274 18,154,892 21,924,418
Sweden
Atlas Copco Ab Ser'a'sek 203,500 5,978,476 7,282,705Ericsson(lm)tel Sek1 Ser'b' 1,013,100 1,129,225 1,816,323Gunnebo Ab Sek 89,000 1,041,360 2,220,269Modern Times Group Sek5'b' 11,300 185,446 237,926Skf Ser'b'sek 54,500 1,744,969 2,105,680
Switzerland
Actelion 13,000 1,265,922 1,403,275Adecco SA 246,250 12,169,448 15,829,290Alcon Inc 56,300 3,001,655 3,408,402Credit Suisse Grp 160,700 4,699,176 5,879,664Logitech Intl 53,700 1,880,214 2,322,984Micronas Semicondu 31,883 1,331,659 1,365,033Nestle SA 162,053 29,577,522 40,488,682Novartis Ag 190,470 4,416,156 8,647,577Roche Hldgs Ag Genusscheine 110,631 8,846,896 11,159,262Swiss Reinsurance 107,958 6,327,103 7,288,856Swisscom Ag 13,000 3,113,987 4,288,660UBS Ag 321,547 16,362,688 22,021,452Zurich Fin Svs Grp 140,703 31,354,029 20,250,765
Taiwan
Compal Electronic Gdr-repr 514,320 3,797,941 3,574,524
Thailand
Bangkok Bank Thb 498,000 941,770 1,369,979Bangkok Bank Thb10 300,700 671,935 872,749Land & Houses Thb1 9,385,600 2,268,940 3,008,319Siam Cement Co Thb1 1,368,597 6,004,848 9,533,290Tisco Finance Thb10 1,122,800 932,695 928,051
58

Illinois Municipal Retirement FundInvestment Portfolio as of December 31, 2003
Asset description Shares Cost Value Market Value
EQUITIESInternational SecuritiesTurkey
Enka Insaat Trl 79,724,013 1,285,800 2,071,122
United Kingdom
3I Group 315,200 2,927,018 3,484,276Abbey National 1,131,100 9,707,966 10,751,893Acambis 306,500 1,273,140 1,673,477Bae Systems 3,875,300 17,938,867 11,672,122Barclays 1,114,576 5,089,951 9,941,374BG Group 1,499,000 6,159,556 7,694,750Bhp Billiton Plc 766,457 4,585,938 6,695,716Brit Amer Tobacco 689,601 5,066,715 9,505,567British Sky Broadc 652,800 6,673,407 8,215,328BT Group 2,715,518 19,915,020 9,151,180Cadbury Schweppes 517,505 2,548,899 3,800,604Cambridge Antibody 109,000 989,364 919,045Capita Group 707,900 3,016,913 3,079,411Cattles 371,500 1,778,622 2,222,899Centrica 645,263 1,876,393 2,437,298Colt Telecom Group 2% Cnv Bds 3/4/07 Eur'144a 2,285,000 1,632,929 3,147,105Colt Telecom Group Plc Nt 625,000 365,445 831,703Compass Group 565,819 3,769,288 3,849,023Corus Group 13,832,258 10,168,016 7,428,545Diageo 431,754 4,146,951 5,680,848Enterprise Inns 119,200 1,062,282 2,163,733French Connection 189,500 1,228,844 1,122,015Friends Provident 1,655,810 4,220,439 3,912,676Galen Hldgs 164,100 2,063,456 2,100,410Glaxosmithkline 828,337 17,108,190 18,980,448Hbos 335,700 3,848,029 4,347,898Hsbc Hldgs 1,485,470 19,424,524 23,380,336Imperial Chem Inds 715,090 5,735,483 2,547,436Invensys 4,260,922 18,414,433 1,392,053Kingfisher 1,329,868 5,623,780 6,630,147Lloyds Tsb Group 899,550 7,236,305 7,214,276Man Group 243,300 4,576,511 6,363,291Marks & Spencer Gp 2,247,121 12,198,591 11,625,556Mfi Furniture Grp 557,500 1,588,185 1,506,993Michael Page Intl 864,200 2,316,757 2,877,509MMO 2,168,660 4,224,838 2,989,315Premier Farnell 230,700 1,034,617 967,423Prudential Plc 5p 441,951 3,746,863 3,736,246Pvtpl Ono Fin Plc Eqty Value Ctf Repstg Rt to Receive 2,675 31 3Pvtpl Ono Fin Plc Rt Exp 150 9,000 1Reckitt Benckiser 234,200 4,045,653 5,299,360
59

Illinois Municipal Retirement FundInvestment Portfolio as of December 31, 2003
Asset description Shares Cost Value Market Value
EQUITIESInternational SecuritiesUnited Kingdom
Reed Elsevier 200,113 1,638,061 1,673,840Reuters Group 1,884,600 10,560,516 7,928,234Rio Tinto Plc 98,800 2,003,342 2,729,055Sabmiller Plc 1,769,145 12,338,790 18,337,132Safeway Plc 782,500 3,420,689 3,978,250Sainsbury(j) 2,343,400 10,329,334 13,119,980Shell Trnspt&trdg 977,055 6,196,565 7,267,407Smith & Nephew 793,440 5,348,906 6,665,117Smiths Group 114,795 1,893,313 1,358,357Standard Chartered 874,500 11,221,057 14,441,610Tesco 4,826,825 17,177,789 22,271,510Ti Automotive 'a'shares 282,800 - -Travis Perkins 31,454 668,809 719,608Unilever Plc 852,860 7,074,980 7,950,537Vodafone Group 6,409,343 9,932,150 15,891,054Wolseley 294,742 3,044,513 4,168,296Wpp Group 531,531 5,313,978 5,219,088
Total International Equity Securities 1,646,072,953$ 1,917,806,303 Less Estimated Disposition Costs (8,630,128) Total Fair Value 1,909,176,175$
International Stock Funds
Schroder Small Company Fund 62,101 87,367,498 199,182,729MFO Emerging Mkts Growth Fd Inc Inc 3,021,200 147,289,463 184,565,135NTI EAFE Equity Index 34,896,412 376,536,870 312,741,624
Total International Stock Funds 611,193,831$ 696,489,488 Less Estimated Disposition Costs (3,134,203) Total Fair Value 693,355,285$
Total International Equities 2,257,266,784$ 2,602,531,460$
Total Equities 8,604,548,056$ 9,524,502,208$
60

Asset descriptionMaturity
date Par Value Cost Value Market Value
SHORT TERM INVESTMENTSCommercial Paper
Kraft Foods Inc 2/26/2004 1560000 1,560,000$ 1,557,435$
Short Term Investment Funds
Northern Trust Custom Cash Fund 442,298,302 442,298,302Northern Trust London 234,400,768 234,400,768
Total Short Term Investment Funds 676,699,070$ 676,699,070$
Foreign Exchange Forward ContractsPurchases
Euro 0 21,192,381 21,807,556Swedish Krona 0 164,760 167,842United States Dollar 0 54,014,703 54,014,703
Total Purchases 75,371,844$ 75,990,101$
Sales
British Pound Sterling 0 (593,005) (596,939)Euro 0 (50,357,921) (54,249,617)Hong Kong Dollar 0 (602,699) (602,729)Japanese Yen 0 (371,983) (371,485)South African Rand 0 (33,771) (34,302)Swedish Krona 0 (2,055,325) (2,211,088)United States Dollar 0 (21,357,141) (21,357,141)
Total Sales (75,371,845)$ (79,423,301)$
Net Unrealized Gain/(Loss) (1)$ (3,433,200)$
Options
10 Yr T-Notes 115 Call Opt 02/21/2004 20 12,288 10,000Opf 5yr US T-Nt Call Opt Mar 02/20/2004 (9) (3,752) (15,187)Opf Call Mar 04 U.S T-bonds 02/20/2004 (45) (47,750) (11,953)Opf Put Mar 04 T-Note Opt 02/20/2004 252 (294,520) (173,250)Opf US T-Bd Call Opt Mar 02/20/2004 (486) (500,296) (361,594)Opt Put Mar 04 Euro Dollars 03/15/2004 117 157,223 212,063Otc Lehman Aaa Cmbs Call Opt W/Stk $08/01/2004 2400 240,000 114,060Otc Lehman Aaa Cmbs Put Opt W/Strk $08/01/2004 -2400 (240,000) (24,000)

Asset descriptionMaturity
date Par Value Cost Value Market Value
SHORT TERM INVESTMENTSOtc Swaption Put @ 09/03/2004 -37500000 (393,750) (123,900)US T-Nt Put Opt Mar 02/20/2004 (37) (27,409) (25,437)
Total Options (1,097,966)$ (399,198)$
Swaps
Swaps (221,584)$ (529,462)$
Total Short Term Investments 676,939,519$ 673,894,645$

Asset description Cost Value Market Value
REAL ESTATECommingled Funds
Lazard Freres Strategic Realty Fund II 34,320,843 27,851,460Morgan Stanley Select Properties I 124,659 94,922Olympus Real Estate Fund II 29,568,870 29,568,870Prudential Strategic Value Investors 9,594,243 13,057,423Security Capital Preferred 75,000,000 106,552,208Sentinel Real Estate Fund 98,797,810 108,118,780
Total Commingled Funds 247,406,425$ 285,243,663$
Timberland
Forest Investment 22,561,611$ 61,263,014$
Farm Land
Premiere Partners IV / Cozad 74,821,478$ 69,706,186$
Directly Owned
Buckhead Industrial Properties, Inc 80,870,517 111,157,491Drake Oak Brook Plaza 40,034,486 40,410,986Drake Oak Brook Hotel 25,740,039 18,770,301
Total Directly Owned 146,645,042$ 170,338,778$
Total Real Estate 491,434,556$ 586,551,641$

Asset description Cost Value Market Value
ALTERNATIVE INVESTMENTSCommingled Funds
Abbott Capital Management 349,938,851 226,069,433Adams Street Venture Partnership Acquisition Fund 1 265,602Aurora Limited Partnership 75,000,000 89,879,633Grosvenor Instl Ptrs 75,000,000 86,830,155Mesirow Multi Manager Fund 75,000,000 86,387,967Pantheon Ven Cap Investments 33,352,539 33,528,972Permira UK Venture III 244,605 202,967TCW Land Fund I 33,538 498,270
Total Commingled Funds 608,569,534$ 523,662,999 Less Estimated Disposition Costs (2,868,750) Total Fair Value 520,794,249$
Total Portfolio 16,056,156,425$ 16,843,692,916$

Illinois Municipal Retirement Fund
Oak Brook Springfield2211 York Road 3000 Professional DriveSuite 500 Suite 101Oak Brook, IL 60523-2337 Springfield, IL 62703
Member Service Representatives1-800-ASK-IMRF (1-800-275-4673)
www.imrf.org
Copyright © 2022 FDOKUMEN