Clustering with Normalized Cuts is Clustering with a Hyperplane
Upload
independentCategory
view
0download
0
S. N. Sulaiman and N. A. M. Isa: Adaptive Fuzzy-K-means Clustering Algorithm for Image Segmentation 26
Adaptive Fuzzy-K-means Clustering Algorithm for Image Segmentation
Siti Noraini Sulaiman and Nor Ashidi Mat Isa, Member, IEEE
Abstract — Clustering algorithms have successfully been applied as a digital image segmentation technique in various fields and applications. However, those clustering algorithms are only applicable for specific images such as medical images, microscopic images etc. In this paper, we present a new clustering algorithm called Adaptive Fuzzy-K-means (AFKM) clustering for image segmentation which could be applied on general images and/or specific images (i.e., medical and microscopic images), captured using different consumer electronic products namely, for example, the common digital cameras and CCD cameras. The algorithm employs the concepts of fuzziness and belongingness to provide a better and more adaptive clustering process as compared to several conventional clustering algorithms. Both qualitative and quantitative analyses favour the proposed AFKM algorithm in terms of providing a better segmentation performance for various types of images and various number of segmented regions. Based on the results obtained, the proposed algorithm gives better visual quality as compared to several other clustering methods.1.
Index Terms — Adaptive Fuzzy-K-means Clustering (AFKM), clustering, image segmentation, digital image processing.
I. INTRODUCTION
Clustering is a process of grouping a set of objects into classes of similar characteristics. It has been extensively used in many areas, including in the statistics [1], [2], machine learning [3]-[5], pattern recognition [6]-[8], data mining [9]-[14], and image processing [15], [16].
In digital image processing, segmentation is essential for image description and classification. The technique is commonly used by many consumer electronic products (i.e., conventional digital image) or in a specific application field such as the medical digital image. The algorithms are normally based on similarity and particularity, which can be divided into different categories; thresholding [17], template
1 This work was partially supported by Majlis Kanser Nasional (MAKNA), Kuala Lumpur, Malaysia, under the Grant “Development of an Intelligent Screening System for Cervical Cancer”.
Siti Noraini Sulaiman is a PhD student at Imaging and Intelligent System Research Team (ISRT), School of Electrical & Electronics Engineering, Universiti Sains Malaysia, Engineering Campus, Penang, Malaysia (e-mail: [email protected]).
Nor Ashidi Mat Isa is an Associate Professor, Imaging and Intelligent System Research Team (ISRT), School of Electrical & Electronics Engineering, Universiti Sains Malaysia, Engineering Campus, Penang, Malaysia (phone: +604 5996051; fax: +604 5941023; e-mail: [email protected]).
matching [18], [19], region growing [20], [21], edge detection [22], [23], and clustering [24].
Clustering algorithm has been applied as a digital image segmentation technique in various fields such as engineering, computer, and mathematics. Recently, the application of clustering algorithms has been further applied to the medical field, specifically in the biomedical image analysis wherein images are produced by medical imaging devices. Previous studies proved that clustering algorithms are capable in segmenting and determining certain regions of interest in medical images [25]-[32]. In a biomedical image segmentation task, clustering algorithm is often deemed suitable since the number of cluster for the structure of interest is usually known from its anatomical information [30].
Among the clustering formulations based on minimizing formal objective functions, the most widely used and studied is the K-means (KM) clustering. KM is an exclusive clustering algorithm, (i.e., data which belongs to a definite cluster could not be included in another cluster). Although it is the most favourable technique, it does have some weaknesses [13], [33]:
1. It is dependent on initialization. 2. It is sensitive to outliers and skewed distributions. 3. It may converge to a local minimum. 4. It may miss a small cluster.
As a result, it may lead to poor or wrong representation of data.
There are several clustering algorithms proposed to overcome the aforementioned weaknesses. Fuzzy C-means (FCM), an overlapping clustering that employs yet another fuzzy concept, allows each data to belong to two or more clusters at different degrees of memberships. In the FCM, there is no clear, significant boundary between the elements if they do, or do not belong to a certain class. In 2002, [34] successfully proposed a modified version of K-means clustering, namely, Moving K-Means (MKM) clustering. The study proved that MKM possesses a great ability in overcoming common problems in clustering, such as dead centres and centre redundancy. Furthermore, the MKM was proven to be effective in avoiding the centre from being trapped in local minima. A number of studies have also provided evidence that the MKM produced better performance as compared to the conventional KM and FCM [26], [27].
In this paper, we introduce a new version of clustering algorithm called Adaptive Fuzzy-K-means (AFKM) clustering algorithm. As mentioned, clustering is the process of organizing objects into groups wherein members are similar on certain aspects. In most clustering models, the concept of similarity is based on distances, such as the Euclidean distance. Agarwal and Mustaffa claimed that simply looking at
Contributed PaperManuscript received 10/08/10Current version published 12/23/10 Electronic version published 12/30/10. 0098 3063/10/$20.00 © 2010 IEEE

IEEE Transactions on Consumer Electronics, Vol. 56, No. 4, November 2010 26
the Euclidean distance between two points was not sufficient [33]. Therefore, in the proposed algorithm, we establish the fuzzy concept to be applied right after the member is assigned to its respective centre via Euclidean distance. Next, we introduce the concept of belongingness to measure the relationship between the centre and to ensure that its membership meets certain criteria. The degree of membership is updated based on its degree of belongingness. Hence, the positions of the centres are recalculated based upon the updated membership function. These features are introduced in order to provide a better and more adaptive clustering process.
This paper is organized as follow: Section II describes in detail the proposed AFKM clustering algorithm. Section III presents the data used and also discusses the type of analyses applied to test the capability of the proposed algorithm. Section IV presents the segmentation results obtained by the proposed algorithm. In addition, a comparison of performance comparison with several selected conventional clustering algorithms is also presented. The comparison is done based on both qualitative and quantitative analyses. Finally, Section V concludes the work focused on of this paper
II. THE PROPOSED CLUSTERING ALGORITHM
As mentioned, the KM clustering is the most widely used clustering algorithm due to its simplicity. The objective of the algorithm is to minimize an objective function in order to assign a group of data to its centre. However, the performance of KM is still limited due to the weaknesses it displays, as indicated in Section I. Thus, the MKM introduced a fitness concept together with the basic concept of KM to improve the segmentation performance. The FCM is also introduced to overcome the KM weaknesses by incorporating fuzzy concept in its implementation.
In this section a new version of clustering algorithm namely AFKM is introduced. The proposed AFKM is specifically design to incorporate both the fundamental theories of the conventional K-means and MKM clustering algorithms (i.e., assigning each data to its closest centre or cluster) and the conventional Fuzzy C-means (FCM) clustering algorithm (i.e., allows the data to belong to two or more clusters or centres).
For details on the implementation of the proposed AFKM, consider a digital image with R×S pixels (i.e., R represents number of columns and S represents number of rows) to be clustered into nc regions or clusters. Let p(x,y) be the considered pixel and cj as the j-th centre, where x = 1, 2, ...., R,y=1, 2, ...., S and j = 1, 2, …., nc. Based on the aforementioned consideration, for the conventional KM and MKM, all data will be assigned to the nearest centre based on Euclidean distance. The new position for each centre is calculated using [34]:
j jj cx cycj yxp
nc ,1 (1)
For the conventional FCM, the process of allocating each data member to be assigned simultaneously to more than one
class is based on the following membership function [34]:
;1
1
)1/(2
,
,
,cn
k
m
yxkp
yxjp
yxjpm
dd
M if yxpjd yxkp ,,,0, (2)
1, yxkpmM if ;0, yxkpd (3)
;0, yxjpmM for kyxp ,
where djp(x,y) is distance from point (x,y) to the current cluster centre j, dkp(x,y) is distance from point (x,y) to other cluster centres k, nc is number of centres and m is an integer, m >1 which determine the degree of fuzziness.
In the conventional FCM, the class membership is assigned based on the distance between two points. Meanwhile, in the MKM, the basic concept introduced suggests that each cluster should have a significant number of members or final fitness value and the differences among the clusters should be minimized to ensure a good clustering process.
For the proposed AFKM algorithm, all centres are firstly initialized to a certain value. In order to ensure a better clustering process, (1) is no longer employed to update the centre, hence, fuzziness and belongingness concepts are introduced in the proposed AFKM algorithm. The concept of fuzzy partitioning concept is applied to allow each data to be assigned to more than one class simultaneously by different degrees of membership, yxjp
mM , . The membership function
yxjpmM , is determined by using (2) and (3). In AFKM, the
membership function measurement is performed within the data members without any influence from outsiders (non-members). Usually, the closer the connection of the data, the bigger the significance of impact on the clustering results. Thus, this provides a significant impact on the degree of membership, which is then used in determining the new position of the centre.
For a good clustering process, the modification concept introduced in the AFKM algorithm suggests that each cluster should have a significant value of belongingness which measures the relationship strength between the centre and its members. Therefore in the proposed AFKM, after specifying the membership for each data, the degree of belongingness, jfor each cluster is calculated. This relationship provides a significant impact on the clustering results through the degree of belongingness. Higher degree of belongingness shows a stronger relationship between the centre and its members, which will ensure a better data clustering. The degree of belongingness, j is calculated based on:
yxjpm
jj M
c
, (4)
In order to improve the clustering process, it is necessary for the degree of membership is needed to always be updated. The degree of membership is optimized based on the degree of belongingness to ensure that the procedure of the reassigning member places the data to its appropriate centre or cluster. By introducing the concept of belongingness, the AFKM suggests

S. N. Sulaiman and N. A. M. Isa: Adaptive Fuzzy-K-means Clustering Algorithm for Image Segmentation 26
that each centre or cluster should have members with a strong relationship formed between them and the difference of belongingness among the clusters should be minimized. This criterion could be achieved using the following processes. The value of yxjp
mM , is updated in the iteration according to:
yxjpm
yxjpm
yxjpm MMM ,,,
' (5)
where'
, yxjpmM is the new membership. yxjp
mM , is defined as:
jjyxjpm ecM ,
(6)
where is a designed constant with value between 0 and 1 and is typically set to 0.1. Subsequently, the value of ej is calculated according to:
jjje ˆ
(7)
where jˆ is the normalized value for degree of belongingness.
Finally the new centre positions of the entire existing clusters are calculated based on the new (optimized) membership function according to:
j j
j j
cx cy
myxjp
cx cy
myxjp
jM
yxpMc '
,
', ,
(8)
(Note: for this work, degree of fuzziness, m is set to 2) All processes are repeated until the values of all centres are
no longer change.
III. DATA SAMPLES AND ANALYSIS
The proposed AFKM has been tested on numerous outdoor and indoor images taken using the most commonly used consumer electronic product namely the digital camera. In this paper, ten out of those tested images are chosen to be used to visualize the performance of the proposed algorithm. These images are called Air Force, Peppers, Elaine, Smarties1,Pirate, Smarties2, Golden Gate, Butterfly, River Bridge and Boat, as shown in Figs. 1(a) to 1(j) respectively. In order to further prove the capability and suitability of the proposed AFKM as a segmentation technique for a conventional consumer electronics field (i.e., conventional digital image), two conventional clustering algorithms namely MKM and FCM are used as a comparison. The FCM clustering is chosen for comparison as both of the proposed AFKM and the conventional FCM algorithms employ a similar fundamental concept for clustering process. The MKM clustering is chosen because it has been proven to produce better segmentation performance as compared to the conventional KM clustering algorithm [25-27]. For all clustering algorithms, centre initializations are set according to:
c
yxpyxpyxpj n
minmaxjminc
212 ),(),(
),( (9)
where minp(x,y) and maxp(x,y) are the minimum and the maximum value of gray level in the image respectively.
(a) (b) (c)
(d) (e) (f)
(g) (h) (i)
(j) Fig. 1. The original images of (a) Air Force (b) Peppers (c) Elaine (d) Smarties1 (e) Pirate (f) Smarties2 (g) Golden Gate (h) Butterfly (i) River Bridge (j) Boat.
The performance analysis is carried out based on qualitative and quantitative analyses. The qualitative analysis refers to the visual interpretation that is observed via unaided human visual perception. In this case, it determines the capability of the segmentation algorithms in detecting and distinguishing the regions of interest from unwanted backgrounds. In our studies, the qualitative analysis is a judged by a panel of experts from Universiti Sains Malaysia and Universiti Teknologi MARA Malaysia. Nonetheless, the quantitative analysis enables the performance of the segmentation results produced by the proposed algorithm and the other algorithms to be evaluated statistically. Here, three evaluation functions are used as the quantitative benchmarks. The three functions are; F(I) proposed by Liu and Yang [ 35],
R
i i
i
AeRIF
1
2 (10)
F’(I) proposed by Borsotti et al. [36], R
i i
iMax
AA
AeAR
MNIF
1
2
1
11
10001 (11)
And Q(I) the improved version from F(I) proposed by Borsotti et al. [36],
R
i i
i
i
i
AAR
AeR
MNIQ
1
22
log110001
(12)
IEEE Transactions on Consumer Electronics, Vol. 56, No. 4, November 2010 26
For the above three formulae, I is the resultant image to be evaluated, N × M is the image size, R is the number of regions found, Ai is the size of the i-th region, and R(Ai) is the number of regions having area Ai. ei, is defined as the sum of Euclidean distances between the features of pixels of region I and the corresponding region in the segmented image. With reference to (11), R(A) is the number of regions having exactly area A, and Max denotes the area of the largest region in the segmented image. These functions allow the segmentation to be evaluated without labelling the image and without the requirement of user-set parameters. Moreover, these functions correspond more closely to visual judgement. Smaller values of F(I),F’(I), and Q(I), show better segmentation results.
IV. RESULT AND DISCUSSION
As mentioned in section III, two analyses are applied namely the qualitative and quantitative analyses. The results for both these analyses will be presented in Section IV (A) and IV (B) respectively.
A. Qualitative Analysis We have tested the AFKM on various images with
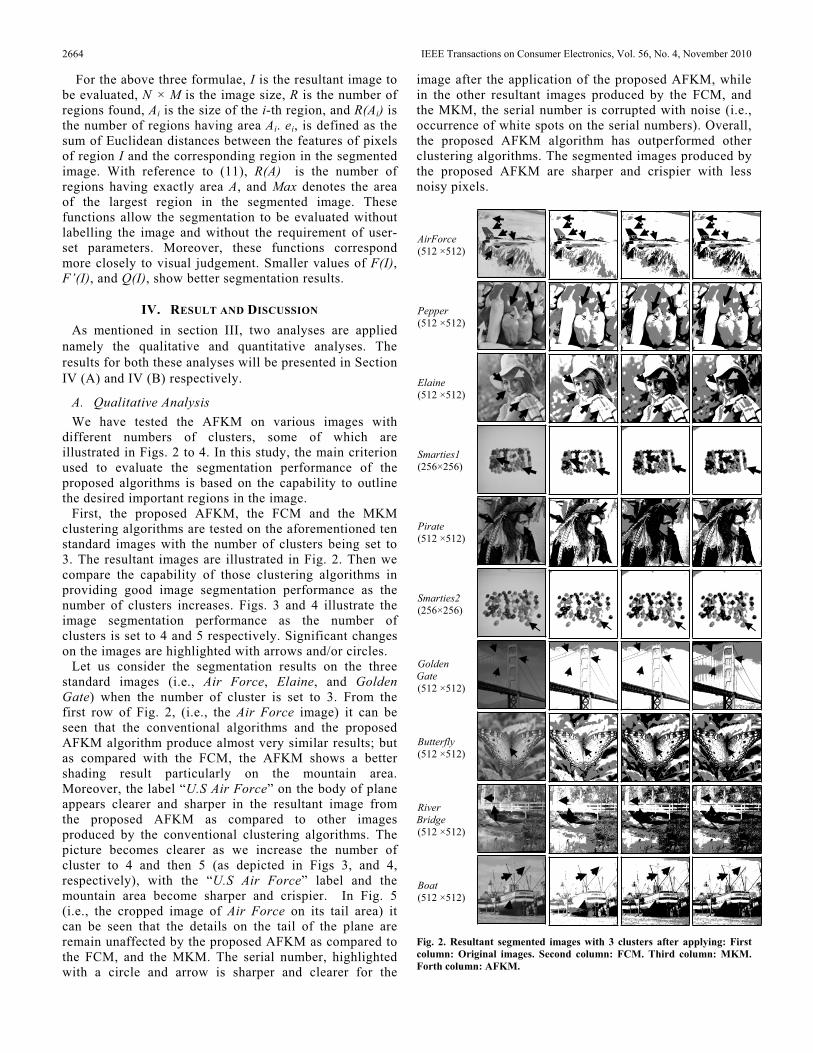
different numbers of clusters, some of which are illustrated in Figs. 2 to 4. In this study, the main criterion used to evaluate the segmentation performance of the proposed algorithms is based on the capability to outline the desired important regions in the image.
First, the proposed AFKM, the FCM and the MKM clustering algorithms are tested on the aforementioned ten standard images with the number of clusters being set to 3. The resultant images are illustrated in Fig. 2. Then we compare the capability of those clustering algorithms in providing good image segmentation performance as the number of clusters increases. Figs. 3 and 4 illustrate the image segmentation performance as the number of clusters is set to 4 and 5 respectively. Significant changes on the images are highlighted with arrows and/or circles.
Let us consider the segmentation results on the three standard images (i.e., Air Force, Elaine, and Golden Gate) when the number of cluster is set to 3. From the first row of Fig. 2, (i.e., the Air Force image) it can be seen that the conventional algorithms and the proposed AFKM algorithm produce almost very similar results; but as compared with the FCM, the AFKM shows a better shading result particularly on the mountain area. Moreover, the label “U.S Air Force” on the body of plane appears clearer and sharper in the resultant image from the proposed AFKM as compared to other images produced by the conventional clustering algorithms. The picture becomes clearer as we increase the number of cluster to 4 and then 5 (as depicted in Figs 3, and 4, respectively), with the “U.S Air Force” label and the mountain area become sharper and crispier. In Fig. 5 (i.e., the cropped image of Air Force on its tail area) it can be seen that the details on the tail of the plane are remain unaffected by the proposed AFKM as compared to the FCM, and the MKM. The serial number, highlighted with a circle and arrow is sharper and clearer for the
image after the application of the proposed AFKM, while in the other resultant images produced by the FCM, and the MKM, the serial number is corrupted with noise (i.e., occurrence of white spots on the serial numbers). Overall, the proposed AFKM algorithm has outperformed other clustering algorithms. The segmented images produced by the proposed AFKM are sharper and crispier with less noisy pixels.
AirForce(512 ×512)
Pepper (512 ×512)
Elaine (512 ×512)
Smarties1(256×256)
Pirate (512 ×512)
Smarties2(256×256)
GoldenGate(512 ×512)
Butterfly(512 ×512)
RiverBridge (512 ×512)
Boat (512 ×512)
Fig. 2. Resultant segmented images with 3 clusters after applying: First column: Original images. Second column: FCM. Third column: MKM. Forth column: AFKM.

S. N. Sulaiman and N. A. M. Isa: Adaptive Fuzzy-K-means Clustering Algorithm for Image Segmentation 26
AirForce(512 ×512)
Pepper (512 ×512)
Elaine (512 ×512)
Smarties1(256×256)
Pirate (512 ×512)
Smarties2(256×256)
GoldenGate(512 ×512)
Butterfly(512 ×512)
RiverBridge (512 ×512)
Boat (512 ×512)
Fig. 3. Resultant segmented images with 4 clusters after applying: First column: Original images. Second column: FCM. Third column: MKM. Forth column: AFKM.
For the Elaine image as shown in the third row of Fig. 2, as we cluster the image into three regions, the folded line on the Elaine’s towel is seen to be unclear for the resultant images produced by the FCM and the MKM. Nonetheless, the proposed algorithm has lined the folded towel much better than the conventional techniques. Elaine’s hair and eyebrow are segmented clearly by the proposed AFKM algorithm as compared to the FCM, and the MKM, which segmented the
aforementioned areas rather poorly. The segmentation regions of hair and eyebrow of Elaine, and the folded line on the Elaine’s towel produced by the proposed AFKM are much clearer as we increase the number of cluster from 3 to 4 and 5. The resultant images for number of clusters set to 4 and 5 are shown in Figs. 3, and 4, respectively. A more significant comparison between the clustering algorithms can be observed from the cropped image of Elaine on her towel as shown in Fig. 6.
AirForce(512 ×512)
Pepper (512 ×512)
Elaine (512 ×512)
Smarties1(256×256)
Pirate (512 ×512)
Smarties2(256×256)
GoldenGate(512 ×512)
Butterfly(512 ×512)
RiverBridge (512 ×512)
Boat (512 ×512)
Fig. 4. Resultant segmented images with 5 clusters after applying: First column: Original images. Second column: FCM. Third column: MKM. Forth column: AFKM.

IEEE Transactions on Consumer Electronics, Vol. 56, No. 4, November 2010 26
Fig. 5. The segmentation results (3 clusters) for cropped image of AirForce. First column: Original images. Second column: FCM. Third column: MKM. Forth column: AFKM.
Fig. 6. The segmentation results (4 clusters) for cropped image of Elaine.First column: Original images. Second column: FCM. Third column: MKM. Forth column: AFKM.
Fig. 7. The segmentation results (5 clusters) for cropped image of Golden Gate. First column: Original images. Second column: FCM. Third column: MKM. Forth column: AFKM.
With reference to the seventh row of Fig.2, (i.e., the Golden Gate image) it can be seen that again, the proposed AFKM algorithm has successfully produced a better segmentation performance. The main structure of the bridge image namely the beams and the pillars are significantly detected and segmented while the conventional FCM clustering algorithm have evidently produced poor segmentation performance. The same observation can also be seen when the number of cluster is set to 4 and 5 as shown in Figs. 3 and 4 respectively. The aforementioned advantages can be clearly seen from the cropped Golden Gate image as shown in Fig. 7.
For the remaining seven images, the results obtained in Figs. 2 to 4 further favour the proposed AFKM as the best segmentation technique compared to the FCM and the MKM clustering algorithms. Significant differences between those algorithms are highlighted with arrows. Based on these results, the proposed algorithm can be suggested to be used as post processing tools for digital images; an added-value to existing digital image processing techniques in recent consumer electronics products (e.g., CCD camera).
B. Quantitative Analysis As mentioned in Section III, three benchmark functions
are used to evaluate the proposed AFKM quantitatively. Table 1, Table 2, and Table 3 summarise the quantitative evaluations of the segmentation results for the conventional clustering methods, and the proposed AFKM. The proposed AFKM produces the smallest
values of F(I), F’(I) and Q(I) for almost all images as well as for almost all number of clusters used (i.e., 3, 4, and 5). These promising quantitative results verify and support the superiority shown by the proposed AFKM in the qualitative analysis. Additionally, the proposed AFKM manages to segment the image successfully with less noisy pixels. In general, these observations indicate that the AFKM might be a better approach in terms of image segmentation application.
This study further investigates the capability of the proposed AFKM algorithm with sixty four standard test images frequently used in literature and real medical images. Using the aforementioned quantitative evaluation functions, the average performance of all algorithms on these tested images is tabulated in Table 4. From the table it can be seen the proposed AFKM algorithm provides a relatively lower value of each evaluation function which demonstrate its quality in improving segmentation capability.
In addition, the processing time analysis is also performed to measure the algorithm efficiency. The analysis is performed using Intel® Core™ i3 CPU3.07GHz Processor, 2.00GB of RAM, and 500GB of disk drive space. The results are tabulated in Table 5. For almost all images, the proposed AFKM clustering algorithm acquired a slightly higher processing time as compared to the conventional clustering MKM clustering algorithm. However, the processing time for the FCM and AFKM are almost similar. Overall, with significant better performances although with a slightly higher processing time, the results obtained have successfully proven that the proposed AFKM is highly capable to be applied as a segmentation tool of digital images for consumers’ electronic applications.
V. CONCLUSION
This paper presents a new clustering algorithm named the AFKM algorithm for segmentation purposes. It employs an adaptive and iterative fuzzy and belongingness concept to obtain the optimum value of clusters centre for a better segmentation process. The proposed clustering algorithm is applicable to numerous outdoor and indoor images whereby ten images have been presented as case studies. The conclusion of this paper sees the proposed algorithm outperforming the conventional FCM and MKM algorithms by successfully producing better segmented images. The proposed AFKM also successfully preserves important features on digital images. Both qualitative and quantitative analyses have justified the conclusion that the proposed approach has been able to illustrate good segmentation results efficiently. Thus, it is recommendable for this algorithm to be applied in the post image processing in consumer electronic products such as the digital camera for general applications and the CCD camera which is extensively used with the microscope in capturing microscopic images, especially in segmenting medical images.

S. N. Sulaiman and N. A. M. Isa: Adaptive Fuzzy-K-means Clustering Algorithm for Image Segmentation 26
TABLE 1.QUANTITATIVE EVALUATION F(I) ON SEGMENTATION OF SELECTED IMAGES
F(I) For Cluster Number (*1.0e+12) Algorithm Images 3 4 5
AirForce 36.6533 54.0284 76.0762 Pepper 10.7947 21.8951 28.6708 Elaine 9.0628 20.8674 37.4632
Smarties1 3.3909 6.9606 9.8462 Pirate 4.7425 7.1192 755.6790
Smarties2 2.9503 5.4771 7.9805 GoldenGate 4.0661 11.3159 15.2695
Butterfly 3.8466 7.3766 12.4678 River Bridge 6.7996 10.2375 17.8349
FCM
Boat 16.2922 24.3458 33.6430 AirForce 13.3609 30.9955 52.2924 Pepper 5.8701 9.6614 14.1086 Elaine 4.0949 8.0236 15.3663
Smarties1 2.1560 3.6655 5.3134 Pirate 7.4972 7.6087 19.5192
Smarties2 1.7981 2.9323 4.3565 GoldenGate 3.4956 2.9058 7.2228
Butterfly 3.1593 4.3336 6.0057 River Bridge 5.8340 7.3061 9.8613
MKM
Boat 6.2771 10.8656 17.3629 AirForce 8.8518 21.6530 42.4109 Pepper 6.2680 9.3014 14.3828 Elaine 3.8346 5.8647 10.0399
Smarties1 2.1071 3.1866 4.2387 Pirate 5.0881 6.5205 12.1597
Smarties2 1.7435 2.8110 3.4876 GoldenGate 2.4505 4.4111 5.6799
Butterfly 3.1770 4.1881 5.6341 River Bridge 5.5767 6.9262 9.3933
AFKM
Boat 6.4890 10.4207 15.3653 Note: Bolded numbers show the best result obtained for each analysis. The same process is used in Table 2 to 4.
TABLE 2.QUANTITATIVE EVALUATION F’(I) ON SEGMENTATION OF SELECTED IMAGES
F’(I) For Cluster Number (*1.0e+5) Algorithm Images 3 4 5
AirForce 1.3982 2.0610 2.9021 Pepper 0.4118 0.8352 1.0937 Elaine 0.3457 0.7960 1.4291
Smarties1 0.5174 1.0621 1.5024 Pirate 0.1809 0.2716 28.8269
Smarties2 0.4502 0.8357 1.2177 GoldenGate 0.1551 0.4317 0.5825
Butterfly 0.1467 0.2814 0.4756 River Bridge 0.2594 0.3905 0.6803
FCM
Boat 0.6215 0.9287 1.2834 AirForce 0.5097 1.1824 1.9948 Pepper 0.2239 0.3686 0.5382 Elaine 0.1562 0.3061 0.5862
Smarties1 0.3290 0.5593 0.8108 Pirate 0.2860 0.2903 0.7446
Smarties2 0.2744 0.4474 0.6648 GoldenGate 0.1333 0.1108 0.2755
Butterfly 0.1205 0.1653 0.2291 River Bridge 0.2225 0.2787 0.3762
MKM
Boat 0.2395 0.4145 0.6623 AirForce 0.3377 0.8074 1.6178 Pepper 0.2391 0.3548 0.5487 Elaine 0.1463 0.2237 0.3830
Smarties1 0.3215 0.4862 0.6468 Pirate 0.1941 0.2487 0.4639
Smarties2 0.2660 0.4289 0.5322 GoldenGate 0.0935 0.1683 0.2167
Butterfly 0.1212 0.1598 0.2149 River Bridge 0.2127 0.2642 0.3583
AFKM
Boat 0.2475 0.3975 0.5861
TABLE 3. QUANTITATIVE EVALUATION Q(I) ON SEGMENTATION OF SELECTED IMAGES
Q(I) For Cluster Number (*1.0e+7) Algorithm Images 3 4 5
AirForce 0.2728 0.3820 0.5103 Pepper 0.1466 0.2475 0.3241 Elaine 0.1142 0.1989 0.2916
Smarties1 0.0674 0.1120 0.1428 Pirate 0.0887 0.1432 0.4586
Smarties2 0.0640 0.1010 0.1332 GoldenGate 0.0467 0.0975 0.1276
Butterfly 0.0640 0.1142 0.1659 River Bridge 0.1086 0.1783 0.2733
FCM
Boat 0.1933 0.2630 0.3403 AirForce 0.1541 0.2796 0.4130 Pepper 0.0997 0.1619 0.2296 Elaine 0.0726 0.1317 0.2123
Smarties1 0.0474 0.0734 0.1010 Pirate 0.1239 0.2028 0.3294
Smarties2 0.0440 0.0664 0.0932 GoldenGate 0.0362 0.0666 0.1316
Butterfly 0.0576 0.0924 0.1304 River Bridge 0.1030 0.1724 0.2518
MKM
Boat 0.1016 0.1646 0.2434 AirForce 0.1177 0.2216 0.3620 Pepper 0.1035 0.1586 0.2287 Elaine 0.0693 0.1120 0.1708
Smarties1 0.0465 0.0662 0.0849 Pirate 0.0967 0.1462 0.2229
Smarties2 0.0430 0.0642 0.0791 GoldenGate 0.0330 0.0548 0.0697
Butterfly 0.0578 0.0902 0.1209 River Bridge 0.0986 0.1643 0.2404
AFKM
Boat 0.1039 0.1572 0.2187
TABLE 4. AVERAGE SEGMENTATION EVALUATION FUNCTIONS ON 64 IMAGES
Quantitative evaluation functions F(I) F'(I) Q(I)
Number of Cluster Algorithms
(*1.0e+12) (*1.0e+5) (*1.0e+6)FCM 7.8030 0.3269 0.8374 MKM 10.9354 0.4441 1.0336 3AFKM 6.1938 0.2609 0.8495 FCM 13.6391 0.5766 1.4149 MKM 6.7291 0.2902 1.4543 4AFKM 5.6972 0.2448 1.2936 FCM 46.4756 1.8677 2.2439 MKM 9.5417 0.4205 2.1243 5AFKM 8.7510 0.3744 1.9115
TABLE 5. EXECUTION TIME (IN SECONDS)
Algorithms and Cluster Number FCM MKM AFKM Images
3 4 5 3 4 5 3 4 5 AirForce 4.9 4.65 4.40 2.46 2.76 2.55 4.74 5.47 6.36 Pepper 5.14 5.24 5.33 2.46 2.46 2.57 3.77 3.80 4.52 Elaine 3.27 4.20 4.55 2.46 2.64 2.59 4.03 5.05 5.40
Smarties1 1.47 1.68 1.89 0.97 1.35 1.31 1.37 1.93 1.97 Pirate 2.95 4.71 5.71 2.43 2.47 2.73 4.64 6.06 7.44
Smarties2 1.68 1.67 1.66 1.14 1.01 1.25 1.46 1.62 2.25 GoldenGate 3.16 5.12 4.45 2.39 2.55 2.51 4.50 4.93 6.08
Butterfly 3.20 4.52 5.13 2.56 2.61 2.49 3.39 3.58 4.71 River Bridge 3.46 4.46 6.34 2.42 2.44 2.60 3.51 3.65 3.87
Boat 4.73 4.72 5.68 2.56 2.71 2.54 3.83 4.33 4.73

IEEE Transactions on Consumer Electronics, Vol. 56, No. 4, November 2010 266
REFERENCES
[1] D. Auber, and M. Delest, “A clustering algorithm for huge trees,” Advances in Applied Mathematics, vol. 31, no. 1 pp. 46-60 2003.
[2] A. S. Mahani, A. E. Carlsson, and R. Wessel, “Motion repulsion arises from stimulus statistics when analyzed with a clustering algorithm,” Biological Cybernetics, vol. 92, no. 4, pp. 288-291, 2005.
[3] T. Abeel, Y. V. d. Peer, and Y. Saeys, “Java-ML: A machine learning library,” Journal of Machine Learning Research, vol. 10, pp. 931-934, 2009.
[4] A. Y. Al-Omary, and M. S. Jamil, “A new approach of clustering based machine-learning algorithm,” Knowledge-Based Systems, vol.19, no.4, pp. 248-258, 2006.
[5] M. J. Rattigan, M. Maier, and D. Jensen. “Graph clustering with network structure indices,” in Proceedings of the 24th International Conference on Machine Learning. 2007. Corvallis, OR.
[6] P. C. Boutros, and A. B. Okey, “Unsupervised pattern recognition: An introduction to the whys and wherefores of clustering microarray data,” Briefings In Bioinformatics,vol. 6, no. 4, pp. 331-343, 2005.
[7] J. P. Jesan, “The neural approach to pattern recognition,” Ubiquity, vol.5, no.7, 2004.
[8] T. Kanungo, D. M. Mount, N. S. Netanyahu, C. D. Piatko, R. Silverman, and A. Y. Wu, “An efficient k-means clustering algorithm: analysis and implementation,” IEEE Transactions on Pattern Analysis and Machine Intelligence, vol. 24, no. 7, pp. 881-892, 2002.
[9] H. Wang, W. Wang, J. Yang, and P. S. Yu, “Clustering by pattern similarity in large data sets,” in Proceedings of the 2002 ACM SIGMOD International Conference on Management of data. 2002, Madison, Wisconsin.
[10] M. Halkidi, and M. Vazirgiannis, “Clustering validity assessment: finding the optimal partitioning of a data set,” Proceedings IEEE International Conference on Data Mining. 2001.
[11] Z.-H. Zhou, “Three perspectives of data mining,” Artificial Intelligence, vol. 143, no. 1, pp. 139-146, 2003.
[12] T. Zhang, R. Ramakrishnan, and M. Livny, “BIRCH: an efficient data clustering method for very large databases,” in Proceedings of the 1996 ACM SIGMOD international conference on Management of data, 1996, Montreal, Quebec, Canada.
[13] C. Ordonez, “Clustering binary data streams with K-means,” in Proceedings of the 8th ACM SIGMOD workshop on Research issues in data mining and knowledge discovery. 2003, San Diego, California.
[14] J. Handl, J. Knowles, and D. B. Kell, “Computational cluster validation in post-genomic data analysis,” Bioinformatics, 2005
[15] S. K. Singh, K. Shishir, G. S. Tomar, K. Ravi, and G. K. A. Santhalia, “Modified framework of a clustering algorithm for image processing applications,” in First Asia International Conference on Modelling & Simulation, AMS '07, 2007.
[16] F. Hoeppner, “Fuzzy shell clustering algorithms in image processing: fuzzy C-rectangular and 2-rectangular shells,” IEEE Transactions on Fuzzy Systems,vol. 5, no. 4, pp. 599-613, 1997.
[17] M. Cheriet, J. N. Said, and C. Y. Suen, “A recursive thresholding technique for image segmentation,” IEEE Transactions on Image Processing, vol. 7, no. 6, pp. 918-921, 1998.
[18] S. K. Warfield, K. Michael, F. A. Jolesz, and K. Ron, “Adaptive, template moderated, spatially varying statistical classification,” Medical Image Analysis, vol. 4, no. 1, pp. 43-55, 2000.
[19] M. Lalonde, M. Beaulieu, and L. Gagnon, “Fast and robust optic disc detection using pyramidal decomposition and Hausdorff-based template matching,” IEEE Transactions on Medical Imaging, vol. 21, no. 11, pp. 1193-1200, 2001.
[20] Y. Seunghwan, and P. Rae-Hong, “Red-eye detection and correction using inpainting in digital photographs,” IEEE Transactions on Consumer Electronics, vol. 55, no. 3, pp. 1006-1014, 2009.
[21] N. A. Mat-Isa, M. Y. Mashor, and N. H. Othman, “Automatic seed based region growing for pap smear image segmentation,” in Kuala Lumpur International Conference on Biomedical Engineering. 2002. Kuala Lumpur, Malaysia.
[22] J. K. Paik, Y. C. Park, and S. W. Park, “An edge detection approach to digital image stabilization based on tri-state adaptive linear neurons,” IEEETransactions on Consumer Electronics, vol. 37, no. 3, pp. 521-530, 1991.
[23] Y. Siyoung, K. Donghyung, and J. Jechang, “Fine edge-preserving deinterlacing algorithm for progressive display,” IEEE Transactions on Consumer Electronics,vol. 53, no. 3, pp. 1654-1662, 2009.
[24] X. Yang, Z. Weidong, C. Yufei, and F. Xin., “Image segmentation with a fuzzy clustering algorithm based on Ant-Tree,” Signal Processing, vol. 88, no. 10, pp. 2453-2462, 2008.
[25] N. A. Mat-Isa, M. Y. Mashor, and N. H. Othman, “Pap smear image segmentation using modified moving k-mean clustering,” in Kuala Lumpur International Conference on Biomedical Engineering. 2002. Kuala Lumpur Malaysia.
[26] N. A. Mat-Isa, M. Y. Mashor, and N. H. Othman, “Comparison of segmentation performance of clustering algorithms for pap smear images,” in Proceeding of International Conference on Robotics, Vision, Information and Signal Processing. January 2003. Penang.
[27] N. A. Mat-Isa, M. Y. Mashor, N. H. Othman and S. N. Sulaiman, “Application of moving k-means clustering for pap smear image processing,” in Proceeding of International Conference on Robotics, Vision, Information and Signal Processing. January 2002. Penang Malaysia.
[28] A. E. O. Boudraa, M. Arzi, J. Sau, J. Champier, S. Hadj-Moussa, J. E. Besson, D. Sappey-Marinier, R. Itti, and J. J. Mallet, “Automated detection of the left ventricular region in gated nuclear cardiac imaging,” IEEETransactions on Biomedical Engineering, vol. 43, no. 4, pp. 430-436, 1996.
[29] A. E. O. Boudraa, J. J. Mallet, J. E. Besson, S. E. Bouyoucef, and J. Champier, “Left ventricle automated detection method in gated isotopic ventriculography using fuzzy clustering,” IEEE Transactions on Medical Imaging, vol. 12, no. 3, pp. 451-465, 1993.
[30] C. W. Chen, J. Luo, and K. J. Parker, “Image segmentation via adaptive K-mean clustering and knowledge-based morphological operations with biomedical applications,” IEEE Transactions on Image Processing, vol. 7, no. 12, pp. 1673-1683, 1998.
[31] M. R. Rezaee, P. M. J. van der Zwet, B. P. E. Lelieveldt, R. J. van der Geest, and J. H. C. Reiber, “A multiresolution image segmentation technique based on pyramidal segmentation and fuzzy clustering,” IEEE Transactions on Image Processing, vol. 9, no. 7, pp. 1238-1248, 2000.
[32] N. A. Mat-Isa, A. S. Samy, U. K. Ngah, “Adaptive fuzzy moving K-means algorithm for image segmentation,” IEEE Transactions on Consumer Electronics, vol. 55, no. 4, pp. 2145-2153, 2009
[33] P. K. Agarwal, and N. H. Mustafa, “k-means projective clustering,” in Proceedings of the twenty-third ACM SIGMOD-SIGACT-SIGART symposium on Principles of database systems, 2004, Paris, France.
[34] M. Y. Mashor, “Hybrid Training Algorithm for RBF Network,” International Journal of Computer, Internet and Management, vol. 8, no. 2, pp. 50-65, 2000.
[35] J. Liu, and Y. H. Yang, “Multiresolution color image segmentation,” IEEETransactions on Pattern Analysis and Machine Intelligence, vol. 16, no. 7, pp. 689-700, 1994.
[36] M. Borsotti, P. Campadelli, and R. Schettini, “Quantitative evaluation of color image segmentation results,” Pattern Recognition Letters, vol. 19, no. 8, pp. 741-747, 1998.
BIOGRAPHIES
Siti Noraini Sulaiman obtained her B.Eng Hons in Electrical and Electronics Engineering from Universiti Sains Malaysia in 2000 and MSc in Medical Imaging from the same university in 2003. She is currently on leave from her current post as lecturer at Faculty of Electrical Engineering, Universiti Teknologi MARA, Malaysia. She is now attached with Imaging and
Intelligent System Research Team (ISRT), School of Electrical and Electronic Engineering, Universiti Sains Malaysia, Engineering Campus in Nibong Tebal, Penang, Malaysia and doing her PhD in Biomedical Engineering, focusing on Medical Imaging at the university.
Associate Professor Dr. Nor Ashidi Mat Isa obtainedhis B.Eng Hons (First Class Honors) in Electronic Engineering from Universiti Sains Malaysia in 1999 and PhD in Image Processing and Neural Networks from the same university in 2003. He is currently an Associate Professor and heading Imaging and Intelligent System Research Team (ISRT), at the School of Electrical and Electronics Engineering, Universiti Sains Malaysia,
Engineering Campus in Nibong Tebal, Penang, Malaysia. He specializes in the area of intelligent systems, image processing, neural networks for medical applications, and algorithms. He has published numerous research articles in international journals and conference proceedings.
Copyright © 2022 FDOKUMEN