DATA CLUSTERING USING K-MEANS ALGORITHM FOR HIGH DIMENSIONAL DATA
10
International Journal of Advance Research in Technology (IJART) Vol:02, No:02, 2012 21 | IJART DATA CLUSTERING USING K-MEANS ALGORITHM FOR HIGH DIMENSIONAL DATA B.Santhosh Kumar 1 , V.Vijayaganth 2 , C.S.I.College of Engineering, Ketti-643 215, The Nilgiris. E-mail: ¹ [email protected] ² [email protected] Abstract In this paper presents an enhanced k-means type algorithm for clustering high-dimensional objects. In high dimensional data, clusters of objects often exist in subspaces rather than in the entire space. This is a data sparsely problem faced in clustering high-dimensional data. In the new algorithm, we extend the k-means clustering process to calculate a weight for each dimension in each cluster and use the weight values to identify the subsets of important dimensions that categorize different clusters. For example, in text clustering, clusters of documents of different topics are categorized by different subsets of terms or keywords. The keywords for one cluster may not occur in the documents of other clusters. This is achieved by including the weight entropy in the objective function that is minimized in the k-means clustering process. An additional step is added to the k-means clustering process to automatically compute the weights of all dimensions in each cluster. The experiments on both synthetic and real data have shown that the new algorithm can generate better clustering results than other subspace clustering algorithms. Index Terms k-means clustering, variable weighting, subspace clustering, text clustering, high-dimensional data. Introduction High-dimensional data is a phenomenon in real-world data mining applications. Text data is a typical example. In text mining, a text document is viewed as a set of pairs < ti; fi >, where ti is a term or word, and fi is a measure of ti, for example, the frequency of ti in the document. The total number of unique terms in a text data set represents the number of dimensions, which is usually in the thousands. High-dimensional data occurs in business as well. In retail companies, for example, for effective supplier relationship management (SRM), suppliers are often categorized in groups according to their business behaviors. The supplier’s behavior data is high dimensional because thousands of attributes are used to describe the supplier’s behaviors, including product items, ordered amounts, order frequencies, product quality, and so forth. Sparsity is an accompanying phenomenon of high dimensional data. In text data, documents related to a particular topic, for instance, sport, are categorized by one subset of terms. A group of suppliers are categorized by the subset of product items supplied by the suppliers. Other suppliers who did not supply these product items have zero order amount for them in the behavior data [1]. Clearly, clustering of high-dimensional sparse data requires special treatment [2], [3], [4], [5]. This type of clustering methods is referred to as subspace clustering, aiming at finding clusters from subspaces of data instead of the entire data space. In a subspace clustering, each cluster is a set of objects identified by a subset of dimensions and different clusters are represented in different subsets of dimensions. Cluster memberships are determined by the similarities of objects measured with respect to subspaces. According to the ways that the subspaces of clusters are determined, subspace clustering methods can be divided into two types. The first type is to find out the exact subspaces of different clusters (see, for instance, [6], [7], [8], [9]). We call these methods as hard subspace clustering. The second type is to cluster data objects in the entire data space but assign different weighting values to different dimensions of clusters in the clustering process, based on the importance of the dimensions in identifying the corresponding clusters (see, for instance, [9], [10]). We call these methods soft subspace clustering. In this paper, we present a new k-means type algorithm for soft subspace clustering of large high-dimensional sparse data. We consider that different dimensions make different
Transcript of DATA CLUSTERING USING K-MEANS ALGORITHM FOR HIGH DIMENSIONAL DATA

International Journal of Advance Research in Technology (IJART)
Vol:02, No:02, 2012
21 | I J A R T
DATA CLUSTERING USING K-MEANS ALGORITHM FOR HIGH DIMENSIONAL DATA
B.Santhosh Kumar1, V.Vijayaganth 2,
C.S.I.College of Engineering, Ketti-643 215, The Nilgiris.
E-mail: ¹ [email protected] ² [email protected]
Abstract
In this paper presents an enhanced k-means
type algorithm for clustering high-dimensional
objects. In high dimensional data, clusters of objects
often exist in subspaces rather than in the entire
space. This is a data sparsely problem faced in
clustering high-dimensional data. In the new
algorithm, we extend the k-means clustering process
to calculate a weight for each dimension in each
cluster and use the weight values to identify the
subsets of important dimensions that categorize
different clusters. For example, in text clustering,
clusters of documents of different topics are
categorized by different subsets of terms or
keywords. The keywords for one cluster may not
occur in the documents of other clusters. This is
achieved by including the weight entropy in the
objective function that is minimized in the k-means
clustering process. An additional step is added to
the k-means clustering process to automatically
compute the weights of all dimensions in each
cluster. The experiments on both synthetic and real
data have shown that the new algorithm can
generate better clustering results than other
subspace clustering algorithms.
Index Terms
k-means clustering, variable weighting, subspace
clustering, text clustering, high-dimensional data.
Introduction
High-dimensional data is a phenomenon in
real-world data mining applications. Text data is a
typical example. In text mining, a text document is
viewed as a set of pairs < ti; fi >, where ti is a term
or word, and fi is a measure of ti, for example, the
frequency of ti in the document. The total number of
unique terms in a text data set represents the number
of dimensions, which is usually in the thousands.
High-dimensional data occurs in business as well. In
retail companies, for example, for effective supplier
relationship management (SRM), suppliers are often
categorized in groups according to their business
behaviors. The supplier’s behavior data is high
dimensional because thousands of attributes are
used to describe the supplier’s behaviors, including
product items, ordered amounts, order frequencies,
product quality, and so forth. Sparsity is an
accompanying phenomenon of high dimensional
data. In text data, documents related to a particular
topic, for instance, sport, are categorized by one
subset of terms. A group of suppliers are
categorized by the subset of product items supplied
by the suppliers. Other suppliers who did not supply
these product items have zero order amount for
them in the behavior data [1]. Clearly, clustering of
high-dimensional sparse data requires special
treatment [2], [3], [4], [5]. This type of clustering
methods is referred to as subspace clustering,
aiming at finding clusters from subspaces of data
instead of the entire data space. In a subspace
clustering, each cluster is a set of objects identified
by a subset of dimensions and different clusters are
represented in different subsets of dimensions.
Cluster memberships are determined by the
similarities of objects measured with respect to
subspaces. According to the ways that the subspaces
of clusters are determined, subspace clustering
methods can be divided into two types. The first
type is to find out the exact subspaces of different
clusters (see, for instance, [6], [7], [8], [9]). We call
these methods as hard subspace clustering. The
second type is to cluster data objects in the entire
data space but assign different weighting values to
different dimensions of clusters in the clustering
process, based on the importance of the dimensions
in identifying the corresponding clusters (see, for
instance, [9], [10]). We call these methods soft
subspace clustering. In this paper, we present a new
k-means type algorithm for soft subspace clustering
of large high-dimensional sparse data. We consider
that different dimensions make different

International Journal of Advance Research in Technology (IJART)
Vol:02, No:02, 2012
22 | I J A R T
contributions to the identification of objects in a
cluster.
Subspace clustering seeks to group objects
into clusters on subsets of dimensions or attributes
of a data set. It pursues two tasks, identification of
the subsets of dimensions where clusters can be
found and discovery of the clusters from different
subsets of dimensions. According to the ways with
which the subsets of dimensions are identified, we
can divide subspace clustering methods into two
categories. The methods in the first category
determine the exact subsets of dimensions where
clusters are discovered. We call these methods hard
subspace clustering. The methods in the second
category determine the subsets of dimensions
according to the contributions of the dimensions in
discovering the corresponding clusters. The
contribution of a dimension is measured by a weight
that is assigned to the dimension in the clustering
process. We call these methods soft subspace
clustering because every dimension contributes to
the discovery of clusters, but the dimensions with
larger weights form the subsets of dimensions of the
clusters. The method in this paper falls in the second
category.
1.1 Hard Subspace Clustering
The subspace clustering methods in this
category can be further divided into bottom-up and
top-down subspace search methods [10]. The
bottom-up methods for subspace clustering consist
of the following main steps. dividing each
dimension into intervals and identifying the dense
intervals in each dimension. From the interactions of
the dense intervals, identifying the dense cells in all
two dimensions. From the intersections of 2D dense
cells and the dense intervals of other dimensions,
identifying the dense cells in all three dimensions
and repeating this process until all dense cells in all
k dimensions are identified, and merging the
adjacent dense cells in the same subsets of
dimensions to identify clusters. Examples of the
bottom-up methods include CLIQUE [6], ENCLUS
[12], and MAFIA [15]. Local Dimensionality
Reduction (LDR) [9], [19], like PROCLUS, projects
each cluster on its associated subspace, which is
generally different from the subspace associated
with another cluster. The efficacy of this method
depends on how the clustering problem is addressed
in the first place in the original feature space. A
potentially serious problem with such a technique is
the lack of data to locally perform PCA on each
cluster to derive the principal components;
therefore, it is inflexible in determining the
dimensionality of data representation.
A hierarchical subspace clustering approach
with automatic relevant dimension selection, called
HARP, was recently presented by Yip et al. [11].
HARP is based on the assumption that two objects
are likely to belong to the same cluster if they are
very similar to each other along many dimensions.
Clusters are allowed to merge only if they are
similar enough in a number of dimensions, where
the minimum similarity and the minimum number
of similar dimensions are controlled by two internal
threshold parameters. Due to the hierarchical nature,
the algorithm is intrinsically slow. Also, if the
number of relevant dimensions per cluster is
extremely low, the accuracy of HARP may drop as
the basic assumption will become less valid due to
the presence of a large amount of noise values in the
data set.
1.2 Soft Subspace Clustering
Instead of identifying exact subspaces for
clusters, this approach assigns a weight to each
dimension in the clustering process to measure the
contribution of the dimension in forming a
particular cluster. In a clustering, every dimension
contributes to every cluster, but contributions are
different. The subspaces of the clusters can be
identified by the weight values after clustering.
Variable weighting for clustering is an important
research topic in statistics and data mining [13],
[14], [15], [16]. However, the purpose is to select
important variables for clustering. Extensions to
some variable weighting methods, for example, the
k-means type variable weighting methods, can
perform the task of subspace clustering. A number
of algorithms in this direction have been reported
recently [16], [18], [17], [18]. The direct extension
to the k-means type variable, weighting algorithm
[12] for variable selection results from the
minimization of the following objective function
[17], [16].
subject to
International Journal of Advance Research in Technology (IJART)
Vol:02, No:02, 2012
23 | I J A R T
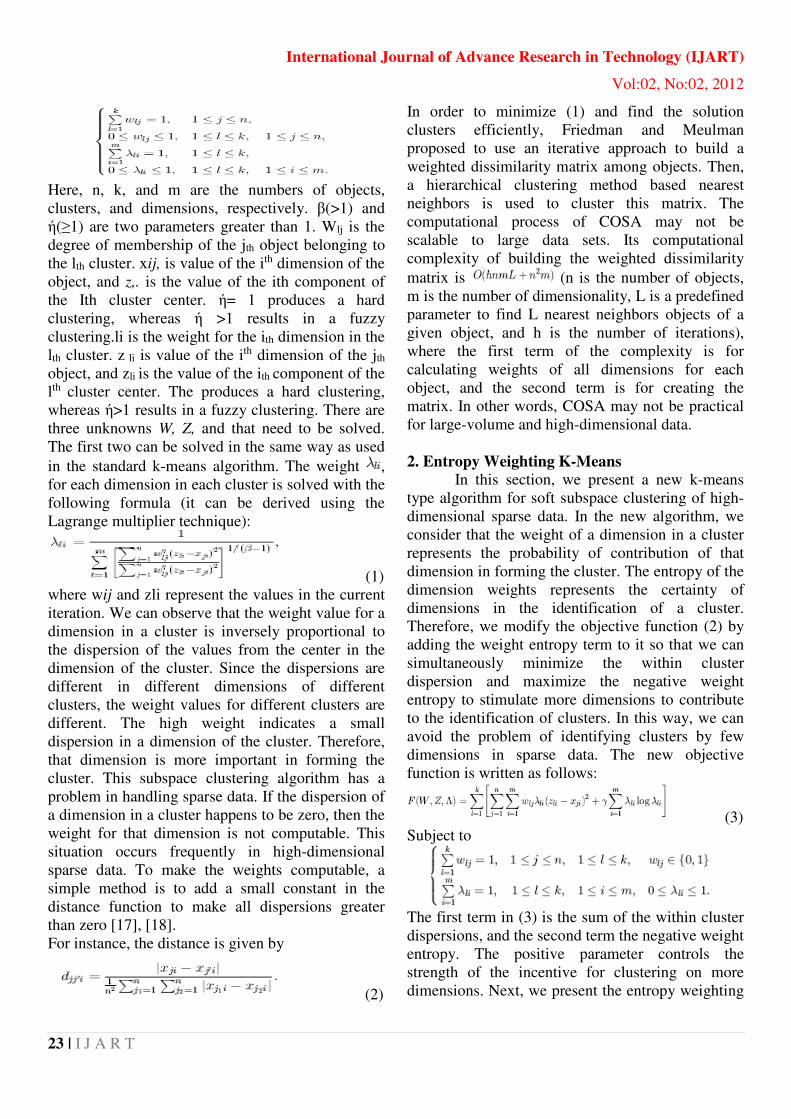
Here, n, k, and m are the numbers of objects,
clusters, and dimensions, respectively. β(>1) and
ή(≥1) are two parameters greater than 1. Wlj is the
degree of membership of the jth object belonging to
the lth cluster. xij, is value of the ith dimension of the
object, and z,. is the value of the ith component of
the Ith cluster center. ή= 1 produces a hard
clustering, whereas ή >1 results in a fuzzy
clustering.li is the weight for the ith dimension in the
lth cluster. z li is value of the ith dimension of the jth
object, and zli is the value of the ith component of the
lth cluster center. The produces a hard clustering,
whereas ή>1 results in a fuzzy clustering. There are
three unknowns W, Z, and that need to be solved.
The first two can be solved in the same way as used
in the standard k-means algorithm. The weight ,
for each dimension in each cluster is solved with the
following formula (it can be derived using the
Lagrange multiplier technique):
(1)
where wij and zli represent the values in the current
iteration. We can observe that the weight value for a
dimension in a cluster is inversely proportional to
the dispersion of the values from the center in the
dimension of the cluster. Since the dispersions are
different in different dimensions of different
clusters, the weight values for different clusters are
different. The high weight indicates a small
dispersion in a dimension of the cluster. Therefore,
that dimension is more important in forming the
cluster. This subspace clustering algorithm has a
problem in handling sparse data. If the dispersion of
a dimension in a cluster happens to be zero, then the
weight for that dimension is not computable. This
situation occurs frequently in high-dimensional
sparse data. To make the weights computable, a
simple method is to add a small constant in the
distance function to make all dispersions greater
than zero [17], [18].
For instance, the distance is given by
(2)
In order to minimize (1) and find the solution
clusters efficiently, Friedman and Meulman
proposed to use an iterative approach to build a
weighted dissimilarity matrix among objects. Then,
a hierarchical clustering method based nearest
neighbors is used to cluster this matrix. The
computational process of COSA may not be
scalable to large data sets. Its computational
complexity of building the weighted dissimilarity
matrix is (n is the number of objects,
m is the number of dimensionality, L is a predefined
parameter to find L nearest neighbors objects of a
given object, and h is the number of iterations),
where the first term of the complexity is for
calculating weights of all dimensions for each
object, and the second term is for creating the
matrix. In other words, COSA may not be practical
for large-volume and high-dimensional data.
2. Entropy Weighting K-Means
In this section, we present a new k-means
type algorithm for soft subspace clustering of high-
dimensional sparse data. In the new algorithm, we
consider that the weight of a dimension in a cluster
represents the probability of contribution of that
dimension in forming the cluster. The entropy of the
dimension weights represents the certainty of
dimensions in the identification of a cluster.
Therefore, we modify the objective function (2) by
adding the weight entropy term to it so that we can
simultaneously minimize the within cluster
dispersion and maximize the negative weight
entropy to stimulate more dimensions to contribute
to the identification of clusters. In this way, we can
avoid the problem of identifying clusters by few
dimensions in sparse data. The new objective
function is written as follows:
(3)
Subject to
The first term in (3) is the sum of the within cluster
dispersions, and the second term the negative weight
entropy. The positive parameter controls the
strength of the incentive for clustering on more
dimensions. Next, we present the entropy weighting
International Journal of Advance Research in Technology (IJART)
Vol:02, No:02, 2012
24 | I J A R T
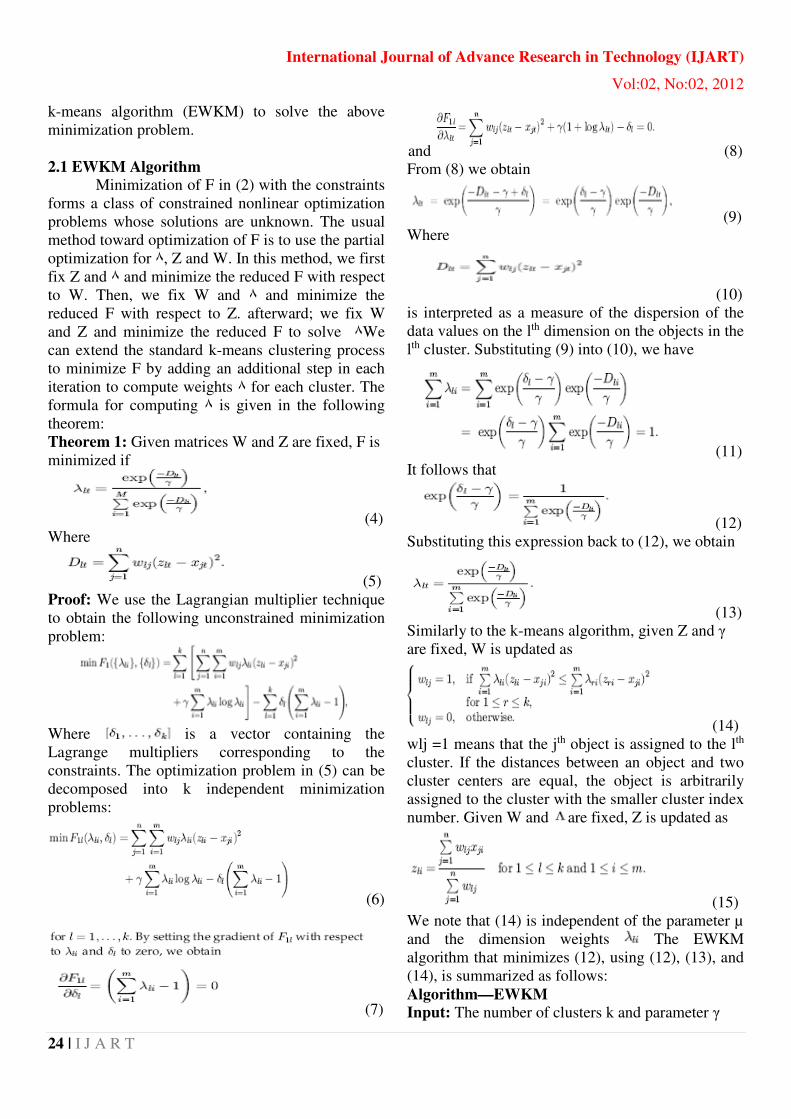
k-means algorithm (EWKM) to solve the above
minimization problem.
2.1 EWKM Algorithm
Minimization of F in (2) with the constraints
forms a class of constrained nonlinear optimization
problems whose solutions are unknown. The usual
method toward optimization of F is to use the partial
optimization for ٨, Z and W. In this method, we first
fix Z and ٨ and minimize the reduced F with respect
to W. Then, we fix W and ٨ and minimize the
reduced F with respect to Z. afterward; we fix W
and Z and minimize the reduced F to solve ٨ We
can extend the standard k-means clustering process
to minimize F by adding an additional step in each
iteration to compute weights ٨ for each cluster. The
formula for computing ٨ is given in the following
theorem:
Theorem 1: Given matrices W and Z are fixed, F is
minimized if
(4)
Where
(5)
Proof: We use the Lagrangian multiplier technique
to obtain the following unconstrained minimization
problem:
Where is a vector containing the
Lagrange multipliers corresponding to the
constraints. The optimization problem in (5) can be
decomposed into k independent minimization
problems:
(6)
(7)
and (8)
From (8) we obtain
(9)
Where
(10)
is interpreted as a measure of the dispersion of the
data values on the lth dimension on the objects in the
lth cluster. Substituting (9) into (10), we have
(11)
It follows that
(12)
Substituting this expression back to (12), we obtain
(13)
Similarly to the k-means algorithm, given Z and γ are fixed, W is updated as
(14)
wlj =1 means that the jth object is assigned to the lth
cluster. If the distances between an object and two
cluster centers are equal, the object is arbitrarily
assigned to the cluster with the smaller cluster index
number. Given W and are fixed, Z is updated as
(15)
We note that (14) is independent of the parameter µ
and the dimension weights The EWKM
algorithm that minimizes (12), using (12), (13), and
(14), is summarized as follows:
Algorithm—EWKM
Input: The number of clusters k and parameter γ

International Journal of Advance Research in Technology (IJART)
Vol:02, No:02, 2012
25 | I J A R T
Randomly choose k cluster centers and set all initial
weights to 1=m;
Repeat
Update the partition matrix W by (13);
Update the cluster centers Z by (14);
Update the dimension weights _ by (7);
Until (the objective function obtains its local
minimum value);
3. Synthetic Data Simulations
The motivation for development of the
EWKM algorithm is to cluster high-dimensional
sparse data. To better understand the properties of
the algorithm, synthetic data with controlled cluster
structures and data sparsity were first used to
investigate the relationships of the dispersion and
Fig. 1. The structure of a synthetic data set where
the gray areas represent four clusters that are formed
in different subspaces, and the white areas represent
the dimensions where data entries are either zeros or
random values. weights of dimensions in each
cluster, the behavior of parameter µ and the
performance of the algorithm on clustering accuracy
in comparison with other clustering algorithms.
3.1 Sparse Data Generation
The structure of a synthetic data set has the
following characteristics: 1) it contains more than
one cluster, 2) the data values of a cluster are
concentrated on a subset of relevant dimensions,
whereas other irrelevant dimensions contain mostly
zero values with some random positive values, and
3) the relevant dimensions for different clusters can
overlap. Fig.1 illustrates an example of a synthetic
data set with four clusters. A similar process as
given by Zait and Messatfa [17] was used to
generate the synthetic data sets with different cluster
structures. The parameters for controlling cluster
structures are listed in Table 1.The subspace ratio s
is defined as
where ml is the number of relevant dimensions in
the lth cluster, and m is the total number of
dimensions in the data set. The subspace ratio s
determines the average size of the subspace of each
cluster. The overlap ratio determines the percentage
of overlap dimensions between two clusters. The
parameter controls the percentage of the positive
values randomly generated for the irrelevant
dimensions of a cluster.
In generating a cluster, the values of relevant
dimensions conform to a normal distribution with
given means and variances. The range of mean
values is specified by parameters MINMU and
MAXMU. For the random values of irrelevant
dimensions, the value range is specified by
parameters MINV and MAXV. The number of
relevant dimensions ml of a cluster is jointly
determined by the parameters subspace ratio s and
overlap ratio , and a random number between 2
and m. The number of irrelevant dimensions in the
lth cluster is

International Journal of Advance Research in Technology (IJART)
Vol:02, No:02, 2012
26 | I J A R T
A generated synthetic data set is an n-by-m matrix.
Its sparsity is defined as
Table 2 gives the algorithm for synthetic data
generation.
3.2 Synthetic Data Sets
One hundred synthetic data sets were generated
in each type. Each data set has 135 points, 16
dimensions, and nine clusters. The subspace ratio s
was set to 0.375, which is equivalent to the average
six relevant dimensions in a cluster. The parameter
MINMU and MAXMU were set to 0 and 100,
respectively, for all data sets. To study the
relationship between the value dispersion of a
dimension and its weight value, we generated the
following three types of synthetic data by specifying
different variances for clusters in each data set:
� Type I. All the relevant dimensions in a
cluster have equal importance, so we
assigned the same variance to them.
� Type II. Assuming that some relevant
dimensions are more important than others,
we assigned small variances to the important
relevant dimensions and large variances to
the less important relevant dimensions.
� Type III. Each relevant dimension is
randomly assigned a variance.
The Algorithm for Generating Synthetic Data
Fig. 2. (a), (c), and (e) show the distributions of
dimensions over different variances for three data
types, TYPE I, TYPE II, and TYPE III. (b), (d), and
(f) are the distributions of dimensions against values
of weights γ= 0:5.
For the Type II data, the cluster variances
were randomly selected from three ranges [0.1, 0.2],
[1, 2], and [5, 6]. For the Type III data, the luster
variances were randomly selected from range [0, 6].
Parameter was set to 0.01 for generating the random
values of irrelevant dimensions and the value range
was set to [0, 5].
3.3 Simulation Results
We conducted extensive experiments on the
100 synthetic data sets, investigated the relationship
between dimension variances and weight values and
the property of parameter γ and compared the
performance of the new algorithm on clustering
performance with other subspace clustering
algorithms. Some results are reported below. Fig. 2
shows the relationships between dimension
variances and weights in three types of data sets. In
the 100 data sets, there were a total of 1,800 relevant
dimensions in 900 clusters. Figs. 2a, 2c, and 2e are
the distributions of relevant dimensions over
variance in
Fig. 3. The clustering accuracy of EWKM and
PROCLUS on the 100 synthetic data sets.
Three types of data sets, whereas Figs. 2b, 2d, and
2f show the distributions of dimensions over weight
values. We can see in Fig. 2a that all relevant
dimensions had the same variance in the Type I data
sets. This type of data resulted from the fact that
most dimension weight values were equal or close,
as shown in Fig. 2b. This indicates that relevant
dimensions with the same distribution would make a
similar contribution in identifying clusters in
subspaces. Fig. 2c shows the distribution of

International Journal of Advance Research in Technology (IJART)
Vol:02, No:02, 2012
27 | I J A R T
dimensions over variance in the Type II data sets.
We can observe that the variances for dimensions
fall in three ranges [0.1, 0.2], [1, 2], and [5, 6].
Three peaks in the distribution of dimensions over
weight values are shown in Fig. 2d. The three peaks
correspond to the three variance ranges. This
implies that, from the weight values, we are able to
relate the weight values to the relevant dimensions
in the data sets. Because the Type III data sets
randomly selected the variances for dimensions, the
distribution of dimensions in Fig. 2f is evenly
spread in the range [0, 6]. However, the importance
of relevant dimensions is still identifiable from the
weight values as shown in Fig. 2f.
Fig. 4. The clustering accuracy of different
algorithms.
These results indicate that the clustering
results were very sensitive to l, which makes the
algorithm difficult to use. Fig. 4 shows the
comparison results of seven clustering algorithms,
including EWKM and our previous clustering
algorithm FWKM [12]. Here, ith secting k-means
[16] is not a subspace clustering algorithm.
PROCLUS [7] and HARP [11] are two hard
subspace clustering algorithms. LAC [19] and
COSA [20] are two other soft subspace clustering
algorithms. We can see that EWKM outperformed
all other algorithms, although FWKM is very close.
The performances of LAC and COSA are not
affected by the data sparsity. However, we find that
their whole clustering qualities are worse than
EWKM and FWKM. The reason is that even though
LAC and COSA deal with sparse problem for high-
dimensional data, they adopt an approximation
process to minimize their objective functions so that
some raw information may be missed. The
clustering accuracy of the two hard subspace
clustering algorithms PROCLUS and HARP
dropped quickly as the sparsity increased. These
results show that EWKM was superior in clustering
complex data, such as sparse data.
4. Experimental Results on Real-World Data
In this section, we present the experimental
results on real world data. We first show the
comparison results of the EWKM algorithm and
other clustering algorithms on real text data taken
from the University of California, Irvine (UCI)
Machine Learning Repository.1 Then, we present a
real application to categorize suppliers for a retail
company in China. We used EWKM to cluster high-
dimensional sparse business transaction data to
reclassify suppliers based on their business
behaviors.
4.1 Text Data
The text data was the publicly available 20
News groups data. The original text data was first
preprocessed to strip the news messages from the e-
mail headers and special tags and eliminate the stop
words and stem words to their root forms. Then, the
words were sorted on the inverse document
frequency (IDF), and some words were removed if
the IDF values were too small or too large. The
BOW toolkit [37] was used in preprocessing. The
word in each document was weighted by the
standard
Overlapping words (dimensions) in data sets B2 and
B4. Data sets A4-U and B4-U contain unbalanced
documents in each category. Table 4 lists other 14
data sets used to test the scalability of the algorithm.
In the first group of data sets D1_6, each data set
contains 15,905 documents in 20 categories. The
International Journal of Advance Research in Technology (IJART)
Vol:02, No:02, 2012
28 | I J A R T
number of terms in these data sets changes from 500
to 2,000. In the second group of data sets E1_4, the
number of These results were consistent with the
algorithm analysis in Section 3 and demonstrated
that EWKM is scalable. Meanwhile, when
compared with the existing soft subspace clustering
algorithm COSA, These functions can be interpreted
as follows: The smaller the entropy, the better the
clustering performance.
Fig. 5. The effect of γ on clustering accuracy.
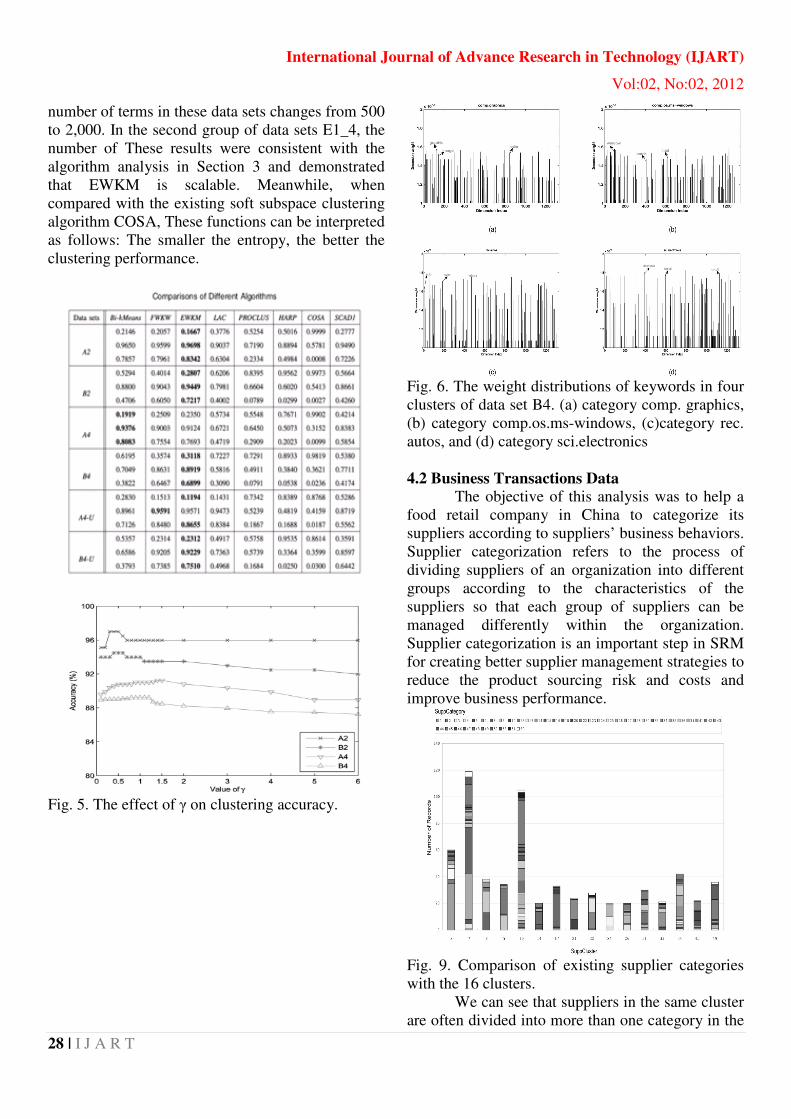
Fig. 6. The weight distributions of keywords in four
clusters of data set B4. (a) category comp. graphics,
(b) category comp.os.ms-windows, (c)category rec.
autos, and (d) category sci.electronics
4.2 Business Transactions Data
The objective of this analysis was to help a
food retail company in China to categorize its
suppliers according to suppliers’ business behaviors.
Supplier categorization refers to the process of
dividing suppliers of an organization into different
groups according to the characteristics of the
suppliers so that each group of suppliers can be
managed differently within the organization.
Supplier categorization is an important step in SRM
for creating better supplier management strategies to
reduce the product sourcing risk and costs and
improve business performance.
Fig. 9. Comparison of existing supplier categories
with the 16 clusters.
We can see that suppliers in the same cluster
are often divided into more than one category in the

International Journal of Advance Research in Technology (IJART)
Vol:02, No:02, 2012
29 | I J A R T
existing categorization. we applied EWKM to the
behavior matrix to cluster the 974 suppliers into 60
clusters. This was because the company already
classified its suppliers into 60 groups based on
suppliers’ location and the product categories that
suppliers can provide. However, suppliers’ business
behaviors were not considered in the classification.
Our result was used to readjust the existing
categorization for better selection of suppliers in
sourcing.
Conclusions
In this paper, we have presented Enhanced a
new k-means type algorithm for high-dimensional
data. In this algorithm, we simultaneously minimize
the within cluster dispersion and maximize the
negative weight entropy in the clustering process.
Because this clustering process awards more
dimensions to make contributions to identification
of each cluster, the problem of identifying clusters
by few sparse dimensions can be avoided. As such,
the sparsity problem of high-dimensional data is
tackled. The experimental results on both synthetic
and real data sets have shown that the new
algorithm outperformed other k-means type
algorithms, for example, Bisecting k-means and
FWKM, and subspace clustering methods, for
example, PROCLUS and COSA, in recovering
clusters. Except for clustering accuracy, the new
algorithm is scalable to large high-dimensional data
and easy to use because the input parameter is not
sensitive. The weight values generated in the
clustering process are also useful for other purposes,
for instance, identifying the keywords to represent
the semantics of text clustering results.
References
[1] X. Zhang, J.Z. Huang, D. Qian, J. Xu, and L.
Jing, “Supplier Categorization with k-Means Type
Subspace Clustering,” Proc.Eighth Asia Pacific
Web Conf., 2006.
[2] A.K. Jain, M.N. Murty, and P.L. Flynn, “Data
Clustering: A Review,” ACM Computing Surveys,
vol. 31, no. 3, pp. 264-323, 1999.
[3] M. Steinbach, L. Ertoz, and V. Kumar, The
Challenges of Clustering High Dimensional Data,
http://www-users.cs.umn.edu/~ertoz/
papers/clustering_chapter.pdf, 2003.
[4] D. Cai, X. He, and J. Han, “Document
Clustering Using Locality Preserving Indexing,”
IEEE Trans. Knowledge and Data Eng.,vol. 17, no.
12, Dec. 2005.
[5] D.R. Swanson, “Medical Literature as a
Potential Source of New Knowledge,” Bull. Medical
Library Assoc., vol. 78, no. 1, Jan. 1990.
[6] R. Agrawal, J. Gehrke, D. Gunopulos, and P.
Raghavan,“Automatic Subspace Clustering of High
Dimensional Data for Data Mining Applications,”
Proc. ACM SIGMOD Int’l Conf. Management of
Data, pp. 94-105, 1998.
[7] C. Aggarwal, C. Procopiuc, J.L. Wolf, P.S. Yu,
and J.S. Park, “Fast Algorithms for Projected
Clustering,” Proc. ACM SIGMOD Int’l Conf.
Management of Data, pp. 61-72, 1999.
[8] C.C. Aggarwal and P.S. Yu, “Finding
Generalized Projected Clusters in High Dimensional
Spaces,” Proc. ACM SIGMOD Int’l Conf.
Management of Data, pp. 70-81, 2000.
[9] K. Chakrabarti and S. Mehrotra, “Local
Dimensionality Reduction: A New Approach to
Indexing High Dimensional Spaces,” Proc.26th Int’l
Conf. Very Large Data Bases, pp. 89-100, 2000.
[10] C.M. Procopiuc, M. Jones, P.K. Agarwal, and
T.M. Murali, “A Monte Carlo Algorithm for Fast
Projective Clustering,” Proc. ACM SIGMOD Int’l
Conf. Management of Data, pp. 418-427, 2002.
[11] K.Y. Yip, D.W. Cheung, and M.K. Ng, “A
Practical Projected Clustering Algorithm,” IEEE
Trans. Knowledge and Data Eng.,vol. 16, no. 11, pp.
1387-1397, Nov. 2004.
[12] K.Y. Yip, D.W. Cheung, and M.K. Ng, “On
Discovery of Extremely Low-Dimensional Clusters
Using Semi-Supervised Projected Clustering,” Proc.
21st Int’l Conf. Data Eng., pp. 329-340, 2005.
[13] W.S. Desarbo, J.D. Carroll, L.A. Clark, and
P.E. Green, “Synthesized Clustering: A Method for
Amalgamating Clustering Baseswith Differential
Weighting Variables,” Psychometrika, vol. 49, pp.
57-78, 1984.
[14] G.W. Milligan, “A Validation Study of a
Variable Weighting Algorithm for Cluster
Analysis,” J. Classification, vol. 6, pp. 53-71,1989.
[15] D.S. Modha and W.S. Spangler, “Feature
Weighting in k-Means Clustering,” Machine
Learning, vol. 52, pp. 217-237, 2003.
[16] Y. Chan, W. Ching, M.K. Ng, and J.Z. Huang,
“An Optimization Algorithm for Clustering Using
Weighted Dissimilarity Measures,” Pattern
Recognition, vol. 37, no. 5, pp. 943-952, 2004.

International Journal of Advance Research in Technology (IJART)
Vol:02, No:02, 2012
30 | I J A R T
[17] H. Frigui and O. Nasraoui, “Unsupervised
Learning of Prototypes and Attribute Weights,”
Pattern Recognition, vol. 37, no. 3, pp. 567-581,
2004.
[18] H. Frigui and O. Nasraoui, “Simultaneous
Clustering and Dynamic Keyword Weighting for
Text Documents,” Survey of Text Mining, Michael
Berry, ed., pp. 45-70, Springer, 2004.
[19] C. Domeniconi, D. Papadopoulos, D.
Gunopulos, and S. Ma, “Subspace Clustering of
High Dimensional Data,” Proc. SIAM Int’l Conf.
Data Mining, 2004.
[20] J.H. Friedman and J.J. Meulman, “Clustering
Objects on Subsets of Attributes,” J. Royal
Statistical Soc. B, vol. 66, no. 4, pp. 815-849, 2004.
[20] J.H. Friedman and J.J. Meulman, “Clustering
Objects on Subsets of Attributes,” J. Royal
Statistical Soc. B, vol. 66, no. 4, pp. 815-849, 2004.