An evolutionary firefly algorithm for the estimation of nonlinear biological model parameters
Int. J. Swarm Intelligence, Vol. 1, No. 1, 2013 19
Copyright © 2013 Inderscience Enterprises Ltd.
Performance analysis of firefly algorithm for data clustering
Hema Banati and Monika Bajaj* Department of Computer Science, University of Delhi, Delhi 110007, India E-mail: [email protected] E-mail: [email protected] *Corresponding author
Abstract: Extraction of relevant information from web is gaining immense significance. This depends upon the efficacy of methods employed to represent, organise and access the information. The most important technique that is used to organise the data is clustering. Clustering problem refers to partitioning unlabeled data objects into certain number of clusters with the objective of maximum homogeneity within cluster and heterogeneity between the clusters. The paper studies viability of firefly algorithm for clustering. It incorporates the flashing behaviour of fireflies to achieve the optimal solution. The performance of the proposed algorithm FClust is compared with particle swarm optimisation (PSO) and differential evolution (DE) algorithms with respect to varied statistical criteria using artificial and benchmark datasets. A detailed convergence behaviour of algorithms is studied using run length distribution. The experimental results prove that the proposed algorithm performs better in terms of speed and success rate as compared to PSO and DE.
Keywords: firefly algorithm; data clustering.
Reference to this paper should be made as follows: Banati, H. and Bajaj, M. (2013) ‘Performance analysis of firefly algorithm for data clustering’, Int. J. Swarm Intelligence, Vol. 1, No. 1, pp.19–35.
Biographical notes: Hema Banati completed her PhD (2006) after her Masters in Computer Applications (MCA) both from Department of Computer Science, University of Delhi, India. Currently, she is an Associate Professor in the Department of Computer Science, Dyal Singh College, University of Delhi. She has over 18 years of teaching experience to both undergraduate and postgraduate classes. Over the past decade, she has been pursuing research in the areas of web engineering, software engineering, human computer interaction, multiagent systems, e-commerce and e-learning. She has many national and international publications to her credit.
Monika Bajaj is a Research Scholar in Computer Science Department at University of Delhi. Her research interests include web engineering, human computer interfaces and e-commerce. She has many national and international publications to her credit.

20 H. Banati and M. Bajaj
1 Introduction
The explosive growth of information with the popularisation of the web makes it difficult to extract relevant information. The relevance of extracted information depends upon the efficacy of methods employed to represent, organise and access the information. One such method employed is clustering that organises the data in turn facilitating the extraction of relevant information. Clustering problem refers to partitioning the unlabeled data objects into certain number of clusters. Since the objective of clustering is to achieve first homogeneity within cluster, i.e., objects belonging to the same cluster should be as similar as possible and second heterogeneity between the clusters, i.e., objects belonging to different clusters should be as different as possible, the algorithmic task can be stated as an optimisation problem (Brucker, 1978). The objective functions of clustering problems are usually non-linear and non-convex so some clustering algorithms may fall into local optimum. Moreover, they possess exponential complexity in terms of number of clusters and become an NP-hard problem when the number of clusters exceeds (Welch, 1983). Clustering is usually performed when no information is available concerning the membership of data items to predefine classes. For this reason clustering is traditionally seen as a part of unsupervised learning.
The simplest and the most popular clustering algorithm is k-means algorithm. It is very efficient, due to its linear time complexity but the deterministic local search used in algorithm, may converge to the nearest local optima. Various meta heuristics and swarm intelligence-based evolutionary algorithms such as tabu search (Al-Sultan, 1995), simulated annealing (Bandyopadhyay et al., 1998; Selim and Al-Sultan, 1991), genetic algorithms (GA) (Bandyopadhyay and Maulik, 2002a, 2002b; Bandyopadhyay et al., 1995, 1999), ant colony optimisation (ACO) (Shelokar et al., 2004), particle swarm optimisation (PSO) (Karthi et al., 2008) and differential evolution (DE) (Paterlini and Krink, 2006) are applied to clustering problem. However these algorithms successfully applied heuristic and evolutionary approaches to avoid convergence to local optima with limited success rate.
Firefly algorithm (FA) is a recently introduced nature inspired approach for solving non-linear optimisation problem (Yang, 2008, 2009). The algorithm is based on the behaviour of social insects (fireflies) where each firefly has own agenda and coordinates with other fireflies in the group (swarm) to achieve the same. Various researchers in the literature study and incorporate the flashing behaviour of fireflies for optimisation purposes. Banati and Bajaj (2011) simulate the attraction system of real fireflies that guides the feature selection procedure. The algorithm combines the rough set theory with FA algorithm to find the optimal reducts. Hönig (2010) present an approach that applies the firefly in the context of task graph scheduling. Jati and Suyanto (2011) addresses how to apply FA for travelling salesman problem (TSP). Khadwilard et al. (2011) develop FA for solving job shop scheduling problem and Senthilnath et al. (2011) measure the performance of FA with respect to supervised clustering problem.
The paper presents a new clustering approach that formulates the flashing behaviour of fireflies with the objective function of the clustering problem. The paper recasts the work of Lukasik and Zak (2009) for continuous constrained optimisation tasks to suit the need for data clustering. The study shows the applicability of standard FA to cluster arbitrary data and developed FA-based clustering algorithm FClust. The proposed algorithm is centroid evolutionary based, thus we compare the performance of FClust with two centroid evolutionary approaches viz. PSO and DE. The performance of each

Performance analysis of firefly algorithm for data clustering 21
algorithm is evaluated with respect to two statistical criteria, i.e., TWR and VRC (Paterlini and Krink, 2006) mentioned in Section 2.
The remaining sections of the paper are organised as follows. Section 2 gives an overview of the clustering problem and statistical criteria used for evaluation. Section 3 describes the FClust algorithm for clustering. Section 4 describes the experimental set-up regarding the algorithmic parameters, benchmark problems, and run schedule. Section 5 reports the main results, and finally, Section 6 presents and analysis of these results and concludes the study.
2 The problem statement
Clustering is the process of partitioning a given set of n points into K groups or clusters based on some similarity (distance) metric.
Let 1 2{ , , , }NO o o o= … be a set of N objects to be clustered and each object is represented as 1 2{ , , , }l i i ido o o o= … where oid represents a value of object i at dimension d.
The goal of clustering algorithm is to determine a set of K partitions C = {Ci,…,Ck} Then:
1
, for 1, , ,, for 1, , , 1, , and
and .
i
i j
Kk
k
C i kC C i k j k i j
C O=
≠ =∩ ≡ = = ≠
=
…… …
∪
Ø
Ø
Each cluster is represented by a cluster centre then 1 2{ , , , }kZ z z z= … is a set of cluster centres to which data objects are assigned. In this study we will use Euclidean metric as distance metric.
1i i
l lo ciz O
n ∈= ∑ (1)
where n is number of objects in cluster.
2.1 Statistical criteria
The following statistical measures are used to evaluate the results generated by different clustering algorithms (Paterlini and Krink, 2006).
2.1.1 Minimisation of trace within criteria (TRW)
This criteria equation (2) is based on pooled within groups scatter matrix W. The pooled
within scatter matrix W is defined as 1
,K
kkW
=∑ where Wk is the variance matrix of the
data object allocated to cluster Ck, where k = {1,….,K}.
( )( )1
k Tn k k k kk l li
W O O O O=
= − −∑ (2)
22 H. Banati and M. Bajaj
where klO indicates the ith data object in cluster Ck and nk is the number of objects in
cluster Ck. and ( )1
knk kkli
O O n=
= ∑ is the vector of the centroid for the cluster Ck.
2.1.2 Maximisation of variance ratio criteria
This criteria is based on pooled within groups scatter matrix W and between group scatter matrixes B. The between scatter matrix B is defined as equation (3),
( )( )1
TK k kkk
B n O O O O=
= − −∑ (3)
where ( )1.
Nli
O O N=
= ∑
( )
( )
( )( 1)
.( )
( )
trace BK
VRCtrace W
N K
⎛ ⎞⎜ ⎟−⎝ ⎠=⎛ ⎞⎜ ⎟−⎝ ⎠
(4)
3 Firefly algorithm
FA (Yang, 2008) is inspired by biochemical and social aspects of real fireflies. Real fireflies produce a short and rhythmic flash that helps them in attracting their mating partners (regardless of their sex) and also serves as protective warning mechanism. FA formulates this flashing behaviour with the objective function of the problem to be optimised.
Let us consider the optimisation problem where the task is to minimise objective function f(x) for x ∈ S ⊂ ℜn, i.e., find x* such as
( )* min ( )x X
f x f x∈
= (5)
The swarm of n fireflies solve the above mentioned problem iteratively and xi represents a solution for a firefly i at iteration t, whereas f(xi) denotes its fitness. The fitness of each firefly is determined by the landscape of the objective function. Furthermore, this fitness value determines the attractiveness of every ith member in the swarm and represented as a light intensity Ii. Initially, all fireflies are dislocated in S (randomly or employing some deterministic strategy). Each firefly finds its matting partner based on attractiveness of other fireflies in the space and move towards that partner in order to improve its fitness. The next position of firefly i at iteration t + 1 is determined as per equation (6) that considers two factors first, the attractiveness of other swarm members with higher light intensity, i.e., Ij > Ii, ∀j, j = 1,……n, j ≠ i, which is varying across distance and second a fixed random step vector ui.
( 1) (1 ) ( ) ( )i i j ix t x t x t μ+ = − + +β β (6)
where β is the attractiveness of firefly j. It states how strong it attracts firefly i in the swarm and calculate using equation (7).
Performance analysis of firefly algorithm for data clustering 23
0ijγre−=β β (7)
where rij = d(xi, xj), a Euclidean distance between two firefly i and j. In general, β0 ∈ [0, 1], describes the attractiveness at r = 0, i.e., when two fireflies are found at the same point of search space S. The value of γ ∈ [0, 10] determines the variation of attractiveness with increasing distance from communicated firefly. It is basically the light absorption coefficient and generally γ ∈ [0, 10] could be suggested (Yang, 2008, 2009). The proposed algorithm FClust recasts the above mentioned firefly algorithm scheme to improve the performance of clustering algorithm. Each firefly i is represented in k dimensions where each dimension represents the centroid of cluster and moves its position in order to achieve the objective functions stated in equations (2) and (4). The algorithm will allow a firefly to move towards its mating partner only if there is an improvement in its intensity otherwise it will move with randomised steps μi in the space with probability p. The movement of a firefly i is attracted to another (brighter) firefly j is determined by equation (6) with β0 and γ = 1 as suggested by Yang (2009).
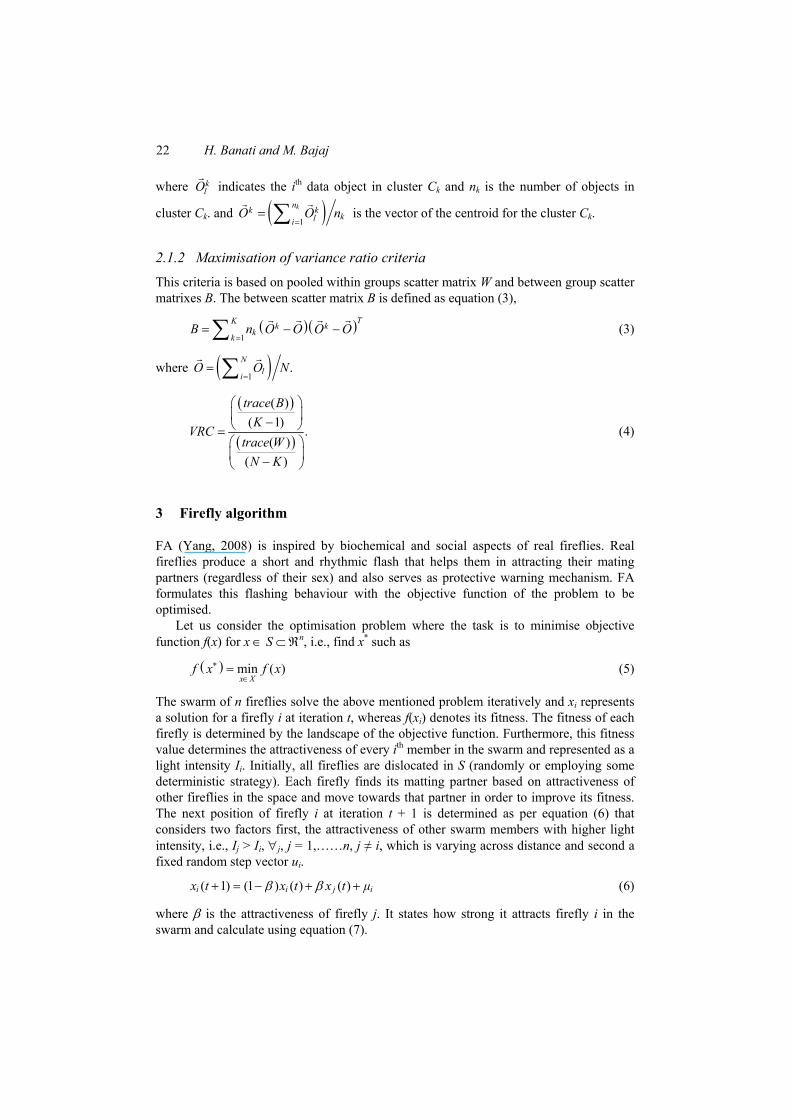
Figure 1 FClust: clustering algorithm
Input: Create randomly an initial population of n fireflies within k dimensional search space xik, i = 1, 2,……N and k = 1, 2,….K Evaluate the fitness of the population f(xi) which is directly proportional to light intensity Ii Algorithm’s parameters β0 and γ, pOutput: Obtained firefly i with minimum f(xi) while (t < maxiteration) for i = 1 to n do for j = 1 to n do if f(xj) < f(xi) then find most attractive j for i using equation (7) end if end for j for k = 1 to K do find x(t+1,k) using equation (6) end for k Evaluate x(t+1,k) using equations (2) and (4) if f(xt+1) < f(xi) then Update xit with xt+1 else if random ~ (0,1)U p>=
xt+1 = xt + ui end if end for i end while

24 H. Banati and M. Bajaj
The randomised step μi moves between lower and upper bounds. Yang (2008) proposed to use min μi = –0.5α and max μi = 0.5α with α ∈ [0, 1] being algorithm’s parameter. The algorithm FClust given in Figure 1 generates μi according to equation (8) with α = 1.
( )~ (0, 1) 0.5iμ random= −Uα (8)
Figure 1 presents the FClust clustering algorithm. The following sections focus on the experimental set and the performance analysis of the proposed algorithm.
4 Experimental set-up
The experimental study evaluates the performance of proposed algorithm FClust by comparing the results with PSO (Karthi et al., 2008), and differential equation (Paterlini and Krink, 2006). All the algorithms are executed in python 2.7 language and all the experiments are performed on a Pentium IV 400 MHz personal computer. The effectiveness of the algorithms is measured on the basis of following criterion:
1 mean best fitness value of TRW, VRC as mentioned in equations (2) and (4)
2 percentage of number of runs (i.e., success %) that reach best known objective function value over 20 simulations
3 run length distribution (RLD) as proposed by Hoose and Stutzl (2004).
The effectiveness of evolutionary algorithms depends upon the generation of initial population. Therefore all algorithms run for 20 times and allow executing 100,000 fitness evaluations in each run for each dataset. The parameter settings for PSO, DE and FClust are depicted in Table 1 and the six datasets (two artificial and four real world datasets) used for experiments are described below. Table 1 Parameter settings used for the PSO, DE, and FClust algorithms
PSO DE FClust
Parameter Value
Parameter Value
Parameter Value
Population size 50 Population size 50 Population size 50 W 0.1 Crossover rate 0.9 β0,γ 1
C1, C2 0.01 Factor 0.1 P 0.98
4.1 Artificial datasets
We have generated two simulated datasets s1 and s2 using a random number generator that produced multivariate normal distributions set of objects. The description of datasets is given below:
• Dataset s1: This dataset is composed of 300 objects with three features distributed over K = six clusters (50 objects in each cluster). The data was generated using mean μ1 = [1, 1, 1], μ1 = [5, 5, 5], μ1 = [9, 9, 9], μ1 = [–3, –3, –3], μ1 = [–7, –7, –7], μ1 = [–11, –11, –11] and sigma Σ1 = I, Σ2 = I, Σ3 = I, Σ4 = I, Σ5 = I, Σ6 = I.

Performance analysis of firefly algorithm for data clustering 25
• Dataset s2: This dataset is composed of 300 objects with three features distributed over K = 6 clusters (50 objects in each cluster). The data was generated using mean μ1 = [1, 1, 1], μ2 = [5, 5, 5], μ3 = [9, 9, 9], μ4 = [–3, –3, –3], μ5 = [13, 13, 13], μ6 = [17, 17, 17] and sigma Σ1 = I, Σ2 = I, Σ3 = I, Σ4 = I, Σ5 = I, Σ6 = I.
4.2 Benchmark datasets
In addition to artificial dataset, the following well known benchmark datasets are considered to evaluate the performance of the algorithms.
a Fisher’s iris dataset: The dataset consists of 150 samples of three iris flowers, i.e., k = 3, viz. Each object is defined by four attributes: sepal length, sepal width, petal length and petal width. This is obtained from the UCI repository of machine learning database (Fisher, 1950).
b Wine dataset: This dataset contains chemical analysis of 178 wines, derived from three different cultivars, k = 3. Each object is defined by 13: alcohol, malic acid, ash, alcalinity of ash, magnesium, total phenols, flavanoids, non-flavanoids phenols, proanthocyaninsm, colour intensity, hue, OD280/OD315 of diluted wines and proline. It is also available in the public domain of UCI repository of machine learning databases (Aeberhard et al., 1992).
c Thyroid dataset: The dataset categories 215 samples of patients suffering from three human thyroid diseases, k = 3 as: euthyroid, hyperthyroidism, and hypothyroidism patients (Coomans et al., 1978).
d Wisconsin breast cancer dataset: This dataset consists of 683 objects characterised by nine features: clump thickness, cell size uniformity, cell shape uniformity, marginal adhesion, single epithelial cell size, bare nuclei, bland chromatin, normal nucleoli and mitoses (Street et al., 1993).
5 Performance analysis
5.1 Mean best fitness value: artificial datasets
The mean best fitness values over 20 runs in the analysis with respect to artificial datasets are reported in the Table 2. The results are compared with PSO and DE algorithms. Table 2 Mean fitness values with standard error over 20 runs in the analysis of artificial
datasets
Dataset Criteria Best known values PSO DE FClust
TRW 865.71 865.71 (0) 865.71 (0) 865.17 (0) s1
VRC 2,846.77 2,836.36 (33.44) 2,846.77 (0) 2,846.77 (0)
TRW 889.76 889.76 (0) 900.99 (31.98) 889.76 (0) s2
VRC 2,756.11 2,756.11 (0) 2,751.04 (15.59) 2,756.11 (0)

26 H. Banati and M. Bajaj
The results of mean fitness in Table 2 show that for the dataset of type s1 all three algorithms (PSO, DE, FClust) converge to the same fitness value for TRW measure whereas for VRC measure, FClust and DE both achieve the optimal value with zero standard error as compare to PSO that attains the mean fitness of 2,836.36 with standard error of 33.44.
The mean best fitness for the dataset of type s2 for TRW and VRC measure reveals superior performance of FClust and PSO. Both algorithms achieve the optimal value with zero standard error as compared to DE that attains the mean fitness of 900.99 and 2,751.04 with standard error of 31.98 and 215.59 for TRW and VRC measure respectively.
5.2 Mean best fitness value: real world datasets
The mean best fitness values over 20 runs in the analysis with respect to benchmarked datasets are reported in the Table 3. The results clearly show that for iris and cancer datasets all three algorithms (PSO, DE, FClust) converge to the same fitness value (i.e., the best known value) for both TRW and VRC measures in every run. Table 3 Mean fitness values and standard error over 20 runs in the analysis of real world
datasets
Dataset Criteria Best known values PSO DE FClust
TRW 7,885.14 7,885.14 (0) 7,885.14 (0) 7,885.14 (0) Iris
VRC 561.63 561.63 (0) 561.63 (0) 561.63 (0)
TRW 19,323 19,323 (0) 19,323 (0) 19,323 (0) Cancer
VRC 1,026.26 1,026.26 (0) 1,026.26 (0) 1,026.26 (0)
TRW 2,370,689.68 2,370,689.68 (0) 2,370,689.68 (0) 2,370,689.68 (0) Wine
VRC 561.81 561.56 (0.6767) 561.81 561.81
TRW 28,560.15 28,651.65 (96.67) 28,642.22 (90.51) 28,618.33 (88.10) Thyroid
VRC 131.83 130.71 (1.13) 131.48 (0.63) 131.50 (0.55)
Regarding the wine dataset all three algorithms achieve the optimal value of TRW measure in every run. Whereas for VRC measure DE and FClust both achieve the target value but PSO has a mean value 561.56 with a standard error of (0.6766) which is acceptable at 95% of confidence level (i.e., [561.269, 561.862] that includes the optimal value 561.63).
The results of thyroid dataset reveal superior performance of FClust as compared to DE and PSO. However, all the three algorithms are not able to reach the optimal value in every run for both TRW and VRC measure, but FClust maintains the mean fitness of TRW value with 28,618.33 among all algorithms with a lower standard error of 88.10. For VRC measure all the algorithms are close to each other but FClust performs well by achieving mean fitness value of 131.50 with standard error (0.55) as compared to DE with mean value 131.48 and SE (0.63) and PSO with 130.71 mean value and standard error of 1.13.

Performance analysis of firefly algorithm for data clustering 27
5.3 Success percentage
The success rate in terms of percentage of number of runs (i.e., success %) that reach best known objective function value over 20 simulations is reported in Table 4 for artificial datasets and for benchmarked datasets in Table 5. Table 4 Percentage of number of runs (i.e., success %) for artificial datasets
Dataset Criteria PSO DE FClust
TRW 100 100 100 s1 VRC 90 100 100 TRW 100 85 100 s2 VRC 100 90 100
5.3.1 Success rate for artificial dataset
The results shown in Table 4 for s1 dataset indicate that both FClust and DE reaches the optimal value of TRW and VRC in every run whereas PSO gained 100% success rate for TRW but for VRC it is able to achieve 90% success rate out of 20 individual runs.
Regarding dataset s2, the FClust and PSO achieve the 100% success for TRW and VRC measure in every run whereas DE gained 85% success for TRW and 90% success for VRC criterion.
5.3.2 Benchmark datasets
The results shown in Table 5 indicate that PSO, DE and FClust perform well for iris and cancer datasets. Regarding wine dataset both FClust and DE reach the optimal value of TRW and VRC in every run whereas PSO gained 100% success for TRW but for VRC it is able to achieve 16 times the target value out of 20 individual runs. However, the results of thyroid dataset depict that all the three algorithms are fail to achieve 100% success for both TRW and VRC measure but FClust achieve the higher success rate by attaining 11 times the target value of TRW as compare to DE which is able to attain only nien times and PSO that achieve only six times from 20 simulations. For VRC measure FClust attain 11 times optimal value whereas DE and PSO attain ten and five times respectively. Table 5 Percentage of number of runs (i.e., success %) for benchmark datasets
Dataset Criteria Best known value PSO DE FClust
TRW 7,885.14 100 100 100 Iris VRC 561.63 100 100 100 TRW 19,323 100 100 100 Cancer VRC 1,026.26 100 100 100 TRW 2,370,689.68 100 100 100 Wine VRC 561.81 80 100 100 TRW 28,560.15 30 45 55 Thyroid VRC 131.83 25 50 55

28 H. Banati and M. Bajaj
5.3 Run length distribution
An important measure to evaluate the quality of the solutions provided by the stochastic algorithms is the number of function evaluations. Thus, we use the methodology RLD proposed by Hoos and Stutzle (2004) to analyse the convergence behaviour of algorithms with respect to the objective under consideration. RLD’s are plotted for all the datasets. RLD plot shows the convergence of the algorithms with respect to the number of function evaluations and also indicates the probability of reaching a pre-specified objective function value over specified number of functional evaluations. The probability value (success rate) is the ratio between the number of runs finding a solution of certain quality and the total number of runs. RLD plots for the artificial datasets are shown in the Figure 2 to Figure 5 and for benchmark datasets are shown in the Figure 6 to Figure 13.
5.3.1 Artificial datasets
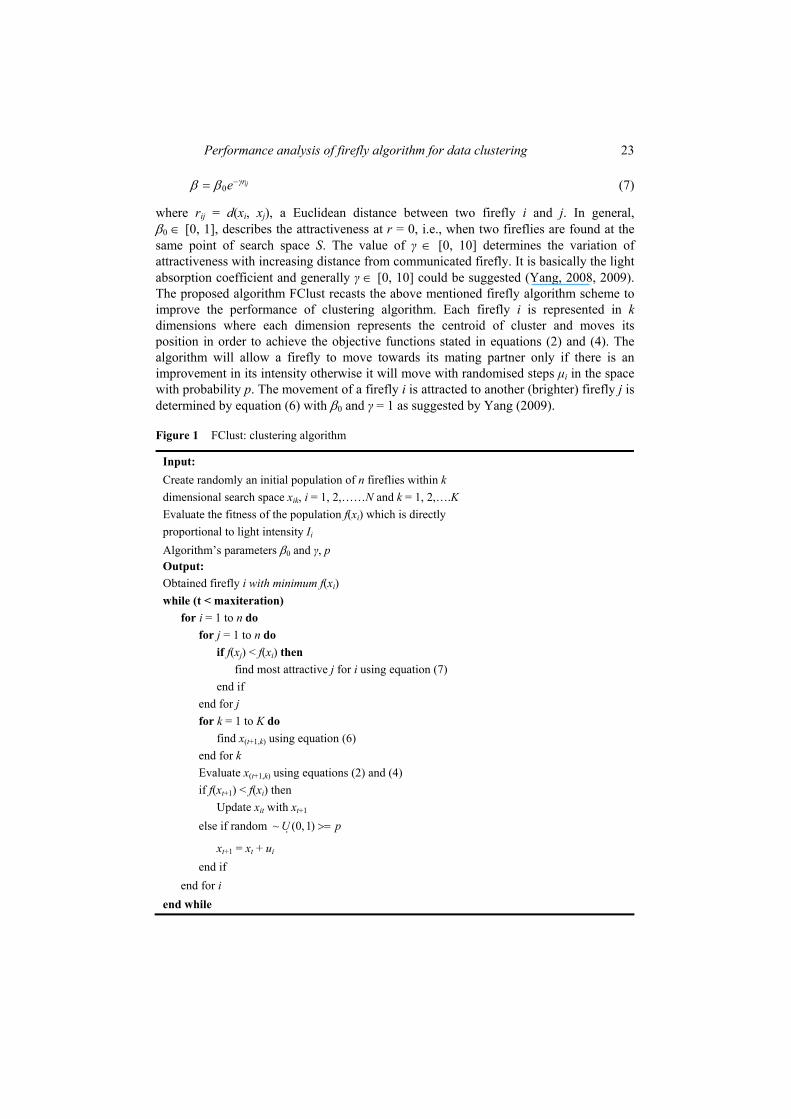
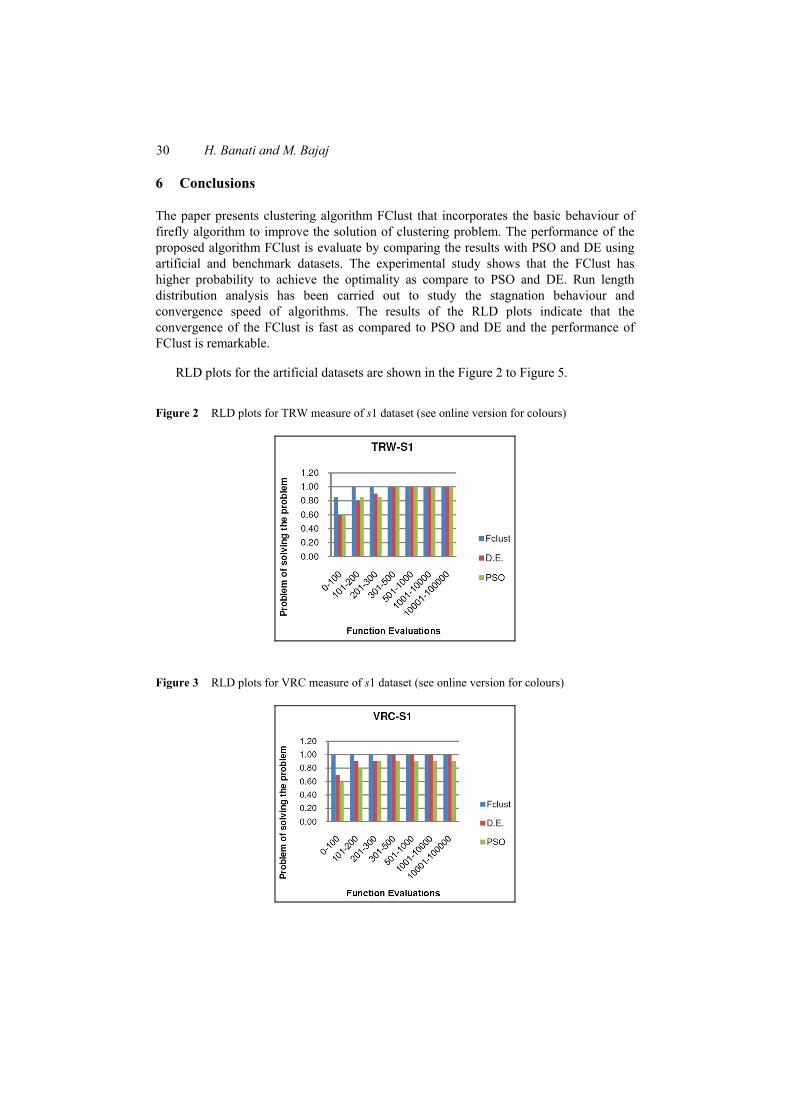
RLD for the three stochastic approaches on artificial datasets s1 for TRW metric is shown in Figure 2. The distribution shows that FClust has the fastest convergence behaviour with respect to the best known value whereas DE and PSO has a slow increasing rate towards 1.0 probability of finding the best known value. The FClust algorithm is able to achieve the best known value with the probability of 1.0 within 200 evaluations as compared to DE and PSO that achieve within 500 evaluations. Figure 3 shows the RLD for VRC measure of s1 dataset. The results show that FClust achieve the best known value with probability of 1.0 within first 100 evaluations. However, DE also attained the 0.1 probability but take 500 evaluations whereas PSO attain the 0.9 probability to solve the problem.
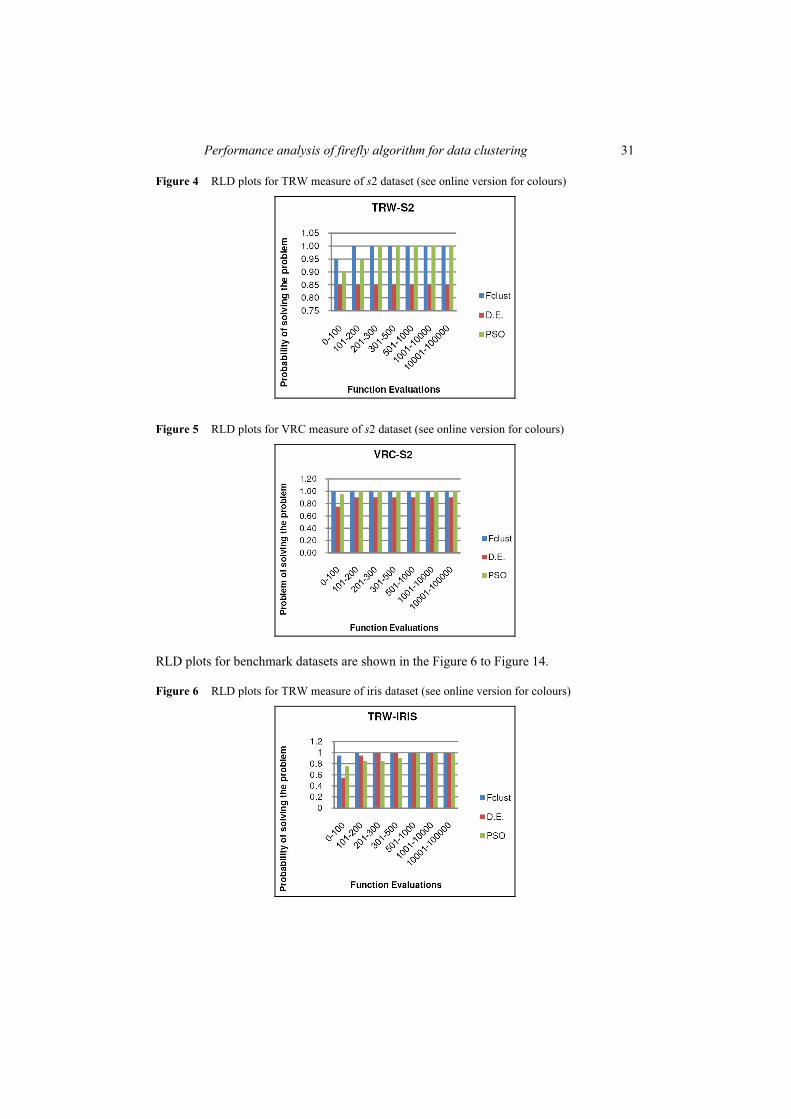
RLD for datasets s2 for TRW metrics is shown in Figure 4. The distribution shows that FClust has the fastest convergence behaviour with respect to the best known value whereas PSO has a slow increasing rate towards 1.0 probability of finding the best known value and DE has 0.85 probability to find the target value. Figure 5 shows the RLD for VRC measure of s2 dataset. The results show that FClust find the best known value with probability of 1.0 within 100 evaluations. However, PSO also attains the 0.1 probability but with slow increasing rate whereas DE has 0.9 probability of solving the problem.
5.3.2 Benchmark datasets
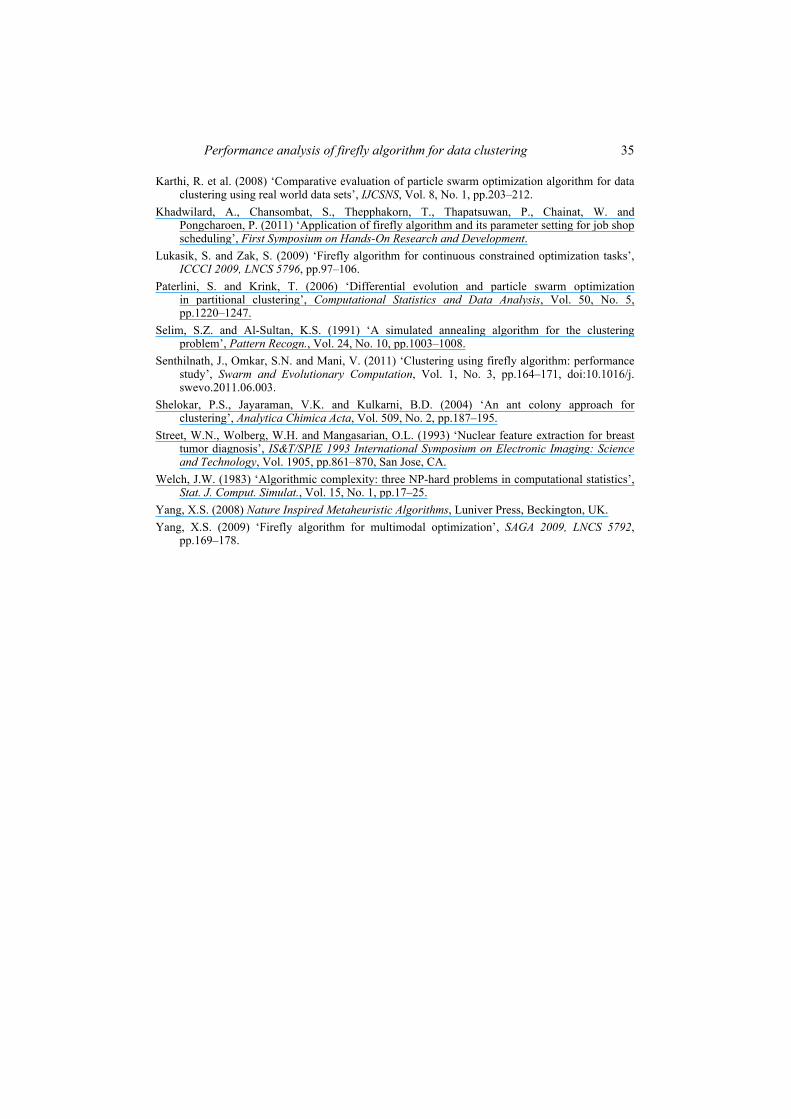
RLD for the three stochastic approaches on iris dataset for TRW metrics is shown in Figure 6. The distribution shows that all the algorithms hit the optimal value within 100 function evaluations but with different probability. FClust has 0.95 probability of achieving the best known value in first 100 function evaluations and the algorithm is able to find a solution of required quality with a probability of 1.0 in first 200 function evaluations. However, DE has 0.55 probability of finding the optimal solution in first 100 evaluations and achieves the success with 0.1 probability within 300 evaluations. PSO achieve the target with 0.75 probability in first 100 evaluations but has slow increasing rate to reach best known value with probability 0.1. Figure 7 shows the RLD of iris dataset for VRC measure. All the algorithms reach the best-known value within 100 function evaluations. However, FClust and DE find a solution of required quality

Performance analysis of firefly algorithm for data clustering 29
with a probability of 1.0 in first 200 function evaluations. But FClust has 0.85 probability of achieving the success within 100 evaluations as compare to DE and PSO that has 0.55 and 0.65 probability respectively.
RLD of cancer dataset for TRW metrics is shown in Figure 8. The distribution shows that all the algorithms are able to hit the optimal value within 100 function evaluations. Whereas FClust has 0.90 probability to find the best known value within 100 function evaluations in comparison of DE and PSO. Figure 9 shows the run length distribution of cancer dataset for VRC measure. The performance of FClust is remarkable as it finds the optimal solution within 100 evaluations in each run. Whereas DE is able to achieve the optimal value with 1.0 probability within 300 evaluations and PSO find the solution with 1.0 probability within 1,000 evaluations.
Figure 10 shows the RLD of wine dataset for TRW criteria. All the algorithms increase slowly to reach the best known value with 1.0 probability. However, FClust and DE both hit the best known value with 1.0 probability within 300 function evaluations, but FClust performs well in first 100 evaluations as compare to DE and PSO. The RLD of wine dataset for VRC measure is shown in Figure 11. The graph shows that both FClust and DE both are able to obtain the solution with 1.0 probability whereas PSO finds the best-known value with a probability of 0.80. FClust has a 0.95 probability of achieving the target value within 200 function evaluations in comparison to DE with 0.85 probability and PSO with 0.75 probability.
RLD for each algorithm on thyroid dataset for TRW metrics are shown in Figure 12. All three algorithms move slowly towards optimal value. The distribution shows that both DE and FClust are able to hit the optimal value within 100 function evaluations with 0.05 probability as compare to PSO which does not find the optimal value. However, with this dataset both DE and PSO find the optimum results with 0.45 and 0.30 probability respectively whereas the FClust performs well and achieves the maximum probability of 0.55 to find best-known value. Figure 13 shows the RLD of thyroid dataset for VRC measure. The distribution shows that this is the only case where DE initially hits the optimal value within 100 function evaluations with 0.05 probability as compare to FClust and PSO. But FClust compensates it by attaining the maximum probability of finding best-known value among all three algorithms. PSO and DE find a solution of required quality with a probability of 0.25 and 0.5 respectively whereas FClust achieves the 0.55 probability of finding a solution of required quality which is remarkable performance.
Interesting observations can be made from the RDL’s for TRW measure. All three algorithms hit the best-known value within 100 evaluations and have increasing success rate to reach optimal value for the dataset. DE and FClust performed well in most of the cases but FClust ensures the maximum probability of finding best-known value among all three algorithms. It is also observe that the convergence of the FClust is fast for most of the benchmark datasets such as iris, cancer and wine. Another interesting observation from the RLDs for VRC metric is that the performance of FClust is remarkable with respect to benchmark datasets. The FClust algorithm has higher probability to find the required optimal value in comparison to DE and PSO. Thus, the convergence of the proposed FClust algorithm for the VRC measure is faster as compare to DE and PSO for most of the benchmark problems.
30 H. Banati and M. Bajaj
6 Conclusions
The paper presents clustering algorithm FClust that incorporates the basic behaviour of firefly algorithm to improve the solution of clustering problem. The performance of the proposed algorithm FClust is evaluate by comparing the results with PSO and DE using artificial and benchmark datasets. The experimental study shows that the FClust has higher probability to achieve the optimality as compare to PSO and DE. Run length distribution analysis has been carried out to study the stagnation behaviour and convergence speed of algorithms. The results of the RLD plots indicate that the convergence of the FClust is fast as compared to PSO and DE and the performance of FClust is remarkable.
RLD plots for the artificial datasets are shown in the Figure 2 to Figure 5.
Figure 2 RLD plots for TRW measure of s1 dataset (see online version for colours)
Figure 3 RLD plots for VRC measure of s1 dataset (see online version for colours)
Performance analysis of firefly algorithm for data clustering 31
Figure 4 RLD plots for TRW measure of s2 dataset (see online version for colours)
Figure 5 RLD plots for VRC measure of s2 dataset (see online version for colours)
RLD plots for benchmark datasets are shown in the Figure 6 to Figure 14.
Figure 6 RLD plots for TRW measure of iris dataset (see online version for colours)

32 H. Banati and M. Bajaj
Figure 7 RLD plots for VRC measure of iris dataset (see online version for colours)
Figure 8 RLD plots for TRW measure of cancer dataset (see online version for colours)
Figure 9 RLD plots for VRC measure of cancer dataset (see online version for colours)

Performance analysis of firefly algorithm for data clustering 33
Figure 10 RLD plots for TRW measure of wine dataset (see online version for colours)
Figure 11 RLD plots for VRC measure of wine dataset (see online version for colours)
Figure 12 RLD plots for TRW measure of thyroid dataset (see online version for colours)

34 H. Banati and M. Bajaj
Figure 13 RLD plots for VRC measure of thyroid dataset (see online version for colours)
References Aeberhard, S., Coomans, D. and de Vel, O. (1992) Comparison of Classifiers in High Dimensional
Settings, Tech. Rep. No. 92-02, Department of Computer Science and Department of Mathematics and Statistics, James Cook University of North Queensland.
Al-Sultan, K.S. (1995) ‘A tabbu search to the clustering problem’, Pattern Recognition, Vol. 28, No. 9, pp.1443–1451.
Banati, H. and Bajaj, M. (2011) ‘Firefly based feature selection approach’, Int. J. Computer Science Issues, Vol. 8, No. 2, pp.473–480.
Bandyopadhyay, S. and Maulik, U. (2002a) ‘An evolutionary technique based on K-means algorithm for optimal clustering’, Information Sciences, Vol. 146, Nos. 1–4, pp.221–237.
Bandyopadhyay, S. and Maulik, U. (2002b) ‘Genetic clustering for automatic evolution of clusters and application to image classification’, Pattern Recognition, Vol. 35, No. 6, pp.1197–1208.
Bandyopadhyay, S., Murthy, C.A. and Pal, S.K. (1995) ‘Pattern classification with genetic algorithms’, Pattern Recognition Letters, Vol. 16, No. 8, pp.801–808.
Bandyopadhyay, S., Murthy, C.A. and Pal, S.K. (1999) ‘Theoretic performance of genetic pattern classifier’, Journal of The Franklin Institute, Vol. 336, No. 3, pp.387–422.
Bandyopadhyay, S., Pal, S.K. and Murthy, C.A. (1998) ‘Simulated annealing based pattern classification’, Journal of Information Sciences, Vol. 109, Nos. 1–4, pp.165–184.
Brucker, P. (1978) ‘On the complexity of clustering problems’, in Beckmenn, M. and Kunzi, H.P. (Eds.): Optimization and Operations Research, Lecture Notes in Economics and Mathematical Systems, Vol. 157, No. 1, pp.45–54, Berlin, Springer.
Coomans, D., Jonckheer, M., Massart, D.L., Broechaert, I. and Blockx, P. (1978) ‘The application of linear discriminant analysis in the diagnosis of thyroid diseases’, Analytica Chimica Acta, Vol. 103, No. 4, pp.409–415.
Fisher, R.A. (1950) ‘The use of multiple measurements in taxonomic problems’, Annual Eugenics, Vol. 7, Part II, pp.179–188 (1936); also in Contributions to Mathematical Statistics, John Wiley, NY (1950).
Hönig, U. (2010) ‘A firefly algorithm-based approach for scheduling task graphs in homogenous systems’, Proceeding Informatics, 724p, doi:10.2316/P.2010.724-033.
Hoos, H.H. and Stutzle, T. (2004) Stochastic Local Search: Foundation and Applications, Morgan Kaufmann, San Francisco, CA, USA.
Jati, G.K. and Suyanto, S. (2011) ‘Evolutionary discrete firefly algorithm for travelling salesman problem’, ICAIS2011, Lecture Notes in Artificial Intelligence (LNAI 6943), pp.393–403.
Performance analysis of firefly algorithm for data clustering 35
Karthi, R. et al. (2008) ‘Comparative evaluation of particle swarm optimization algorithm for data clustering using real world data sets’, IJCSNS, Vol. 8, No. 1, pp.203–212.
Khadwilard, A., Chansombat, S., Thepphakorn, T., Thapatsuwan, P., Chainat, W. and Pongcharoen, P. (2011) ‘Application of firefly algorithm and its parameter setting for job shop scheduling’, First Symposium on Hands-On Research and Development.
Lukasik, S. and Zak, S. (2009) ‘Firefly algorithm for continuous constrained optimization tasks’, ICCCI 2009, LNCS 5796, pp.97–106.
Paterlini, S. and Krink, T. (2006) ‘Differential evolution and particle swarm optimization in partitional clustering’, Computational Statistics and Data Analysis, Vol. 50, No. 5, pp.1220–1247.
Selim, S.Z. and Al-Sultan, K.S. (1991) ‘A simulated annealing algorithm for the clustering problem’, Pattern Recogn., Vol. 24, No. 10, pp.1003–1008.
Senthilnath, J., Omkar, S.N. and Mani, V. (2011) ‘Clustering using firefly algorithm: performance study’, Swarm and Evolutionary Computation, Vol. 1, No. 3, pp.164–171, doi:10.1016/j. swevo.2011.06.003.
Shelokar, P.S., Jayaraman, V.K. and Kulkarni, B.D. (2004) ‘An ant colony approach for clustering’, Analytica Chimica Acta, Vol. 509, No. 2, pp.187–195.
Street, W.N., Wolberg, W.H. and Mangasarian, O.L. (1993) ‘Nuclear feature extraction for breast tumor diagnosis’, IS&T/SPIE 1993 International Symposium on Electronic Imaging: Science and Technology, Vol. 1905, pp.861–870, San Jose, CA.
Welch, J.W. (1983) ‘Algorithmic complexity: three NP-hard problems in computational statistics’, Stat. J. Comput. Simulat., Vol. 15, No. 1, pp.17–25.
Yang, X.S. (2008) Nature Inspired Metaheuristic Algorithms, Luniver Press, Beckington, UK. Yang, X.S. (2009) ‘Firefly algorithm for multimodal optimization’, SAGA 2009, LNCS 5792,
pp.169–178.
Copyright © 2022 FDOKUMEN