Supplier Categorization with K -Means Type Subspace Clustering
12
Supplier Categorization with K -Means Type Subspace Clustering Xingjun Zhang 1,3 , Joshua Zhexue Huang 2 , Depei Qian 1 , Jun Xu 2 , and Liping Jing 2 1 Computer School, The Beihang University, Beijing, China {xjzhang, dpqian}@xjtu.edu.cn 2 E-Business Technology Institute, The University of Hong Kong, Hong Kong, China {jhuang, fxu, lpjing}@eti.hku.hk 3 Department of Computer Science, Xi’an Jiaotong University, Xi’an, China [email protected] Abstract. Many large enterprises work with thousands of suppliers to provide raw materials, product components and final products. Supplier relationship management (SRM) is a business strategy to reduce logistic costs and improve business performance and competitiveness. Effective categorization of suppliers is an important step in supplier relationship management. In this paper, we present a data-driven method to cate- gorize suppliers from the suppliers’ business behaviors that are derived from a large number of business transactions between suppliers and the buyer. A supplier business behavior is described as the set of product items it has provided in a given time period, a mount of each item in each order, the frequencies of orders, as well as other attributes such as prod- uct quality, product arrival time, etc. Categorization of suppliers based on business behaviors is a problem of clustering high dimensional data. We used the k-means type subspace clustering algorithm FW-KMeans to solve this high dimensional, sparse data clustering problem. We have applied this algorithm to a real data set from a food retail company to categorize over 1000 suppliers based on 11 months transaction data. Our results have produced better groupings of suppliers which can enhance the company’s SRM. Keywords: Clustering, Feature Weighting, Supplier Categorization. 1 Introduction Supplier categorization refers to the process of dividing suppliers of an orga- nization into different groups according to the characteristics of the suppliers so each group of suppliers can be managed differently within the organization. This work was part-supported by the Intel University Research HPC Program and the EIES Science Foundation Project of Xi’an Jiaotong University. X. Zhou et al. (Eds.): APWeb 2006, LNCS 3841, pp. 226–237, 2006. c Springer-Verlag Berlin Heidelberg 2006
Transcript of Supplier Categorization with K -Means Type Subspace Clustering

Supplier Categorization with K -Means TypeSubspace Clustering�
Xingjun Zhang1,3, Joshua Zhexue Huang2, Depei Qian1,Jun Xu2, and Liping Jing2
1 Computer School, The Beihang University, Beijing, China{xjzhang, dpqian}@xjtu.edu.cn
2 E-Business Technology Institute, The University of Hong Kong,Hong Kong, China
{jhuang, fxu, lpjing}@eti.hku.hk3 Department of Computer Science, Xi’an Jiaotong University,
Xi’an, [email protected]
Abstract. Many large enterprises work with thousands of suppliers toprovide raw materials, product components and final products. Supplierrelationship management (SRM) is a business strategy to reduce logisticcosts and improve business performance and competitiveness. Effectivecategorization of suppliers is an important step in supplier relationshipmanagement. In this paper, we present a data-driven method to cate-gorize suppliers from the suppliers’ business behaviors that are derivedfrom a large number of business transactions between suppliers and thebuyer. A supplier business behavior is described as the set of productitems it has provided in a given time period, a mount of each item in eachorder, the frequencies of orders, as well as other attributes such as prod-uct quality, product arrival time, etc. Categorization of suppliers basedon business behaviors is a problem of clustering high dimensional data.We used the k-means type subspace clustering algorithm FW-KMeansto solve this high dimensional, sparse data clustering problem. We haveapplied this algorithm to a real data set from a food retail company tocategorize over 1000 suppliers based on 11 months transaction data. Ourresults have produced better groupings of suppliers which can enhancethe company’s SRM.
Keywords: Clustering, Feature Weighting, Supplier Categorization.
1 Introduction
Supplier categorization refers to the process of dividing suppliers of an orga-nization into different groups according to the characteristics of the suppliersso each group of suppliers can be managed differently within the organization.� This work was part-supported by the Intel University Research HPC Program and
the EIES Science Foundation Project of Xi’an Jiaotong University.
X. Zhou et al. (Eds.): APWeb 2006, LNCS 3841, pp. 226–237, 2006.c© Springer-Verlag Berlin Heidelberg 2006
lenovo
文本框
lenovo
文本框
Supplier Categorization with K -Means Type Subspace Clustering 227
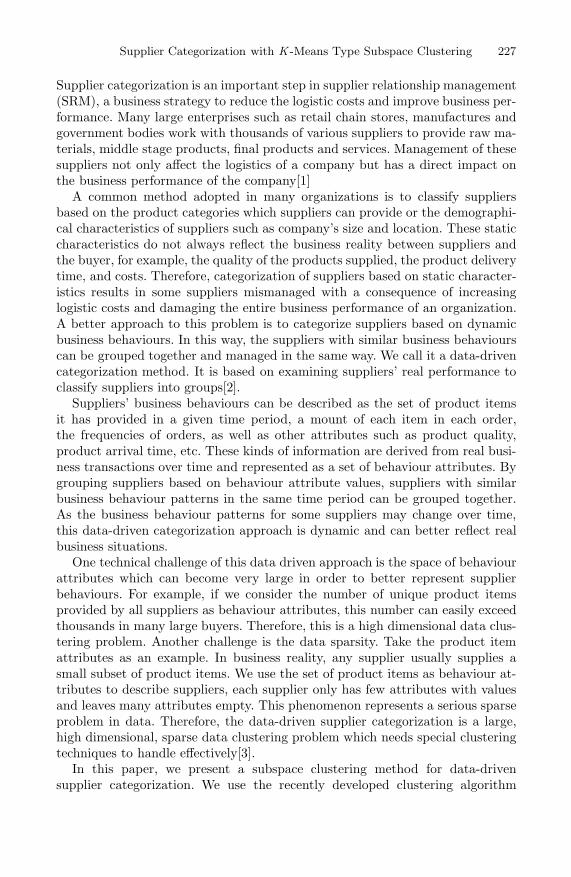
Supplier categorization is an important step in supplier relationship management(SRM), a business strategy to reduce the logistic costs and improve business per-formance. Many large enterprises such as retail chain stores, manufactures andgovernment bodies work with thousands of various suppliers to provide raw ma-terials, middle stage products, final products and services. Management of thesesuppliers not only affect the logistics of a company but has a direct impact onthe business performance of the company[1]
A common method adopted in many organizations is to classify suppliersbased on the product categories which suppliers can provide or the demographi-cal characteristics of suppliers such as company’s size and location. These staticcharacteristics do not always reflect the business reality between suppliers andthe buyer, for example, the quality of the products supplied, the product deliverytime, and costs. Therefore, categorization of suppliers based on static character-istics results in some suppliers mismanaged with a consequence of increasinglogistic costs and damaging the entire business performance of an organization.A better approach to this problem is to categorize suppliers based on dynamicbusiness behaviours. In this way, the suppliers with similar business behaviourscan be grouped together and managed in the same way. We call it a data-drivencategorization method. It is based on examining suppliers’ real performance toclassify suppliers into groups[2].
Suppliers’ business behaviours can be described as the set of product itemsit has provided in a given time period, a mount of each item in each order,the frequencies of orders, as well as other attributes such as product quality,product arrival time, etc. These kinds of information are derived from real busi-ness transactions over time and represented as a set of behaviour attributes. Bygrouping suppliers based on behaviour attribute values, suppliers with similarbusiness behaviour patterns in the same time period can be grouped together.As the business behaviour patterns for some suppliers may change over time,this data-driven categorization approach is dynamic and can better reflect realbusiness situations.
One technical challenge of this data driven approach is the space of behaviourattributes which can become very large in order to better represent supplierbehaviours. For example, if we consider the number of unique product itemsprovided by all suppliers as behaviour attributes, this number can easily exceedthousands in many large buyers. Therefore, this is a high dimensional data clus-tering problem. Another challenge is the data sparsity. Take the product itemattributes as an example. In business reality, any supplier usually supplies asmall subset of product items. We use the set of product items as behaviour at-tributes to describe suppliers, each supplier only has few attributes with valuesand leaves many attributes empty. This phenomenon represents a serious sparseproblem in data. Therefore, the data-driven supplier categorization is a large,high dimensional, sparse data clustering problem which needs special clusteringtechniques to handle effectively[3].
In this paper, we present a subspace clustering method for data-drivensupplier categorization. We use the recently developed clustering algorithm

228 X. Zhang et al.
FW-KMeans [4][5][6] to categorize suppliers from business behaviours repre-sented in a large, high dimensional sparse data matrix. FW-KMeans is a k-meanstype subspace clustering algorithm that identifies clusters from subspaces by au-tomatically assigning large weights to the attributes that form the subspacesin which the clusters are formed. The most remarkable metric of the algorithmis that it can handle highly sparse data. We have applied FW-KMeans to textdata, which outperformed other k-means clustering algorithms. This work isthe first time to apply FW-KMeans to dynamically categorize suppliers fromhigh dimensional, sparse behaviour data which is different from the text datadistribution.
We have applied our data-driven supplier categorization approach to a realdataset from a food product retail chain company. This company operates over330 outlets in a large Chinese city to sell both Chinese and Western food prod-ucts. It has more than thousands suppliers around the world to supply over seventhousands different product items to its shops. To improve their supplier relation-ship management and reduce logistics costs, this company wanted to readjustits current supplier groupings based on dynamic business behaviour patterns.We have used the FW-KMeans clustering algorithm to its supplier transactiondata and produced satisfactory results for the company. Some important resultsin this work include the following:
• We propose a data-driven supplier categorization approach to categorize sup-pliers from dynamic business behaviours, rather than static demographicaldata commonly used;
• We propose to use the k-means type subspace clustering algorithm FW-KMeans to solve the high dimensional, sparse data clustering problem;
• We have applied this approach to a real data set to demonstrate its usefulnessin supplier relationship management.
The rest of the paper is organized as follows. Section 2 describes the data-driven supplier categorization. Section 3 presents the method of subspace clus-tering with the feature weighting k-means algorithm. Following the discussion ofour method, we present, in Section 4, a real case study of using FW-KMeans tocategorize suppliers for a food product retail chain company. Finally, we drawsome conclusions and point out our future work in Section 5.
2 Data-Driven Supplier Categorization
Supplier management manages the business with suppliers, including supplierselection, purchase order (PO), product delivery, quality control and payment.Effective supplier management can reduce logistic costs and affects the bottomline of business in a company. In a company, suppliers are usually divided intogroups managed by different portfolio managers. Suppliers in each group arecategorized with product categories provided and demographical characteristicsof suppliers such as company’s size and location.
lenovo
文本框

Supplier Categorization with K -Means Type Subspace Clustering 229
The above static categorization of suppliers does not really reflect the realbusiness behaviours of suppliers in supplier groups. For example, two suppli-ers in the same group that provide similar product categories and have similardemographical characteristics may commit business in very different ways. Forexample, one supplier may always delay the delivery where the other can onlyprovide a subset of products in good quality. Although these two suppliers arein the same group, they should be treated differently. Identification of differentbusiness behaviours of suppliers requires dynamic analysis of business data todiscover the business behaviour of each supplier and categorize them accord-ing to the real business behaviours. This process is called data-driven suppliercategorization which can help better understand suppliers, adjust the suppliergrouping, and make the supplier management more efficient[7].
A Component of Business Intelligence Analyzer
Supplier Static Data
Demographic Data Product Data
Dynamic Data
Transaction Data
Preprocessing
Behavior Data
Subspace ClustreingStatic Supplier Categorize
Supervised Supplier Categorization Management
Supplier Relationship Management
Supply Chain Planning Optimization…
Fig. 1. BI Component Architecture
Figure 1 shows the system architecture for data-driven supplier categorizationand management. We can consider this as a component of the enterprise businessintelligence solution system. The outputs of this component are used by supplierrelationship management or supply chain planning and optimization. The sup-plier categorization component integrates two categorization results, the staticcategorization based on supplier’s product data and demographic data, and thedynamic categorization based on the data of business transactions committed bysuppliers. To conduct dynamic categorization, the large volume of transactiondata needs to be converted into behaviour data in the data pre-processing steps.
The business behaviour of a supplier at a given time period can be describedby a set of behaviour attributes, such as the set of product items purchased inthe past 6 months, the quantity and amount of each item, the delivery of eachpurchase and the quality of the products in each delivery, etc. Each supplieris represented as a set of values of these behaviour attributes. The entire setof suppliers is represented as an N x P matrix where N is the total number ofsuppliers and P is the total number of behaviour attributes used to representbehaviours of all suppliers. Each element of the matrix is the value of a particularattribute for a particular supplier.

230 X. Zhang et al.
When the supplier behaviour matrix is created, the dynamic categorizationof suppliers is treated as a clustering problem, i.e., clustering suppliers based onthe behaviour attribute values. Given a matrix and a clustering algorithm, thiscan be easily done. However, the real characteristics of the behaviour matrixrepresent a number of challenges to the clustering algorithms. (1) The matrixcan be very large with thousands of suppliers and behaviour attributes. This isa very high dimensional data clustering problem. (2) The matrix may containdifferent types of data, depending on the selected behaviour attributes. (3) Thematrix is very sparse, i.e., different suppliers have values in different subsets ofbehaviour attribute. For example, if we use the product items as behaviour at-tributes, different suppliers supplied different kinds of products to the company,e.g., some supplying food products and some supplying toys. In this case, thesuppliers providing food products did not have values for the toy product itemattributes while the suppliers supplying toy products did not have values for thefood product item attributes. This high sparse matrix requires the clusteringalgorithms to be able to find clusters from the subspace of the behaviour at-tribute space. Therefore, in this work, we use the newly developed k-means typesubspace clustering algorithm FW-KMeans we discuss in the following section.
3 Feature Weighting K -Means Subspace ClusteringAlgorithm
The FW-KMeans algorithm was developed to cluster text data with high dimen-sionality and sparsity [6]. In text clustering, documents are represented using abag-of-words representation [8]. In this representation (also named as VSM ), aset of documents are represented as a set of vectors X = {X1, X2, . . . , Xn}. Eachvector Xj is characterized by a set of m terms or words, (t1, t2, . . . , tm). Here, theterms can be considered as the features of the vector space and m as the numberof dimensions representing the total number of terms in the vocabulary. Assumethat several categories exist in X, each category of documents is characterizedby a subset of terms in the vocabulary that corresponds to a subset of featuresin the vector space. In this sense, we say that a cluster of documents is situatedin a subspace of the vector space.
The supplier behavior data can be represented in the same way. Each supplieris equivalent to a document and each behavior equals to a term in the vocabulary
Table 1. An example of supplier behavior data matrix
i0 i1 i2 i3 i4 C
1 1 1 0 0
1 1 0 0 0
s0
s1
s2 0 1 1 0 0
C0
0 0 1 1 1
0 0 1 1 1
s3
s4
s5 0 0 0 1 1
C1
lenovo
文本框

Supplier Categorization with K -Means Type Subspace Clustering 231
which is equivalent to the set of behavior attributes. Table 1 shows a simpleexample of the supplier behavior data matrix. There are 6 suppliers divided intotwo groups. Each column i is a behavior attribute for a product item. 1 indicatethat the company bought that product from the supplier while 0 means thatproduct item was not bought. The real supplier behavior data matrix can bemuch larger than this simple one.
We can see that there are many zero entries in the table. In clustering weneed to focus on the attributes with non-zero values, instead of the entire at-tribute space. How to find clusters from the non-zero attributes while ignoringthe attributes with zero values is a problem of subspace clustering that can besolved by the feature weighting k-means algorithm[4].
The feature weighting k -means finds the weight for each feature from eachcluster. Let Λ = (Λ1, Λ2, . . . , Λk) be the set of weight vectors for all clusters;Λl = (λl,1, λl,2, . . . , λl,m) be the weights for m features from the lth cluster.During the k-means clustering process, FW-KMeans automatically calculatesthe feature weights which produces a k × m weights matrix. That is to say, ineach cluster m weights are assigned to m features. The weights can be used todetermine which attributes are important in discovering the clusters. To calculatethe weights in the k-means clustering process, we minimize the following costfunction:
F (W, Z, Λ) =k∑
l=1
n∑
j=1
m∑
i=1
wl,jλβl,i[d(zl,i, xj,i) + σ] (1)
subject to ⎧⎪⎪⎪⎪⎨
⎪⎪⎪⎪⎩
k∑l=1
wl,j = 1, 1 ≤ j ≤ n
wl,j ∈ {0, 1}, 1 ≤ j ≤ n, 1 ≤ l ≤ km∑
i=1λl,i = 1, 0 ≤ λl,i ≤ 1, 1 ≤ l ≤ k
(2)
where k(≤ n) is a known number of clusters, β is an exponent greater than 1 [5];W = [wl,j ] is a k × n integer matrix; Z = [Z1, Z2, . . . , Zk] ∈ Rk×m represents kcluster centers; d(zl,i, xj,i) (≥ 0) is a distance or dissimilarity measure betweenobject j and the centroid of cluster l on the ith feature. Usually, we use Euclideandistance:
d(xj,i, zl,i) = (xj,i − zl,i)2 (3)
The value of parameter σ will affect the feature weighting process. If σ is muchlarger than d(z̃l,i, xj,i), the weights will be dominated by σ and λl,i will approachto 1
m . This will make the clustering process back to the standard k-means. If σis too small, then the gap of the weights between the zero dispersion featuresand other important features will be big, therefore, undermining the importanceof other features. To balance we calculate σ based on the average dispersion ofthe entire data set for all features as follows:
σ =
∑n̂j=1
∑mi=1 d(xj,i, oi)n̂ · m
(4)

232 X. Zhang et al.
where oi is the mean feature value of the entire data set. In practice we use asample instead of the entire data set to calculate σ. (5% sample is used accordingto the sampling theory [9].) n̂ is the number of objects in the sample. Experi-mental results in [4] have shown that this selection of σ is reasonable to producesatisfactory clustering results and identify important features of clusters.
4 Supplier Categorization with FW-KMeans
In this section, we discuss the use of FW-KMeans to categorize suppliers froma real data set taken from a food retail chain company and present the results.We first present supplier transaction data and conversion from transaction datato behavior descriptions of suppliers. Then we show the clustering results anddiscuss validation analysis.
4.1 Transaction Data
A supplier business behavior in a given time period is recorded in a set of businesstransactions occurred at different time points. A business transaction records apurchase of food products of a set of product items. The most relevant data at-tributes in a transaction include the amount, quantity and price of each productitem and the time and date that the transaction was committed. In this experi-ment, We extracted transaction data of 974 suppliers in a 10 1/2 month period,from 1 January 2004 to 16 November 2004. Below is the summary of the data[10].
Table 2. Summary of transaction data
Total number of transactions: 3,945,190 RecordsGross amount: 1,235,581,986HKDTotal number of items: 16,323 ItemsTotal number of purchased items: 7,441 ItemsNumber of items categories: 100 ItemCatsTotal number of suppliers: 974 Suppliers
The company has a total number of 2,399 suppliers that are grouped intofour broad categories: active external suppliers, inactive external suppliers, in-ternal suppliers with a supplier coded as 4XXXXX and internal suppliers witha supplier coded 9XXXXX. We were only interested in the 974 active externalsuppliers. Each record of the row transaction data contains much information.The focus of our studies is to classify suppliers according to the actual tradedata using our clustering algorithm. We pre-processed the transaction data andconverted it into behaviour attribute representation so the suppliers could beclustered according to behaviour patterns.
The behaviour data matrix has 100 columns and 974 rows. Each column rep-resents one item category and each row represents one supplier. In the behaviour
lenovo
文本框

Supplier Categorization with K -Means Type Subspace Clustering 233
data, we only consider the items each supplier has provided. The cell of the ma-trix is the purchase amount (its dimension is money) for each supplier on eachitem category. Figure 2 show the data matrix. A black dot in the figure denotesthat the supplier bought certain quantity of the given category. A blank cell indi-cates that the corresponding supplier didn’t supply the corresponding categoryitems. We can see that the data is very sparse.
ItemCat
Supplie
rs
20 40 60 80 100
100
200
300
400
500
600
700
800
900
Fig. 2. Matrix Map Image of Trans. Data
4.2 Supplier Categorization with FW-KMeans
In this section, we discuss use of the FW-KMeans clustering algorithm to catego-rize the 974 suppliers based on the behaviors of product item supplying patterns.We first converted the transaction data into a supplier and behavior attributematrix. The behavior attributes are 100 top product items purchased and theelements of the matrix are the purchase amount which was normalized to bea proportion of the real purchase amount over the total purchase amount fromthis supplier. This would make two suppliers of different sizes with the samepurchasing pattern very similar. In this way, the suppliers in a cluster have thesame set of items purchased and the purchase amount for each item accountedfor the same portion of total purchases.
The company already categorized their existing suppliers based on the staticinformation of the suppliers. Because of the dissimilarity of purchase patternsin different suppliers of the same category, the current supplier classificationmakes a lot of bias on the supplier relationship management. For instance, thesuppliers in the same class are treated same although their dynamic business

234 X. Zhang et al.
behaviours were very different. The purpose of re-categorizing suppliers basedon real business behaviours was to adjust the existing categorization and offersuppliers with different business behaviours different relationship managementstrategies.
0
20
40
60
80
100
120
140
160
1 2 3 4 5 6 7 8 9 10 12 13 14 15 16 18 19 20 22 23 24 25 26 27 28 29 30 31 32 33 34 35 36 37 38 39 40 41 42 43 44 45 46 47 48 49 50 51 53 54 60
0 1 2 3 4 5 6 7 8 9 10 11 12 13 15 16 18 1920 21 22 24 25 26 27 28 30 31 32 33 36 37 38 40 41 4243 44 45 46 47 48 49 50 51 52 53 54 58 59
Fig. 3. Comparing Supplier Categories vs. Supplier Clusters
We used FW-KMeans to cluster the supplier and behaviour attribute matrix.The experiment was conducted on a machine with a Pentium (R) 1.8G CPUand 512M RAM. The parameter was assigned to 1.5 and K was assigned to 60because the number of supplier classes in the current categorization is 60. Figure3 shows the relationships between the result clusters and the company’s currentsupplier classes. The spectrum value is the clustering results. The x-axis is thecompany’s supplier classes and the y-axis is the count of suppliers.
From the above chart, we can see that suppliers in some existing classes wereclustered into different clusters. This indicates that suppliers in the same classhad very different business behaviors although their static information is similar.
From this figure we can observe three different types of the current supplierclasses. The first type is the classes in which suppliers had similar supplying pat-terns such as class 1 and class 42. For these classes, adjustment is not needed.The second type is the classes which were merged into single clusters. This indi-cates that the current classification is two fine for the suppliers in these classes.Examples of this type are classes 9 and 12, which should be merged into one classbecause suppliers in these classes have similar supplying patterns. The third typeof classes are those in which suppliers were divided into different clusters, suchas classes 7, 8 and 60. These classes should be divided into subclasses becausesuppliers with different supplying patterns should be managed differently.
This result demonstrates that some of the current supplier classes were welldeveloped but others should be adjusted in order to better facilitate the resourcesof product purchases and improve the management of supplier relationship inthe company. This kind of information was observed first time by the companybuying staff and gave them a lot of insight in their current practice of managingsuppliers.
lenovo
文本框

Supplier Categorization with K -Means Type Subspace Clustering 235
4.3 Validation of Cluster Analysis
To validate the clustering results produced by the FW-KMeans clustering algo-rithm, we sorted suppliers on the cluster IDs and visualized the product supply-ing patterns of different clusters. Figure 4 shows part of the visualization result.
ItemCat Index
Clu
ste
r 5
, 4
0,
44
, 5
4
20 40 60 80 100
10
20
30
40
50
60
70
80
90
Fig. 4. Shows that clusters 5, 40, 44 and 54 are described in attributes (11, 24, 31, 18,20, 21, 22, 23, 25, 26, 27, 29, 30, 33, 36, 37, 38), (44, 45, 47, 52, 54, 55), (78, 80, 86,89, 92, 94, 98, 100) and (1, 3, 4, 5, 10, 12, 14, 15, 16, 17, 18, 30, 35) respectively
From the figure, we can clearly see that clusters 5, 40, 44 and 54 indeed hadsimilar product supplying patterns, which implies that the clustering algorithmwas effective in clustering such highly sparse data and solving the dynamic sup-plier categorization problems.
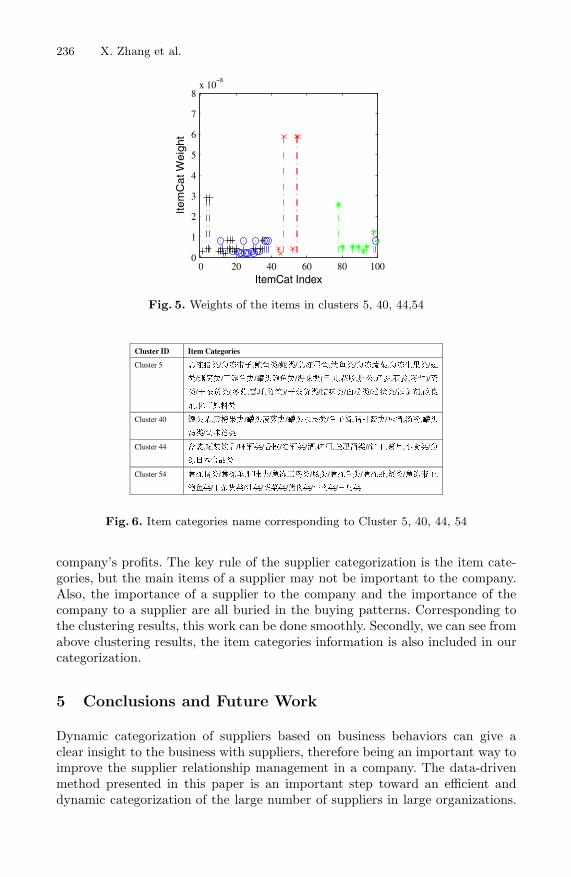
We used the weights produced by the FW-KMeans algorithm to identify theimportant item categories in each cluster. However, because of the special caseof zero dispersion in certain features, the largest weights may identify some itemcategories which were not supplied by the suppliers of the cluster. In this casewe ignored these item categories. Although the weights for these items werelarge, they did not imply the semantics of the product items that we consideredimportant. These are the items which contributed most to the semantics of thecluster so we used these items to categorize the suppliers. Figure 5 plots theweights of these items in different clusters. The horizontal axis is the index ofthe items and the vertical lines indicate the values of the weights. It is clear thateach cluster has its own subset of key items because the lines do not have bigoverlapping in different clusters. Cluster 5 and cluster 54 have some overlappingbecause the goods supplied by two group suppliers are close to each other.
The items corresponding to the clusters are listed in Figure 6. The suppliersof cluster 5 mainly supplied deepfreeze seafood products while the suppliers ofclusters 40, 44 and 54 mainly supplied canned food, inebriant and deepfreezemeat respectively. In comparison to the company’s current supplier classes, thesupplier categorization generated by our algorithm has two merits. Firstly, itcontains the buying patterns, which can be used to manage suppliers to enlarge
236 X. Zhang et al.
0 20 40 60 80 1000
1
2
3
4
5
6
7
8x 10
−8
ItemCat Index
Item
Cat W
eig
ht
Fig. 5. Weights of the items in clusters 5, 40, 44,54
Cluster ID Item Categories
Cluster 5 急冻猪类/急冻带子,鲍鱼类/蚝类/急冻墨鱼,鱿鱼类/急冻蔬菜,急冻生果类/翅
类/燕窝类/干鲍鱼类/罐头鲍鱼类/海味类(元贝,花胶,肚公,辽参,石参,海哲)/斋
类/干杂货类(冬菇,雪耳,竹笙)/干杂货类/腊味类/面粉类/粉状类/添加剂,改良
剂,化工原料类
Cluster 40 罐头梨,黄梅果类/罐头菠萝类/罐头水果类/鱼子酱,猪肝酱类/味精,汤粉,罐头
汤类/调味粉类
Cluster 44 盒装,罐装饮品/啤酒类/香槟/红酒类/酒,砵酒,些厘酒类//饼干,薯片,小食类/急
冻日本食品类
Cluster 54 急冻猪类/急冻羊,野味类/急冻三鸟类/肠类/急冻鱼类/急冻虾,蟹类/急冻带子,
鲍鱼类/干杂货类/油类/蔬菜类/猪肉类/牛肉类/三鸟类
Fig. 6. Item categories name corresponding to Cluster 5, 40, 44, 54
company’s profits. The key rule of the supplier categorization is the item cate-gories, but the main items of a supplier may not be important to the company.Also, the importance of a supplier to the company and the importance of thecompany to a supplier are all buried in the buying patterns. Corresponding tothe clustering results, this work can be done smoothly. Secondly, we can see fromabove clustering results, the item categories information is also included in ourcategorization.
5 Conclusions and Future Work
Dynamic categorization of suppliers based on business behaviors can give aclear insight to the business with suppliers, therefore being an important way toimprove the supplier relationship management in a company. The data-drivenmethod presented in this paper is an important step toward an efficient anddynamic categorization of the large number of suppliers in large organizations.
lenovo
文本框

Supplier Categorization with K -Means Type Subspace Clustering 237
We have discussed the problems of dynamic supplier categorization and demon-strated our method to use the k-means type subspace clustering algorithm toeffectively cluster the high dimensional, high sparse supplier and behavior data.The results produced from a real data set have shown that the clusters producedby the algorithm are indeed useful in real business.
To use data mining techniques in supplier relationship management is still inits early stage and a lot of real business problems need to be identified and datamining solutions need to be developed. This work represents one step forward inthis direction. Our current work is to implement a real system to incorporate themethodology discussed in this paper to be used in real company’s environment.
References
1. M.Bensaou., “Portfolios of buyer-suuplier relationships,” Sloan Management Re-view, vol. 40, no. 4, p. p35(1), 1999.
2. F. Olsen and M. Ellram., “A portfolio approach to supplier relationships,” Indus-trial Marketing Management, vol. 26, no. 2, pp. 101–113, 1997.
3. L. Parsons, E. Haque, and H. Liu, “Subspace clustering for high dimensional data:a review,” SIGKDD Explorations, vol. 6, no. 1, pp. 90–105, 2004.
4. L. Jing, M. Ng, J. Xu, and Z. Huang, “Subspace clustering of text documents withfeature weighting k-means algorithm,” PAKDD, 2005.
5. Y. Chan, K. Ching, K. Ng, and Z. Huang, “An optimization algorithm for clusteringusing weighted dissimilarity measures,” Pattern recognition, vol. 37, no. 5, pp. 943–952, 2004.
6. L. Jing, M. Ng, J. Xu, and Z. Huang, “On the performance of feature weightingk-means for text subspace clustering,” WAIM, 2005.
7. I. S. Lars-Erik Gadde, “Making the most of supplier relationships,” IndustrialMarketing Management, no. 29, pp. 305–316, 2000.
8. B. Ricardo and R. PBerthier, “Modern information retrieval,” Addison Wesley,1999.
9. P. Hague and P. Harris, “Sampling and statistics,” Kogan Page, 1993.10. ETI., “Final report for business intelligence case study to x’s limited,” Technique
report, 2005.