Clustering Genes Using Heterogeneous Data Sources
18
Clustering Genes using Heterogeneous Data Sources Erliang Zeng 1, *, Chengyong Yang 2 , Tao Li 3 , and Giri Narasimhan 3 1 Department of Computer Science and Engineering, University of Notre Dame, Fitzpatrick Hall 384, Notre Dame, IN 46556. 2 Life Technologies Inc., 850 Lincoln Centre Drive, MS 407, Foster City, CA 94404. 3 Bioinformatics Research Group (BioRG), School of Computing and Information Sciences, Florida International University, 11200 SW 8th Street, Miami, FL 33199. * To whom correspondence should be addressed. Abstract Clustering of gene expression data is a standard exploratory technique used to identify closely related genes. Many other sources of data are also likely to be of great assistance in the analysis of gene expression data. Such sources include protein- protein interaction data, transcription factor and regulatory elements data, comparative genomics data, protein expression data and much more. These data provide us with a means to begin elucidating the large-scale modular organization of the cell. Conclusions drawn from more than one data source is likely to lead to new insights. Data sources may be complete or incomplete depending on whether or not they provide information about every gene in the genome. With a view toward a combined analysis of heterogeneous sources of data, we consider the challenging task of developing exploratory analytical techniques to deal with multiple complete and incomplete information sources. The Multi-Source Clustering (MSC) algorithm we developed performs clustering with multiple, but complete, sources of data. To deal with incomplete data sources, we have adopted the MPCK-means clustering algorithm, which is a constrained clustering algorithm, to perform exploratory analysis on one complete source (such as gene expression data) and other potentially incomplete sources provided in the form of constraints. We have shown that the MSC algorithm produces clusters that are biologically more meaningful when integrating gene expression data and text data than those identified using only one source of data. For the constrained clustering algorithm, we have studied the effectiveness of various constraints sets. To address the problem of automatically generating constraints from biological text literature, we considered two methods (cluster-based and similarity-based). The novelty of research presented here is the development of a new clustering algorithm MSC to perform exploratory analysis using two or more diverse but complete data sources, and study of effectiveness of constraints sets and robustness of the constrained clustering algorithm using multiple sources of incomplete biological data, and incorporating such incomplete data into constrained clustering algorithm in form of constraints sets. Keyword: Gene Expression Data, Multi-Source Clustering, Constrained Clustering, Heterogeneous Data Sources, Biological Literature, Text Mining 1. INTRODUCTION Large scale microarray experiments that have been performed under a variety of conditions or at various stages during a biological process have resulted in huge amounts of gene expression data, and have presented big challenges for the field of data mining (de Souto, Costa et al. 2008; Kerr, Ruskin et al. 2008). Challenges include
-
Upload
independent -
Category
Documents
-
view
2 -
download
0
Transcript of Clustering Genes Using Heterogeneous Data Sources
Clustering Genes using Heterogeneous Data Sources
Erliang Zeng1, *, Chengyong Yang2, Tao Li3, and Giri Narasimhan3
1Department of Computer Science and Engineering, University of Notre Dame, Fitzpatrick Hall 384, Notre Dame, IN 46556. 2Life Technologies Inc., 850 Lincoln Centre Drive, MS 407, Foster City, CA 94404. 3Bioinformatics Research Group (BioRG), School of Computing and Information Sciences, Florida International University, 11200 SW 8th Street, Miami, FL 33199.
* To whom correspondence should be addressed. Abstract
Clustering of gene expression data is a standard exploratory technique used to identify closely related genes. Many other sources of data are also likely to be of great assistance in the analysis of gene expression data. Such sources include protein-protein interaction data, transcription factor and regulatory elements data, comparative genomics data, protein expression data and much more. These data provide us with a means to begin elucidating the large-scale modular organization of the cell. Conclusions drawn from more than one data source is likely to lead to new insights. Data sources may be complete or incomplete depending on whether or not they provide information about every gene in the genome. With a view toward a combined analysis of heterogeneous sources of data, we consider the challenging task of developing exploratory analytical techniques to deal with multiple complete and incomplete information sources. The Multi-Source Clustering (MSC) algorithm we developed performs clustering with multiple, but complete, sources of data. To deal with incomplete data sources, we have adopted the MPCK-means clustering algorithm, which is a constrained clustering algorithm, to perform exploratory analysis on one complete source (such as gene expression data) and other potentially incomplete sources provided in the form of constraints. We have shown that the MSC algorithm produces clusters that are biologically more meaningful when integrating gene expression data and text data than those identified using only one source of data. For the constrained clustering algorithm, we have studied the effectiveness of various constraints sets. To address the problem of automatically generating constraints from biological text literature, we considered two methods (cluster-based and similarity-based). The novelty of research presented here is the development of a new clustering algorithm MSC to perform exploratory analysis using two or more diverse but complete data sources, and study of effectiveness of constraints sets and robustness of the constrained clustering algorithm using multiple sources of incomplete biological data, and incorporating such incomplete data into constrained clustering algorithm in form of constraints sets.
Keyword: Gene Expression Data, Multi-Source Clustering, Constrained Clustering, Heterogeneous Data Sources, Biological Literature, Text Mining
1. INTRODUCTION
Large scale microarray experiments that have been performed under a variety of conditions or at various stages during a biological process have resulted in huge amounts of gene expression data, and have presented big challenges for the field of data mining (de Souto, Costa et al. 2008; Kerr, Ruskin et al. 2008). Challenges include

rapidly analyzing and interpreting data on thousands of genes measured with hundreds of different conditions, and assessing the biological significance of the results. Clustering is the exploratory, unsupervised process of partitioning the expression data into groups (or clusters) of genes sharing similar expression patterns (Yeung, Medvedovic et al. 2003; Kerr, Ruskin et al. 2008). However, the quality of clusters can vary greatly, as can their ability to lead to biologically meaningful conclusions. On a different note, the biological and medical literature databases are information warehouses with a vast store of useful knowledge. In fact, text analysis has been successfully applied in bioinformatics for various purposes such as identifying relevant literature for genes and proteins, connecting genes with diseases, and reconstructing gene networks (Yandell and Majoros 2002). Hence, including the literature in the analysis of gene expression data offers an opportunity to incorporate additional functional information about the genes when defining expression clusters. In more general terms, with the availability of multiple information sources, it is a challenging problem to conduct integrated exploratory analyses with the aim of extracting more information than what is possible from only a single source. The basic problem of learning from multiple information sources has been extensively studied by the machine learning community. In computer vision this problem is referred to as multi-modal learning. In general, there are two approaches to multi-modal learning: feature level integration and semantic integration (Wu, Oviatt et al. 1999). Methods that use feature level integration combine the information at the feature level and then perform the analysis in the joint feature space (Glenisson, Mathys et al. 2003). On the other hand, the semantic level integration methods first build individual models based on separate information sources and then combine these models via techniques such as mutual information maximization (Becker 1996). Microarray experiments usually provide gene expression data on all the genes in a genome. Hence they are inherently “complete”. A major challenge using other sources of data to assist the analysis of gene expression data is that they may not always be complete, i.e., do not provide information on all the genes in the genome. Recent work from the machine learning community has focused on the use of background information in the form of instance-level constraints. Two types of pairwise constraints have been proposed: positive constraints that specify that two instances must remain in the same cluster, and negative constraints that specify that two instances must not be placed in the same cluster. Recent examples of work include methods that ensured that constraints were satisfied at each iteration (Wagsta, Cardie et al. 2001), algorithms that used constraints as initial conditions (Basu, Banerjee et al. 2002), algorithms that learned a distance metric trained by a shortest-path algorithm (Klein, Kamvar et al. 2002), a convex optimization method using Mahalanobis distances (Xing, Ng et al. 2002), and semi-supervised clustering that incorporated both metric learning and the use of pairwise constraints in a principled manner (Bilenko, Basu et al. 2004). While great efforts have been made to develop efficient constrained clustering algorithm variants, the role of constraint sets in constrained clustering algorithm has not been fully studied yet. Recently, Wagstaff et al., and Davidson et al. attempted to link the quality of constraint sets with clustering algorithm performance (Davidson, Wagstaff et al. 2006; Wagsta, Basu et al. 2006). Two properties of constraint set – inconsistency and incoherence – were shown to be strongly negative correlated with clustering algorithm performance.
This paper makes several important contributions. First, we investigate the problem of integrating two or more heterogeneous sources of data to produce
biologically significant clusters. To address this problem, we have proposed an EM-based clustering algorithm called Multi-Source Clustering (MSC) to perform clustering using multiple, but complete, data sources. For our experiments with MSC, we focused on algorithms using gene expression data and biological text literature as the two main sources, although the techniques are general enough to be applicable to other data sources. Then, we consider the non-trivial task of proposing evaluation schemes to evaluate the results of clustering techniques by utilizing independent sources of data. This is performed by considering functional annotation data and transcription factor binding site data as the independent data sources. Next, we tackle the data integration problem, when the data sources provide incomplete data sets. Most data sources (such as biological text literature) are incomplete since data is not available on all the genes in the genome. The problem of incomplete data sources is addressed by adopting MPCK-Means algorithm. Finally, we tackle the case when the data sources provide inconsistent and conflicting pieces of information or are unreliable or inaccurate to varying degrees. 2. METHODS
In this section we describe our new approaches. We first introduce our new MSC clustering algorithm and then present the adaptive MPCK-means clustering algorithm.
2.1 Multi-Source Clustering In this section we describe MSC algorithm in detail. The problem of clustering data arises in many disciplines and has a wide range of applications. Intuitively, clustering is the problem of partitioning a finite set of points in a multi-dimensional space into classes (called clusters) so that (i) the points belonging to the same class
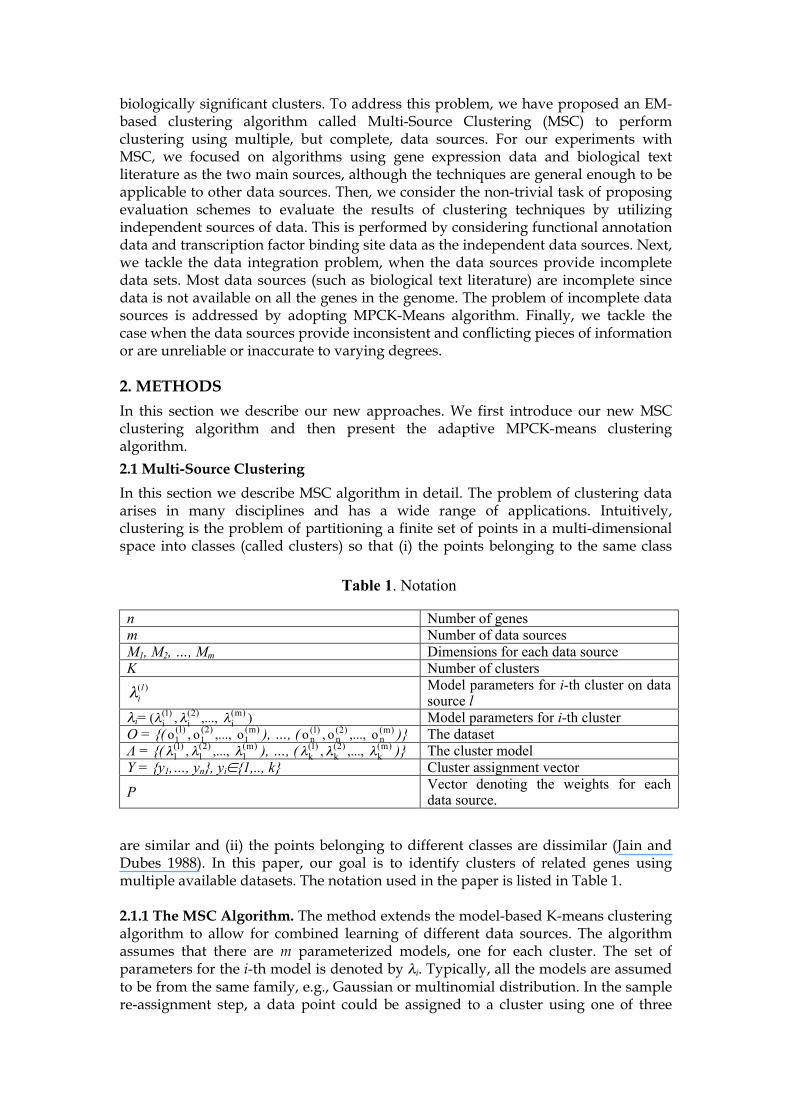
are similar and (ii) the points belonging to different classes are dissimilar (Jain and Dubes 1988). In this paper, our goal is to identify clusters of related genes using multiple available datasets. The notation used in the paper is listed in Table 1. 2.1.1 The MSC Algorithm. The method extends the model-based K-means clustering algorithm to allow for combined learning of different data sources. The algorithm assumes that there are m parameterized models, one for each cluster. The set of parameters for the i-th model is denoted by λi. Typically, all the models are assumed to be from the same family, e.g., Gaussian or multinomial distribution. In the sample re-assignment step, a data point could be assigned to a cluster using one of three
Table 1. Notation
n Number of genes m Number of data sources M1, M2, …, Mm Dimensions for each data source K Number of clusters
Model parameters for i-th cluster on data source l
λi= Model parameters for i-th cluster O = {( ), …, ( )} The dataset Λ = {( ), …, ( )} The cluster model Y = {y1,…, yn}, yi∈{1,.., k} Cluster assignment vector
P Vector denoting the weights for each data source.
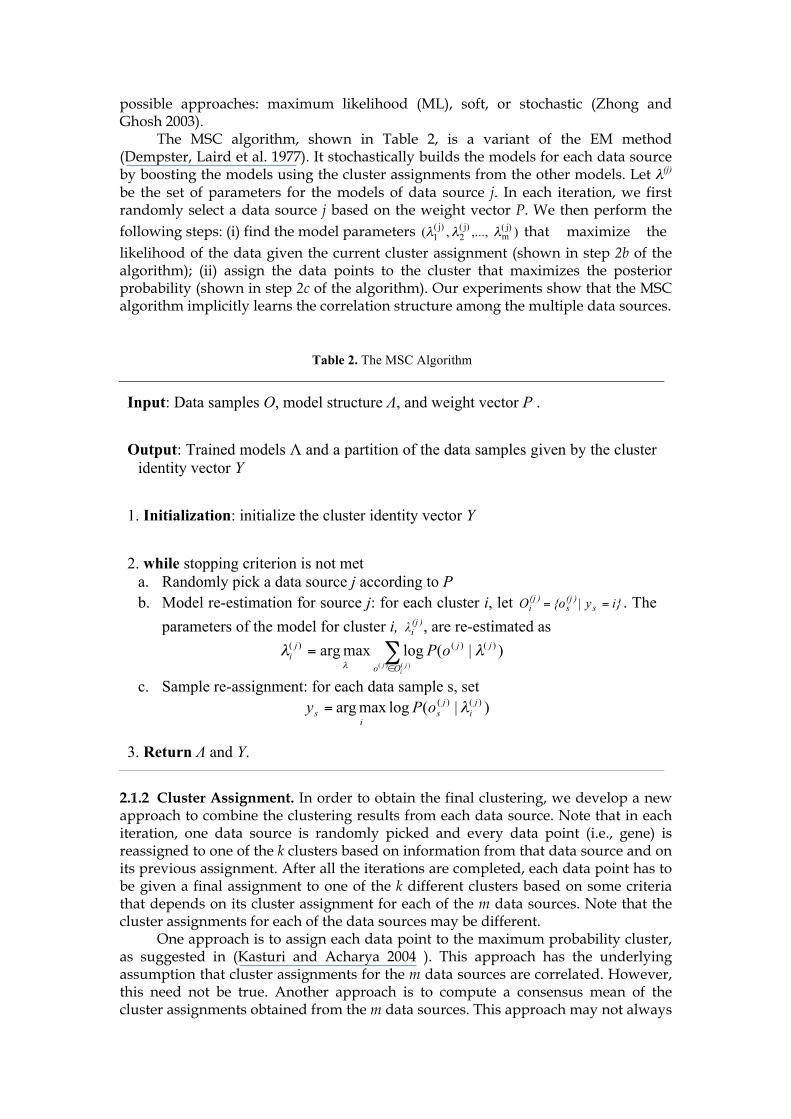
possible approaches: maximum likelihood (ML), soft, or stochastic (Zhong and Ghosh 2003). The MSC algorithm, shown in Table 2, is a variant of the EM method (Dempster, Laird et al. 1977). It stochastically builds the models for each data source by boosting the models using the cluster assignments from the other models. Let λ(j) be the set of parameters for the models of data source j. In each iteration, we first randomly select a data source j based on the weight vector P. We then perform the following steps: (i) find the model parameters that maximize the likelihood of the data given the current cluster assignment (shown in step 2b of the algorithm); (ii) assign the data points to the cluster that maximizes the posterior probability (shown in step 2c of the algorithm). Our experiments show that the MSC algorithm implicitly learns the correlation structure among the multiple data sources.
2.1.2 Cluster Assignment. In order to obtain the final clustering, we develop a new approach to combine the clustering results from each data source. Note that in each iteration, one data source is randomly picked and every data point (i.e., gene) is reassigned to one of the k clusters based on information from that data source and on its previous assignment. After all the iterations are completed, each data point has to be given a final assignment to one of the k different clusters based on some criteria that depends on its cluster assignment for each of the m data sources. Note that the cluster assignments for each of the data sources may be different. One approach is to assign each data point to the maximum probability cluster, as suggested in (Kasturi and Acharya 2004 ). This approach has the underlying assumption that cluster assignments for the m data sources are correlated. However, this need not be true. Another approach is to compute a consensus mean of the cluster assignments obtained from the m data sources. This approach may not always
Table 2. The MSC Algorithm
Input: Data samples O, model structure Λ, and weight vector P .
Output: Trained models Λ and a partition of the data samples given by the cluster identity vector Y
1. Initialization: initialize the cluster identity vector Y
2. while stopping criterion is not met a. Randomly pick a data source j according to P b. Model re-estimation for source j: for each cluster i, let . The
parameters of the model for cluster i, , are re-estimated as
c. Sample re-assignment: for each data sample s, set
3. Return Λ and Y.
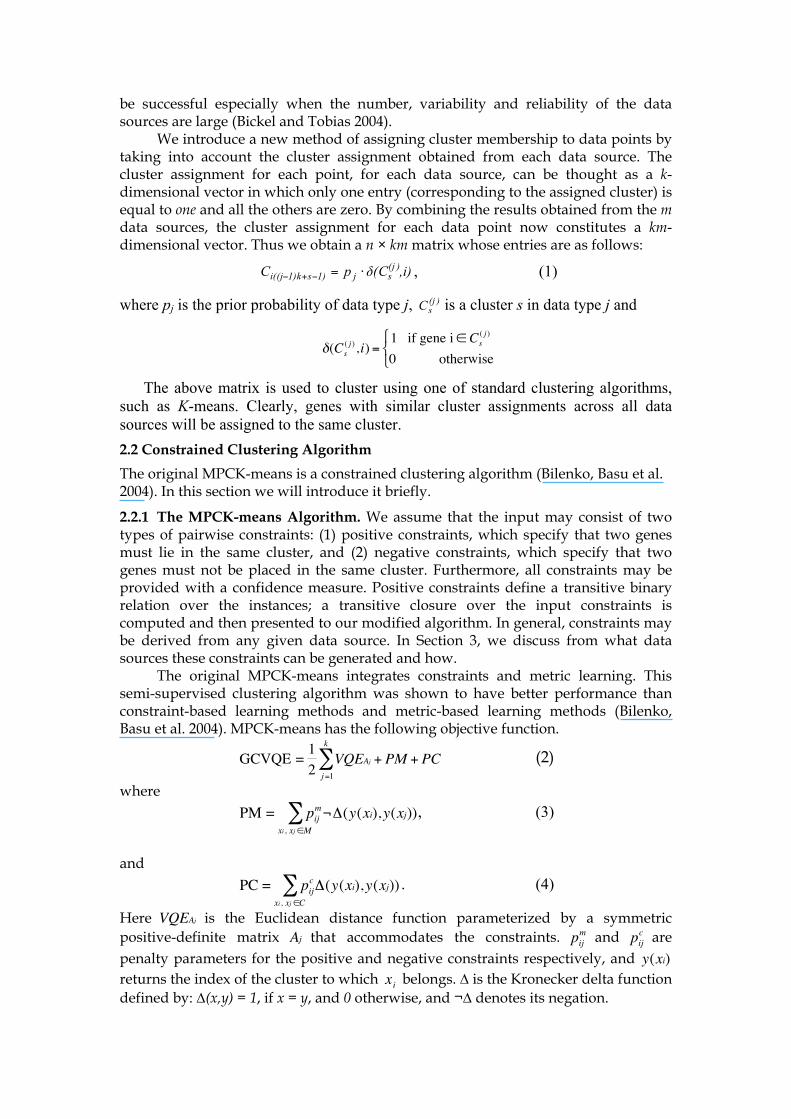
be successful especially when the number, variability and reliability of the data sources are large (Bickel and Tobias 2004). We introduce a new method of assigning cluster membership to data points by taking into account the cluster assignment obtained from each data source. The cluster assignment for each point, for each data source, can be thought as a k- dimensional vector in which only one entry (corresponding to the assigned cluster) is equal to one and all the others are zero. By combining the results obtained from the m data sources, the cluster assignment for each data point now constitutes a km-dimensional vector. Thus we obtain a n × km matrix whose entries are as follows:
, (1)
where pj is the prior probability of data type j, is a cluster s in data type j and
€
δ(Cs( j ),i) =
1 if gene i∈ Cs( j )
0 otherwise
⎧ ⎨ ⎩
The above matrix is used to cluster using one of standard clustering algorithms, such as K-means. Clearly, genes with similar cluster assignments across all data sources will be assigned to the same cluster. 2.2 Constrained Clustering Algorithm
The original MPCK-means is a constrained clustering algorithm (Bilenko, Basu et al. 2004). In this section we will introduce it briefly.
2.2.1 The MPCK-means Algorithm. We assume that the input may consist of two types of pairwise constraints: (1) positive constraints, which specify that two genes must lie in the same cluster, and (2) negative constraints, which specify that two genes must not be placed in the same cluster. Furthermore, all constraints may be provided with a confidence measure. Positive constraints define a transitive binary relation over the instances; a transitive closure over the input constraints is computed and then presented to our modified algorithm. In general, constraints may be derived from any given data source. In Section 3, we discuss from what data sources these constraints can be generated and how. The original MPCK-means integrates constraints and metric learning. This semi-supervised clustering algorithm was shown to have better performance than constraint-based learning methods and metric-based learning methods (Bilenko, Basu et al. 2004). MPCK-means has the following objective function.
€
GCVQE = 12
VQEAj
j=1
k
∑ + PM + PC (2)
where
€
PM = pijm
xi, xj ∈M∑ ¬Δ(y(xi),y(xj)), (3)
and
€
PC = pijc
xi, xj ∈C∑ Δ(y(xi),y(xj)) . (4)
Here
€
VQEAj is the Euclidean distance function parameterized by a symmetric positive-definite matrix
€
Aj that accommodates the constraints.
€
pijm and
€
pijc are
penalty parameters for the positive and negative constraints respectively, and
€
y(xi) returns the index of the cluster to which
€
xi belongs. ∆ is the Kronecker delta function defined by: ∆(x,y) = 1, if x = y, and 0 otherwise, and ¬∆ denotes its negation.
The MPCK-means algorithm is an iterative algorithm. As in K-means, the first order derivative of GCVQE (Eq. (2)) is set to zero and solved. The result of the derivative is dependent on the choice of penalty functions (Bilenko, Basu et al. 2004).
3. DATA SOURCES AND THEIR REPRESENTATIONS
As discussed in this section, the goal is to convert the information in each data source into numeric feature vectors. Once the vector representations are obtained, the clustering algorithms have several choices for integrating the information. Integration can either happen before the analysis or after the analysis. Feature-level integration simply concatenates the feature vectors (Glenisson, Mathys et al. 2003). An alternative and more sophisticated approach is that of semantic-level integration, as described in the previous section.
3.1 Gene Expression Data
The main source of data for algorithms that cluster genes is gene expression data, typically arising from microarray experiments. The advantage of this data source is that it is often complete, in the sense that it covers all the genes in the genome. Since this data is numeric, representation of this information is now standard, i.e., it is represented as a point in d-dimensional space, where d is the number of different conditions under which the data for each gene is collected.
3.2 Text Literature Data
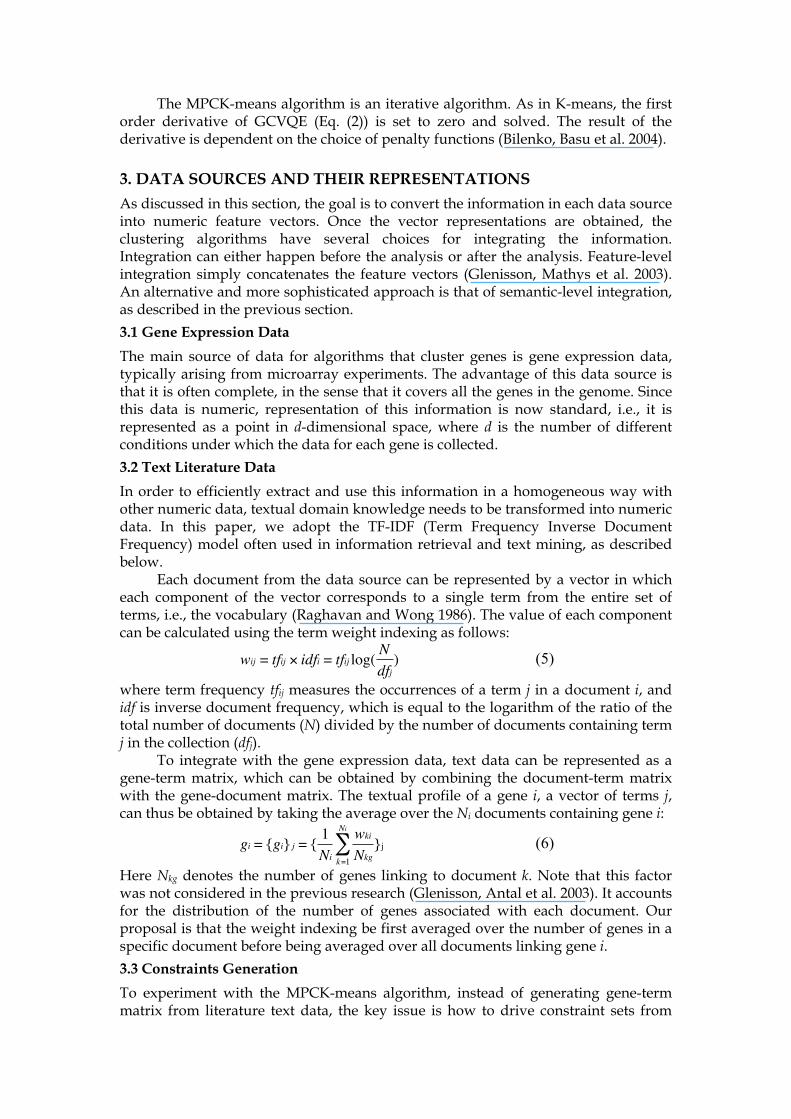
In order to efficiently extract and use this information in a homogeneous way with other numeric data, textual domain knowledge needs to be transformed into numeric data. In this paper, we adopt the TF-IDF (Term Frequency Inverse Document Frequency) model often used in information retrieval and text mining, as described below. Each document from the data source can be represented by a vector in which each component of the vector corresponds to a single term from the entire set of terms, i.e., the vocabulary (Raghavan and Wong 1986). The value of each component can be calculated using the term weight indexing as follows:
€
wij = tfij × idfi = tfij log( Ndfj) (5)
where term frequency tfij measures the occurrences of a term j in a document i, and idf is inverse document frequency, which is equal to the logarithm of the ratio of the total number of documents (N) divided by the number of documents containing term j in the collection (dfj). To integrate with the gene expression data, text data can be represented as a gene-term matrix, which can be obtained by combining the document-term matrix with the gene-document matrix. The textual profile of a gene i, a vector of terms j, can thus be obtained by taking the average over the Ni documents containing gene i:
€
gi = {gi} j = { 1Ni
wki
Nkgk=1
Ni
∑ }j (6)
Here Nkg denotes the number of genes linking to document k. Note that this factor was not considered in the previous research (Glenisson, Antal et al. 2003). It accounts for the distribution of the number of genes associated with each document. Our proposal is that the weight indexing be first averaged over the number of genes in a specific document before being averaged over all documents linking gene i.
3.3 Constraints Generation
To experiment with the MPCK-means algorithm, instead of generating gene-term matrix from literature text data, the key issue is how to drive constraint sets from
literature text data. Constraints can be generated from the data with known labels (such as functional categories) or from prior knowledge about the data from other knowledge domain (such as literature text). For labeled datasets, i.e., datasets where the clusters are known beforehand, constraints were generated based on the known labels. For each randomly chosen gene pair, if they had the same label, then a positive constraint was generated. A negative constraint was generated otherwise. For unlabeled data sets, constraints were generated from literature text data. A simple approach is to generate positive constraint pairs from genes associated with the same document. After merging all positive constraint pairs into connected components, neighborhood sets could be produced and genes belonging to different neighborhood sets could be used to build the negative constraint set. A cautionary note is that this approach ignores contextual information and natural language issues and could potentially generate erroneous constraints. Although this approach is efficient, we used the gene-term matrix as described above. We explored two ways to generate gene pair constraints from the gene-term matrix. We refer to the two approaches as cluster-based and similarity-based constraint generation methods. In the first approach, cosine similarity was calculated between all pairs of genes and then sorted. Positive constraint pairs were generated by picking gene pairs having high similarity. Negative constraint pairs may be generated by picking gene pairs with low similarity values. However, for the text literature data source, this is not appropriate since it is difficult to differentiate between negative information and lack of information. In the second approach, the spherical K-means algorithm, which is a K-means algorithm using cosine-based distance, was applied to the gene-term matrix T times (we chose T = 100 here). Frequencies of gene pairs appearing in the same cluster were counted and sorted into T + 1 bins using the bucket sort algorithm. Gene pairs with high frequency were listed as positive constraint pairs. In other words, the constraints can be generated from the consensus matrix M, where Mij gives the probability that gene i and j belongs to the same cluster. Two sets of constraint pairs were generated: constraint pairs from text similarity, and constraint pairs from text clustering.
4. CLUSTERING ASSESSMENT
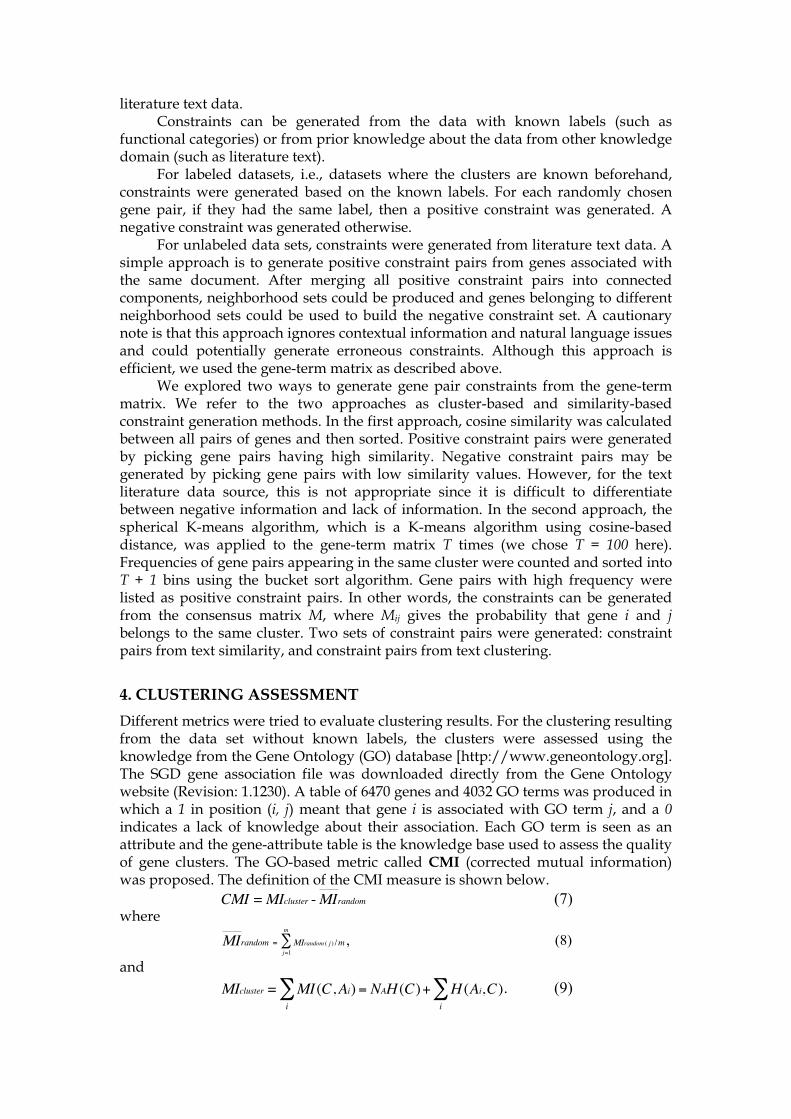
Different metrics were tried to evaluate clustering results. For the clustering resulting from the data set without known labels, the clusters were assessed using the knowledge from the Gene Ontology (GO) database [http://www.geneontology.org]. The SGD gene association file was downloaded directly from the Gene Ontology website (Revision: 1.1230). A table of 6470 genes and 4032 GO terms was produced in which a 1 in position (i, j) meant that gene i is associated with GO term j, and a 0 indicates a lack of knowledge about their association. Each GO term is seen as an attribute and the gene-attribute table is the knowledge base used to assess the quality of gene clusters. The GO-based metric called CMI (corrected mutual information) was proposed. The definition of the CMI measure is shown below.
€
CMI =MIcluster -MIrandom (7) where
€
MIrandom = MIrandom ( j ) /mj=1
m
∑ , (8)
and
€
MIcluster = MI (C,Ai)i∑ = NAH (C)+ H (Ai,C)
i∑ . (9)
Here MIcluster corresponds to the mutual information between the cluster assignment produced by a clustering algorithm and the GO database; MIrandom refers to the mutual information between a random cluster assignment and the GO database. H(.) refers to entropy function. The mutual information between a cluster assignment and all attributes (GO terms) is defined as the sum of the mutual information between the cluster assignment and the genes associated with each individual attribute (Gibbons and Roth 2002), using the standard definition of mutual information. Thus, higher corrected CMI values suggest that the clustering results are more significantly related to gene function. The GO-based CMI measure is similar to the z-score measure (Gibbons and Roth 2002). Evaluation was performed using the Rand Index (Rand 1971) for the clustering resulting from the data set with known labels. Rand Index allows for a measure of agreement between the clustering results and their true labels. Let n be the size of data set D. The clustering result is viewed as a collection of n × (n − 1)/2 pairwise decisions. For each pair of items di and dj in D, the algorithm either assigns them to the same cluster or to different clusters. Let p1 (p2, respectively) be the number of decisions where the algorithm correctly assigns the same (different, respectively) label to items di and dj. Then
€
RandIndex = p1 + p2n× (n −1) /2
. (10)
Metrics CMI is gene annotation based method, and is used for the clustering resulting from the data set without known labels. Rand Index is suitable for the clustering resulting from the data set with known labels. In this paper, the CMI was used to compare the performance of the four clustering methods: K-means clustering of expression data, K-means clustering of text data, K-means clustering of the feature-level integrated expression and text data, and the MSC algorithm applied to expression and text data. The CMI was also used to compare the performance of MSC algorithm and constrained clustering algorithm. Rand Index was used to evaluate the effectiveness of constraints sets in clustering algorithm.
5. EXPERIMENTAL RESULTS
Five algorithms were implemented in Java. These included model-based K-means algorithm on the individual data sources (text and gene expression), model-based K-means algorithm on feature-level integration of the multi-source data, the MSC algorithm, and the MPCK-means algorithm. We also include an meta-clustering algorithm developed by Zare et al. (Zare, Khodursky et al. 2006) for comparison. We first discuss the data sets used for our experiments.
5.1 Expression and Literature Data Sets
For text information, a literature index for yeast genes was constructed from 31924 yeast-related MEDLINE abstracts, which were downloaded using Entrez/Pubmed search engine based on text matching in an entry’s fields (Roberts 2001). The abstract-gene relation information was constructed from the Saccharomyces Genome Database (SGD, http://www.yeastgenome.org/). It is also available by ftp from the following URL: [ftp://genome-ftp.stanford.edu/pub/yeast/data_download/ literature_curation/]. Gene expression data set was generated from cultures synchronized in cell cycle by three independent methods and consisted of measurements of 6206 genes over 77 experimental conditions (Spellman, Sherlock et al. 1998). After removing those having no literature references, the remaining 5473 genes were retained for further analysis. Two other gene expression data sets were used in this research. One is the
yeast galactose dataset originally from the study of Ideker et al. (Ideker, Thorsson et al. 2001). Yeung et al. compiled a subset of 205 genes from four functional categories (Yeung, Medvedovic et al. 2003). Genes from each functional category would be expected to cluster together. In the original experiment, microarrays were used to measure the mRNA expression profiles of yeast growing under 20 differ perturbations to the GAL pathway. Four replicates were performed for each condition. All MEDLINE abstracts referred to in SGD’s literature database were considered as acceptable, noise-free, domain-specific source of information for the yeast genes being considered (Stephens, Palakal et al. 2001). A restricted vocabulary is suggested in several recent papers (Stephens, Palakal et al. 2001; Chiang and Yu 2003; Glenisson, Antal et al. 2003). Often these restricted vocabularies involve terms from the GO database. In this work, we chose to eliminate such constraints and have resorted to generic text mining methods to extract the terms. Our reasoning was as follows. Since GO terms were used in the validation of the clusters, it would be inappropriate to bias the text mining part of the process by allowing only terms that would validate positively.
5.2 Results of MSC Algorithm
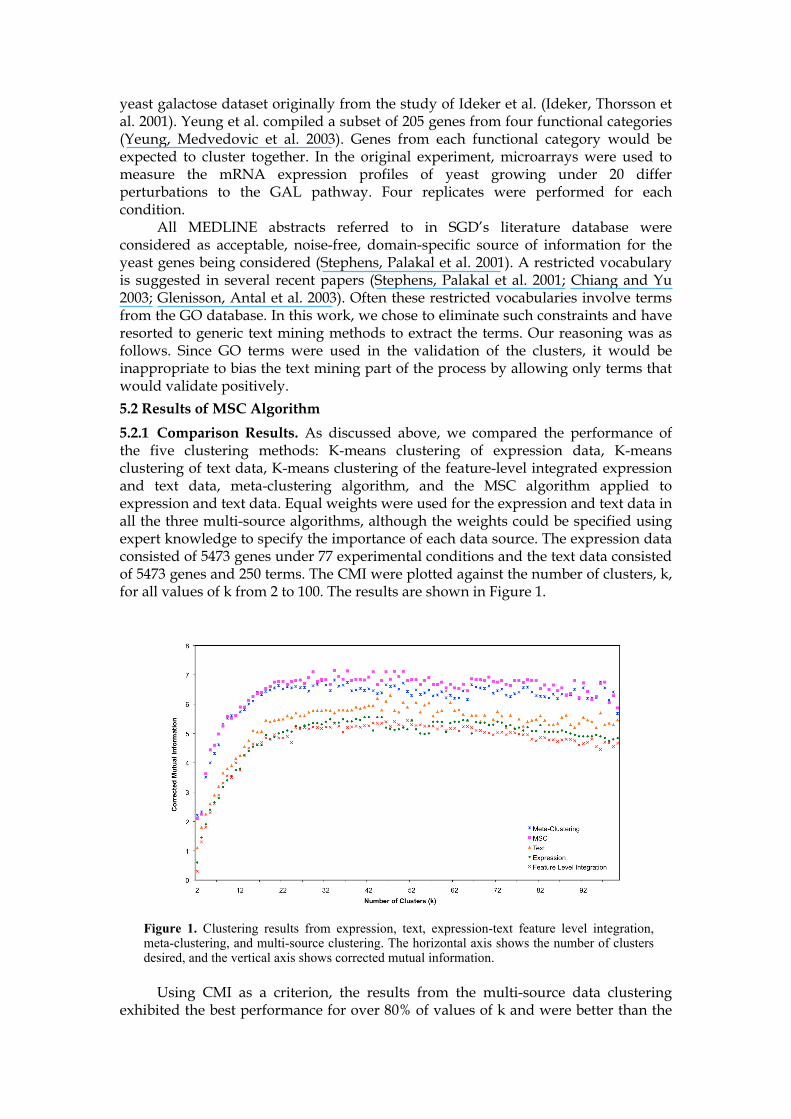
5.2.1 Comparison Results. As discussed above, we compared the performance of the five clustering methods: K-means clustering of expression data, K-means clustering of text data, K-means clustering of the feature-level integrated expression and text data, meta-clustering algorithm, and the MSC algorithm applied to expression and text data. Equal weights were used for the expression and text data in all the three multi-source algorithms, although the weights could be specified using expert knowledge to specify the importance of each data source. The expression data consisted of 5473 genes under 77 experimental conditions and the text data consisted of 5473 genes and 250 terms. The CMI were plotted against the number of clusters, k, for all values of k from 2 to 100. The results are shown in Figure 1.
Using CMI as a criterion, the results from the multi-source data clustering exhibited the best performance for over 80% of values of k and were better than the
Figure 1. Clustering results from expression, text, expression-text feature level integration, meta-clustering, and multi-source clustering. The horizontal axis shows the number of clusters desired, and the vertical axis shows corrected mutual information.
method that only used text data. Surprisingly, the results from the feature-level integration were worse than the methods that used only a single data source. It suggests that a simple combination of features and distance functions may not be the best approach to improve the quality of clustering. Figure 1 shows that CMI decays as k grows over 70, indicating clustering with k greater than 70 is not appropriate because CMI decrease means clustering results are less significantly related to gene function. In the next two subsections, we explore other ways to evaluate the quality of the resulting clusters. 5.2.2 Functional Enrichment. To assess the classification capability of the clustering
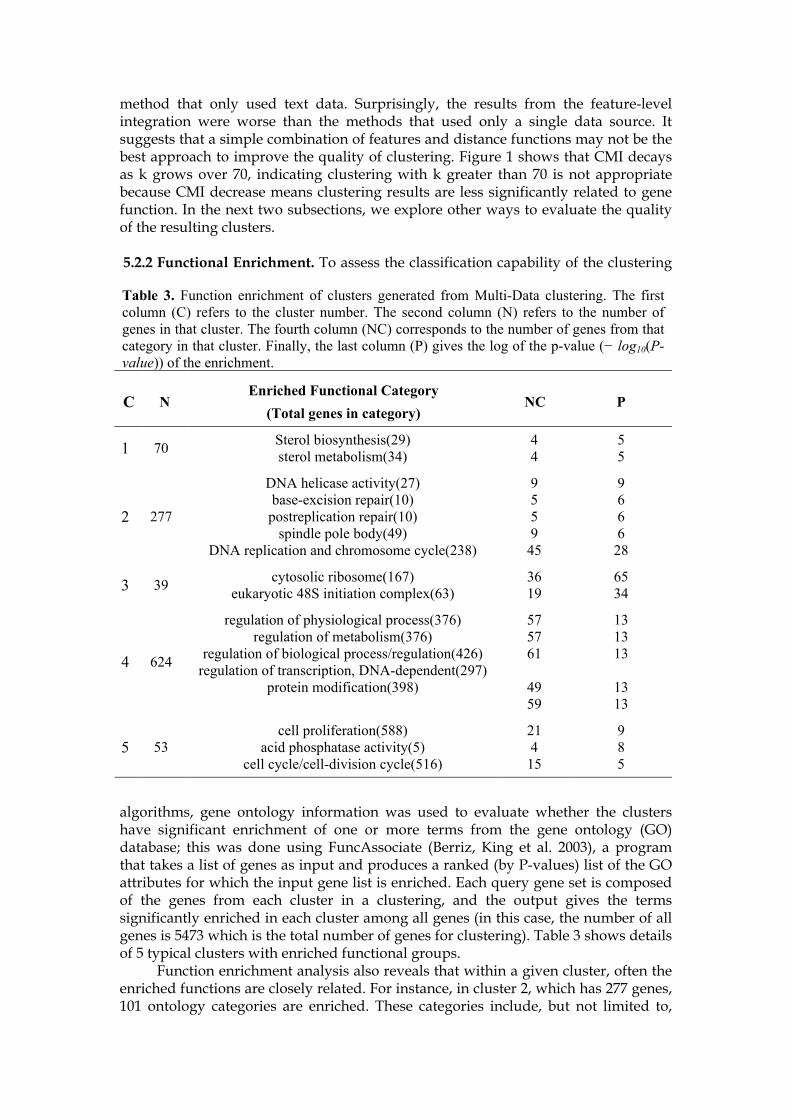
algorithms, gene ontology information was used to evaluate whether the clusters have significant enrichment of one or more terms from the gene ontology (GO) database; this was done using FuncAssociate (Berriz, King et al. 2003), a program that takes a list of genes as input and produces a ranked (by P-values) list of the GO attributes for which the input gene list is enriched. Each query gene set is composed of the genes from each cluster in a clustering, and the output gives the terms significantly enriched in each cluster among all genes (in this case, the number of all genes is 5473 which is the total number of genes for clustering). Table 3 shows details of 5 typical clusters with enriched functional groups. Function enrichment analysis also reveals that within a given cluster, often the enriched functions are closely related. For instance, in cluster 2, which has 277 genes, 101 ontology categories are enriched. These categories include, but not limited to,
Table 3. Function enrichment of clusters generated from Multi-Data clustering. The first column (C) refers to the cluster number. The second column (N) refers to the number of genes in that cluster. The fourth column (NC) corresponds to the number of genes from that category in that cluster. Finally, the last column (P) gives the log of the p-value (− log10(P-value)) of the enrichment.
C N Enriched Functional Category
(Total genes in category) NC P
1 70 Sterol biosynthesis(29) sterol metabolism(34)
4 4
5 5
2 277
DNA helicase activity(27) base-excision repair(10)
postreplication repair(10) spindle pole body(49)
DNA replication and chromosome cycle(238)
9 5 5 9
45
9 6 6 6
28
3 39 cytosolic ribosome(167) eukaryotic 48S initiation complex(63)
36 19
65 34
4 624
regulation of physiological process(376) regulation of metabolism(376)
regulation of biological process/regulation(426) regulation of transcription, DNA-dependent(297)
protein modification(398)
57 57 61
49 59
13 13 13
13 13
5 53 cell proliferation(588)
acid phosphatase activity(5) cell cycle/cell-division cycle(516)
21 4
15
9 8 5
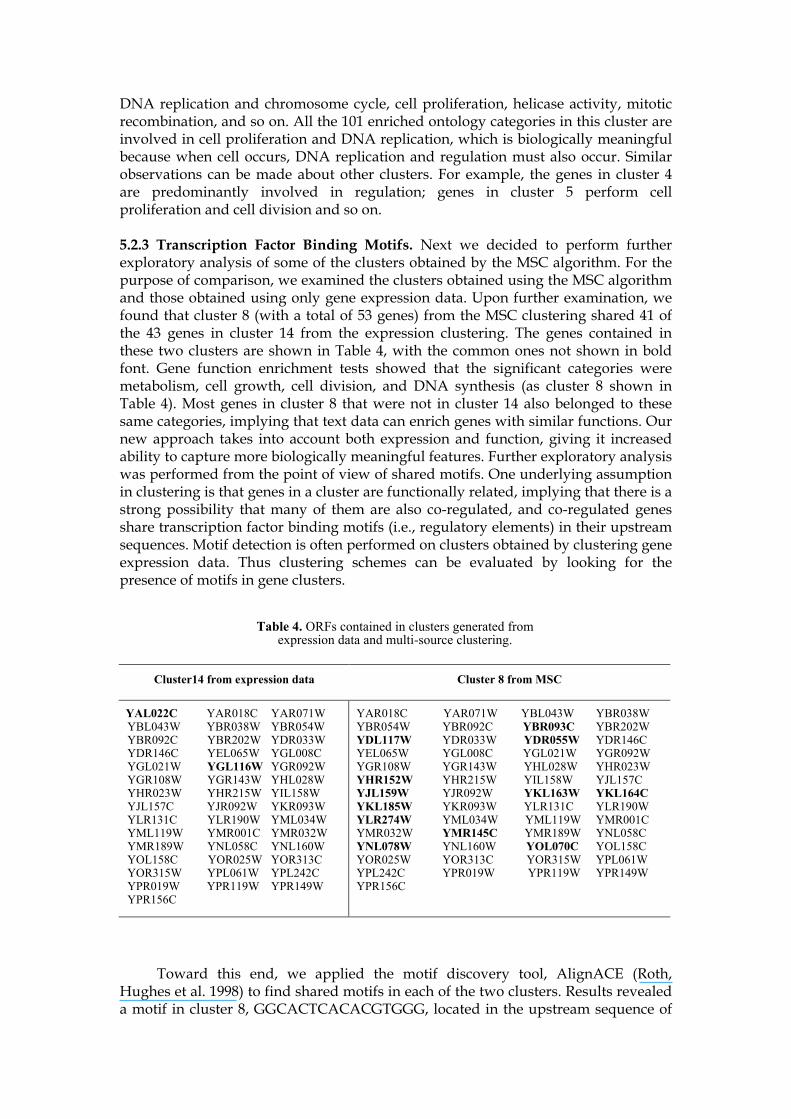
DNA replication and chromosome cycle, cell proliferation, helicase activity, mitotic recombination, and so on. All the 101 enriched ontology categories in this cluster are involved in cell proliferation and DNA replication, which is biologically meaningful because when cell occurs, DNA replication and regulation must also occur. Similar observations can be made about other clusters. For example, the genes in cluster 4 are predominantly involved in regulation; genes in cluster 5 perform cell proliferation and cell division and so on. 5.2.3 Transcription Factor Binding Motifs. Next we decided to perform further exploratory analysis of some of the clusters obtained by the MSC algorithm. For the purpose of comparison, we examined the clusters obtained using the MSC algorithm and those obtained using only gene expression data. Upon further examination, we found that cluster 8 (with a total of 53 genes) from the MSC clustering shared 41 of the 43 genes in cluster 14 from the expression clustering. The genes contained in these two clusters are shown in Table 4, with the common ones not shown in bold font. Gene function enrichment tests showed that the significant categories were metabolism, cell growth, cell division, and DNA synthesis (as cluster 8 shown in Table 4). Most genes in cluster 8 that were not in cluster 14 also belonged to these same categories, implying that text data can enrich genes with similar functions. Our new approach takes into account both expression and function, giving it increased ability to capture more biologically meaningful features. Further exploratory analysis was performed from the point of view of shared motifs. One underlying assumption in clustering is that genes in a cluster are functionally related, implying that there is a strong possibility that many of them are also co-regulated, and co-regulated genes share transcription factor binding motifs (i.e., regulatory elements) in their upstream sequences. Motif detection is often performed on clusters obtained by clustering gene expression data. Thus clustering schemes can be evaluated by looking for the presence of motifs in gene clusters.
Toward this end, we applied the motif discovery tool, AlignACE (Roth, Hughes et al. 1998) to find shared motifs in each of the two clusters. Results revealed a motif in cluster 8, GGCACTCACACGTGGG, located in the upstream sequence of
Table 4. ORFs contained in clusters generated from expression data and multi-source clustering.
Cluster14 from expression data Cluster 8 from MSC
YAL022C YAR018C YAR071W YBL043W YBR038W YBR054W YBR092C YBR202W YDR033W YDR146C YEL065W YGL008C YGL021W YGL116W YGR092W YGR108W YGR143W YHL028W YHR023W YHR215W YIL158W YJL157C YJR092W YKR093W YLR131C YLR190W YML034W YML119W YMR001C YMR032W YMR189W YNL058C YNL160W YOL158C YOR025W YOR313C YOR315W YPL061W YPL242C YPR019W YPR119W YPR149W YPR156C
YAR018C YAR071W YBL043W YBR038W YBR054W YBR092C YBR093C YBR202W YDL117W YDR033W YDR055W YDR146C YEL065W YGL008C YGL021W YGR092W YGR108W YGR143W YHL028W YHR023W YHR152W YHR215W YIL158W YJL157C YJL159W YJR092W YKL163W YKL164C YKL185W YKR093W YLR131C YLR190W YLR274W YML034W YML119W YMR001C YMR032W YMR145C YMR189W YNL058C YNL078W YNL160W YOL070C YOL158C YOR025W YOR313C YOR315W YPL061W YPL242C YPR019W YPR119W YPR149W YPR156C
YBR093C, which, according to TRANSFAC (Matys, Fricke et al. 2003), is known to be the binding site for the transcription factor PHO4 and has been reported previously in the literature (Vogel, Horz et al. 1989). Genes that shared this motif are YBR093C, YAR018C, YDR055W, YHR215W, YML034W, and YOR313C. In particular, YBR093C and YHR215W are two of three repressible acid phosphatases (SGD). However, this motif was not found in cluster 14. Thus, clustering obtained by integrating information from the literature databases, as performed by the MSC algorithm was able to better detect motifs.
5.3 Results of Constrained Clustering Algorithm
As discussed above, the MSC algorithm performed significantly better than the feature-level integration approach. However, a major disadvantage of the MSC algorithm is that it requires all the data sources to be complete (i.e., data available on all genes to be analyzed). Constrained clustering algorithm, on the other hand, should overcome this weakness since constraints can be generated from incomplete data sources. The motivation for designing the constrained clustering algorithm is based on the assumption that constraints based on prior correct knowledge can assist a clustering algorithm to improve its performance. Our experimental results confirm the hypothesis, but also show situations where it is not true.
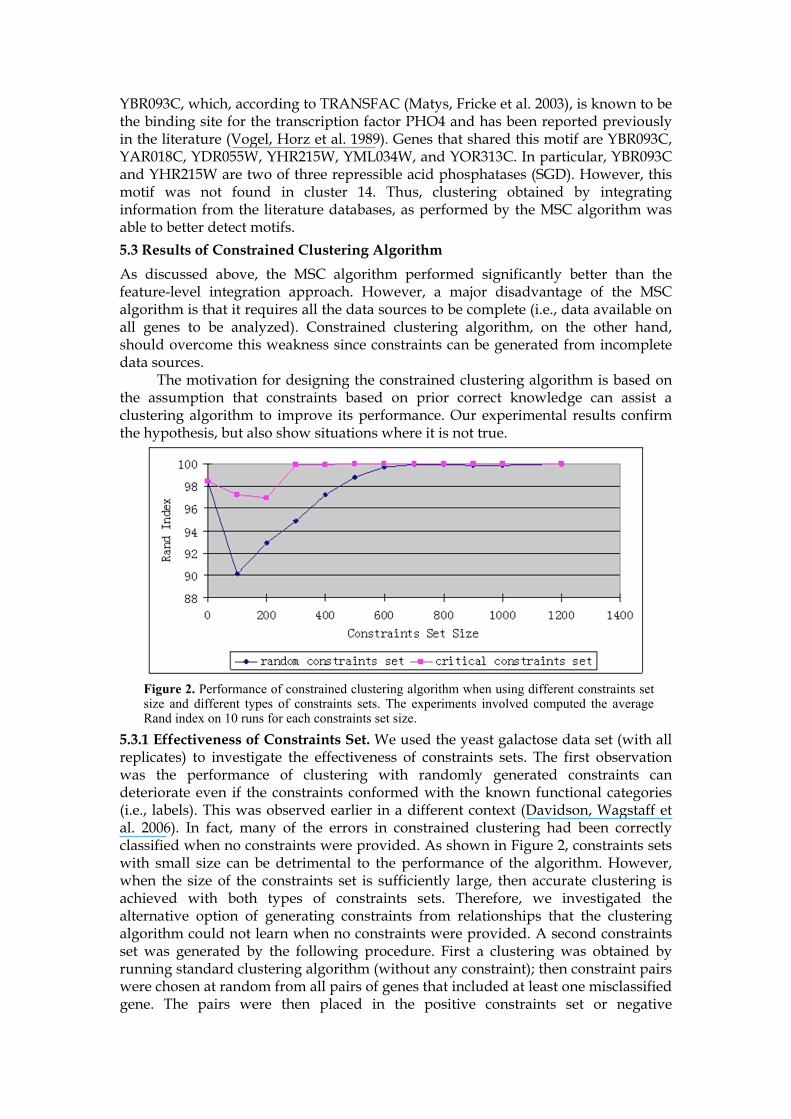
5.3.1 Effectiveness of Constraints Set. We used the yeast galactose data set (with all replicates) to investigate the effectiveness of constraints sets. The first observation was the performance of clustering with randomly generated constraints can deteriorate even if the constraints conformed with the known functional categories (i.e., labels). This was observed earlier in a different context (Davidson, Wagstaff et al. 2006). In fact, many of the errors in constrained clustering had been correctly classified when no constraints were provided. As shown in Figure 2, constraints sets with small size can be detrimental to the performance of the algorithm. However, when the size of the constraints set is sufficiently large, then accurate clustering is achieved with both types of constraints sets. Therefore, we investigated the alternative option of generating constraints from relationships that the clustering algorithm could not learn when no constraints were provided. A second constraints set was generated by the following procedure. First a clustering was obtained by running standard clustering algorithm (without any constraint); then constraint pairs were chosen at random from all pairs of genes that included at least one misclassified gene. The pairs were then placed in the positive constraints set or negative
Figure 2. Performance of constrained clustering algorithm when using different constraints set size and different types of constraints sets. The experiments involved computed the average Rand index on 10 runs for each constraints set size.
constraints set using the known labels. We refer to the resulting set of constraints as the critical constraints set. Figure 2 shows that accurate clustering can be achieved with much smaller critical constraints sets (roughly, 300 is enough in comparison to the roughly 700 that is needed in the case of random constraints sets). In practice, it is difficult to estimate the size of the critical constraints set required to achieve accurate clustering.
5.3.2 Results with Inconsistent Constraints. The results shown in Section 5.3.1 showed that small constraints set might hurt the ability to infer accurate clusters. However, all constraints used in Section 5.3.1 were known to be true and were based on known functional categories. Next we investigated how robust the
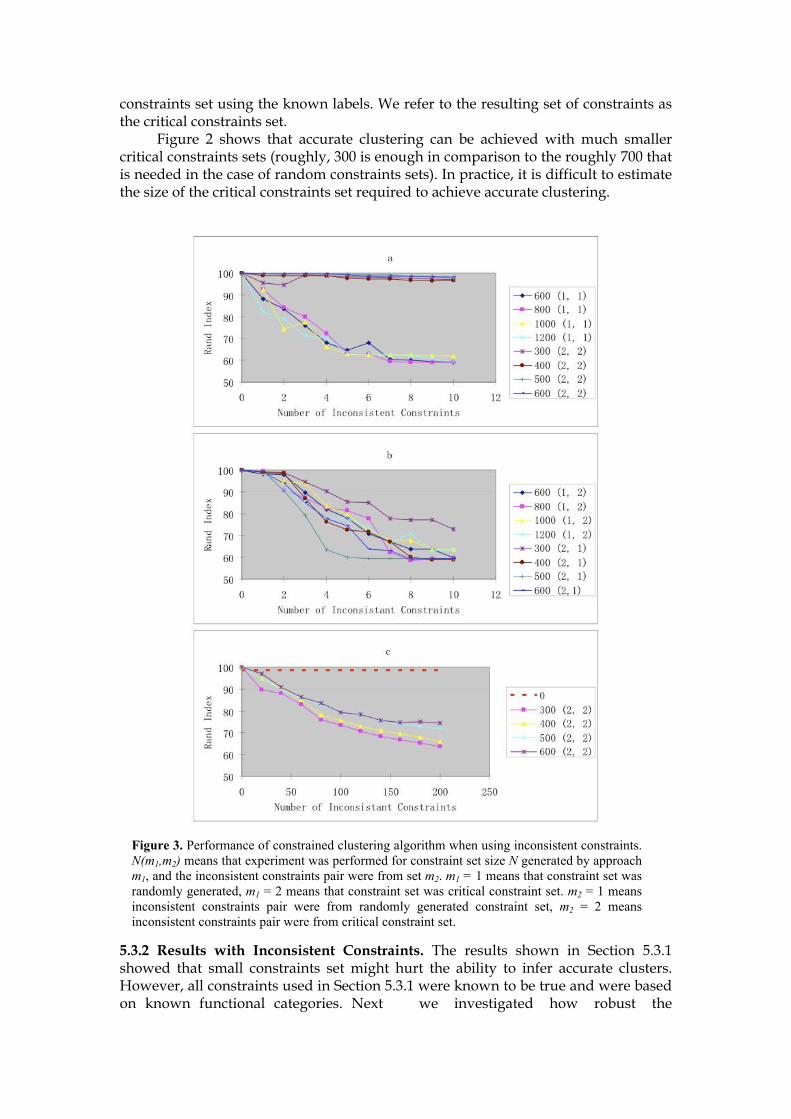
Figure 3. Performance of constrained clustering algorithm when using inconsistent constraints. N(m1,m2) means that experiment was performed for constraint set size N generated by approach m1, and the inconsistent constraints pair were from set m2. m1 = 1 means that constraint set was randomly generated, m1 = 2 means that constraint set was critical constraint set. m2 = 1 means inconsistent constraints pair were from randomly generated constraint set, m2 = 2 means inconsistent constraints pair were from critical constraint set.
algorithm was, i.e., how does it perform when a small number of constraints are incorrect or inconsistent with known functional categories. Once again, we consider two ways of generating constraints sets. As before, pairs were either picked at random or picked from among pairs with at least one misclassified gene. A small number of the generated constraints were then made inconsistent (i.e., put into positive constraints when they should have been put into negative constraints, vice versa). Figure 3a and Figure 3b show that a small number of inconsistent constraints do not affect clustering algorithm performance a lot when both consistent and inconsistent pairs of constraints were generated from the critical constraints set. Otherwise, the performance of the algorithm decreases dramatically. However, Figure 3c shows that algorithm performance decreases considerably if the fraction of inconsistent constraints rises above some threshold even when the consistent and inconsistent pairs of constraints were generated from critical constraints set. Overall, the results confirm the hypothesis that inconsistent constraints will diminish clustering performance and should be avoided.
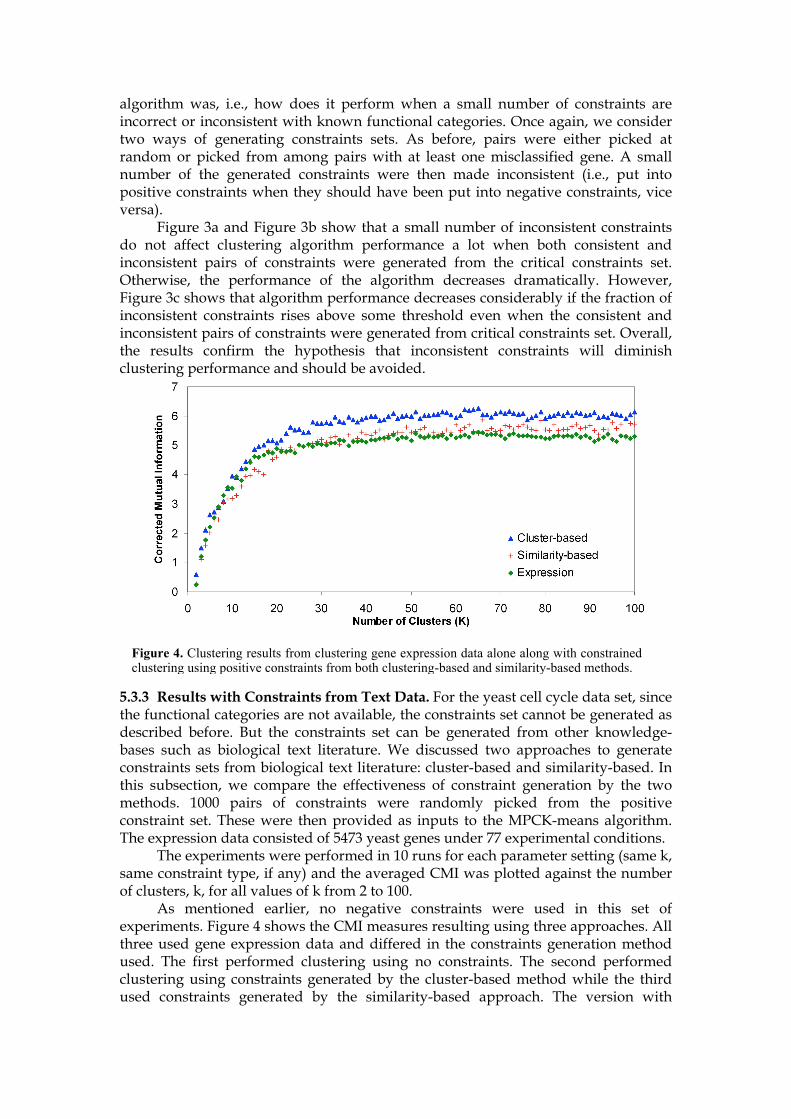
5.3.3 Results with Constraints from Text Data. For the yeast cell cycle data set, since the functional categories are not available, the constraints set cannot be generated as described before. But the constraints set can be generated from other knowledge-bases such as biological text literature. We discussed two approaches to generate constraints sets from biological text literature: cluster-based and similarity-based. In this subsection, we compare the effectiveness of constraint generation by the two methods. 1000 pairs of constraints were randomly picked from the positive constraint set. These were then provided as inputs to the MPCK-means algorithm. The expression data consisted of 5473 yeast genes under 77 experimental conditions. The experiments were performed in 10 runs for each parameter setting (same k, same constraint type, if any) and the averaged CMI was plotted against the number of clusters, k, for all values of k from 2 to 100. As mentioned earlier, no negative constraints were used in this set of experiments. Figure 4 shows the CMI measures resulting using three approaches. All three used gene expression data and differed in the constraints generation method used. The first performed clustering using no constraints. The second performed clustering using constraints generated by the cluster-based method while the third used constraints generated by the similarity-based approach. The version with
Figure 4. Clustering results from clustering gene expression data alone along with constrained clustering using positive constraints from both clustering-based and similarity-based methods.
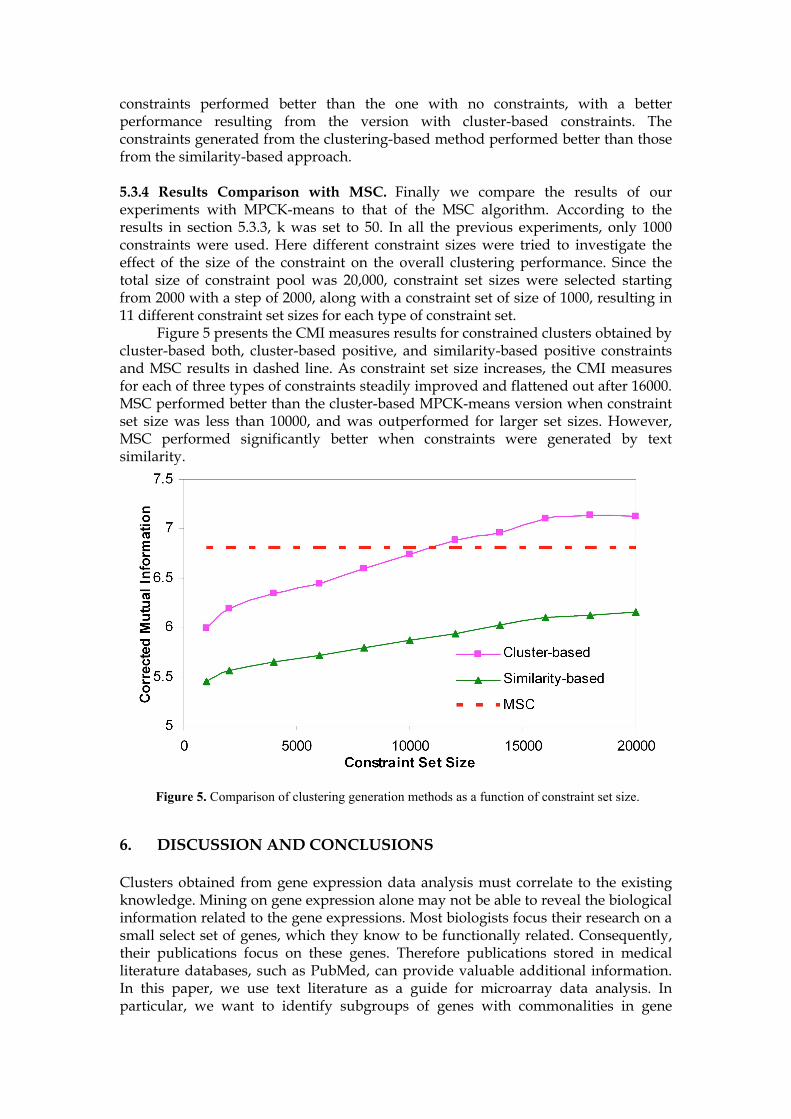
constraints performed better than the one with no constraints, with a better performance resulting from the version with cluster-based constraints. The constraints generated from the clustering-based method performed better than those from the similarity-based approach. 5.3.4 Results Comparison with MSC. Finally we compare the results of our experiments with MPCK-means to that of the MSC algorithm. According to the results in section 5.3.3, k was set to 50. In all the previous experiments, only 1000 constraints were used. Here different constraint sizes were tried to investigate the effect of the size of the constraint on the overall clustering performance. Since the total size of constraint pool was 20,000, constraint set sizes were selected starting from 2000 with a step of 2000, along with a constraint set of size of 1000, resulting in 11 different constraint set sizes for each type of constraint set. Figure 5 presents the CMI measures results for constrained clusters obtained by cluster-based both, cluster-based positive, and similarity-based positive constraints and MSC results in dashed line. As constraint set size increases, the CMI measures for each of three types of constraints steadily improved and flattened out after 16000. MSC performed better than the cluster-based MPCK-means version when constraint set size was less than 10000, and was outperformed for larger set sizes. However, MSC performed significantly better when constraints were generated by text similarity.
6. DISCUSSION AND CONCLUSIONS Clusters obtained from gene expression data analysis must correlate to the existing knowledge. Mining on gene expression alone may not be able to reveal the biological information related to the gene expressions. Most biologists focus their research on a small select set of genes, which they know to be functionally related. Consequently, their publications focus on these genes. Therefore publications stored in medical literature databases, such as PubMed, can provide valuable additional information. In this paper, we use text literature as a guide for microarray data analysis. In particular, we want to identify subgroups of genes with commonalities in gene
Figure 5. Comparison of clustering generation methods as a function of constraint set size.
expression and in biological function. We developed two clustering algorithms for clustering genes incorporating information from literature text data. These two algorithms were applied to gene expression data for the same purpose, but differ in the way using literature text data. When the information from literature text data is complete (i.e., data available on all genes to be analyzed), the MSC algorithm performed significantly better than the feature-level integration approach. Also, the clusters from the MSC algorithm shared regulatory elements that were not found using gene expression data alone. For the situation that complete information from literature text data is not available, constrained clustering algorithm can be applied to gene expression data with constraints derived from a subset of the literature data. We showed that constraints set may not improve the performance of a clustering algorithm if it is not carefully chosen or not large enough. We concluded that inconsistent constraints should be avoided since small number of them will hurt the clustering. We explored several ways of deriving constraints from prior knowledge about the data and from external biological text literature. Our results suggested that clustering using constraints generated from a clustering-based approach outperformed the case when constraints were generated using a similarity-based approach. Comparisons with MSC algorithm showed that constraint-based methods performed better assuming that the constraints were of sufficiently high quality. Based on our experience, negative constraints are not appropriate for text literature data source. However, we conjecture that it is appropriate for other data sources such as protein-protein interactions, and to a limited extent, regulatory element information. Clustering using heterogeneous data sources is a rapidly growing area of research. Future plans include incorporating more data sources for clustering and comparative studies on the clustering methods proposed in this paper and other methods, such as ensemble clustering, which involves finding a single consensus solution by combining a set of clusterings obtained from different data sources.
REFERENCE
Basu, S., A. Banerjee, et al. (2002). Semi-supervised clustering by seeding. International Conference on Machine Learning.
Becker, S. (1996). "Mutual information maximization: Models of cortical self-organization." Network: Computation in Neural Systems 7(1): 7-31.
Berriz, G. F., O. D. King, et al. (2003). "Characterizing gene sets with FuncAssociate." Bioinformatics 19(18): 2502-2504.
Bickel, S. and S. Tobias (2004). Multi-View Clustering. Proceedings of the Fourth IEEE International Conference on Data Mining (ICDM'04).
Bilenko, M., S. Basu, et al. (2004). Integrating constraints and metric learning in semi-supervised clustering. International Conference on Machine Learning (ICML '04).
Chiang, J. H. and H. C. Yu (2003). "MeKE: discovering the functions of gene products from biomedical literature via sentence alignment." Bioinformatics 19(11): 1417-1422.
Davidson, I., K. L. Wagstaff, et al. (2006). "Measuring constraint-set utility for partitional clustering algorithms." Knowledge Discovery in Databases: Pkdd 2006, Proceedings 4213: 115-126.
de Souto, M. C., I. G. Costa, et al. (2008). "Clustering cancer gene expression data: a comparative study." BMC Bioinformatics 9: 497.
Dempster, A. P., N. M. Laird, et al. (1977). "Maximum likelihood from incomplete data via the em algorithm." Journal of the Royal Statistical Society 39: 1-38.
Gibbons, F. D. and F. P. Roth (2002). "Judging the quality of gene expression-based clustering methods using gene annotation." Genome Research 12(10): 1574-1581.
Glenisson, P., P. Antal, et al. (2003). "Evaluation of the vector space representation in text-based gene clustering." Pac Symp Biocomput: 391-402.
Glenisson, P., J. Mathys, et al. (2003). "Meta-clustering of gene expression data and literature-based information." SIGKDD Explor. Newsl. 5(2): 101-112.
Ideker, T., V. Thorsson, et al. (2001). "Integrated genomic and proteomic analyses of a systematically perturbed metabolic network." Science 292(5518): 929-934.
Jain, A. K. and R. C. Dubes (1988). Algorithms for clustering data, Prentice Hall. Kasturi, J. and R. Acharya (2004 ). Clustering of diverse genomic data using
information fusion Proceedings of the 2004 ACM symposium on Applied computing Nicosia, Cyprus ACM Press: 116-120
Kerr, G., H. J. Ruskin, et al. (2008). "Techniques for clustering gene expression data." Comput Biol Med 38(3): 283-293.
Klein, D., S. D. Kamvar, et al. (2002). From instance-level constraints to space- level constraints: Making the most of prior knowledge in data clustering. International Conference on Machine Learning (ICML'02).
Matys, V., E. Fricke, et al. (2003). "TRANSFAC(R): transcriptional regulation, from patterns to profiles." Nucl. Acids Res. 31(1): 374-378.
Raghavan, V. V. and S. K. M. Wong (1986). "A critical analysis of vector space model for information retrieval." Journal of the American Society for Information Science 37(5): 279-287.
Rand, W. M. (1971). "Objective Criteria for Evaluation of Clustering Methods." Journal of the American Statistical Association 66(336): 846-&.
Roberts, R. J. (2001). "PubMed Central: The GenBank of the published literature." Proc Natl Acad Sci U S A 98(2): 381-382.
Roth, F. P., J. D. Hughes, et al. (1998). "Finding DNA regulatory motifs within unaligned noncoding sequences clustered by whole-genome mRNA quantitation." Nature Biotechnology 16(10): 939-945.
Spellman, P. T., G. Sherlock, et al. (1998). "Identification of cell cycle regulated genes in yeast by DNA microarray hybridization." Molecular Biology of the Cell 9: 371a-371a.
Stephens, M., M. Palakal, et al. (2001). Detecting gene relations from MEDLINE abstracts. Proc of the sixth Ann Pac Symp Biocomp (PSB 2001).
Vogel, K., W. Horz, et al. (1989). "The two positively acting regulatory proteins PHO2 and PHO4 physically interact with PHO5 upstream activation regions." Mol Cell Biol 9(5): 2050-2057.
Wagsta, K., S. Basu, et al. (2006). When is constrained clustering beneficial, and why? AAAI.
Wagsta, K., C. Cardie, et al. (2001). Constrained k-means clustering with background knowledge. 18th International Conference on Machine Learning (ICML-01).
Wu, L., S. L. Oviatt, et al. (1999). "Multimodal integration - a statistical view." IEEE Transactions on Multimedia 1(4): 334-341.
Xing, E. P., A. Y. Ng, et al. (2002). Distance metric learning, with application to clustering with side-information. Advances in Neural Information Processing Systems 15, MIT Press: 505-512.

Yandell, M. D. and W. H. Majoros (2002). "Genomics and natural language processing." Nature Reviews Genetics 3(8): 601-610.
Yeung, K. Y., M. Medvedovic, et al. (2003). "Clustering gene-expression data with repeated measurements." Genome Biol 4(5): R34.
Zare, H., A. B. Khodursky, et al. (2006). Gene clustering and gene function prediction using multiple sources of data. IEEE Genomic Signal Processing and Statistics 2006 113-114.
Zhong, S. and J. Ghosh (2003). A comparative study of generative models for document clustering. Proceedings of the workshop on Clustering High Dimensional Data and Its Applications in SIAM Data Mining Conference.