
An exact solution of the metric-affine gauge theory with dilation, shear, and spin charges
Active dilation of penetrating arterioles restoresred blood cell flux to penumbral neocortex afterfocal stroke
Andy Y Shih1, Beth Friedman2, Patrick J Drew1, Philbert S Tsai1, Patrick D Lyden2,3 andDavid Kleinfeld1,3
1Department of Physics, University of California at San Diego, La Jolla, California, USA; 2Department ofNeuroscience, University of California at San Diego, La Jolla, California, USA; 3Graduate Program inNeurosciences, University of California at San Diego, La Jolla, California, USA
Pial arterioles actively change diameter to regulate blood flow to the cortex. However, it is unclearwhether arteriole reactivity and its homeostatic role of conserving red blood cell (RBC) flux remainsintact after a transient period of ischemia. To examine this issue, we measured vasodynamics in pialarteriole networks that overlie the stroke penumbra during transient middle cerebral artery occlusionin rat. In vivo two-photon laser-scanning microscopy was used to obtain direct and repeatedmeasurements of RBC velocity and lumen diameter of individual arterioles, from which the flux ofRBCs was calculated. We observed that occlusion altered surface arteriole flow patterns in a mannerthat ensured undisrupted flow to penetrating arterioles throughout the imaging field. Small-diameterarterioles ( < 23 lm), which included 88% of all penetrating arterioles, exhibited robust vasodilationover a 90-min occlusion period. Critically, persistent vasodilation compensated for an incompleterecovery of RBC velocity during reperfusion to enable a complete restoration of postischemic RBCflux. Further, histologic examination of tissue hypoxia suggested re-oxygenation through all corticallayers of the penumbra. These findings indicate that selective reactivity of small pial arterioles ispreserved in the stroke penumbra and acts to conserve RBC flux during reperfusion.Journal of Cerebral Blood Flow & Metabolism advance online publication, 28 January 2009; doi:10.1038/jcbfm.2008.166
Keywords: homeostasis; ischemia; rodent; two-photon microscopy; vasculature
Introduction
The in vivo examination of blood flow in singlearterioles has been a valuable approach to studyingvascular function under normal and pathologicconditions. In rats, the perfusion of each cubicmillimeter of neocortex is strictly regulated by 10or more penetrating arterioles (Nishimura et al,2007), which are in turn supplied by a highlyinterconnected plexus of surface arterioles withheterogeneous flow profiles (Bar, 1980; Schaffer
et al, 2006). The vascular response to change inneuronal input (Devor et al, 2007, 2008) or to thedisruption of blood flow (Kontos et al, 1978) involvespopulations of arterioles that react differently basedon their size and location within the network. Thus,examination of blood flow in the level of individualvessels is necessary to characterize these responses.
Red blood cell (RBC) velocity in pial arteriolesis, on average, an order of magnitude faster thanin capillaries. Using confocal or two-photon laser-scanning microscopy, RBC velocity is tracked inindividual arterioles using high-speed line scans(Dirnagl et al, 1992; Kleinfeld et al, 1998), andvessel diameters are concurrently determined fromplanar image stacks. These two measurementsare then combined to determine the volume flux ofRBCs, which provides a complete description ofblood flow in each vessel (Ngai and Winn, 1996;Rovainen et al, 1993; Schaffer et al, 2006).
We apply this technique to examine the importantissue of whether homeostatic regulation of RBCflux is preserved in the acutely recovering stroke
Received 9 July 2008; revised 9 December 2008; accepted 12December 2008
Correspondence: Dr D Kleinfeld, Department of Physics, Univer-sity of California at San Diego, 9500 Gilman Drive, La Jolla, CA92093-0374, USA.E-mail: [email protected]
This work was funded by the Canadian Institutes of Health
Research, the National Institutes of Health (NCRR, NIA, NIBIB,
and NINDS), the National Science Foundation, and the Veterans
Medical Research Foundation.
Journal of Cerebral Blood Flow & Metabolism (2009), 1–14& 2009 ISCBFM All rights reserved 0271-678X/09 $32.00
www.jcbfm.com

penumbra (Iadecola, 1998). The preservation ofcerebrovascular reactivity is critical for bufferingvariations in postischemic blood flow (Paulson et al,1990), and the loss of this function in humans hasbeen linked to the recurrence of stroke and to poorrecovery from stroke (Marshall, 2004). Severe ische-mia in the focal stroke core can compromise themyogenic response to changes in arteriole pressure(Cipolla et al, 2001). However, less is known aboutthe state of arterioles in the stroke penumbra, whereresidual blood flow may be sufficient to preservevascular function and improve tissue recovery afterreperfusion (Dirnagl and Pulsinelli, 1990; Iadecola,1998). This includes the effect of stroke on penetrat-ing arteriole reactivity, which constitutes B40% ofthe cerebrovascular resistance for blood flow (Cipollaet al, 2004; Heistad and Kontos, 1983).
We measured the vasodynamics of flow in pialarterioles across the stroke penumbra in the parietalcortex during 90 mins of transient middle cerebralartery occlusion (tMCAo). We ask the followingquestions: (i) How does the pattern of RBC flow inthe pial arteriole network change in response to MCAocclusion, and what is the role of these flowchanges? (ii) Does the measurement of RBC velocityor lumen diameter alone accurately predict RBC fluxduring stroke? (iii) Is compensatory arteriole reactiv-ity intact after stroke, and are penetrating arterioles,as a population, able to maintain normal levels offlux? Importantly, these questions are not accessibleto laser Doppler flowmetry (LDF), which recordsfrom multiple vessels and, in practice, is insensitiveto the relatively high flow rates in pial vessels(Barfod et al, 1997). Rather, we make use of in vivotwo-photon laser-scanning microscopy to obtainsystematic and repeated measurements of RBCvelocity and lumen diameter in individual surfaceand penetrating arterioles.
Materials and methods
Animal Models and Surgery
In total, 57 male Sprague–Dawley rats were used in thisstudy (Charles River, Hollister, CA, USA), ranging in massfrom 270 to 310 g. Thirteen animals were imaged duringtMCAo using the Koizumi method, that is, ligation of theipsilateral common carotid artery (CCA) during reperfusion(Koizumi et al, 1986); 4 for tMCAo using the Longamethod, that is, the ipsilateral CCA is intact duringreperfusion (Longa et al, 1989); 7 for sham tMCAo controls,that is, ipsilateral CCA ligation and partial filamentinsertion (Supplementary Figure 2); 6 for Window-onlycontrols, that is, cranial window but no vascular manip-ulation (Supplementary Figure 3); 4 for hypercapnictreatment to control for large surface arteriole dilation; 12for pimonidazole studies using the Koizumi method; and11 for LDF studies. Anesthesia was maintained with 1 to2% (v/v) isoflurane (Baxter Healthcare, Deerfield, IL, USA)in 30% oxygen and 70% nitrous oxide. As isoflurane is avasodilator that can affect cerebral autoregulation (Eger,
1981), the Window-only group controlled for the effects ofanesthesia over time (Supplementary Figure 3). Atropine(American Regent, Shirley, NY, USA), 0.05 mg per kg bodyweight intraperitoneal, and lidocaine (Hospira Inc., LakeForest, IL, USA), 2% (v/v) subcutaneous, were adminis-tered at the start of surgery. Body temperature wasmaintained at 371C with a feedback-regulated heat pad(50-7053-F; Harvard, Holliston, MA, USA). Heart rate andblood oxygen saturation were continuously monitoredusing a pulse oximeter (8600V; Nonin, Plymouth, MN,USA). Cranial windows, 4� 4 mm in size and centered at4.5 mm medial–lateral and �3.0 mm anterior–posterior,were constructed, as described earlier (Kleinfeld et al,2008). The left femoral artery was catheterized withpolyethylene 50 tubing (BD diagnostics, Sparks, MD,USA) connected to a stopcock and a 10-mL syringe filledwith heparin saline (20 units per mL, Baxter Healthcare).Arterial blood was sampled from the catheter for blood gasmeasurement (RapidLab 248; Bayer, Norwood, MA, USA)during each of three imaging periods, that is, baseline,occlusion, and reperfusion. Blood pressure was measuredwith the tail cuff method (XBP-1000; Kent Scientific,Torrington, CT, USA) once during each imaging period.Intraperitoneal injections of 5% (w/v) glucose in 1 mLsaline were given every 2 h for re-hydration.
Transient middle cerebral artery occlusion was inducedusing the intraluminal filament method. Ischemia wasmaintained for 90 mins and followed by 90 mins ofreperfusion. We examined two variations of the modeland exploited their differences in postischemic blood flow.In the majority of the experiments, the CCA was perma-nently ligated to generate an incomplete reperfusion(Koizumi et al, 1986). In a control study, we left the CCAintact, which generated a transient hyperemia during thereperfusion period (Longa et al, 1989). In all cases, thefilament placement was guided with LDF measurementsthrough the cranial window. Animals that exhibitedsubarachnoid hemorrhage were excluded from the study.
The penumbra was defined by the amount of residualblood flow during occlusion, typically ranging within 25%to 50% of baseline flow values, measured either using LDFor averaging arteriole flux measurements from the cranialwindow. This level of blood flow in the penumbra is agenerally accepted range (Lipton, 1999) and is contrastedto flow in the ischemic core, which can be lower than 20%of baseline.
Two-Photon Microscopy
Images were collected using a two-photon laser scanningmicroscope of local design (Tsai et al, 2003; Tsai et al,2002), which was controlled by MPScope software(Nguyen et al, 2006). The blood serum was labeled using0.3 mL of 2 MDa fluorescein dextran (FD2000S; Sigma, StLouis, MO, USA) prepared at a concentration of 5% (w/v)in saline, and delivered through the femoral artery catheter,with 0.1 mL supplements as required (Schaffer et al, 2006).A 0.3 numerical aperture (NA), � 10 magnification water-dipping objective (Zeiss, Thornwood, NY, USA) was usedto collect a large-scale map to aid navigation through the
Flux conservation after cortical reperfusionAY Shih et al
2
Journal of Cerebral Blood Flow & Metabolism (2009) 00, 1–14
cortical vasculature, whereas a 0.8-NA, � 40 magnificationwater-dipping objective (Olympus, Center Valley, PA, USA)was used to obtain high-resolution line scan and planardata. The line scans were collected along the centerline ofeach vessel over a length of 70 pixels, spanning 7 to 76 mm,at a scan rate of 1.6 kHz/line. Red blood cell velocity wasdetermined from the slope of the line-scan streaks using amethod based on singular value decomposition (Kleinfeldet al, 1998). For each vessel, we reported the averagevelocity over a 1.5-s period. Planar image stacks, 256� 256pixels, were acquired to establish the diameter of the vessel.Our analysis was limited to arterioles smaller than 60mm indiameter as a result of technical constraints. A furtherlimitation was that penetrating arterioles could only bemeasured if a portion of the vessel was parallel to the corticalsurface before diving perpendicularly. In a survey of 154penetrating arterioles across 11 rats, 17% were not measur-able as a result of this limitation.
During analysis of surface arterioles, a 23-mm breakpointwas used to divide the vessels into small- and large-diameter categories. This number corresponded to theintersection between normalized histograms for penetrat-ing arteriole (n = 215) and surface arteriole (n = 271)diameters at baseline, and by maximum likelihood, wasthe natural point to divide the data. Further, 23 mm was themedian diameter for measured surface arterioles.
Flux Quantification
Under the assumption that the flow in the vessels islaminar, RBC velocity and lumen diameter collected from asingle vessel can be used to define the average volume flux,F!
, by:
F!¼ h v!iA ¼ p
8v!ð0Þd2 ð1Þ
where h v!i is the average RBC velocity, A the cross-sectional area of the vessel lumen, v!ð0Þ the RBC velocityalong the central axis of the vessel, and d the lumendiameter. Our sign convention is that positive velocitypoints in the direction of flow prior to the occlusion. Theconstraint of constant flux implies that the change indiameter, Dd, that is required to offset a change in speed,that is, D v!ð0Þ, is given by
Dd
d¼
ffiffiffiffiffiffiffiffiffiffiffiffiffiffiffiffiffiffiffiffiffiffiffiffiffiffiffiffiffiffiffiffiffiffiffiffi1
1 þ D v!ð0Þ= v!ð0Þ
s� 1�!D v!!0
� 1
2
D v!ð0Þv!ð0Þ
ð2Þ
A decrease in v!ð0Þ, that is, D v!ð0Þ< 0, yields an increase ind, that is, Dd > 0.
Vascular Casting
A fluorescent agarose gel was formulated from 0.42% (w/v)2 MDa fluorescein dextran and 1% (w/v) low gellingtemperature agarose (A4018; Sigma) in phosphate-bufferedsaline (PBS), mixed at 601C, and maintained at 401C beforeuse (Tsai, 2004). Cerebral blood vessels were dilated byadministration of 5% CO2 and 95% O2 with 2% isofluranethrough a nose cone for 15 mins to facilitate perfusion of thegel. Animals were perfused transcardially through the leftventricle with 100 mL of PBS, 100 mL of 4% paraformalde-
hyde, another 50 mL of PBS to wash out residual fixative. Gel(50 mL) was then steadily injected into the ventricle using asyringe at a rate of B2 mL per sec. The gel was rapidlysolidified in situ by placing the animal in an ice bath. Thebrain was carefully extracted to avoid damage to pial vessels.The cortex of the ischemic hemisphere was removed andflattened between two glass slides separated by a distance of3 mm for wide-field fluorescence microscopy (Axioplan 2;Zeiss). The arteriole network, including the region imaged invivo, was traced from overlapping images taken with a 0.5-NA � 10 magnification air objective (Zeiss).
Pimonidazole Immunohistochemistry
Pimonidazole hydrochloride (Hypoxyprobet; http://www.hypoxyprobe.com) is a sensitive method for detect-ing even small volumes of tissue hypoxia, that is,< 10 mm Hg tissue oxygen, compared with B30 mm Hgunder normoxic conditions (Nishimura et al, 2006;Takasawa et al, 2008). Pimonidazole was injected throughthe femoral artery catheter at a concentration of 60 mg perkg body weight. For immunostaining, 50-mm-thick frozensections were treated for 10 mins with 3% (v/v) H2O2, andincubated for 72 h at room temperature in an anti-Hypoxyprobe antibody diluted 103 times in PBS containing10% (v/v) of normal goat serum (Vector Laboratories,Burlingame, CA, USA), 2% (v/v) of Triton X-100 (Sigma),and 0.2% (v/v) of sodium azide (Sigma). Bound antibodywas visualized with the Vectastain ABC kit and diamino-benzadine peroxidase substrate kit (both from Vector Labora-tories), and brain sections were photographed using aMacroView microscope (MVX10; Zeiss). Pimonidazole stain-ing was quantified from brain sections, originating frombregma �3.0 mm anterior–posterior, by first determining thenormalized intensity histogram for staining in both ischemic(ipsilateral) and nonischemic (contralateral) cortices. Athreshold, set to include the largest 90% of pixel valuesfrom the nonischemic side, was then used to isolate stainedregions on the ischemic side, which was presented as apercentage of the total cortical area.
Laser Doppler Flowmetry
Flowmetry measurements were performed with a MoorLabunit (Moor Instruments, Millwey, Axminster, Devon, UK;lo = 780 nm and fcut = 15 kHz low-pass filtered, to give amaximum measurable speed of lo fcut/2= 6 mm/sec), fittedwith an MP1-V2 probe tip that was held in place with acustom adaptor over the cranial window or thinned skull.The LDF ‘flux’ output, a measure of average RBC velocitymultiplied by the intensity of the reflected signal, wascollected at a sampling rate of 40 Hz using WinEDRsoftware (http://spider.science.strath.ac.uk/sipbs/softwar-e_ses.htm), and averaged over 60-sec intervals.
Statistics
Data are presented as mean±s.e.m. We used the nonpara-metric Wilcoxon signed rank test unless otherwise stated, asthe in vivo imaging data were not always normally distributed.
Flux conservation after cortical reperfusionAY Shih et al
3
Journal of Cerebral Blood Flow & Metabolism (2009) 00, 1–14

In Figure 4, differences between experimental means and atheoretical line of conserved flux were tested with a two-tailedone-sample t-test. In Figure 6, differences between thepimonidazole-stained cortical area were analyzed with anunpaired t-test. In Figure 7, vasodynamic changes betweenimaging periods were analyzed using a two-tailed paired t-test.
Results
Pial Arteriole Vasodynamics under Basal Conditions
We obtained an overview of RBC flux from surfaceand penetrating arterioles through a cranial window
in the anesthetized rats (Figures 1A to 1C). Linescans were used to measure the centerline velocity(maximal velocity) of RBCs in individual arterioles,denoted as v!ð0Þ, followed immediately by thecollection of an image stack to measure vesseldiameter, d (Figures 1D and 1E). A random samplingof surface arterioles at baseline yielded RBC velo-cities that ranged from 1.4 to 34 mm/sec in vesselswith diameters between 5 and 60 mm (Figure 1F). Therange of velocities in penetrating arterioles wassimilar, 0.7 to 35 mm/sec, but all vessels were30 mm or less in diameter (Figure 1G). Velocitieswere significantly correlated with diameter for both
Figure 1 Vascular parameters of individual pial arterioles under basal conditions. (A) The location of the imaged region over the rightdorsolateral cortex is marked (dashed square). Below, a tracing of the MCA network, derived from the vascular casting method,shows the imaged region (dashed square) relative to major distal MCA branches (thick black lines) and detailed interconnecting loopstructures (thin black lines). M, medial; R, rostral. (B) A flattened 3-D image stack collected from the cranial window, i.e., maximal Zaxis projection (300 mm depth, 5 mm steps). All TPLSM (two-photon laser-scanning microscopy) images were inverted for improvedcontrast of the vasculature. (C) Arteriole tracing of the imaged region, which reveals surface arterioles (SA) and penetrating arterioles(PA) that were randomly sampled. The analysis of a typical surface arteriole (blue square) and penetrating arteriole (red square) isshown. (D and E) Lumen diameter, d, was measured from maximal projections of planar 3-D image stacks (distance betweenarrowheads). Line scans were repeatedly collected from the arteriole centerline axis (white line) and stacked sequentially to form aspace-time image. The streaks within the line-scan image represent non-fluorescent RBC moving through a fluorescent background,with the x axis representing the distance traveled by the RBCs, x, and the y axis representing time, t. Centerline RBC velocity, v!ð0Þ,was then calculated from the inverse of the slope of the RBC streaks, as shown in the equation. (F and G) Centerline velocity of RBCsfrom three categories of arterioles: large surface arterioles, small surface arterioles, and penetrating arterioles, plotted as a function oflumen diameter. The mean velocity and diameter of each arteriole category (black circle) and linear fit (dotted line) are shown. (H)Histogram of the range of RBC fluxes, and average flux (arrowhead), for each arteriole category.
Flux conservation after cortical reperfusionAY Shih et al
4
Journal of Cerebral Blood Flow & Metabolism (2009) 00, 1–14
surface arterioles, r = 0.49 (P < 10�4), and penetratingarterioles, r = 0.26 (P < 10�4). To emphasize size-baseddifferences in our subsequent analyses, we separatedthe arterioles into three categories, namely largesurface arterioles (d > 23 mm, that is, diametersgreater that the median diameter of surface arter-ioles), small surface arterioles (d < 23 mm), andpenetrating arterioles. The flux of RBCs (Equation(1)) in large surface arterioles ranged from 0.3 to100 nL/sec, whereas flux in small surface arteriolesand penetrating arterioles were, on average, an orderof magnitude lower, typically between 0.01 and10 nL/sec (Figure 1H).
Pial Arteriole Vasodynamics in Response to TransientMiddle Cerebral Artery Occlusion
We used the intraluminal filament model to transi-ently occlude the MCA origin for 90 mins followedby 90 mins of reperfusion (Koizumi et al, 1986). Wefirst considered stroke-induced change in RBC flowdirection within the pial network, followed byquantitative near-simultaneous measurements ofRBC velocity and lumen diameter. We then com-bined these two measurements to assess volume fluxof RBCs. Physiologic parameters including blood gas,blood pressure, and core temperature were withinnormal limits throughout the imaging sessions
(Supplementary Table 1). Unnormalized values forall measured vasodynamic parameters are providedin Supplementary Figure 1.
Middle Cerebral Artery Occlusion Causes Red BloodCell Flow Reversal in Surface Arterioles but not inPenetrating Arterioles
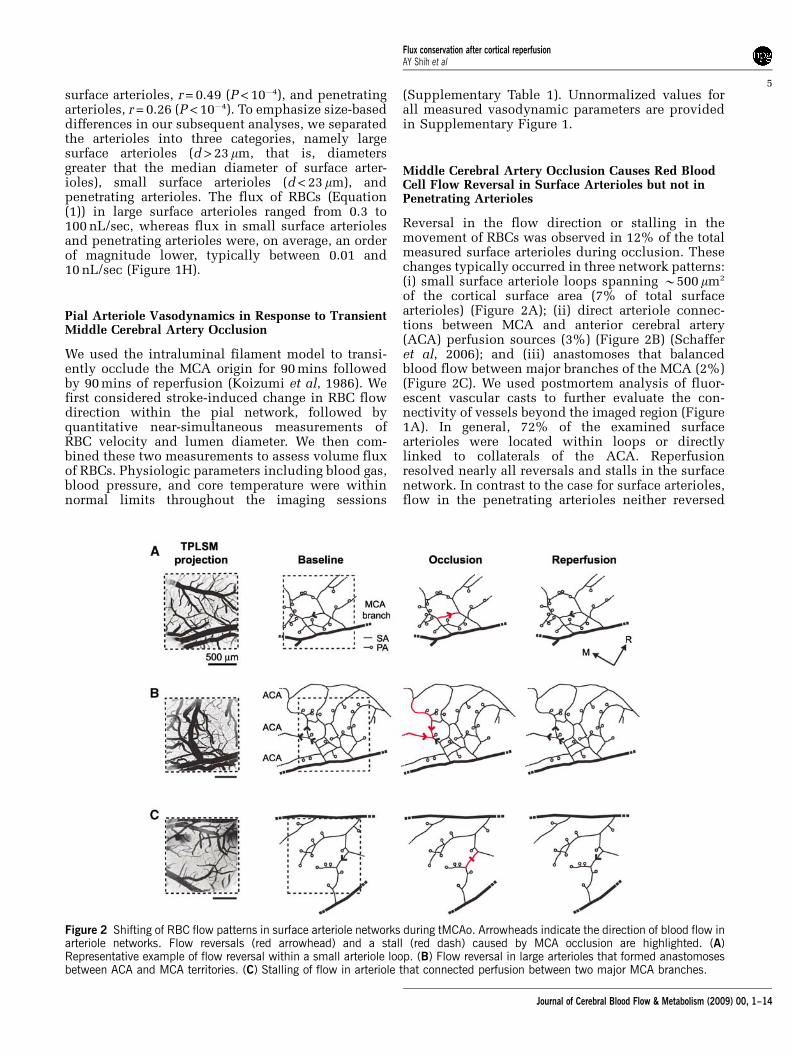
Reversal in the flow direction or stalling in themovement of RBCs was observed in 12% of the totalmeasured surface arterioles during occlusion. Thesechanges typically occurred in three network patterns:(i) small surface arteriole loops spanning B500 mm2
of the cortical surface area (7% of total surfacearterioles) (Figure 2A); (ii) direct arteriole connec-tions between MCA and anterior cerebral artery(ACA) perfusion sources (3%) (Figure 2B) (Schafferet al, 2006); and (iii) anastomoses that balancedblood flow between major branches of the MCA (2%)(Figure 2C). We used postmortem analysis of fluor-escent vascular casts to further evaluate the con-nectivity of vessels beyond the imaged region (Figure1A). In general, 72% of the examined surfacearterioles were located within loops or directlylinked to collaterals of the ACA. Reperfusionresolved nearly all reversals and stalls in the surfacenetwork. In contrast to the case for surface arterioles,flow in the penetrating arterioles neither reversed
Figure 2 Shifting of RBC flow patterns in surface arteriole networks during tMCAo. Arrowheads indicate the direction of blood flow inarteriole networks. Flow reversals (red arrowhead) and a stall (red dash) caused by MCA occlusion are highlighted. (A)Representative example of flow reversal within a small arteriole loop. (B) Flow reversal in large arterioles that formed anastomosesbetween ACA and MCA territories. (C) Stalling of flow in arteriole that connected perfusion between two major MCA branches.
Flux conservation after cortical reperfusionAY Shih et al
5
Journal of Cerebral Blood Flow & Metabolism (2009) 00, 1–14
nor stalled during the occlusion, but rather re-sponded homogeneously to the overall decrease inblood flow. As a guiding hypothesis, this suggeststhat flow irregularities in the surface network act tomaintain uninterrupted flow to penetrating arteriolesduring occlusion.
Change in Red Blood Cell Velocity and LumenDiameter during Transient Middle Cerebral ArteryOcclusion
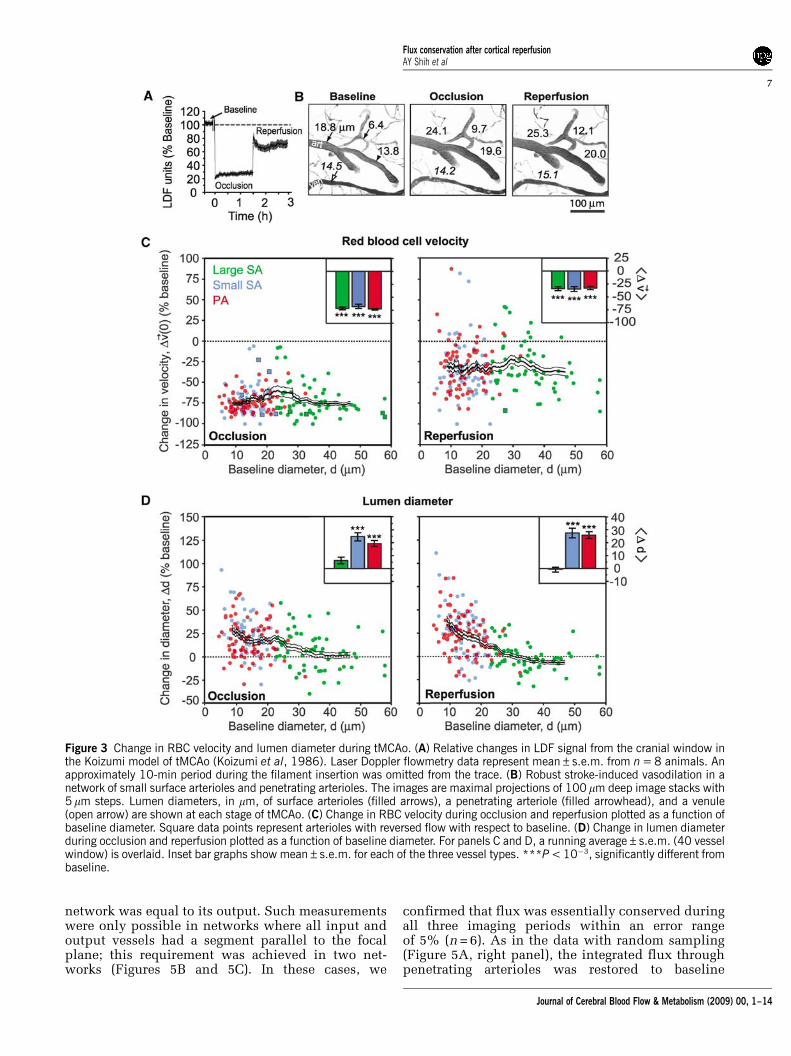
The Koizumi method of tMCAo involves permanentligation of the ipsilateral CCA, which generates anincomplete recovery of blood flow during reperfusion,as detected by LDF (Figure 3A) (Koizumi et al, 1986).We exploited this feature of the model to determinewhether arteriole reactivity remains intact and capableof compensating for incomplete reperfusion.
Overall, the RBC velocity across each class ofarterioles decreased to B30% of the baseline levelsduring occlusion (Figure 3C, left panel); this degreeof ischemia falls within a range defined aspenumbral flow (Lipton, 1999). After 90 mins ofocclusion, the filament was retracted to initiatereperfusion. In 11 of 13 experiments, reperfusionwas accompanied by a substantial recovery of RBCvelocities toward their baseline values (Figure 3C,right panel). Nonetheless, the velocities across allarterioles recovered to only B70% of their baselinelevels, similar to LDF measurements (Figure 3A)(data include 65 large surface arterioles, 56 smallsurface arterioles, and 75 penetrating arterioles over11 animals).
In two cases of tMCAo, flow values weresufficiently low to be categorized as stroke core,that is, flow decreased to 17% and 13% of baselinelevels. Recovery of RBC velocities was poorin these cases, returning to only 35% and 38% ofbaseline levels upon reperfusion, respectively, incontrast to B70% for the main cluster of tMCAocases. As these severely ischemic cases represented asmall proportion of the total animals, they wereremoved as outliers in subsequent analysesof the data.
Lumen diameter of small surface arterioles andpenetrating arterioles increased by an average ofB20% over baseline levels (Figures 3B, left andcenter panel, and 3D, left panel) during occlusion.This vasodilation persisted into the reperfusionperiod (Figures 3B, right panel, and 3D, right panel),and was observed as late as 90 mins after de-occlusion, indicating a prolonged contribution topostischemic blood flow (data not shown). In con-trast, the diameter of large surface arterioles exhib-ited both dilation and constriction, but on averagedid not change significantly from baseline at anystage during tMCAo (Figure 3D). However, largesurface arterioles dilated uniformly in response tohypercapnia, which verifies that these vessels were
not already maximally dilated by generation of thecranial window (Supplementary Materials).
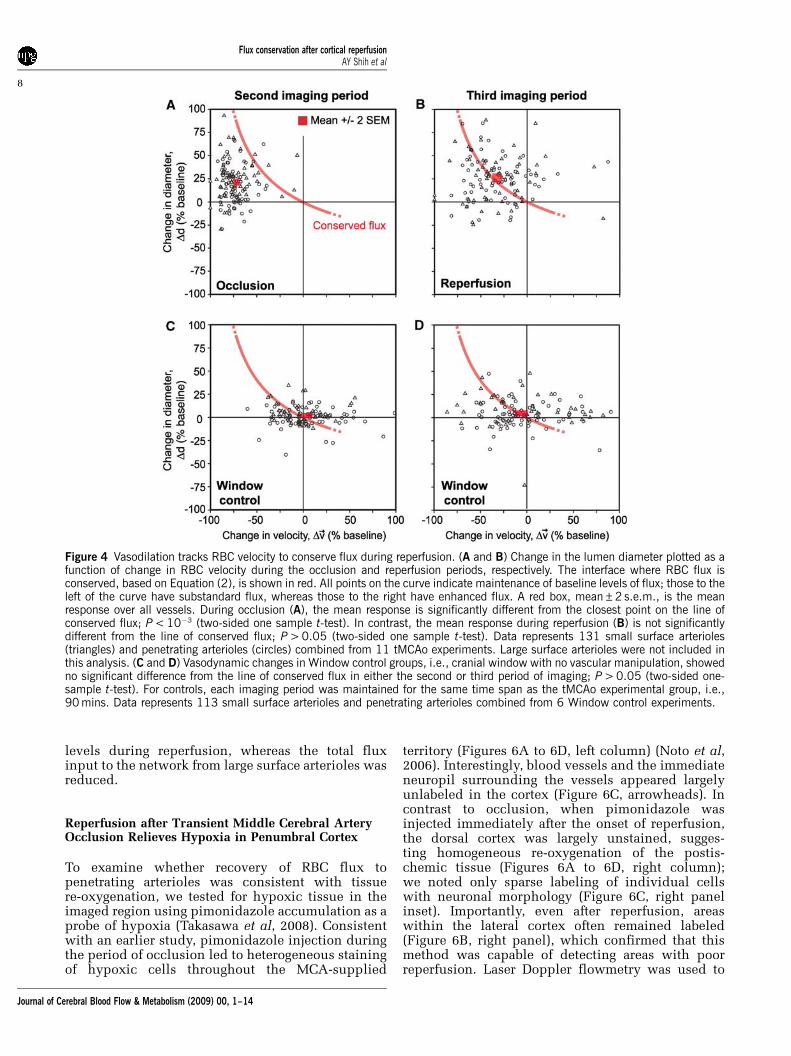
Vasodilation Inversely Tracks Red Blood Cell Velocityto Conserve Flux after Ischemia
The above results show a net increase in the diameterof small surface arterioles and penetratingarterioles concomitant with the net decreasein the RBC velocity during both periods of occlusionand reperfusion. Does the change in diametercompensate for decrease in velocity to conserveRBC flux (Equation (2))? During occlusion, thedilation was insufficient to maintain baselinelevels of RBC flux through penetrating arteriolesand the mean change corresponded to a significantnet drop in flux (P < 0.001) (Figure 4A; red box,mean±2 s.e.m., lies far from the theoretical line forconserved flux). In contrast, when reperfusion wasinitiated, the mean arteriole diameter remaineddilated such that baseline levels of flux wereachieved despite incomplete recovery of RBC velo-city. This central result indicates that persistentvasodilation during reperfusion was an enablingfactor for the complete recovery of flux to baselinelevels in small arterioles (Figure 4B; red box,mean±2 s.e.m., lies atop theoretical line for con-served flux).
To control for the effects of generating a cranialwindow, we also imaged a Window control group,that is, cranial window without vascular manipula-tion. This group showed no significant change ineither diameter or velocity through two rounds ofimaging, which corresponded to the same timeschedule as occlusion and reperfusion in the tMCAogroup, and thus no significant deviation fromconserved flux was observed for the mean response(Figures 4C and 4D) (Supplementary Figure 3). TheWindow control group also revealed an inherentvariability in the measured parameters in individualvessels over time. Although the mean response ofvessel populations collected over many animalsindicated a clear association with the line forconserved flux, vasodynamic changes did not neces-sarily conform to this theory at the level of individualvessels.
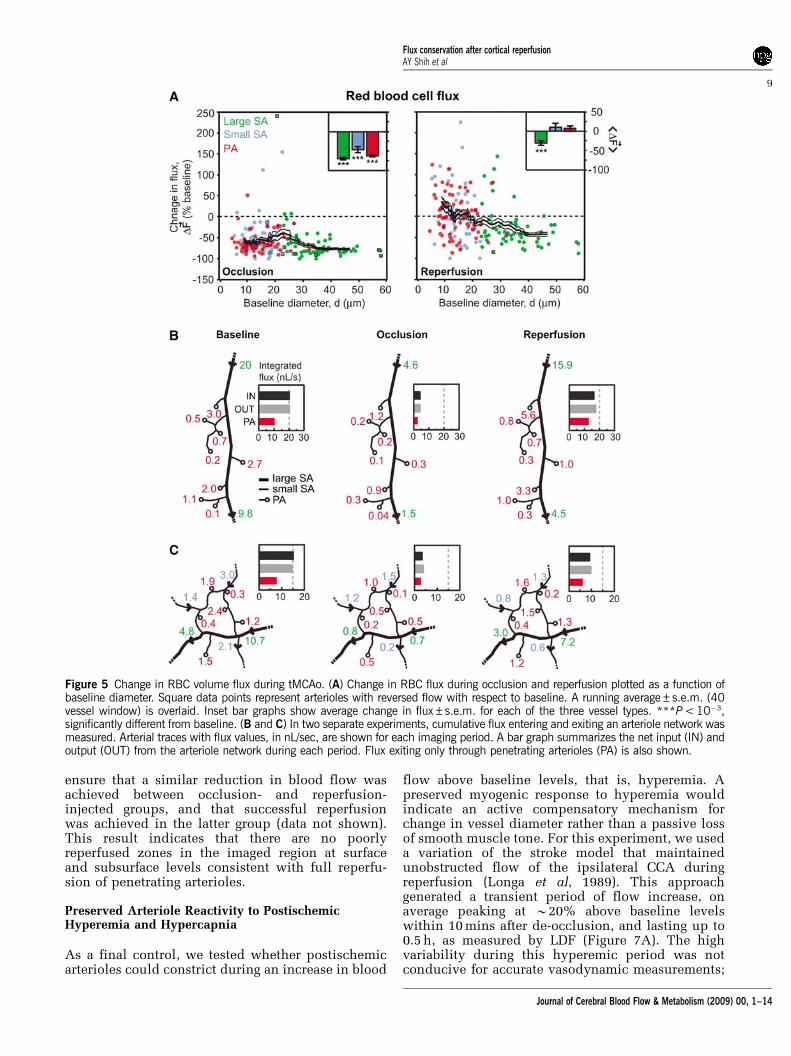
To further examine the relationship betweenRBC flux and vessel diameter, and to verify theaccuracy of our measurements, we calculatedflux for all vessels in the tMCAo experiments(Equation (1)). When normalized flux was plottedas a function of lumen diameter (Figure 5A), a clearpreferential recovery of small surface arterioles andpenetrating arterioles, as opposed to large surfacearterioles, was observed during the reperfusionperiod. This is consistent with specific dilation ofsmall-diameter arterioles shown in Figure 3D.
Our claims depend on an absence of systematicerrors in the determination of RBC flux. As a control,we checked whether the measured input into a small
Flux conservation after cortical reperfusionAY Shih et al
6
Journal of Cerebral Blood Flow & Metabolism (2009) 00, 1–14
network was equal to its output. Such measurementswere only possible in networks where all input andoutput vessels had a segment parallel to the focalplane; this requirement was achieved in two net-works (Figures 5B and 5C). In these cases, we
confirmed that flux was essentially conserved duringall three imaging periods within an error rangeof 5% (n = 6). As in the data with random sampling(Figure 5A, right panel), the integrated flux throughpenetrating arterioles was restored to baseline
Figure 3 Change in RBC velocity and lumen diameter during tMCAo. (A) Relative changes in LDF signal from the cranial window inthe Koizumi model of tMCAo (Koizumi et al, 1986). Laser Doppler flowmetry data represent mean±s.e.m. from n = 8 animals. Anapproximately 10-min period during the filament insertion was omitted from the trace. (B) Robust stroke-induced vasodilation in anetwork of small surface arterioles and penetrating arterioles. The images are maximal projections of 100 mm deep image stacks with5 mm steps. Lumen diameters, in mm, of surface arterioles (filled arrows), a penetrating arteriole (filled arrowhead), and a venule(open arrow) are shown at each stage of tMCAo. (C) Change in RBC velocity during occlusion and reperfusion plotted as a function ofbaseline diameter. Square data points represent arterioles with reversed flow with respect to baseline. (D) Change in lumen diameterduring occlusion and reperfusion plotted as a function of baseline diameter. For panels C and D, a running average±s.e.m. (40 vesselwindow) is overlaid. Inset bar graphs show mean±s.e.m. for each of the three vessel types. ***P < 10�3, significantly different frombaseline.
Flux conservation after cortical reperfusionAY Shih et al
7
Journal of Cerebral Blood Flow & Metabolism (2009) 00, 1–14
levels during reperfusion, whereas the total fluxinput to the network from large surface arterioles wasreduced.
Reperfusion after Transient Middle Cerebral ArteryOcclusion Relieves Hypoxia in Penumbral Cortex
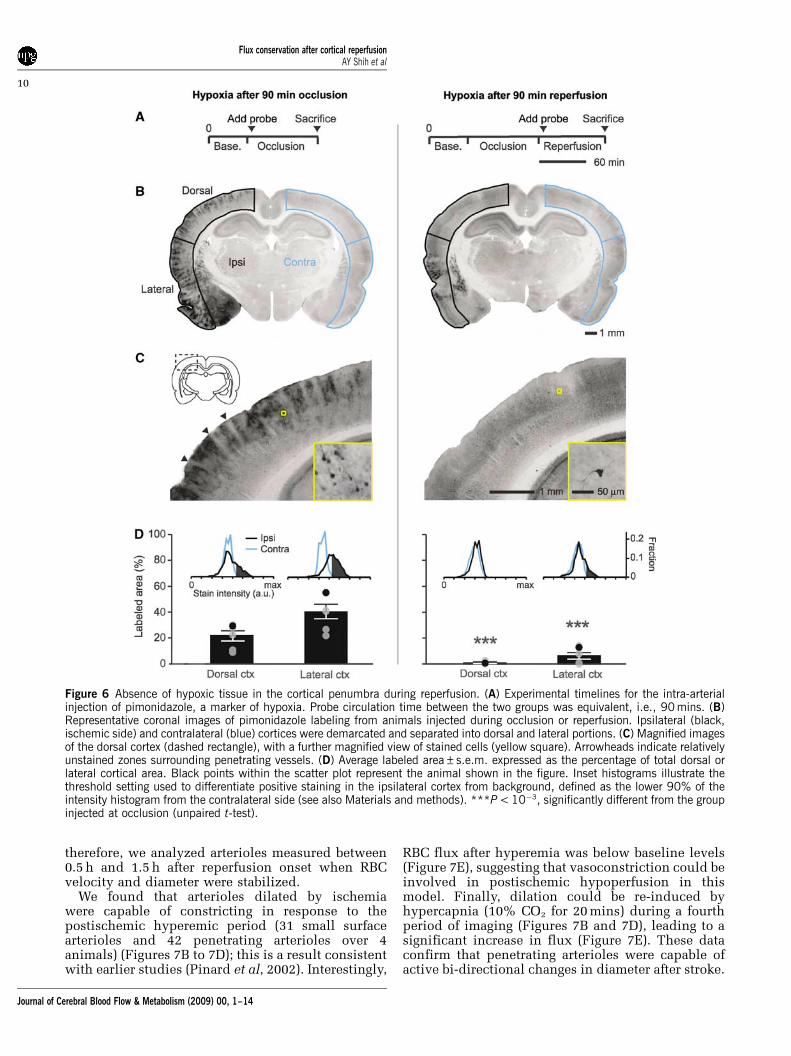
To examine whether recovery of RBC flux topenetrating arterioles was consistent with tissuere-oxygenation, we tested for hypoxic tissue in theimaged region using pimonidazole accumulation as aprobe of hypoxia (Takasawa et al, 2008). Consistentwith an earlier study, pimonidazole injection duringthe period of occlusion led to heterogeneous stainingof hypoxic cells throughout the MCA-supplied
territory (Figures 6A to 6D, left column) (Noto et al,2006). Interestingly, blood vessels and the immediateneuropil surrounding the vessels appeared largelyunlabeled in the cortex (Figure 6C, arrowheads). Incontrast to occlusion, when pimonidazole wasinjected immediately after the onset of reperfusion,the dorsal cortex was largely unstained, sugges-ting homogeneous re-oxygenation of the postis-chemic tissue (Figures 6A to 6D, right column);we noted only sparse labeling of individual cellswith neuronal morphology (Figure 6C, right panelinset). Importantly, even after reperfusion, areaswithin the lateral cortex often remained labeled(Figure 6B, right panel), which confirmed that thismethod was capable of detecting areas with poorreperfusion. Laser Doppler flowmetry was used to
Figure 4 Vasodilation tracks RBC velocity to conserve flux during reperfusion. (A and B) Change in the lumen diameter plotted as afunction of change in RBC velocity during the occlusion and reperfusion periods, respectively. The interface where RBC flux isconserved, based on Equation (2), is shown in red. All points on the curve indicate maintenance of baseline levels of flux; those to theleft of the curve have substandard flux, whereas those to the right have enhanced flux. A red box, mean±2 s.e.m., is the meanresponse over all vessels. During occlusion (A), the mean response is significantly different from the closest point on the line ofconserved flux; P < 10�3 (two-sided one sample t-test). In contrast, the mean response during reperfusion (B) is not significantlydifferent from the line of conserved flux; P > 0.05 (two-sided one sample t-test). Data represents 131 small surface arterioles(triangles) and penetrating arterioles (circles) combined from 11 tMCAo experiments. Large surface arterioles were not included inthis analysis. (C and D) Vasodynamic changes in Window control groups, i.e., cranial window with no vascular manipulation, showedno significant difference from the line of conserved flux in either the second or third period of imaging; P > 0.05 (two-sided one-sample t-test). For controls, each imaging period was maintained for the same time span as the tMCAo experimental group, i.e.,90 mins. Data represents 113 small surface arterioles and penetrating arterioles combined from 6 Window control experiments.
Flux conservation after cortical reperfusionAY Shih et al
8
Journal of Cerebral Blood Flow & Metabolism (2009) 00, 1–14
ensure that a similar reduction in blood flow wasachieved between occlusion- and reperfusion-injected groups, and that successful reperfusionwas achieved in the latter group (data not shown).This result indicates that there are no poorlyreperfused zones in the imaged region at surfaceand subsurface levels consistent with full reperfu-sion of penetrating arterioles.
Preserved Arteriole Reactivity to PostischemicHyperemia and Hypercapnia
As a final control, we tested whether postischemicarterioles could constrict during an increase in blood
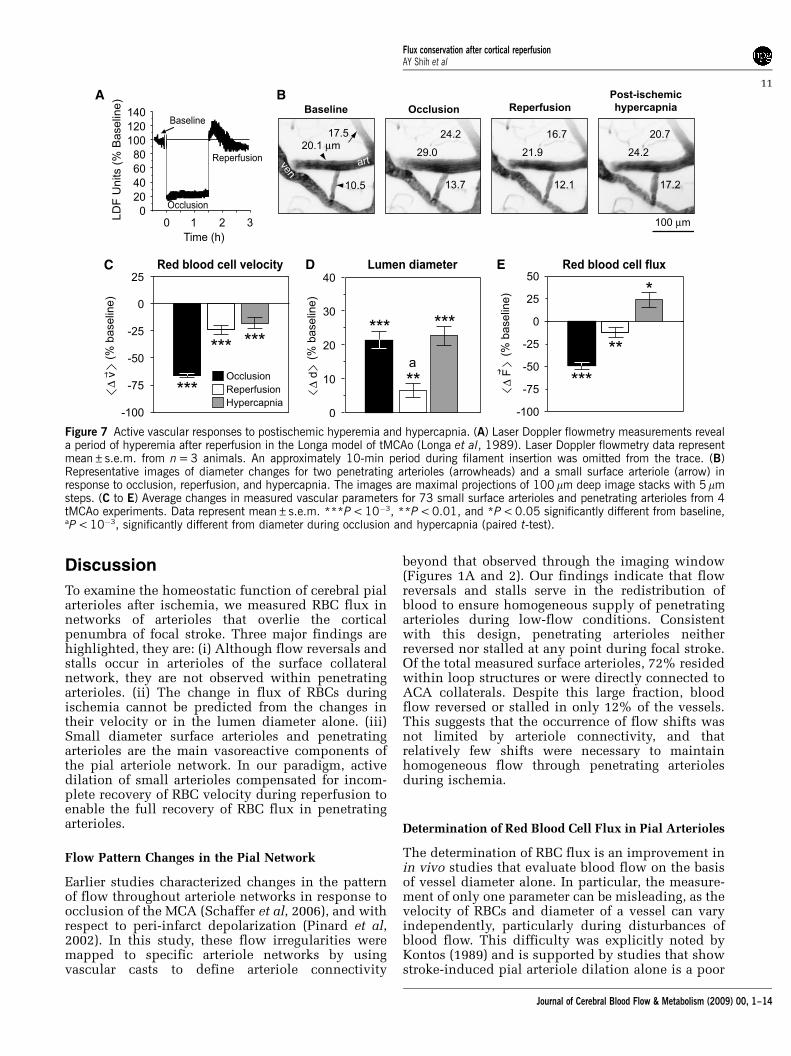
flow above baseline levels, that is, hyperemia. Apreserved myogenic response to hyperemia wouldindicate an active compensatory mechanism forchange in vessel diameter rather than a passive lossof smooth muscle tone. For this experiment, we useda variation of the stroke model that maintainedunobstructed flow of the ipsilateral CCA duringreperfusion (Longa et al, 1989). This approachgenerated a transient period of flow increase, onaverage peaking at B20% above baseline levelswithin 10 mins after de-occlusion, and lasting up to0.5 h, as measured by LDF (Figure 7A). The highvariability during this hyperemic period was notconducive for accurate vasodynamic measurements;
Figure 5 Change in RBC volume flux during tMCAo. (A) Change in RBC flux during occlusion and reperfusion plotted as a function ofbaseline diameter. Square data points represent arterioles with reversed flow with respect to baseline. A running average±s.e.m. (40vessel window) is overlaid. Inset bar graphs show average change in flux±s.e.m. for each of the three vessel types. ***P< 10�3,significantly different from baseline. (B and C) In two separate experiments, cumulative flux entering and exiting an arteriole network wasmeasured. Arterial traces with flux values, in nL/sec, are shown for each imaging period. A bar graph summarizes the net input (IN) andoutput (OUT) from the arteriole network during each period. Flux exiting only through penetrating arterioles (PA) is also shown.
Flux conservation after cortical reperfusionAY Shih et al
9
Journal of Cerebral Blood Flow & Metabolism (2009) 00, 1–14
therefore, we analyzed arterioles measured between0.5 h and 1.5 h after reperfusion onset when RBCvelocity and diameter were stabilized.
We found that arterioles dilated by ischemiawere capable of constricting in response to thepostischemic hyperemic period (31 small surfacearterioles and 42 penetrating arterioles over 4animals) (Figures 7B to 7D); this is a result consistentwith earlier studies (Pinard et al, 2002). Interestingly,
RBC flux after hyperemia was below baseline levels(Figure 7E), suggesting that vasoconstriction could beinvolved in postischemic hypoperfusion in thismodel. Finally, dilation could be re-induced byhypercapnia (10% CO2 for 20 mins) during a fourthperiod of imaging (Figures 7B and 7D), leading to asignificant increase in flux (Figure 7E). These dataconfirm that penetrating arterioles were capable ofactive bi-directional changes in diameter after stroke.
Figure 6 Absence of hypoxic tissue in the cortical penumbra during reperfusion. (A) Experimental timelines for the intra-arterialinjection of pimonidazole, a marker of hypoxia. Probe circulation time between the two groups was equivalent, i.e., 90 mins. (B)Representative coronal images of pimonidazole labeling from animals injected during occlusion or reperfusion. Ipsilateral (black,ischemic side) and contralateral (blue) cortices were demarcated and separated into dorsal and lateral portions. (C) Magnified imagesof the dorsal cortex (dashed rectangle), with a further magnified view of stained cells (yellow square). Arrowheads indicate relativelyunstained zones surrounding penetrating vessels. (D) Average labeled area±s.e.m. expressed as the percentage of total dorsal orlateral cortical area. Black points within the scatter plot represent the animal shown in the figure. Inset histograms illustrate thethreshold setting used to differentiate positive staining in the ipsilateral cortex from background, defined as the lower 90% of theintensity histogram from the contralateral side (see also Materials and methods). ***P < 10�3, significantly different from the groupinjected at occlusion (unpaired t-test).
Flux conservation after cortical reperfusionAY Shih et al
10
Journal of Cerebral Blood Flow & Metabolism (2009) 00, 1–14
Discussion
To examine the homeostatic function of cerebral pialarterioles after ischemia, we measured RBC flux innetworks of arterioles that overlie the corticalpenumbra of focal stroke. Three major findings arehighlighted, they are: (i) Although flow reversals andstalls occur in arterioles of the surface collateralnetwork, they are not observed within penetratingarterioles. (ii) The change in flux of RBCs duringischemia cannot be predicted from the changes intheir velocity or in the lumen diameter alone. (iii)Small diameter surface arterioles and penetratingarterioles are the main vasoreactive components ofthe pial arteriole network. In our paradigm, activedilation of small arterioles compensated for incom-plete recovery of RBC velocity during reperfusion toenable the full recovery of RBC flux in penetratingarterioles.
Flow Pattern Changes in the Pial Network
Earlier studies characterized changes in the patternof flow throughout arteriole networks in response toocclusion of the MCA (Schaffer et al, 2006), and withrespect to peri-infarct depolarization (Pinard et al,2002). In this study, these flow irregularities weremapped to specific arteriole networks by usingvascular casts to define arteriole connectivity
beyond that observed through the imaging window(Figures 1A and 2). Our findings indicate that flowreversals and stalls serve in the redistribution ofblood to ensure homogeneous supply of penetratingarterioles during low-flow conditions. Consistentwith this design, penetrating arterioles neitherreversed nor stalled at any point during focal stroke.Of the total measured surface arterioles, 72% residedwithin loop structures or were directly connected toACA collaterals. Despite this large fraction, bloodflow reversed or stalled in only 12% of the vessels.This suggests that the occurrence of flow shifts wasnot limited by arteriole connectivity, and thatrelatively few shifts were necessary to maintainhomogeneous flow through penetrating arteriolesduring ischemia.
Determination of Red Blood Cell Flux in Pial Arterioles
The determination of RBC flux is an improvement inin vivo studies that evaluate blood flow on the basisof vessel diameter alone. In particular, the measure-ment of only one parameter can be misleading, as thevelocity of RBCs and diameter of a vessel can varyindependently, particularly during disturbances ofblood flow. This difficulty was explicitly noted byKontos (1989) and is supported by studies that showstroke-induced pial arteriole dilation alone is a poor
Figure 7 Active vascular responses to postischemic hyperemia and hypercapnia. (A) Laser Doppler flowmetry measurements reveala period of hyperemia after reperfusion in the Longa model of tMCAo (Longa et al, 1989). Laser Doppler flowmetry data representmean±s.e.m. from n = 3 animals. An approximately 10-min period during filament insertion was omitted from the trace. (B)Representative images of diameter changes for two penetrating arterioles (arrowheads) and a small surface arteriole (arrow) inresponse to occlusion, reperfusion, and hypercapnia. The images are maximal projections of 100 mm deep image stacks with 5 mmsteps. (C to E) Average changes in measured vascular parameters for 73 small surface arterioles and penetrating arterioles from 4tMCAo experiments. Data represent mean±s.e.m. ***P < 10�3, **P < 0.01, and *P < 0.05 significantly different from baseline,aP < 10�3, significantly different from diameter during occlusion and hypercapnia (paired t-test).
Flux conservation after cortical reperfusionAY Shih et al
11
Journal of Cerebral Blood Flow & Metabolism (2009) 00, 1–14
indicator of downstream flow to tissue (Pinard et al,2002; Tasdemiroglu et al, 1992). Our results confirmthat reliance on only a single indicator of blood flowprovides an incomplete description of the vascularresponse to stroke. In the Koizumi tMCAo paradigm,RBC velocity alone suggests an incomplete recoveryof blood flow during reperfusion (Figures 3A and3C), whereas diameter measurements consideredalone support persistent vasodilation and thereforeincreased flow (Figures 3B and 3D). The calculationof flux from these parameters (Equation (1)), how-ever, showed that blood flow in fact recovered tobaseline levels during reperfusion (Figure 5A).
One potential caveat of our methodology is thatserum flow is not measured. Indeed, serum suppliesboth glucose and oxygen in ischemic states, inaddition to other nutritional sources. By measuringarterio-venous transit times of a fluorescent dye,Rovainen et al (1993) found net serum flow to be onaverage three times faster than RBC flow. Serum flowmay persist even when RBCs are stalled and may stillrepresent a significant source of oxygen duringischemia (Villringer et al, 1994).
Preservation of Small Arteriole Reactivity in the FocalStroke Penumbra
Our findings reveal that arteriole reactivity in thestroke penumbra remains intact and capable ofmodulating lumen diameter as a compensatory me-chanism to conserve RBC flux at these time points ofischemia and reperfusion. By distinguishing betweenthe differing sizes and types of pial arterioles, theprimary locus of reactivity was shown to reside insmall surface arterioles and penetrating arterioles. Weconfirmed that small arterioles ( < 23mm) were capableof constriction in response to transient hyperemia afterstroke (Figures 7B and 7D), and thus did not becomepassively dilated owing to the loss of vascular tone.Although we did not evaluate the arteriole responseover a wide autoregulatory curve (Kontos et al, 1978),these results nonetheless indicate that myogenicreactivity to increased flow is intact at the level ofindividual arterioles. Further, our findings with hy-percapnic treatment (Figures 7B and 7D) are consistentwith studies that show partial preservation of reactivityto CO2 in the stroke penumbra (Jones et al, 1989).Finally, at a histologic level, parenchymal vesselswithin the penumbra did not bind pimonidazoleduring both occlusion and reperfusion periods, sug-gesting limited hypoxic damage (Figure 6C, left panel).
An open question is how net dilation of only smaller-diameter arterioles affects the pial network flow as awhole. We showed that total RBC flux into and out ofthese networks was conserved (Figures 5B and 5C).However, during reperfusion, the total flux availablewas reduced compared with baseline, consistent withincomplete recovery of flux in large surface arterioles,whereas penetrating arteriole flux returned to baseline(Figure 5B). Penetrating arterioles thus extracted a
larger proportion of the available blood from largesupply vessels, perhaps causing a reduction in flow towatershed regions sourced by both the MCA and ACA(Momjian-Mayor and Baron, 2005). This may representa form of cerebrovascular steal, where blood flow isintercepted from the hypoperfused ischemic focus byhighly collateralized and reactive penumbral regions(Scremin, 1991). We suspect that unbalanced deliveryof blood between the stroke penumbra and core may, inpart, contribute to the poor re-oxygenation of the lateralcortex during reperfusion (Figure 6B, right panel).
What are the long-term consequences of ischemia onpenetrating arteriole reactivity? Recent work by Cipollaand colleagues suggest that isolated penetrating lenti-culostriate arterioles possess normal myogenic toneand reactivity 24 h after a 1-h period of transient andmoderate ischemia (Cipolla and Bullinger, 2008).Interestingly, these arterioles exhibited compensatoryalterations in nitric oxide and endothelial-derivedhyperpolarizing factor signaling to maintain normalvascular function. In a related study, Ngai et al (2007)also found no effect on the cerebral penetratingarteriole tone 24 h after 1 to 2 h of transient ischemia,and further showed that conducted dilatory responsesalong penetrating arterioles were augmented afterstroke. These recent findings are in contrast to surfacearterioles isolated from severely ischemic zones sur-rounding the proximal MCA, which lose tone evenafter 30 mins of ischemia as a result of structuraldamage to arteriole smooth muscle (Cipolla and Curry,2002). Taken together with the results of this study,small surface arterioles and penetrating arteriolesappear to be unique in their ability to adapt andmaintain regulatory function after transient ischemia.Although the mechanisms that underlie this prefer-ential resistance to ischemia remain to be defined, thepreserved reactivity of penetrating arterioles will be akey determinant for improved recovery after stroke.
Acknowledgements
We thank Agnieszka Prechtl for assistance withimmunohistochemistry, Christopher A. Rafie forassistance with fluorescent vascular casts, AnnaDevor for surgical advice, and Jonathan Driscolland Pablo Blinder for comments on the manuscript.
Disclosure
The authors state no conflict of interest.
References
Bar T (1980) The vascular system of the cerebral cortex.Adv Anat Embryol Cell Biol 59:1–62
Barfod C, Akgoren N, Fabricius M, Dirnagl U, Lauritzen M(1997) Laser-Doppler measurements of concentrationand velocity of moving blood cells in rat cerebralcirculation. Acta Physiol Scand 160:123–32
Flux conservation after cortical reperfusionAY Shih et al
12
Journal of Cerebral Blood Flow & Metabolism (2009) 00, 1–14
Cipolla MJ, Bullinger LV (2008) Reactivity of brainparenchymal arterioles after ischemia and reperfusion.Microcirculation 15:495–501
Cipolla MJ, Curry AB (2002) Middle cerebral arteryfunction after stroke: the threshold duration of reperfu-sion for myogenic activity. Stroke 33:2094–9
Cipolla MJ, Lessov N, Hammer ES, Curry AB (2001)Threshold duration of ischemia for myogenic tone inmiddle cerebral arteries: effect on vascular smoothmuscle actin. Stroke 32:1658–64
Cipolla MJ, Li R, Vitullo L (2004) Perivascular innervationof penetrating brain parenchymal arterioles. J Cardio-vasc Pharmacol 44:1–8
Devor A, Hillman EM, Tian P, Waeber C, Teng IC,Ruvinskaya L, Shalinsky MH, Zhu H, Haslinger RH,Narayanan SN, Ulbert I, Dunn AK, Lo EH, Rosen BR,Dale AM, Kleinfeld D, Boas DA (2008) Stimulus-induced changes in blood flow and 2-deoxyglucoseuptake dissociate in ipsilateral somatosensory cortex. JNeurosci 28:14347–57
Devor A, Tian P, Nishimura N, Teng IC, Hillman EM,Narayanan SN, Ulbert I, Boas DA, Kleinfeld D, Dale AM(2007) Suppressed neuronal activity and concurrentarteriolar vasoconstriction may explain negativeblood oxygenation level-dependent signal[s]. J Neurosci27:4452–9
Dirnagl U, Pulsinelli W (1990) Autoregulation of cerebralblood flow in experimental focal brain ischemia. J CerebBlood Flow Metab 10:327–36
Dirnagl U, Villringer A, Einhaupl KM (1992) In-vivoconfocal scanning laser microscopy of the cerebralmicrocirculation. J Microsc 165:147–57
Eger II EI (1981) Isoflurane: a review. Anesthesiology55:559–76
Heistad DD, Kontos HA (eds) (1983) Cerebral circulation.Bethesda: American Physiological Society
Iadecola C (1998) Cerebral circulatory dysregulation inischemia. In: Cerebrovascular disease: pathophysiology,diagnosis, and management (Ginsberg MD, ed), Malden:Blackwell Publishing, 319–32
Jones SC, Bose B, Furlan AJ, Friel HT, Easley KA, MeredithMP, Little JR (1989) CO2 reactivity and heterogeneity ofcerebral blood flow in ischemic, border zone, andnormal cortex. Am J Physiol 257:H473–82
Kleinfeld D, Friedman B, Lyden PD, Shih AY (2008)Targeted occlusion to surface and deep vessels inneocortex via linear and nonlinear optical absorption.In: Animal models of acute neurological injuries (ChenJ, Xu Z, Xu X-M et al, eds), Totowa: The Humana PressInc, 169–83
Kleinfeld D, Mitra PP, Helmchen F, Denk W (1998)Fluctuations and stimulus-induced changes in bloodflow observed in individual capillaries in layers 2through 4 of rat neocortex. Proc Natl Acad Sci USA95:15741–6
Koizumi J, Yoshida Y, Nakazawa T, Ooneda G (1986)Experimental studies of ischemic brain edema: 1. A newexperimental model of cerebral embolism in rats inwhich recirculation can be introduced in the ischemicarea. Japn J Stroke 8:1–8
Kontos HA (1989) Validity of cerebral arterial blood flowcalculations from velocity measurements. Stroke 20:1–3
Kontos HA, Wei EP, Navari RM, Levasseur JE, RosenblumWI, Patterson JLJ (1978) Responses of cerebral arteriesand arterioles to acute hypotension and hypertension.Am J Physiol 234:H371–83
Lipton P (1999) Ischemic cell death in brain neurons.Physiol Rev 79:1431–568
Longa EZ, Weinstein PR, Carlson S, Cummins R (1989)Reversible middle cerebral artery occlusion withoutcraniectomy in rats. Stroke 20:84–91
Marshall RS (2004) The functional relevance of cerebralhemodynamics: why blood flow matters to the injuredand recovering brain. Curr Opin Neurol 17:705–9
Momjian-Mayor I, Baron JC (2005) The pathophysiology ofwatershed infarction in internal carotid artery disease:review of cerebral perfusion studies. Stroke 36:567–77
Ngai AC, Nguyen TS, Meno JR, Britz GW (2007) Post-ischemic augmentation of conducted dilation in cere-bral arterioles. Stroke 38:124–30
Ngai AC, Winn HR (1996) Estimation of shear and flowrates in pial arterioles during somatosensory stimula-tion. Am J Physiol 270:H1712–7
Nguyen Q-T, Tsai PS, Kleinfeld D (2006) MPScope:a versatile software suite for multiphoton microscopy.J Neurosci Methods 156:351–9
Nishimura B, Schaffer CB, Friedman B, Lyden PD,Kleinfeld D (2007) Penetrating arterioles are a bottleneckin the perfusion of neocortex. Proc Natl Acad Sci USA104:365–70
Nishimura N, Schaffer CB, Friedman B, Tsai PS, Lyden PD,Kleinfeld D (2006) Targeted insult to individual subsur-face cortical blood vessels using ultrashort laser pulses:three models of stroke. Nat Methods 3:99–108
Noto T, Furuichi Y, Ishiye M, Matsuoka N, Aramori I,Mutoh S, Yanagihara T, Manabe N (2006) Temporal andtopographic profiles of tissue hypoxia following tran-sient focal cerebral ischemia in rats. J Vet Med Sci68:803–7
Paulson OB, Strandgaard S, Edvinsson L (1990) Cerebralautoregulation. Cerebrovasc Brain Metab Rev 2:161–92
Pinard E, Nallet H, MacKenzie ET, Seylaz J, Roussel S(2002) Penumbral microcirculatory changes associatedwith peri-infarct depolarizations in the rat. Stroke33:606–12
Rovainen CM, Woolsey TA, Blocher NC, Wang D-B,Robinson OF (1993) Blood flow in single surfacearterioles and venules on the mouse somatosensorycortex measured with videomicroscopy, fluorescentdextrans, nonoccluding fluorescent beads, and compu-ter-assisted image analysis. J Cereb Blood Flow Metab13:359–71
Schaffer CB, Friedman B, Nishimura N, Schroeder LF, TsaiPS, Ebner FF, Lyden PD, Kleinfeld D (2006) Two-photonimaging of cortical surface microvessels reveals a robustredistribution in blood flow after vascular occlusion.Public Library of Science Biology 4:258–70
Scremin OU (1991) Pharmacological control of the cerebralcirculation. Annu Rev Pharmacol Toxicol 31:229–51
Takasawa M, Moustafa RR, Baron JC (2008) Applications ofnitroimidazole in vivo hypoxia imaging in ischemicstroke. Stroke 39:1629–37
Tasdemiroglu E, Macfarlane R, Wei EP, Kontos HA,Moskowitz MA (1992) Pial vessel caliber and cerebralblood flow become dissociated during ischemia–reper-fusion in cats. Am J Physiol 263:H533–6
Tsai PS (2004) All-optical histology using two photonlaser scanning microscopy and ablation with ultrashortpulses. Thesis (PhD). San Diego: University ofCalifornia
Tsai PS, Friedman B, Ifarraguerri AI, Thompson BD, Lev-Ram V, Schaffer CB, Xiong Q, Tsien RY, Squier JA,
Flux conservation after cortical reperfusionAY Shih et al
13
Journal of Cerebral Blood Flow & Metabolism (2009) 00, 1–14

Kleinfeld D (2003) All-optical histology using ultrashortlaser pulses. Neuron 39:27–41
Tsai PS, Nishimura N, Yoder EJ, Dolnick EM, White GA,Kleinfeld D (2002) Principles, design, and construction ofa two photon laser scanning microscope for in vitro and in
vivo brain imaging. In: In vivo optical imaging of brainfunction (Frostig RD, ed), Boca Raton: CRC Press, 113–71
Villringer A, Them A, Lindauer U, Einhaupl K, Dirnagl U(1994) Capillary perfusion of the rat brain cortex: an invivo confocal microscopy study. Circ Res 75:55–62
Supplementary Information accompanies the paper on the Journal of Cerebral Blood Flow & Metabolism website (http://www.nature.com/jcbfm)
Flux conservation after cortical reperfusionAY Shih et al
14
Journal of Cerebral Blood Flow & Metabolism (2009) 00, 1–14
Copyright © 2022 FDOKUMEN