Histogenetic Processes Leading to the Laminated Neocortex: Migration Is Only a Part of the Story
22
Histogenetic Processes Leading to the Laminated Neocortex: Migration Is Only a Part of the Story V.S. Caviness a , P.G. Bhide a , and R.S. Nowakowski b a Department of Neurology, Massachusetts General Hospital, Boston, Mass. b Department of Neuroscience and Cell Biology, UMDNJ-RWJ Medical School, Piscataway, N.J., USA Abstract The principal events of neocortical histogenesis were anticipated by work published prior to the 20th century. These were neuronal proliferation and migration and the complex events of cortical pattern formation leading to a laminated architecture where each layer is dominated by a principal neuronal class. Work that has followed has extended the knowledge of the workings of the proliferative epithelium, cellular mechanisms of migration and events through which cells are winnowed and then differentiate once their postmigratory positions are established. Work yet ahead will emphasize mechanisms that coordinate the molecular events that integrate proliferation and cell class specification in relation to the final neocortical neural system map. Keywords Neocortical histogenesis; Neuronal migration; Cell position; Cortical pattern; Cell death The neocortex is the dominant structure of the mammalian cerebral surface, sharing only limited portions of the ventral and medial surfaces with the much smaller archicortical and paleocortical structures [Brodmann, 1909; von Economo and Koskinas, 1925; Zilles, 1990]. It has a distinctive 6-layered architecture continuous throughout with each layer dominated by a principal class of neuron. Regional variations in the stratification patterns, corresponding to functional architectonic subdivisions, are distinguished by characteristic widths, patterns of cell arrangements and density and tinctorial properties of the cells of each lamina. These diverse features, which characterize the mature cortex and are indispensable to its operations, have a complex histogenetic history that reflects a dramatic, precisely orchestrated sequence of cellular events implemented by complex signaling and molecular mechanisms. In the largest mammals, these events, coordinated over months, regulate the origin, qualities and disposition of literally millions of neurons [Sidman and Rakic, 1982]. We review in the following salient highlights of these cellular events as our understanding of them has emerged in the course of more than a century of investigations. We begin with several brief historical notes treating work from late in the 19th century. We view these contributions as the origin of investigational themes for the century that was to come. We will continue with a review of highlights of work following these investigational themes. These are the origin of the neocortical projection neurons in the periventricular proliferative epithelium, their migration from place of origin to © 2008 S. Karger AG, Basel Verne S. Caviness, MD, PhD, Department of Neurology, Massachusetts General Hospital, 55 Fruit Street, VBK-901, Boston, MA 02114 (USA), Tel. +1 617 726 1813, Fax +1 617 726 2353, E-Mail [email protected] NIH Public Access Author Manuscript Dev Neurosci. Author manuscript; available in PMC 2009 July 20. Published in final edited form as: Dev Neurosci. 2008 ; 30(1-3): 82–95. doi:10.1159/000109854. NIH-PA Author Manuscript NIH-PA Author Manuscript NIH-PA Author Manuscript
Transcript of Histogenetic Processes Leading to the Laminated Neocortex: Migration Is Only a Part of the Story

Histogenetic Processes Leading to the Laminated Neocortex:Migration Is Only a Part of the Story
V.S. Cavinessa, P.G. Bhidea, and R.S. NowakowskibaDepartment of Neurology, Massachusetts General Hospital, Boston, Mass.bDepartment of Neuroscience and Cell Biology, UMDNJ-RWJ Medical School, Piscataway, N.J.,USA
AbstractThe principal events of neocortical histogenesis were anticipated by work published prior to the 20thcentury. These were neuronal proliferation and migration and the complex events of cortical patternformation leading to a laminated architecture where each layer is dominated by a principal neuronalclass. Work that has followed has extended the knowledge of the workings of the proliferativeepithelium, cellular mechanisms of migration and events through which cells are winnowed and thendifferentiate once their postmigratory positions are established. Work yet ahead will emphasizemechanisms that coordinate the molecular events that integrate proliferation and cell classspecification in relation to the final neocortical neural system map.
KeywordsNeocortical histogenesis; Neuronal migration; Cell position; Cortical pattern; Cell death
The neocortex is the dominant structure of the mammalian cerebral surface, sharing onlylimited portions of the ventral and medial surfaces with the much smaller archicortical andpaleocortical structures [Brodmann, 1909; von Economo and Koskinas, 1925; Zilles, 1990].It has a distinctive 6-layered architecture continuous throughout with each layer dominated bya principal class of neuron. Regional variations in the stratification patterns, corresponding tofunctional architectonic subdivisions, are distinguished by characteristic widths, patterns ofcell arrangements and density and tinctorial properties of the cells of each lamina. These diversefeatures, which characterize the mature cortex and are indispensable to its operations, have acomplex histogenetic history that reflects a dramatic, precisely orchestrated sequence ofcellular events implemented by complex signaling and molecular mechanisms. In the largestmammals, these events, coordinated over months, regulate the origin, qualities and dispositionof literally millions of neurons [Sidman and Rakic, 1982]. We review in the following salienthighlights of these cellular events as our understanding of them has emerged in the course ofmore than a century of investigations. We begin with several brief historical notes treatingwork from late in the 19th century. We view these contributions as the origin of investigationalthemes for the century that was to come. We will continue with a review of highlights of workfollowing these investigational themes. These are the origin of the neocortical projectionneurons in the periventricular proliferative epithelium, their migration from place of origin to
© 2008 S. Karger AG, BaselVerne S. Caviness, MD, PhD, Department of Neurology, Massachusetts General Hospital, 55 Fruit Street, VBK-901, Boston, MA 02114(USA), Tel. +1 617 726 1813, Fax +1 617 726 2353, E-Mail [email protected]
NIH Public AccessAuthor ManuscriptDev Neurosci. Author manuscript; available in PMC 2009 July 20.
Published in final edited form as:Dev Neurosci. 2008 ; 30(1-3): 82–95. doi:10.1159/000109854.
NIH
-PA Author Manuscript
NIH
-PA Author Manuscript
NIH
-PA Author Manuscript

cortex, the events within the cortex that eventuate in their final relative positions and finallythe winnowing process that culminates in the final roster of neurons.
Historical NotesA critical and organizing insight, setting the stage of the developmental cell biologicaldiscoveries to come, was achieved late in the 19th century by His [1889,1904]. Specifically hewas able to infer from general cell stains that neurons of the neocortex arise not in situ withinthe cortex itself but rather in the course of a sustained process of cell proliferation in anepithelium lining the ventricular cavities in the depths of the cerebral vesicle. It was apparentto him that young neurons must then migrate across the full width of the cerebral wall fromthe place of origin to their eventual destiny in the neocortex at the surface of the hemisphere.A startling insight relating time of origin to ultimate radial disposition in the cortex was thenprovided by the Golgi analysis of embryonic brains by von Koelliker [1896], who realized thatthe maturation and origin sequence of postmigratory neurons in the cortical anlage could beread from the relative degree of elaboration of apical and then basal dendritic arbors (fig. 1).Because this important insight is not widely appreciated, we quote here from his original text:
‘Die Pyramidalenzellen anlangend, so gab dieser Embryo den wichtigen Aufschluss,dass dieselben von aussen nach der Tiefe sich entwickeln. Es fanden sich nämlich …immer noch die aller-jüngsten bei dem vier- und siebenmonatlichen Embryogefundenen Stadien in grösster Zahl in der alleräussersten Lage der Zellenschicht,dicht am Stratum zonale’ [von Koelliker, 1896].
To paraphrase, postmitotic neurons migrate in the order in which they arise to becomeassembled in an inside-to-outside laminar order. Implicit here is the realization thatproliferative succession corresponds to laminar class origin succession with the earliest formedassigned to the deepest and successively later formed to successively more superficial layers,that is the ‘inside-out’ pattern of succession established by experimental DNA-labelingmethods more than half a century later [Sidman et al., 1959; Angevine and Sidman, 1961].
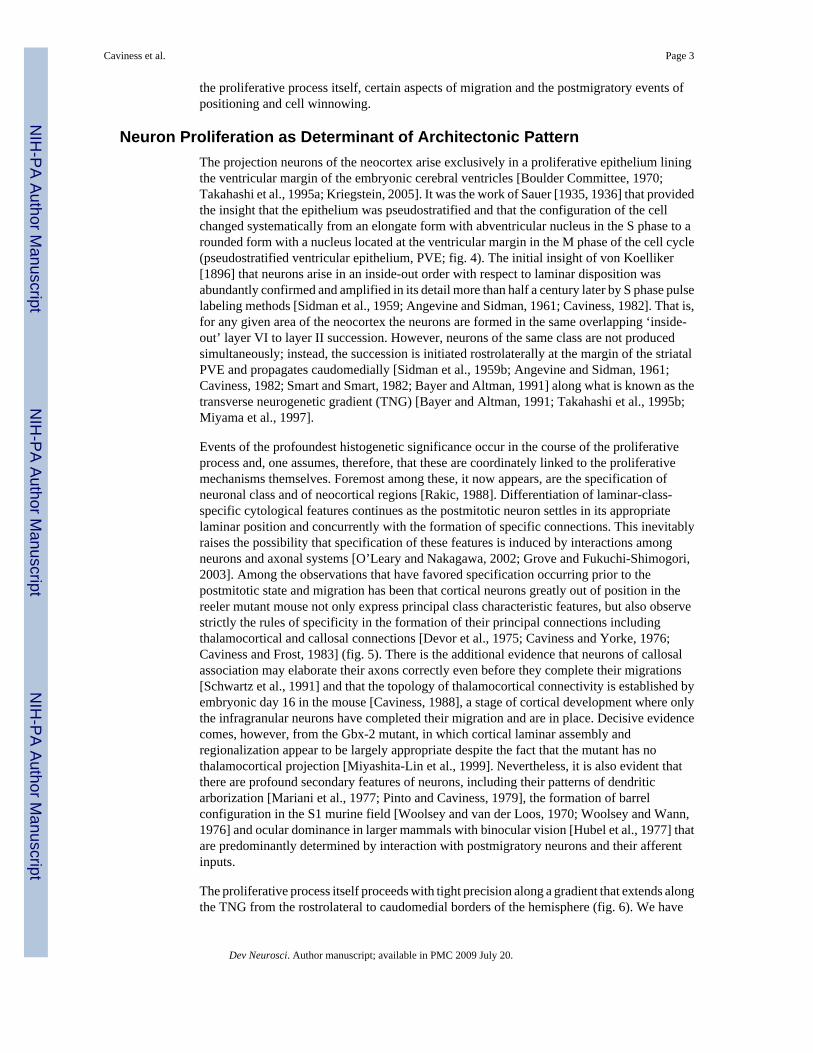
Also in the epoch of His, it was recognized that among the heritable microcephalies [Vogt,1895; Cunningham, 1895] (fig. 2) were disorders where the neocortex is reduced in width. Thelaminar order is preserved but the populations of the outer layers are greatly reduced relativeto those of the deeper layers [Hammarberg, 1895] (fig. 3). That is, single-gene disordersassociated with profound reduction of neuron formation may preferentially have an impactupon the generation of the outer, that is the later specified and formed, classes of neurons. Inretrospect we may infer that in these brains, the proper neuronal classes in fact are formed,migrate properly and become positioned properly in laminae with a pattern of subsequentwinnowing that yields region-specific architectonic patterns (fig. 3). This pattern is nowrecognized also to be characteristic of disordered regulation of the proliferative process itselfas a consequence of mutation of a diverse set of specific gene mutations in mice [Monuki etal., 2001; Roy et al., 2004; Yun et al., 2004].
Thus, insights from these early investigations essentially laid out the salient themes ofinvestigations to follow over the century focused upon the sequence and scheduling ofhistogenetic events leading to the elaboration of neocortical cell pattern. These have been thecoordinate events of cell production and cell class specification during the proliferative phase,migration, laminar distribution and arrival at final populations and arrangement. Investigationsgoing forward over the past century have greatly illuminated the cell biological and, to a morelimited extent, the molecular mechanisms through which the final architectonic pattern of theneocortex is achieved. This extensive body of knowledge will be treated here only in terms ofthe selected ‘chapters’, which have had our personal attention over the years. These include
Caviness et al. Page 2
Dev Neurosci. Author manuscript; available in PMC 2009 July 20.
NIH
-PA Author Manuscript
NIH
-PA Author Manuscript
NIH
-PA Author Manuscript
the proliferative process itself, certain aspects of migration and the postmigratory events ofpositioning and cell winnowing.
Neuron Proliferation as Determinant of Architectonic PatternThe projection neurons of the neocortex arise exclusively in a proliferative epithelium liningthe ventricular margin of the embryonic cerebral ventricles [Boulder Committee, 1970;Takahashi et al., 1995a; Kriegstein, 2005]. It was the work of Sauer [1935, 1936] that providedthe insight that the epithelium was pseudostratified and that the configuration of the cellchanged systematically from an elongate form with abventricular nucleus in the S phase to arounded form with a nucleus located at the ventricular margin in the M phase of the cell cycle(pseudostratified ventricular epithelium, PVE; fig. 4). The initial insight of von Koelliker[1896] that neurons arise in an inside-out order with respect to laminar disposition wasabundantly confirmed and amplified in its detail more than half a century later by S phase pulselabeling methods [Sidman et al., 1959; Angevine and Sidman, 1961; Caviness, 1982]. That is,for any given area of the neocortex the neurons are formed in the same overlapping ‘inside-out’ layer VI to layer II succession. However, neurons of the same class are not producedsimultaneously; instead, the succession is initiated rostrolaterally at the margin of the striatalPVE and propagates caudomedially [Sidman et al., 1959b; Angevine and Sidman, 1961;Caviness, 1982; Smart and Smart, 1982; Bayer and Altman, 1991] along what is known as thetransverse neurogenetic gradient (TNG) [Bayer and Altman, 1991; Takahashi et al., 1995b;Miyama et al., 1997].
Events of the profoundest histogenetic significance occur in the course of the proliferativeprocess and, one assumes, therefore, that these are coordinately linked to the proliferativemechanisms themselves. Foremost among these, it now appears, are the specification ofneuronal class and of neocortical regions [Rakic, 1988]. Differentiation of laminar-class-specific cytological features continues as the postmitotic neuron settles in its appropriatelaminar position and concurrently with the formation of specific connections. This inevitablyraises the possibility that specification of these features is induced by interactions amongneurons and axonal systems [O’Leary and Nakagawa, 2002; Grove and Fukuchi-Shimogori,2003]. Among the observations that have favored specification occurring prior to thepostmitotic state and migration has been that cortical neurons greatly out of position in thereeler mutant mouse not only express principal class characteristic features, but also observestrictly the rules of specificity in the formation of their principal connections includingthalamocortical and callosal connections [Devor et al., 1975; Caviness and Yorke, 1976;Caviness and Frost, 1983] (fig. 5). There is the additional evidence that neurons of callosalassociation may elaborate their axons correctly even before they complete their migrations[Schwartz et al., 1991] and that the topology of thalamocortical connectivity is established byembryonic day 16 in the mouse [Caviness, 1988], a stage of cortical development where onlythe infragranular neurons have completed their migration and are in place. Decisive evidencecomes, however, from the Gbx-2 mutant, in which cortical laminar assembly andregionalization appear to be largely appropriate despite the fact that the mutant has nothalamocortical projection [Miyashita-Lin et al., 1999]. Nevertheless, it is also evident thatthere are profound secondary features of neurons, including their patterns of dendriticarborization [Mariani et al., 1977; Pinto and Caviness, 1979], the formation of barrelconfiguration in the S1 murine field [Woolsey and van der Loos, 1970; Woolsey and Wann,1976] and ocular dominance in larger mammals with binocular vision [Hubel et al., 1977] thatare predominantly determined by interaction with postmigratory neurons and their afferentinputs.
The proliferative process itself proceeds with tight precision along a gradient that extends alongthe TNG from the rostrolateral to caudomedial borders of the hemisphere (fig. 6). We have
Caviness et al. Page 3
Dev Neurosci. Author manuscript; available in PMC 2009 July 20.
NIH
-PA Author Manuscript
NIH
-PA Author Manuscript
NIH
-PA Author Manuscript

shown in the mouse that aligned with the TNG there is an orderly advance in the duration ofthe cell cycle during which only the G1 phase (TG1) is lengthened [Takahashi et al.,1995a;Miyama et al., 1997]. Coordinated with the lengthening of TG1, there is an increase inthe fraction of postmitotic cells that exits each cell cycle (Q) and a commensurate decline inthe fraction that will return to the cycle (P; Q + P = 1.0) [Takahashi et al., 1996]. The parametersQ and TG1 govern more general regulatory aspects of the proliferative process. Thus, the cycle-to-cycle increase in Q as Q ascends its obligatory path from 0.0 (before the first cell becomespostmitotic) to 1.0 (the cycle at which the proliferative population disappears and the lastpostmitotic cells arise) determines the total number of cycles that will constitute the overallproliferative process [Caviness et al., 2000a;Nowakowski et al., 2002]. The rate at which agiven cell cycle domain propagates along the TNG in turn will be proportional to 2 × theduration of the cell cycle [Caviness et al., 2000a]. Finally as evidence of the close coordinationbetween proliferative mechanisms and those involved in specification, it turns out that acrossthe PVE there is a close correlation between cell cycle number in the 11-cycle sequence, onaverage accomplished by each proliferative lineage, and the laminar class of neurons arising[Takahashi et al., 1999] (fig. 7). In wild-type animals, the progression of the two regulatedparameters Q and TG1 are closely coordinated. However, in a double transgenic animal thatoverexpresses the cell cycle inhibitor p27Kip1, TG1 is unaffected but Q is increased relative tocycle number. Notably the laminar class specification sequence is also advanced, suggestingthat the class specification sequence is coordinated with Q [Tarui et al., 2001] (fig. 8, fig. 9).This suggests that Q for each cycle is not only an index of the probability that any postmitoticcell will exit the cycle, but also an index of the probability that this cell will be a neuron of aspecific laminar class.
With these considerations in mind, the relationship of the proliferative process to the regulateddelivery of the successive laminar neuron classes in appropriate numbers becomes apparent.The ascent of Q from 0.0 to 1.0 is nonlinear but monotonic, rising slowly during the first severalcycles, then more rapidly to cross the steady-state value of Q of 0.5 and continue beyond toexhaustion of the proliferative process with the final cycle at Q of 1.0 [Takahashi et al.,1996] (fig. 6). At Q = 0.5 the number of cells exiting the cycle is equal to that remaining tosustain the proliferative pool. Prior to this the proliferative pool is expanding in both its radialand tangential dimensions while afterwards it is contracting but only in its radial dimension.In the mouse, the expansion of the proliferative pool in the interval before Q passes 0.5 isapproximately 50-fold while the overall multiplicative factor for a given lineage is about 150-fold. The corresponding multiplier values are orders of magnitude greater in larger mammals,in particular in primates where some of this type of data has been collected [Kornack and Rakic,1998; Nowakowski et al., 2002]. Two points pertinent to earlier discussion follow [Takahashiet al., 1997; Kornack and Rakic, 1998]. The first is that it would be at Q = 0.5 where the PVEhas reached its maximum tangential extent, that one would expect regional specification withthe PVE (the protomap) to be consummated [Takahashi et al., 1996; Caviness et al., 2000a].This is consistent with the observation that when cells arising when Q is about 0.5 completetheir migrations they are essentially immediately able to enter into a thalamocortical networkthat is topologically the same as that of the adult projection [Caviness, 1988]. The second isthat for the large number of genetic defects that result in microcephaly characterized byimpoverishment of the outer cortical layers, the mechanisms must be mediated via an orderlyadvance in the rate of progression of Q with cycle [Caviness et al., 2003]. This would lead toa late impoverishment of the proliferative pool of the PVE from which these cells arise.
Postproliferative Events as Determinants of Architectonic PatternThe reeler mutant mouse has contributed both insight and consternation to this discourse. Themutant was initially recognized and sustained because of its reeling ataxia of gait [Cavinessand Rakic, 1978]. Histological examination of the brain identified a universal and dramatic
Caviness et al. Page 4
Dev Neurosci. Author manuscript; available in PMC 2009 July 20.
NIH
-PA Author Manuscript
NIH
-PA Author Manuscript
NIH
-PA Author Manuscript

pattern abnormality involving all cortical structures with the exception of the olfactory bulb.Early studies concluded that cell pattern was random, that is without any systematic principleof pattern, and studies based upon dissociation reaggregation experiments in vitro led to thehypothesis that the reeler gene was a master cortical gene that was an indispensable universaldeterminant of cortical pattern [DeLong and Sidman, 1970; Sidman, 1970]. Reexamination ofthis material subsequently led to the realization that the cells were not distributed randomly;in fact there was an underlying consistent anomaly in cell position in all affected corticalstructures. In the neocortex, architectonic studies based on general cell stains suggested, andpulse chase S phase autoradiography confirmed, that there was a systematic inversion of theradial order of neurons with respect to time of origin [Caviness and Sidman, 1972, 1973; Devoret al., 1975; Caviness, 1976, 1982]. That is, rather than being inside-out as in the normal, itwas outside-in. There appeared to be no problems with the proliferative mechanisms and theirsequences, and the appropriate classes arose in the appropriate order. Moreover, the corticalneurons retained their principal class characteristic features of size and pattern of afferent andefferent connections despite malposition (fig. 5). Moreover, they appeared to migrate more orless appropriately until they reached the cortical domain. At that point, from the vantage ofelectron microscopy, they appeared to freeze in place and in the order that they entered thecortical plane [Pinto-Lord et al., 1982]. In short, the right cells were born at the right time butduring their migration they failed to reach the right place.
Subsequent work has cloned the gene, characterized the protein and provided critical insightswith respect to its cell classes of origin and about the signaling cascade in which the reelergene participates [Goffinet, 1995; D’Arcangelo et al., 1997]. Moreover, a variety of‘lookalikes’ and near-look-alikes have turned up, some with related and some with unrelatedmolecular affinities [Gilmore et al., 1998; Ohshima et al., 1999; Ross and Walsh, 2001; Forsteret al., 2006]. The mechanisms through which the protein encoded by the normal reeler geneacts to facilitate migration within the cortical plane remains illusive, but considerable progresshas been made in understanding the reelin signaling cascade [Forster et al., 2006]. The modernera of work on reeler proceeded concurrently with the signal discovery of Rakic [1971] thatthe course of migration was guided in its ascent by adherence to the transcerebral radial glialfiber. Certainly this mechanism is among the most indispensable to pattern formation, andrecent work, much based upon developmental malformations in man, has begun to identify itsvulnerabilities [Mochida and Walsh, 2004]. For example, it is clear from such work thatmolecular mechanisms related to cytoskeletal elements that are components of migratorymechanisms, are indispensable. The human malformation Lis1, for example, in which there ismassive arrest of neuronal migration at a cerebral level superficial to the sagittal strata andwithin the corona radiata [Stewart etal., 1975], arises from a mutation in the lis1 gene [Pilz etal., 1998]. In this mutation and the closely related ‘double cortex’ malformation [Corbo et al.,2002] designated originally by Bielschowsky as pachygyria [Stewart et al., 1975], it is themicrotubular system that is disordered. In periventricular nodular heterotopia, the heterotopicneurons are clustered in nodules just above the proliferative epithelium. The mutated gene inthis instance is filamen, a component in the microfilament system [Fox and Walsh, 1999; Sheenet al., 2002].
The final events involved in fine tuning cortical patterning occur within the cortex itself andinvolve postmigratory cells. There is a complex and extended sequence of developmentalprocesses continuing through all that occurs with the formation of connections and growth.We mention here two critical early events that occur soon after neurons have completed theirascent along the radial glial fiber. We cite first the process of winnowing by histogenetic celldeath. This is a process, massive in scale, for which the regulatory mechanisms are littleunderstood. It was appreciated more than 2 decades ago by Finlay and associates that this wasa process of great magnitude [Finlay and Slattery, 1983; Janowsky and Finlay, 1983; Finlayet al., 1986; Finlay and Pallas, 1989]. They postulated that in fact the differences in neuron
Caviness et al. Page 5
Dev Neurosci. Author manuscript; available in PMC 2009 July 20.
NIH
-PA Author Manuscript
NIH
-PA Author Manuscript
NIH
-PA Author Manuscript

number from area to area and layer to layer within an area were due principally to differentialmagnitudes of histogenetic cell death rather than differential neuron complement afterproliferation and migration. This hypothesis is consistent with the observation based uponquantitative studies. These establish first of all that the same number of neurons appear to beformed in the course of proliferation in multiple regions of the PVE giving rise to the neuronalpopulation in multiple different architectonic fields [Takahashi et al., 1996; Caviness et al.,2000a]. Secondly, in different and widely separate cortical areas and in the separate layerswithin these areas, the amount of cell death is greatly variable and consistent with a reasonableapproximation of the final complement of those layers and fields [Verney et al., 2000]. In themouse, the process peaks at postnatal day 4, that is, within 48–72 h of the completion ofmigration, and is completed before the end of the second postnatal week. It appears to proceedconcurrently in all fields rather than observing the earlier cytogenetic sequence in the PVE. Inthis way it is similar to the schedule of synaptogenesis [Bourgeois et al., 1994; Granger et al.1995; Bourgeois and Rakic, 1996]. This is consistent with the hypothesis that it is governedprincipally by a process of system matching that is an interaction between cell and afferentsystems [O’Leary and Cowan, 1982, 1984; Carlson et al., 1986].
Once the cells have reached their proper position in the neocortex and established their finalnumber by cell death and their appropriate connections with their afferent and efferent targets,additional steps occur to shape the final function of the neocortex. One of these, the productionof myelin, has been known for many years [Flechsig, 1920] to occur in a specific order thatcorresponds apparently to the functional needs of the developing infant. Other processes,notably the development of the cortical columns, require functional interactions that includesensory input [Rakic, 1976; Wiesel, 1982; Kanold and Shatz, 2006].
The sequence of histogenetic events reviewed in brief in these paragraphs is robust, orderlyand greatly precise in execution under conditions of normal genetic background and favorableenvironmental circumstances. However, genetic flaws or unfavorable environmentalconditions regularly precede a greatly diverse range of disorders reflecting disruption of a seriesof entrained histogenetic sequences. The gravest of these may be reflected in topologicaldisruptions with profound limitation of growth while others may be detected only in domainsof behavioral adaptation [Caviness et al., 2000b; Takahashi et al., 2003]. The direction ofthought over the past century has moved strongly from a grounding in formal origin of thenervous system and its cell biological basis towards an enlarging grasp of molecular biologicalregulation. It is in this domain of exploration that we place our strongest expectations for anunderstanding that will lessen the probability and burden of histogenetic failures.
AcknowledgementsThis work was supported by US Public Health Service grants NS12005 to V.S.C., NS43246 and DA020796 to P.G.B.,NS49445 and EY15647 to R.S.N., and a grant from the NJ Commission on Spinal Cord Research to R.S.N.
ReferencesAngevine JB, Sidman RL. Autoradiographic study of cell migration during histogenesis of the cerebral
cortex in the mouse. Nature 1961;192:766–768. [PubMed: 17533671]Bayer, SA.; Altman, J. Neocortical Development. New York: Raven Press; 1991.Boulder Committee. Embryonic vertebrate nervous system: revised terminology. Anat Rec
1970;166:257–262. [PubMed: 5414696]Bourgeois JP, Goldman-Rakic PS, Rakic P. Synaptogenesis in the prefrontal cortex of rhesus monkeys.
Cereb Cortex 1994;4:78–96. [PubMed: 8180493]Bourgeois JP, Rakic P. Synaptogenesis in the occipital cortex of macaque monkey devoid of retinal input
from early embryonic stages. Eur J Neurosci 1996;8:942–950. [PubMed: 8743742]
Caviness et al. Page 6
Dev Neurosci. Author manuscript; available in PMC 2009 July 20.
NIH
-PA Author Manuscript
NIH
-PA Author Manuscript
NIH
-PA Author Manuscript

Brodmann, K. Vergleichende Lokalisationslehre der Grosshirnrinde. Leipzig: Barth; 1909.Carlson M, Hubel DH, Wiesel TN. Effects of monocular exposure to oriented lines on monkey striate
cortex. Brain Res 1986;390:71–81. [PubMed: 3948033]Caviness V Jr. Patterns of cell and fiber distribution in the neocortex of the reeler mutant mouse. J Comp
Neurol 1976;170:435–447. [PubMed: 1002868]Caviness V Jr. Neocortical histogenesis in normal and reeler mice: a developmental study based upon
[3H]thymidine autoradiography. Brain Res 1982;256:293–302. [PubMed: 7104762]Caviness, V, Jr. Architecture and development of the thalamocortical projection in the mouse. In:
Bentivoglio, M.; Spreafico, R., editors. Cellular Thalamic Mechanisms. Amsterdam: ElsevierScience Publishers; 1988. p. 489-499.
Caviness V Jr, Takahashi T, Nowakowski RS. Numbers, time and neocortical neurogenesis: a generaldevelopmental and evolutionary model. Trends Neurosci 1995;18:379–383. [PubMed: 7482802]
Caviness V Jr, Frost DO. Thalamocortical projections in the reeler mutant mouse. J Comp Neurol1983;219:182–202. [PubMed: 6194186]
Caviness VS Jr, Goto T, Tarui T, Takahashi T, Bhide PG, Nowakowski RS. Cell output, cell cycle durationand neuronal specification: a model of integrated mechanisms of the neocortical proliferative process.Cereb Cortex 2003;13:592–598. [PubMed: 12764033]
Caviness VS Jr, Rakic P. Mechanisms of cortical development: a view from mutations in mice. AnnuRev Neurosci 1978;1:297–326. [PubMed: 386903]
Caviness V Jr, Sidman RL. Olfactory structures of the forebrain in the reeler mutant mouse. J CompNeurol 1972;145:85–104. [PubMed: 5036667]
Caviness V Jr, Sidman RL. Time of origin or corresponding cell classes in the cerebral cortex of normaland reeler mutant mice: an autoradiographic analysis. J Comp Neurol 1973;148:141–151. [PubMed:4700506]
Caviness, V., Jr; Takahashi, T.; Nowakowski, RS. Neuronogenesis and the early events of neocorticalhistogenesis. In: Goffinet, A.; Rakic, P., editors. Development of the Neocortex. Berlin: Springer;2000a. p. 107-143.
Caviness VS Jr, Takahashi T, Nowakowski RS. Neocortical malformation as consequence of nonadaptiveregulation of neuronogenetic sequence. Ment Retard Dev Disabil Res Rev 2000b;6:22–33. [PubMed:10899794]
Caviness V Jr, Yorke C Jr. Interhemispheric neocortical connections of the corpus callosum in the reelermutant mouse: a study based on anterograde and retrograde methods. J Comp Neurol 1976;170:449–459. [PubMed: 63471]
Corbo JC, Deuel TA, Long JM, LaPorte P, Tsai E, Wynshaw-Boris A, Walsh CA. Doublecortin is requiredin mice for lamination of the hippocampus but not the neocortex. J Neurosci 2002;22:7548–7557.[PubMed: 12196578]
Cunningham, D. The brain of the microcephalic idiot. London: The Royal Dublin Society, Williams &Norgate; 1895.
D’Arcangelo G, Nakajima K, Miyata T, Ogawa M, Mikoshiba K, Curran T. Reelin is a secretedglycoprotein recognized by the CR-50 monoclonal antibody. J Neurosci 1997;17:23–31. [PubMed:8987733]
DeLong GR, Sidman R. Alignment defect of reaggregating cells in cultures of developing brains of Reelermutant mice. Dev Biol 1970;22:584–600.
Devor M, Caviness V Jr, Derer P. A normally laminated afferent projection to an abnormally laminatedcortex: some olfactory connections in the reeler mouse. J Comp Neurol 1975;164:471–482. [PubMed:1206130]
Finlay BL, Pallas SL. Control of cell number in the developing mammalian visual system. Prog Neurobiol1989;32:207–234. [PubMed: 2652194]
Finlay BL, Sengelaub DR, Berian CA. Control of cell number in the developing visual system. I. Effectsof monocular enucleation. Dev Brain Res 1986;28:1–10.
Finlay BL, Slattery M. Local differences in the amount of early cell death in neocortex predict adult localspecializations. Science 1983;219:1349–1351. [PubMed: 6828866]
Caviness et al. Page 7
Dev Neurosci. Author manuscript; available in PMC 2009 July 20.
NIH
-PA Author Manuscript
NIH
-PA Author Manuscript
NIH
-PA Author Manuscript

Flechsig, P. Anatomie des menschlichen Gehirns und Rückenmarks auf myelogenetischer Grundlage.Leipzig: Thieme; 1920.
Forster E, Jossin Y, Zhao S, Chai X, Frotscher M, Goffinet AM. Recent progress in understanding therole of Reelin in radial neuronal migration, with specific emphasis on the dentate gyrus. Eur JNeurosci 2006;23:901–909. [PubMed: 16519655]
Fox JW, Walsh CA. Periventricular heterotopia and the genetics of neuronal migration in the cerebralcortex. Am J Hum Genet 1999;65:19–24. [PubMed: 10364512]
Gilmore EC, Ohshima T, Goffinet AM, Kulkarni AB, Herrup K. Cyclin-dependent kinase 5-deficientmice demonstrate novel developmental arrest in cerebral cortex. J Neurosci 1998;18:6370–6377.[PubMed: 9698328]
Goffinet AM. Developmental neurobiology: a real gene for reeler. Nature 1995;374:675–676. [PubMed:7715721]
Granger B, Tekaia F, Le Sourd AM, Rakic P, Bourgeois JP. Tempo of neurogenesis and synaptogenesisin the primate cingulated mesocortex: comparison with the neocortex. J Comp Neurol 1995;360:363–376. [PubMed: 8522653]
Grove EA, Fukuchi-Shimogori T. Generating the cerebral cortical area map. Annu Rev Neurosci2003;26:355–380. [PubMed: 14527269]
Hammarberg C. Studien über Klinik und Pathologie der Idiotienebst Untersuchungen über die normaleAnatomie der Hirnrinde. Upsala, Druck der Akademischen Buchdruckerei. 1895
His W. Die Neuroblasten und deren Entstehung im embryonalen Mark. Abh Math Phys Cl Kgl SaechsGes Wiss 1889;15:313–372.
His, W. Die Entwicklung des menschlichen Gehirns während der ersten Monate. Leipzig: Hirzel; 1904.Hubel D, Wiesel TN, LeVay S. Plasticity of ocular dominance columns in monkey striate cortex. Phil
Trans R Soc Lond B 1977;278:377–409. [PubMed: 19791]Janowsky JS, Finlay BL. Cell degeneration in early development of the forebrain and cerebellum. Anat
Embryol 1983;167:439–447. [PubMed: 6625197]Kanold PO, Shatz CJ. Subplate neurons regulate maturation of cortical inhibition and outcome of ocular
dominance plasticity. Neuron 2006;51:627–638. [PubMed: 16950160]Kornack DR, Rakic P. Changes in cell-cycle kinetics during the development and evolution of primate
neocortex. Proc Natl Acad Sci USA 1998;95:1242–1246. [PubMed: 9448316]Kriegstein AR. Constructing circuits: neurogenesis and migration in the developing neocortex. Epilepsia
2005;46(suppl 7):15–21. [PubMed: 16201991]Mariani J, Crepel F, Mikoshiba K, Changeux JP, Sotelo C. Anatomical, physiological and biochemical
studies of the cerebellum from Reeler mutant mouse. Philos Trans R Soc Lond B Biol Sci 1977;281:1–28. [PubMed: 22882]
Miyama S, Takahashi T, Nowakowski RS, Caviness VS Jr. A gradient in the duration of the G1 phase inthe murine neocortical proliferative epithelium. Cereb Cortex 1997;7:678–689. [PubMed: 9373022]
Miyashita-Lin E, Hevner R, Wassarman K, Martinez S, Rubenstein J. Early neocortical regionalizationin the absence of thalamic innervation. Science 1999;285:906–909. [PubMed: 10436162]
Mochida GH, Walsh CA. Genetic basis of developmental malformations of the cerebral cortex. ArchNeurol 2004;61:637–640. [PubMed: 15148137]
Monuki ES, Porter FD, Walsh CA. Patterning of the dorsal telencephalon and cerebral cortex by a roofplate-Lhx2 pathway. Neuron 2001;32:591–604. [PubMed: 11719201]
Nowakowski, R.; Caviness, V.; Takahashi, T.; Hayes, N. Population dynamics during cell proliferationand neuronogenesis in the developing murine neocortex. In: Hohmann, C., editor. CorticalDevelopment: From Specification to Differentiation. New York: Springer; 2002. p. 1-22.
Ohshima T, Gilmore EC, Longenecker G, Jacobowitz DM, Brady RO, Herrup K, Kulkarni AB. Migrationdefects of cdk5(−/−) neurons in the developing cerebellum is cell autonomous. J Neurosci1999;19:6017–6026. [PubMed: 10407039]
O’Leary DD, Cowan WM. Further studies on the development of the isthmo-optic nucleus with specialreference to the occurrence and fate of ectopic and ipsilaterally projecting neurons. J Comp Neurol1982;212:399–416. [PubMed: 7161417]
Caviness et al. Page 8
Dev Neurosci. Author manuscript; available in PMC 2009 July 20.
NIH
-PA Author Manuscript
NIH
-PA Author Manuscript
NIH
-PA Author Manuscript

O’Leary DD, Cowan WM. Survival of isthmo-optic neurons after early removal of one eye. Brain Res1984;314:293–310. [PubMed: 6704755]
O’Leary DD, Nakagawa Y. Patterning centers, regulatory genes and extrinsic mechanisms controllingarealization of the neocortex. Curr Opin Neurobiol 2002;12:14–25. [PubMed: 11861160]
Pilz DT, Matsumoto N, Minnerath S, Mills P, Gleeson JG, Allen KM, Walsh CA, Barkovich AJ, DobynsWB, Ledbetter DH, Ross ME. LIS1 and XLIS (DCX) mutations cause most classical lissencephaly,but different patterns of malformation. Hum Mol Genet 1998;7:2029–2037. [PubMed: 9817918]
Pinto LM, Caviness V Jr. Determinants of cell shape and orientation: a comparative Golgi analysis ofcell-axon interrelationships in the developing neocortex of normal and reeler mice. J Comp Neurol1979;187:49–69. [PubMed: 489778]
Pinto-Lord MC, Evrard P, Caviness V Jr. Obstructed neuronal migration along radial glial fibers in theneocortex of the reeler mouse: a Golgi-EM analysis. Brain Res 1982;256:379–393. [PubMed:7127145]
Rakic P. Neuron-glia relationship during granule cell migration in developing cerebellar cortex: a Golgiand electronmicroscopic study in Macacus rhesus. J Comp Neurol 1971;141:283–312. [PubMed:4101340]
Rakic P. Prenatal genesis of connections subserving ocular dominance in the rhesus monkey. Nature1976;261:467–471. [PubMed: 819835]
Rakic P. Specification of cerebral cortical areas. Science 1988;241:170–176. [PubMed: 3291116]Ross ME, Walsh CA. Human brain malformations and their lessons for neuronal migration. Annu Rev
Neurosci 2001;24:1041–1070. [PubMed: 11520927]Roy K, Kuznicki K, Wu Q, Sun Z, Bock D, Schutz G, Vranich N, Monaghan AP. The Tlx gene regulates
the timing of neurogenesis in the cortex. J Neurosci 2004;24:8333–8345. [PubMed: 15385616]Sauer FC. Mitosis in the neural tube. J Comp Neurol 1935;62:377–405.Sauer FC. The interkinetic migration of embryonic epithelial nuclei. J Morphol 1936;60:1–11.Schwartz ML, Rakic P, Goldman-Rakic PS. Early phenotype expression of cortical neurons: evidence
that a subclass of migrating neurons have callosal axons. Proc Nat Acad Sci USA 1991;88:1354–1358. [PubMed: 1705036]
Sheen VL, Feng Y, Graham D, Takafuta T, Shapiro SS, Walsh CA. Filamin A and filamin B are co-expressed within neurons during periods of neuronal migration and can physically interact. Hum MolGenet 2002;11:2845–2854. [PubMed: 12393796]
Sidman, R. Cell proliferation, migration and interaction in the developing mammalian central nervoussystem. In: Schmidt, F., editor. The Neurosciences Second Study Program. New York: RockefellerUniversity Press; 1970.
Sidman RL, Miale IL, Feder N. Cell proliferation and migration in the primitive ependymal zone: anautoradiographic study of histogenesis in the nervous system. Exp Neurol 1959;1:322–333.[PubMed: 14446424]
Sidman, RL.; Rakic, P. Development of the human central nervous system. In: Haymaker, W.; Adams,RD., editors. Histology and Histopathology of the Nervous System. Springfield: Thomas; 1982. p.3-145.
Smart IH, Smart M. Growth patterns in the lateral wall of the mouse telencephalon. I. Autoradiographicstudies of the histogenesis of the isocortex and adjacent areas. J Anat 1982;134:273–298. [PubMed:7076556]
Stewart RM, Richman DP, Caviness V Jr. Lissencephaly and pachygyria: an architectonic andtopographical analysis. Acta Neuropathol 1975;31:1–12. [PubMed: 1121923]
Takahashi T, Goto T, Miyama S, Nowakowski RS, Caviness VS Jr. Sequence of neuron origin andneocortical laminar fate: relation to cell cycle of origin in the developing murine cerebral wall. JNeurosci 1999;19:10357–10371. [PubMed: 10575033]
Takahashi T, Kinsman S, Makris N, Grant E, Haselgrove C, McInerney S, Kennedy DN, Fredrickson K,Mori S, Caviness VS. Semilobar holoprosencephaly with midline ‘seam’: a topologic andmorphogenetic model based upon MRI analysis. Cereb Cortex 2003;13:1299–1312. [PubMed:14615296]
Takahashi T, Nowakowski RS, Caviness V Jr. The cell cycle of the pseudostratified ventricular epitheliumof the embryonic murine cerebral wall. J Neurosci 1995a;15:6046–6057. [PubMed: 7666188]
Caviness et al. Page 9
Dev Neurosci. Author manuscript; available in PMC 2009 July 20.
NIH
-PA Author Manuscript
NIH
-PA Author Manuscript
NIH
-PA Author Manuscript

Takahashi T, Nowakowski RS, Caviness VS Jr. The cell cycle of the pseudostratified ventricularepithelium of the embryonic murine cerebral wall. J Neurosci 1995b;15:6046–6057. [PubMed:7666188]
Takahashi T, Nowakowski RS, Caviness VS Jr. The leaving or Q fraction of the murine cerebralproliferative epithelium: a general model of neocortical neuronogenesis. J Neurosci 1996;16:6183–6196. [PubMed: 8815900]
Takahashi T, Nowakowski R, Caviness V Jr. The mathematics of neocortical neuronogenesis. DevNeurosci 1997;19:17–22. [PubMed: 9078427]
Tarui T, Takahashi T, Bhide P, Caviness V. Effects of p27kip1 overexpression on neocorticalneurogenesis are developmentally regulated. Soc Neurosci Abstr 2001;27:896.
Tarui T, Takahashi T, Nowakowski RS, Hayes NL, Bhide PG, Caviness VS. Overexpression of p27 Kip1, probability of cell cycle exit, and laminar destination of neocortical neurons. Cereb Cortex2005;15:1343–1355. [PubMed: 15647527]
Verney C, Takahashi T, Bhide PG, Nowakowski RS, Caviness VS Jr. Independent controls for neocorticalneuron production and histogenetic cell death. Dev Neurosci 2000;22:125–138. [PubMed: 10657705]
Vogt, C. Mémoire sur les microcéphales ou hommes-singes. Paris: 1895.von Economo, C.; Koskinas, GN. Die Cytoarchitektonik der Hirnrinde des erwachsenen Menschen.
Berlin: Springer; 1925.von Koelliker, A. Handbuch der Gewebelehre des Menschen. Leipzig: Engelmann; 1896.Wiesel TN. Postnatal development of the visual cortex and the influence of environment. Nature
1982;299:583–591. [PubMed: 6811951]Woolsey T, Wann J. Area changes in mouse cortical barrels following vibrissal damage at different
postnatal ages. J Comp Neurol 1976;170:53–66. [PubMed: 977815]Woolsey TA, van der Loos H. The structural organization of layer IV in the somatosensory region (SI)
of mouse cerebral cortex. Brain Res 1970;17:205–242. [PubMed: 4904874]Yun K, Mantani A, Garel S, Rubenstein J, Israel MA. Id4 regulates neural progenitor proliferation and
differentiation in vivo. Development 2004;131:5441–5448. [PubMed: 15469968]Zilles, K. Cortex. In: Paxinos, G., editor. The Human Nervous System. New York: Academic Press; 1990.
p. 757-802.
Caviness et al. Page 10
Dev Neurosci. Author manuscript; available in PMC 2009 July 20.
NIH
-PA Author Manuscript
NIH
-PA Author Manuscript
NIH
-PA Author Manuscript

Fig. 1.Golgi impregnation of late first-trimester embryo. The pyramidal cells from deep to superficialillustrate an orderly differentiation sequence where those in the deepest level have elaboratedapical and basal dendritic systems and the superficial ones only early elaboration of the apicalsystems [von Koelliker, 1896].
Caviness et al. Page 11
Dev Neurosci. Author manuscript; available in PMC 2009 July 20.
NIH
-PA Author Manuscript
NIH
-PA Author Manuscript
NIH
-PA Author Manuscript
Fig. 2.Images of microcephalics approximately 8 (1), about 20 (2) and around 50–60 years old (3, 4)by the estimate of the author. Basal images of the brain (5, 6) are from subjects 3 and 1[Cunningham, 1895].
Caviness et al. Page 12
Dev Neurosci. Author manuscript; available in PMC 2009 July 20.
NIH
-PA Author Manuscript
NIH
-PA Author Manuscript
NIH
-PA Author Manuscript

Fig. 3.Transverse sections stained with methylene blue from normal cortex (a) and cortex fromgravely cognitively impaired microcephalic subjects (b). The Betz cells readily recognized incolumns 3 and 4, respectively, identify the corresponding pre-Rolandic gyrus in the normaland microcephalic subjects. The other panels illustrate the corresponding regions of frontal,parietal and occipital association cortical regions. The important generalizations to take fromthese comparisons is that the microcephalic cortex is laminated with the appropriate radialorder by readily recognized classes corresponding to those in the normal subject but that thereis marked attenuation of the most superficial layers in the microcephalic brains [Hammarberg,1895].
Caviness et al. Page 13
Dev Neurosci. Author manuscript; available in PMC 2009 July 20.
NIH
-PA Author Manuscript
NIH
-PA Author Manuscript
NIH
-PA Author Manuscript

Fig. 4.Neuronogenesis in the PVE in relation to the ‘inside-out pattern’ of neocortical layer formation.a The founder proliferative populations and their progeny in both dorsomedial (DCZ) andlateral (LCZ) cortical zones of the PVE execute 11 cell cycles (CC1–CC11) in the course ofthe 6-day neuronogenetic interval, continuing from the 11th to the 17th embryonic day (E) inthe DCZ and from the 10th to the 16th embryonic day in the LCZ. The cycle sequence isinitiated earlier and remains advanced by about 24 h in the LCZ relative to the DCZ (note foreach cell cycle a 24-hour difference in time of occurrence of corresponding cell cycles in theDCZ and LCZ). The first neurons to arise from either region of the PVE are destined for thedeepest cortical layers (dashed curved lines connecting the PVE and layers VI and V), whereasprogressively later forming neurons are destined for progressively more superficial layers(solid curved lines connecting the PVE and layers IV and II/III). The daughter cells arisingfrom cycle 11 are the terminal output (TO) of neuronogenesis. Curved arrows in the PVE showinterkinetic nuclear migration through G1, S, G2 and M phases of the cell cycle. ML =Molecular layer. Interkinetic nuclear migration is shown for CC2 in the magnified view in theinset on the top left. A fraction of postmitotic cells (Q) leaves the PVE with each cycle andmigrates toward the surface of the hemisphere as young neurons. b, c The DCZ and LCZ of
Caviness et al. Page 14
Dev Neurosci. Author manuscript; available in PMC 2009 July 20.
NIH
-PA Author Manuscript
NIH
-PA Author Manuscript
NIH
-PA Author Manuscript

the PVE of the embryonic cerebral hemisphere (b coronal cutaway) give rise (curved arrowsconnecting b and c) to neurons destined, respectively, for fields 1 and 40 in the adult hemisphere(c coronal cutaway) [Takahashi et al., 1999].
Caviness et al. Page 15
Dev Neurosci. Author manuscript; available in PMC 2009 July 20.
NIH
-PA Author Manuscript
NIH
-PA Author Manuscript
NIH
-PA Author Manuscript

Fig. 5.Schematic representation of the distribution of basic neuronal classes and their major afferentsystems in normal +/− (a) and reeler rl/rl (b) neocortex. The left half of a displays the normalpositions of the plexiform layer (P), layer of small pyramids (SP), layer of medium pyramids(MP), layer of granule (stellate) cells (G), layer of large pyramids (LP), layer of polymorphouscells (PM) and the subcortical white matter (WM). The left half of b shows the relativedistributions of the homologous classes of neurons in the corresponding cortical areas in thereeler mouse. Note the absence of the plexiform layer and misplacement and/or inversion ofposition of some cell classes. The right halves of a and b indicate the territories occupied bycallosal (CC) and by thalamocortical terminals (TC) in the normal or reeler mouse,respectively. The distribution of thalamocortical and callosal terminal afferent systems to theneocortex varies in normal and mutant cortex, depending on the position of the target cells[Caviness and Rakic, 1978].
Caviness et al. Page 16
Dev Neurosci. Author manuscript; available in PMC 2009 July 20.
NIH
-PA Author Manuscript
NIH
-PA Author Manuscript
NIH
-PA Author Manuscript

Fig. 6.Expansion and involution of a founder PVE population and cell output in the course of theneuronogenetic interval. The volume of the PVE, the cell output from a single cell cycle (PVEoutput) and the cumulative cell output are plotted with respect to both the elapsed cell cycles,CC1–CC11, and embryonic days (E) on the abscissa. At the beginning of the neuronogeneticinterval, where 0 cell cycles have elapsed (i.e. the beginning of CC1) at 9.00 a.m. on E11, thePVE volume is set at the arbitrary unit value of 1.0, and cell output at this point is by definition0. The vertical dashed line divides the neuronogenetic interval with respect to where Q and Preach the critical turning point of 0.5. To the left of the vertical dashed line, Q < 0.5 and thePVE is expanding; to the right of the vertical dashed line, Q > 0.5 and the PVE is involuting.The PVE size reaches its maximum value at this point, and cell output per cycle is maximumbeyond this point. The P fraction cells of CC11 will divide to produce 2 daughter cells, all ofwhich (Q = 1.0) will exit the cell cycle as the terminal output (TO). The contribution of Q fromthe first half of the 11 cell cycles (CC1–CC6) is only approximately 6%, whereas that of thelast 2 cycles (CC10–CC11) and the terminal output is about 50% of the total neuronal
Caviness et al. Page 17
Dev Neurosci. Author manuscript; available in PMC 2009 July 20.
NIH
-PA Author Manuscript
NIH
-PA Author Manuscript
NIH
-PA Author Manuscript

population of the cortex at the end of the neuronogenetic interval. Our previous estimate of thecumulative output throughout the full neuronogenetic interval [Caviness et al., 1995] wasapproximately twice that represented here. This is because the unit founder population wasconsidered to be the population of the cell cycle preceding CC1 for the previous estimate butwas considered to be the population at the beginning of G1 of CC1 in this plot [Takahashi etal., 1996].
Caviness et al. Page 18
Dev Neurosci. Author manuscript; available in PMC 2009 July 20.
NIH
-PA Author Manuscript
NIH
-PA Author Manuscript
NIH
-PA Author Manuscript

Fig. 7.A schematic diagram of the contribution, patterns of distribution and intermixing of neuronsby cycle of origin. This plot is a summary of the individual distributions plotted in figure 4 andshows the contribution and distribution pattern of net output from each cycle to each corticallayer. The output of each cycle is color coded and numbered. TO refers to the terminal outputafter cycle 11 at the end of the neuronogenetic interval. Cell number per counting sector(ordinate; also see Materials and Methods) is a net number, that is a number that is obtainedat postnatal day 22 after histogenetic cell death has been completed. Net neuronal out put islowest to the midcortex, corresponding to layer V, where the contribution arises principallywith cycles 7 and 8 in both fields. It is evident that all layers, and particularly the deepest levelsof layer VI, represent the contributions of many cycles [Takahashi et al., 1999]. a Field 1. bField 4 0.
Caviness et al. Page 19
Dev Neurosci. Author manuscript; available in PMC 2009 July 20.
NIH
-PA Author Manuscript
NIH
-PA Author Manuscript
NIH
-PA Author Manuscript

Fig. 8.Effect of p27Kip1 overexpression on the laminar fate of neocortical neurons. Effects ofp27Kip1 overexpression during the embryonic period on the gross appearance of the brain,cytoarchitecture of the neocortex and laminar fates of cells generated on embryonic day 14examined at postnatal day 21. The brains of wild-type (WT) and double transgenic (DT) miceappear similar in size and shape at postnatal day 2 (a). b, c Micrographs of 4-µm-thick coronalsections through field 1 (b) and field 40 (c) of WT and DT mice stained with basic fuchsin toreveal cortical lamination. The cytoarchitecture of fields 1 and 40 is preserved in the DT mice.However, the thickness of the cortical gray matter is reduced dramatically in the DT mouse infield 1 compared to the WT littermates (b). The thickness of the gray matter in field 40 issimilar in the DT and WT mice (c). The reduction in the thickness of field 1 is caused mainlyby a marked reduction in the thickness of supragranular (SG) layers (layers I I/III and IV, b).The thickness of infragranular (IG) layers (layers V and VI) is similar in the DT and WTlittermates in fields 1 and 40 (b, c). d Micrographs of 4-µm-thick coronal sections through
Caviness et al. Page 20
Dev Neurosci. Author manuscript; available in PMC 2009 July 20.
NIH
-PA Author Manuscript
NIH
-PA Author Manuscript
NIH
-PA Author Manuscript

field 1 of postnatal day 21 WT and DT littermates processed for iododeoxyuridine andbromodeoxyuridine immunohistochemistry. At higher magnification (box insert),iododeoxyuridine-only (blue labeled) cells are readily distinguished from cells labeled withbromodeoxyuridine (brown containing). e Quantitative analysis of the distribution of theiododeoxyuridine-only labeled cells (i.e. cells that exited the cell cycle on embryonic day 14)in field 1 at postnatal day 21 revealed that the majority of the cells was distributed in theinfragranular (IG) layers in the WT cortex (blue line) and in the supragranular (SG) layers inthe DT cortex (red line) at postnatal day 21. Thus, layer destination of cells generated onembryonic day 14 was shifted toward the supragranular layers in the DT mice. ML = Molecularlayer (layer I). a Scale bar = 5 mm. b–d Scale bar = 100 µm [Tarui et al, 2005]
Caviness et al. Page 21
Dev Neurosci. Author manuscript; available in PMC 2009 July 20.
NIH
-PA Author Manuscript
NIH
-PA Author Manuscript
NIH
-PA Author Manuscript

Fig. 9.The regulatory linkage among p27Kip1 overexpression, cell Output and cell fate. a Regressionanalysis of the percentage of Q cells directed to granular and supragranular (SG) layers in fields1 and 40 in wild-type (WT) and double transgenic (DT) littermate pairs. The dashed line (with45-degree slope) denotes the ‘no effect’ line, representing a hypothetical function, in whichDT and WT littermates have identical values (i.e. no effect of p27Kip1 overexpression). Theslope of the regression line obtained with the actual data is significantly (t test, p = 0.01) lowerthan that of the ‘no effect’ line, indicating that the percentage of cells directed to the SG layerswas greater in DT mice compared to the WT littermates. Moreover, the field 1 values divergefrom the ‘no effect’ line to a greater extent than the field 40 values, which tend to approximatethe line closely. b The percentage of cells that exited the cell cycle on embryonic day 14 andthat occupied SG layers at postnatal day 21 in the WT and DT mice is plotted as function ofthe probability of cell cycle exit (Q). The solid line represents data from the CD1 mouse strainobtained in our earlier work [Takahashi et al., 1996, 1999]. The data from the current studyare plotted as dashed line. Nonlinear regression curves are obtained for both the sets of data.Q values were measured in the ventricular zone of the cerebral wall in the medial and lateralcortical zones (MCZ and LCZ, respectively) on embryonic day 14. The MCZ and LCZ areprecursors of fields 1 and 40, respectively. The MCZ and LCZ are separated from each otheralong the transverse neurogenetic gradient so that the LCZ progenitors are ‘in advance’ of theMCZ progenitors with regard to cell cycle kinetics. The correlation between Q and percentageof SG cells observed in the WT mice also applies to the DT mice despite the p27Kip1
overexpression-induced increase in Q. Thus, when Q increases, percent SG increasesproportionately, both in the MCZ and the LCZ and both in the WT and DT mice. This indicatesthat the probability of origin of a given laminar neuron class is a function of the probability ofcell cycle exit, regardless of position along the TNG [Tarui et al., 2005].
Caviness et al. Page 22
Dev Neurosci. Author manuscript; available in PMC 2009 July 20.
NIH
-PA Author Manuscript
NIH
-PA Author Manuscript
NIH
-PA Author Manuscript