Application of photochemical cross-linking to the study of oligomerization of amyloidogenic proteins

Activation of DNA Cleavage by Oligomerization of DNA BoundSgrAI
Chad K. Park1, Amanda P. Stiteler1, Santosh Shah1, M. Imran Ghare1, Jurate Bitinaite2, andNancy C. Horton1,*
1Department of Chemistry & Biochemistry, University of Arizona, Tucson, AZ, 857212New England Biolabs Inc., Ipswich, MA 01938-2723
AbstractSgrAI is a type II restriction endonuclease that cuts an unusually long recognition sequence andexhibits allosteric self-modulation of DNA activity and sequence specificity. Precleaved primarysite DNA has been shown to be an allosteric effector [Hingorani-Varma & Bitinaite, (2003) J.Biol. Chem. 278, 40392-40399], stimulating cleavage of both primary (CR|CCGGYG, | indicatescut site, R=A,G, Y=C,T) and secondary (CR|CCGGY(A/C/T) and CR|CCGGGG) site DNAsequences. The fact that DNA is the allosteric effector of this endonuclease suggests at least twoDNA binding sites on the functional SgrAI molecule, yet crystal structures of SgrAI [Dunten, etal., (2008) Nucleic Acids Res. 36, 5405–5416] show only one DNA duplex bound to one dimer ofSgrAI. We show that SgrAI forms species larger than dimers or tetramers (High Molecular WeightSpecies, HMWS) in the presence of sufficient concentrations of SgrAI and its primary site DNAsequence, that are dependent on the concentration of the DNA bound SgrAI dimer. Analyticalultracentrifugation indicates that the HMWS is heterogeneous, has sedimentation coefficients of15–20 s, and is composed of possibly 4–12 DNA bound SgrAI dimers. SgrAI bound to secondarysite DNA will not form HMWS itself, but can bind to HMWS formed with primary site DNA andSgrAI. Uncleaved, as well as precleaved, primary site DNA is capable of stimulating HMWSformation. Stimulation of DNA cleavage by SgrAI, at primary as well as secondary sites, is alsodependent on the concentration of primary site DNA (cleaved or uncleaved) bound SgrAI dimers.SgrAI bound to secondary site DNA does not have significant stimulatory activity. We proposethat the oligomers of DNA bound SgrAI (i.e. HMWS) are the activated, or activatable, form of theenzyme.
Type II restriction endonucleases are bacterial enzymes thought to protect their host fromphage infection, by cleaving phage DNA injected into the cell prior to replication1.Sequence specific endonucleases capable of cleaving longer unique recognition sequencesare highly sought for genomic work, since longer sequences occur less frequently and allowthe manipulation of larger DNA fragments. Most of the type II restriction endonucleasescharacterized to date cleave 4–6 bp recognition sites in DNA, however, SgrAI, a type IIFrestriction endonuclease from Streptomyces griseus, cleaves an 8 base pair recognitionsequence, CR|CCGGYG2 (R=A,G, Y=C,T, | indicates site of cleavage), known as the SgrAIcognate or primary site sequence. Interestingly, SgrAI cleaves plasmids bearing two copiesof its recognition sequence faster than those bearing only a single site3, 4. In addition,plasmid assays revealed that SgrAI will also cleave the sequences CR|CCGGY(A,C,T) andCR|CCGGGG, known as secondary sites, but only substantially in plasmids containingprimary site sequences5. Secondary sites are distinct from star sites, in that secondary sitesare cleaved appreciably under solution conditions optimal for primary sequence cleavage. In
*Corresponding author NCH: Telephone: 520-626-3828 FAX: 520-621-9288 [email protected].
NIH Public AccessAuthor ManuscriptBiochemistry. Author manuscript; available in PMC 2011 October 19.
Published in final edited form as:Biochemistry. 2010 October 19; 49(41): 8818–8830. doi:10.1021/bi100557v.
NIH
-PA Author Manuscript
NIH
-PA Author Manuscript
NIH
-PA Author Manuscript

contrast, star site sequences are sequences that are cleaved appreciably only under specialreaction conditions, such as high enzyme concentrations or the presence of organic solventsor Mn2+, and are discriminated against under optimal enzyme conditions by 2–4 orders ofmagnitude6. The self-activation with self-modulation of sequence specificity exhibited bySgrAI is quite unusual and has not been detected before in type II restriction endonucleases.
Type II restriction endonucleases typically bind and recognize palindromic sequences asdimers1, 6, but the unusual biochemical properties exhibited by SgrAI suggest the formationof a higher order oligomer containing altered enzymatic properties. For example, at lowenzyme concentrations, SgrAI cleaves plasmids bearing one or two sites at equal rates, buthigher concentrations of enzyme result in the faster cleavage of the two site plasmid4, 7.Similarly, the DNA cleavage turnover number, kcat, of SgrAI with its primary sequenceshows a sigmoidal dependenon on SgrAI concentration, consistent with the formation of anactivated oligomer at the higher enzyme concentrations4, 7. The stimulation of DNAcleavage activity must occur through three-dimensional space, as the accelerated andconcerted cleavage also occurs with plasmids each bearing a single site but connected bycatenation7. Cleavage at primary and secondary site sequences in plasmids can also bestimulated by the addition of oligonucleotides containing the primary site sequence, intact ormimicking the cleavage products of SgrAI5, 7, 8, indicating that DNA is the allostericeffector, and that the functional unit of stimulated SgrAI has at least two DNA binding sites.(An alternative mechanism would involve the memory of the binding of cleaved primary siteafter its dissociation. Such mechanisms typically require a covalent modification ifoligomerization is absent.) Analytical ultracentrifugation shows that SgrAI exists as a dimerin the absence of DNA, but forms both DNA bound dimers and high molecular massaggregates in the presence of a 20 base pair DNA containing a primary site4. Thestoichiometry of this mixture of species has been determined by titration of DNA withSgrAI in analytical untracentrifuge sedimentation velocity experiments showing 1 dimer ofSgrAI per DNA duplex4. A reasonable model for the oligomerization of DNA bound dimers(DBD), which will bring two DNA binding sites together into a single functional unit of theenzyme, is the formation of a tetramer, since the evolutionarily related enzymes NgoMIV,Cfr10I, and Bse634I form tetramers that bind to two duplexes of DNA. However, we showhere that rather than tetramers, SgrAI forms larger oligomers of DBD (HMWS for HighMolecular Weight Species) containing possibly as many as 4–12 DNA bound SgrAI dimers.The HMWS is formed with primary site DNA, which need not be cleaved. SgrAI dimersbound to secondary site DNA will not form HMWS unless sufficient concentrations ofSgrAI dimers bound to primary site are also present. Since the stimulation of the singleturnover rate of DNA cleavage (on primary or secondary site DNA) also depends on thepresence of sufficient concentrations of SgrAI enzyme bound to primary site DNA,conditions where HMWS form, we conclude that the HMWS is composed of many DBD,and is the activated, or activatable, form of SgrAI.
Experimental ProceduresProtein Purification
Wild type SgrAI was prepared as described9. Briefly, SgrAI was expressed in E. coli strainER2566 in the presence of the MspI methyltransferase (New England Biolabs). The enzymewas purified using FPLC (GE Healthcare Biosciences) chromatography and the followingchromatographic resins: Heparin FF Sepharose (Pharmacia), SP FF Sepharose (GEHealthcare Biosciences), Q FF Sepharose (GE Healthcare Biosciences), and then a secondHeparin FF Sepharose (GE Healthcare Biosciences) chromatographic step. Finally, SgrAIenzyme was dialyzed into storage buffer (20 mM Tris-OAc, (pH 8.0), 50 mM KOAc, 0.1mM EDTA, 1 mM DTT, 50% glycerol), aliquoted into single use aliquots, flash frozen inliquid nitrogen, and stored at −80°C.
Park et al. Page 2
Biochemistry. Author manuscript; available in PMC 2011 October 19.
NIH
-PA Author Manuscript
NIH
-PA Author Manuscript
NIH
-PA Author Manuscript

DNA PreparationThe oligonucleotides were made synthetically and purified using C18 reverse phaseHPLC10. The concentration was measured spectrophotometrically, with an extinctioncoefficient calculated from standard values for the nucleotides11, and fluorophore whereappropriate. Fluorophore labeled DNA utilized a 6-(3',6'-dipivaloylfluoresceinyl-6-carboxamido)-hexyl (FLO) group attached to the 5’ phosphate of the top strand ofprecleaved 40 bp primary site containing DNA (FLO-PCP), or 6- (4,7,2’,4’,5’,7’-hexachloro-(3’,6’-dipivaloylfluoresceinyl)-6-carboxamido)-hexyl (HEX) group attached tothe 5’ phosphate of both strands (HEX-18-1) or only the top strands of the 18 bp secondarysite DNA (HEX-18-2) and 40 bp primary site containing DNA (HEX-40-1), and wereobtained from a commercial synthetic source (Sigma Genosys, Inc.) and contain a 6 carbonspacer between the fluorophore and the 5’ phosphate. The self-complementary DNA, orequimolar quantities of complementary DNA, were annealed by heating to 90°C for 10minutes at a concentration of 1 mM, followed by slow-cooling to 4°C over 4–5 hours in athermocycler. Sequences of the DNA used are:
Because freeze-thawing altered the concentration of double stranded DNA used in theassays, DNA used for stimulation of HMWS formation or in single turnover assays wastreated very carefully to minimize this problem. Such DNA samples were either reannealedimmediately prior to the assay, or carefully annealed, assessed for concentration, aliquotedinto small amounts, flash frozen in liquid nitrogen, stored at −20°C (in water), and used onlyonce after removing from the freezer. DNA was 5’ end labeled with 32P using T4polynucleotide kinase (New England Biolabs) and [γ-32P]-ATP (Perkin-Elmer, Inc.), andexcess ATP removed using G-30 spin columns (Biorad Laboratories, Inc.).
Binding AssaysFluorescence polarization anisotropy (FPA)
The equilibrium dissociation constant, KD, of SgrAI-DNA complexes was measured using afluorescence polarization anisotropy technique (FPA)12. DNA oligonucleotides (1 nM in 2ml binding buffer: 20 mM Tris-OAc (pH 8.0), 50 mM KOAc, 10 mM Ca(OAc)2, 1 mMDTT, 10% glycerol at 4°C) containing a fluorophore (HEX or FLO) ligated to the 5' end,were titrated with increasing amounts of SgrAI enzyme (1 nM – 1 µM), and the polarizationof the emitted fluorescence monitored. Excitation occurred at 537 nm (HEX) or 492 nm(FLO) in a PC1 (ISS) fluorimeter with T format, automatic polarizers and temperaturecontrol. The emitted intensities were measured using a 50.8 mm diameter 570 nm cut-onfilter with 580-2750 nm transmittance range (ThermoOriel Inc., no. 59510) and 1 mm slitwidths. The polarization of the emitted light as a function of added enzyme was fit to 1:1binding using Kaleidagraph software and the following12:
Park et al. Page 3
Biochemistry. Author manuscript; available in PMC 2011 October 19.
NIH
-PA Author Manuscript
NIH
-PA Author Manuscript
NIH
-PA Author Manuscript

where A is the polarization at a given protein concentration, Amax is the predictedpolarization of fully bound DNA, Amin is the polarization with no protein binding, PT is thetotal concentration of protein, OT is the total concentration of the DNA, and KD is thedissociation constant to be determined.
Gel shift—The gel shift assay13 was also used to measure binding affinities of SgrAI toDNA. DNA oligonucleotides were 5’ end labeled14 with 32P and held constant at aconcentration of 10 pM in 20 µl binding buffer (20 mM Tris-OAc (pH 8.0), 50 mM KOAc,10 mM Ca(OAc)2, 1 mM DTT, 10% glycerol at 4°C). Separate incubations were performedwith the DNA and varied concentrations of SgrAI enzyme (10 pM – 1 µM). Theseconcentrations were chosen carefully to give a well defined binding curve. Native PAGE (8–10% 19:1 or 29:1 acrylamide:bisacrylamide, 89 mM Tris, 89 mM boric acid, and 10 mMCa2+) was used to separate the bound and unbound DNA, as the DNA bound to SgrAI willhave reduced electrophoretic mobility. Care was taken to prevent heating of the gel, byrunning at 4°C at low voltage (190 V). The electrophoresis buffer (89 mM Tris, 89 mMboric acid, and 10 mM Ca2+) was recirculated during electrophoresis. Gels were loadedwhile undergoing electrophoresis at 300 V, and the voltage returned to 190 V five minutesafter the loading of the last sample. Gels were then subjected to electrophoresis for anadditional 2 hours at 4°C. Autoradiography of gels was performed without drying with aphosphor image plate exposed at 4°C for 12–17 hours. Densitometry of phosphor imageplates was performed with a Typhoon Scanner (GE Healthcare Life Sciences), andintegration using ImageQuant (GE Healthcare Life Sciences) or ImageJ15. The equilibriumdissociation constant, KD, was determined as above for the FPA measurements, usingnormalized values of the amount of shifted DNA for each concentration of SgrAI.
Single turnover DNA cleavage assays—Single turnover measurements of DNAcleavage were performed using chemical rapid quench techniques and 5' end 32P labeledoligonucleotide substrates (typically 1 nM), under conditions of excess enzyme (1 µM), withand without the addition of unlabeled DNA. All reactions were performed at 37°C in 20 mMTris-OAc (pH 8.0), 50 mM KOAc, 10 mM Mg(OAc)2, and 1 mM DTT. For sampling byhand, 5 µl aliquots were withdrawn at specific time intervals after mixing the enzyme andlabeled DNA (100 µl total reaction volume), quenched by addition to 5 µl of quench (80%formamide, 50 mM EDTA), and electrophoresed on 20% denaturing polyacrylamide (19:1acrylamide:bisacrylamide, 4 M urea, 89 mM Tris, 89 mM boric acid, 2 mM EDTA) gels.Autoradiography of gels was performed without drying with a phosphor image plateexposed at 4°C for 12–17 hours. Densitometry of phosphor image plates was performedwith a Typhoon Scanner (GE Healthcare Life Sciences), and integration using ImageQuant(GE Healthcare Life Sciences) or ImageJ15. The percent of product formed as a function oftime was determined by integrating both cleaved and uncleaved DNA bands. The singleturnover DNA cleavage rate constant was determined from the data using a singleexponential function:
where C1 is a constant fitting the baseline, C2 is the total percent of DNA predicted to becleaved by SgrAI, k is the rate constant, and t is the length of incubation in minutes. Toachieve time points faster than 10 seconds, a RQF-3 rapid quench flow instrument (KinTekInc.), was used according to a method modified from that of the instrument manual. Becausedilution of the samples was a concern using samples in the sample loops, the enzyme andDNA solutions were instead placed in the drive syringes A and B, respectively. Quenchsolution was used in the C syringe. For the reactions, loop 3 (40 µl) was used in a two steppush. Each step was made at 500 rpm (7,475 µl/sec) to ensure good mixing (Re = 11,900).
Park et al. Page 4
Biochemistry. Author manuscript; available in PMC 2011 October 19.
NIH
-PA Author Manuscript
NIH
-PA Author Manuscript
NIH
-PA Author Manuscript

Each step pushed 64 µl from each syringe (128 µl total). The reaction time was set by thetime between the two steps and was controlled by the instruments' computer. The step sizewas chosen such that the sample loop would be completely filled with one step and ejectedin the second step.
Native gel analysis of HMWS formation—Formation of HMWS was monitored usingnative PAGE and the method described above for gel shift measurements with the followingmodifications. The acrylamide composition was 8% 29:1 acrylamide:bisacrylamide, andsamples were prepared with 1 µM SgrAI, 1 nM 32P labeled DNA, and varied concentrationsof unlabeled DNA in binding buffer (20 mM Tris-OAc (pH 8.0), 50 mM KOAc, 10 mMCa(OAc)2, 1 nM DTT, 10% glycerol) in 20 µl. The effect of increased ionic strength wastested using buffers with varied concentrations (0–300 mM) of KOAc or NaCl in place ofthe 50 mM KOAc. Prepared samples were incubated for 30 minutes at 4°C prior toelectrophoresis. Integrated band intensities were normalized using the sum of the DNAbound species (DBD and HMWS) to determine the percent HMWS.
Sedimentation velocity—Sedimentation velocity experiments were performed in aBeckman Coulter XL-I equipped with monochrometer and interference scanning optics (632nm) using a Ti-50 rotor. Two sector sedimentation velocity cells were loaded withapproximately 400 µl sample containing 3 µM fluorophore labeled DNA with or without 6µM SgrAI in one sector, 425 µl buffer in the other. The buffers used in the measurementscontained 20 mM Tris-OAc (pH 8.0), 1 mM DTT, and either 50 mM KOAc or 150 mMNaCl and either 10 mM Ca(OAc)2 or 10 mM Mg(OAc)2. After sealing the cell, loading,balancing and installing the rotor, the system was allowed to equilibrate for at least 1 hourafter reaching the target temperature (4°C or 37°C). The sample was spun at 40,000 rpm(115,000 × g) and absorbance scans were taken at 495 nm (FLO-PCP) or 537nm(HEX-18-2) continuously, with a 0.003 cm step stize, until the last of the boundaries hadmoved to the bottom of the solution column (at least 12–17 hours). Data from the scans werefit to a sedimentation coefficient distribution, c(s), using the software SEDFIT16. The SgrAIdimer partial specific volume was calculated using SEDNTERP17. Only a single partialspecific volume can be used in the data analysis with SEDFIT, and that of the 1:1 SgrAIdimer:DNA duplex was used (calculated using a weighted, by their respective molecularweights, average of the partial specific volumes of the protein (0.74 ml/g) and DNA (0.55ml/g)). This same partial specific volume was also used in the analysis of data from samplescontaining only DNA, in order to allow for the assignment of the peaks corresponding to theunbound DNA in the SgrAI/DNA mixtures. Viscosities and densities were calculated usingSEDNTERP17. .Due to limited component selection, SEDNTERP calculations utilized theparameters of potassium sulfate, magnesium sulfate, and calcium chloride for potassiumacetate, magnesium acetate, and calcium acetate of the buffers. Calculated values for similarbuffers as used in these studies have been found to be within 1% error of the valuesmeasured experimentally using a Mettler-Toledo five place densitomer and Canon-Fenskeviscometer.
Sedimentation equilibrium—Sedimentation equilibrium experiments were performed asabove for sedimentation velocity with the following modifications. Samples (110 µl)containing varied concentrations of SgrAI (3–12 µM) and fluorophore labeled DNA (1.5–6µM) were loaded into three chambers of a six chamber centerpiece, with buffer occupyingthe remaining three. The system was allowed to equilibrate for at least 1 hour after reachingthe target temperature (4 or 37°C). Samples were then subjected to centrifugal speeds from4,000 to 18,000 rpm for a period of 72–96 hours. High resolution scans were made at 492nm (FLO-PCP) or 537 nm (HEX-18-2) every 4 hours, with a step size of 0.001 cm. Theestablishment of equilibrium was determined when a reasonable (<0.07) and constant
Park et al. Page 5
Biochemistry. Author manuscript; available in PMC 2011 October 19.
NIH
-PA Author Manuscript
NIH
-PA Author Manuscript
NIH
-PA Author Manuscript
RMSD was found between sequential scans. The data was analyzed using global fitting inSEDFIT16 with a single species. Density and partial specific volumes were determined asabove.
ResultsDNA binding assays
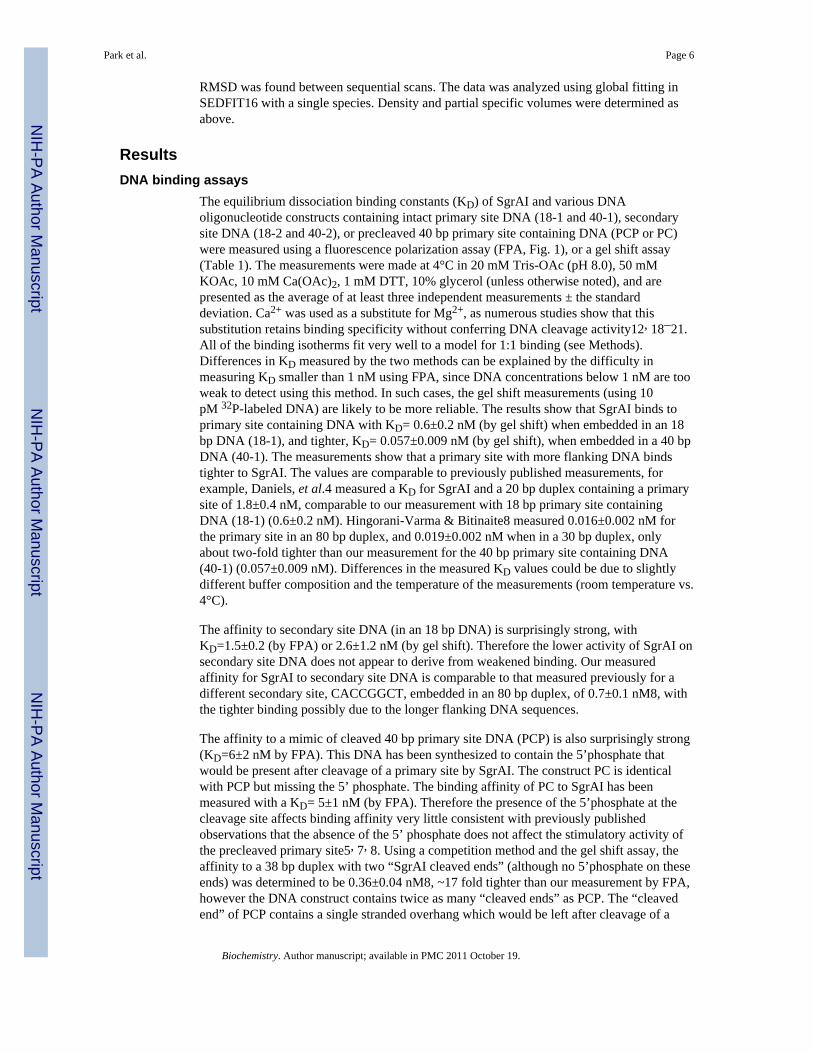
The equilibrium dissociation binding constants (KD) of SgrAI and various DNAoligonucleotide constructs containing intact primary site DNA (18-1 and 40-1), secondarysite DNA (18-2 and 40-2), or precleaved 40 bp primary site containing DNA (PCP or PC)were measured using a fluorescence polarization assay (FPA, Fig. 1), or a gel shift assay(Table 1). The measurements were made at 4°C in 20 mM Tris-OAc (pH 8.0), 50 mMKOAc, 10 mM Ca(OAc)2, 1 mM DTT, 10% glycerol (unless otherwise noted), and arepresented as the average of at least three independent measurements ± the standarddeviation. Ca2+ was used as a substitute for Mg2+, as numerous studies show that thissubstitution retains binding specificity without conferring DNA cleavage activity12, 18–21.All of the binding isotherms fit very well to a model for 1:1 binding (see Methods).Differences in KD measured by the two methods can be explained by the difficulty inmeasuring KD smaller than 1 nM using FPA, since DNA concentrations below 1 nM are tooweak to detect using this method. In such cases, the gel shift measurements (using 10pM 32P-labeled DNA) are likely to be more reliable. The results show that SgrAI binds toprimary site containing DNA with KD= 0.6±0.2 nM (by gel shift) when embedded in an 18bp DNA (18-1), and tighter, KD= 0.057±0.009 nM (by gel shift), when embedded in a 40 bpDNA (40-1). The measurements show that a primary site with more flanking DNA bindstighter to SgrAI. The values are comparable to previously published measurements, forexample, Daniels, et al.4 measured a KD for SgrAI and a 20 bp duplex containing a primarysite of 1.8±0.4 nM, comparable to our measurement with 18 bp primary site containingDNA (18-1) (0.6±0.2 nM). Hingorani-Varma & Bitinaite8 measured 0.016±0.002 nM forthe primary site in an 80 bp duplex, and 0.019±0.002 nM when in a 30 bp duplex, onlyabout two-fold tighter than our measurement for the 40 bp primary site containing DNA(40-1) (0.057±0.009 nM). Differences in the measured KD values could be due to slightlydifferent buffer composition and the temperature of the measurements (room temperature vs.4°C).
The affinity to secondary site DNA (in an 18 bp DNA) is surprisingly strong, withKD=1.5±0.2 (by FPA) or 2.6±1.2 nM (by gel shift). Therefore the lower activity of SgrAI onsecondary site DNA does not appear to derive from weakened binding. Our measuredaffinity for SgrAI to secondary site DNA is comparable to that measured previously for adifferent secondary site, CACCGGCT, embedded in an 80 bp duplex, of 0.7±0.1 nM8, withthe tighter binding possibly due to the longer flanking DNA sequences.
The affinity to a mimic of cleaved 40 bp primary site DNA (PCP) is also surprisingly strong(KD=6±2 nM by FPA). This DNA has been synthesized to contain the 5’phosphate thatwould be present after cleavage of a primary site by SgrAI. The construct PC is identicalwith PCP but missing the 5’ phosphate. The binding affinity of PC to SgrAI has beenmeasured with a KD= 5±1 nM (by FPA). Therefore the presence of the 5’phosphate at thecleavage site affects binding affinity very little consistent with previously publishedobservations that the absence of the 5’ phosphate does not affect the stimulatory activity ofthe precleaved primary site5, 7, 8. Using a competition method and the gel shift assay, theaffinity to a 38 bp duplex with two “SgrAI cleaved ends” (although no 5’phosphate on theseends) was determined to be 0.36±0.04 nM8, ~17 fold tighter than our measurement by FPA,however the DNA construct contains twice as many “cleaved ends” as PCP. The “cleavedend” of PCP contains a single stranded overhang which would be left after cleavage of a
Park et al. Page 6
Biochemistry. Author manuscript; available in PMC 2011 October 19.
NIH
-PA Author Manuscript
NIH
-PA Author Manuscript
NIH
-PA Author Manuscript

primary site by SgrAI, 5’-CCGG-3’, and also contains the phosphate at the 5’ end of thisoverhang to better mimic the naturally cleaved ends.
The affinity of SgrAI to PCP in buffer without glycerol (but with 10 mM Ca2+) wasmeasured with a KD=3±1 nM (by FPA), indicating that the 10% glycerol of the bindingbuffer also has little affect on the binding affinity. Since PCP cannot be cleaved further bySgrAI, the binding affinity to this DNA could also be measured in the presence of Mg2+,rather than Ca2+, and was found to have KD=14±4 nM (by FPA). Therefore, use of Ca2+ inplace of Mg2+ appears to have the effect of tightening the DNA binding affinity by ~3 fold.
Stoichiometric measurements were performed with SgrAI and the 18 bp DNA containingthe prinary site sequence (18-1), as well as the 18 bp DNA containing the secondary sitesequence (18- 2), using FPA or the gel shift method. In this method, 75-100 nM DNA istitrated with SgrAI until a break is seen (Fig. 2) giving the concentration of SgrAI dimerwhich fully saturates all binding sites on the DNA. The expected 1:1 binding is seen forsecondary site DNA using hexachlorofluoescein (HEX) labeled 18-2 and FPA (Fig. 2A),and 18-1 using 32P labeled 18-1 and the gel shift assay (Fig. 2B). However, two breaks areseen in the plot of polarization vs. SgrAI concentration with HEX labeled 18-1, one at 1:1binding, and one at 2:1 SgrAI dimers per 18-1 duplex (Fig. 2C). Hence a second dimer,binding more weakly than the first, appears to add to the SgrAI dimer/HEX-18-1 complex.The binding of additional SgrAI dimers to 1:1 saturated primary site has been seen before,also using FPA, although the second binding was not titrated to completion4.
All of the binding isotherms used to measure the KD (with 1 nM DNA), fit very well to amodel for 1:1 binding without cooperativity (Fig. 1), most likely indicating that theadditional SgrAI dimers do not bind at the low nanomolar concentrations of the SgrAI:DNAcomplex. The fit to the 1:1 binding model also suggests that only a single duplex of DNAbinds to one SgrAI binding site, which was surprising in the case of PCP, since twomolecules of PCP are equivalent to one complete primary site DNA. Since unbound SgrAIis dimeric under the conditions of the binding measurements (as determined by analyticalultracentrifugation4), the fit to 1:1 binding without any evidence of cooperativity couldmean that one molecule of PCP binds to one dimer of SgrAI. Alternatively, it could meanthat two molecules of PCP bind uncooperatively to the SgrAI dimer having two independentbinding sites, but this appears intuitively unlikely since the single stranded 5’-CCGG-3’overhangs would be expected to anneal in the enzyme binding site and therefore interactcooperatively. Still a third possibility is that SgrAI binds to one molecule of DNA,composed of two PCP molecules. Since the binding measurements were performed at 4°C,and the Tm of the single stranded overhangs of PCP, 5’-CCGG-3’, is calculated to be 16°C,the binding data determined at 4°C likely represents the binding of SgrAI to one molecule ofannealed PCP, comprised of two PCP molecules.
Characterization of HMWS using native gel electrophoresisWe have determined conditions to separate DNA bound dimers of SgrAI (DBD) from a highmolecular weight species (HMWS, Fig. 3) composed of SgrAI and DNA using nativepolyacrylamide gel electrophoresis at 4°C. The binding reactions were prepared in bindingbuffer (20 mM Tris-OAc (pH 8.0), 50 mM KOAc, 1 mM DTT, 10 mM Ca(OAc)2, and 10%glycerol) with 1 nM 32P labeled DNA and varied concentrations (typically 1 µM) SgrAI.Additional unlabeled DNA was added in these experiments, in the range of 1 – 3000 nM.Using the native PAGE, we observed two shifted bands, the faster moving band wasidentified as dimeric SgrAI bound to DNA (i.e., DBD), since analytical ultracentrifugation(see below and Daniels, et al.4) have shown that only DBD is formed with secondary siteDNA, and lane 9 in Fig. 3, mimicking the conditions used in the analyticalultracentrifugation, shows only this species. The HMWS is so named because it runs slower
Park et al. Page 7
Biochemistry. Author manuscript; available in PMC 2011 October 19.
NIH
-PA Author Manuscript
NIH
-PA Author Manuscript
NIH
-PA Author Manuscript

than DBD, however the exact composition of HMWS cannot be determined from the gel(see below for analytical ultracentrifugation of HMWS). Using this native gel assay we havediscovered that the formation of HMWS depends upon the concentration of DBD, as well asthe sequence of bound DNA. Only DBD form with 1 nM 32P labeled uncleaved DNA and 1µM SgrAI dimer, whether the DNA is the primary or secondary site DNA (lanes 2–3 and 7–8, Fig. 3), however, with primary site DNA at concentrations of 1 µM DNA (with 1 nM 32Plabeled DNA, and 1 µM SgrAI dimer), both DBD and HMWS are found (lane 4, Fig. 3).HMWS is never formed with only secondary site DNA, regardless of the concentration ofDNA or SgrAI (lanes 6–10, Fig. 3), or length (18 or 40 bp, Fig. 4C). However, HMWS willform with 1 nM 32P labeled secondary site DNA in the presence of 1 µM SgrAI and 1 µMunlabeled pre-cleaved 40 bp primary site DNA (PCP) (lane 18, Fig. 3). PCP binds withnanomolar affinity to SgrAI (Table 1), however at 50 nM SgrAI and 1 nM 32P labeled PCP,the complex appears to be too labile to form a shifted band (lane 12, Fig. 3). This could bedue to differences in the temperature at which the two measurements were performed; bothwere performed at 4°C, however local heating can occur in the gel during electrophoresis.PCP contains a 4 nucleotide self-complementary single stranded overhang (5’-CCGG-3’)that anneals to itself with a calculated Tm of 16°C to form a 40 bp duplex, which may bindtighter to SgrAI than the unannealed form. In addition, a band running more slowly than theDNA bound dimer appears at 1 µM SgrAI dimer and 1 nM 32P labeled PCP (lane 13, Fig.3), suggesting a propensity for additional SgrAI dimers to bind to the DNA bound dimer ofSgrAI (DBD) at these concentrations, as is seen with 1 µM SgrAI dimer and 1 nM 18 bpDNA containing the secondary site sequence (18-2) (lane 8, Fig. 3), and 1 nM 18 bp DNAcontaining the primary site sequence (18-1) when analyzed by FPA (see above). At 1 µMSgrAI dimer and 1 µM PCP (of which 1 nM is 32P labeled), only HMWS is observed (lane14, Fig. 3).
The precleaved 40 bp primary site containing DNA (PCP) induces HMWS with 1 nM 32Plabeled uncleaved primary site containing DNA (18-1, lane 16, Fig. 3) and with an 18 bpsecondary site containing DNA (18-2, lane 18, Fig. 3) in a concentration dependent manner(Fig. 4A–B). Side by side comparisons of HMWS formation on 32P labeled 18-1 (with 1 µMSgrAI) as a function of DNA concentration shows that PCP, 40-1, and 18-1 induce HMWSsimilarly (Fig. 4C). This is somewhat unexpected as one might expect that twice as muchprecleaved 40 bp primary site containing DNA (PCP) as uncleaved (40-1) would be requiredto induce the same amount of HMWS if two PCP bind to one dimer. This result mayindicate 1:1 binding of PCP to SgrAI dimer, or that SgrAI bound to PCP is better able tostimulate the HMWS.
The effect of increased ionic strength on the high molecular weight species (HMWS)stability was tested using increasing concentrations of either KOAc or NaCl in buffercontaining 20 mM Tris-OAc (pH8.0), 10 mM Ca(OAc)2, 10% glycerol, and 1 mM DTT(Fig. 5). The samples were electrophoresed at 4°C as described above after 30 minutesincubation at 4°C. Lanes 1 and 2 contain samples that mark the positions of unbound DNA(lane 1, containing 1 nM 32P labeled 18 bp primary site containing DNA (18-1) only) andDBD (DNA bound SgrAI dimer, lane 2, containing 1 nM 32P- 18-1 and 1 µM SgrAI).Samples loaded into lanes 3–16 each contained 1 nM 32P labeled 18-1, 1 µM SgrAI and 1µM precleaved 40 bp primary site containing DNA (PC) in the different buffer conditions,and all lanes show a clear HMWS band. The samples loaded into lanes 3 and 10 containedno added KOAc or NaCl, while lanes 4–9 contain samples incubated in buffer withincreasing concentration of KOAc from 50 mM to 300 mM, in 50 mM increments.Similarly, lanes 11–16 show the results from samples containing increasing concentrationsof NaCl, from 50–300 mM. Clearly, the higher salt concentrations of the incubation bufferdo not eliminate the appearance of the HMWS.
Park et al. Page 8
Biochemistry. Author manuscript; available in PMC 2011 October 19.
NIH
-PA Author Manuscript
NIH
-PA Author Manuscript
NIH
-PA Author Manuscript

Analytical UltracentrifugationUsing fluorophore labeled DNA and both the sedimentation equilibrium and velocitymethods, we have been able to characterize SgrAI/DNA complexes formed with secondarysite DNA and precleaved 40 bp primary site containing DNA (Fig. 6–7). Figure 6A showsthe data from sedimentation equilibrium of 7 µM SgrAI and 3.6 µM fluorophore labeled 18bp secondary site containing DNA (HEX-18-2) in binding buffer without glycerol (20 mMTris-OAc, 50 mM KOAc, 10 mM Ca(OAc)2, 1 mM DTT) at 4°C. The binding buffercontains Ca2+ which inhibits DNA cleavage by SgrAI. A global fit to a single species usingdata from two speeds (13,500 rpm and 18,000 rpm) and two concentrations of SgrAI/DNA(7.0 µM/3.6 µM and 5.4 µM/2.7 µM) resulted in a molecular weight of 90.7 kDa, very closeto the calculated molecular weight of the DNA bound SgrAI dimer (DBD, 87.5 kDa).Hence, SgrAI forms only DBD with this secondary site DNA. The excess SgrAI was addedin these experiments to ensure complete binding of the fluorophore labeled DNA, yet thefitted molecular weight from the data indicates that additional SgrAI dimers did not bind tothe DNA bound SgrAI dimer (DBD). Figure 6B shows the c(s) distribution from thesedimentation velocity experiment performed in the same buffer and same temperature asthe sedimentation equilibrium experiment shown in Figure 6A, with either HEX-18-2 alone(3 µM, dotted line, Fig. 6B) or with SgrAI (6 µM, solid line, Fig. 6B). The DNA alone hasan s value of 2.2 s, while that in the presence of SgrAI occurs at 5.2 s. Since thesedimentation equilibrium data indicate that the SgrAI/HEX-18-2 complex is predominantlyin the form of the DNA bound SgrAI dimer (DBD), the 5.2 s peak must correspond to theDBD.
Figure 7A shows the result of sedimentation equilibrium experiments performed at threedifferent speeds with 3 µM SgrAI and 1.5 µM fluorophore labeled precleaved 40 bp primarysite containing DNA (FLO-PCP) in the buffer used for the DNA cleavage assays (20 mMTris-OAc, 50 mM KOAc, 10 mM Mg(OAc)2, 1 mM DTT) and at 37°C. Data was alsocollected at two other concentrations of SgrAI (6 and 12 µM) and DNA (3 and 6 µM), andthe same three speeds. Again, excess SgrAI enzyme was included to ensure completebinding of the fluorophore labeled DNA. The line in Figure 7A (upper panel) corresponds toa fit for a single species of approximately 732 kDa, derived from global fitting of all of thedata. The residuals between the fits and the data are shown in the lower panel of Figure 7A.Clear trends in the residuals can be seen indicating a poor fit of the single species model tothe data, hence the SgrAI/FLO-PCP complexes must be heterogeneous. In addition, theraised baseline of the data suggests the presence of significantly smaller species that are notsedimented significantly at these speeds (likely the unbound DNA).
Figure 7B shows the c(s) distribution from the sedimentation velocity measurement of either3 µM FLO-PCP DNA only (blue line, Fig. 7B), or with 6 µM SgrAI (red line, Fig. 7B), inthe same buffer conditions and temperature as the sedimentation equilibrium experiment ofFigure 7A. In addition, the sedimentation of a SgrAI/FLO-PCP mixture in a buffer withhigher ionic strength (150 mM NaCl in place of the 50 mM KOAc) (black line, Fig. 7B) wasalso analyzed. The data from the FLO-PCP DNA only sample (blue line, Fig. 7B) marks thesedimentation of the free DNA, the peaks with sedimentation coefficients less than 4 s. The5–6 s peaks, more prevalent in the lower ionic strength buffer (red line, Fig. 7B), is similarin sedimentation coefficient to the DNA bound SgrAI dimer (DBD) seen with secondary siteDNA in Fig. 6B (5.2 s). A shoulder is found with higher s values adjacent to this peak,which may indicate additional species, however the predominant SgrAI bound DNA speciesruns with s values of either 15 or 20 s, depending on the ionic strength of the buffer. The svalue of this species is consistent with the large molecular weights derived from thesedimentation equilibrium measurements, and therefore corresponding to the HMWS.
Park et al. Page 9
Biochemistry. Author manuscript; available in PMC 2011 October 19.
NIH
-PA Author Manuscript
NIH
-PA Author Manuscript
NIH
-PA Author Manuscript

Single turnover DNA cleavage assaysSingle turnover DNA cleavage rate constants were measured by mixing solutions of 32Plabeled DNA (1 nM) with a solution of enzyme (typically 1 µM) at 37°C, in buffersupporting DNA cleavage containing 10 mM Mg2+ (20 mM mM Tris-OAc, 50 mM KOAc,10 mM Mg(OAc)2, 1 mM DTT). Some reactions were also performed at 4°C. The amountof DNA cleaved with time was measured by quenching aliquots of the reaction mixtures atdifferent times after mixing the SgrAI enzyme with the DNA, separating cleaved fromuncleaved DNA via denaturing PAGE, and quantitating by autoradiography. The amount ofcleaved DNA was normalized (using either the total intensity of the lane, or the sum of theamount of cleaved and uncleaved DNA in the same lane), then plotted vs. time. UnlabeledDNA was added in some reactions to test for its stimulatory capacity, and was added to thesolution with the labeled DNA prior to mixing with the enzyme solution. The resultingsingle turnover rate constants measured for DNA cleavage of various sequences by SgrAIare presented in Table 2. Most data fit well (R>0.99) to a single exponential equation (seeMethods), while the data with 0.9 µM 40 bp uncleaved primary site DNA (40-1) (Table 2)required two exponential functions in order to fit the data. The total amount of the labeledDNA that was cleaved in each reaction varied, in some cases due to the melting of theduplex into single strands (which are not cleavable by SgrAI) as a consequence of repeatedfreeze-thawing of the labeled DNA stock solution. However, the amount of secondary siteDNA cleaved did show a systematic trend where a greater fraction was cleaved withincreasing amounts of added unlabeled precleaved 40 bp primary site containing DNA(PCP). The percent of the DNA cleaved was then very carefully measured in triplicate, insingle turnover reactions performed simultaneously.
The rate constants for cleavage of primary site DNA embedded in constructs with differentamounts of flanking DNA, 18-1 and 40-1, are very similar: 0.094±0.015 min−1 and0.14±0.05 min−1, respectively. The rate constant for cleavage of secondary site DNA (18-2),in the absence of added precleaved 40 bp primary site containing DNA (PCP), was only ~5fold smaller than that for primary site DNA (18-1): 0.020±0.006 min−1. Added PCPincreased the rate constant for cleavage of 1 nM 32P labeled primary site (18-1)dramatically, from 0.094 min−1 to >20 min−1 with 1 µM PCP, a rate too fast to measure byhand. Using a quench flow instrument, this rate constant was measured as 22±7 min−1,representing a >200 fold increase. Similarly, added 40-1 (0.9 µM) also stimulated cleavageof 1 nM 32P labeled primary site (18-1 or 40-1), to a rate too fast to measure by hand, >20min−1, although only a portion of the total amount of cleaved DNA was cleaved with anaccelerated rate. In contrast, added unlabeled 18-1 (0.9 µM) did not stimulate primary siteDNA cleavage by SgrAI (at 37°C), and neither did unlabeled 0.9 µM 40-2 (0.16±0.06min−1), the secondary site embedded in the same oligonucleotide as 40-1.
The cleavage of secondary site DNA (18-2) was also stimulated by added precleaved 40 bpprimary site containing DNA (PCP), from 0.020±0.006 min−1 in the absence of PCP, to0.05±0.01 min−1 in the presence of 1 µM PCP, an increase by a factor of ~2.5. Moresignificantly, the percentage of the secondary site DNA cleaved by SgrAI was very low inthe absence of PCP, and is increased, from about 2% to ~24% with 1 µM PCP. The totalamount of DNA cleaved reaches a maximum at ~25% cleavage rather than 100%, mostlikely due to the dissociation of duplex DNA into single strands during freezing for storageof the DNA.
Cleavage reactions were also performed at 4°C with 1 nM 32P labeled 18 bp primary siteDNA (18-1) and 1 µM SgrAI, in the presence or absence of the addition of 0.9 µMunlabeled DNA, either 18-1 or precleaved 40 bp primary site DNA (PC, as in PCP withoutthe 5’phosphate at the cleavage site). No cleavage of the labeled DNA was detected in theabsence of the additional DNA, even after 21 hours, suggesting a rate constant less than
Park et al. Page 10
Biochemistry. Author manuscript; available in PMC 2011 October 19.
NIH
-PA Author Manuscript
NIH
-PA Author Manuscript
NIH
-PA Author Manuscript
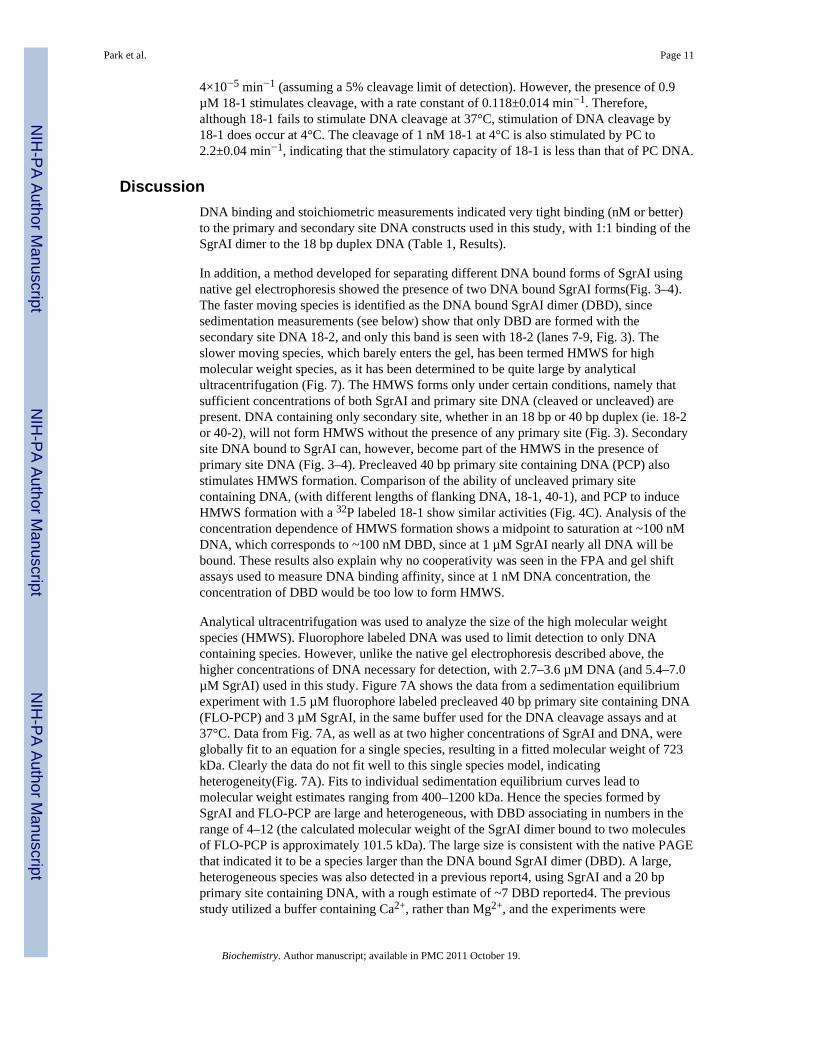
4×10⁻⁵ min−1 (assuming a 5% cleavage limit of detection). However, the presence of 0.9µM 18-1 stimulates cleavage, with a rate constant of 0.118±0.014 min−1. Therefore,although 18-1 fails to stimulate DNA cleavage at 37°C, stimulation of DNA cleavage by18-1 does occur at 4°C. The cleavage of 1 nM 18-1 at 4°C is also stimulated by PC to2.2±0.04 min−1, indicating that the stimulatory capacity of 18-1 is less than that of PC DNA.
DiscussionDNA binding and stoichiometric measurements indicated very tight binding (nM or better)to the primary and secondary site DNA constructs used in this study, with 1:1 binding of theSgrAI dimer to the 18 bp duplex DNA (Table 1, Results).
In addition, a method developed for separating different DNA bound forms of SgrAI usingnative gel electrophoresis showed the presence of two DNA bound SgrAI forms(Fig. 3–4).The faster moving species is identified as the DNA bound SgrAI dimer (DBD), sincesedimentation measurements (see below) show that only DBD are formed with thesecondary site DNA 18-2, and only this band is seen with 18-2 (lanes 7-9, Fig. 3). Theslower moving species, which barely enters the gel, has been termed HMWS for highmolecular weight species, as it has been determined to be quite large by analyticalultracentrifugation (Fig. 7). The HMWS forms only under certain conditions, namely thatsufficient concentrations of both SgrAI and primary site DNA (cleaved or uncleaved) arepresent. DNA containing only secondary site, whether in an 18 bp or 40 bp duplex (ie. 18-2or 40-2), will not form HMWS without the presence of any primary site (Fig. 3). Secondarysite DNA bound to SgrAI can, however, become part of the HMWS in the presence ofprimary site DNA (Fig. 3–4). Precleaved 40 bp primary site containing DNA (PCP) alsostimulates HMWS formation. Comparison of the ability of uncleaved primary sitecontaining DNA, (with different lengths of flanking DNA, 18-1, 40-1), and PCP to induceHMWS formation with a 32P labeled 18-1 show similar activities (Fig. 4C). Analysis of theconcentration dependence of HMWS formation shows a midpoint to saturation at ~100 nMDNA, which corresponds to ~100 nM DBD, since at 1 µM SgrAI nearly all DNA will bebound. These results also explain why no cooperativity was seen in the FPA and gel shiftassays used to measure DNA binding affinity, since at 1 nM DNA concentration, theconcentration of DBD would be too low to form HMWS.
Analytical ultracentrifugation was used to analyze the size of the high molecular weightspecies (HMWS). Fluorophore labeled DNA was used to limit detection to only DNAcontaining species. However, unlike the native gel electrophoresis described above, thehigher concentrations of DNA necessary for detection, with 2.7–3.6 µM DNA (and 5.4–7.0µM SgrAI) used in this study. Figure 7A shows the data from a sedimentation equilibriumexperiment with 1.5 µM fluorophore labeled precleaved 40 bp primary site containing DNA(FLO-PCP) and 3 µM SgrAI, in the same buffer used for the DNA cleavage assays and at37°C. Data from Fig. 7A, as well as at two higher concentrations of SgrAI and DNA, wereglobally fit to an equation for a single species, resulting in a fitted molecular weight of 723kDa. Clearly the data do not fit well to this single species model, indicatingheterogeneity(Fig. 7A). Fits to individual sedimentation equilibrium curves lead tomolecular weight estimates ranging from 400–1200 kDa. Hence the species formed bySgrAI and FLO-PCP are large and heterogeneous, with DBD associating in numbers in therange of 4–12 (the calculated molecular weight of the SgrAI dimer bound to two moleculesof FLO-PCP is approximately 101.5 kDa). The large size is consistent with the native PAGEthat indicated it to be a species larger than the DNA bound SgrAI dimer (DBD). A large,heterogeneous species was also detected in a previous report4, using SgrAI and a 20 bpprimary site containing DNA, with a rough estimate of ~7 DBD reported4. The previousstudy utilized a buffer containing Ca2+, rather than Mg2+, and the experiments were
Park et al. Page 11
Biochemistry. Author manuscript; available in PMC 2011 October 19.
NIH
-PA Author Manuscript
NIH
-PA Author Manuscript
NIH
-PA Author Manuscript
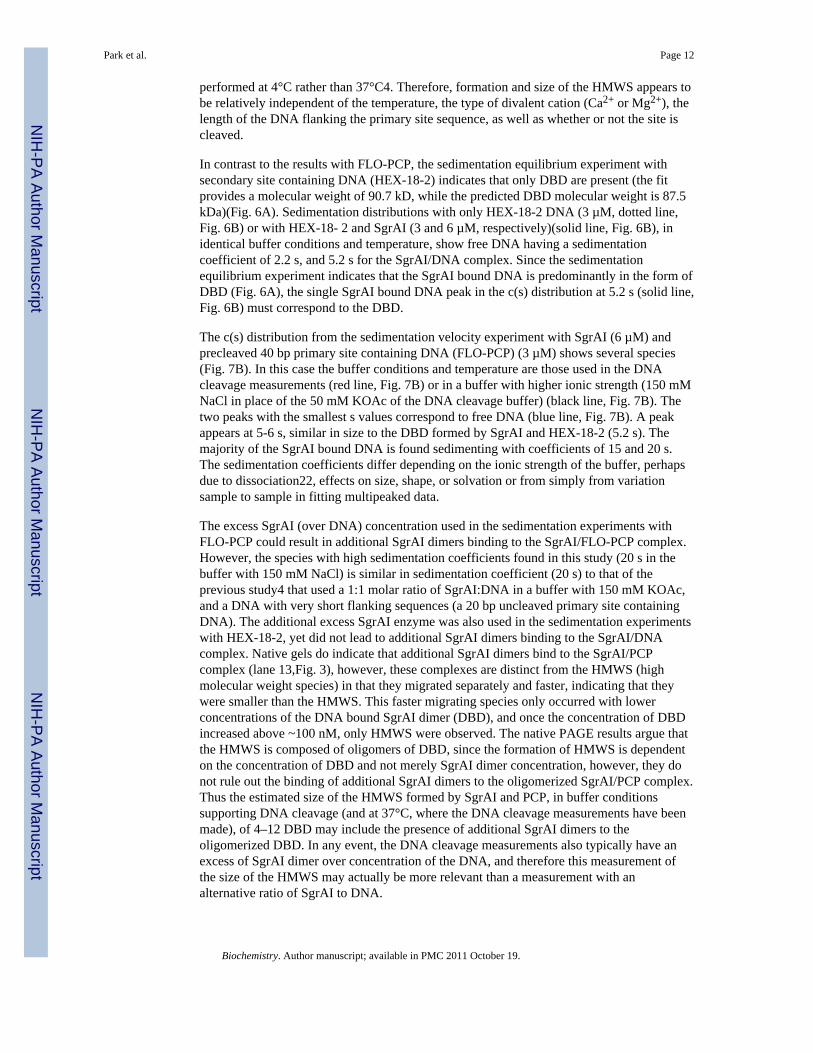
performed at 4°C rather than 37°C4. Therefore, formation and size of the HMWS appears tobe relatively independent of the temperature, the type of divalent cation (Ca2+ or Mg2+), thelength of the DNA flanking the primary site sequence, as well as whether or not the site iscleaved.
In contrast to the results with FLO-PCP, the sedimentation equilibrium experiment withsecondary site containing DNA (HEX-18-2) indicates that only DBD are present (the fitprovides a molecular weight of 90.7 kD, while the predicted DBD molecular weight is 87.5kDa)(Fig. 6A). Sedimentation distributions with only HEX-18-2 DNA (3 µM, dotted line,Fig. 6B) or with HEX-18- 2 and SgrAI (3 and 6 µM, respectively)(solid line, Fig. 6B), inidentical buffer conditions and temperature, show free DNA having a sedimentationcoefficient of 2.2 s, and 5.2 s for the SgrAI/DNA complex. Since the sedimentationequilibrium experiment indicates that the SgrAI bound DNA is predominantly in the form ofDBD (Fig. 6A), the single SgrAI bound DNA peak in the c(s) distribution at 5.2 s (solid line,Fig. 6B) must correspond to the DBD.
The c(s) distribution from the sedimentation velocity experiment with SgrAI (6 µM) andprecleaved 40 bp primary site containing DNA (FLO-PCP) (3 µM) shows several species(Fig. 7B). In this case the buffer conditions and temperature are those used in the DNAcleavage measurements (red line, Fig. 7B) or in a buffer with higher ionic strength (150 mMNaCl in place of the 50 mM KOAc of the DNA cleavage buffer) (black line, Fig. 7B). Thetwo peaks with the smallest s values correspond to free DNA (blue line, Fig. 7B). A peakappears at 5-6 s, similar in size to the DBD formed by SgrAI and HEX-18-2 (5.2 s). Themajority of the SgrAI bound DNA is found sedimenting with coefficients of 15 and 20 s.The sedimentation coefficients differ depending on the ionic strength of the buffer, perhapsdue to dissociation22, effects on size, shape, or solvation or from simply from variationsample to sample in fitting multipeaked data.
The excess SgrAI (over DNA) concentration used in the sedimentation experiments withFLO-PCP could result in additional SgrAI dimers binding to the SgrAI/FLO-PCP complex.However, the species with high sedimentation coefficients found in this study (20 s in thebuffer with 150 mM NaCl) is similar in sedimentation coefficient (20 s) to that of theprevious study4 that used a 1:1 molar ratio of SgrAI:DNA in a buffer with 150 mM KOAc,and a DNA with very short flanking sequences (a 20 bp uncleaved primary site containingDNA). The additional excess SgrAI enzyme was also used in the sedimentation experimentswith HEX-18-2, yet did not lead to additional SgrAI dimers binding to the SgrAI/DNAcomplex. Native gels do indicate that additional SgrAI dimers bind to the SgrAI/PCPcomplex (lane 13,Fig. 3), however, these complexes are distinct from the HMWS (highmolecular weight species) in that they migrated separately and faster, indicating that theywere smaller than the HMWS. This faster migrating species only occurred with lowerconcentrations of the DNA bound SgrAI dimer (DBD), and once the concentration of DBDincreased above ~100 nM, only HMWS were observed. The native PAGE results argue thatthe HMWS is composed of oligomers of DBD, since the formation of HMWS is dependenton the concentration of DBD and not merely SgrAI dimer concentration, however, they donot rule out the binding of additional SgrAI dimers to the oligomerized SgrAI/PCP complex.Thus the estimated size of the HMWS formed by SgrAI and PCP, in buffer conditionssupporting DNA cleavage (and at 37°C, where the DNA cleavage measurements have beenmade), of 4–12 DBD may include the presence of additional SgrAI dimers to theoligomerized DBD. In any event, the DNA cleavage measurements also typically have anexcess of SgrAI dimer over concentration of the DNA, and therefore this measurement ofthe size of the HMWS may actually be more relevant than a measurement with analternative ratio of SgrAI to DNA.
Park et al. Page 12
Biochemistry. Author manuscript; available in PMC 2011 October 19.
NIH
-PA Author Manuscript
NIH
-PA Author Manuscript
NIH
-PA Author Manuscript

The single turnover rate constants for DNA cleavage of the primary site in the two differentlength duplexes (18-1 and 40-1) and with a secondary site DNA (18-2) were measured(Table 2). The reactions were performed at 37°C (unless otherwise specified) with 10 mMMg2+ (rather than Ca2+) and in the absence of glycerol, but the buffer components wereotherwise the same as those for the FPA and native PAGE, The concentration of SgrAI inthe measurements was 1 µM, to ensure complete saturation of the 32P labeled DNA, whichwas 1 nM at the initiation of the reactions. The rate constants for cleavage of the primarysite DNAs were found to be similar, 0.094±0.015 min−1 and 0.14±0.05 min−1 for 18-1 and40-1, respectively, indicating that the added flanking DNA of 40-1 does not greatlyinfluence the DNA cleavage rate constant. These numbers compare well to a previouslypublished single turnover cleavage rate constant on plasmids with single primary sites4, 0.04min−1. The rate constant for cleavage of the secondary site, 18-2, was measured to be0.020±0.006 min−1 (Table 2), only five fold slower than that of the primary site in the samelength DNA. This rate constant is similar to that found using steady state kinetics for asecondary site in an 80 bp duplex8, 0.012 min−1. Cleavage of both primary and secondarysite DNA was found to be stimulated under the conditions of the assay, by the addition ofprimary site DNA (40-1, PCP) with sufficient flanking sequences. Both 40-1 and PCP(precleaved 40 bp primary site containing DNA) stimulated cleavage of 18-1 by 1 µM SgrAIto a rate constant >20 min−1, too fast to measure by hand. The rate constant was measuredby quench flow as 22±7 min−1 (with 1 µM PCP), a stimulatory factor of >200 fold.Stimulation of cleavage of 20 and 30 bp oligonucleotides with primary and secondary siteshas been observed previously, using a 30 bp oligonucleotide with a primary site sequence,although rate constants were not reported7. Surprisingly, the 18-1 DNA could not stimulateits own cleavage (at 37°C), even at 0.9 µM (and 1 µM SgrAI), similar to that reported usinga 20 bp primary site duplex4. The requirement for sufficient flanking DNA to providestimulation was seen in a previous study7, as well as the ability of both uncleaved andcleaved primary site to stimulate DNA cleavage by SgrAI5, 7, 8. Flanking DNA itselfhowever is not sufficient, as a construct with the same flanking DNA but a secondary, ratherthan a primary site, (40-2), did not stimulate DNA cleavage (at a concentration of 0.9 µMwith 1 µM SgrAI) (Table 3). Previous measurements of DNA cleavage under stimulatedconditions at 37°C include a single turnover DNA cleavage rate constant measured with aplasmid containing two recognition sites4 of 0.5–0.7 min−1, and with an 80 bp duplex usingsteady state kinetics8 2.4 min−1, and the same duplex but added precleaved primary sitecontaining DNA 16.2 min−1 (using steady state kinetics). Our measurement of themaximally stimulated primary site DNA cleavage by SgrAI compares best to the latterexample.
The stimulation of primary site DNA cleavage increased with increasing concentration ofadded precleaved 40 bp primary site containing DNA (PCP) by at least 200 fold, however,stimulation of secondary site DNA increased by only ~2.5 fold, to 0.05±0.01 min−1. Thisvalue is similar to that found by Wood, et al.7, in the single turnover cleavage of secondarysites on plasmid DNA with primary sites, 0.08 min−1. However more significantly, theoverall percent of secondary site DNA that was cleaved by the end of the reaction was muchgreater with higher concentrations of PCP. The total amount of DNA cleaved appears toreach a maximum at only 24%, probably due to a majority of it being single stranded afterrepeated freeze-thaw of the labeled DNA. In the absence of PCP, only 2%, or 10% of thefinal fully cleavable amount, is cleaved by SgrAI. The stimulated rate constants for cleavageof the secondary site we measure, 0.05±0.01 min−1, is 5 times slower than that measuredusing steady state kinetics with an 80 bp duplex (0.35 min−1)8, however, a differentsecondary site sequence was used in our study (CACCGGGG compared to CACCGGCT).
The effects of buffer conditions such as ionic strength, temperature, and divalent cationcofactor were tested on the high molecular weight species (HMWS) formation using either
Park et al. Page 13
Biochemistry. Author manuscript; available in PMC 2011 October 19.
NIH
-PA Author Manuscript
NIH
-PA Author Manuscript
NIH
-PA Author Manuscript

the native gel electrophoresis analysis or the sedimentation velocity method. First, theformation of HMWS at 4°C analyzed using the native gel electrophoresis assay withsamples incubated in buffers containing 10 mM Ca2+ and either 0–300 mM KOAc or 0-300mM NaCl (Fig. 5) showed that HMWS formed with radiolabeled 18 bp DNA containing theprimary site sequence (18-1) and precleaved 40 bp primary site containing DNA (PC) wasstable at all ionic strengths tested. Hence the HMWS is not an artifact of low ionic strength.Sedimentation velocity experiments carried out at 37°C with 10 mM Mg2+, 6 µM SgrAI and3 µM fluorophore labeled precleaved 40 bp primary site containing DNA (FLO-PCP) inbuffer containing either 50 mM KOAc or 150 mM NaCl (Fig. 7B) show changes in thecentering of the peak designated as HMWS, indicating altered sedimentation coefficients,again, the higher ionic strength does not eliminate the presence of the HMWS. In addition,the fact that HMWS was detected in the sedimentation experiments performed with Mg2+,and at 37°C (Fig. 7) show that the HMWS is not an artifact of Ca2+ or temperature (4°C)used in the native gel electrophoresis assays.
In a previous study, steady state kinetic measurements of the cleavage of 80 bp DNAconstructs containing primary or secondary site DNA showed Hill coefficients of 2–48.These Hill coefficients are reduced to ~1 when an added pre-cleaved primary site DNA isadded, supporting the cooperativity on DNA concentration in enhancing DNA cleavage. Thecooperativity seen with secondary site DNA, in the absence of any primary site DNA, mayappear contradictory to the results presented here that show no DNA cleavage stimulation insingle turnover cleavage assays by the addition of secondary site DNA. However, uponcleavage of secondary site DNA, two cleaved ends are produced, one of which is exactly thesame as a cleaved primary site. With multiple enzyme turnovers, as in the steady statekinetic assay, these species can accumulate to sufficient concentrations to influence thereaction kinetics. Therefore, the cooperativity seen in the steady state kinetics withsecondary site DNA and the lack of stimulation by secondary site DNA seen in the currentwork are consistent if the species mediating the cooperativity in the steady state kinetics isthe product of secondary site DNA cleavage.
The self-activation of DNA cleavage by SgrAI implies allostery, where at a minimum a lowand high activity conformation exist in an equilibrium that can be shifted by the interactionwith an allosteric effector. The fact that the addition of pre-cleaved 40 bp primary sitecontaining DNA (PCP) can enhance the DNA cleavage rate by SgrAI suggests the existenceof more than one DNA binding site on the functional SgrAI molecule. Type II restrictionendonucleases typically bind to duplex DNA as dimers, in a 1:1 complex, however severaltype II restriction endonucleases form tetramers in solution, and bind to two DNA duplexes.SgrAI shares amino acid sequence similarity and DNA cleavage sequence similarity withthree such enzymes: NgoMIV, Cfr10I, and Bse634I, therefore it was reasonable to considerthat SgrAI might also form a tetramer with two DNA binding sites under activatingconditions. Analytical ultracentrifugation of the SgrAI enzyme showed it to exist as a dimerin solution in the absence of DNA4; with DNA it formed a 1:1 complex of SgrAI dimer toDNA duplex that appeared to aggregate into a very large species, large enough toaccommodate at least seven SgrAI dimers bound to duplex DNA4. Still, the model forSgrAI activity included slow cleavage of DNA by SgrAI dimers, and association of dimersbound to cleaved DNA with other dimers bound to uncleaved DNA to form an activatedtetramer4, 7, 8. The activated tetramer conformation is predicted by the model to exhibitvery fast cleavage of DNA. In addition, the activated DNA bound dimers could dissociatefrom the tetramer and associate with other DNA bound dimers thus activating them, andhence a chain reaction would result in the overall observed accelerated DNA cleavage rate.The addition of precleaved primary site DNA presumably accelerated the rate of DNAcleavage by inducing the activated conformation and stimulating dimers to form tetramerswith the activated conformation. Structural studies reported to date show a dimer of SgrAI
Park et al. Page 14
Biochemistry. Author manuscript; available in PMC 2011 October 19.
NIH
-PA Author Manuscript
NIH
-PA Author Manuscript
NIH
-PA Author Manuscript

bound to a single duplex of primary site containing DNA (the 18-1 construct used in thisstudy), which is considered to be in a low activity conformation9. A structure of theactivated conformation has not yet been reported, and no direct data exists to support atetrameric form of SgrAI as the activated species.
Native PAGE and analytical ultracentrifugation were successful in unambiguouslydemonstrating the presence of DNA bound species of SgrAI larger than dimers (Fig. 3–5,Fig. 7). Identified as high molecular weight species (HMWS) on native gels, thesedimentation measurements indicate that HMWS composed of SgrAI and PCP isheterogeneous containing possibly as many as 4–12 DNA bound SgrAI dimers (DBD). Wefound that formation of the HMWS species by SgrAI is dependent on DNA sequence(requiring the primary site sequence), dependent on the concentration of DNA bound SgrAIdimer (DBD) (forming significantly with DBD of 100 nM or higher in our assays), and canform with either cleaved or uncleaved primary site containing DNA. We also found thatHMWS formation did not depend on the divalent cation or temperature used in the assays,as HMWS is observed in assays with either Ca2+ or Mg2+, and at both 4°C and 37°C.Initially we used the pre-cleaved primary site (PCP) DNA to induce HMWS and to stimulateDNA cleavage, although later determined that uncleaved 40 bp primary site containing DNA(40-1) can also induce HMWS. We found that added PCP stimulated both HMWS formation(in 10 mM Ca2+ or Mg2+, 4°C) and DNA cleavage (10 mM Mg2+, 37°C) with 1 nMuncleaved (primary or secondary site) DNA at similar concentrations of PCP (100–1000nM). Since both DNA cleavage activity and the oligomerization of DBD into HMWS aredependent on the concentrations of added PCP, we propose that the HMWS is the activated(or activatable) form of the enzyme. Activation by oligomerization is a very unusualmechanism, although has been proposed in one other system, that of Acetyl-CoAcarboxylase23.
The simplest model of DNA cleavage by SgrAI includes two conformations of SgrAI, a lowactivity form, and a high activity form. In such a model, intermediate rate constants forDNA cleavage should not occur, since there are no conformations with intermediate levelsof activation. Instead, in cases where only a subset of the total population of enzymes isstimulated, the amount of cleaved DNA with time would be the sum of that from twoindependent first order processes from the two enzyme states, and therefore the data ofcleaved DNA with time should fit to two exponential functions. This was true in the assayswith 0.9 µM 40 bp primary site containing DNA (40-1), where a portion of the labeled DNAwas cleaved at a much stimulated rate, and a portion cleaved at the lower, unstimulated rate.However, the experimental data using precleaved 40 bp primary site containing DNA (PCP)as the stimulating DNA is best fit not with multiple exponential functions, but rather only asingle. The measured rate constants increase with the concentration of added PCP, such thatwith intermediate concentrations of PCP, intermediate values of the rate constant areexhibited (Table 2). If the rate constants measure the actual rate of the chemical step in DNAcleavage, they then indicate that intermediate levels of enzyme activation exist. However,because these first order rate constants vary with the concentration of added PCP, they couldalso be pseudo-first order rate constants for a second order process that is dependent on PCPconcentration, which occurs prior to DNA cleavage. For example, the binding of DNA toSgrAI, or the association of the SgrAI dimer bound to 32P labeled 18 bp primary sitecontaining DNA (18-1) with SgrAI dimers bound to PCP. The association of DNA bindingproteins with DNA is typically very fast24, therefore the association of the DNA bounddimers could be the second order process that governs the observed kinetics. In the case ofthe cleavage of the secondary site DNA, the observed kinetics appear more like thecontributions from two enzyme states, one that is completely inactive, and another that has amaximal rate of cleavage that is similar to the slow cleavage rate of primary site DNA.Roughly the same cleavage rate constant is measured in the absence and presence of
Park et al. Page 15
Biochemistry. Author manuscript; available in PMC 2011 October 19.
NIH
-PA Author Manuscript
NIH
-PA Author Manuscript
NIH
-PA Author Manuscript
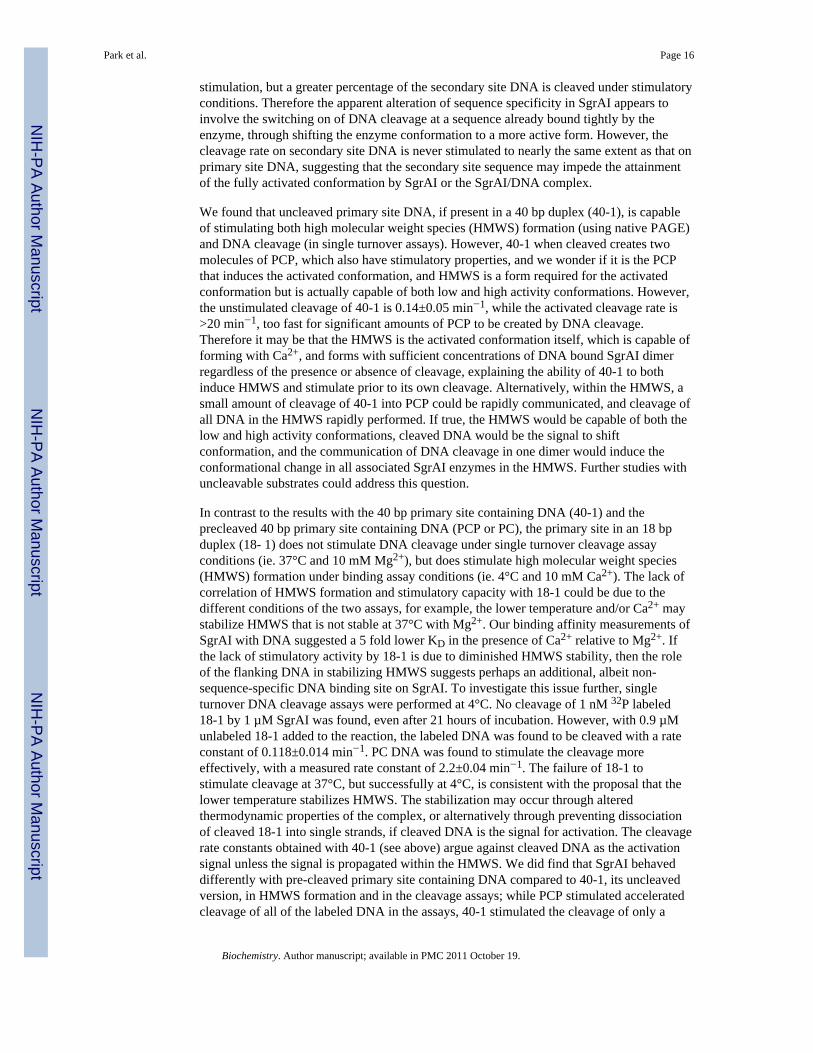
stimulation, but a greater percentage of the secondary site DNA is cleaved under stimulatoryconditions. Therefore the apparent alteration of sequence specificity in SgrAI appears toinvolve the switching on of DNA cleavage at a sequence already bound tightly by theenzyme, through shifting the enzyme conformation to a more active form. However, thecleavage rate on secondary site DNA is never stimulated to nearly the same extent as that onprimary site DNA, suggesting that the secondary site sequence may impede the attainmentof the fully activated conformation by SgrAI or the SgrAI/DNA complex.
We found that uncleaved primary site DNA, if present in a 40 bp duplex (40-1), is capableof stimulating both high molecular weight species (HMWS) formation (using native PAGE)and DNA cleavage (in single turnover assays). However, 40-1 when cleaved creates twomolecules of PCP, which also have stimulatory properties, and we wonder if it is the PCPthat induces the activated conformation, and HMWS is a form required for the activatedconformation but is actually capable of both low and high activity conformations. However,the unstimulated cleavage of 40-1 is 0.14±0.05 min−1, while the activated cleavage rate is>20 min−1, too fast for significant amounts of PCP to be created by DNA cleavage.Therefore it may be that the HMWS is the activated conformation itself, which is capable offorming with Ca2+, and forms with sufficient concentrations of DNA bound SgrAI dimerregardless of the presence or absence of cleavage, explaining the ability of 40-1 to bothinduce HMWS and stimulate prior to its own cleavage. Alternatively, within the HMWS, asmall amount of cleavage of 40-1 into PCP could be rapidly communicated, and cleavage ofall DNA in the HMWS rapidly performed. If true, the HMWS would be capable of both thelow and high activity conformations, cleaved DNA would be the signal to shiftconformation, and the communication of DNA cleavage in one dimer would induce theconformational change in all associated SgrAI enzymes in the HMWS. Further studies withuncleavable substrates could address this question.
In contrast to the results with the 40 bp primary site containing DNA (40-1) and theprecleaved 40 bp primary site containing DNA (PCP or PC), the primary site in an 18 bpduplex (18- 1) does not stimulate DNA cleavage under single turnover cleavage assayconditions (ie. 37°C and 10 mM Mg2+), but does stimulate high molecular weight species(HMWS) formation under binding assay conditions (ie. 4°C and 10 mM Ca2+). The lack ofcorrelation of HMWS formation and stimulatory capacity with 18-1 could be due to thedifferent conditions of the two assays, for example, the lower temperature and/or Ca2+ maystabilize HMWS that is not stable at 37°C with Mg2+. Our binding affinity measurements ofSgrAI with DNA suggested a 5 fold lower KD in the presence of Ca2+ relative to Mg2+. Ifthe lack of stimulatory activity by 18-1 is due to diminished HMWS stability, then the roleof the flanking DNA in stabilizing HMWS suggests perhaps an additional, albeit non-sequence-specific DNA binding site on SgrAI. To investigate this issue further, singleturnover DNA cleavage assays were performed at 4°C. No cleavage of 1 nM 32P labeled18-1 by 1 µM SgrAI was found, even after 21 hours of incubation. However, with 0.9 µMunlabeled 18-1 added to the reaction, the labeled DNA was found to be cleaved with a rateconstant of 0.118±0.014 min−1. PC DNA was found to stimulate the cleavage moreeffectively, with a measured rate constant of 2.2±0.04 min−1. The failure of 18-1 tostimulate cleavage at 37°C, but successfully at 4°C, is consistent with the proposal that thelower temperature stabilizes HMWS. The stabilization may occur through alteredthermodynamic properties of the complex, or alternatively through preventing dissociationof cleaved 18-1 into single strands, if cleaved DNA is the signal for activation. The cleavagerate constants obtained with 40-1 (see above) argue against cleaved DNA as the activationsignal unless the signal is propagated within the HMWS. We did find that SgrAI behaveddifferently with pre-cleaved primary site containing DNA compared to 40-1, its uncleavedversion, in HMWS formation and in the cleavage assays; while PCP stimulated acceleratedcleavage of all of the labeled DNA in the assays, 40-1 stimulated the cleavage of only a
Park et al. Page 16
Biochemistry. Author manuscript; available in PMC 2011 October 19.
NIH
-PA Author Manuscript
NIH
-PA Author Manuscript
NIH
-PA Author Manuscript
portion. However recent structural studies of SgrAI bound to cleaved primary site DNAargue against cleaved primary site itself as the stimulatory signal25, this structure containsthe 18 bp primary site DNA and the SgrAI-DNA complex is in the DNA bound dimer form.Structural characterization of the HMWS will be key to understanding the origin of theactivation signal.
The unusual DNA cleavage activity of SgrAI may be a consequence of the large genome ofS. griseus, from which it is derived. Restriction endonucleases are coexpressed with amethyltransferase enzyme having the same sequence specificity, which functions to protectthe host genome from the cleavage activity of the endonuclease. Hence the SgrAImethyltransferase must methylate all SgrAI recognition sequences within the genome beforecleavage by the endonuclease can occur, and this requirement may be difficult due to thelarge size of the genome (over 8 million bp). The relatively long sequence recognized bySgrAI, 8 bp versus the usual 4–6, may have evolved due to this pressure, since the longersequence greatly reduces the number of sites to be methylated in the host DNA. In addition,the inherently low cleavage activity of SgrAI in the absence of cleaved primary site DNAalso reduces the pressure on host DNA, as well as the methyltransferase enzyme. However,such a long recognition sequence will also occur far less frequently in the phage DNA, andhence place selective pressure on the enzyme for increased activity in order for adequateprotection of the host from phage infection. It appears that one way in which the SgrAIenzyme activity is increased is through the stimulation of its cleavage activity. Another wayis through its secondary site cleavage activity, which will induce more cleavages in thephage DNA than at the primary sites alone, and hence could better protect the host. Thesesecondary sites of the host are normally protected from SgrAI cleavage activity, sincecleavable primary sites are required to induce secondary site cleavage, and primary sites areprotected by methylation in the host. However, activation of SgrAI by invading phage couldresult in cleavage of the host DNA, in addition to phage DNA, at the secondary sites.Therefore, the formation of aggregates, or oligomers, of DNA bound dimers may have animportant role in sequestering activated SgrAI on the phage DNA and away from the hostgenomic DNA.
AcknowledgmentsThis work was supported by the National Institutes of Health [GM066805 to NCH] and the Howard HughesMedical Institute [number 52005889 to the University of Arizona supporting MIG) We also acknowledge theAnalytical Biophysics Core Facility at the University of Arizona for the analytical ultracentrifugation data and itsinterpretation.
Abbreviations
DBD DNA bound SgrAI dimer
DTT dithiothreitol
EDTA ethylenediaminetetraacetic acid
FLO fluorescein moiety
FPA fluorescence polarization anisotropy
HEX hexachlorofluorescein moiety
HMWS high molecular weight species
OAc acetate
PAGE polyacrylamide gel electrophoresis
Park et al. Page 17
Biochemistry. Author manuscript; available in PMC 2011 October 19.
NIH
-PA Author Manuscript
NIH
-PA Author Manuscript
NIH
-PA Author Manuscript
PC pre-cleaved primary site DNA without 5’end at the cleavage sitephosphorylated
PCP pre-cleaved primary site DNA with 5’end at the cleavage site phosphorylated
RMSD root mean square deviation
References1. Pingoud A, Fuxreiter M, Pingoud V, Wende W. Type II restriction endonucleases: structure and
function. Cell. Mol. Life Sci. 2005; 62:685–707. [PubMed: 15770420]2. Tautz N, Kaluza K, Frey B, Jarsch M, Schmitz GG, Kessler C. SgrAI, a novel class- II restriction
endonuclease from Streptomyces griseus recognizing the octanucleotide sequence 5' - CR/CCGGYG-3' [corrected]. Nucleic Acids Res. 1990; 18(10):3087. [PubMed: 2161521]
3. Bilcock DT, Daniels LE, Bath AJ, Halford SE. Reactions of type II restriction endonucleases with8-base pair recognition sites. J Biol Chem. 1999; 274(51):36379–36386. [PubMed: 10593932]
4. Daniels LE, Wood KM, Scott DJ, Halford SE. Subunit assembly for DNA cleavage by restrictionendonuclease SgrAI. J Mol Biol. 2003; 327(3):579–591. [PubMed: 12634054]
5. Bitinaite J, Schildkraut I. Self-generated DNA termini relax the specificity of SgrAI restrictionendonuclease. Proceedings of the National Academy of Sciences of the United States of America.2002; 99(3):1164–1169. [PubMed: 11818524]
6. Pingoud A, Jeltsch A. Structure and function of type II restriction endonucleases. Nucleic AcidsRes. 2001; 29(18):3705–3727. [PubMed: 11557805]
7. Wood KM, Daniels LE, Halford SE. Long-range communications between DNA sites by thedimeric restriction endonuclease SgrAI. J Mol Biol. 2005; 350(2):240–253. [PubMed: 15923010]
8. Hingorani-Varma K, Bitinaite J. Kinetic analysis of the coordinated interaction of SgrAI restrictionendonuclease with different DNA targets. J Biol Chem. 2003; 278(41):40392–40399. [PubMed:12851384]
9. Dunten PW, Little EJ, Gregory MT, Manohar VM, Dalton M, Hough D, Bitinaite J, Horton NC. Thestructure of SgrAI bound to DNA; recognition of an 8 base pair target. Nucleic Acids Res. 2008;36:5405–5416. [PubMed: 18701646]
10. Aggarwal AK. Crystallization of DNA binding proteins with oligodeoxynucleotides. Methods: ACompanion to Methods in Enzymology. 1990; 1:83–90.
11. Fasman, GD. CRC Handbook of Biochemistry and Molecular Biology. 3rd ed.. Cleveland, OH:CRC; 1975.
12. Reid SL, Parry D, Liu HH, Connolly BA. Binding and recognition of GATATC target sequencesby the EcoRV restriction endonuclease: a study using fluorescent oligonucleotides andfluorescence polarization. Biochemistry. 2001; 40(8):2484–2494. [PubMed: 11327870]
13. Carey J. Gel retardation. Methods Enzymol. 1991; 208:103–117. [PubMed: 1779832]14. Sambrook, J.; Fritsch, EF.; Maniatis, T. Molecular cloning : a laboratory manual. 2nd ed.. Cold
Spring Harbor, N.Y.: Cold Spring Harbor Laboratory; 1989. p. 3v15. Abramoff MD. Image Processing with ImageJ. Biophotonics International. 2009; 11(7):36–42.16. Schuck P. Size-distribution analysis of macromolecules by sedimentation velocity
ultracentrifugation and lamm equation modeling. Biophys J. 2000; 78(3):1606–1619. [PubMed:10692345]
17. Laue, TM.; Shah, BD.; Ridgeway, TM.; Pelletier, SL. Computer-aided interpretation of analyticalsedimentation data for proteins. In: Harding, SE.; Rowe, AJ.; Horton, JC., editors. AnalyticalUltracentrifugation in Biochemistry and Polymer Science. Cambridge [UK]: Royal Society ofChemistry; 1992. p. 90-125.
18. Vipond IB, Halford SE. Specific DNA recognition by EcoRV restriction endonuclease induced bycalciumions. Biochemistry. 1995; 34(4):1113–1119. [PubMed: 7827059]
Park et al. Page 18
Biochemistry. Author manuscript; available in PMC 2011 October 19.
NIH
-PA Author Manuscript
NIH
-PA Author Manuscript
NIH
-PA Author Manuscript
19. Martin AM, Horton NC, Lusetti S, Reich NO, Perona JJ. Divalent metal dependence of site-specific DNA binding by EcoRV endonuclease. Biochemistry. 1999; 38(26):8430–8439.[PubMed: 10387089]
20. Etzkorn C, Horton NC. Ca2+ binding in the active site of HincII: implications for the catalyticmechanism. Biochemistry. 2004; 43(42):13256–13270. [PubMed: 15491133]
21. Joshi HK, Etzkorn C, Chatwell L, Bitinaite J, Horton NC. Alteration of sequence specificity of thetype II restriction endonuclease HincII through an indirect readout mechanism. J Biol Chem. 2006;281(33):23852–23869. [PubMed: 16675462]
22. Schuck P. Diffusion of the reaction boundary of rapidly interacting macromolecules insedimentation velocity. Biophys J. 98(11):2741–2751. [PubMed: 20513419]
23. Brownsey RW, Boone AN, Elliott JE, Kulpa JE, Lee WM. Regulation of acetyl- CoA carboxylase.Biochem Soc Trans. 2006; 34(Pt 2):223–227. [PubMed: 16545081]
24. Halford SE. An end to 40 years of mistakes in DNA-protein association kinetics? Biochem SocTrans. 2009; 37(Pt 2):343–348. [PubMed: 19290859]
25. Little EJ, Dunten PW, Bitinaite J, Horton NC. Structures of SgrAI Bound to Cleaved Primary SiteDNA and Uncleaved Secondary Site DNA. Submitted for publication. 2010
Park et al. Page 19
Biochemistry. Author manuscript; available in PMC 2011 October 19.
NIH
-PA Author Manuscript
NIH
-PA Author Manuscript
NIH
-PA Author Manuscript
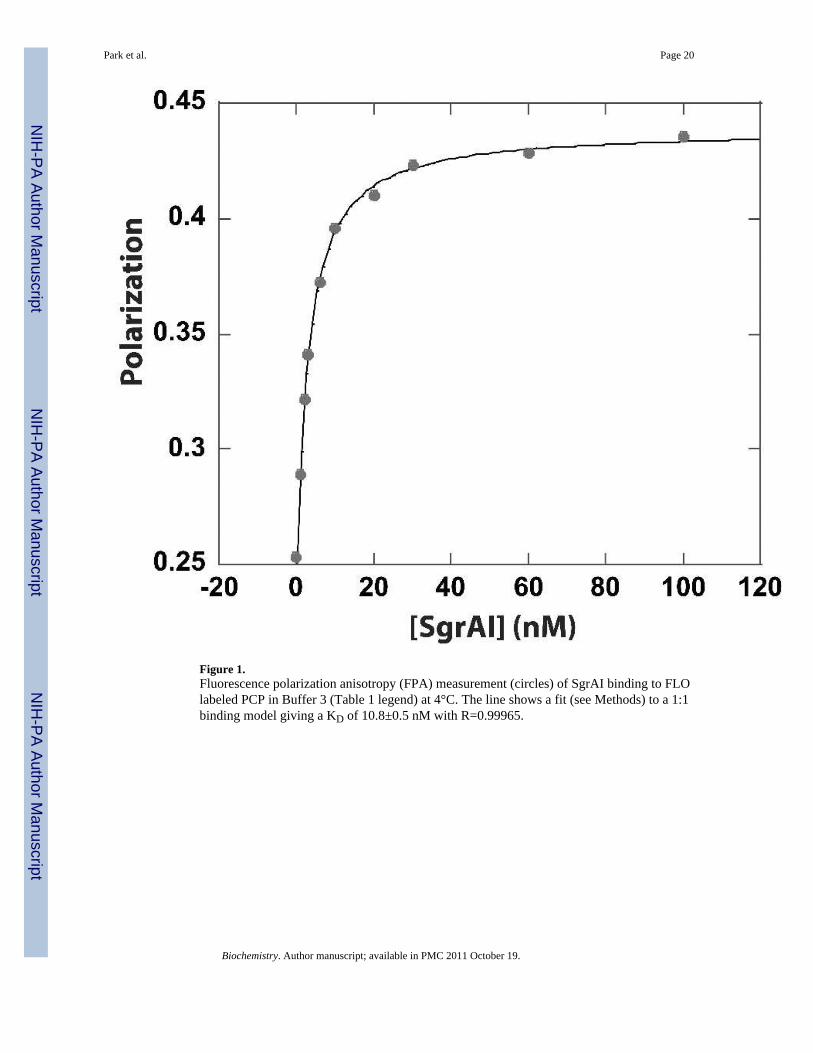
Figure 1.Fluorescence polarization anisotropy (FPA) measurement (circles) of SgrAI binding to FLOlabeled PCP in Buffer 3 (Table 1 legend) at 4°C. The line shows a fit (see Methods) to a 1:1binding model giving a KD of 10.8±0.5 nM with R=0.99965.
Park et al. Page 20
Biochemistry. Author manuscript; available in PMC 2011 October 19.
NIH
-PA Author Manuscript
NIH
-PA Author Manuscript
NIH
-PA Author Manuscript
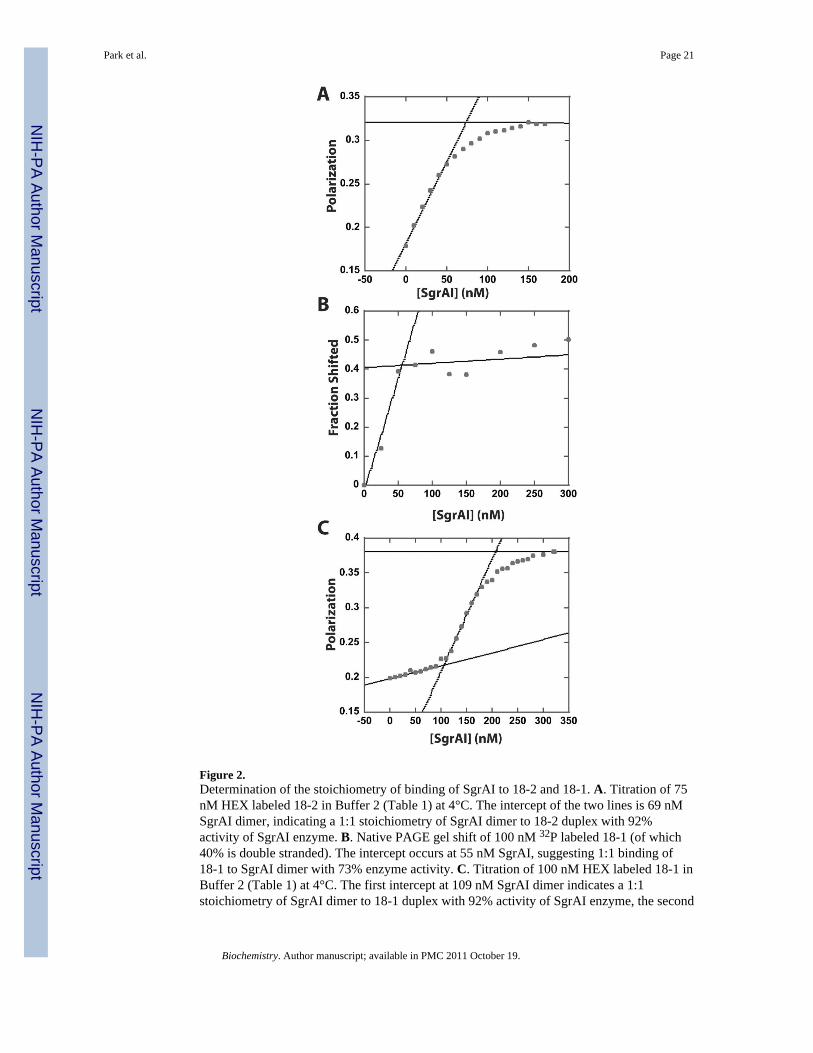
Figure 2.Determination of the stoichiometry of binding of SgrAI to 18-2 and 18-1. A. Titration of 75nM HEX labeled 18-2 in Buffer 2 (Table 1) at 4°C. The intercept of the two lines is 69 nMSgrAI dimer, indicating a 1:1 stoichiometry of SgrAI dimer to 18-2 duplex with 92%activity of SgrAI enzyme. B. Native PAGE gel shift of 100 nM 32P labeled 18-1 (of which40% is double stranded). The intercept occurs at 55 nM SgrAI, suggesting 1:1 binding of18-1 to SgrAI dimer with 73% enzyme activity. C. Titration of 100 nM HEX labeled 18-1 inBuffer 2 (Table 1) at 4°C. The first intercept at 109 nM SgrAI dimer indicates a 1:1stoichiometry of SgrAI dimer to 18-1 duplex with 92% activity of SgrAI enzyme, the second
Park et al. Page 21
Biochemistry. Author manuscript; available in PMC 2011 October 19.
NIH
-PA Author Manuscript
NIH
-PA Author Manuscript
NIH
-PA Author Manuscript

intercept at 207 nM SgrAI dimer indicates a second SgrAI dimer binds the original 1:1complex.
Park et al. Page 22
Biochemistry. Author manuscript; available in PMC 2011 October 19.
NIH
-PA Author Manuscript
NIH
-PA Author Manuscript
NIH
-PA Author Manuscript

Figure 3.Autoradiogram of native PAGE with 1 nM 32P labeled DNA as indicated and variedadditions including 1 µM unlabeled 18-1, 18-2, or PCP DNA (+), 50 nM SgrAI dimer (+),and/or 1 µM SgrAI dimer (++). HMWS: high molecular weight species, DBD: DNA bounddimer, *: DBD bound to one or more additional SgrAI dimers.
Park et al. Page 23
Biochemistry. Author manuscript; available in PMC 2011 October 19.
NIH
-PA Author Manuscript
NIH
-PA Author Manuscript
NIH
-PA Author Manuscript

Figure 4.Native gel electrophoresis of 1 nM 32P labeled 18 bp DNA and 1 µM SgrAI dimer andvaried concentrations of unlabeled DNA. A. 1 nM 32P labeled primary site (18-1) withadded unlabeled PCP (10, 30, 60, 100, 200, 300, 400, 500, 600, 1000 nM). B. 1 nM 32Plabeled secondary site (18-2) with added unlabeled PCP (10, 30, 60, 100, 200, 300, 400,500, 600, 1000 nM). C. Plot of percent of DNA (1 nM 32P-18-1) bound species with 1 µMSgrAI found in HMWS vs. concentration of added unlabeled PCP (open circles), 40-1 (openboxes), 18-1 (filled circles), or 40-2 (filled boxes).
Park et al. Page 24
Biochemistry. Author manuscript; available in PMC 2011 October 19.
NIH
-PA Author Manuscript
NIH
-PA Author Manuscript
NIH
-PA Author Manuscript

Figure 5.Native gel electrophoresis of samples in binding buffer containing KOAc or NaClconcentrations from 0 – 300 mM. All samples contain 1 nM 32P-18-1 DNA, 1 µM SgrAI,and 1 µM PC DNA with the exception of that loaded in lane 1, which contains onlythe 32P-18-1, and lane 2, which contains 32P-18-1 and SgrAI. All samples were incubated inbuffer containing 20 mM Tris-OAc (pH 8.0), 10 mM Ca(OAc)2, 10% glycerol and 1 mMDTT and varied concentrations of KOAc (lanes 4-9, with 50, 100, 150, 200, 250, 300 mMrespectively) or NaCl (lanes 11–16, with 50, 100, 150, 200, 250, 300 mM respectively).Samples loaded in lanes 1–3 and 10 contain no KOAc or NaCl.
Park et al. Page 25
Biochemistry. Author manuscript; available in PMC 2011 October 19.
NIH
-PA Author Manuscript
NIH
-PA Author Manuscript
NIH
-PA Author Manuscript
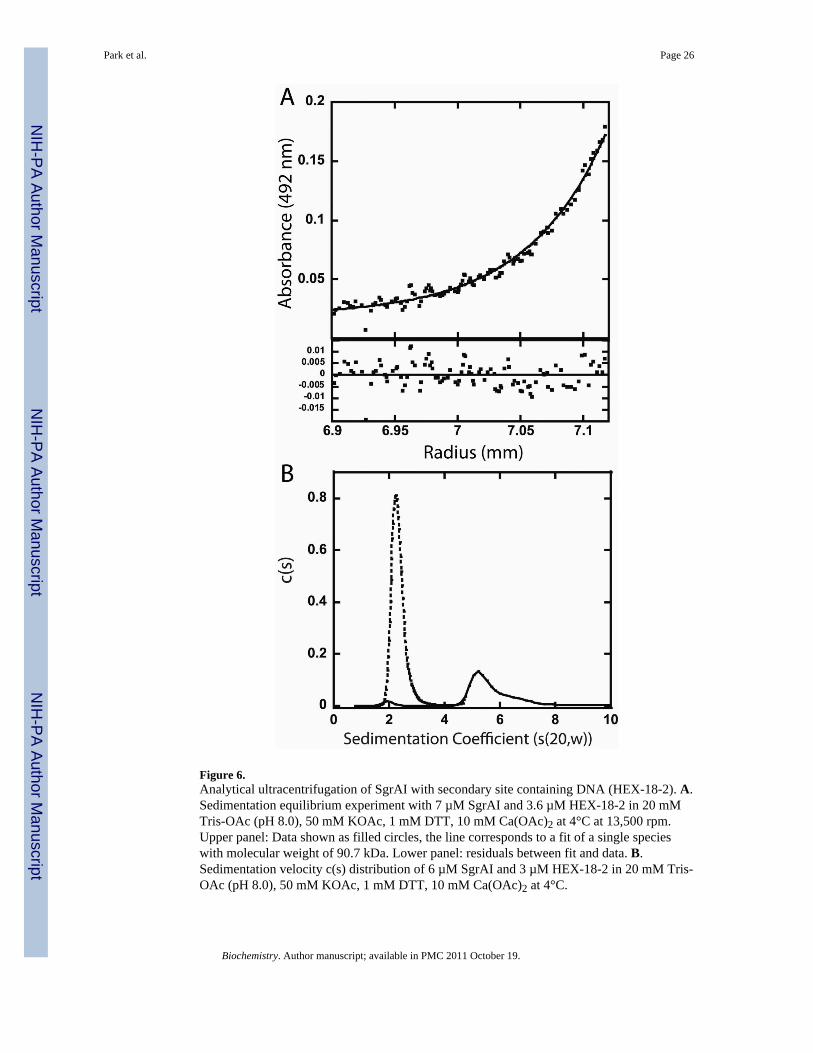
Figure 6.Analytical ultracentrifugation of SgrAI with secondary site containing DNA (HEX-18-2). A.Sedimentation equilibrium experiment with 7 µM SgrAI and 3.6 µM HEX-18-2 in 20 mMTris-OAc (pH 8.0), 50 mM KOAc, 1 mM DTT, 10 mM Ca(OAc)2 at 4°C at 13,500 rpm.Upper panel: Data shown as filled circles, the line corresponds to a fit of a single specieswith molecular weight of 90.7 kDa. Lower panel: residuals between fit and data. B.Sedimentation velocity c(s) distribution of 6 µM SgrAI and 3 µM HEX-18-2 in 20 mM Tris-OAc (pH 8.0), 50 mM KOAc, 1 mM DTT, 10 mM Ca(OAc)2 at 4°C.
Park et al. Page 26
Biochemistry. Author manuscript; available in PMC 2011 October 19.
NIH
-PA Author Manuscript
NIH
-PA Author Manuscript
NIH
-PA Author Manuscript
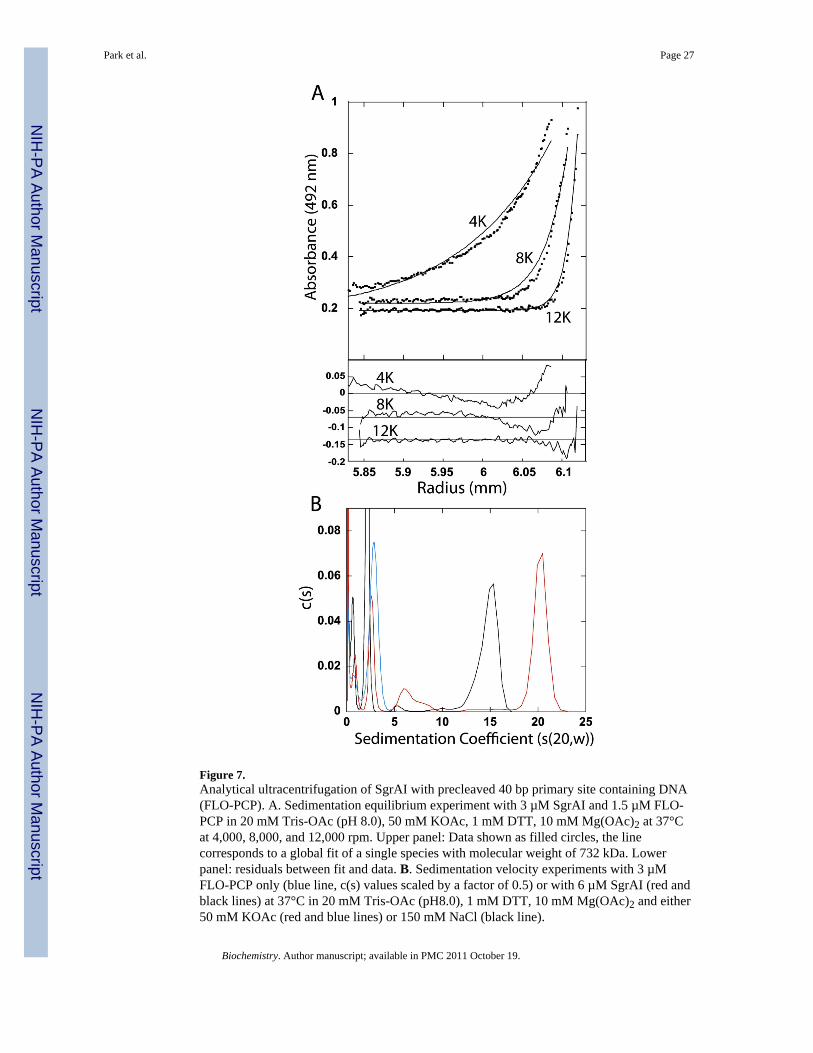
Figure 7.Analytical ultracentrifugation of SgrAI with precleaved 40 bp primary site containing DNA(FLO-PCP). A. Sedimentation equilibrium experiment with 3 µM SgrAI and 1.5 µM FLO-PCP in 20 mM Tris-OAc (pH 8.0), 50 mM KOAc, 1 mM DTT, 10 mM Mg(OAc)2 at 37°Cat 4,000, 8,000, and 12,000 rpm. Upper panel: Data shown as filled circles, the linecorresponds to a global fit of a single species with molecular weight of 732 kDa. Lowerpanel: residuals between fit and data. B. Sedimentation velocity experiments with 3 µMFLO-PCP only (blue line, c(s) values scaled by a factor of 0.5) or with 6 µM SgrAI (red andblack lines) at 37°C in 20 mM Tris-OAc (pH8.0), 1 mM DTT, 10 mM Mg(OAc)2 and either50 mM KOAc (red and blue lines) or 150 mM NaCl (black line).
Park et al. Page 27
Biochemistry. Author manuscript; available in PMC 2011 October 19.
NIH
-PA Author Manuscript
NIH
-PA Author Manuscript
NIH
-PA Author Manuscript

NIH
-PA Author Manuscript
NIH
-PA Author Manuscript
NIH
-PA Author Manuscript
Park et al. Page 28
Table 1
Equilibrium dissociation constants for 1µM wild type SgrAI dimer and DNA sequences at 4°C.
DNAa Bufferb KDc (nM)FPA
KDc (nM)
Gel shift
18-1 1 2.5±0.9 0.6±0.2
18-2 1 1.5±0.2 2.6±1.2
40-1 1 0.9±0.2 0.057±0.009
PCP 1 6±2 ND
PC 1 5±1 ND
PCP 2 3±1 ND
PCP 3 14±4 ND
aFPA utilized HEX labeled 18-1, 40-1, 18-2 and FLO labeled PCP, and PC.
bBuffer 1: 20 mM Tris-Acetate (pH 8.0), 50 mM KOAc, 10 mM Ca(OAc)2, 1 mM DTT, 10% glycerol.
Buffer 2: 20 mM Tris-Acetate (pH 8.0), 50 mM KOAc, 10 mM Ca(OAc) 2, 1 mM DTT.Buffer 3: 20 mM Tris-Acetate (pH 8.0), 50 mM KOAc, 10 mM Mg(OAc) 2, 1 mM DTT.
cEquilibrium dissociation constants, KD given as the average of at least three different measurements ± the standard deviation, and assuming 1:1
binding.
Biochemistry. Author manuscript; available in PMC 2011 October 19.

NIH
-PA Author Manuscript
NIH
-PA Author Manuscript
NIH
-PA Author Manuscript
Park et al. Page 29
Table 2
Single turnover DNA cleavage rate constants using 1 µM SgrAI and 37°C (unless otherwise noted)
32P labeledDNA
(1 nM)
Conc. Added unlabeled DNA WT SgrAI Rateconstant (min−1)
1° site(18-1, 18 bp)
0 0.094±0.015
10 nM PCP 0.18±0.06
100 nM PCP 0.30±0.03
1 µM PCP >20
1 µM PCP (QF) 22±7
2 µM PCP >20
0.9 µM 18-1 0.063±0.006
0.9 µM 40-1 10.0±1.4 (56±2%)0.032±0.012 (44±2%)
0.9 µM 40-2 0.16±0.06
0, 4°C <4×10⁻⁵b
0.9 µM 18-1, 4°C 0.118±0.014
0.9 µM PC, 4°C 2.2±0.04
1° site (40-1, 40 bp) 0 0.14±0.05
0.9 µM 40-1 >20 (22±9%)0.024±0.008 (78±9%)
2° site (18-2, 18 bp) 0 0.020±0.006(2.8%±0.6%)
10 nM PCP 0.012±0.001a
(3.4%±0.1%) a
100 nM PCP 0.016±0.005(19%±5%)
1 µM PCP 0.05±0.01(24%±1%)
aOnly 2 repetitions.
QF=measurement made in the Kintek RQF-3 Rapid Quench Flow Instrument.
bNo cutting detected after 21 hours of incubation. Rate constant estimated assuming 5% cleavage or less after 21 hours.
Biochemistry. Author manuscript; available in PMC 2011 October 19.
Copyright © 2022 FDOKUMEN