Photo-induced double-strand DNA and site-specific protein cleavage activity of l-histidine...
12
PAPER www.rsc.org/dalton | Dalton Transactions Photo-induced double-strand DNA and site-specific protein cleavage activity of L-histidine (l-oxo)diiron(III) complexes of heterocyclic bases† Mithun Roy, a Tuhin Bhowmick, b Ramkumar Santhanagopal, a Suryanarayana Ramakumar b and Akhil R. Chakravarty* a Received 21st January 2009, Accepted 26th March 2009 First published as an Advance Article on the web 27th April 2009 DOI: 10.1039/b901337g Three oxo-bridged diiron(III) complexes of L-histidine and heterocyclic bases [Fe 2 (m-O)(L-his) 2 (B) 2 ]- (ClO 4 ) 2 (1–3), where B is 2,2¢-bipyridine (bpy), 1,10-phenanthroline (phen), dipyrido[3,2-d :2¢,3¢-f ]- quinoxaline (dpq), were prepared and characterized. The bpy complex 1 was structurally characterized by X-ray crystallography. The molecular structure showed a {Fe 2 (m-O)} core in which iron(III) in a FeN 4 O 2 coordination is bound to tridentate monoanionic L-histidine and bidentate bpy ligands. The Fe ◊◊◊ Fe distance is ~3.5 A ˚ . The Fe–O–Fe unit is essentially linear, giving a bond angle of ~172 ◦ . The complexes showed irreversible cyclic voltammetric cathodic response near -0.1 V vs. SCE in H 2 O–0.1 M KCl. The binuclear units displayed antiferromagnetic interaction between two high-spin (S = 5/2) iron(III) centers giving a -J value of ~110 cm -1 . The complexes showed good DNA binding propensity giving a binding constant value of ~10 5 M -1 . Isothermal titration calorimetric data indicated single binding mode to the DNA. The binding was found to be driven by negative free energy change and enthalpy. The dpq complex 3 showed oxidative double-strand DNA cleavage on exposure to UV-A and visible light. The phen complex 2 displayed single-strand photocleavage of DNA. The DNA double-strand breaks were rationalized from theoretical molecular docking calculations. Mechanistic investigations showed formation of hydroxyl radicals as the reactive species through photodecarboxy- lation of the L-histidine ligand. The complexes exhibited good binding propensity to bovine serum albumin (BSA) protein in Tris-HCl/NaCl buffer medium. The dpq complex 3 showed UV-A light-induced site-specific oxidative BSA cleavage forming fragments of ~45 kDa and ~20 kDa molecular weights via ∑ OH pathway. Introduction Metal-based synthetic nucleases and proteases are of importance for their various applications in nucleic acid and peptide chemistry, viz. as restriction enzyme mimics, foot-printing agents, model peptidases and as therapeutic agents. 1–10 Oxidative cleavage of DNA by model nucleases involves the deoxyribose moiety or guanine base in phototherapeutic applications like photodynamic therapy (PDT) of cancer. 11–15 PDT is a non-invasive treatment modality in which the cancer cells are selectively targeted by red light of 600–800 nm wavelength thus damaging only the cancer cells leaving the healthy cells unaffected. Porphyrin and phthalocyanin bases have been studied as PDT agents. 11 The PDT drug Photofrin R is the mixture of hematoporphyrin species. Porphyrin bases are known to be hepatotoxic due to bilirubin formation on oxidative conversion. 16 This has generated current interests to develop the chemistry of metal-based PDT agents. a Department of Inorganic and Physical Chemistry, Indian Institute of Science, Bangalore, 560012, India. E-mail: [email protected]; Fax: +91- 80-23600683; Tel: +91-80-22932533 b Bioinformatics Centre, Department of Physics, Indian Institute of Science, Bangalore, 560012, India †Electronic supplementary information (ESI) available: Figures on spec- tral, magnetic, redox, DNA and protein binding and cleavage (Fig. S1– S14). CCDC reference number 678207. For ESI and crystallographic data in CIF or other electronic format see DOI: 10.1039/b901337g While a variety of organic dyes have been used as potent PDT agents, the chemistry of metal-based complexes remains largely unexplored. 17–25 The present work stems from our interest in developing the chemistry of 3d metal complexes as photocleavers of DNA within the PDT spectral window. 26–30 Our recent reports have shown that ternary iron(III) complexes having photoactive dipyrido[3,2-d :2¢,3¢-f ]quinoxaline (dpq) or dipyrido[3,2-a:2¢,3¢- c]phenazine (dppz) ligand cleave DNA efficiently on photo- irradiation of the metal-centered charge transfer band in visible light. 31,32 We have also reported a (m-oxo)diiron(III) complex [{Fe(L-his)(dpq)} 2 (m-O)] 2+ of L-histidine (L-his) and dpq showing DNA double-strand breaks on exposure to visible light. 33 Double- strand DNA cleavage is of importance in terms of greater cell lethality than the single-strand cleavage. The natural antitumor antibiotic iron-bleomycins (Fe-BLMs) are known to show double- strand DNA cleavage. 34 Synthetic models of Fe-BLMs showing such activity are, however, rare and are limited to complexes acting as “chemical nucleases” in the presence of external additives. 35,36 Synthetic proteases that can cleave protein backbone with a high specificity are useful as multifunctional biochemical agents suitable for understanding the structure–activity correlations of proteins and towards exploring different structural domains in proteins. 37–42 Like model photonucleases, synthetic photoproteases that degrade protein under physiological conditions are of interest for selectively controlling specific protein functions. 43–47 Kumar and coworkers have reported cobalt-based model photoproteases This journal is © The Royal Society of Chemistry 2009 Dalton Trans., 2009, 4671–4682 | 4671
Transcript of Photo-induced double-strand DNA and site-specific protein cleavage activity of l-histidine...
PAPER www.rsc.org/dalton | Dalton Transactions
Photo-induced double-strand DNA and site-specific protein cleavage activityof L-histidine (l-oxo)diiron(III) complexes of heterocyclic bases†
Mithun Roy,a Tuhin Bhowmick,b Ramkumar Santhanagopal,a Suryanarayana Ramakumarb andAkhil R. Chakravarty*a
Received 21st January 2009, Accepted 26th March 2009First published as an Advance Article on the web 27th April 2009DOI: 10.1039/b901337g
Three oxo-bridged diiron(III) complexes of L-histidine and heterocyclic bases [Fe2(m-O)(L-his)2(B)2]-(ClO4)2 (1–3), where B is 2,2¢-bipyridine (bpy), 1,10-phenanthroline (phen), dipyrido[3,2-d:2¢,3¢-f ]-quinoxaline (dpq), were prepared and characterized. The bpy complex 1 was structurally characterizedby X-ray crystallography. The molecular structure showed a {Fe2(m-O)} core in which iron(III) in aFeN4O2 coordination is bound to tridentate monoanionic L-histidine and bidentate bpy ligands. TheFe ◊ ◊ ◊ Fe distance is ~3.5 A. The Fe–O–Fe unit is essentially linear, giving a bond angle of ~172◦. Thecomplexes showed irreversible cyclic voltammetric cathodic response near -0.1 V vs. SCE inH2O–0.1 M KCl. The binuclear units displayed antiferromagnetic interaction between two high-spin(S = 5/2) iron(III) centers giving a -J value of ~110 cm-1. The complexes showed good DNA bindingpropensity giving a binding constant value of ~105 M-1. Isothermal titration calorimetric data indicatedsingle binding mode to the DNA. The binding was found to be driven by negative free energy changeand enthalpy. The dpq complex 3 showed oxidative double-strand DNA cleavage on exposure to UV-Aand visible light. The phen complex 2 displayed single-strand photocleavage of DNA. The DNAdouble-strand breaks were rationalized from theoretical molecular docking calculations. Mechanisticinvestigations showed formation of hydroxyl radicals as the reactive species through photodecarboxy-lation of the L-histidine ligand. The complexes exhibited good binding propensity to bovine serumalbumin (BSA) protein in Tris-HCl/NaCl buffer medium. The dpq complex 3 showed UV-Alight-induced site-specific oxidative BSA cleavage forming fragments of ~45 kDa and ~20 kDamolecular weights via ∑OH pathway.
Introduction
Metal-based synthetic nucleases and proteases are of importancefor their various applications in nucleic acid and peptide chemistry,viz. as restriction enzyme mimics, foot-printing agents, modelpeptidases and as therapeutic agents.1–10 Oxidative cleavage ofDNA by model nucleases involves the deoxyribose moiety orguanine base in phototherapeutic applications like photodynamictherapy (PDT) of cancer.11–15 PDT is a non-invasive treatmentmodality in which the cancer cells are selectively targeted byred light of 600–800 nm wavelength thus damaging only thecancer cells leaving the healthy cells unaffected. Porphyrin andphthalocyanin bases have been studied as PDT agents.11 ThePDT drug Photofrin R© is the mixture of hematoporphyrin species.Porphyrin bases are known to be hepatotoxic due to bilirubinformation on oxidative conversion.16 This has generated currentinterests to develop the chemistry of metal-based PDT agents.
aDepartment of Inorganic and Physical Chemistry, Indian Institute ofScience, Bangalore, 560012, India. E-mail: [email protected]; Fax: +91-80-23600683; Tel: +91-80-22932533bBioinformatics Centre, Department of Physics, Indian Institute of Science,Bangalore, 560012, India† Electronic supplementary information (ESI) available: Figures on spec-tral, magnetic, redox, DNA and protein binding and cleavage (Fig. S1–S14). CCDC reference number 678207. For ESI and crystallographic datain CIF or other electronic format see DOI: 10.1039/b901337g
While a variety of organic dyes have been used as potent PDTagents, the chemistry of metal-based complexes remains largelyunexplored.17–25 The present work stems from our interest indeveloping the chemistry of 3d metal complexes as photocleaversof DNA within the PDT spectral window.26–30 Our recent reportshave shown that ternary iron(III) complexes having photoactivedipyrido[3,2-d:2¢,3¢-f ]quinoxaline (dpq) or dipyrido[3,2-a:2¢,3¢-c]phenazine (dppz) ligand cleave DNA efficiently on photo-irradiation of the metal-centered charge transfer band in visiblelight.31,32 We have also reported a (m-oxo)diiron(III) complex[{Fe(L-his)(dpq)}2(m-O)]2+ of L-histidine (L-his) and dpq showingDNA double-strand breaks on exposure to visible light.33 Double-strand DNA cleavage is of importance in terms of greater celllethality than the single-strand cleavage. The natural antitumorantibiotic iron-bleomycins (Fe-BLMs) are known to show double-strand DNA cleavage.34 Synthetic models of Fe-BLMs showingsuch activity are, however, rare and are limited to complexes actingas “chemical nucleases” in the presence of external additives.35,36
Synthetic proteases that can cleave protein backbone with ahigh specificity are useful as multifunctional biochemical agentssuitable for understanding the structure–activity correlations ofproteins and towards exploring different structural domains inproteins.37–42 Like model photonucleases, synthetic photoproteasesthat degrade protein under physiological conditions are of interestfor selectively controlling specific protein functions.43–47 Kumarand coworkers have reported cobalt-based model photoproteases
This journal is © The Royal Society of Chemistry 2009 Dalton Trans., 2009, 4671–4682 | 4671
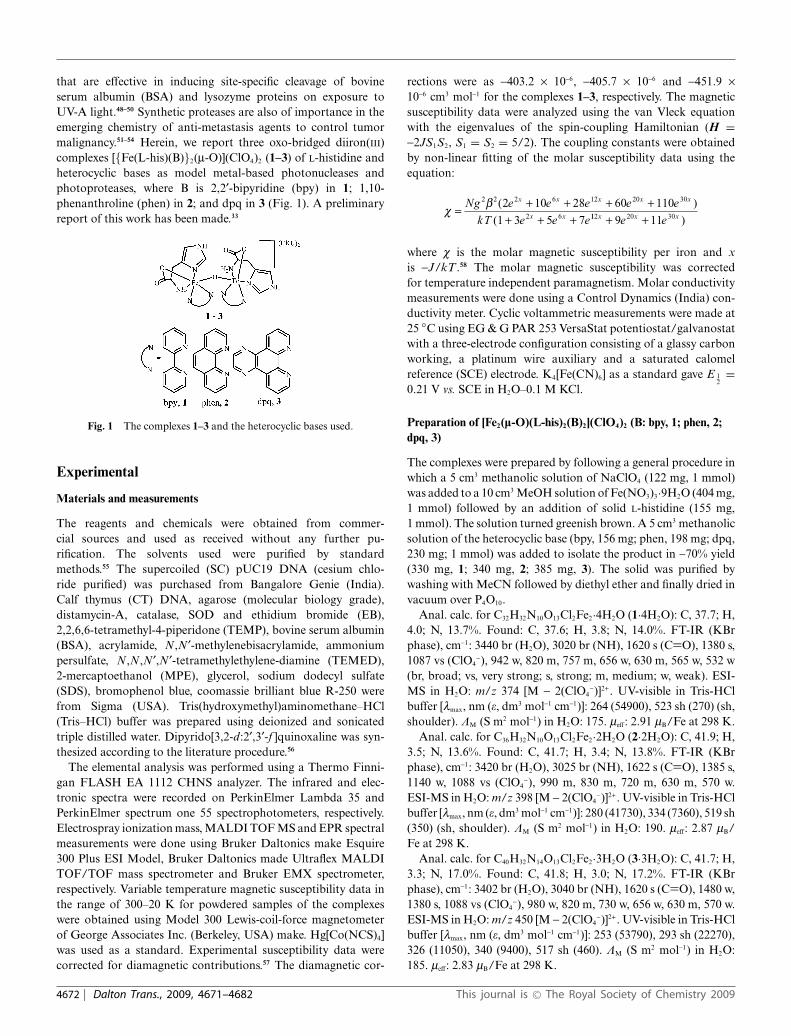
that are effective in inducing site-specific cleavage of bovineserum albumin (BSA) and lysozyme proteins on exposure toUV-A light.48–50 Synthetic proteases are also of importance in theemerging chemistry of anti-metastasis agents to control tumormalignancy.51–54 Herein, we report three oxo-bridged diiron(III)complexes [{Fe(L-his)(B)}2(m-O)](ClO4)2 (1–3) of L-histidine andheterocyclic bases as model metal-based photonucleases andphotoproteases, where B is 2,2¢-bipyridine (bpy) in 1; 1,10-phenanthroline (phen) in 2; and dpq in 3 (Fig. 1). A preliminaryreport of this work has been made.33
Fig. 1 The complexes 1–3 and the heterocyclic bases used.
Experimental
Materials and measurements
The reagents and chemicals were obtained from commer-cial sources and used as received without any further pu-rification. The solvents used were purified by standardmethods.55 The supercoiled (SC) pUC19 DNA (cesium chlo-ride purified) was purchased from Bangalore Genie (India).Calf thymus (CT) DNA, agarose (molecular biology grade),distamycin-A, catalase, SOD and ethidium bromide (EB),2,2,6,6-tetramethyl-4-piperidone (TEMP), bovine serum albumin(BSA), acrylamide, N,N¢-methylenebisacrylamide, ammoniumpersulfate, N,N,N¢,N¢-tetramethylethylene-diamine (TEMED),2-mercaptoethanol (MPE), glycerol, sodium dodecyl sulfate(SDS), bromophenol blue, coomassie brilliant blue R-250 werefrom Sigma (USA). Tris(hydroxymethyl)aminomethane–HCl(Tris–HCl) buffer was prepared using deionized and sonicatedtriple distilled water. Dipyrido[3,2-d:2¢,3¢-f ]quinoxaline was syn-thesized according to the literature procedure.56
The elemental analysis was performed using a Thermo Finni-gan FLASH EA 1112 CHNS analyzer. The infrared and elec-tronic spectra were recorded on PerkinElmer Lambda 35 andPerkinElmer spectrum one 55 spectrophotometers, respectively.Electrospray ionization mass, MALDI TOF MS and EPR spectralmeasurements were done using Bruker Daltonics make Esquire300 Plus ESI Model, Bruker Daltonics made Ultraflex MALDITOF/TOF mass spectrometer and Bruker EMX spectrometer,respectively. Variable temperature magnetic susceptibility data inthe range of 300–20 K for powdered samples of the complexeswere obtained using Model 300 Lewis-coil-force magnetometerof George Associates Inc. (Berkeley, USA) make. Hg[Co(NCS)4]was used as a standard. Experimental susceptibility data werecorrected for diamagnetic contributions.57 The diamagnetic cor-
rections were as -403.2 ¥ 10-6, -405.7 ¥ 10-6 and -451.9 ¥10-6 cm3 mol-1 for the complexes 1–3, respectively. The magneticsusceptibility data were analyzed using the van Vleck equationwith the eigenvalues of the spin-coupling Hamiltonian (H =-2JS1S2, S1 = S2 = 5/2). The coupling constants were obtainedby non-linear fitting of the molar susceptibility data using theequation:
cb
=+ + + +
+ + +Ng e e e e e
kT e e e
x x x x x
x x
2 2 2 6 12 20 30
2 6
2 10 28 60 110
1 3 5 7
( )
( 112 20 309 11x x xe e+ + )
where c is the molar magnetic susceptibility per iron and xis -J/kT .58 The molar magnetic susceptibility was correctedfor temperature independent paramagnetism. Molar conductivitymeasurements were done using a Control Dynamics (India) con-ductivity meter. Cyclic voltammetric measurements were made at25 ◦C using EG & G PAR 253 VersaStat potentiostat/galvanostatwith a three-electrode configuration consisting of a glassy carbonworking, a platinum wire auxiliary and a saturated calomelreference (SCE) electrode. K4[Fe(CN)6] as a standard gave E 1
2=
0.21 V vs. SCE in H2O–0.1 M KCl.
Preparation of [Fe2(l-O)(L-his)2(B)2](ClO4)2 (B: bpy, 1; phen, 2;dpq, 3)
The complexes were prepared by following a general procedure inwhich a 5 cm3 methanolic solution of NaClO4 (122 mg, 1 mmol)was added to a 10 cm3 MeOH solution of Fe(NO3)3·9H2O (404 mg,1 mmol) followed by an addition of solid L-histidine (155 mg,1 mmol). The solution turned greenish brown. A 5 cm3 methanolicsolution of the heterocyclic base (bpy, 156 mg; phen, 198 mg; dpq,230 mg; 1 mmol) was added to isolate the product in ~70% yield(330 mg, 1; 340 mg, 2; 385 mg, 3). The solid was purified bywashing with MeCN followed by diethyl ether and finally dried invacuum over P4O10.
Anal. calc. for C32H32N10O13Cl2Fe2·4H2O (1·4H2O): C, 37.7; H,4.0; N, 13.7%. Found: C, 37.6; H, 3.8; N, 14.0%. FT-IR (KBrphase), cm-1: 3440 br (H2O), 3020 br (NH), 1620 s (C=O), 1380 s,1087 vs (ClO4
-), 942 w, 820 m, 757 m, 656 w, 630 m, 565 w, 532 w(br, broad; vs, very strong; s, strong; m, medium; w, weak). ESI-MS in H2O: m/z 374 [M - 2(ClO4
-)]2+. UV-visible in Tris-HClbuffer [lmax, nm (e, dm3 mol-1 cm-1)]: 264 (54900), 523 sh (270) (sh,shoulder). KM (S m2 mol-1) in H2O: 175. meff: 2.91 mB/Fe at 298 K.
Anal. calc. for C36H32N10O13Cl2Fe2·2H2O (2·2H2O): C, 41.9; H,3.5; N, 13.6%. Found: C, 41.7; H, 3.4; N, 13.8%. FT-IR (KBrphase), cm-1: 3420 br (H2O), 3025 br (NH), 1622 s (C=O), 1385 s,1140 w, 1088 vs (ClO4
-), 990 m, 830 m, 720 m, 630 m, 570 w.ESI-MS in H2O: m/z 398 [M - 2(ClO4
-)]2+. UV-visible in Tris-HClbuffer [lmax, nm (e, dm3 mol-1 cm-1)]: 280 (41730), 334 (7360), 519 sh(350) (sh, shoulder). KM (S m2 mol-1) in H2O: 190. meff: 2.87 mB/Fe at 298 K.
Anal. calc. for C40H32N14O13Cl2Fe2·3H2O (3·3H2O): C, 41.7; H,3.3; N, 17.0%. Found: C, 41.8; H, 3.0; N, 17.2%. FT-IR (KBrphase), cm-1: 3402 br (H2O), 3040 br (NH), 1620 s (C=O), 1480 w,1380 s, 1088 vs (ClO4
-), 980 w, 820 m, 730 w, 656 w, 630 m, 570 w.ESI-MS in H2O: m/z 450 [M - 2(ClO4
-)]2+. UV-visible in Tris-HClbuffer [lmax, nm (e, dm3 mol-1 cm-1)]: 253 (53790), 293 sh (22270),326 (11050), 340 (9400), 517 sh (460). KM (S m2 mol-1) in H2O:185. meff: 2.83 mB/Fe at 298 K.
4672 | Dalton Trans., 2009, 4671–4682 This journal is © The Royal Society of Chemistry 2009
CAUTION! The perchlorate salts could be potentially explosive.Therefore, only small quantities of the sample was handled to avoidany possible explosion.
Solubility and stability
The complexes were soluble in water, dimethylformamide (DMF)and dimethyl sulfoxide (DMSO). The complexes were stablein the solid phase at ambient temperature in the light. Thesolutions on keeping for a long period in light gave a red solid ofbinary composition [FeII(B)3](ClO4)2 as evidenced from the visiblespectral band of the binary iron(II) complex.
X-Ray crystallographic procedure
The reddish brown rectangular shaped crystals of 1 were grownfrom an aqueous solution of 1 on slow evaporation. The crystalmounting was done on a glass fiber using epoxy cement. The X-raydiffraction data were measured in frames with increasing w (widthof 0.3◦ per frame) and with a scan speed at 15 s per frame usinga Bruker SMART APEX CCD diffractometer, equipped with afine focus 1.75 kW sealed tube X-ray source. Empirical absorptioncorrection was made using multi-scan program.59 The structurewas solved by heavy-atom method and refined by full matrix least-squares using SHELX system of programs.60 The perspective viewof the complex was obtained using the ORTEP program.61 Therewere two molecules in the crystallographic asymmetric unit of 1 inthe monoclinic space group C2. While one ClO4
- in 1 was refinedwith full atom occupancy, the other positionally disordered ClO4
-
was modeled for two ClO4 units each refined with half-occupancykeeping the central Cl atom with full occupancy. The disorderedperchlorate oxygen atoms were refined isotropically. The othernon-hydrogen atoms were refined anisotropically. The hydrogenatoms were fixed in their calculated positions using a riding model.The CCDC number for the complex 1 is 678207.33
Crystal data for 1·4H2O: C32H40Cl2Fe2N10O17, M = 1019.34,monoclinic, space group C2, a = 18.265(3), b = 12.584(2), c =19.116(3) A, b = 102.399(4)◦, U = 4291.5(13) A3, Z = 4, Dc =1.578 Mg m-3, T = 293(2) K, 1.09 ≤ q ≤ 25.00◦, m = 8.83 cm-1,F(000) = 2096, GOF = 1.042, R1 = 0.1218, wR2 = 0.2928 for 7441reflections with I > 2s(I) and 568 parameters [R1(F 2) = 0.1849 (alldata)]. Weighting scheme: w = [s 2(F 0
2) + (0.1480P)2 + 0.000P]-1,where P = [F 0
2 + 2F c2]/3.
DNA binding experiments
DNA binding propensities of the complexes were investigatedusing various spectroscopic, isothermal titration calorimetric andviscometric titration techniques. UV-visible titration experimentswere carried out in Tris-HCl/NaCl buffer (5 mM Tris-HCl/NaCl,pH 7.2) using aqueous solutions of the complexes. Calf thymus(CT) DNA (ca. 130 mM NP) in Tris-HCl buffer medium wasfound to be free from any protein impurity as evident fromthe ratio of UV absorbance at 260 and 280 nm of ca.1.9 : 1.The CT DNA concentration was measured from its absorptionintensity at 260 nm using molar absorption coefficient value of6600 dm3 mol-1 cm-1.62 UV-visible absorption titration experi-ments were performed with increasing concentrations of CT DNAkeeping the complex concentration as constant at 30 mM. Duecorrection was made to the absorbance of CT DNA itself. Samples
were initially pre-equilibrated with CT DNA for 5 min beforerecording each spectrum. The equilibrium binding constant (Kb)and the binding site size (s) of the complex as a fitting parameterwere determined from a non-linear fitting of the plot of Deaf/Debf vs.[DNA] applying McGhee–von Hippel (MvH) method and usingthe expression of Bard and coworkers: Deaf/Debf = (b - (b2 -2Kb
2Ct[DNA]/s)12 )/2Kb, b = 1 + KbCt + Kb[DNA]/2s, where
Kb is the microscopic equilibrium binding constant for each site,Ct is the total concentration of the metal complex, s is the sitesize of the metal complex interacting with the DNA, [DNA] is theconcentration of DNA in nucleotides, ef, ea and eb are respectivelythe molar extinction coefficient values of the free complex insolution, complex bound to DNA at a definite concentrationand the complex in completely bound form with CT DNA.63,64
The non-linear least-squares analysis was done using Origin Lab,version 7.0.
The apparent binding constant (Kapp) values of the complexeswere determined by ethidium bromide (EB) displacement assayusing EB bound CT DNA solution in 5 mM Tris-HCl/NaCl buffer(pH 7.2). The fluorescence intensities of EB at 600 nm (546 nmexcitation) with increasing complex concentration were measured.EB did not show any fluorescence in Tris buffer medium.65 It,however, showed enhanced emission intensity in the presence ofCT DNA due to its intercalative binding to DNA. Competitivebinding of the oxo-bridged diiron(III) complexes to CT DNAshowed a gradual decrease in the emission intensity of EB. Therelative binding order was obtained from the comparison of theslopes of the I/I 0 vs. [complex] plots.
DNA melting experiments were carried out by monitoring theabsorbance of the CT DNA (260 nm) in the temperature range of40 to 90 ◦C in absence and in the presence of the complexes in a13 : 1 molar ratio of the CT DNA and the complex with a ramprate of 0.5 ◦C min-1 in 5 mM phosphate buffer medium (pH 6.85)using Cary 300 bio UV-Vis spectrometer with Cary temperaturecontroller. The melting of the double-strand DNA to single-strand DNA was observed with a significant hyperchromicityof the absorbance at 260 nm. The melting temperature wasdetermined from the derivative plot (dA260/dT vs. T) of themelting profile. Viscometric titration experiments were done usingSchott Gerate AVS 310 automated viscometer attached withconstant temperature bath at 37 ◦C to determine the natureof the interaction of the complexes with the CT DNA. Theconcentration of CT DNA stock solution was 130 mM (NP)in 5 mM Tris-HCl buffer. The complex was added gradually inincreasing concentration from 0 to 250 mM and the viscosity wasmeasured after each addition. The flow times were monitored withan automated timer. The data were presented by ploting relativespecific viscosity of DNA, (h/h0)1/3 vs. [complex]/[DNA], whereh is the viscosity of DNA in the presence of the complex and h0
is the viscosity of DNA alone in 5 mM Tris buffer medium. Theviscosity values were calculated from the observed flow time of CTDNA containing solutions (t) duly corrected for that of the Trisbuffer alone (t0), h = (t - t0).66
Isothermal titration calorimmetric (ITC) experiments wereperformed using Nano-Isothermal Titration Calorimeter III,Model CSC 5300. In a typical experiment, a 1.0 cm3 solutionof CT-DNA in 5 mM Tris-HCl/25 mM NaCl buffer was placedin the sample cell of the calorimeter and equilibrated to 20 ◦Cfor 3 h before performing the experiment. A 100 mM CT DNA
This journal is © The Royal Society of Chemistry 2009 Dalton Trans., 2009, 4671–4682 | 4673
was used for the titration against the complexes (2 mM). Thecomplex solution that was placed in the injection syringe of 250 mLwas injected into the sample cell in 31 injections with 8 mL perinjection. Control titration experiments of the complex into the5 mM Tris-HCl/25 mM NaCl buffer were also performed in orderto subtract background heat of dilution that was found to beinsignificant from the ITC data. The data were fitted to single set ofbinding site model using the Bind Works, version 3.1.11 softwarepackage.67
Molecular docking
Molecular docking was performed using the DS Modeling 1.2-SBD Docking Module by AccelrysTM Software.68 The CHARMmforce-field was used for the metal complex in the input of thecalculations. Due to the higher hybridization state of Fe3+ atomin the molecule, the correction of the partial charge distributionfor all atoms in the ligand was done by following the output fromGaussian 03.69 The crystal structure of the B-DNA dodecamerd(CGCGAATTCGCG)2 (NDB code GDLB05) was downloadedfrom the protein data bank. In the docking analysis, the bindingsite was assigned across the entire minor and major grooves ofthe DNA molecule. The docking was performed to find the moststable and favorable orientation (vide ESI†).
Protein binding experiments
The protein binding propensity of the complexes was determinedby tryptophan fluorescence quenching experiment as well as byisothermal titration calorimetry using bovine serum albumin(BSA) protein as the substrate. In a typical tryptophan fluo-rescence quenching experiment in phosphate buffer (pH 6.8),quenching of the emission intensity of tryptophan residues (trp-134 and trp-214) of BSA at 344 nm (excitation wavelength at295 nm) was monitored using complexes 1–3 with increasingcomplex concentration.70 The Stern–Volmer (I 0/I) vs. [complex]plots using the corrected fluorescence data that took into accountthe effect of dilution were done. Linear fit of the Stern–Volmerequation (I 0/I = 1 + KBSA[Q]), where I 0, I are respective emissionintensity of BSA in the absence of the quencher and emissionintensity of BSA in the presence of the quencher of concentration[Q] gave the binding constant (KBSA) value using Origin 7.0.
Isothermal titration calorimetry for BSA binding was per-formed in a similar way as was done for the CT DNA. BSA,at a concentration of 100 mM in 5 mM Tris-HCl/25 mM NaCl(pH 7.2), was placed in the 1.4 cm3 calorimeter cell and the complex(2 mM) was added gradually in 8 mL aliquots for each injection fora total of 31 injections at 5 min intervals. The heat of reaction perinjection was determined by integration of the peak areas usingthe Bind Works, version 3.1.11 software package.67 The plots ofthe heat evolved per mol complex injected vs. the complex/BSAmolar ratio was fitted into the single set binding site model. Thebest-fit values of the heat of binding (DH), the stoichiometry ofbinding (N), and the binding constant (K) were obtained from thesame plot. The heats of dilution were taken into account from acontrol experiment that was done by injecting 2 mM complex intothe buffer solution. The heats of dilution were subtracted fromthe corresponding complex/BSA binding experiment data beforecurve-fitting.
DNA cleavage experiments
The supercoiled (SC) pUC19 DNA (1 mL, 0.2 mg, 30 mM, 2686base pairs) cleavage activity of 1–3 was studied by agarose gelelectrophoresis in 50 mM Tris-HCl/NaCl buffer (pH 7.2). Thechemical nuclease activity of the complexes was studied using3-mercaptopropionic acid (MPA, 500 mM) as a reducing agent indark. The photo-induced DNA cleavage reactions were performedunder illuminated conditions using UV-A lamp of 365 nm (6 W,sample area of illumination: 45 mm2) and at different visiblewavelengths (458, 520 and 647 nm) using a continuous-wave (CW)argon–krypton laser (50 mW laser power, laser beam diameter of1.8 mm with a beam divergence of 0.70 mrad) of the SpectraPhysics Water-Cooled Mixed-Gas Ion Laser Stabilite R© 2018-RM model. The power of the Ar–Kr laser beam at the sampleposition (~5 mm away from the laser source) was measured usingSpectra Physics CW Laser Power Meter (Model 407A). Eppendorfand glass vials were used for respective UV-A and visible lightexperiments in a dark room at 25 ◦C.
The anaerobic photocleavage experiment was performed un-der argon atmosphere. Different additives like singlet oxygenquenchers and radical scavengers were used for mechanisticinvestigations in the presence of the complexes. The concentrationsof the complexes and the additives corresponded to the quantity in2 mL stock solution after dilution to the 20 mL final volume usingTris-HCl/NaCl buffer. After the photoexposure, the sample wasincubated for 1 h at 37 ◦C, followed by its addition to the loadingbuffer containing 25% bromophenol blue, 0.25% xylene cyanoland 30% glycerol (2 mL). The solution was finally loaded on 0.8%agarose gel containing 1.0 mg mL-1 EB. Electrophoresis was carriedout in a dark room for 2 h at 45 V in Tris–acetate–EDTA (TAE)buffer. The bands were visualized by UV light and photographed.The extent of DNA cleavage was determined by measuring theintensities of the bands using a UVITECH Gel DocumentationSystem. Due corrections were made to the intensity data for thepresence of minor quantity of nicked circular (NC) DNA in theoriginal SC DNA sample and for the low affinity of EB bindingto SC compared to NC and linear forms of DNA.71 The extent ofexperimental error in measuring the SC and NC forms of DNAfrom the gel diagrams varied from 3–5%.
Protein cleavage experiments
Photo-induced protein cleavage experiments were carried outaccording to the literature procedure described by Kumar andcoworkers.72 Freshly prepared solution of BSA in 50 mM Tris-HCl buffer (pH 7.2) was used for the photo-induced proteincleavage studies. The protein (2.5 mM) solutions in Tris-HClbuffer medium containing complexes with varied concentrationfrom 50–200 mM were photo-exposed at 365 nm (100 W) for20 min and eppendorf vials were used for the UV-A light-inducedprotein cleavage studies. The sample solutions were incubatedat 37 ◦C for 1 h prior to the photoexposure. The irradiatedsamples (50 mL) were dried in EYELA centrifugal vaporizer(Model CVE-200D) and the samples were dissolved in the loadingbuffer (24 mL) containing SDS (7% w/v), glycerol (4% w/v),Tris-HCl buffer (50 mM, pH 6.8), mercaptoethanol (2% v/v)and bromophenol blue (0.01% w/v). The protein solutions werethen denatured on heating to boil. Samples were then loaded
4674 | Dalton Trans., 2009, 4671–4682 This journal is © The Royal Society of Chemistry 2009
on a 3% polyacrylamide (stacking) gel. The gel electrophoresisthat was done initially at 60 V until the dye passed into theseparating gel (10% polyacrylamide) from the stacking (3%) gel,followed by setting the voltage to 110 V for 1.5 h. Staining wasdone with Coomassie Brilliant Blue R-250 solution (acetic acid–methanol–water = 1 : 2 : 7 v/v) and destaining was done withwater–methanol–acetic acid mixture (5 : 4 : 1 v/v) for 4 h. The gels,after destaining, were scanned with a HP Scanjet G3010 scannerand the images were further processed using Adobe Photoshop7.0 software package. Molecular weight markers were used in eachgel to calibrate the molecular weights of the BSA. The presence ofreactive oxygen species was investigated by carrying out the photo-induced protein cleavage experiments in the presence of varioussinglet oxygen quenchers like NaN3 (3 mM), TEMP (3 mM) andhydroxyl radical scavengers like DMSO (20 mL), KI (3 mM) andmannitol. The photocleaved BSA was dialyzed using dialysis tube(cut-off 3 kDa) to isolate the sample containing protein fragmentsfor mass spectral study to determine the molecular weight of thefragments.
Results and discussion
Synthesis and general aspects
Three (m-oxo)diiron(III) L-histidine complexes [{Fe(L-his)(B)}2(m-O)](ClO4)2 (1–3) were prepared in good yield from the reaction ofFe(NO3)3·9H2O with the amino acid and the heterocyclic base inmethanol (B: bpy, 1; phen, 2; dpq, 3). The products were isolated asthe perchlorate salt. The complexes were characterized from ana-lytical, spectral and magnetic data (Table 1, ESI Fig. S1–S6†). TheIR spectra of the complexes displayed characteristic n(ClO4
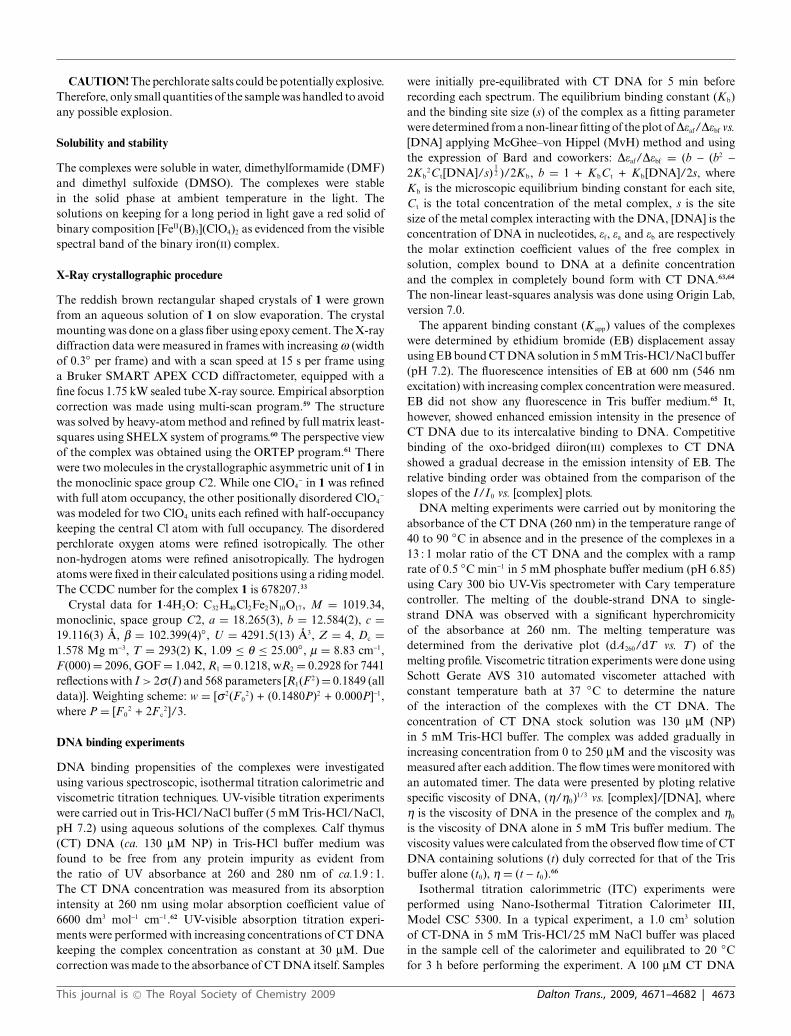
-) at~1088 cm-1 and n(C=O) at ~1630 cm-1. The variable-temperaturemagnetic susceptibility data showed strong antiferromagneticcoupling between the metal centers through the oxo-bridge givinga -J value of ~110 cm-1 (ESI Fig. S5†).73 The electronic spectraof the complexes in Tris-HCl buffer medium (pH 7.2) exhibitedweak oxo→Fe(III) charge transfer band at ~520 nm and theligand centered electronic bands in the UV region (Fig. 2, ESIFig. S4†). The spectral bands near 350 nm are assignable to then–p* and/or p–p* electronic transitions of the quinoxaline moietyof the dpq ligand in 3.74 The redox properties of the complexeswere investigated by cyclic voltammetry in H2O–0.1 M KCl(Table 1). The complexes showed irreversible cathodic response
Fig. 2 Visible electronic spectra of the complexes 1–3 in Tris-HCl buffershowing the LMCT band near 500 nm. The arrows indicate the visiblewavelengths used in the DNA photocleavage studies. The inset shows anirreversible cyclic voltammetric responses observed for 3 in H2O–0.1 MKCl at 50 mV s-1. The dashed line show the anodic scan for 3.
with a peak current that corresponds to two-electron reductionof the {FeIII
2O} unit near -0.1 V vs. SCE without showing anyanodic counterpart. The dpq complex 3 showed ligand reductionsin the potential range of -1.0 to -1.8 V. A quasi-reversible cyclicvoltammetric response was observed at ~1.0 V for the complexesafter making the initial cathodic scan. This redox response isbelieved to be due to the formation of stable binary monomericiron(II) species [Fe(B)3]2+ from degradation of the unstable reduced{FeII–O–FeII} core. Such redox behaviour has been found tobe common for the oxo-bridged diiron(III) complexes havingphenanthroline bases.75 The anodic voltammetric response is,however, not observed during an initial anodic scan within thevoltage window of 0.0 to 1.3 V vs. SCE (Fig. 2).
X-Ray crystallography
The bipyridyl complex 1 has been structurally characterized bysingle crystal X-ray diffraction technique. Complex 1 crystallizedin C2 space group in the monoclinic crystal system with fourmolecules in the unit cell. An ORTEP view of the cationic complexis shown in Fig. 3. Selected bond distances and angles data aregiven in Table S1 (vide ESI†). The unit cell packing diagram isshown in Fig. S7 (vide ESI†). The complex has a (m-oxo)diiron(III)
Table 1 Selected physicochemical and DNA binding data for the complexes 1–3
Complex 1 2 3
IR:a n (ClO4-)/cm-1 1085 1088 1089
Electronic spectra:b lmax/nm (e/dm3 mol-1 cm-1) 523 sh (270) 519 sh (350) 517 sh (460)Conductivity:b KM/S m2 mol-1 175 190 185Cyclic voltammetry:c Epc/V (vs. SCE) -0.25 -0.08 -0.05Magnetism:d -J/cm-1 112 110 108Kapp
e/M-1 4.6 ¥ 105 2.6 ¥ 106 6.6 ¥ 106
Kbf/M-1 [s] 4.6 (±0.5) ¥ 104 [0.25] 1.1 (±0.6) ¥ 105 [0.22] 5.6 (±0.7) ¥ 105 [0.2]
DTmg/◦C 1 2.3 4.5
KBSAh/M-1 3.6 ¥ 104 5.7 ¥ 104 8.8 ¥ 104
a KBr phase. b In H2O. sh, shoulder. c Fe(III)/Fe(II) cathodic peak in aqueous medium with 0.1 M KCl as supporting electrolyte. Scan rate = 50 mV s-1.d Magnetic exchange parameter. e Apparent binding constant determined from ethidium bromide displacement assay. f Equilibrium DNA binding constantand s is the binding site size determined from the UV-visible absorption spectral titration. g Change in DNA melting temperature. h Stern–Volmer fluorescentquenching constant determined from tryptophan fluorescent quenching experiment.
This journal is © The Royal Society of Chemistry 2009 Dalton Trans., 2009, 4671–4682 | 4675
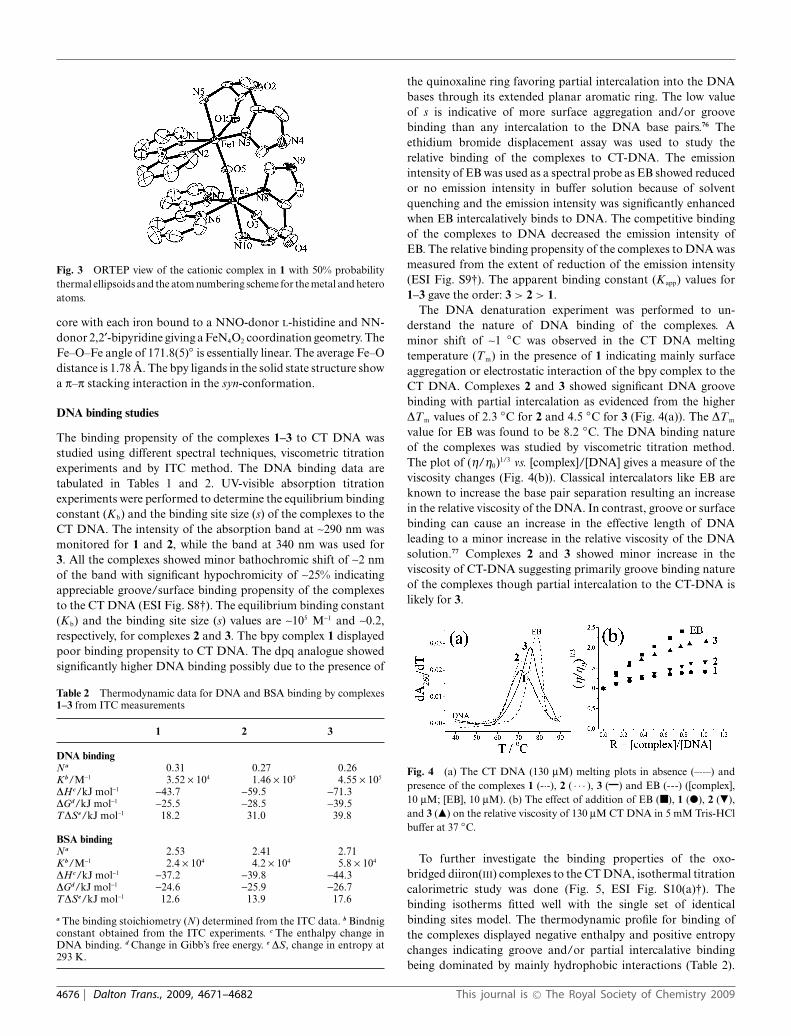
Fig. 3 ORTEP view of the cationic complex in 1 with 50% probabilitythermal ellipsoids and the atom numbering scheme for the metal and heteroatoms.
core with each iron bound to a NNO-donor L-histidine and NN-donor 2,2¢-bipyridine giving a FeN4O2 coordination geometry. TheFe–O–Fe angle of 171.8(5)◦ is essentially linear. The average Fe–Odistance is 1.78 A. The bpy ligands in the solid state structure showa p–p stacking interaction in the syn-conformation.
DNA binding studies
The binding propensity of the complexes 1–3 to CT DNA wasstudied using different spectral techniques, viscometric titrationexperiments and by ITC method. The DNA binding data aretabulated in Tables 1 and 2. UV-visible absorption titrationexperiments were performed to determine the equilibrium bindingconstant (Kb) and the binding site size (s) of the complexes to theCT DNA. The intensity of the absorption band at ~290 nm wasmonitored for 1 and 2, while the band at 340 nm was used for3. All the complexes showed minor bathochromic shift of ~2 nmof the band with significant hypochromicity of ~25% indicatingappreciable groove/surface binding propensity of the complexesto the CT DNA (ESI Fig. S8†). The equilibrium binding constant(Kb) and the binding site size (s) values are ~105 M-1 and ~0.2,respectively, for complexes 2 and 3. The bpy complex 1 displayedpoor binding propensity to CT DNA. The dpq analogue showedsignificantly higher DNA binding possibly due to the presence of
Table 2 Thermodynamic data for DNA and BSA binding by complexes1–3 from ITC measurements
1 2 3
DNA bindingNa 0.31 0.27 0.26Kb/M-1 3.52 ¥ 104 1.46 ¥ 105 4.55 ¥ 105
DHc/kJ mol-1 -43.7 -59.5 -71.3DGd/kJ mol-1 -25.5 -28.5 -39.5TDSe/kJ mol-1 18.2 31.0 39.8
BSA bindingNa 2.53 2.41 2.71Kb/M-1 2.4 ¥ 104 4.2 ¥ 104 5.8 ¥ 104
DHc/kJ mol-1 -37.2 -39.8 -44.3DGd/kJ mol-1 -24.6 -25.9 -26.7TDSe/kJ mol-1 12.6 13.9 17.6
a The binding stoichiometry (N) determined from the ITC data. b Bindnigconstant obtained from the ITC experiments. c The enthalpy change inDNA binding. d Change in Gibb’s free energy. e DS, change in entropy at293 K.
the quinoxaline ring favoring partial intercalation into the DNAbases through its extended planar aromatic ring. The low valueof s is indicative of more surface aggregation and/or groovebinding than any intercalation to the DNA base pairs.76 Theethidium bromide displacement assay was used to study therelative binding of the complexes to CT-DNA. The emissionintensity of EB was used as a spectral probe as EB showed reducedor no emission intensity in buffer solution because of solventquenching and the emission intensity was significantly enhancedwhen EB intercalatively binds to DNA. The competitive bindingof the complexes to DNA decreased the emission intensity ofEB. The relative binding propensity of the complexes to DNA wasmeasured from the extent of reduction of the emission intensity(ESI Fig. S9†). The apparent binding constant (Kapp) values for1–3 gave the order: 3 > 2 > 1.
The DNA denaturation experiment was performed to un-derstand the nature of DNA binding of the complexes. Aminor shift of ~1 ◦C was observed in the CT DNA meltingtemperature (Tm) in the presence of 1 indicating mainly surfaceaggregation or electrostatic interaction of the bpy complex to theCT DNA. Complexes 2 and 3 showed significant DNA groovebinding with partial intercalation as evidenced from the higherDTm values of 2.3 ◦C for 2 and 4.5 ◦C for 3 (Fig. 4(a)). The DTm
value for EB was found to be 8.2 ◦C. The DNA binding natureof the complexes was studied by viscometric titration method.The plot of (h/h0)1/3 vs. [complex]/[DNA] gives a measure of theviscosity changes (Fig. 4(b)). Classical intercalators like EB areknown to increase the base pair separation resulting an increasein the relative viscosity of the DNA. In contrast, groove or surfacebinding can cause an increase in the effective length of DNAleading to a minor increase in the relative viscosity of the DNAsolution.77 Complexes 2 and 3 showed minor increase in theviscosity of CT-DNA suggesting primarily groove binding natureof the complexes though partial intercalation to the CT-DNA islikely for 3.
Fig. 4 (a) The CT DNA (130 mM) melting plots in absence (–··–) andpresence of the complexes 1 (-·-), 2 ( ◊ ◊ ◊ ), 3 ( ) and EB (---) ([complex],10 mM; [EB], 10 mM). (b) The effect of addition of EB (�), 1 (�), 2 (�),and 3 (�) on the relative viscosity of 130 mM CT DNA in 5 mM Tris-HClbuffer at 37 ◦C.
To further investigate the binding properties of the oxo-bridged diiron(III) complexes to the CT DNA, isothermal titrationcalorimetric study was done (Fig. 5, ESI Fig. S10(a)†). Thebinding isotherms fitted well with the single set of identicalbinding sites model. The thermodynamic profile for binding ofthe complexes displayed negative enthalpy and positive entropychanges indicating groove and/or partial intercalative bindingbeing dominated by mainly hydrophobic interactions (Table 2).
4676 | Dalton Trans., 2009, 4671–4682 This journal is © The Royal Society of Chemistry 2009
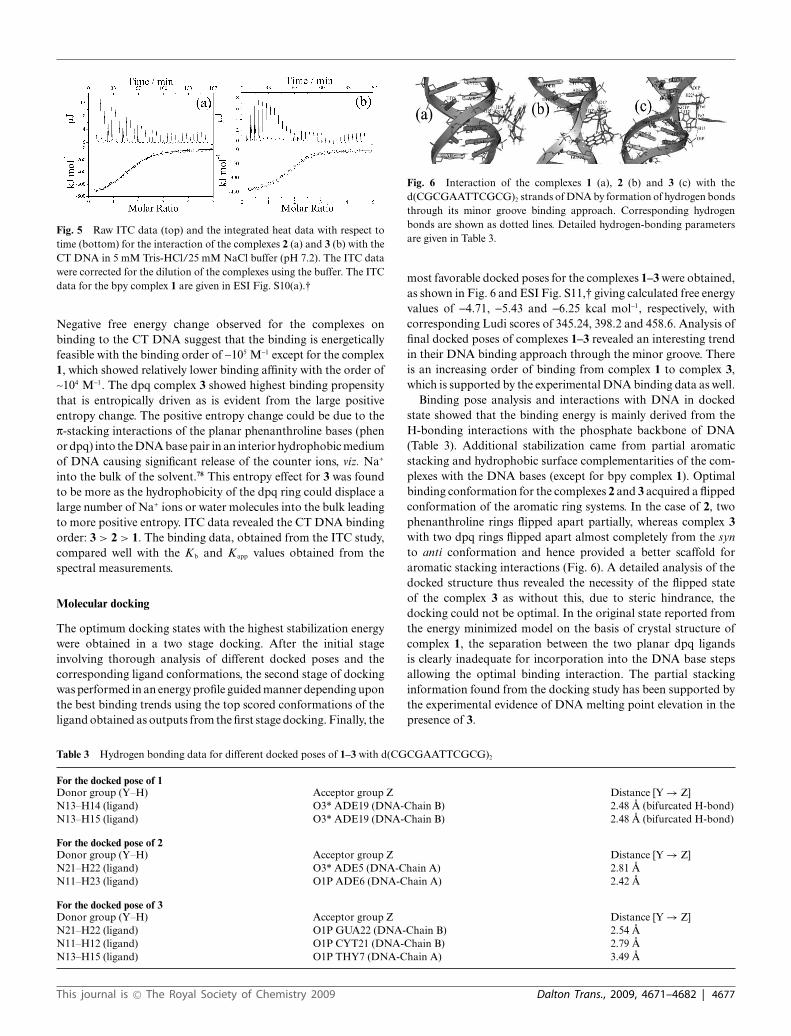
Fig. 5 Raw ITC data (top) and the integrated heat data with respect totime (bottom) for the interaction of the complexes 2 (a) and 3 (b) with theCT DNA in 5 mM Tris-HCl/25 mM NaCl buffer (pH 7.2). The ITC datawere corrected for the dilution of the complexes using the buffer. The ITCdata for the bpy complex 1 are given in ESI Fig. S10(a).†
Negative free energy change observed for the complexes onbinding to the CT DNA suggest that the binding is energeticallyfeasible with the binding order of ~105 M-1 except for the complex1, which showed relatively lower binding affinity with the order of~104 M-1. The dpq complex 3 showed highest binding propensitythat is entropically driven as is evident from the large positiveentropy change. The positive entropy change could be due to thep-stacking interactions of the planar phenanthroline bases (phenor dpq) into the DNA base pair in an interior hydrophobic mediumof DNA causing significant release of the counter ions, viz. Na+
into the bulk of the solvent.78 This entropy effect for 3 was foundto be more as the hydrophobicity of the dpq ring could displace alarge number of Na+ ions or water molecules into the bulk leadingto more positive entropy. ITC data revealed the CT DNA bindingorder: 3 > 2 > 1. The binding data, obtained from the ITC study,compared well with the Kb and Kapp values obtained from thespectral measurements.
Molecular docking
The optimum docking states with the highest stabilization energywere obtained in a two stage docking. After the initial stageinvolving thorough analysis of different docked poses and thecorresponding ligand conformations, the second stage of dockingwas performed in an energy profile guided manner depending uponthe best binding trends using the top scored conformations of theligand obtained as outputs from the first stage docking. Finally, the
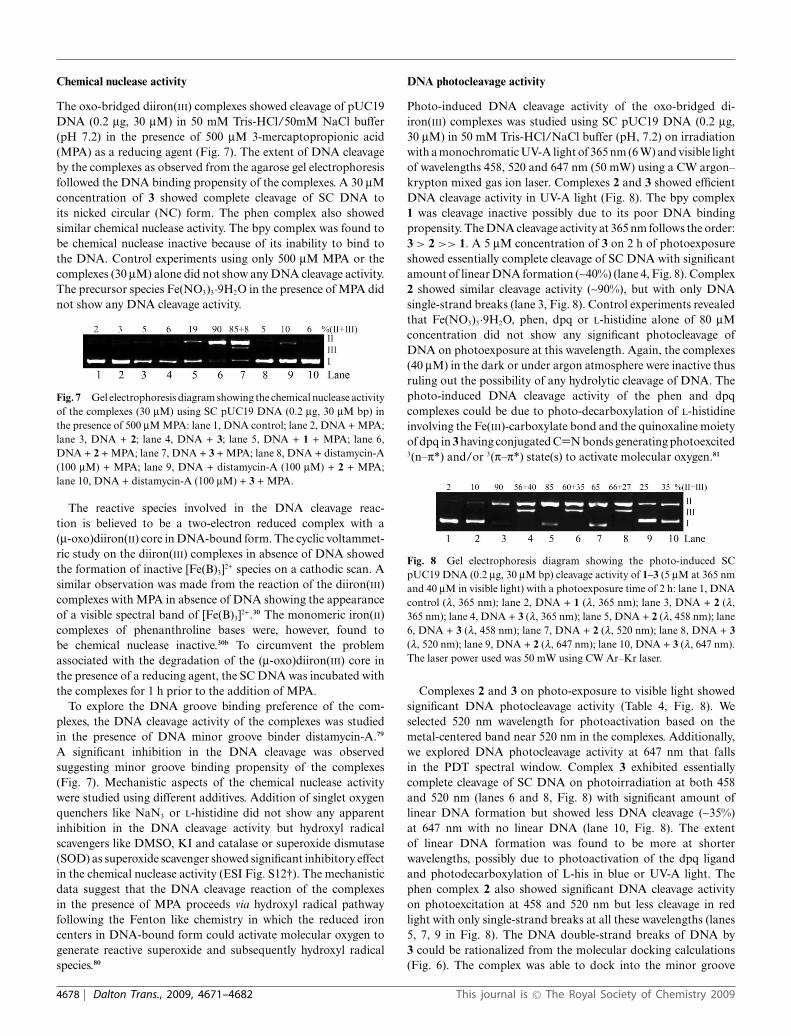
Fig. 6 Interaction of the complexes 1 (a), 2 (b) and 3 (c) with thed(CGCGAATTCGCG)2 strands of DNA by formation of hydrogen bondsthrough its minor groove binding approach. Corresponding hydrogenbonds are shown as dotted lines. Detailed hydrogen-bonding parametersare given in Table 3.
most favorable docked poses for the complexes 1–3 were obtained,as shown in Fig. 6 and ESI Fig. S11,† giving calculated free energyvalues of -4.71, -5.43 and -6.25 kcal mol-1, respectively, withcorresponding Ludi scores of 345.24, 398.2 and 458.6. Analysis offinal docked poses of complexes 1–3 revealed an interesting trendin their DNA binding approach through the minor groove. Thereis an increasing order of binding from complex 1 to complex 3,which is supported by the experimental DNA binding data as well.
Binding pose analysis and interactions with DNA in dockedstate showed that the binding energy is mainly derived from theH-bonding interactions with the phosphate backbone of DNA(Table 3). Additional stabilization came from partial aromaticstacking and hydrophobic surface complementarities of the com-plexes with the DNA bases (except for bpy complex 1). Optimalbinding conformation for the complexes 2 and 3 acquired a flippedconformation of the aromatic ring systems. In the case of 2, twophenanthroline rings flipped apart partially, whereas complex 3with two dpq rings flipped apart almost completely from the synto anti conformation and hence provided a better scaffold foraromatic stacking interactions (Fig. 6). A detailed analysis of thedocked structure thus revealed the necessity of the flipped stateof the complex 3 as without this, due to steric hindrance, thedocking could not be optimal. In the original state reported fromthe energy minimized model on the basis of crystal structure ofcomplex 1, the separation between the two planar dpq ligandsis clearly inadequate for incorporation into the DNA base stepsallowing the optimal binding interaction. The partial stackinginformation found from the docking study has been supported bythe experimental evidence of DNA melting point elevation in thepresence of 3.
Table 3 Hydrogen bonding data for different docked poses of 1–3 with d(CGCGAATTCGCG)2
For the docked pose of 1Donor group (Y–H) Acceptor group Z Distance [Y → Z]N13–H14 (ligand) O3* ADE19 (DNA-Chain B) 2.48 A (bifurcated H-bond)N13–H15 (ligand) O3* ADE19 (DNA-Chain B) 2.48 A (bifurcated H-bond)
For the docked pose of 2Donor group (Y–H) Acceptor group Z Distance [Y → Z]N21–H22 (ligand) O3* ADE5 (DNA-Chain A) 2.81 AN11–H23 (ligand) O1P ADE6 (DNA-Chain A) 2.42 A
For the docked pose of 3Donor group (Y–H) Acceptor group Z Distance [Y → Z]N21–H22 (ligand) O1P GUA22 (DNA-Chain B) 2.54 AN11–H12 (ligand) O1P CYT21 (DNA-Chain B) 2.79 AN13–H15 (ligand) O1P THY7 (DNA-Chain A) 3.49 A
This journal is © The Royal Society of Chemistry 2009 Dalton Trans., 2009, 4671–4682 | 4677
Chemical nuclease activity
The oxo-bridged diiron(III) complexes showed cleavage of pUC19DNA (0.2 mg, 30 mM) in 50 mM Tris-HCl/50mM NaCl buffer(pH 7.2) in the presence of 500 mM 3-mercaptopropionic acid(MPA) as a reducing agent (Fig. 7). The extent of DNA cleavageby the complexes as observed from the agarose gel electrophoresisfollowed the DNA binding propensity of the complexes. A 30 mMconcentration of 3 showed complete cleavage of SC DNA toits nicked circular (NC) form. The phen complex also showedsimilar chemical nuclease activity. The bpy complex was found tobe chemical nuclease inactive because of its inability to bind tothe DNA. Control experiments using only 500 mM MPA or thecomplexes (30 mM) alone did not show any DNA cleavage activity.The precursor species Fe(NO3)3·9H2O in the presence of MPA didnot show any DNA cleavage activity.
Fig. 7 Gel electrophoresis diagram showing the chemical nuclease activityof the complexes (30 mM) using SC pUC19 DNA (0.2 mg, 30 mM bp) inthe presence of 500 mM MPA: lane 1, DNA control; lane 2, DNA + MPA;lane 3, DNA + 2; lane 4, DNA + 3; lane 5, DNA + 1 + MPA; lane 6,DNA + 2 + MPA; lane 7, DNA + 3 + MPA; lane 8, DNA + distamycin-A(100 mM) + MPA; lane 9, DNA + distamycin-A (100 mM) + 2 + MPA;lane 10, DNA + distamycin-A (100 mM) + 3 + MPA.
The reactive species involved in the DNA cleavage reac-tion is believed to be a two-electron reduced complex with a(m-oxo)diiron(II) core in DNA-bound form. The cyclic voltammet-ric study on the diiron(III) complexes in absence of DNA showedthe formation of inactive [Fe(B)3]2+ species on a cathodic scan. Asimilar observation was made from the reaction of the diiron(III)complexes with MPA in absence of DNA showing the appearanceof a visible spectral band of [Fe(B)3]2+.30 The monomeric iron(II)complexes of phenanthroline bases were, however, found tobe chemical nuclease inactive.30b To circumvent the problemassociated with the degradation of the (m-oxo)diiron(III) core inthe presence of a reducing agent, the SC DNA was incubated withthe complexes for 1 h prior to the addition of MPA.
To explore the DNA groove binding preference of the com-plexes, the DNA cleavage activity of the complexes was studiedin the presence of DNA minor groove binder distamycin-A.79
A significant inhibition in the DNA cleavage was observedsuggesting minor groove binding propensity of the complexes(Fig. 7). Mechanistic aspects of the chemical nuclease activitywere studied using different additives. Addition of singlet oxygenquenchers like NaN3 or L-histidine did not show any apparentinhibition in the DNA cleavage activity but hydroxyl radicalscavengers like DMSO, KI and catalase or superoxide dismutase(SOD) as superoxide scavenger showed significant inhibitory effectin the chemical nuclease activity (ESI Fig. S12†). The mechanisticdata suggest that the DNA cleavage reaction of the complexesin the presence of MPA proceeds via hydroxyl radical pathwayfollowing the Fenton like chemistry in which the reduced ironcenters in DNA-bound form could activate molecular oxygen togenerate reactive superoxide and subsequently hydroxyl radicalspecies.80
DNA photocleavage activity
Photo-induced DNA cleavage activity of the oxo-bridged di-iron(III) complexes was studied using SC pUC19 DNA (0.2 mg,30 mM) in 50 mM Tris-HCl/NaCl buffer (pH, 7.2) on irradiationwith a monochromatic UV-A light of 365 nm (6 W) and visible lightof wavelengths 458, 520 and 647 nm (50 mW) using a CW argon–krypton mixed gas ion laser. Complexes 2 and 3 showed efficientDNA cleavage activity in UV-A light (Fig. 8). The bpy complex1 was cleavage inactive possibly due to its poor DNA bindingpropensity. The DNA cleavage activity at 365 nm follows the order:3 > 2 >> 1. A 5 mM concentration of 3 on 2 h of photoexposureshowed essentially complete cleavage of SC DNA with significantamount of linear DNA formation (~40%) (lane 4, Fig. 8). Complex2 showed similar cleavage activity (~90%), but with only DNAsingle-strand breaks (lane 3, Fig. 8). Control experiments revealedthat Fe(NO3)3·9H2O, phen, dpq or L-histidine alone of 80 mMconcentration did not show any significant photocleavage ofDNA on photoexposure at this wavelength. Again, the complexes(40 mM) in the dark or under argon atmosphere were inactive thusruling out the possibility of any hydrolytic cleavage of DNA. Thephoto-induced DNA cleavage activity of the phen and dpqcomplexes could be due to photo-decarboxylation of L-histidineinvolving the Fe(III)-carboxylate bond and the quinoxaline moietyof dpq in 3 having conjugated C=N bonds generating photoexcited3(n–p*) and/or 3(p–p*) state(s) to activate molecular oxygen.81
Fig. 8 Gel electrophoresis diagram showing the photo-induced SCpUC19 DNA (0.2 mg, 30 mM bp) cleavage activity of 1–3 (5 mM at 365 nmand 40 mM in visible light) with a photoexposure time of 2 h: lane 1, DNAcontrol (l, 365 nm); lane 2, DNA + 1 (l, 365 nm); lane 3, DNA + 2 (l,365 nm); lane 4, DNA + 3 (l, 365 nm); lane 5, DNA + 2 (l, 458 nm); lane6, DNA + 3 (l, 458 nm); lane 7, DNA + 2 (l, 520 nm); lane 8, DNA + 3(l, 520 nm); lane 9, DNA + 2 (l, 647 nm); lane 10, DNA + 3 (l, 647 nm).The laser power used was 50 mW using CW Ar–Kr laser.
Complexes 2 and 3 on photo-exposure to visible light showedsignificant DNA photocleavage activity (Table 4, Fig. 8). Weselected 520 nm wavelength for photoactivation based on themetal-centered band near 520 nm in the complexes. Additionally,we explored DNA photocleavage activity at 647 nm that fallsin the PDT spectral window. Complex 3 exhibited essentiallycomplete cleavage of SC DNA on photoirradiation at both 458and 520 nm (lanes 6 and 8, Fig. 8) with significant amount oflinear DNA formation but showed less DNA cleavage (~35%)at 647 nm with no linear DNA (lane 10, Fig. 8). The extentof linear DNA formation was found to be more at shorterwavelengths, possibly due to photoactivation of the dpq ligandand photodecarboxylation of L-his in blue or UV-A light. Thephen complex 2 also showed significant DNA cleavage activityon photoexcitation at 458 and 520 nm but less cleavage in redlight with only single-strand breaks at all these wavelengths (lanes5, 7, 9 in Fig. 8). The DNA double-strand breaks of DNA by3 could be rationalized from the molecular docking calculations(Fig. 6). The complex was able to dock into the minor groove
4678 | Dalton Trans., 2009, 4671–4682 This journal is © The Royal Society of Chemistry 2009
Table 4 Selected photoinduced SC pUC19 DNA (0.2 mg, 30 mM bp)cleavage data for the complexes 1–3
Sl. No. Reaction conditions la/nm ([complex]/mM) % (II + III)
1. DNA control 365 22. DNA + Fe(NO3)3·9H2Ob 365 43. DNA + phenb 365 64. DNA + dpqb 365 95. DNA + L-histidineb 365 56. DNA + 2 In dark (40) 77. DNA + 3 In dark (40) 108. DNA + 1 365 (5) 109. DNA + 2 365 (5) 90
458 (40) 85520 (40) 65647 (40) 25
10. DNA + 3 365 (5) 56 + 40458 (40) 60 + 35520 (40) 66 + 27647 (40) 35
a Wavelengths used for DNA photocleavage: l = 365 nm (6 W UV lamp),l = 458, 520 and 647 nm (CW Ar–Kr laser, 50 mW), b The concentrationof Fe(NO3)3·9H2O, phen, dpq or L-histidine was 80 mM.
of the DNA by structural flipping of the dpq rings from syn toanti conformation around the linear Fe–O–Fe bond and was ableto access both the strands for cleavage (chain A and chain B ofthe DNA dodecamer used for docking study). The inability ofcomplex 2 to effect DNA double-strand breaks could be due tothe presence of photo-inactive phen ligands.
The mechanistic aspects of the photo-induced DNA cleavageactivity of the complexes 2 and 3 at 520 nm was investigatedusing various additives (Fig. 9). The complexes did not show anyappreciable DNA photocleavage activity under argon suggestingthe involvement of reactive oxygen species (ROS) in the DNAcleavage reactions. Addition of singlet oxygen quenchers likeL-histidine, sodium azide (NaN3) or TEMP under aerobic con-dition did not show any inhibitory effect on the DNA cleavageactivity. The hydroxyl radical scavengers like KI, DMSO orcatalase and superoxide radical scavenger superoxide dismutase(SOD), however, showed significant inhibition in the DNAcleavage activity of the complexes. The mechanistic data indicate
Fig. 9 The bar diagram showing mechanistic aspects of the visiblelight-induced SC pUC19 DNA (0.2 mg, 30 mM bp) cleavage activity ofthe complexes 2 and 3 in the presence of various additives (NaN3, TEMP,L-his and KI of 500 mM; DMSO, 6 mL; catalase and SOD of 4 units). Thewavelength used for 2 h photo-exposure of 2 and 3 (40 mM) was 520 nm.
the involvement of hydroxyl radical (∑OH) as the DNA damagingagent.
Complex 3 in the absence of DNA, on photoexcitation at 365 nmunder argon, showed the appearance of two intense bands at 512and 475 nm that are assignable to the MLCT transitions of abinary dpq–iron(II) complex.30 The binary complex was found tobe photonuclease inactive in visible light. When 3 (0.4 mM) wasphotoexposed to 365 nm for 30 min in the presence of 5,5-dimethyl-1-pyrroline-N-oxide (DMPO, 20 mM) under aerobic condition,the formation of DMPO–∑OH adduct was observed from thecharacteristic EPR signal of the species (Fig. 10). The aN andaH values of 14.5 and 14.6 G observed for the DMPO-stabilizedhydroxyl radical compared well with the reported value of 14.9 G(aN = aH).82
Fig. 10 (a) Spectral traces showing the enhancement of the Fe(II)–dpq(LMCT) band intensity on photoexposure of complex 3 (50 mM) at 365 nmfor 20 min. (b) EPR spectra of complex 3 (0.4 mM) in the presence ofDMPO (20 mM) in water before (i) and after (ii) photo-irradiation withUV-A light of 365 nm for 30 min.
The mechanistic data suggest a photo-redox pathway for thephoto-induced DNA cleavage reactions of 2 and 3 in which photo-decarboxylation involving the Fe(III)–carboxylate(L-his) moietiesreduce Fe(III) to Fe(II) which in turn reacts with molecular oxygento produce superoxide radical and subsequently hydroxyl radicalunder aerobic conditions (Fig. 11).30b,83
Fig. 11 The proposed photo-redox pathway involved in the oxidativecleavage of DNA or BSA by the complexes 2 and 3.
BSA protein binding
The interaction of bovine serum albumin protein with the com-plexes 1–3 was investigated by tryptophan emission-quenchingexperiments. The fluorescence property of BSA in buffer mediumis due to the presence of tryptophan residues (trp-134 and trp-214).The emission intensity of BSA was found to quench gradually onincreasing the complex concentration because of changes in thesecondary/tertiary structure of BSA in phosphate buffer medium
This journal is © The Royal Society of Chemistry 2009 Dalton Trans., 2009, 4671–4682 | 4679
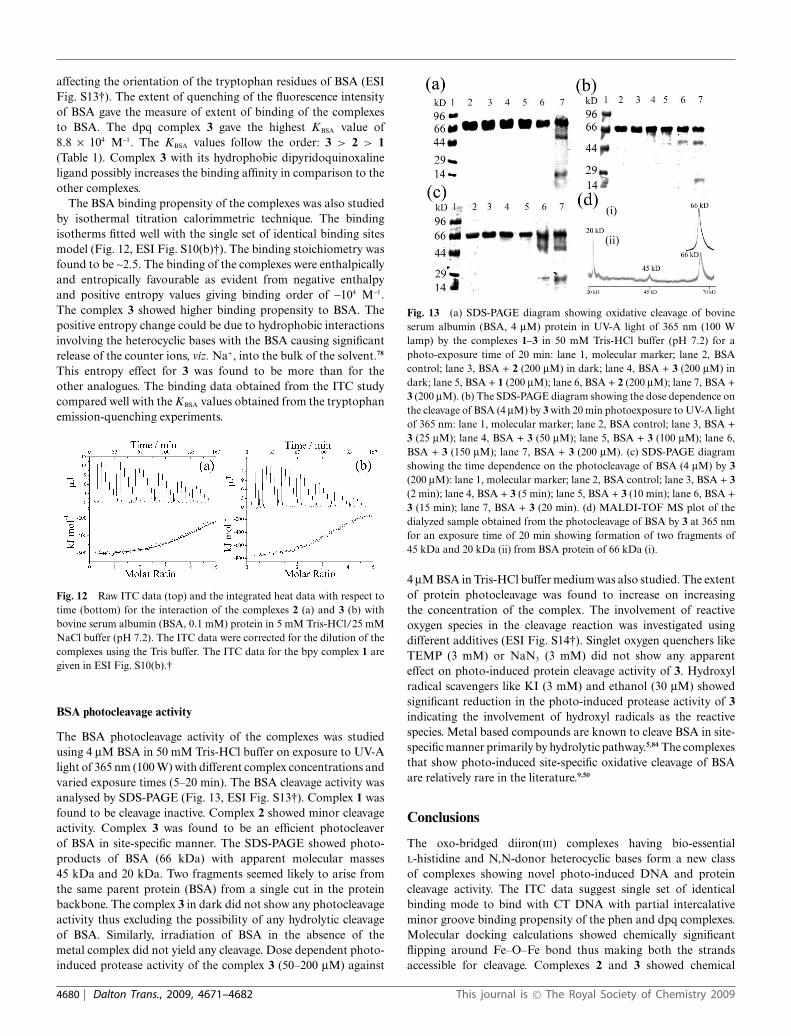
affecting the orientation of the tryptophan residues of BSA (ESIFig. S13†). The extent of quenching of the fluorescence intensityof BSA gave the measure of extent of binding of the complexesto BSA. The dpq complex 3 gave the highest KBSA value of8.8 ¥ 104 M-1. The KBSA values follow the order: 3 > 2 > 1(Table 1). Complex 3 with its hydrophobic dipyridoquinoxalineligand possibly increases the binding affinity in comparison to theother complexes.
The BSA binding propensity of the complexes was also studiedby isothermal titration calorimmetric technique. The bindingisotherms fitted well with the single set of identical binding sitesmodel (Fig. 12, ESI Fig. S10(b)†). The binding stoichiometry wasfound to be ~2.5. The binding of the complexes were enthalpicallyand entropically favourable as evident from negative enthalpyand positive entropy values giving binding order of ~104 M-1.The complex 3 showed higher binding propensity to BSA. Thepositive entropy change could be due to hydrophobic interactionsinvolving the heterocyclic bases with the BSA causing significantrelease of the counter ions, viz. Na+, into the bulk of the solvent.78
This entropy effect for 3 was found to be more than for theother analogues. The binding data obtained from the ITC studycompared well with the KBSA values obtained from the tryptophanemission-quenching experiments.
Fig. 12 Raw ITC data (top) and the integrated heat data with respect totime (bottom) for the interaction of the complexes 2 (a) and 3 (b) withbovine serum albumin (BSA, 0.1 mM) protein in 5 mM Tris-HCl/25 mMNaCl buffer (pH 7.2). The ITC data were corrected for the dilution of thecomplexes using the Tris buffer. The ITC data for the bpy complex 1 aregiven in ESI Fig. S10(b).†
BSA photocleavage activity
The BSA photocleavage activity of the complexes was studiedusing 4 mM BSA in 50 mM Tris-HCl buffer on exposure to UV-Alight of 365 nm (100 W) with different complex concentrations andvaried exposure times (5–20 min). The BSA cleavage activity wasanalysed by SDS-PAGE (Fig. 13, ESI Fig. S13†). Complex 1 wasfound to be cleavage inactive. Complex 2 showed minor cleavageactivity. Complex 3 was found to be an efficient photocleaverof BSA in site-specific manner. The SDS-PAGE showed photo-products of BSA (66 kDa) with apparent molecular masses45 kDa and 20 kDa. Two fragments seemed likely to arise fromthe same parent protein (BSA) from a single cut in the proteinbackbone. The complex 3 in dark did not show any photocleavageactivity thus excluding the possibility of any hydrolytic cleavageof BSA. Similarly, irradiation of BSA in the absence of themetal complex did not yield any cleavage. Dose dependent photo-induced protease activity of the complex 3 (50–200 mM) against
Fig. 13 (a) SDS-PAGE diagram showing oxidative cleavage of bovineserum albumin (BSA, 4 mM) protein in UV-A light of 365 nm (100 Wlamp) by the complexes 1–3 in 50 mM Tris-HCl buffer (pH 7.2) for aphoto-exposure time of 20 min: lane 1, molecular marker; lane 2, BSAcontrol; lane 3, BSA + 2 (200 mM) in dark; lane 4, BSA + 3 (200 mM) indark; lane 5, BSA + 1 (200 mM); lane 6, BSA + 2 (200 mM); lane 7, BSA +3 (200 mM). (b) The SDS-PAGE diagram showing the dose dependence onthe cleavage of BSA (4 mM) by 3 with 20 min photoexposure to UV-A lightof 365 nm: lane 1, molecular marker; lane 2, BSA control; lane 3, BSA +3 (25 mM); lane 4, BSA + 3 (50 mM); lane 5, BSA + 3 (100 mM); lane 6,BSA + 3 (150 mM); lane 7, BSA + 3 (200 mM). (c) SDS-PAGE diagramshowing the time dependence on the photocleavage of BSA (4 mM) by 3(200 mM): lane 1, molecular marker; lane 2, BSA control; lane 3, BSA + 3(2 min); lane 4, BSA + 3 (5 min); lane 5, BSA + 3 (10 min); lane 6, BSA +3 (15 min); lane 7, BSA + 3 (20 min). (d) MALDI-TOF MS plot of thedialyzed sample obtained from the photocleavage of BSA by 3 at 365 nmfor an exposure time of 20 min showing formation of two fragments of45 kDa and 20 kDa (ii) from BSA protein of 66 kDa (i).
4 mM BSA in Tris-HCl buffer medium was also studied. The extentof protein photocleavage was found to increase on increasingthe concentration of the complex. The involvement of reactiveoxygen species in the cleavage reaction was investigated usingdifferent additives (ESI Fig. S14†). Singlet oxygen quenchers likeTEMP (3 mM) or NaN3 (3 mM) did not show any apparenteffect on photo-induced protein cleavage activity of 3. Hydroxylradical scavengers like KI (3 mM) and ethanol (30 mM) showedsignificant reduction in the photo-induced protease activity of 3indicating the involvement of hydroxyl radicals as the reactivespecies. Metal based compounds are known to cleave BSA in site-specific manner primarily by hydrolytic pathway.5,84 The complexesthat show photo-induced site-specific oxidative cleavage of BSAare relatively rare in the literature.9,50
Conclusions
The oxo-bridged diiron(III) complexes having bio-essentialL-histidine and N,N-donor heterocyclic bases form a new classof complexes showing novel photo-induced DNA and proteincleavage activity. The ITC data suggest single set of identicalbinding mode to bind with CT DNA with partial intercalativeminor groove binding propensity of the phen and dpq complexes.Molecular docking calculations showed chemically significantflipping around Fe–O–Fe bond thus making both the strandsaccessible for cleavage. Complexes 2 and 3 showed chemical
4680 | Dalton Trans., 2009, 4671–4682 This journal is © The Royal Society of Chemistry 2009
nuclease activity in the presence of a reducing agent (MPA) andsignificant photo-induced DNA cleavage activity in UV-A andvisible light. Significant results of this study include double strandDNA cleavage activity of complex 3, significant photo-inducedDNA cleavage activity within the PDT window by 2 and 3,rationalization of the DNA double-strand breaks from theoreticalcalculations and photo-induced site-specific BSA cleavage activityof complex 3. The DNA photocleavage activity presumably occursfrom a photodecarboxylation process involving the carboxylatemoiety of the metal-bound L-histidine ligand. The reaction seemsto follow a photo-redox pathway generating reactive Fe(II) centersforming hydroxyl radicals under aerobic medium thus modelingthe Fe(II)–bleomycin activity. The results are of importance indesigning new iron-based synthetic photonucleases and photo-proteases having bio-essential amino acids/peptides for potentialapplications in PDT and as anti-metastasis agents targeting bothprimary and secondary tumors.
Acknowledgements
We thank the Department of Science and Technology (DST), Gov-ernment of India, and the Council of Scientific and Industrial Re-search (CSIR), New Delhi, for financial support [SR/S5/MBD-02/2007 and 01(2081)/06/EMR-II]. We also thank the Alexandervon Humboldt Foundation, Germany, for donation of an electro-analytical system. We sincerely thank Prof. S. Ramakrishnan ofour department for providing the ITC facility and Mr RitankarMajumdar of the department of Molecular Reproduction, Devel-opment and Genetics for protein dialysis study. TB is thankfulto CSIR for research fellowship. ARC thanks DST for J. C. BoseFellowship.
References
1 (a) D. S. Sigman, A. Mazumder and D. M. Perrin, Chem. Rev., 1993,93, 2295; (b) D. S. Sigman, Acc. Chem. Res., 1986, 19, 180.
2 L. K. J. Boerner and J. M. Zaleski, Curr. Opin. Chem. Biol., 2005, 9,135.
3 G. Pratviel, J. Bernadou and B. Meunier, Angew. Chem., Int. Ed. Engl.,1995, 34, 746.
4 C. Metcalfe and J. A. Thomas, Chem. Soc. Rev., 2003, 32, 215.5 H. T. Chifotides and K. R. Dunbar, Acc. Chem. Res., 2005, 38, 146.6 (a) A. Sreedhara and J. A. Cowan, JBIC, J. Biol. Inorg. Chem., 2001, 6,
337; (b) J. Reedijk, J. Inorg. Biochem., 2001, 86, 89; (c) S. E. Wolkenbergand D. L. Boger, Chem. Rev., 2002, 102, 2477.
7 (a) N. J. Farrer and P. J. Sadler, Aust. J. Chem., 2008, 61, 669; (b) P. C. A.Bruijnincx and P. J. Sadler, Curr. Opin. Chem. Biol., 2008, 12, 197.
8 (a) H. Y. Sang, J. L. Byoung, H. Kim and J. Suh, J. Am. Chem. Soc.,2005, 127, 9593; (b) S. A. Stoffregen, A. K. K. Griffin and N. M. Kostic,Inorg. Chem., 2005, 44, 8899; (c) V. Rajendiran, M. Palaniandavar, P.Swaminathan and L. Uma, Inorg. Chem., 2007, 46, 10446.
9 C. V. Kumar, A. Buranaprapuk, G. J. Opitech, M. B. Moyer, S. Jockuschand N. J. Turro, Proc. Natl. Acad. Sci. U. S. A., 1998, 95, 10361.
10 J. J. Thomas, R. Bakhtiar and G. Siuzdak, Acc. Chem. Res., 2000, 33,179.
11 R. Bonnett, Chemical Aspects of Photodynamic Therapy, Gordon &Breach, London, UK, 2000.
12 M. R. Detty, S. L. Gibson and S. J. Wagner, J. Med. Chem., 2004, 47,3897.
13 M. C. De Rosa and R. J. Crutchley, Coord. Chem. Rev., 2002, 233–234,351.
14 B. W. Henderson, T. M. Busch, L. A. Vaughan, N. P. Frawley, D. Babich,T. A. Sosa, J. D. Zollo, A. S. Dee, M. T. Cooper, D. A. Bellnier, W. R.Greco and A. R. Oseroff, Cancer Res., 2000, 60, 525.
15 W.-H. Wei, Z. Wang, T. Mizuno, C. Cortez, L. Fu, M. Sirisawad, L.Naumovski, D. Magda and J. L. Sessler, Dalton Trans., 2006, 1934.
16 M. Ochsner, J. Photochem. Photobiol., B, 1996, 32, 3.17 C. M. Allen, W. M. Sharman and J. E. van Lier, Tumor Targeting Cancer
Ther., 2002, 329.18 (a) D. Ramaiah, I. Eckert, K. T. Arun, L. Weidenfeller and B. Epe,
Photochem. Photobiol., 2004, 79, 99; (b) M. Kar and A. Basak, Chem.Rev., 2007, 107, 2861.
19 S. Atilgan, Z. Ekmekci, A. L. Dogan, D. Guc and E. U. Akkaya, Chem.Commun., 2006, 4398.
20 F. S. Mackay, J. A. Woods, P. Heringova, J. Kasparkova, A. M. Pizarro,S. Parsons, V. Brabec and P. J. Sadler, Proc. Natl. Acad. Sci. U. S. A.,2007, 104, 20743.
21 (a) A. M. Angeles-Boza, H. T. Chifotides, J. D. Aguirre, A. Chouai,P. K.-L. Fu, K. R. Dunbar and C. Turro, J. Med. Chem., 2006, 49,6841; (b) A. M. Angeles-Boza, P. M. Bradley, P. K.-L. Fu, S. E. Wicke,J. Bacsa, K. R. Dunbar and C. Turro, Inorg. Chem., 2004, 43, 8510;(c) D. A. Lutterman, P. K. L. Fu and C. Turro, J. Am. Chem. Soc.,2006, 128, 738.
22 M. Brindell, E. Kulis, S. K. C. Elmroth, K. Urbanska and G. Stochel,J. Med. Chem., 2005, 48, 7298.
23 W. X. Belliston-Bittner, A. R. Dunn, Y. H. L. Nguyen, D. J. Stuehr,J. R. Winkler and H. B. Gray, J. Am. Chem. Soc., 2005, 127, 15907.
24 (a) A. M. Funston, C. Cullinane, K. P. Ghiggino, W. D. McFadyen,S. S. Stylli and P. A. Tregloan, Aust. J. Chem., 2005, 58, 206; (b) I. J.Bigio and S. G. Bown, Cancer Biol. Ther., 2004, 3, 259.
25 M. J. Rose, N. L. Fry, R. Marlow, L. Hinck and P. K. Mascharak,J. Am. Chem. Soc., 2008, 130, 8834.
26 S. Dhar, D. Senapati, P. K. Das, P. Chattopadhyay, M. Nethaji andA. R. Chakravarty, J. Am. Chem. Soc., 2003, 125, 12118.
27 A. K. Patra, S. Dhar, M. Nethaji and A. R. Chakravarty, Chem.Commun., 2003, 1562.
28 S. Dhar, D. Senapati, P. A. N. Reddy, P. K. Das and A. R. Chakravarty,Chem. Commun., 2003, 2452.
29 P. K. Sasmal, A. K. Patra, M. Nethaji and A. R. Chakravarty, Inorg.Chem., 2007, 46, 11112.
30 (a) M. Roy, B. Pathak, A. K. Patra, E. D. Jemmis, M. Nethaji andA. R. Chakravarty, Inorg. Chem., 2007, 46, 11122; (b) M. Roy, R.Santhanagopal and A. R. Chakravarty, Dalton Trans., 2009, 1024.
31 M. Roy, S. Saha, A. K. Patra, M. Nethaji and A. R. Chakravarty, Inorg.Chem., 2007, 46, 4368.
32 S. Saha, R. Mazumdar, M. Roy, R. R. Dighe and A. R. Chakravarty,Inorg. Chem., 2009, 48, 2652.
33 M. Roy, T. Bhowmick, S. Ramakumar, M. Nethaji and A. R.Chakravarty, Dalton Trans., 2008, 3542.
34 R. M. Burger, Chem. Rev., 1998, 98, 1153.35 R. P. Hertzberg and P. B. Dervan, J. Am. Chem. Soc., 1982, 104, 313.36 T. A. Van Den Berg, B. L. Feringa and G. Roelfes, Chem. Commun.,
2007, 180.37 T. M. Rana and C. F. Meares, J. Am. Chem. Soc., 1991, 113, 1859.38 T. M. Rana and C. F. Meares, J. Am. Chem. Soc., 1990, 112, 2457.39 T. M. Rana and C. F. Meares, Proc. Natl. Acad. Sci. U. S. A., 1991, 88,
10578.40 J. B. Ghaim, D. P. Greiner, C. F. Meares and R. B. Gennis, Biochemistry,
1995, 34, 11311.41 N. Ettner, G. A. Ellestad and W. Hillen, J. Am. Chem. Soc., 1993, 115,
2546.42 N. Ettner, J. W. Metzger, T. Lederer, J. D. Hulmes, C. Kisker, W.
Hinrichs, G. Ellestad and W. Hillen, Biochemistry, 1995, 34, 22.43 R. Miyake, J. T. Owens, D. Xu, W. M. Jackson and C. F. Meares, J. Am.
Chem. Soc., 1999, 121, 7453.44 G. Plourde, II, A. El-Shafey, F. S. Fouad, A. S. Purohit and G. B. Jones,
Bioorg. Med. Chem. Lett., 2002, 12, 2985.45 F. S. Fouad, J. M. Wright, G. Plourde, II, A. D. Purohit, J. K. Wyatt,
A. El-Shafey, G. Hynd, C. F. Crasto, Y. Lin and G. B. Jones, J. Org.Chem., 2005, 70, 9789.
46 A. Suzuki, M. Hasegawa, M. Ishii, S. Matsumura and K. Toshima,Bioorg. Med. Chem. Lett., 2005, 15, 4624.
47 S. Tanimoto, S. Matsumura and K. Toshima, Chem. Commun., 2008,3678.
48 C. V. Kumar and A. Buranaprapuk, Angew. Chem., Int. Ed. Engl., 1997,36, 2085.
49 C. V. Kumar and J. Thota, Inorg. Chem., 2005, 44, 825.50 J. Thota, K. Bandara and C. V. Kumar, Photochem. Photobiol. Sci.,
2008, 7, 1531 and references therein.51 (a) A. Bergamo and G. Sava, Dalton Trans., 2007, 1267; (b) P. J. Dyson
and G. Sava, Dalton Trans., 2006, 1929.
This journal is © The Royal Society of Chemistry 2009 Dalton Trans., 2009, 4671–4682 | 4681
52 H.-K. Liu, S. J. Berners-Price, F. Wang, J. A. Parkinson, J. Xu, J. Bellaand P. J. Sadler, Angew. Chem., Int. Ed., 2006, 45, 8153.
53 S. Pacor, S. Zorzet, M. Cocchietto, M. Bacac, M. Vadori, C. Turrin, B.Gava, A. Castellarin and G. Sava, J. Pharmacol. Exp. Ther., 2004, 310,737.
54 G. Sava, I. Capozzi, K. Clerici, R. Gagliardi, E. Alessio and G.Mestroni, Clin. Exp. Metastasis, 1998, 16, 371.
55 D. D. Perrin, W. L. F. Armarego and D. R. Perrin, Purification ofLaboratory Chemicals, Pergamon Press, Oxford, U. K. 1980.
56 J. G. Collins, A. D. Sleeman, J. R. Aldrich-Wright, I. Greguric and T. W.Hambley, Inorg. Chem., 1998, 37, 3133.
57 R. L. Dutta and A. Syamal, Elements of Magnetochemistry, AffiliatedEast-West Press, New Delhi, 2nd edn, 1993.
58 C. J. O’Connor, Prog. Inorg. Chem., 1982, 29, 203.59 G. M. Sheldrick, SADABS, Version 2. Multi-Scan Absorption Correc-
tion Program, Universitat Gottingen, Gottingen, Germany, 2001.60 G. M. Sheldrick, SHELX-97, Programs for Crystal Structure Solution
and Refinement, Universitat Gottingen, Gottingen, Germany, 1997.61 C. K. Johnson, ORTEP, III Report ORNL-5138Oak Ridge National
Laboratory, Oak Ridge, TN.62 M. E. Reichmann, S. A. Rice, C. A. Thomas and P. Doty, J. Am. Chem.
Soc., 1954, 76, 3047.63 J. D. McGhee and P. H. von Hippel, J. Mol. Biol., 1974, 86, 469.64 M. T. Carter, M. Rodriguez and A. J. Bard, J. Am. Chem. Soc., 1989,
111, 8901.65 (a) J.-B. LePecq and C. Paoletti, J. Mol. Biol., 1967, 27, 87; (b) S. Neidle,
Nat. Prod. Rep., 2001, 18, 291.66 V. G. Cohen and H. Eisenberg, Biopolymers, 1969, 8, 45.67 A. Rentmeister, G. Mayer, N. Kuhn and M. Famulok, Biol. Chem.,
2008, 389, 127.68 Structure-based drug design with discovery studio, Accelrys, version 0406,
Accelrys Software Inc., San Diego, 2003.69 M. J. Frisch, G. W. Trucks, H. B. Schlegel, G. E. Scuseria, M. A. Robb,
J. R. Cheeseman, J. A. Montgomery, Jr., T. Vreven, K. N. Kudin, J. C.Burant, J. M. Millam, S. S. Iyengar, J. Tomasi, V. Barone, B. Mennucci,M. Cossi, G. Scalmani, N. Rega, G. A. Petersson, H. Nakatsuji, M.Hada, M. Ehara, K. Toyota, R. Fukuda, J. Hasegawa, M. Ishida, T.Nakajima, Y. Honda, O. Kitao, H. Nakai, M. Klene, X. Li, J. E.Knox, H. P. Hratchian, J. B. Cross, V. Bakken, C. Adamo, J. Jaramillo,
R. Gomperts, R. E. Stratmann, O. Yazyev, A. J. Austin, R. Cammi,C. Pomelli, J. Ochterski, P. Y. Ayala, K. Morokuma, G. A. Voth, P.Salvador, J. J. Dannenberg, V. G. Zakrzewski, S. Dapprich, A. D.Daniels, M. C. Strain, O. Farkas, D. K. Malick, A. D. Rabuck, K.Raghavachari, J. B. Foresman, J. V. Ortiz, Q. Cui, A. G. Baboul, S.Clifford, J. Cioslowski, B. B. Stefanov, G. Liu, A. Liashenko, P. Piskorz,I. Komaromi, R. L. Martin, D. J. Fox, T. Keith, M. A. Al-Laham, C. Y.Peng, A. Nanayakkara, M. Challacombe, P. M. W. Gill, B. G. Johnson,W. Chen, M. W. Wong, C. Gonzalez and J. A. Pople, GAUSSIAN 03(Revision C.02), Gaussian, Inc., Wallingford, CT, 2004.
70 J. M. Rademaker-Lakhai, D. Van Den Bongard, D. Pluim, J. H. Beijnenand J. H. M. Schellens, Clin. Cancer Res., 2004, 10, 3717.
71 J. Bernadou, G. Pratviel, F. Bennis, M. Girardet and B. Meunier,Biochemistry, 1989, 28, 7268.
72 C. V Kumar, A. Buranaprapuk, H. C. Sze, S. Jockusch and N. J. Turro,Proc. Natl. Acad. Sci. U. S. A., 2002, 99, 5810.
73 R. E. Norman, S. Yan, L. Que, Jr., G. Backes, J. Ling, J. S. Loehr, J. H.Zhang and C. J. O’Connor, J. Am. Chem. Soc., 1990, 112, 1554.
74 S. Menage, J. M. Vincent, C. Lambeaux, G. Chottard, A. Grand andM. Fontecave, Inorg. Chem., 1993, 32, 4766.
75 Q. X. Wang, K. Jiao, W. Sun, F. F. Jian and X. Hu, Eur. J. Inorg. Chem.,2006, 1838.
76 R. B. Nair, E. S. Teng, S. L. Kirkland and C. J. Murphy, Inorg. Chem.,1998, 37, 139.
77 C. Rajput, R. Rutkaite, L. Swanson, I. Haq and J. A. Thomas, Chem.–Eur. J., 2006, 12, 4611.
78 C. Metcalfe, I. Haq and J. A. Thomas, Inorg. Chem., 2004, 43, 317.79 U. Koen, S. Jiri and V. M. Luc, Eur. J. Biochem., 2002, 269, 2868.80 T. A. Van Den Berg, B. L. Feringa and G. Roelfes, Chem. Commun.,
2007, 180.81 K. Toshima, R. Takano, T. Ozawa and S. Matsumura, Chem. Commun.,
2002, 212.82 S. Xu, S. Zhang, S. Chen, M. Zhang and T. Shen, Photochem. Photobiol.
Sci., 2003, 2, 871.83 P. Hanson, J. R. L. Smith and V. A. Osborne, J. Chem. Soc., Perkin
Trans. 2, 1998, 2653.84 M. C. B. de Oliveira, M. Scarpellini, A. Neves, H. Terenzi, A. J.
Bortoluzzi, B. Szpoganics, A. Greatti, A. S. Mangrich, E. M. de Souza,P. M. Fernandez and M. R. Soares, Inorg. Chem., 2005, 44, 921.
4682 | Dalton Trans., 2009, 4671–4682 This journal is © The Royal Society of Chemistry 2009


![Cyclodextrin-mediated entrapment of curcuminoid 4-[3,5-bis(2-chlorobenzylidene-4-oxo-piperidine-1-yl)-4-oxo-2-butenoic acid] or CLEFMA in liposomes for treatment of xenograft lung](https://static.fdokumen.com/doc/165x107/6313dbe3fc260b71020f4934/cyclodextrin-mediated-entrapment-of-curcuminoid-4-35-bis2-chlorobenzylidene-4-oxo-piperidine-1-yl-4-oxo-2-butenoic.jpg)

![4-[(2,4-Difluorophenyl)hydrazinylidene]-3-methyl-5-oxo-4,5-dihydro-1 H -pyrazole-1-carbothioamide](https://static.fdokumen.com/doc/165x107/63448600596bdb97a9087f01/4-24-difluorophenylhydrazinylidene-3-methyl-5-oxo-45-dihydro-1-h-pyrazole-1-carbothioamide.jpg)