Acquisitions Driven by Stock Overvaluation - 2011 European ...
43
Acquisitions Driven by Stock Overvaluation: Are They Good Deals? * Fangjian Fu Singapore Management University Lee Kong Chian School of Business 50 Stamford Road Singapore 178899 Email: [email protected] Telephone: (+65) 6828 0244 Leming Lin University of Florida Warrington College of Business Administration Gainesville, FL 32611-7150 Email: [email protected] Telephone: (352) 226-6409 Micah Officer Loyola Marymount University College of Business Administration Hilton Center for Business, 1 LMU Drive Los Angeles, CA 90045-2659 Email: [email protected] Telephone: (310) 338-7658 This draft: July 2011 First draft: June 2008 * We are grateful to Tom Bates, Jie Cai, Alex Edmans, Vidhan Goyal, Iftekhar Hasan, Shane Heitzman, David Hirshleifer, Mike Lemmon, Li Jin, Roger Loh, Michelle Lowry, Tom Noe, Matt Rhodes-Kropf, Bill Schwert, Cliff Smith, Mike Stegemoller, Geoffrey Tate, Cong Wang, An Yan, and seminar participants at Chinese University of Hong Kong, National University of Singapore, Queen’s University at Canada, Rensselaer Polytechnic Institute, Singapore Management University, University of Connecticut, University of Rochester, 2009 FMA Asian and North American meetings, 2010 China International Conference in Finance, and 2010 City University of Hong Kong Corporate Finance Conference for helpful comments and discussion. Fu acknowledges the financial support of SMU research grant No. C207/MSS8B002.
-
Upload
khangminh22 -
Category
Documents
-
view
0 -
download
0
Transcript of Acquisitions Driven by Stock Overvaluation - 2011 European ...

Acquisitions Driven by Stock Overvaluation: Are They Good Deals?*
Fangjian Fu Singapore Management University
Lee Kong Chian School of Business 50 Stamford Road Singapore 178899
Email: [email protected] Telephone: (+65) 6828 0244
Leming Lin University of Florida
Warrington College of Business Administration Gainesville, FL 32611-7150
Email: [email protected] Telephone: (352) 226-6409
Micah Officer Loyola Marymount University
College of Business Administration Hilton Center for Business, 1 LMU Drive
Los Angeles, CA 90045-2659 Email: [email protected]
Telephone: (310) 338-7658
This draft: July 2011 First draft: June 2008
* We are grateful to Tom Bates, Jie Cai, Alex Edmans, Vidhan Goyal, Iftekhar Hasan, Shane Heitzman, David Hirshleifer, Mike Lemmon, Li Jin, Roger Loh, Michelle Lowry, Tom Noe, Matt Rhodes-Kropf, Bill Schwert, Cliff Smith, Mike Stegemoller, Geoffrey Tate, Cong Wang, An Yan, and seminar participants at Chinese University of Hong Kong, National University of Singapore, Queen’s University at Canada, Rensselaer Polytechnic Institute, Singapore Management University, University of Connecticut, University of Rochester, 2009 FMA Asian and North American meetings, 2010 China International Conference in Finance, and 2010 City University of Hong Kong Corporate Finance Conference for helpful comments and discussion. Fu acknowledges the financial support of SMU research grant No. C207/MSS8B002.

1
Acquisitions Driven by Stock Overvaluation: Are They Good Deals?
Abstract
Overvaluation may motivate a firm to use its stock to acquire a target whose stock is not as overpriced
(Shleifer and Vishny (2003)). Though hypothetically desirable, these acquisitions in practice create little,
if any, value for acquirer shareholders. Two factors often impede value creation: payment of a large
premium to the target and lack of economic synergies in the acquisition. We find that overvaluation-
driven stock acquirers suffer worse operating performance and lower long-run stock returns than control
firms that are in the same industry, similarly overvalued at the same time, have similar size and Tobin’s q,
but have not pursued an acquisition. Our findings suggest that stock overvaluation increases agency costs
and the resulting actions potentially benefit managers more than shareholders (Jensen (2005)).
JEL classification: G34, G14
Keywords: Mergers and acquisitions, Overvaluation, Operating performance, Agency costs, CEO
compensation.

2
1. Introduction
Shleifer and Vishny (2003) posit that stock market overvaluation motivates merger and acquisition
activity, and that deals completed by acquirers with overvalued stock can benefit long-run acquirer
shareholders.1 If a firm’s stock is overvalued, managers have an incentive to use the overpriced stock as
cheap currency to buy a target firm as long as the target’s stock is less overvalued; such acquisitions
would benefit existing acquirer shareholders even if they do not generate economic synergies.2 Empirical
evidence generally supports the claim that stock overvaluation motivates firms to pursue stock-swap
acquisitions: Rhodes-Kropf, Robinson, and Viswanathan (2005), Dong, Hirshleifer, Richardson, and
Teoh (2006), and Ang and Cheng (2006) show that stock acquirers are more overvalued than their targets
before merger announcements and that the level of equity overvaluation increases a firm’s probability of
becoming a bidder and of using stock as the method of payment.
It is a separate question, however, whether (and why) acquirer shareholders actually benefit from
acquisitions motivated by stock overvaluation, as this critically depends on two factors: (i) if acquirers are
able to lock in their relative stock overvaluation advantage in negotiating a favorable exchange ratio with
the target (i.e., pay a low premium); and (ii) whether there are (positive) economic synergies from the
merger or acquisition.
Anecdotal evidence suggests that acquirer shareholders may suffer substantial losses when
overvalued acquirers pursue stock-financed acquisitions. For example, on March 22, 2000, when PSINet
Inc. (an Internet service provider) announced its intention to acquire Metamor Worldwide Inc. (an
information technology consulting firm) in a $1.9 billion stock-swap, The Wall Street Journal hinted that
the acquisition was motivated by PSINet’s stock overvaluation:
1 See, for example, p.301 in Shleifer and Vishny (2003). 2 Why would the target agree to a stock swap with an overvalued acquirer? Shleifer and Vishny (2003) argue that target shareholders might have short investment horizons, hoping they can cash out by selling acquirer shares before the overvaluation is corrected. It is also possible that acquirers make side payments to target managers to agree to support the deal through, for example, acceleration of stock option exercises, severance pay, or promises of future employment. Rhodes-Kropf and Viswanathan (2004) further suggest that targets might over-estimate the potential synergies when market-wide overvaluation is severe.

3
“The deal is also the latest example of how a company such as PSINet can use its highflying stock as currency for stock-swap acquisitions. PSINet’s stock has soared 51% in the past three months, while the stock of Metamor has fallen 45% in the same time period.”3
However, PSINet announced that it would offer 0.9 shares for each share of Metamor, even though its
shares were more than three times more expensive than the shares of Metamor one day earlier ($49.50 vs.
$15.00). The Washington Post noted the next day:
“Wall Street's initial reaction, however, was that the deal was better for Metamor’s stockholders than for PSINet. Metamor’s share price more than doubled, to $33.31, up $17.31 for the day. Meanwhile, shares of PSINet fell 16 percent, to $41.56.”4
Investors often correct the pre-announcement overvaluation of the acquirer’s stock, at least to some
extent, once the acquisition attempt is announced.5 If the drop of PSINet’s stock price merely reflects
investors’ partial correction of the overvaluation, which would occur anyway in an efficient market, the
acquisition might still benefit the long-term shareholders of PSINet if the exchange ratio reflects the
overvaluation of the acquirer before announcement or the deal produces substantial synergies for the
acquirer. But if the merger does not generate large enough economic synergies, and if the drop in
PSINet’s stock price (and the sharp increase in Metamor’s stock price) is driven by PSINet’s
overpayment to Metamor, the acquisition might not be beneficial to PSINet’s long-term shareholders. It
may fail to turn the hypothetical benefits from pre-announcement relative overvaluation into real gains.
It is clear that the acquisition of Metamor did not benefit PSINet’s shareholders. William Schrader,
then CEO of PSINet Inc., acknowledged in an interview a few months later: “We purchased Metamor, in
retrospect, at exactly the wrong time.”6 Six months later, PSINet Inc. filed for bankruptcy. A financial
3 The Wall Street Journal, March 22, 2000. 4 The Washington Post, March 23, 2000. On the day before announcement, the closing price of Metamor was $15.00 and the closing price of PSINet was $49.50. Metamor had a market capitalization of $519.5 million and PSINet had a market capitalization of $7,794 million. 5 This correction of pre-announcement overvaluation is unlikely to be detrimental to long-term buy-and-hold acquirer shareholders if such a correction would have occurred in time anyway absent the acquisition announcement. 6 The New York Times, November 3, 2000

4
analyst (Peter DeCaprio) commented: “One of PSINet’s key wrong moves was buying Metamor… That
started the whole death spiral.”7 On the other hand, the acquisition of Time Warner by the “ridiculously
overvalued” AOL is often regarded as beneficial to AOL shareholders,8 although that deal was heavily
criticized by AOL shareholders and later undone (accompanied by a mea culpa from Steve Case, the main
proponent of the merger).9
In this paper we study mergers and acquisitions of U.S. firms announced and completed during 1985-
2006 to provide evidence on the two questions noted above: (1) do overvalued acquirers substantially
overpay and thus lose the hypothetical benefits from their pre-merger overvaluation? and (2) are
acquisitions motivated by overvaluation justified by long-run synergies? We find that not all stock-swap
acquisitions are necessarily driven by the acquirer’s stock price overvaluation relative to the target. In
about 30% of the stock-swap acquisitions acquirers actually have lower valuation multiples than their
targets. We then identify the stock-swap mergers for which the acquirer has the largest relative stock price
overvaluation compared to the target before the acquisition announcement. If there are acquisitions by
overvalued acquirers that produce the benefits suggested in Shleifer and Vishny (2003), these deals are
likely to provide the best examples. We find that the acquirer’s overvaluation relative to the target, though
substantial before the announcement, quickly dissipates once the deal is announced. Furthermore,
compared with other acquirers, overvalued acquirers incur a substantially larger drop in stock price
around bid announcement. This drop in price could be driven by investors’ (partial) correction of acquirer
overvaluation, and long-term shareholders may not view the correction of overvaluation as a real loss.
The price movement of the targets thus conveys more meaningful information about the premium offered
by acquirers (Schwert, 1996). Compared to the targets in other acquisitions, targets in acquisitions by
overvalued acquirers realize significantly larger increases in stock price over the announcement and bid
periods (i.e., higher premiums, even net of the correction of acquirer overvaluation). Reflective of this,
7 USA Today, April 4, 2001 8 See, for example, Dong et al. (2006), Savor and Lu (2009). 9 InfoWorld Daily News, January 13, 2005

5
targets in acquisition driven by stock overvaluation are able to secure more favorable exchange ratios
compared to the pre-merger relative stock prices of the acquirer and target. These higher premiums are
not explained by the differences in the deal, acquirer, or target characteristics, suggesting significant
overpayment to targets by overvalued acquirers. Our evidence on exchange ratios also refutes the notion
that overvalued acquirers are successful in turning their substantial pre-merger relative overvaluation into
a favorable exchange ratio in the consummated deal.
Temporarily overvalued firms could potentially take advantage of the window of opportunity by
issuing new equity at the overvalued price (Loughran and Ritter, 1995). Why do the firms in our sample
choose a stock acquisition over a seasoned equity offering (SEO) when their stock is overpriced? Shleifer
and Vishny (2003) argue that, in addition to exploiting overvaluation, these acquisitions generate
economic synergies while SEOs do not. Therefore, expected synergies might also explain (or justify) the
large premiums paid by overvalued acquirers. To test this hypothesis, we examine operating performance
following acquisitions by overvalued acquirers, but fail to find evidence of positive synergies. Instead,
merged firms in these acquisitions suffer deterioration in operating ROA and asset turnover, while such
deterioration is not found, or is substantially less severe, for firms in cash acquisitions or stock
acquisitions not driven by overvaluation.
If overvalued acquirers had not pursued acquisitions, would their shareholders have been better off?
To answer this counterfactual question, for each overvalued acquirer we identify a contemporaneous
control firm that is in the same industry, and has similar size, Tobin’s q, stock return in the previous year,
and, most importantly, a similar valuation multiple, but does not pursue a merger or equity offering. We
compare the operating and return performance of the overvalued acquirers to the performance of the
control firms. Overvalued acquirers incur significantly worse stock returns during the five years following
acquisitions than the control firms that did not engage in mergers. Overvalued acquirers experience
significant deterioration in operating performance, which is also not observed in the control firms over the
same period.

6
Measuring stock overvaluation based on publicly available information is impossible if markets are
perfectly efficient. Shleifer and Vishny (2003) however assume inefficient markets and suggest that
overvaluation-driven acquisitions – overvalued bidders using stock swaps to acquire less-overvalued
targets – benefit acquirers’ existing shareholders. Our perspective in this study is not to challenge the
assumption of inefficient markets, as misvaluation measures similar to the ones we employ are used by
Rhodes-Kropf, Robinson, and Viswanathan (2005) and Ang and Cheng (2006) to provide evidence in
support of Shleifer and Vishny’s hypothesis. Instead, we show that even if stock overvaluation is
measurable in the Shleifer and Vishny sense, the high premiums paid and the negative operating synergies
typically make deals driven by acquirer stock overvaluation considerably less attractive for long-term
acquirer shareholders.
Our results lead us, however, to the question of what motivates overvalued acquirers to buy less-
overvalued targets if there is little shareholder value creation. Following Harford and Li (2007), we find
that acquirer CEOs in overvaluation-driven acquisitions obtain substantial pecuniary benefits following
these transactions, specifically large new restricted stock and option grants. These large increases in
compensation often outweigh the relatively small decreases in the value of the CEO’s equity holding in
the acquiring firm resulting from the erosion of shareholder wealth described above. Combined, our
findings are consistent with Jensen’s (2005) hypothesis that equity overvaluation generates substantial
agency costs for shareholders: in this case the pursuit of value-destroying acquisitions.
Taken together, our findings cast significant doubt on the effectiveness of acquirers’ use of
temporarily overvalued stock in stock-swap mergers and acquisitions. We demonstrate tangible losses for
overvalued acquiring firms (poor acquisitions that produce negligible, or negative, synergies), and that the
CEOs of these overvalued acquiring firms are generally rewarded with large amounts of, principally
stock-based, incentive compensation. Evidence also suggests overvalued acquirers substantially overpay
their targets, even allowing for the market correction of acquirer overvaluation. These factors appear to
erode most of the gains that would otherwise accrue to an overvalued acquirer buying a less-overvalued

7
target, and our evidence suggests that shareholders would be better off if an overvalued firm did not
pursue an acquisition.
Our study contributes to several recent strands of the M&A literature. In a small sub-sample of
mergers and acquisitions between 1998-2001, Moeller, Schlingemann, and Stulz (2005) show that
acquirer shareholders, in aggregate, lose $240 billion during the three-day announcement period,
principally in acquisitions by what appear to be overvalued acquirers (high market-to-book). Our paper is
different from theirs in that we examine a larger sample of overvalued acquirers over a longer period of
time,10 and that we examine accounting-based metrics of value creation in addition to stock-return based
measures. Dong et al. (2006) find, as we do, that overvalued acquirers suffer more significant stock price
declines at announcement than other categories of acquirers do: the principal differences between our
study and theirs are that we also examine total bid-period returns to acquirers, post-completion operating
performance, and premiums paid to targets.
Several recent papers examine the wealth effects of acquisitions for overvalued acquirers, taking
different perspectives that result in conclusions that are broadly consistent with ours. Gu and Lev (2011)
find that acquisitions driven by equity overvaluation frequently trigger large goodwill write-offs in the
years following the acquisition. They further conclude that the stock prices of the merged firms perform
poorly after the merger beyond the necessary correction of overvaluation – these results suggest, as ours
do, that overvalued acquirers make systematically worse acquisition decisions than acquirers that are not
overvalued. Akbulut (2009) and Song (2007) use acquirer managers’ personal trading decisions (i.e.,
insider trading) to infer overvaluation (instead of the market-/accounting-based metrics used here), and
similarly conclude that such deals are unlikely to benefit acquirer shareholders. On the other hand, Savor
and Lu (2009) focus on unsuccessful acquiring firms and report that unsuccessful stock acquirers earn
10 We select our sample of interest using measures of the relative overvaluation of the bidder to the target, while Moeller, Schlingemann, and Stulz (2005) select their sample by year; they tend to focus on the notable outliers of value destruction in acquisitions occurring at a particular point in time, while our analysis is concerned with the mean outcome from acquisitions occurring over a long period of time.

8
lower long-run stock returns than successful stock acquirers do, concluding that there must be some value
to success in a stock acquisition. Their sample of failed mergers is, however, very small, and it is difficult
to tell whether the failed mergers in their sample are motivated by stock overvaluation (or something
else).
The remainder of the paper proceeds as follows. Section 2 describes our data. Section 3 introduces
our empirical measures of stock overvaluation and identifies acquisitions driven by acquirer
overvaluation. Section 4 examines acquisition premiums and potential overpayment. Section 5 examines
acquisition synergies and post-acquisition operating performance. Section 6 examines long-run stock
returns following acquisition announcements. Section 7 investigates changes in compensation and wealth
of acquirer CEOs following acquisitions and concludes the paper.
2. Data
Our mergers and acquisitions data are obtained from the Securities Data Company’s (SDC) U.S. database.
We use the following criteria to select the final sample:
1) The acquisition is announced and completed between 1985 and 2006.
2) Both the acquirer and target are public firms listed on the NYSE, AMEX, or Nasdaq.
3) The deal value is at least $10 million (in 2006 dollars) and at least 1% of the acquirer’s market
value of equity.
4) The acquirer controls less than 50% of the target’s shares prior to the announcement and owns
100% of the target’s shares after the transaction.

9
5) The method of payment is either 100% cash or 100% stock.11
6) Both the acquirer and target have positive book value of assets (AT) and book value of equity
(CEQ) in Compustat as of the end of the fiscal year prior to announcement, and share price and
shares outstanding data available in the CRSP (to compute market-to-book (assets) ratios).
The final sample has 1,319 stock-financed and 671 cash-financed mergers or acquisitions. Table 1 reports
the number of acquisitions by the calendar year of acquisition announcement. Consistent with extant
studies, there are concentrations of deal activity in the late 1980s and, especially, the late 1990s. Cash-
financed acquisitions appear relatively more popular in the 1980s, but in the bull-market M&A wave of
the late 1990s the number of acquisitions financed by stock vastly outnumbers those financed with cash
(although this trend appears to have reversed following the market crash in 2001).
3. Identifying acquisitions motivated by stock overvaluation
A necessary condition for a stock-swap acquisition to be motivated by (equity) overvaluation is that the
stock of the acquirer is overvalued by more than the stock of the target. Using various measures of stock
overvaluation, previous studies find that, based on the stock prices before acquisition announcements,
acquirers in stock swaps are more overvalued than their targets on average. However, whether an acquirer
can turn this relative, pre-announcement overvaluation into actual gains after the merger for their
shareholders depends on the premium paid to the target and the potential synergies from the deal.
We start the empirical analysis by confirming existing findings in the literature: specifically, that
overvalued equity appears to motivate stock-swap acquisitions. Following previous studies, we use three
different measures of (over)valuation. The first one follows Rhodes-Kropf, Robinson, and Viswanathan
11 Mixed method-of-payment deals are not included in our sample because it is difficult to determine the wealth effects of stock overvaluation when the method of payment is partially (overvalued) stock and partially cash.

10
(2005, hereafter RRV). They decompose a firm’s log market-to-book equity ratio (Ln(M/B)) into two
components, one related to misvaluation (Ln(M/V)) and the other related to growth options (Ln(V/B)).
The measure of misvaluation is the difference between the observed log market-to-book ratio and log of
growth options,
. (1)
The growth options are estimated as a function of time, industry, profitability (i.e., net income), and
leverage. The details of the decomposition methodology can be found in the Appendix of this paper, or in
RRV (2005). This decomposition has also been adopted in recent studies such as Hertzel and Li (2010).
Our second measure of overvaluation is the industry-adjusted market-to-book ratio of equity,
it
jtit
B
M
B
M
B
M
OVadj -Ind
. (2)
itB
M
is the market-to-book equity ratio of stock i at time t. jtB
M
is the median market-to-book
equity ratio of industry j to which stock i belongs at time t. The subtraction of the industry median is
intended to control for investment opportunities or risk. We use the Fama and French (1997) 48-industry
scheme to classify firms into industries. A positive number suggests overvaluation relative to the industry
median while a negative number suggests undervaluation. This measure of misvaluation is used by Ang
and Cheng (2006), who report results consistent with the hypotheses in Shleifer and Vishny (2003).
Our third measure of misvaluation (M/V) follows Lee, Myers, and Swaminathan (1999) and Dong,
Hirshleifer, Richarson, and Teoh (2006), in which the intrinsic value of the firm’s equity (V) derives from
the residual income model first proposed in Ohlson (1995). Specifically, the intrinsic value of the firm’s

11
equity (V) is the sum of the book value of equity and the present value of expected future residual income
to shareholders. Analyst’ earnings forecasts are used to estimate future residual income.
The correlation between any pair of these three misvaluation measures is over 0.60, which is not
surprising as they all derive from the market-to-book equity ratio. We find very similar empirical results
based on classifying acquirers into groups based on the three measures of stock overvaluation. For the
sake of brevity, therefore, in the tables we focus on the results based on the RRV measure (i.e., Eq. (1)
above).12
Table 2 reports the valuation ratios of merging firms at different dates around the transaction, in
particular, 42 trading days before the acquisition announcement, one day before the acquisition
announcement, and on the day of deal completion. Schwert (1996) suggests that, due to information
leakage and market anticipation, stock prices of the merging firms may partially reflect the value
implications of the merger in the two trading months prior to announcement. Therefore our first measure
of market value is 42 trading days before the announcement. The book value of equity (from Compustat)
is the same for all these measures (and is measured as of the end of the fiscal year ending immediately
prior to the merger announcement date).
Prior to merger announcements, bidders have significantly higher market-to-book equity ratios than
their targets (1.02 vs. 0.71), but the difference seems due to mispricing (0.50 vs. 0.13 at day -42) rather
than growth options. At day -42 prior to bid announcements, stock bidders are overvalued by more than
cash bidders (0.58 vs. 0.32). Targets in stock-swap acquisitions are also overvalued before the merger
announcements, while targets in cash acquisitions appear to be fairly valued on average. Although both
acquirers and targets in stock-financed mergers are overvalued on average before announcement (day -42
or day -1), acquirers tend to be more overvalued than their targets (e.g., 0.60 vs. 0.26 one trading day
prior to announcement). Overall, our results are consistent with the empirical evidence in Rhodes-Kropf,
12 Results based on the other misvaluation metrics are available from the authors by request.

12
Robinson, and Viswanathan (2005), Dong, Hirshleifer, Richardson, and Teoh (2006), and Ang and Cheng
(2006). The dominant overvaluation of acquirers relative to targets in stock swaps is consistent with
Shleifer and Vishny’s (2003) explanation of the motivation for stock-financed acquisitions.13
The relative overvaluation of stock acquirers compared to their target diminishes quickly as the
merger progresses towards completion. In particular, the difference in Ln(M/V) between the acquirer and
target in stock-financed mergers drops by 80% from 0.39 42 trading days before the announcement to
0.08 on the day of deal completion. This substantial narrowing of the relative overvaluation is reflective
of the general fact that acquirers stock prices fall and target stock prices rise on average during the bid
period. The fact that the difference in overvaluation between acquirers and targets narrows substantially
by the date of deal completion does not, however, imply that acquirers fail to capture the benefits of
relative overvaluation at announcement: as long as the exchange ratio in the merger is set taking into
account pre-announcement acquirer and target stock prices, the acquirer could still, theoretically, take
advantage of their overvalued stock to buy cheap(er) target assets. Whether this is the case is an empirical
question that we will turn to shortly.
Although overvaluation may motivate a firm to pursue a stock-financed acquisition, it does not mean
that every stock-financed acquisition is motivated by the acquirer’s overvaluation relative to the target.14
Relative overvaluation is measured as the difference in Ln(M/V) between the acquirer and target (as in
Table 2). For 404 stock acquisitions (out of 1,319 in Table 1: 31% of our sample), we find that either the
acquirer is not more overvalued than its target or the acquirer is not overvalued in absolute terms (i.e.,
Ln(M/V) for the acquirer is less than zero). We deem it inappropriate to classify these stock acquisitions
as motivated by acquirer overvaluation.
13 However, the stock of cash bidders is also more overvalued than the stock of their targets. If relative overvaluation is the most important determinant of the bidder’s choice of the method of payment, it is puzzling why these cash bidders did not use stock as the method of payment. The fact that these bidders choose to use cash, despite the relative overvaluation of their equity, suggests that there are other factors affecting the choice of payment method. 14 Savor and Lu (2009) do not differentiate between the various motives of stock acquisitions, and thus implicitly assume that all stock-financed mergers are motivated by acquirer stock overvaluation.

13
Therefore, we focus on the remaining stock acquisitions in which the acquirers are a) overvalued in
absolute terms; and b) are more overvalued than their respective target. Further, in order to sharpen our
tests and to mitigate the impact of potential measurement errors, we exclude the bottom half of the
distribution (within this subsample) based on the ranking of the relative overvaluation. We are left with a
subsample of 425 stock-swap acquisitions satisfying these criteria; in terms of acquisitions motivated by
stock overvaluation, these acquisitions should fit Shleifer and Vishny’s overvaluation hypothesis the best
– acquirers are overvalued in absolute terms and substantially more overvalued than their targets. For the
purpose of exposition, we denote these 425 stock acquisitions as “OV acquisitions” (i.e., acquisitions
likely driven by stock overvaluation) and the 404 stock acquisitions not seemingly driven by
overvaluation (using the criteria above) as “NOV acquisitions”.
Table 3 presents some key characteristics of the merging firms in the fiscal year prior to the
acquisition announcement, divided into these three groups (OV stock acquisitions, NOV stock
acquisitions, and cash acquisitions). Bidders in NOV stock acquisitions are smaller than bidders in either
of the other deal-type categories, measured using total assets or market value of equity, although the
targets are generally not significantly different in size. Somewhat mechanically bidders in OV
acquisitions have significantly higher median valuation (P/E) ratios and pre-deal stock returns (market-
adjusted 12-month return) than bidders in NOV and cash-financed deals. Interestingly, however, such
high valuations and returns of OV bidders appear to be unrelated to accounting fundamentals, as OV
bidders do not have higher operating ROA, leverage, or asset turnover (but do have significantly higher
sales growth) than NOV stock bidders and cash bidders. Consistent with findings in the literature, cash
acquisitions tend to be more hostile, more likely to involve competing bidders, involve tender offers, have
bidders with toehold, and be diversifying deals. There is also some evidence in the table that cash
acquisitions are less likely to occur in waves.
One concern with the time-series of OV acquisitions is that it might consist of primarily acquisitions
in the market bubble period of the late 1990s, as that is when there are a large number of stock-financed

14
acquisitions by overvalued acquirers (e.g., Moeller, Schlingemann, and Stulz (2005)). The results in this
paper would be less meaningful if the OV group of acquisitions contained mostly acquisitions from that
unusual time period. We therefore examine the distribution of these three groups of acquisitions over
time, and the results suggest that this is not a concern. While there is some concentration in OV
acquisitions during the 1997 – 2000 period (216 (51%) out of 425 OV acquisitions), this four year period
is one in which there is a concentration of stock-financed acquisitions in general (585 (44%) out of the
1,319 stock-financed acquisition in the sample described in Table 1). Furthermore, of the 752 acquisitions
in Table 1 between 1997 and 2000, 29% are in the OV group, 19% in the NOV group, and 22% are cash
financed.15 Therefore, this suggests that OV acquisitions are not overly concentrated in the market bubble
period of the late 1990s relative to the general concentration of stock-financed acquisitions in this period,
and that the acquisitions in this unusual period are not overrepresented by acquisitions in the OV group.
Overall, all the sub-samples of our data (OV, NOV, and cash acquisitions) appear relatively well
distributed over time, subject to the general correlation of acquisition activity with periods of economic
prosperity (as noted in most of the M&A literature).
4. Do overvalued acquirers overpay?
As long as the acquirer’s stock is more overvalued than the target’s stock, a stock-swap acquisition could
benefit acquirer shareholders. As an ex-ante motivation for stock acquisitions, however, this justification
overlooks one important fact: acquirers often pay a significant premium to take over their targets. As a
result, price movements in the acquirer (down sharply) and target (up sharply) shares may shrink, or even
eliminate, the relative overvaluation that initially motivates the acquisition. If the terms of acquisition,
specifically the exchange ratio at which target stock is converted into acquirer stock, are determined based
15 These percentages do not add up to 100% because we have excluded some stock acquisitions with low, positive relative overvaluation (i.e., those that did not make it into either the OV or NOV groups described above) and not all the acquisitions in Table 1 have enough information to compute relative overvaluation measures.

15
on the relative valuation before announcement, the acquiring firm may be able to lock in the transactional
gains from acquiring hard (target) assets using (more) overvalued paper.
However, this is not always the case. For example, PSINet’s stock price was more than three times
more expensive than that of Metamor on the day before the announcement of their merger ($49.50 vs.
$15.00), implying an exchange ratio of around 0.4 to 0.45 PSINet shares per Metamor share ((15 / 49.5)
plus a 40% premium (approximately the average in the literature)). But in the merger agreement PSINet
offered 0.9 of its own shares in exchange for each share of Metamor, what appears to be a substantial
overpayment. This raises doubts about whether PSINet was able to take advantage of their pre-
announcement overvaluation in negotiating a favorable exchange ratio for their shareholders. Whether
overvalued acquirers can do so on average is an empirical question.
To address this question we estimate the acquisition premium paid by acquirers, and compare
premiums in OV stock-swap acquisitions with premiums paid in NOV stock-swaps and cash acquisitions.
We use two different measures of acquisition premium (AP). The first measure is based on the stock
returns of the target during the bid period, as in Schwert (1996). One advantage of this measure is that the
measured acquisition premium (increase in target stock price) reflects the true premium offered by the
acquirer net of any correction of acquirer stock mispricing (because the measure is based on the target
market prices). As in Schwert (1996) we compute this measure of acquisition premium as the target
cumulative abnormal returns (CAR) from 42 trading days before the announcement to the day of deal
completion (i.e., the bid period),
∑ , (3)
where t=0 for the day of announcement and t=T for the date of deal completion. This measure of
acquisition premium is also used in Bargeron, Schlingemann, Stulz, and Zutter (2008). For completeness,

16
we also report the three-day announcement CARs for targets (another popular measure of value creation
in the M&A literature) and the bid-period CAR for acquirers. 16
Our second measure of acquisition premium is the exchange ratio divided by the relative price of the
target and acquirer stock before announcement. In particular,
, ,⁄1 100 (4)
Exchange ratio is defined as the number of acquirer shares exchanged for each share of target stock. The
denominator is the relative price of the target and acquirer shares 42 trading days prior to the
announcement day (AD). This measure is calculated only for stock-swap acquisition (by OV and NOV
acquirers), and exchange ratio data is from SDC and hand-checked for every stock-swap in our sample.
As can be seen in Table 4, both these measures of acquisition premium yield consistent results. The
average premium paid by OV stock acquirers to their target is significantly higher than the premium paid
by NOV stock acquirers. The difference is as large as 15% using the AP1 premium measure (based on
target stock returns), and is larger if the second measure (AP2) is used. The premiums paid by OV
acquirers do not, however, appear to be lower than those paid by cash acquirers. Cash acquirers are
known to offer higher premiums than stock acquirers for their targets (Jensen and Ruback, 1983),
potentially explained by the incidence of hostile acquisitions (which often involve cash payments) and the
fact that cash offers trigger an immediate tax liability for target shareholders (and hence require a
compensating premium). The three-day announcement returns for target shareholders suggest the same
conclusion: higher premiums paid by overvalued acquirers using their own stock as a method of payment.
16 We follow the standard event study methodology to compute cumulative abnormal return (CAR). Specifically, we use the CRSP value-weighted index as the market portfolio, estimate the parameters of the market model using returns from trading day -253 to trading day -42, and use the estimated parameters to compute the expected return during the event window. The daily pricing errors (the differences between realized returns and estimated expected returns) are cumulated over the event window to compute CARs. The three-day event window is counted from day -1 to day +1 relative to the announcement day.

17
Consistent with the acquisition premium results, we find that OV stock-swap acquirers incur very
negative abnormal returns during the bid period (-17% at the mean and -11% at the median). In contrast,
NOV stock acquirers and cash acquirers do not realize negative cumulative abnormal returns on average
during the bid period.
Next we examine if the higher premiums paid by OV bidders are explained by differences in target,
acquirer, and deal characteristics. The dependent variable in the regressions is the acquisition premium
(AP1 or AP2 above). We include an indicator variable (OV) in the regressions that takes the value of one
if the deal is an OV acquisition and zero otherwise. Bargeron, Schlingemann, Stulz, and Zutter (2008) use
a similar regression method to examine if private acquirers pay significantly different premiums from
public acquirers, and we use similar control variables as in their study. Table 5 presents the regression
results, with results for stock mergers only and for the sample containing both stock and cash mergers.
Our results are easily summarized. Controlling for acquirer, target, and deal characteristics, OV stock
acquirers tend to pay an average premium of around 10 percentage points higher than other bidders do.
These differences are statistically significantly different from zero, and suggest that the characteristics of
the merging firms and the deal terms that they agree on are unable to explain the significantly higher
premiums paid by OV bidders observed in Table 4. In other words, overvalued stock acquirers
substantially overpay their target. The coefficients on the control variables are largely consistent with
prior literature, with higher premiums being paid by large acquirers, to small targets, by acquirers with
low leverage (and hence more financial flexibility), and in hostile deals. We also observe a markup-
pricing effect (Schwert, 1996) in our sample: the coefficients on the prior 12-month return to the target
stock are significantly negative but far smaller than -1.
In summary, our stock return evidence points to higher premiums paid by, and lower bid-period
returns accruing to, overvalued bidders (relative to stock bidders that are not overvalued). Our results are
consistent with overpayment by overvalued acquirers to their targets, but using stock-return data alone we

18
cannot determine whether lower acquirer returns are driven by overpayment and market pessimism about
value creation (i.e., low or even negative synergies) or the correction of overvaluation of OV acquirers
around and after deal announcement. In the next section we examine post-acquisition operating
performance to assess the synergistic benefits associated with acquisitions by the various categories of
bidders to distinguish between these two alternatives.
5. Do acquisitions driven by stock overvaluation generate synergies?
The evidence above is consistent with the notion that overvalued acquirers pay especially high premiums
in acquisitions and earn very negative bid-period returns. This pattern suggests that the synergies that
overvalued acquirers are expected to extract from their acquisitions are insufficient to compensate for the
especially high premiums. Why don’t overvalued acquirers instead conduct an equity offering to take
advantage of their (presumably temporary) stock overvaluation? Shleifer and Vishny (2003) emphasize
the importance of higher synergies to justify the overvalued acquirer’s choice to make an acquisition as
opposed to conducting a seasoned equity offering. To directly address the question of whether
acquisitions driven by stock overvaluation generate larger and positive synergies than other acquisitions,
we examine operating performance after the deal is completed. An examination of post-completion
operating performance sheds light on the source of economic gains or losses associated with the mergers
in our sample, and allows us to evaluate whether the merger creates real value for acquiring-firm
shareholders.
Our primary measure of operating performance is earnings before interest, taxes, depreciation and
amortization (EBITDA, also called operating income before depreciation) divided by the market value of
the assets at the beginning of the fiscal year.17 Market value of assets is the market value of common
17 Healy, Palepu, and Ruback (1992) argue that the rationale for using the market value of the assets rather than the book value to deflate operating income is that market value represents the opportunity cost of the assets and

19
equity plus the book values of preferred stock and long- and short-term debt net of cash. We call this
measure operating ROA. Operating ROA can be decomposed into asset turnover, calculated as sales
divided by the market value of assets at the beginning of the fiscal year, and operating profit margin,
calculated as EBITDA divided by Sales.
(5)
We employ two different methods to examine abnormal changes in operating performance after
mergers. The first method follows Healy, Palepu, and Ruback (1992). We calculate operating
performance for the merged firm for nine fiscal years (years -3 to +5) surrounding the merger completion
year (year 0). In the pre-merger years, operating performance is calculated as the weighted average of the
performance of the acquirer and target (weighted by the market values of assets for the two firms at the
beginning of each fiscal year). We then find the industry median operating performance for the merged
firm for the same fiscal years, which in the pre-completion years is the weighted average of the industry
median operating performance for the acquirer and target (weighted by the market values of assets for the
two merging firms at the beginning of each fiscal year and using the 48 industry categories defined as in
Fama and French (1997)). Abnormal operating performance is calculated as the difference between
operating performance for the merged firm and the industry median operating performance. We then run a
cross-sectional regression to compute abnormal changes in performance due to the mergers,
,,, iipreipost EPERFORMANCEPERFORMANC , (6)
therefore facilitates inter-temporal and cross-sectional comparisons. Furthermore, using the market value of assets mitigates any effects arising from the choice of the accounting method for mergers. Our results are also robust to the use of book value of assets as the denominator.

20
where the explanatory variable, ,pre iPERFORMANCE , is the median abnormal operating performance
(operating ROA, asset turnover, or operating margin) for the merging firms of acquisition i during the
pre-merger years (years -3 to -1) and the dependent variable, ,post iPERFORMANCE , is the median
abnormal operating performance during the post-merger years (years 1 to 5). The slope coefficient
captures the correlation in abnormal performance between the pre-and post-merger years. The intercept
measures the average change in the industry-adjusted abnormal performance that is due to the merger,
and is our main coefficient of interest.
The top panel of Table 6 contains estimates of intercept from Eq. (6) for the various categories of
bidders (OV, NOV, and cash) analyzed in this paper. The point estimates suggest significant deterioration
in operating performance (both operating ROA and asset turnover) following acquisitions for overvalued
bidders, while the same is not true for NOV stock-swap bidders (no significant change in performance) or
cash bidders (significant improvement in performance). In other words, acquisitions driven by stock
overvaluation experience significantly abnormal declines in operating performance after mergers, largely
attributed to a significant drop in asset turnover, while other types of bidders do not.
The last column in Table 6 addresses the issue of whether overvalued firms generally underperform
around the dates of mergers in this sample (even if they didn’t pursue a merger) or whether the decline in
operating performance is attributable to the transaction itself. In other words, we try to answer the
question: what would have happened if these overvalued acquirers had not pursued the acquisition. We
match each OV acquiring firm in the sample to a non-merging overvalued firm that: a) exists for at least
seven fiscal years centered on the merger completion year; b) does not conduct an SEO or acquisition in
that seven-year window; c) is in the same industry as the acquirer; d) has total assets of 50%-150% of the
acquirer; e) has Tobin’s Q of 50%-150% of the acquirer; f) has a buy-and-hold return in the year before
merger announcement of 50%-150% of the acquirer; and g) has the closest Ln(M/V) measure (Table 2)

21
to the acquirer (but not more than 50% larger or smaller) in the year prior to merger announcement. This
procedure yields 326 matched control firms for the 425 OV acquirers. For these similarly-overvalued, but
non-merging, control firms we compute abnormal operating performance over the same fiscal years as we
do for the event (acquiring) firms.
As can be seen in the final column of Table 6, matched similarly-overvalued firms that do not
participate in acquisitions on average do not incur a decline in performance around the time of the
mergers in our sample. This contrasts starkly with the significant declines in performance observed for the
overvalued acquirers documented in the first column of the table. These results suggest that overvalued
acquirers suffer significant declines in operating ROA, at least partly caused by declines in the efficiency
of asset usage, while other types of acquirers and similarly-overvalued non-acquiring firms do not. The
comparison with non-acquiring overvalued firms suggests that the overvalued acquirers in our sample
may have been better off had they not pursued their acquisition.
Barber and Lyon (1996) emphasize the importance of matching firm size and pre-event operating
performance in estimating firms’ abnormal performance following corporate events (such as mergers).
Therefore, our second method adopts this approach. For every bidder and target firm, we find a control
firm that (a) has total assets of 50%-150% of the merging firm, and (b) has the closest operating ROA to
the merging firm in the fiscal year before the merger. As a result, we have a pair of control firms for each
pair of merging firms. Control firms are required to exist for at least three years and not conduct seasoned
equity offerings or be involved in acquisitions in the following five years. The weighted-average
operating performance of the control firm pair is calculated each year as the benchmark performance for
the merged firm. The weights are the market values of assets of the two merging firms at the beginning of
the merger completion year. Abnormal operating performance is the difference in operating performance

22
of the merged firm and its benchmark. We compute the median abnormal operating performance over the
five post-merger years to make statistical inferences in the bottom panel of Table 6.18
Our conclusions using this method of analysis are similar to those reported above. Specifically,
overvalued acquirers appear to substantially and significantly underperform the weighted-average
benchmark of matched firms that had similar size and ROA as the bidder in the pre-merger years. Using
the Barber and Lyon method, it appears that NOV stock-swap bidders, cash bidders, and the similarly-
overvalued but non-merging control firms also experience significant declines in both operating ROA and
asset turnover in the following years, but their declines in performance are substantially lower in
magnitude than those experienced by overvalued (OV) bidders, largely because these firms experience
(offsetting) improvements in operating margins that OV acquirers do not.
To summarize, the post-acquisition operating performance evidence in Table 6 suggests that
overvalued acquirers significantly underperform in the years after their acquisitions, both in industry- and
pre-event adjusted terms (the Healy, Palepu, and Ruback (1992) technique) and relative to firms matched
on size and pre-event performance (the Barber and Lyon (1996) technique). Interestingly, this is not true
(or much lower in magnitude) for NOV stock-swap bidders or cash bidders, nor is it true for industry
peers that are similarly overvalued at around the same time as the acquisition takes place. Combined, this
evidence suggests that overvalued acquirers do not seem to reap operating synergies from acquisitions. In
other words, “synergies” in deals consummated by overvalued acquirers are at best lower than synergies
in deals by acquirers not using overvalued stock as a method of payment, and at worst potentially
negative.
18 Ghosh (2001) uses a similar method to examine post-merger operating performance for acquisitions. Using control firms matched on pre-merger performance and size, he finds no evidence that operating performance improves following acquisitions in general. However, he shows that operating performance increases following cash acquisitions but decline for stock acquisitions.

23
6. What if overvalued acquirers had not pursued stock acquisitions?
Thus far, our evidence suggests that acquirers in OV acquisitions pay high premiums to their targets and
that these acquisitions generate little (or, worse, negative) long-run operating synergies: both factors
identified in the introduction as critical to long-run value creation for the shareholders of overvalued
acquirers. However, it still may be the case that if an overvalued acquirer does not pursue an acquisition,
stockholders might incur even larger losses in value in the long run. Savor and Lu (2009) find that stock
bidders that fail to complete their deals (i.e., failed bidders) realize worse long-run abnormal stock returns
than do stock bidders that consummate their deals, and argue that completed stock acquisitions create
value for acquirer shareholders.19
We address the same issue from a different perspective – comparing the long-run abnormal returns of
successful OV acquirers with those of control firms that are in the same industry, similarly overvalued at
the same time, have similar size, Tobin’s Q and prior returns, but have not pursued an acquisition or
equity offering (the similarly-overvalued, non-merging peers identified in Table 6).20 In part, this
evidence complements the findings in Table 6 and addresses a missing piece of the value creation puzzle.
In addition, these results also help compare and contrast our paper, and our OV-acquirer sample selection
process specifically, with the existing literature (especially Savor and Lu (2009), which compares
successful and unsuccessful bidders without conditioning on overvaluation).
We compute long-run abnormal returns using three different approaches. The first is market-adjusted
buy-and-hold returns, defined as follows:
19 However, Savor and Lu (2009) show in their Table IX (p.1084) that acquirer shareholders react positively to announcements of bid termination, suggesting shareholders do not think that completing the deal creates value. 20 In a similar spirit, DeAngelo, DeAngelo, and Stulz (2010) examine the popular view of market timing as a primary motivation for SEOs. They find that although SEO firms have high M/B ratios and high recent stock returns prior to the announcement, the vast majority of firms with high M/B ratios and high recent stock returns do not issue stock. They therefore conclude that “The problem for the market-timing explanation is that, paraphrasing Sherlock Holmes, many ‘dogs don’t bark’ at times when, according to theory, they should be barking.” (p.276). One way to think about our tests is that we investigate if “dogs that should bark but didn’t bark” are penalized by poor long-run returns, and in particular whether their long-run returns are worse than those for similar firms that did undertake an acquisition.

24
0, ∏ 1 , 1 ∏ 1 , 1 ,
(7)
where t=0 is the month of acquisition announcement. , is the monthly return for stock i in month t,
, is the monthly return for the CRSP value-weighted index in month t, is the holding period,
respectively 24, 36, and 60 months.
Our second method is the calendar-time portfolio approach proposed by Mitchell and Stafford
(2000). Specifically, in each month during our sample period we form a portfolio consisting of OV
acquirers that have announced an eventually-completed acquisition within the previous 24, 36, or 60
months. The portfolio is rebalanced monthly to add the OV acquirers that have just announced an
acquisition and drop the firms that reach the end of the holding period. We form another portfolio
consisting of the non-merging OV peers, and the timing of their inclusion into (and exclusion from) the
non-merging portfolio is the same as for their matched OV acquirer. We calculate the monthly equal-
weighted excess returns of the event and control portfolios and run time-series regressions of the portfolio
excess returns on the Fama and French three factors,
, , , , , . (8)
The regression intercepts measure the average monthly abnormal return for portfolio p over the
holding period.
Our third approach is Ibbotson’s (1975) returns across time and securities (IRATS) method combined
with the Fama-French three-factor model. We run the following regression in each event month j:

25
, , , , , , (9)
where , is the monthly return on stock in the calendar month that corresponds to the event month .
0 is the month of the merger announcement. The abnormal returns during the holding period are sums
of the intercepts of cross-sectional regressions over the relevant event-time periods.
Table 7 reports median long-run stock returns, contrasting OV acquirers with non-merging, but
similarly overvalued, peers in the same industry. The columns labeled “Difference” report the median
returns for a long-short portfolio that is long OV acquirers and short non-merging OV peers. In general,
we find that OV acquirers realize significantly and substantially worse returns than their matched peers in
the two to five years after acquisitions, with the differences appearing especially strong in market-
adjusted buy-and-hold returns and using the IRATS method. Of particular interest, the market-adjusted
buy-and-hold returns are negative for both OV acquirers and non-merging overvalued peers (reflecting
the correction of overvaluation), but substantially more negative for overvalued firms that actually
complete an acquisition compared to their similarly overvalued peers.
This long-run stock return comparison, coupled with the operating performance results in Table 6,
suggests value destruction for long-term OV acquirer shareholders (of a magnitude larger than necessary
to correct ex-ante overvaluation). Furthermore, it implies that shareholders of overvalued firms would be
significantly better off if managers of their firms did not pursue the acquisitions.
7. Discussion and conclusion
Stock-swap acquisitions by overvalued acquirers could benefit acquirer shareholders, but only if the
premium paid to the target is not too high and/or if the acquisition generates substantial synergies. The
evidence in this paper suggests that neither of these conditions appears to be satisfied. Overvalued

26
acquirers pay higher than necessary premiums to their targets and generate negative synergies in the post-
acquisition years (substantial declines in operating performance). This results in substantial declines in the
value of the acquirer’s stock over the bid period and negative long-run abnormal stock returns that appear
larger in magnitude than necessary to correct ex-ante overvaluation. Overall, our findings cast substantial
doubt on the notion that acquisitions by overvalued acquirers benefit acquirer shareholders in any
measurable way.
Why would overvalued acquirers pay such high premiums to their targets when post-completion
performance is so poor? One possibility is that agency problems drive acquisition activity by overvalued
acquirers. Jensen (2005) suggests that equity overvaluation generates substantial agency costs, and
suggests that ill-conceived acquisitions, driven by stock overvaluation, reflect these agency costs.
Overvaluation, by definition, implies that the firm will be unable to deliver the operating performance
priced into its pre-acquisition stock price. Managers under pressure to meet such unachievable
expectations potentially take risky actions that harm shareholder value, such as poorly-conceived
acquisitions. Jensen points out that the prevalence of equity-based managerial compensation in the past
two decades, such as incentive bonuses based on stock price appreciation and stock option grants,
exacerbates this problem.
Extant studies of CEO compensation and incentives suggest this is highly plausible. For instance,
Fich, Starks, and Yore (2008) argue that executive compensation schemes often motivate CEOs to engage
in deal-making activity. They find that total CEO compensation increases upon the completion of many
large corporate transactions, such as mergers and acquisitions, even when the deals are not expected to
improve firm value. Grinstein and Hribar (2004) show that CEOs having more power to influence board
decisions receive significantly larger M&A bonuses, but these bonuses are not related to deal
performance. Based on 1,508 acquisitions between 1993 and 2000, Harford and Li (2007) find that
acquirer CEOs are significantly better off due to new stock and option grants following acquisitions. The
addition of large new grants offset the wealth reduction of the CEO’s existing portfolio even for poorly

27
performing firms. Moreover, CEO’s pay and wealth become insensitive to poor performance, but remain
sensitive to good performance, after acquisitions. Combined, these studies suggest that it is possible that
the results in this paper can be explained from an agency cost perspective.
We conduct a preliminary investigation into whether acquisitions by overvalued acquirers are related
to CEO enrichment rather than stockholder wealth creation (the latter of which seems unlikely given our
results so far). We follow the empirical approach in Harford and Li (2007) and decompose CEO
compensation into two components: cash payments (including annual salary and bonus compensation)
and new grants of restricted stock and stock options. We compare the medians of these two variables in
the fiscal year before merger announcement with their values in the fiscal year following merger
completion.
Our sample consists of 166 OV acquirers and 90 similarly-overvalued, non-merging peers (as
described in Table 6) with available compensation data in Compustat’s ExecuComp database. Because we
have ExecuComp data for so few of our non-merging peers, we also relax the matching criteria
somewhat: the column labeled “Matching firms” contains a sample of 222 firms matched to OV acquirers
by industry and size (closest match).
We find that acquirer CEOs enjoy a considerable increase in their wealth after completing
acquisitions. Of the three groups, CEOs in OV acquisitions experience the largest increase in wealth
despite having poor acquisition performance (high premiums, low or negative synergies). Compared to
the year prior to announcement, the median CEO of an overvalued acquirer obtains an increase in grants
of options and/or restricted stock following completion of $1.28 million versus $0.72 million for CEOs of
similarly-overvalued, non-merging peers and $0.077 million for CEOs of firms matched by industry and
size (the latter difference is statistically significant at the 10% level). The median value of cumulative
grants from the year prior to announcement to the year after completion is $9.6 million for the CEOs of
overvalued acquirers, compared to $4.9 million for CEOs of similarly-overvalued, non-merging peers and

28
$3.9 million for CEOs of firms matched by industry and size. Both these differences are statistically
significant at better than the 5% level.
This analysis therefore demonstrates that CEOs of overvalued acquirers are rewarded with
substantially more grants of restricted stock and options than comparable CEOs that are not involved in
acquisitions, despite the fact that acquisitions by overvalued acquirers appears to destroy wealth for
stockholders in both the short- and long-run. These results are consistent with the notion that agency costs
might be the motivation for acquisitions by overvalued acquirers, as hypothesized in Jensen (2005).
29
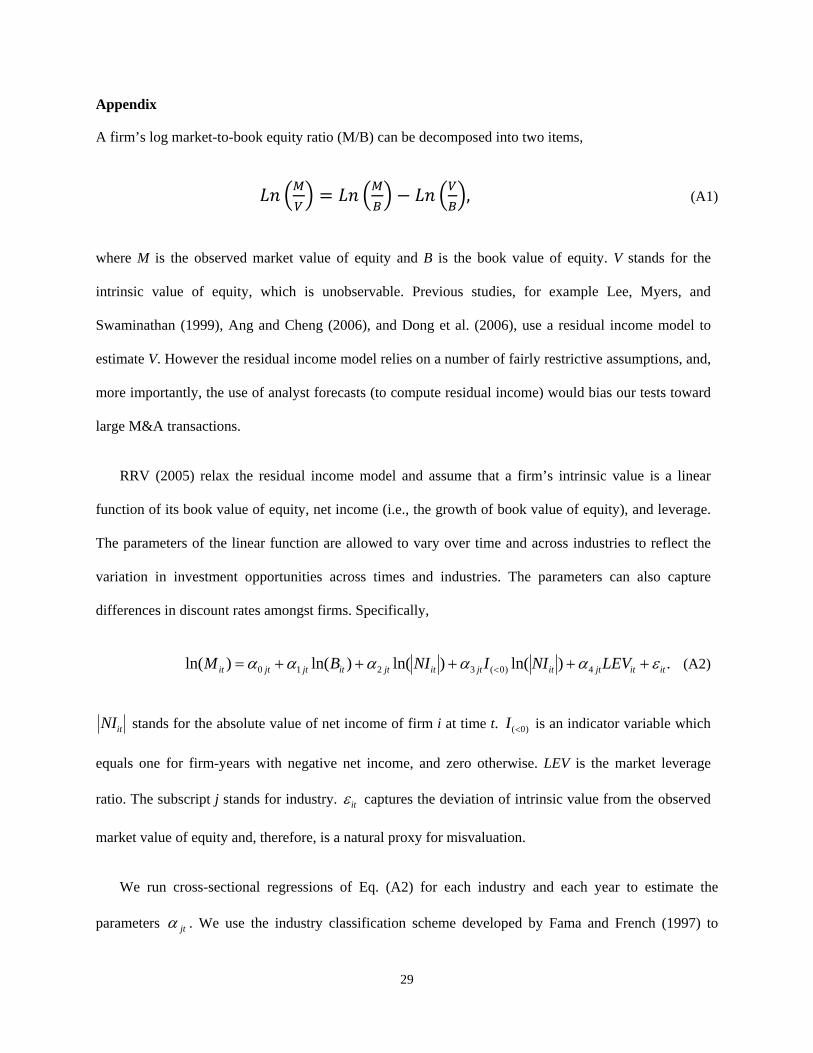
Appendix
A firm’s log market-to-book equity ratio (M/B) can be decomposed into two items,
, (A1)
where M is the observed market value of equity and B is the book value of equity. V stands for the
intrinsic value of equity, which is unobservable. Previous studies, for example Lee, Myers, and
Swaminathan (1999), Ang and Cheng (2006), and Dong et al. (2006), use a residual income model to
estimate V. However the residual income model relies on a number of fairly restrictive assumptions, and,
more importantly, the use of analyst forecasts (to compute residual income) would bias our tests toward
large M&A transactions.
RRV (2005) relax the residual income model and assume that a firm’s intrinsic value is a linear
function of its book value of equity, net income (i.e., the growth of book value of equity), and leverage.
The parameters of the linear function are allowed to vary over time and across industries to reflect the
variation in investment opportunities across times and industries. The parameters can also capture
differences in discount rates amongst firms. Specifically,
.)ln()ln()ln()ln( 4)0(3210 ititjtitjtitjtitjtjtit LEVNIINIBM (A2)
itNI stands for the absolute value of net income of firm i at time t. )0(I is an indicator variable which
equals one for firm-years with negative net income, and zero otherwise. LEV is the market leverage
ratio. The subscript j stands for industry. it captures the deviation of intrinsic value from the observed
market value of equity and, therefore, is a natural proxy for misvaluation.
We run cross-sectional regressions of Eq. (A2) for each industry and each year to estimate the
parameters jt . We use the industry classification scheme developed by Fama and French (1997) to

30
classify firms into 12 industries, and find similar results to RRV (2005). These three variables, i.e., book
value of equity, net income, and leverage ratio, are able to explain the within-industry cross-sectional
variations of market value of equity well, with regression R2s over 80% for almost all industries.
The residual from Eq. (A2) ( it ) can be interpreted as the firm-level mispricing at a point of time.
Previous studies suggest, however, that there is an important industry-specific component of
misvaluation, and the magnitude of industry-level misvaluation also varies over time. So the effective
mispricing for a firm is the sum of firm-level and industry-level mispricing. Following RRV (2005), we
take the time-series average of jt̂ , the estimated jt from Eq. (A2), to compute the long-run parameters
t
jtj T ˆ
1. The final measure of RRV mispricing is:
])ln()ln()ln([)ln()/ln( 4)0(3210 itjitjitjitjjititit LEVNIINIBMVM . (A3)

31
References:
Akbulut, M., 2009. Do Overvaluation-driven stock acquisitions really benefit acquirer shareholders?
Working paper, Cal State Fullerton.
Andrade, G., Mitchell, M., Stafford, E., 2001. New evidence and perspectives on mergers. Journal of
Economic Perspectives 15, 103-120.
Ang, J., Cheng, Y., 2006. Direct evidence on the market-driven acquisition theory. Journal of Financial
Research 29, 199-216.
Barber, B., Lyon, J., 1997. Detecting long-run abnormal stock returns: the empirical power and
specification of test statistics. Journal of Financial Economics 43, 341-372.
Bargeron, L., Schlingemann, F., Stulz, R., Zutter, C., 2008. Why do private acquirers pay so little
compared to public acquirers? Journal of Financial Economics 89, 375-390.
DeAngelo, H., DeAngelo, L., Stulz, R., 2010. Seasoned equity offerings, market timing, and the corporate
lifecycle. Journal of Financial Economics 95, 275-295.
Dong, M., Hirshleifer, D., Richardson, S., Teoh, S., 2006. Does investor misvaluation drive the takeover
market? Journal of Finance 61, 725-762.
Fama, E., French, K., 1997. Industry costs of equity. Journal of Financial Economics 43, 153-193.
Fich, E., Starks, L., Yore, A., 2008, CEO deal-making activities, CEO compensation, and firm value.
Working paper, Drexel University and University of Texas-Austin.
Ghosh, A., 2001. Does operating performance really improve following corporate acquisitions? Journal of
Corporate Finance 7, 151-178.
Grinstein, Y., Hribar, P., 2004. CEO compensation and incentives: evidence from M&A bonuses. Journal
of Financial Economics 73, 119-143.
Gu, F., Lev, B., 2011. Overpriced shares, ill-advised acquisitions, and goodwill impairment. The
Accounting Review, forthcoming.
Harford, J., Li, K., 2007. Decoupling CEO wealth and firm performance: the case of acquiring CEOs.
Journal of Finance 62, 917-949.
Healy, P., Palepu, K., Ruback, R., 1992. Does corporate performance improve after mergers? Journal of
Financial Economics 31, 135-175.
Hertzel, M., Li, Z., 2010. Behavioral and rational explanations of stock price performance around SEOs:
evidence from a decomposition of market-to-book ratios. Journal of Financial and Quantitative Analysis
45, 935-958.
Jensen, M., 2005. Agency costs of overvalued equity. Financial Management 34, 5-19.

32
Jensen, M., Ruback, R., 1983. The market for corporate control: the scientific evidence. Journal of
Financial Economics 11, 5-50.
Lee, C., Myers, J., Swaminathan, B., 1999. What is the intrinsic value of the Dow? Journal of Finance
54, 1693–1741.
Loughran, T., Ritter, J., 1995. The new issue puzzle. Journal of Finance 50, 23-51.
Mitchell, M., Stafford, E., 2000. Managerial decisions and long-term stock price performance. Journal of
Business 73, 287-329.
Moeller, S., Schlingemann, F., Stulz, R., 2005. Wealth destruction on a massive scale? A study of
acquiring-firm returns in the recent merger wave. Journal of Finance 60, 757-782.
Rhodes-Kropf, M., Robinson, D., Viswanathan, S., 2005. Valuation waves and merger activity: the
empirical evidence. Journal of Financial Economics 77, 561-603.
Rhodes-Kropf, M., Viswanathan, S., 2004. Market valuation and merger waves. Journal of Finance 59,
2685-2718.
Savor, P., Lu, Q., 2009. Do stock mergers create value for acquirers? Journal of Finance 64, 1061 - 1097.
Schwert, G., 1996. Markup pricing in mergers and acquisitions. Journal of Financial Economics 41, 153-
192.
Shleifer, A., Vishny, R., 2003. Stock market driven acquisitions. Journal of Financial Economics 70, 295-
311.
Song, W., 2007. Does Overvaluation Lead to Bad Mergers? Working paper, University of Cincinnati.

33
Table 1 The sample of mergers and acquisitions: 1985-2006 The sample consists of 1,319 stock-financed and 671 cash-financed mergers and acquisitions that are announced and completed during 1985 - 2006 in the U.S. The table presents the sample distribution by the calendar year of acquisition announcement. The following criteria are used to select the sample from the SDC Domestic M&A database: (1) Both the acquirer and target are public firms listed on the NYSE, AMEX, or Nasdaq; (2) The deal value is at least $10 million (in 2006 dollars) and at least 1% of the acquirer’s market value of equity as of the month end before merger announcement; (3) The acquirer controls less than 50% of the target’s shares prior to the announcement and owns 100% of the target’s shares after the transaction; (4) The method of payment is either 100% cash or 100% stock; (5) Both the acquirer and the target have positive book value of assets (AT) and book value of equity (CEQ) in Compustat as of the end of the fiscal year prior to announcement, and share price and shares outstanding data available in the CRSP as of the end of the month prior to announcement.
Year Stock Cash
1985 27 33
1986 16 48
1987 24 33
1988 16 38
1989 17 20
1990 15 11
1991 26 4
1992 26 7
1993 25 18
1994 92 36
1995 121 36
1996 105 29
1997 167 37
1998 174 43
1999 134 48
2000 110 39
2001 79 23
2002 23 21
2003 39 30
2004 40 36
2005 22 34
2006 21 47
Total 1,319 671

34
Table 2 Overvaluation of merging firms This table presents averages of a measure of overvaluation for bidders and target in the sample described in Table 1. Overvaluation is measured as proposed by Rhodes-Kropf, Robinson, and Viswanathan (2005) and described in the Appendix. Overvaluation is measured at three points in the life of each deal: 42 trading days before announcement (AD-42), one day before announcement (AD-1), and on the day of deal completion (CD). For all three measures, the book value of equity (from Compustat) is measured as of the end of the fiscal year immediately preceding deal announcement. The market-to-book equity ratio is decomposed into two components: misvaluation and long-run investment opportunities, Ln(M/B) = Ln(M/V) + Ln(V/B). The last three rows of the table describe the measure of misvaluation (Ln(M/V)). The last three columns report the differences in valuation ratios. Statistical significance is examined with t-tests: *, **, or *** indicates that the difference is significantly different from zero at the 10%, 5% or 1% level respectively.
Valuation ratios Bidders Targets Stock bidders Targets ofstock bidders
Cash bidders Targets ofcash bidders
Stock bidders – Cash bidders
Stock bidders – Stock targets
Cash bidders – Cash targets
Ln(M/B) _AD-42 1.02 0.71 1.14 0.79 0.78 0.54 0.36*** 0.35*** 0.24***
Ln(V/B)_AD-42 0.52 0.58 0.56 0.60 0.46 0.54 0.10*** -0.04** -0.08**
Ln(M/V)_AD-42 0.50 0.13 0.58 0.19 0.32 0.01 0.26*** 0.39*** 0.31***
Ln(M/V)_AD-1 0.51 0.21 0.60 0.26 0.33 0.10 0.27*** 0.33*** 0.22***
Ln(M/V)_CD 0.43 0.39 0.49 0.41 0.33 0.36 0.16*** 0.08*** -0.03

35
Table 3 Acquirer, target, and deal characteristics The sample consists of 425 OV mergers, 404 NOV mergers, and 671 cash mergers out of the sample described in Table 1. The classification of stock-swap acquisitions into OV and NOV groups is based on the relative overvaluation measures proposed by Rhodes-Kropf, Robinson, and Viswanathan (2005) (and described in the Appendix) measured 42 trading days prior to the merger announcement. NOV stock mergers are defined as those for which the acquirer is either a) not overvalued in absolute terms; or b) not more overvalued than its target. For the remaining stock-swap acquisitions, we divide the sample into halves using the median of the difference in overvaluation between the acquirer and target, and stock-swap acquisitions with the greatest difference in overvaluation are labeled OV stock mergers. This table reports medians of the following firm characteristics and performance variables as of (unless otherwise noted) the fiscal year ending immediately prior to the merger announcement: assets, MVE (market value of equity 42 trading days before announcement), price-to-earnings (P/E) ratio, leverage (debt/market value of assets), Tobin’s Q (market value of assets divided by the book value of assets), operating ROA (operating income/market value of assets at the beginning of fiscal year), asset turnover (sales/market value of assets at the beginning of fiscal year), sales growth (from fiscal year t-2 to fiscal year t-1), the acquirer’s market-adjusted 12-month stock return (the buy-and-hold return during the 12 months prior to the announcement divided by the contemporaneous CRSP valued-weighted market return), and the standard deviation of the acquirer’s stock returns (over the period from trading day -253 to -42 relative to the announcement date). Total assets and market value of equity are expressed in real terms (2006 dollars). Hostile, Compete, Tender, Tarterm, Bidlock, and Toehold are indicator variables of deal characteristics that equal one if the deal is hostile, has more than one acquirer bidding for the target, is a tender offer, includes target termination fees, includes bidder lockup provisions, or involves a bidder that holds 0.5% or more of the target stock prior to the announcement, respectively (and zero otherwise). Means are reported for all indicator variables. % of horizontal is the percentage of acquisitions that are horizontal mergers, defined as mergers in which both the acquirer and the target are in the same Fama-French 48 industry. % in waves is the percentage of acquisitions that occur during merger waves, where merger waves are identified as in Harford (2005). Wilcoxon sign rank tests are used to test the difference in medians and Fisher’s Exact tests are used to test the difference in means of all indicator variables. *, **, or *** indicates that the value in the NOV or Cash acquisitions column is significantly different from the corresponding value in the OV acquisitions column at the 10%, 5% or 1% level respectively.

36
Stock Acquisitions Cash acquisitions OV NOV
Bidder Target Bidder Target Bidder Target
Assets ($ millions) 1,435 208
1,050** 269
2,233*** 189
MVE ($ millions) 1,974 178
783*** 171
1,912 134**
P/E ratio 17.4 13.1
12.5*** 11.1**
14.4*** 11.6
Leverage 0.16 0.07
0.13 0.19***
0.19** 0.16***
Tobin’s Q 1.45 1.19
1.05 0.98**
1.04** 0.97***
Operating ROA 0.11 0.11
0.12 0.11
0.14*** 0.12
Asset turnover 0.58 0.62
0.50* 0.63
0.88*** 1.06***
Sales growth 0.25 0.13
0.15*** 0.13
0.10*** 0.08***
Acquirer market-adjusted 12-month stock return (RET_12) 17.13 -11.66
-0.76*** -4.33*
-0.82*** -2.90***
Standard deviation of the acquirer’s stock returns (STDEV) 2.68 3.57
2.52 3.37
2.02*** 2.99***
Hostile 0.01
0.01
0.05***
Compete 0.03
0.03
0.08***
Tender 0.02
0.01
0.53***
Tarterm 0.61
0.59
0.50***
Bidlock 0.28
0.25
0.16***
Teohold 0.01
0.06***
0.11***
% of horizontal 0.67
0.73*
0.56***
% in waves 0.46
0.39**
0.32***

37
Table 4 Acquisition premium This table presents descriptive statistics for acquisition premiums paid by acquirers to targets and for acquirer bid-period cumulative abnormal returns (CAR). Acquisition premiums are measured in two different ways. The first measure is the cumulative abnormal return to the target during the bid period, i.e., from 42 trading days before merger announcement to the date of deal completion (Schwert, 1996). Cumulative abnormal returns are estimated using the market model with the CRSP valued-weighted index as the market portfolio. The parameters of the market model are estimated based on daily stock returns from trading days -253 to -45. The second measure of acquisition premium is estimated for stock-swap acquisitions only, and is the exchange ratio divided by the relative stock price of the target and bidder 42 trading day before the announcement. The classification of stock acquisitions into OV and NOV groups is described in Table 3. The last two columns report the differences in means and medians. Statistical significance is examined with t-tests (means) and Wilcoxon-Mann-Whitney tests (medians): *, **, or *** indicates that the difference is significantly different from zero at the 10%, 5% or 1% level respectively. OV NOV Cash Diff
(OV – NOV) Diff
(OV– Cash)
Acquisition premium I = Target bid-period CAR [-42, completion]
Mean 39.09*** 23.24*** 39.71*** 15.85*** -0.62
Median
35.16***
21.78*** 34.24*** 13.38***
0.92
Acquisition premium II =(
, ,⁄1 100
Mean 68.51*** 37.15*** - 31.36*** -
Median
44.97***
24.62***
-
20.35***
-
Three-day target abnormal announcement returns [-1,+1]
Mean 19.70*** 14.24*** 28.40*** 5.46*** -8.70***
Median
16.56***
10.93***
21.68*** 5.63***
-5.12***
Acquirer bid-period CAR [-42, completion]
Mean -17.45*** 0.12 1.72 -17.57*** -19.17***
Median
-10.88***
-1.27
-0.09
-9.61***
-10.79***

38
Table 5 Can acquirer, target, or deal characteristics explain the higher premiums paid by overvalued acquirers? The table reports the results from OLS regressions of acquisition premiums (measured as in Table 4) on merging firm and deal characteristics. In columns 1 and 2 the dependent variable is the target’s cumulative abnormal returns from 42 trading days prior to announcement to merger completion (Acquisition premium I from Table 4). In column 3 the dependent variable is the exchange ratio divided by the relative stock prices of the target and acquirer 42 trading days before announcement (Acquisition premium II from Table 4). OV is an indicator variable that equals one if the deal is an OV stock-swap merger (defined in Table 3), and zero otherwise. Cash is an indicator variable that equals one if the method of payment is 100% cash and zero if the method of payment is 100% stock. Other explanatory variables are defined in Table 3. *, **, or *** indicates that the regression coefficient is significantly different from zero at the 10%, 5% or 1% level respectively.
Acquisition Premium: Target bid-period CAR
, ,⁄1 100
Stock-swap only Stock and cash Stock-swap only
OV 11.17*** 10.39*** 9.74***
Log(MVE) (acquirer) 5.80*** 5.56*** 11.21***
Log(MVE) (target) -8.79*** -8.32*** -8.67***
Tobin’s Q (acquirer) 0.07 0.27 0.02
Tobin’s Q (target) -0.14 -0.57 0.20
Leverage (acquirer) -18.11** -17.33*** -29.33***
Leverage (target) 14.49** 11.32* 13.55
Operating ROA (acquirer) -8.70 8.64 -3.69
Operating ROA (target) 18.95*** 8.85 13.30
RET_12 (acquirer) -0.01 -0.01 0.06**
RET_12 (target) -0.21*** -0.23*** -0.06***
STDEV (acquirer) 2.15 4.14*** -0.65
STDEV (target) -0.40 -0.89 4.62***
Cash 5.27
Hostile 38.38** 10.00 32.36*
Compete 3.31 8.29 0.44
Tender -5.31 9.57** -15.05
Tarterm 5.00* 3.33 0.53
Bidlock -0.35 -1.14 10.04***
Toehold -6.36 7.26 -4.78
No. of Obs. 1,198 1,823 1,198
Adjusted R2 0.189 0.173 0.126

39
Table 6 Abnormal changes in operating performance after mergers This table reports abnormal changes in operating performance after mergers for acquirers and overvalued non-acquirers. There are two metrics used to assess post-merger abnormal changes in operating performance. The first is based on Healy, Palepu, and Ruback (1992). For the first three columns, we calculate operating performance for the merged firm for nine fiscal years surrounding the merger completion year (years -3 to +5 relative to the merger completion year (0)). In the pre-merger years, this is calculated as the weighted average of the performance of the acquirer and target (with weights relative to the market values of assets for the two firms at the beginning of each fiscal year). We then find the industry median operating performance for the merged firm for the same fiscal years, which in pre-merger years is the weighted average of the industry median operating performance for the acquirer and target (with weights relative to the market values of assets for the two merging firms at the beginning of each fiscal year and 48 industry categories defined as in Fama and French (1997)). Abnormal operating performance is calculated as the difference between operating performance for the merged firm and the industry median operating performance. We then run a cross-sectional regression of the median post-merger abnormal performance (years +1 to +5 relative to the merger completion year (0)) on the median pre-merger abnormal performance (years -3 to -1 relative to the merger completion year). The regression intercept is interpreted as the change in abnormal performance due to the merger, and is displayed in the table. In the final column we replicate this procedure for non-merging firms that are approximately as overvalued as the acquirer in the year prior to merger announcement. Specifically, for each OV acquiring firm in the sample we identify a non-merging OV firm that: a) exists for at least seven fiscal years centered the merger completion year; b) does not conduct an SEO or acquisition in that seven-year window; c) is in the same industry as the acquirer; d) has total assets of 50%-150% of the acquirer; e) has Tobin’s Q of 50%-150% of the acquirer; f) has a buy-and-hold return in the year before merger announcement of 50%-150% of the acquirer; g) has the closest Ln(M/V) measure (Table 2) to the acquirer (but not more than 50% larger or smaller) in the year prior to merger announcement. For this non-merging OV firm we replicate the procedure described above to compute abnormal operating performance over the same fiscal years as we did for the event (acquiring) firms. The second metric is the size and pre-merger performance match suggested by Barber and Lyon (1996). For the first three columns, for every acquirer and target firm we find a control firm that (a) has total assets of 50%-150% of the merging firm in the fiscal year before the merger, and (b) has the closest operating ROA to the merging firm in the fiscal year before the merger. As a result, we have a pair of control firms for each pair of merging firms. Control firms are required to exist for at least three years and not to conduct seasoned equity offerings or be involved in acquisitions in the following five years. The weighted-average operating performance of the control firm pair is calculated each year as the benchmark performance for the merged firm (with weights relative to the market values of assets for the two firms in the year before merger completion year (0)). Abnormal operating performance is the difference in the operating performance of the merged firm and this weighted-average benchmark, and the median abnormal operating performance over the first five post-merger years is displayed in the table. In the final column we replicate this procedure for non-merging firms that are approximately as overvalued as the acquirer in the merger announcement year (the non-merging OV firms are selected as described above). For the non-merging OV firms we replicate the procedure of finding control firms based on total assets and ROA and reporting median abnormal operating performance over the following five fiscal years. p-values for tests of significance are in parentheses.

40
OV NOV Cash Non-Merging OV
Healy, Palepu, and Ruback (1992)
Operating ROA -0.93 (0.005)
-0.15 (0.767)
1.37 (<0.001)
-0.22 (0.631)
Asset Turnover -12.81 (<0.001)
2.94(0.448)
3.71(0.267)
0.60(0.841)
Operating Margin 0.69
(0.463)1.04
(0.442)1.24
(0.006)0.59
(0.648)
Barber and Lyon (1996)
Operating ROA -1.82 (<0.001)
-1.78 (0.002)
-0.63 (0.041)
-0.76 (0.033)
Asset Turnover -8.67 (<0.001)
-3.49(0.002)
-4.82(0.004)
-4.63(<0.001)
Operating Margin -0.27
(0.920)1.57
(0.075)0.97
(0.056)1.18
(0.400)

41
Table 7 Long-run stock returns
This table presents median long-run stock returns of OV acquirers and their matched control firms. The non-merging OV control firms are in the same industry, similarly overvalued, have similar size and Tobin’Q as the OV acquirers, but have not pursued an acquisition or SEO (as described in Table 6). We compute long-run abnormal returns using three different approaches: (1) Market-adjusted buy-and-hold returns: 0, ∏ 1 , 1 ∏ 1 , 1 , where t=0 is the month of acquisition announcement. , is the monthly return for stock i in month t, , is the monthly return for the CRSP value-weight index in month t, is the holding period (24, 36, or 60 months). (2) The calendar-time portfolio approach proposed by Mitchell and Stafford (2000). Specifically, in each month during our sample period we form two portfolios, one consisting of OV acquirers that have announced an eventually-completed acquisition within the previous 24, 36, or 60 months and the other consisting of corresponding control firms. The portfolios are rebalanced monthly to add the OV acquirers that have just announced an acquisition and drop the firms that reach the end of the holding period. We calculate the monthly equal-weighted excess returns of the OV acquirer and control portfolios and run time-series regressions of the portfolio excess returns on the Fama and French three factors, , , , , , . The regression intercepts measure the average monthly abnormal return for portfolio p over the holding period, and are reported in the table. (3) Ibbotson’s (1975) returns across time and securities (IRATS) method combined with the Fama-French three-factor model. We run the following cross-sectional regression in each event month j: , ,
, , , , where , is the monthly return on stock in the calendar month that corresponds to the event month ( 0 is the month of the merger announcement). The reported abnormal returns during the holding period are sums of the intercepts from the cross-sectional regressions over the relevant event-time periods. p-values are in parentheses.
Holding Period
Market-adjusted buy-and-hold returns Calendar-time approach Ibbotson’s IRATS
OV Acquirers
Non- Merging OV Difference
OV Acquirers
Non- Merging OV Difference
OV Acquirers
Non- Merging OV Difference
[0, 24] -19.80 (<0.001)
-12.40 (0.015)
-9.51 (0.002)
-0.22
(0.343) 0.02
(0.925) -0.24
(0.417)
-9.95
(0.012) 6.95
(0.129) -17.90 (0.002)
[0, 36] -28.90 (<0.001)
-15.10 (0.003)
-13.01 (0.009)
-0.38
(0.042) 0.01
(0.943) -0.40
(0.080)
-16.0
(0.002) 5.66
(0.332) -17.97 (0.019)
[0, 60] -21.40 (<0.001)
-3.40 (0.617)
-15.17 (0.004)
-0.20
(0.197) 0.08
(0.640) -0.28
(0.140)
-12.99 (0.050)
7.61 (0.342)
-18.75 (0.077)

42
Table 8 Changes in CEO compensation and wealth after acquisitions This table reports medians of CEO compensation data from Compustat’s ExecuComp database. We require that CEOs be the same between the fiscal year before the acquisition announcement (ayr-1) and the fiscal year after the merger completion (cyr+1). Cash payment is the annual salary and bonus compensation. Grants are the total value of all restricted stock and options granted during the fiscal year. Cumulative grants are the value of grants from the announcement year (ayr) to year cyr+1. Portfolio value of equity is the market value of the CEO’s existing holding of stocks and options at the fiscal year end. Dollar values are in thousands and adjusted to 2006 dollars. *, **, or *** indicates that the difference is significantly different from zero at the 10%, 5% or 1% level respectively.
OV
Matching firms
Non-Merging OV
Difference (OV - Matching firm)
Difference (OV - Non-merging OV)
Year: ayr-1 Cash payment 1,342 1,016 1,339 17 123 Grants 2,219 1,250 1,538 335* 1,257*** Year: cyr+1 Cash payment 1,615 1,162 1,489 -194 -3 Grants 4,247 1,199 1,879 1,566*** 2,010*** Change from year ayr-1 to cyr+1 Cash payment 210 122 220 -37 -137 Grants 1,281 77 715 524* 902 Cumulative grants 9,585 3,894 4,875 1,846*** 1,906**
No. of Obs. 166 222 90 114 53