Employee stock ownership plan and stock price crash risk
33
RESEARCH Open Access Employee stock ownership plan and stock price crash risk Yan Li 1 , Bao Sun 1 and Shangyao Yu 2* * Correspondence: yushangyao@ btbu.edu.cn 2 Business School, Beijing Technology and Business University, Beijing 100048, China Full list of author information is available at the end of the article Abstract This paper examines whether the announcement of an employee stock ownership plan (ESOP) affects stock price crash risk and the mechanism by which the ESOP may influence crash risk, using a sample of Chinese A-share firms from the period 2014 to 2017. We provide evidence that an ESOP announcement is significantly and negatively related to a firm’ s stock price crash risk. An ESOP announcement sends positive signals to the market that insiders are optimistic about a firm’ s future value, which helps enhance investor confidence, resist the pressure for a fire sale caused by negative information disclosure, and reduce stock price crash risk. Further research shows that larger-scale, lower-priced and non-leveraged ESOPs are more helpful in reducing crash risk. This paper sheds lights on the impact of ESOPs in a volatile market environment. It also contributes to firms’ implementation of ESOPs and the development of the legal system in capital markets. Keywords: Employee stock ownership plan (ESOP), Crash risk, Market situation, Signaling effect, Leveraged ESOP, China Introduction The China Securities Regulatory Commission (CSRC) issued the “Guiding Opinions on the Pilot Program for the Implementation of the Employee Share Ownership Plans by Listed Companies” (“Opinions”) on June 20, 2014. ESOPs have been attracting more and more attention and recognition from China’s listed companies. By December 31, 2017, more than 816 Chinese A-share listed companies had successively implemented ESOPs and many other companies have indicated that they intend to implement ESOPs. Are ESOPs an effective means to stabilize market sentiment and stock prices or an accelerator for market fluctuations and crash? The answer to this question is im- portant to listed firms and regulators, especially in China where ESOPs are still rela- tively new and stock markets are still underdeveloped and often suffer from systematic sharp downturns. There is considerable research on ESOPs and stock price crash risk respectively in the existing literature. However, limited research has been conducted on the influence of ESOPs on stock price crash risk directly. The most related research may be the influence of executive equity incentives on stock price crash risk. Ismail et al. (2016) argue that executives are more likely to announce good news in a timely manner and conceal bad news after the adoption of executive equity incentives. Kim et al. (2011b) study the relationship between executive equity incentives and stock price crash risk. © The Author(s). 2019 Open Access This article is distributed under the terms of the Creative Commons Attribution 4.0 International License (http://creativecommons.org/licenses/by/4.0/), which permits unrestricted use, distribution, and reproduction in any medium, provided you give appropriate credit to the original author(s) and the source, provide a link to the Creative Commons license, and indicate if changes were made. Frontiers of Business Research in China Li et al. Frontiers of Business Research in China (2019) 13:14 https://doi.org/10.1186/s11782-019-0061-2
-
Upload
khangminh22 -
Category
Documents
-
view
0 -
download
0
Transcript of Employee stock ownership plan and stock price crash risk
RESEARCH Open Access
Employee stock ownership plan and stockprice crash riskYan Li1, Bao Sun1 and Shangyao Yu2*
* Correspondence: [email protected] School, BeijingTechnology and Business University,Beijing 100048, ChinaFull list of author information isavailable at the end of the article
Abstract
This paper examines whether the announcement of an employee stockownership plan (ESOP) affects stock price crash risk and the mechanism bywhich the ESOP may influence crash risk, using a sample of Chinese A-sharefirms from the period 2014 to 2017. We provide evidence that an ESOPannouncement is significantly and negatively related to a firm’s stock pricecrash risk. An ESOP announcement sends positive signals to the market that insiders areoptimistic about a firm’s future value, which helps enhance investor confidence, resist thepressure for a fire sale caused by negative information disclosure, and reduce stock pricecrash risk. Further research shows that larger-scale, lower-priced and non-leveragedESOPs are more helpful in reducing crash risk. This paper sheds lights on the impact ofESOPs in a volatile market environment. It also contributes to firms’ implementation ofESOPs and the development of the legal system in capital markets.
Keywords: Employee stock ownership plan (ESOP), Crash risk, Market situation, Signalingeffect, Leveraged ESOP, China
IntroductionThe China Securities Regulatory Commission (CSRC) issued the “Guiding Opinions on
the Pilot Program for the Implementation of the Employee Share Ownership Plans by
Listed Companies” (“Opinions”) on June 20, 2014. ESOPs have been attracting more
and more attention and recognition from China’s listed companies. By December 31,
2017, more than 816 Chinese A-share listed companies had successively implemented
ESOPs and many other companies have indicated that they intend to implement
ESOPs. Are ESOPs an effective means to stabilize market sentiment and stock prices
or an accelerator for market fluctuations and crash? The answer to this question is im-
portant to listed firms and regulators, especially in China where ESOPs are still rela-
tively new and stock markets are still underdeveloped and often suffer from systematic
sharp downturns.
There is considerable research on ESOPs and stock price crash risk respectively in
the existing literature. However, limited research has been conducted on the influence
of ESOPs on stock price crash risk directly. The most related research may be the
influence of executive equity incentives on stock price crash risk. Ismail et al. (2016)
argue that executives are more likely to announce good news in a timely manner and
conceal bad news after the adoption of executive equity incentives. Kim et al. (2011b)
study the relationship between executive equity incentives and stock price crash risk.
© The Author(s). 2019 Open Access This article is distributed under the terms of the Creative Commons Attribution 4.0 InternationalLicense (http://creativecommons.org/licenses/by/4.0/), which permits unrestricted use, distribution, and reproduction in any medium,provided you give appropriate credit to the original author(s) and the source, provide a link to the Creative Commons license, andindicate if changes were made.
Frontiers of BusinessResearch in China
Li et al. Frontiers of Business Research in China (2019) 13:14 https://doi.org/10.1186/s11782-019-0061-2

They find that CFO option incentives increase future stock price crash risk. These two
studies indicate that the relationship between ESOPs and crash risk may be positive.
However, although there are some similarities between ESOPs and executive equity
incentives, the influence of ESOPs on stock price crash risk may be very different from
that of executive equity incentives. First, as executive equity incentives target the top
executives or executive team, the range of targets is often limited. The scope of ESOPs
is undoubtedly wider and includes a substantial number of or most employees aside
from executives. The number of insiders committed to firm value greatly increases and
the difficulty executives have in concealing a firm’s bad news is significantly higher after
the adoption of an ESOP. Second, executives can exercise their options at any time
after the exercise date in executive equity incentives in the form of stock options; hence
they only need to pay attention to the stock price when they exercise their options.
However, the selling of stock in the case of an ESOP needs the unanimous consent of
the shareholder committee and must comply with strict laws and regulations. It is more
complicated, difficult and time-consuming. Therefore, an ESOP is likely to contribute
more to the long-term value of a firm instead of increasing the short-term stock price
by concealing bad news. Last but not least, stock ownership incentives are often offered
to executives freely or at a very low price, meaning money on the table for executives.
Executives benefit as stock price increases and suffer no losses when prices drop. How-
ever, participation in ESOPs is not free. Employees need to pay for ESOPs in accord-
ance with (in the case of purchase from the secondary market) or in reference to (in
the case of private placement) the market price, even needing to assume extra liabilities
in the case of leveraged ESOPs. If share prices fall below the ESOP purchase price, par-
ticipants will suffer extra losses, and even go bankrupt due to margin closeout in the
case of leveraged ESOPs. Therefore, compared with executive equity incentives, ESOP
participants may be more conservative and less likely to increase share prices through
short-term risk-taking behaviors increasing future crash risk. For these reasons, we
assume that ESOPs may reduce stock price crash risk rather than increase it like
executive equity incentives do.
To examine the actual influence of ESOPs on stock price crash risk, we conduct em-
pirical tests using Chinese listed firms who adopted ESOPs from 2014 to 2017. Empir-
ical results show that the announcement of an ESOP significantly decreases a firm’s
future stock price crash risk. The mechanism by which ESOPs affect crash risk is
mainly through signaling effects, namely, ESOPs convey positive signals to the market
that insiders are optimistic about the firm’s future value, which helps build investors’
confidence in the firm, mitigates the fall in stock price or a fire sale on stocks if there is
bad news, and thus reduces stock price crash risk. The positive signals ESOPs convey
to capital markets also include the likelihood that employees participating in ESOPs are
more motivated in exposing firms’ bad news, especially when their shares are within a
lock-in period. This finding is consistent with previous research, which focuses mainly
on the announcement effect of ESOPs. Beatty (1995) shows that ESOP announcements
may provide investors with signals about firms’ tax avoidance and anti-takeover behav-
iors. Conte et al. (1996) investigate the financial return and market reaction of ESOP
announcements. They find that an ESOP announcement is a good signal to buy a firm’s
stock. Banerjee et al. (2017) examine the stock price performance of ESOP firms during
economic crisis and recovery and find that ESOPs predict a lower fall in market
Li et al. Frontiers of Business Research in China (2019) 13:14 Page 2 of 33

capitalization during a crisis and a greater rise in market capitalization at the end of the
crisis. External shareholders pay close attention to information signals generated by
managerial actions [ESOPs and Seasoned Equity Offerings (SEOs)] that indicate resili-
ence during an economic crisis.
This paper also finds that the impact of ESOPs on stock price crash risk depends on
the characteristics of the ESOPs. In particular, the link between ESOPs and stock price
crash risk is more pronounced in larger-scale ESOPs, which is consistent with the find-
ings on the signaling effect of ESOPs, as larger-scale ESOPs convey stronger signals
about employees’ optimistic views on firms’ future value. ESOPs with high prices or
financial leverage do not reduce crash risk and sometimes even raise it, which is in-
consistent with the signaling effect. However, these inconsistent results do not mean
the signaling effect is ineffective, but indicate special signals about liquidation pressure
in a harsh market environment, which offset the positive signals sent by the ESOPs.
Our results are robust to various sensitivity analyses.
Our study makes several contributions. First, this study contributes to the literature
on the impact of ESOPs. This paper is the first so far directly testing the influence of
ESOPs on the stability of capital markets from the perspective of stock price crash risk,
while previous research focused mainly on employees’ attitudes, firm performance,
market reactions and abnormal returns. Our study enriches the perspectives on ESOP
influence and is a necessary supplement to the existing literature.
Second, our study extends literature on the influence factors of stock price crash risk.
Existing literature on factors affecting stock price crash risk mainly takes into account
the concealment and concentrated disclosures of bad news, while this paper includes
ESOPs into the study framework of stock price crash risk, and examines the influencing
factors of stock price crash risk from the perspectives of insiders’ signals sending and
investor behaviors, which is an important extension of the existing literature.
Finally, this paper uses a specific period, namely “the stock market crash in 2015” to
examine the impact of ESOPs on crash risk. It is a beneficial supplement to specific
and situated studies on ESOPs, and it also sheds light on the further establishment and
improvement of the relevant laws and regulations to the regulatory authorities.
The remainder of this paper is organized as follows. Institutional background intro-
duces the history and basic background of ESOPs in China. literature review and hy-
potheses development section presents the literature review and theoretical hypotheses.
Research design section describes the study design. In empirical results section, analysis
and explanation of empirical results are presented. Conclusion section concludes.
Institutional backgroundESOPs in China have emerged with the development following the reform and opening
up policy of China and the reform of state-owned enterprises (SOEs). The first ESOP
took place in a state-owned department store in 1984 with the approval of the Chinese
government. This store is also the first company in China to complete shareholding
reform. Since then, the number of ESOPs has increased rapidly. By the end of 1987,
more than 3,200 enterprises in China had carried out shareholding reforms, of which
more than 80% adopted ESOPs.
In 1992, the Chinese government started the process of corporatization in SOEs.
SOEs were allowed to adopt ESOPs with the approval of the regulatory authorities,
Li et al. Frontiers of Business Research in China (2019) 13:14 Page 3 of 33

which led to a further increase in the number of companies that implemented ESOPs.
However, ESOPs at that time were far from formal, and a series of key issues were not
clear. Abuse of public power and corruption emerged as the number of ESOPs ex-
panded. As such, the government gradually stopped approving new applications for
ESOPs and the implementation of ESOPs was actually stagnating.
To sum up, it is impossible to research the influence of ESOPs on capital markets at
this stage, as only two major stock exchanges in China, the Shanghai Stock Exchange
and the Shenzhen Stock Exchange, had just officially come into existence and only
eight stocks were traded in 1990. Most firms adopting ESOPs at that time were non-
listed companies. The adoption of an ESOP cannot be regarded as an independent mar-
ket-driven choice of a firm, for adoption and termination were both under the control
of the government.
Almost 20 years later, the CSRC issued the “Opinions” on June 20, 2014, which indi-
cated the resurgence of ESOPs in China. By the end of 2017, 816 out of 3,468 Chinese
A-share listed companies had successfully implemented ESOPs and many other com-
panies have the intention of adopting ESOPs. In addition, a large number of non-listed
companies, especially start-ups and high-tech ones have also implemented ESOPs.
Unlike in the US, where ESOPs are typically used as a pension plan (e.g., Holden and
Van Derhei 2003; Mitchell and Utkus 2002; Rauh 2006) and a means to conserve cash
in lieu of wages (e.g., Core and Guay 2001; Kim and Ouimet 2014; Poterba 2004),
ESOPs in Chinese firms, especially in listed firms, are adopted in the hope of establish-
ing a benefit-sharing system between workers and owners, improving corporate govern-
ance, enhancing employee cohesion and the competitiveness of a company. All of this
is covered in the “Opinions.”
In reality, ESOPs are often used by start-ups and high-tech companies as a means of
retaining core employees (so-called “golden handcuffs”), which means that ESOPs in
China emphasize incentives and benefits-sharing. Because of a lack of cash, there is in-
deed a phenomenon of substituting equity for wages in some Chinese start-ups. How-
ever, this is not the case in China’s listed firms though employees pay for shares with
their future wage earnings in most ESOPs, which may reduce cash outflows of wage
payment. The implementation of an ESOP does not improve the cash holdings of a
company, for less than a third of ESOPs in our sample are implemented through the
offering of new shares. Cash from ESOPs flow more to the stock market than to ESOP
firms through block transactions and secondary market acquisitions. In fact, due to the
existence of leveraged ESOPs, the implementation of ESOPs has somewhat deteriorated
firms’ financing ability rather than improving firms’ cash holdings. As a provider of
leveraged capital, financial institutions usually require a guarantee from ESOP firms or
their major shareholders. Due to the severe shocks in the China’s stock market in 2015,
firms that had implemented leveraged ESOPs and their major shareholders assumed
huge joint and several guarantee liability. In order to avoid compulsory liquidation,
some even repaid the leveraged capital in advance with their own funds.
ESOPs are also regarded as an effective anti-takeover tool (e.g., Beatty 1994; Chang
and Mayers 1992; Chaplinsky and Niehaus 1994; Gordon and Pound 1990; Park 2017;
Rauh 2006) in the US with fully decentralized stock ownership. However, the owner-
ship structure of listed firms in China is relatively centralized. According to the 2017
annual report of A-share listed companies in China, among all 3,512 listed companies,
Li et al. Frontiers of Business Research in China (2019) 13:14 Page 4 of 33

the average shareholding ratio of the largest shareholder is 33.8% and 520 companies
account for more than 50% of the largest shareholders. Considering that there may be
common ultimate controllers among different shareholders, the actual ownership
concentration is higher than these figures. Correspondingly, the shareholding ratio of
ESOPs in China is only 1.68%, which only has a minimal impact on firms’ ownership
structure and would not be able to prevent a takeover.
According to the “Opinions,” the total shareholding ratio of ESOPs shall not exceed
10%, and the single employee stock ownership ratio shall not exceed 1%. Considering
that ESOP participants are usually hundreds or even thousands of employees and the
shareholding ratio of ESOPs in China is less than 2%, the shareholding ratio of a single
employee is even smaller. The free riding behavior of ESOP participants maybe a prob-
lem to be considered (Brown et al. 1999; Comment and Jarrell 1987; Kim and Ouimet
2014). However, we argue that free riding behavior is not a causative problem in this
paper; instead, ESOP participants may be the active shareholders that shareholder ac-
tivism theory has been looking for, especially in the Chinese context. Free riding prob-
lems in ESOPs occur mainly in reducing productivity or firm performance (e.g., Kim
and Ouimet 2014). Employees may behave differently in supervising management and
disclosing negative information. Dyck et al. (2010) find that 17% of U.S. firms’ financial
fraud is first disclosed by employees. The number of active employees needed to im-
prove productivity and supervise management may be totally different. In other words,
only one active employee in the firm may have no effect on improving productivity, but
one is enough for information disclosure. There are many factors that can change an
ordinary employee into an active one. These factors are sometimes even not worth
mentioning from the perspective of corporate governance and incentives. For example,
a Chinese listed firm, Changsheng Biotechnology Co., Ltd. (stock code: 002680), was
fined RMB9.1 billion and forced to withdraw from the stock market for promulgating
fake vaccines in 2018. This event, which forced the CSRC to amend the rules for com-
pulsory delisting of listed firms, was first exposed by employees within the firm, whose
initial motivation was that the company did not pay their overtime wages on time. Par-
ticipation in an ESOP presumes a closer link between the employees’ and the firm’s
interests than overtime wages. Once employees have been injured, they are more likely
to become active employees and expose bad news about the firm, which in turn affects
the firm’s stock price and the stock price crash risk.
Finally, in China, ESOPs are still relatively new, and investors may not fully under-
stand what an ESOP is. Since the Chinese stock markets and investors are far from
mature, there may be deviations in the market reactions to ESOPs.
Literature review and hypotheses developmentThe existing literature on ESOPs and on stock price crash risk is extensive; however,
few studies have been conducted on the relationship between ESOPs and stock price
crash risk directly. As a mechanism linking employees’ interests and firms’ future value,
ESOPs are often regarded as an effective incentive measure, which can encourage em-
ployees’ motivation (Akerlof 1982; Buchko 1992; Hammer et al. 1981), improving firm
performance (Ahrens 2018; Conte and Tannenbaum 1978; Kumbhakar and Dunbar
1993; Pugh et al. 2000; Quarrey et al. 1986; Rosen and Quarrey 1987). The capital mar-
ket generally considers ESOP announcements to be positive signals of stock price
Li et al. Frontiers of Business Research in China (2019) 13:14 Page 5 of 33

which result in positive market reactions (Ding and Sun 2001; De Fusco et al. 1990;
Fang et al. 2015; Tehranian and Waegelein 1985; Triki and Ureche-Rangau 2012).
Overall, ESOPs are considered to be helpful in enhancing firm value and stock price.
The existing literature shows that stock price crash risk is due to the concealment
and subsequent concentrated outbreak of bad news. In consideration of private bene-
fits, such as political promotion (Piotroski et al. 2015), tax avoidance (Kim et al. 2011a)
and stock ownership incentives (Kim et al. 2011b), executives are motivated to disclose
firms’ good news in a timely manner while concealing bad news as far as possible.
However, hoarded bad news is suddenly revealed once concealment fails, which has a
negative impact on stock price and eventually leads to stock price crash (Xu et al.
2013). Therefore, the key to reducing stock price crash risk lies in timely and effective
information disclosure and avoidance of bad news hoarding (Jin and Myers 2006).
Building on the existing research, we propose two different effects of ESOPs on
stock price.
On the one hand, ESOPs may be negatively related to crash risk. ESOPs send positive
signals to the market that insiders are optimistic about a firm’s value (Tehranian and
Waegelein 1985), and these signals are often reliable for the following reasons. First,
not all firms can successfully issue an ESOP. An ESOP may be terminated if the board
of directors votes to oppose it, if it is vetoed by shareholders, or if employees choose
not to participate. In fact, more than 200 ESOPs have not been successfully issued for
these reasons from 2014 to 2017 in China. The successful issuance of an ESOP repre-
sents the unanimous judgment of directors, shareholders and employees on the value
of the firm. Second, participating in an ESOP is a voluntary and independent decision
made by employees rather than a compulsory act under firms’ administrative orders;
therefore it is a better way to show the employees’ evaluation of firm value than other
channels such as corporate marketing and media reports. Third, employees need to pay
for ESOPs, sometimes assuming extra liabilities, which make ESOP participation a high
cost and risky decision. Employees will not participate in the ESOP unless they do be-
lieve in the firm’s future value. It is highly unlikely that employees would participate in
an ESOP just to raise stock price and mislead investors.
Therefore, an ESOP announcement can upgrade investors’ estimates of the firm’s
future value, help build investors’ confidence in the firm, reduce the possibility of
a stock fire sale due to short-term negative news, and decrease a firm’s future
stock price crash risk. The higher the cost employees pay for participating in an
ESOP, the stronger the signal sent to capital markets. Larger-scale, higher-priced
and leveraged ESOPs are more signaling than otherwise. The signaling effect of an
ESOP on crash risk can also work through motivating employees to disclose firms’
bad news. Internal employees are one of the most important ways a firm’s bad
news is exposed (Dyck et al. 2010). An ESOP strengthens the link between
employees’ wealth and firm stock price performance. Employees are more moti-
vated to disclose bad news in order to prevent possible declines in stock price
caused by a concentrated outbreak of bad news when they sell their stocks. This
will also enhance investors’ confidence in a firm’s future value and reduce crash
risk. Based on the signaling hypothesis, we predict that ESOPs send positive signals
to the market about a firm’s value, reduce negative reactions to bad news and
ultimately decrease stock price crash risk.
Li et al. Frontiers of Business Research in China (2019) 13:14 Page 6 of 33

On the other hand, ESOPs may increase crash risk under specific circumstances. As a
tool linking shareholders’ benefits with employees’ (Hall and Murphy 2000, 2002, 2003;
Huddart 1994; Jensen and Murphy 1990; Kim and Ouimet 2011), employees share not
only the benefits but also the risks with the firm after the adoption of an ESOP. Partici-
pants in an ESOP will suffer extra losses if share prices drop dramatically after the adop-
tion of an ESOP. As employees are generally considered to be risk neutral or even risk
averse (Agrawal and Mandelker 1987; Cohen et al. 2000; De Fusco et al. 1990; Haugen
and Senbet 1981; Rajgopal and Shevlin 2002), an ESOP committee may sell off shares to
stop losses when share prices fall sharply. ESOPs may be forced to sell off shares in the
form of a margin close out in the case of leveraged ESOPs, if the margin is not replenished
or no other remedial measures are taken. These active or passive trading practices will ac-
celerate the drop of stock price and increase crash risk. Second, considering that the
ESOP is now a hot topic in China’s capital markets, announcements of ESOPs are more
likely to attract analysts’ optimistic bias and forecasting may also increase a firm’s stock
price crash risk (Xu et al. 2013).
Therefore, we propose two competing hypotheses.
Hypothesis 1a: ESOP announcements are negatively related to firms’ future stock price
crash risk.
Hypothesis 1b: ESOP announcements are positively related to firms’ future stock price
crash risk.
Research designSample selection
Our sample period is from the second half of 2014 to the end of 2017. The CRSC
issued the “Opinions” on June 20, 2014, which indicates that ESOPs had officially
become a stock ownership incentive for Chinese listed companies by that time. It is
noteworthy that 2014 is not the first year ESOPs came to China. For example, Chinese
SOEs have been allowed to be privatized into incorporated companies and adopt
ESOPs with the approval of regulatory authorities since 1992. However, ESOPs at that
time were to some extent mandatory, unplanned and nonstandard. Most firms adopting
ESOPs were non-listed and therefore did not need to pay attention to crash risk.
All of our research data comes from CSMAR and WIND databases, two of the most
publicly used and widely accepted databases in financial and economic research in
China. The financial and stock exchange data of listed firms used to calculate stock
price crash risk are sourced from the CSMAR database. Employee stock ownership data
of listed companies are sourced from the WIND database. ESOP partial characteristic
data, such as ESOP size, price, and leverage ratio, are collected manually from
provisional announcements of listed firms.
We collect data from 816 cases of ESOPs in China announced from the second half
of 2014 to the end of 2017, and remove cases with missing or abnormal values which
could not be refilled manually, which reduces our ESOP cases to 783. Meanwhile, in
order to address the endogeneity problem caused by differences in firm characteristics,
and examine the influence of ESOP announcements on stock price crash risk accur-
ately, we conduct propensity score matching (PSM) for ESOP firms. ESOP paired firms
Li et al. Frontiers of Business Research in China (2019) 13:14 Page 7 of 33

are in the same industry and most similar in terms of total assets (Ding and Sun 2001;
Jones and Pliskin 1997), return on assets (Beatty 1994), shareholding ratio of the largest
shareholder (Beatty 1994) and debt liability, which previous research has demonstrated
impacts the decision to adopt an ESOP. The ratio of event firms to the paired ones
is 1:1. Finally, we obtain a full sample of 4,832 observations from 1,566 event and
paired firms.
Existing literature on stock price crash risk generally uses quarterly data; this paper,
however, employs half-year data, as the quarterly data of some control variables (e.g.,
the information transparency of listed firms measured as the accrual earnings) in the
empirical models are unavailable due to the information disclosure rules of the Chinese
stock markets.
Table 1 reports the number of ESOP adoptions. The number of ESOP adoptions had
increased gradually from the second half of 2014 to the end of 2015. The adoption of
ESOPs fell sharply in 2016, mainly because China’s stock market experienced a big
crash in 2015 and the confidence of the firm’s major shareholders and employees in
the stock market had not yet been restored.
Measuring crash risk
We employ two measures of stock price crash risk, following Chen et al. (2001), Hutton
et al. (2009) and Kim et al. (2011a, 2011b). Both measures are based on firm-specific
weekly returns estimated as the residuals from the market model. To calculate firm-
specific weekly returns, we estimate the following expanded market model regression.
Ri;t ¼ α0 þ α1Rm;t−2 þ α2Rm;t−1 þ α3Rm;t þ α4Rm;tþ1 þ α5Rm;tþ2 þ εi;t ; ð1Þ
where Ri,t is the return of stock i in week t, Rm,t rm, t is the value-weighted return of all
China A-share stocks in week t. The firm-specific return Wi,t is measured by the nat-
ural log of one plus the residual return in Eq. (2):
Wi;t ¼ ln 1þ εi;t� �
; ð2Þ
where εi,t is the regression residual of Eq. (1).
Based on Wi,t, our first measure of crash risk is the negative conditional skewness of
firm-specific weekly returns over the past 6 months (NCSKEW), Specifically, for each
firm i in period t, NCSKEW is calculated as:
NCSKEWi;t ¼ − n n−1ð Þ3=2Xni¼1
W 3i;t
" #= n−1ð Þ n−2ð Þ
Xni¼1
W 2i;t
!3=224
35; ð3Þ
where Wi,t is the firm-specific weekly return defined above and n is the number of
weekly returns during period t. A negative sign is put such that a higher value of
NCSKEW indicates higher crash risk.
Our second measure of crash risk is the down-to-up volatility (DUVOL). For each
firm i over the period t, firm-specific weekly returns are separated into two groups,
“down” weeks when the returns are below the mean of firm-specific weekly returns
over the last 6 months, and “up” weeks when the returns are above it. Then we calcu-
late the standard deviation of firm-specific weekly returns for each of these two groups
Li et al. Frontiers of Business Research in China (2019) 13:14 Page 8 of 33

separately. DUVOL is the natural logarithm of the ratio of the standard deviation in the
“down” weeks to the standard deviation in the “up” weeks:
DUVOLi;t ¼ ln nu−1ð ÞXdown
R2d
" #= nd−1ð Þ
Xup
R2u
" #( ); ð4Þ
where nu is the number of up weeks and nd is the number of down weeks over the past
6 months.
Empirical model
ESOPs and stock price crash risk
To investigate the effect of ESOPs on crash risk, we first estimate the following
regression:
CrashRiski;t ¼ α0 þ α1 � ESOPi;t−1 þ α2 � Control Variablest−1 þ εi;t ; ð5Þ
where CrashRiski,t represents stock price crash risk of firm i during the time period t,
which is measured by the negative conditional skewness of firm-specific weekly returns
over the past 6 months (NCSKEW) and the down-to-up volatility measure (DUVOL) of
the crash likelihood; ESOPi,t-1 is a dummy variable representing whether firm i adopts
an ESOP during the time period t–1, valued at 1 if the firm has announced the adop-
tion of ESOP, and 0 otherwise.
We also use the follow indexes to measure firm ESOP in the subsequent empirical
tests:
(1) The scale of ESOP stocks (Size_ESOP, Stock_ESOP)
Size_ESOP is the fund scale of an ESOP, which is measured by the natural logarithm
of all capital invested in an ESOP (including employees’ own money and funds from
leveraged financing). Once an ESOP is announced, external investors may judge a
firm’s future value based on the size of the ESOP. For example, a small-scale ESOP
may means that employees are not so optimistic about the firm’s future and are not
willing to invest a lot of money in the firm’s ESOP, which will certainly affect the
ESOP’s market reaction. We employ this variable to differentiate the market reaction to
different capital scales in ESOPs.
Table 1 Semiannual ESOP adoptions and observations
Semiannual ESOP adoptions ESOP firm-semiannual observations
2014–2 49 98
2015–1 146 390
2015–2 208 666
2016–1 103 808
2016–2 70 896
2017–1 103 1032
2017–2 104 942
Total 783 4832
Notes. This table reports the number of ESOP adoptions and the number of firm-semiannual observations identifiedthrough PSM from the second half of 2014 (2014–2) to the second half of 2017 (2017–2)
Li et al. Frontiers of Business Research in China (2019) 13:14 Page 9 of 33

Stock_ESOP is the shareholding ratio of an ESOP, which is measured as the ratio of
ESOP shares to the firm’s total outstanding ones. Considering that the variable Size_
ESOP is closely related to the size of the firm, in order to eliminate this correlation, we
introduce Stock_ESOP to further test the market reaction of ESOPs of different sizes.
(2) The price of ESOPs (Price_ESOP, R_Price_ESOP)
Price_ESOP is the estimated share price of an ESOP disclosed in the Draft of Em-
ployee Stock Ownership Plan. The estimated share price of an ESOP is not only dir-
ectly related to the future returns of the ESOP, but also reflects the insider judgment
on future share price, which will undoubtedly affect the final market reaction. We em-
ploy this variable to differentiate the market reaction to the level of share price at which
the ESOP is issued.
R_Price_ESOP is the ratio of estimated share price to the closing price of the shares
on the date the ESOP was announced. ESOP share price is based on the firm’s share
price at the time the ESOP was announced, and there is significant difference in prices
between different stocks, which may reduce the information content of variable Price_
ESOP. In order to control for this problem, we employ variable R_Price_ESOP to fur-
ther test the market reaction of ESOPs of different price levels.
(3) The leverage of ESOPs (Dum_lev_ESOP, Lev_ESOP)
Dum_lev_ESOP is a dummy variable representing whether an ESOP is leveraged, val-
ued at 1 if funds used in the ESOP involve debt financing from other financial institu-
tions, and 0 otherwise. A leveraged ESOP implies a higher risk for employees, the firm
or its major shareholders with joint and several liability for security than a general
ESOP. The willingness to adopt a leveraged ESOP may mean that employees are more
optimistic about the firm’s future value, which will also affect the external investors’
judgment of the firm’s value, and thus the market reaction. Therefore, we employ this
variable to differentiate the market reaction to the level of ESOP leverage.
Lev_ESOP is the ratio of debt financing to employees’ own money in the ESOP. This
variable is employed to further test the difference of market reaction to the level of
ESOP leverage.
ControlVariablesi,t-1 are the control variables. Following Chen et al. (2001), Hutton et
al. (2009), and Kim et al. (2011a, 2011b), we use the following variables as control
variables:
(1) Change of trading volume (Dturn), calculated as the average monthly share
turnover in period t minus the average monthly share turnover in t – 1;
(2) Stock return over the past 6 months (Hret), calculated as the mean of firm-specific
weekly returns over the fiscal year;
(3) Stock volatility (Sigma), calculated as the standard deviation of firm-specific weekly
returns over the past 6 months;
(4) Firm size (Size), calculated as the log value of the market value of equity;
(5) The market-to-book ratio (MB), calculated as the market value of a firm divided by
its book value of equity;
Li et al. Frontiers of Business Research in China (2019) 13:14 Page 10 of 33

(6) The firm’s asset liability ratio (Lev), calculated as total long-term debts divided by
total assets;
(7) Profitability (ROA), calculated as net profits divided by total assets;
(8) Earnings management (DA), the absolute value of abnormal accruals estimated by
the modified Jones model.
As well, we control the lag value of crash risk to account for the potential serial cor-
relation for the sample firms. All of our regressions include industry and time fixed
effects.
To eliminate the influence of extreme values on our findings, we winsorize continu-
ous variables by replacing all outliers with the 5th and 95th percentiles.
Table 2 presents the descriptive statistics for the variables used in our regression ana-
lysis. Panel A of Table 2, which contains both firms adopting ESOPs and their paired
ones, reports the descriptive statistics for the full sample, and gives an overview of the
China stock markets in terms of trading volume (Dturn), half year return (Hret), stock
price volatility (Sigma), firm size (Size), market to book ratio (MB), leverage ratio (Lev),
return on assets (ROA), earnings management (DA), and stock price crash risk
(NCSKEW and DUVOL).
More details of ESOPs in China are presented in panel B of Table 2. The size of
ESOPs after logarithmic (Size_ESOP) is 9.310, about 1.679% of firms’ total stock
(Stock_ESOP). The expected ESOP price (Price_ESOP) is 19.51, which is equivalent
to a 30.8% discount of the closing price on the ESOP announcement date (R_
Price_ESOP). 44.9% of ESOPs are leveraged (Price_ESOP); the average proportion
of leveraged funds to employees’ own money is 71.6% (Lev_ESOP).
Signaling effect of ESOPs on crash risk
To test whether the signaling mechanism of ESOPs on crash risk works, we run the fol-
lowing empirical model:
CrashRiski;t ¼ α0 þ α1 � ESOPi;t−1 � Signali;t−1 þ α2 � ESOPi;t−1
þα3 � Signali;t−1 þ α4 � Control Variablest−1 þ εi;t ;ð6Þ
where Signali,t-1 is a dummy variable representing a firm’s negative information. We
use three methods to describe a firm’s negative information: A dummy variable of
whether the firm’s earnings per share (EPS) is lower than analysts’ consensus expect-
ation (DEPS), a dummy variable of whether the firm has been penalized by the CSRC
(Punish) in the past 6 months, and a dummy variable of whether the firm is involved in
lawsuits as a defendant (Lawsuit).
Notice that these three variables DEPS, Punish and Lawsuit represent the
quality of the firm to a certain extent, which may affect the original crash risk
level and cause some endogeneity problems. However, crash risk is caused by a
concentrated outbreak of bad news, rather than “bad” firms. We employ these
three variables to test the influence of ESOPs on crash risk when bad news does
exist and breaks out. If ESOPs do send positive signals to external investors
about firms’ future value and produce confidence in stock price, the influence of
negative information should be weakened and the stock price should drop less or
not at all.
Li et al. Frontiers of Business Research in China (2019) 13:14 Page 11 of 33

Empirical resultsESOPs and stock price crash risk
To examine the relationship between ESOPs and stock price crash risk, we esti-
mate Eq. (5) using matched samples obtained through propensity score matching
(PSM). Full samples without PSM are also included in Table 3 to ensure the effect-
iveness of our PSM approach and to control for the selective bias caused by PSM.
Table 3 presents the regression results. Columns (3) and (4) report the results of
regressions using matched samples, where crash risk is measured by the negative condi-
tional skewness of firm-specific weekly returns over the past 6 months (NCSKEW) and
the down-to-up volatility (DUVOL) respectively. Results show that ESOP
Table 2 Descriptive statistics
Variable No. of obs. Mean P1 Median P99 Std
Panel A: Event group (firms adopting ESOPs) + paired group
NCSKEW 4832 −0.341 −1.745 − 0.435 1.337 0.764
DUVOL 4832 −0.256 −1.375 −0.312 0.946 0.575
ESOP 4832 0.500 0 1 1 0.500
Dturn 4832 −0.315 −9.295 −0.266 4.188 1.552
Hret 4832 −0.013 −0.336 −0.081 1.407 0.036
Sigma 4832 0.030 0.013 0.026 0.064 0.013
Size 4832 22.239 20.598 22.146 24.015 0.931
MB 4832 2.871 0.027 2.147 12.597 3.042
Lev 4832 0.412 0.146 0.402 0.720 0.181
ROA 4832 2.140 −0.788 1.870 5.728 1.807
DA 4832 − 0.017 −0.203 −0.026 0.182 0.109
Panel B: Sub-sample of companies adopting ESOPs
NCSKEW 2416 −0.353 −1.745 − 0.446 1.337 0.760
DUVOL 2416 −0.276 −1.254 −0.328 0.946 0.568
Stock_ESOP 2416 1.679 0.030 1.260 7.270 1.501
Size_ ESOP 2416 9.310 6.358 9.220 11.918 1.145
Price_ ESOP 2416 19.510 3.140 15.790 84.140 14.765
R_price_ESOP 2416 0.692 0 0.853 1.769 0.489
Dum_Lev_ ESOP 2416 0.449 0 0 1 0.498
Lev_ ESOP 2416 0.716 0 0 6.301 1.719
Dturn 2416 −0.296 −4.341 −0.250 3.910 1.466
Hret 2416 −0.006 − 0.336 − 0.078 1.540 0.318
Sigma 2416 0.030 0.013 0.026 0.064 0.014
Size 2416 22.235 20.737 22.157 24.015 0.881
MB 2416 2.819 0.201 2.235 11.080 2.389
Lev 2416 0.411 0.146 0.404 0.720 0.176
ROA 2416 2.180 −0.788 1.985 5.728 1.741
DA 2416 −0.023 − 0.203 −0.031 0.182 0.106
Notes. This table presents descriptive statistics on stock price crash risk, executive compensation, and control variables.The sample contains firms adopting ESOPs from 2014 to 2017 and their paired firms. All variables are defined insection 3.2
Li et al. Frontiers of Business Research in China (2019) 13:14 Page 12 of 33

announcements are negatively related to future crash risk at the 5% level, indicating
that ESOPs can significantly decrease firms’ future stock price crash risk.
Columns (1) and (2) report full sample results, which cover all listed firms in the
China A-share market from 2014 to 2017. The negative relationship between
ESOPs and future crash risk still persists after enlarging our research sample to all
listed firms in China. As the PSM approach does not affect the relation between
ESOPs and crash risk, samples used in subsequent tests are all matched ones.
In sum, results in Table 3 show that ESOP announcements are negatively related to
firms’ future crash risk, which indicates that ESOPs can decrease crash risk signifi-
cantly. This finding supports Hypothesis 1a.
Results in Table 3 may also indicate potential endogeneity problems. As ESOPs
are negatively related to stock price crash risk, a firm’s stock price and its crash
risk may also be determinants of ESOP implementation. Firms with lower crash
risk are more likely to adopt ESOPs rather than ESOPs’ decreasing firms’ crash
risk. To control for this problem, we modify the PSM approach in this paper, add-
ing firms’ previous crash risk level in matching conditions and re-examine Eq. (5).
The results still persist, which indicates that the potential effect of firms’ previous
crash risk level on ESOP adoption cannot explain the negative relationship between
them. However, we do not present this result due to the length of this paper.
Table 3 Impact of ESOPs on stock price crash risk
Variable Full samples Paired samples
NCSKEW (1) DUVOL (2) NCSKEW (3) DUVOL (4)
ESOPi,t-1 −0.104c (−3.16) − 0.109c (−4.19) − 0.025b (− 2.22) − 0.038b (− 2.47)
Dturni,t-1 0.003 (0.63) 0.004 (0.91) 0.007 (0.99) 0.007 (1.25)
Hreti,t-1 0.238c (22.09) 0.151c (16.87) 0.705c (11.83) 0.515c (10.9)
Sigmai,t-1 −6.928c (−21) −5.675c (− 21.66) −2.785 (− 1.33) −1.021 (−0.65)
MBi,t-1 0.02c (5.96) 0.015c (5.77) 0.016c (3.76) 0.009c (2.88)
Sizei,t-1 −0.042c (−9.29) − 0.029c (−8.15) −0.011 (−0.70) − 0.022a (−1.85)
Levi,t-1 0.028b (2.39) 0.018b (2.01) 0.128 (1.64) 0.041 (0.71)
ROAi,t-1 0.000 (−0.08) 0.000 (−0.10) −0.03c (−4.69) −0.031c (−6.60)
DAi,t-1 0.000 (−0.02) 0.000 (−0.11) −0.138 (−1.30) −0.107 (−1.35)
NCSKEWi,t-1 0.067c (10.12) 0.108c (6.87)
DUVOLi,t-1 0.077c (10.82) 0.119c (7.01)
Intercept 0.938c (8.72) 0.68c (7.98) 0.075 (0.18) 0.524a (1.69)
Fix_ind Yes Yes Yes Yes
Fix_time Yes Yes Yes Yes
Adj-R2 0.0541 0.0665 0.1554 0.1799
No. of obs. 25,391 25,391 4,832 4,832
Notes. This table presents the results of the impact of ESOPs on stock price crash risk using both full samples and pairedsamples. Full samples cover firms in China A-share markets from 2014 to 2017 with non-missing values for crash risk,ESOPs and control variables. Paired samples cover firms adopting ESOPs and their matched firms through PSM. Theempirical test model isCrashRiski, t = α0 + α1 × ESOPi, t − 1 + α2 × Control Variablest − 1 + εi, tThe t-statistics, reported in parentheses, are based on standard errors clustered by both firm and time. Time and industryfixed effects are included. Here a, b, and c indicate statistical significance at the 10%, 5%, and 1% levels, respectively
Li et al. Frontiers of Business Research in China (2019) 13:14 Page 13 of 33
Signaling effect of ESOPs on crash risk
To examine the signaling effect of ESOPs on crash risk, we run Eq. (6) and estimate
the interaction between ESOPs and firms’ negative news in crash risk. We employ three
proxies for firms’ negative information: Whether the firm’s EPS is lower than analysts’
consensus expectations (DEPS); whether the firm or its executive being penalized by
the CSRC (Punish); and whether the firm was involved in lawsuits as a defendant
(Lawsuit) during the past 6 months.
First, regression results in Table 4 show a positive regression coefficient of negative
information (DEPSi,t, Punishi,t and Lawsuiti,t) and crash risk, indicating that the release
of bad news significantly aggravates current crash risk. Second, the regression coeffi-
cients of cross terms between ESOPi,t-1 and DEPSi,t (Punishi,t and Lawsuiti,t) are signifi-
cantly negative, indicating that previously announced ESOPs can alleviate crash risk
caused by the outbreak of negative information. Results in Table 4 is consistent with
the signaling effect that ESOPs send positive signals about firms’ future value and build
up investors’ confidence in stock prices, which decrease the adverse effects of negative
information on crash risk.
It is worth noting that the signaling effect in this paper is not entirely consistent with
previous mainstream research on stock price crash risk which focuses on the conceal-
ment and subsequent concentrated outbreak of bad news (e.g., Kim et al. 2011a, 2011b;
Piotroski et al. 2015). However, as found by Goldstein and Guembel (2008) and Chu
and Fang (2016), crash risk describes the imbalance of stock price volatility between as-
cending and descending stages, and is manifested through investors’ trading behaviors.
Following this research, we compare the differences between ESOP firms and their
matched ones on stock price performance and investors’ trading behavior after the re-
lease of bad news and test the influence of these differences on the relationship of
ESOPs and crash risk.
We define bad news as when a listed firm or its executive is penalized by the CSRC
(Punish), and/or the firm is involved in lawsuits as a defendant (Lawsuit). Different
from the regression results presented in Table 4, we drop DEPS from the bad news
measurement if a firm’s earnings per share (EPS) is formally disclosed in annual re-
ports, which contain other information that affects stock price and investor behavior.
We collect 1,291 cases where ESOP firms and their matched ones were involved in law-
suits as a defendant (Lawsuit) and 381 cases that listed firms or its executives were pe-
nalized by the CSRC (Punish). We drop observations in which two or more incidents of
bad news were released in less than 3 months to control the mixed influence of differ-
ent incidents of bad news. Finally, we obtain 1,421 observations of bad news, 706 from
ESOP firms and the other 715 from matched samples. We define stock price perform-
ance as the cumulative abnormal returns adjusted by market line in the subsequent 5
days after bad news was released [CAR (0, 5)], and investors’ behavior as firms’ stock
turnover in the 30 days (Stto) after the release of bad news. Stto is adjusted by the in-
dustry level to control the co-movement effect of sectors, which is a typical
phenomenon in Chinese stock markets.
We then compare the difference of CAR (0, 5) and Stto between ESOP firms and
their matched ones using the t-test method. Table 5 presents the results of the t-test.
Results in Table 5 show that there are significant differences between ESOP firms
and matched ones in stock price performance and investors’ trading behavior.
Li et al. Frontiers of Business Research in China (2019) 13:14 Page 14 of 33

Table 4 Signaling effect of ESOPs on crash risk
Variable DEPS Punish Lawsuit
NCSKEW (1) DUVOL (2) NCSKEW (3) DUVOL (4) NCSKEW (5) DUVOL (6)
ESOPi,t-1 × DEPSi,t −0.002b − 0.002c
(−2.28) (−3.52)
ESOPi,t-1×Punishi,t −0.008b −0.015b
(−2.51) (−1.98)
ESOPi,t-1×Lawsuiti,t −0.005c −0.010b
(−3.01) (−2.27)
ESOPi,t-1 −0.027b −0.04b − 0.027b −0.044c − 0.023b −0.035b
(−2.13) (− 2.57) (− 2.17) (−3.09) (−2.01) (− 2.05)
DEPSi,t 0.002a 0.002a
(1.93) (1.68)
Punishi,t 0.059b 0.019b
(1.91) (2.48)
Lawsuiti,t 0.066a 0.040c
(1.82) (3.48)
Dturni,t-1 0.011 0.008 0.008 0.007 0.008 0.007
(1.47) (1.51) (1.09) (1.22) (1.11) (1.23)
Hreti,t-1 0.725c 0.54c 0.723c 0.527c 0.724c 0.527c
(11.85) (11.21) (12.21) (11.21) (12.24) (11.21)
Sigmai,t-1 −3.676a −1.761 −2.902 −1.239 −3.092 − 1.343
(−1.70) (− 1.10) (− 1.38) (−0.79) (− 1.47) (− 0.86)
MBi,t-1 0.023c 0.011b 0.016c 0.009c 0.016c 0.009c
(3.67) (2.42) (3.69) (2.90) (3.74) (2.93)
Sizei,t-1 −0.004 − 0.023a − 0.012 − 0.024b − 0.012 − 0.023a
(− 0.26) (−1.83) (− 0.75) (− 1.97) (− 0.75) (− 1.96)
Levi,t-1 0.158a 0.061 0.118 0.039 0.114 0.036
(1.91) (0.99) (1.50) (0.68) (1.46) (0.62)
ROAi,t-1 −0.033c − 0.034c − 0.028c − 0.031c −0.027c − 0.03c
(−5.04) (−6.96) (−4.40) (−6.49) (−4.27) (−6.38)
DAi,t-1 −0.127 −0.085 − 0.158 − 0.113 − 0.163 −0.116
(−1.16) (−1.05) (− 1.49) (− 1.44) (− 1.53) (− 1.48)
NCSKEWi,t-1 0.093c 0.09c 0.09c
(5.95) (5.88) (5.87)
DUVOLi,t-1 0.105c 0.103c 0.103c
(6.21) (6.22) (6.20)
Intercept 0.164 0.626b 0.304 0.615b 0.296 0.606b
(0.41) (2.09) (0.80) (2.18) (0.78) (2.15)
Fix_ind Yes Yes Yes Yes Yes Yes
Fix_time Yes Yes Yes Yes Yes Yes
Adj-R2 0.1492 0.1771 0.1503 0.1768 0.1509 0.1773
No. of obs. 4634 4634 4832 4832 4832 4832
Notes. This table presents results of the relationship between ESOPs and crash risk when firms’ negative information isdisclosed, estimated by the equation:CrashRiski;t ¼ α0 þ α1 � ESOPi;t−1 � Signali;t−1 þ α2 � ESOPi;t−1 þ α3 � Signali;t−1 þ α4 � Control Variablest−1 þ εi;t ;The t-statistics, reported in parentheses, are based on standard errors clustered by both firm and time. Time and industryfixed effects are included. Here a, b, and c indicate statistical significance at the 10%, 5%, and 1% levels, respectively
Li et al. Frontiers of Business Research in China (2019) 13:14 Page 15 of 33

Concretely, firms suffer a negative cumulative abnormal return of 15.3% in the 5 days
after the release of bad news, while the negative cumulative abnormal return decreases
to 12.6% if the firm had announced the adoption of an ESOP beforehand. The 2.7% dif-
ference (significant at the 1% level) in cumulative abnormal returns may change the dis-
tribution of stock returns and affect stock price crash risk. The release of bad news also
causes a fire sale and increases the turnover ratio of stocks. The turnover ratio of stocks
increases to an additional 78.1% compared to its industry level in the 30 days after the
breakout of bad news, but it decreases to 47.7% if a firm had announced the adoption
of an ESOP beforehand. The difference in stock turnover ratio (significant at the 1%
level) indicates that investors have more confidence in ESOP firms and are more cau-
tious to sell ESOP stocks, which can also reduce stock price crash risk. In sum, Table 5
shows that the adoption of ESOPs does influence investors’ trading behavior and the
distribution of stock returns, which may change the level of stock price crash risk.
To further examine whether this influence is pronounced in the relationship between
ESOPs and crash risk, we then test the mediation effect of CAR (0,5) and Stto on the
relationship between ESOPs and crash risk. Table 6 presents the results of these
regressions.
Regression results in Table 6 show that the negative relationship between ESOPs and
crash risk still exists when we reduce our research sample to firms experiencing bad news,
in columns (1) and (6), which is the baseline fortesting the mediation effect. Regression re-
sults in columns (2) and (7) show that CAR (0, 5) is negatively related to crash risk, which
indicates that ESOP adoption may reduce crash risk through changing stock price perform-
ance, as ESOP adoption can decrease the negative cumulative abnormal returns caused by
bad news (the result is presented in Table 5). Regression results in columns (3) and (8) show
that the negative relationship between ESOPs and crash risk disappears when we add the
variable CAR (0, 5) into the regression of ESOP and crash, which further improves the me-
diation effective of CAR (0, 5) on the relationship between ESOP and crash risk.
The regression results of Stto are similar as that of CAR (0, 5). The release of bad news
causes a fire sale, leads to a higher stock turnover ratio, and increases crash risk [in columns
(4) and (9)]. The adoption of an ESOP can decrease the abnormal high stock turnover ratio
(this result is presented in Table 5). When we add Stto into the regression equation, the
negative relationship between ESOPs and crash disappears [in column (5)] or decreases [in
column (10)]. This result can also improve the existence of the mediation effect.
In sum, Tables 5 and 6 further improve our understanding of how the signaling effect
of ESOPs works: ESOPs send positive signals to capital markets that insiders are
optimistic about the firms’ future value, which helps enhance investors’ confidence. If
Table 5 Stock price performance and investor trading behavior after negative informationdisclosure
Variable ESOP Firms (1) Matched Samples (2) Difference (1)–(2)
Means No. of obs. Means No. of obs. Means t-value
CAR (0,5) −0.126 706 −0.153 715 0.027a (8.33)
Stto 0.477 706 0.781 715 −0.304a (15.98)
Notes. This table presents the difference in price performance and investor trading behavior between ESOP firms andtheir matched ones after the disclosure of negative information using a t-test method CAR (0,5) is the cumulativeabnormal returns adjusted by market line in the 5 days after bad news is disclosed, which measures stock priceperformance. Stto is firms’ stock turnover ratio in the 30 trading days after negative information disclosure to measureinvestor trading behavior. Here aindicate statistical significance at the 1% levels
Li et al. Frontiers of Business Research in China (2019) 13:14 Page 16 of 33
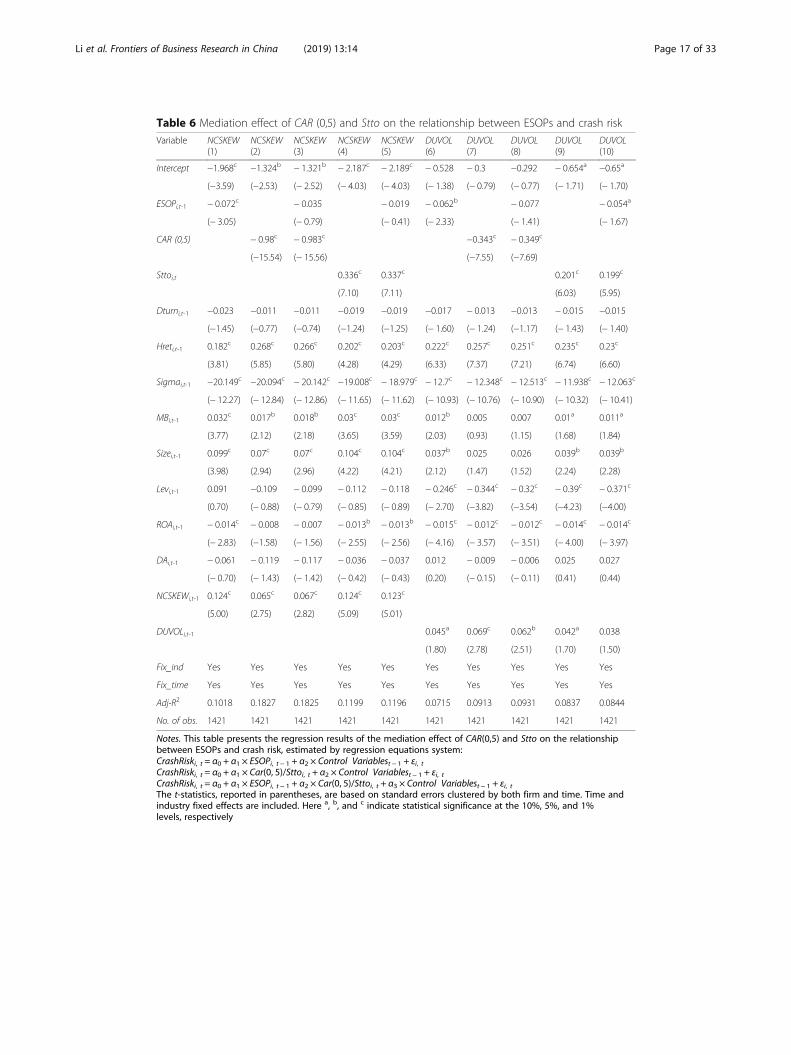
Table 6 Mediation effect of CAR (0,5) and Stto on the relationship between ESOPs and crash risk
Variable NCSKEW(1)
NCSKEW(2)
NCSKEW(3)
NCSKEW(4)
NCSKEW(5)
DUVOL(6)
DUVOL(7)
DUVOL(8)
DUVOL(9)
DUVOL(10)
Intercept −1.968c −1.324b − 1.321b − 2.187c − 2.189c − 0.528 − 0.3 −0.292 − 0.654a −0.65a
(−3.59) (−2.53) (− 2.52) (− 4.03) (− 4.03) (− 1.38) (− 0.79) (− 0.77) (− 1.71) (− 1.70)
ESOPi,t-1 − 0.072c − 0.035 − 0.019 − 0.062b − 0.077 − 0.054a
(− 3.05) (− 0.79) (− 0.41) (− 2.33) (− 1.41) (− 1.67)
CAR (0,5) − 0.98c − 0.983c −0.343c − 0.349c
(−15.54) (− 15.56) (−7.55) (−7.69)
Sttoi,t 0.336c 0.337c 0.201c 0.199c
(7.10) (7.11) (6.03) (5.95)
Dturni,t-1 −0.023 −0.011 −0.011 −0.019 −0.019 −0.017 − 0.013 −0.013 − 0.015 −0.015
(−1.45) (−0.77) (−0.74) (−1.24) (−1.25) (− 1.60) (− 1.24) (−1.17) (− 1.43) (− 1.40)
Hreti,t-1 0.182c 0.268c 0.266c 0.202c 0.203c 0.222c 0.257c 0.251c 0.235c 0.23c
(3.81) (5.85) (5.80) (4.28) (4.29) (6.33) (7.37) (7.21) (6.74) (6.60)
Sigmai,t-1 −20.149c −20.094c − 20.142c −19.008c − 18.979c − 12.7c − 12.348c − 12.513c − 11.938c − 12.063c
(− 12.27) (− 12.84) (− 12.86) (− 11.65) (− 11.62) (− 10.93) (− 10.76) (− 10.90) (− 10.32) (− 10.41)
MBi,t-1 0.032c 0.017b 0.018b 0.03c 0.03c 0.012b 0.005 0.007 0.01a 0.011a
(3.77) (2.12) (2.18) (3.65) (3.59) (2.03) (0.93) (1.15) (1.68) (1.84)
Sizei,t-1 0.099c 0.07c 0.07c 0.104c 0.104c 0.037b 0.025 0.026 0.039b 0.039b
(3.98) (2.94) (2.96) (4.22) (4.21) (2.12) (1.47) (1.52) (2.24) (2.28)
Levi,t-1 0.091 −0.109 − 0.099 − 0.112 − 0.118 − 0.246c − 0.344c − 0.32c − 0.39c − 0.371c
(0.70) (− 0.88) (− 0.79) (− 0.85) (− 0.89) (− 2.70) (−3.82) (−3.54) (−4.23) (−4.00)
ROAi,t-1 − 0.014c − 0.008 − 0.007 − 0.013b − 0.013b − 0.015c − 0.012c − 0.012c − 0.014c − 0.014c
(− 2.83) (−1.58) (− 1.56) (− 2.55) (− 2.56) (− 4.16) (− 3.57) (− 3.51) (− 4.00) (− 3.97)
DAi,t-1 − 0.061 − 0.119 − 0.117 − 0.036 − 0.037 0.012 − 0.009 − 0.006 0.025 0.027
(− 0.70) (− 1.43) (− 1.42) (− 0.42) (− 0.43) (0.20) (− 0.15) (− 0.11) (0.41) (0.44)
NCSKEWi,t-1 0.124c 0.065c 0.067c 0.124c 0.123c
(5.00) (2.75) (2.82) (5.09) (5.01)
DUVOLi,t-1 0.045a 0.069c 0.062b 0.042a 0.038
(1.80) (2.78) (2.51) (1.70) (1.50)
Fix_ind Yes Yes Yes Yes Yes Yes Yes Yes Yes Yes
Fix_time Yes Yes Yes Yes Yes Yes Yes Yes Yes Yes
Adj-R2 0.1018 0.1827 0.1825 0.1199 0.1196 0.0715 0.0913 0.0931 0.0837 0.0844
No. of obs. 1421 1421 1421 1421 1421 1421 1421 1421 1421 1421
Notes. This table presents the regression results of the mediation effect of CAR(0,5) and Stto on the relationshipbetween ESOPs and crash risk, estimated by regression equations system:CrashRiski, t = α0 + α1 × ESOPi, t − 1 + α2 × Control Variablest − 1 + εi, tCrashRiski, t = α0 + α1 × Car(0, 5)/Sttoi, t + α2 × Control Variablest − 1 + εi, tCrashRiski, t = α0 + α1 × ESOPi, t − 1 + α2 × Car(0, 5)/Sttoi, t + α3 × Control Variablest − 1 + εi, tThe t-statistics, reported in parentheses, are based on standard errors clustered by both firm and time. Time andindustry fixed effects are included. Here a, b, and c indicate statistical significance at the 10%, 5%, and 1%levels, respectively
Li et al. Frontiers of Business Research in China (2019) 13:14 Page 17 of 33

firms have bad news, investors will be more cautious selling stock. The change in inves-
tors’ behavior will decrease negative cumulative abnormal returns and abnormal high
stock turnover ratios caused by stock fire sales, and finally reduce crash risk.
The signaling effect of ESOPs may also work because participation in an ESOP may
make employees more likely to release bad news. However, this hypothesis may be lim-
ited as employees also suffer from falling stock price caused by bad news. The motiv-
ation for employees to disclose firms’ bad news is unclear in an ESOP firm.
We attribute this to the lock-in period for ESOPs. ESOPs in China usually contain a
lock-in period at the time ESOP equities are offered to employees. The lock-in period
is usually 12 months, and can reach up to 18 months, 24 months, or even 36months in
some ESOPs. Shares offered to employees cannot be traded during the lock-in period.
During this time, employees are encouraged to disclose bad news about their firms for
two reasons. First, employees will not suffer actual losses due to falling share prices
within the lock-in period, as their shares cannot be traded. Share prices still have a
chance to recover from negative shocks before the end of the lock-in period and em-
ployees’ selling shares. Second, hoarded bad news may be disclosed after the lock-in
period if not done by employees first, which will cause a sharp fall in share price. This
will prevent employees from easily selling shares and employees may suffer larger
losses.
The motivation for employees releasing bad news may weaken when the lock-in
period ends. They may even help conceal bad news to maintain high share prices if
they plan to sell shares in the near future.
Based on this analysis, we divide our research samples into two groups according to
whether they were in or out of the lock-in period. We then test the influence of ESOPs
on crash risk in these two subsamples separately using regression Eq. (5).
We also test the difference of ESOPs’ effect on crash risk during and after the lock-in
period using the difference-in-difference (DID) method. The estimate regression
equation is:
CrashRiski;t ¼ α0 þ α1 � ESOPi;t−1 � Blocki;t þ α2 � ESOPi;t−1
þα3 � Blocki;t þ α4 � Control Variablest−1 þ εi;t ;ð7Þ
where Blocki,t is a dummy variable measure whether ESOP shares are still within the
lock-in period. It is valued 1 if ESOP shares are still within the lock-in period and 0
otherwise. Table 7 presents the results of the regressions.
Regression results in columns (1) and (2) show that an ESOP is negatively related to
crash risk, which indicates that employees are more likely to disclose bad news to avoid
the risk of stock price decline within a lock-in period. The significance of the negative
relationship between ESOP and crash risk is reduced (regression result 3), and even dis-
appears (regression result 4) after the lock-in period when employees no longer have
strong motivations to disclose a firm’s bad news if they are planning to or already have
sold their shares. The cross terms in columns (5) and (6) are negatively related to crash
risk, meaning that there are significant differences in the relationship between ESOPs
and crash risk around the end of the lock-in period.
In sum, regression results in Table 7 indicate that employees are more motivated
to disclose bad news to avoid future stock price crash risk when ESOP stocks are
still within a lock-in period, and this motivation decreases as the lock-in period
Li et al. Frontiers of Business Research in China (2019) 13:14 Page 18 of 33

ends. This may be another way for the signaling effect to work: ESOP adoption in-
dicates that employees are more motivated to disclose firms’ bad news. Investing in
these firms is less risky. This will also enhance investors’ confidence and reduce
crash risk.
However, the wide-spread implementation of ESOPs in China has only recently
started, and most ESOPs are still within their lock-in period. As time goes on, and
more and more ESOP shares are unlocked, employees’ motivation to disclose firms’
bad news will change, and the relationship between ESOPs and crash risk may also
change.
Additional analysis of the signaling effect
Previous research has found that firms adopting ESOPs generally are quite different,
and that the details of ESOPs are also varied, that is, ESOPs are heterogeneous. It is
therefore important to consider the heterogeneity of ESOPs in examining the relation-
ship between ESOPs and crash risk. Examining the effect of ESOP characteristics on
crash risk will also help further verify the signaling mechanism of ESOPs. Therefore, in
considering ESOP heterogeneity, we examine the different influences of specific charac-
teristics of ESOPs on stock price crash risk from three aspects: ESOP leverage, ESOP
scale, and ESOP price.
ESOP leverage and crash risk
One of the important characteristics of ESOPs is whether or not the funds used in the
ESOP come from leveraged financing and the proportion of leverage. Leverage in an
ESOP is related to tax avoidance (Chaplinsky and Niehaus 1990; Shackelford 1991) and
anti-takeover measures (Brecher et al. 1983) and influences firm value and share-
holders’ wealth (Chang 1990). From the perspective of the signaling effect, leveraged
funds often have the priority claim in leveraged ESOPs, while employees’ own funds
have a residual claim. As a well-known incentive system, ESOPs link employees’ inter-
ests to firm value. Employees will not only share in stock price gains but also risk stock
price losses. The risk of loss from falling share prices is often magnified by the priority
claim of leveraged funds, which will affect the decision of employees to participate in
the stock ownership plan and its signaling effect. In sum, we predict that leveraged
ESOPs send a stronger signal to capital markets and are more likely to decrease crash
risk, compared with non-leveraged ESOPs.
To verify these differences, we employ two variables to proxy ESOP leverage charac-
teristics: Whether the ESOP includes leveraged funds (Dum_Lev_ESOPi,t-1), and the
leverage ratio of the ESOP (Lev_ESOPi,t-1). Then we run the following equation to
further verify the influence of ESOPs on stock price crash risk.
CrashRiski;t ¼ α0 þ α1 � Dum lev ESOPi;t−1ðLev ESOPi;t−1Þ þ α2 � ESOPi;t−1
þα3 � Control Variablest−1 þ εi;t:
ð8Þ
Table 8 presents the effect of ESOP leverage on crash risk. Results show that the
negative impact of ESOPs on stock price crash risk still exists after considering the le-
verage factor, but compared with non-leveraged ESOPs, leveraged ESOPs do not reduce
Li et al. Frontiers of Business Research in China (2019) 13:14 Page 19 of 33

crash risk and sometimes even increase it, indicating a weaker effect of leveraged
ESOPs on reducing stock price crash risk.
However, the regression results in Table 8 conflict with the signaling mechanism to
some extent. The signaling effect supposes that the announcement of an ESOP
indicates positive signals about a firm’s value and reduces the influence of negative
news on stock price. If ESOPs do send positive signals, leveraged ESOPs, in which
Table 7 Lock-in period, ESOP and crash risk
Variable Lock-in period After lock-in DID test
NCSKEW (1) DUVOL (2) NCSKEW (3) DUVOL (4) NCSKEW (5) DUVOL (6)
Intercept 0.726b 0.837c 0.975 0.603 0.142 0.372
(2.01) (3.11) (0.57) (−0.50) (0.24) (0.85)
ESOPi,t-1 −0.033a − 0.039b
×Blocki,t (− 1.73) (− 2.16)
ESOPi,t-1 −0.036c − 0.046c − 0.043a − 0.288 − 0.463 −0.361
(−2.68) (− 2.92) (− 1.92) (− 1.54) (− 1.45) (− 1.54)
Blocki,t −0.003b −0.002a
(−2.01) (−1.76)
Dturni,t-1 0.001 0.005 0.108c 0.04 0.007 0.007
(0.06) (0.61) (2.70) (1.39) (0.72) (0.87)
Hreti,t-1 0.756c 0.556c 1.304c 0.824c 0.823c 0.592c
(12.97) (11.95) (3.81) (2.93) (10.65) (9.72)
Sigmai,t-1 −1.197 −0.1 −6.411 −1.808 −0.922 −0.77
(− 0.57) (− 0.06) (−0.74) (− 0.29) (− 0.34) (−0.38)
MBi,t-1 0.026c 0.016b 0.052 0.027 0.028c 0.017c
(3.08) (2.51) (1.38) (1.01) (3.34) (2.80)
Sizei,t-1 −0.031b −0.033c −0.037 − 0.032 −0.021 − 0.025
(−2.01) (−2.87) (−0.50) (− 0.60) (− 0.97) (−1.58)
Levi,t-1 0.103 0.026 0.387 0.246 0.058 −0.073
(1.28) (0.44) (1.04) (0.94) (0.53) (−0.92)
ROAi,t-1 −0.022c −0.026c − 0.067b −0.063c − 0.038c −0.035c
(−3.33) (−5.41) (−2.38) (−3.16) (−4.44) (−5.49)
DAi,t-1 −0.158 −0.111 − 0.679 −0.448 − 0.21 −0.123
(−1.45) (−1.37) (− 1.39) (− 1.30) (−1.42) (− 1.13)
NCSKEWi,t-1 0.095c 0.079 0.062c
(5.96) (1.28) (2.98)
DUVOLi,t-1 0.107c 0.111 0.09c
(6.27) (1.49) (4.00)
Fix_ind Yes Yes Yes Yes Yes Yes
Fix_time Yes Yes Yes Yes Yes Yes
Adj-R2 0.1495 0.1777 0.1292 0.11 0.1623 0.1875
No. of obs. 4517 4517 315 315 4832 4832
Notes. This table presents regression results of the relationship during and after an ESOP’s lock-inperiod. Results (1) to (4)are estimated by regression equation:CrashRiski, t = α0 + α1 × ESOPi, t − 1 + α2 × Control Variablest − 1 + εi, tResults (5) and (6) are estimated by regression equationCrashRiski;t ¼ α0 þ α1 � ESOPi;t−1 � Blocki;t þ α2 � ESOPi;t−1 þ α3 � Blocki;t−1 þ α4 � Control Variablest−1 þ εi;tThe t-statistics, reported in parentheses, are based on standard errors clustered by both firm and time. Time and industryfixed effects are included. Here a, b, and c indicate statistical significance at the 10%, 5%, and 1% levels, respectively
Li et al. Frontiers of Business Research in China (2019) 13:14 Page 20 of 33
participants take more risks, absolutely have stronger signaling effects and should be
more helpful in reducing crash risk.
Results in Table 8 do not deny the signal effect completely. The positive relationship
of ESOP leverage to crash risk maybe caused by specific signals from leveraged ESOPs
under particular market situations. In June 2015, 1 year after China’s ESOP system was
officially put into practice, the capital markets suffered huge fluctuations and the stock
prices of many leveraged ESOP firms fell below the warning line or even the liquidation
line. Employees involved in leveraged ESOPs did not make extra gains but suffered
losses because of compulsory liquidation pressure of leveraged ESOPs. As well, the fact
that share prices fell to the liquidation line sent additional negative signals to the mar-
ket: The ESOP would be forced to liquidate and trigger a continuous stock price crash.
With this in mind, investors accelerated the sale of shares and further exacerbated
stock price crash risk.1 Therefore, leveraged ESOPs in this situation do not help en-
hance market confidence, but exacerbate stock price volatility and heighten crash risk
from liquidation expectations.
To test the hypothesis above, combined with the huge fluctuations of the China A-
share markets in 2015, we first divide our sample period into three sub-samples accord-
ing to stock market index returns: pre-disaster (samples before June 2015), in-disaster
(samples from June 2015 to October 2015) and post-disaster (samples after October
2015). Then we run Eq. (8) on these three sub samples respectively. The regression re-
sults are presented in Table 9.
Table 9 shows that the positive relationship between ESOP leverage and crash risk is
not caused by the negative signaling effect of leveraged ESOPs but by a specific market
situation. Before June 2015, leveraged ESOPs did not result in increased crash risk (as
shown in regression results 1 to 4 in Table 8). However, starting from June 2015,
China’s stock markets suffered drastic fluctuations and stock prices fell rapidly over a
short period. It is possible that investors sold their stocks early to avoid losses caused
by compulsory liquidation, which eventually increased crash risk. In sum, the positive
relationship between ESOP leverage and crash risk is caused by stock dumping due to
forced liquidation rather than the signaling effect of leveraged ESOPs.
It should be noted that the sharp price fall in China A-shares came to an end in
October 2015 and then started to turn up. However, further analyses show that
the increasing effect of leveraged ESOPs on price crash risk still existed even
though the stock market started to recover. The reasons may be as follows: On the
one hand, investors still had no confidence in leveraged ESOPs due to their recent
experiences with the crash; on the other hand, a “deleveraging” policy had been in-
troduced and was being refined by Chinese government at the end of 2015. The
interpretations and expectations of the deleveraging policies and aversion to
leveraging may have contributed to investors’ pessimism about leveraged ESOPs.
Meanwhile, the regression results 1 to 4 in Table 9 show that leveraged ESOPs neither
increased nor decreased crash risk before June 2015. We suppose this is due to the
1In reality, mandatory liquidation of ESOPs rarely occurs even if the share price falls below the liquidationline due to the voluntary suspension of the company and opposition from financial institutions. However,leveraged ESOPs are new to the Chinese capital markets. The expectations that ESOPs will be forced toliquidate when the stock price falls below the liquidation line are reasonable according to established rules.
Li et al. Frontiers of Business Research in China (2019) 13:14 Page 21 of 33

market’s limited recognition of ESOPs as they were still new at that time. We may need
longer to reach a better understanding of leveraged ESOPs and their signaling effect, espe-
cially in China’s capital markets where individuals account for the majority of investors.
On the other hand, unlike firms’ other decisions, ESOPs cannot be compared horizontally
between different firms. As employees are subordinate to particular companies, they can-
not directly decide the leverage ratio of an ESOP or choose among different stock owner-
ship plans. Therefore, participation in a firm’s ESOP can only indicate that the firm is
“good,” but participation in a leveraged ESOPs does not mean the firm is “better.” This
may also explain why leveraged ESOPs cannot further reduce crash risk.
Table 8 Leveraged ESOPs and crash risk
Variable NCSKEW (1) NCSKEW (2) DUVOL (3) DUVOL (4)
Dum_Lev_ESOPi,t-1 0.078c 0.028b
(2.76) (2.31)
Lev_ESOPi,t-1 0.018b 0.008a
(2.18) (1.95)
ESOPi,t-1 − 0.061b − 0.039a − 0.05c − 0.044c
(− 2.52) (− 1.82) (− 2.80) (− 2.76)
Dturni,t-1 0.008 0.008 0.007 0.007
(1.03) (1.04) (1.27) (1.28)
Hreti,t-1 0.704c 0.703c 0.515c 0.514c
(11.82) (11.79) (10.89) (10.87)
Sigmai,t-1 −2.824 −2.769 −1.034 −1.015
(− 1.35) (− 1.32) (− 0.66) (− 0.65)
MBi,t-1 0.016c 0.016c 0.009c 0.009c
(3.74) (3.71) (2.87) (2.85)
Sizei,t-1 −0.009 −0.011 −0.021a − 0.022a
(− 0.58) (− 0.67) (−1.79) (−1.84)
Levi,t-1 0.113 0.12 0.036 0.039
(1.45) (1.54) (0.63) (0.67)
ROAi,t-1 −0.029c −0.029c −0.031c − 0.031c
(−4.6) (−4.61) (−6.57) (−6.57)
DAi,t-1 −0.134 −0.136 − 0.106 −0.106
(−1.26) (−1.28) (−1.34) (− 1.35)
NCSKEWi,t-1 0.107c 0.108c
(6.81) (6.83)
DUVOLi,t-1 0.119c 0.118c
(7.00) (6.99)
Intercept 0.273 0.311 0.569b 0.582b
(0.72) (0.82) (2.02) (2.06)
Fix_ind Yes Yes Yes Yes
Fix_time Yes Yes Yes Yes
Adj-R2 0.1564 0.1559 0.1802 0.1802
No. of obs. 4832 4832 4832 4832
Notes. This table presents the influence of ESOP leverage on stock price crash risk. The empirical test equation is:CrashRiski;t ¼ α0 þ α1 � Dum lev ESOPi;t−1ðLev ESOPi;t−1Þ þ α2 � ESOPi;t−1 þ α3 � Control Variablest−1 þ εi;tThe t-statistics, reported in parentheses, are based on standard errors clustered by both firm and time. Time and industryfixed effects are included. Here a, b, and c indicate statistical significance at the 10%, 5%, and 1% levels, respectively
Li et al. Frontiers of Business Research in China (2019) 13:14 Page 22 of 33

Table
9Marketsituation,leverage
dESOPs
andcrashrisk
Variable
Pre-disaster
In-disaster
Post-disaster
NCSKEW
(1)
NCSKEW
(2)
DUVO
L(3)
DUVO
L(4)
NCSKEW
(5)
NCSKEW
(6)
DUVO
L(7)
DUVO
L(8)
NCSKEW
(9)
NCSKEW
(10)
DUVO
L(11)
DUVO
L(12)
Dum
_Lev_ESO
P i,t-1
0.087
0.019
0.015b
0.011a
0.08
b0.03
a
(0.89)
(0.23)
(2.21)
(1.72)
(2.44)
(1.73)
Lev_ESOP i,t-1
−0.003
0.005
−0.004
−0.011
0.026b
0.014a
(−0.13)
(0.27)
(−0.19)
(−0.78)
(2.57)
(1.83)
ESOP i,t-1
−0.217c
−0.188c
−0.16
b−0.156c
0.015
0.024
−0.004
0−0.053a
−0.035b
−0.042b
−0.039b
(−2.84)
(−2.64)
(−2.47)
(−2.62)
(0.25)
(0.46)
(−0.09)
(−0.01)
(−1.89)
(−2.41)
(−2.05)
(−2.12)
Dturn
i,t-1
−0.049a
−0.049a
−0.023
−0.022
−0.047c
−0.047c
−0.03
c−0.03
c0.014
0.014
0.01
0.01
(−1.94)
(−1.95)
(−1.07)
(−1.05)
(−3.04)
(−3.07)
(−2.59)
(−2.61)
(1.51)
(1.52)
(1.53)
(1.53)
Hret i,t-1
0.622c
0.63
c0.48
c0.48
c0.866c
0.865c
0.667c
0.667c
1.093c
1.094c
0.859c
0.86
c
(7.21)
(7.29)
(6.25)
(6.27)
(5.88)
(5.88)
(5.69)
(5.69)
(11.43)
(11.43)
(10.95)
(10.96)
Sigm
a i,t-1
−18.779
c−18.734
c−12.917
b−12.897
b10.535
b10.646
b10.024
c10.086
c−2.894
−2.792
−1.116
−1.061
(−2.92)
(−2.91)
(−2.36)
(−2.36)
(2.28)
(2.31)
(2.86)
(2.89)
(−1.15)
(−1.11)
(−0.60)
(−0.58)
MB i,t-1
0.018
0.018
0.013
0.013
0.018b
0.018b
0.011a
0.011a
0.012b
0.012b
0.007a
0.007a
(1.42)
(1.43)
(1.23)
(1.22)
(2.23)
(2.24)
(1.84)
(1.86)
(2.37)
(2.33)
(1.76)
(1.73)
Size
i,t-1
0.045
0.048
0.052
0.052
0.06
0.06
0.077b
0.077b
−0.04
b−0.042b
−0.054c
−0.055c
(0.87)
(0.92)
(1.18)
(1.19)
(1.44)
(1.44)
(2.42)
(2.43)
(−2.15)
(−2.26)
(−3.95)
(−4.01)
Lev i,t-1
0.223
0.207
0.029
0.028
0.096
0.097
0.043
0.043
0.099
0.109
0.032
0.035
(0.92)
(0.86)
(0.14)
(0.14)
(0.52)
(0.52)
(0.31)
(0.31)
(1.08)
(1.20)
(0.47)
(0.52)
ROA i,t-1
−0.028
−0.031
−0.024
−0.024
−0.024
−0.024a
−0.024b
−0.024b
−0.031c
−0.031c
−0.034c
−0.034c
(−1.30)
(−1.45)
(−1.33)
(−1.34)
(−1.65)
(−1.66)
(−2.19)
(−2.17)
(−4.12)
(−4.08)
(−6.18)
(−6.16)
DA i,t-1
−0.082
−0.086
0.044
0.044
−0.185
−0.183
−0.305a
−0.296a
−0.19
−0.189
−0.111
−0.11
(−0.22)
(−0.23)
(0.14)
(0.14)
(−0.79)
(−0.78)
(−1.73)
(−1.67)
(−1.52)
(−1.52)
(−1.22)
(−1.21)
NCSKEW
i,t-1
0.184b
0.195b
0.215c
0.215c
0.108c
0.109c
Li et al. Frontiers of Business Research in China (2019) 13:14 Page 23 of 33

Table
9Marketsituation,leverage
dESOPs
andcrashrisk(Con
tinued)
Variable
Pre-disaster
In-disaster
Post-disaster
NCSKEW
(1)
NCSKEW
(2)
DUVO
L(3)
DUVO
L(4)
NCSKEW
(5)
NCSKEW
(6)
DUVO
L(7)
DUVO
L(8)
NCSKEW
(9)
NCSKEW
(10)
DUVO
L(11)
DUVO
L(12)
(2.22)
(2.37)
(5.17)
(5.17)
(5.97)
(6.00)
DUVO
L i,t-1
0.056
0.057
0.252c
0.253c
0.141c
0.141c
(0.72)
(0.73)
(6.04)
(6.07)
(6.82)
(6.84)
Intercept
−1.052
−1.061
−1.476
−1.479
−2.253b
−2.257b
−2.487c
−2.494c
0.961b
1.006b
1.34
c1.354c
(−0.84)
(−0.85)
(−1.40)
(−1.41)
(−2.20)
(−2.21)
(−3.21)
(−3.22)
(2.16)
(2.26)
(4.12)
(4.17)
Fix_ind
Yes
Yes
Yes
Yes
Yes
Yes
Yes
Yes
Yes
Yes
Yes
Yes
Fix_tim
eYes
Yes
Yes
Yes
––
–Yes
Yes
Yes
Yes
Adj-R
20.2236
0.2215
0.201
0.2013
0.0949
0.0949
0.1112
0.1121
0.1377
0.1378
0.1453
0.1457
No.of
obs.
354
354
354
354
662
662
662
662
3816
3816
3816
3816
Notes.T
histablepresen
tstheinflu
ence
ofESOPleverage
onstockpricecrashriskov
erthreesubsamples:p
re-disaster(sam
ples
before
June
2015
),in-disaster(sam
ples
from
June
2015
toOctob
er20
15)an
dpo
st-
disaster
(sam
ples
afterOctob
er20
15).Th
eem
pirical
test
equa
tionis:
CrashRisk
i;t¼
α 0þα 1
�Dum
levESOP i;t−1ðLe
vESOP i;t−1Þþ
α 2�ESOP i;t−1þα 3
�Con
trol
Variables
t−1þε i;
t
Thet-statistics,repo
rted
inpa
renthe
ses,areba
sedon
stan
dard
errors
clusteredby
both
firm
andtim
e.Timean
dindu
stry
fixed
effectsareinclud
ed.H
ere
a ,b,and
cindicate
statistical
sign
ificanceat
the10
%,5
%,and
1%levels,respe
ctively
Li et al. Frontiers of Business Research in China (2019) 13:14 Page 24 of 33

ESOP scale and crash risk
Another important characteristic of ESOPs is the stock ownership size. In terms of sig-
naling effects, larger-sized ESOPs require employees to pay more money or assume
higher risks through leveraged financing, thus sending a more convincing signal to the
market that insiders are optimistic about a firm’s value.
To examine the influence of ESOP size on crash risk, we employ two variables: the
natural logarithm of total funds (both employees’ own money and funds from leveraged
financing are included) invested in an ESOP (Size_ESOP) and the proportion of em-
ployee stock ownership to total share capital (Stock_ESOP). Then we examine the influ-
ence of ESOP scale on crash risk using the following equation.
CrashRiski;t ¼ α0 þ α1 � Size ESOPi;t−1ðStock ESOPi;t−1Þ þ α2 � ESOPi;t−1
þα3 � Control Variablest−1 þ εi;t :ð9Þ
The regression results in Table 10 first show that larger-sized ESOPs generally con-
tribute more to the reduction of stock price crash risk. Meanwhile, comparing the re-
gression results of Size_ESOPi,t-1 and Stock_ESOPi,t-1, we can conclude that investors
consider the relative size of ESOPs (Stock_ESOPi,t-1) more important than the absolute
capital size (Size_ESOPi,t-1). This is reasonable as the capital size of an ESOP is often re-
lated to the firm’s size. For large firms, there are more employees and every 1 % share
corresponds to more stocks and more money to purchase them. Thus, the capital size
of the ESOP does not send any additional signals of insiders’ opinions.
ESOP price and crash risk
Stock price is also an important characteristic of ESOPs. First of all, stock price consti-
tutes the cost of employee participation in an ESOP and directly determines future
returns. Moreover, stock price reflects, to some extent, insiders’ estimation of firm
value, which is also important in signal sending. Therefore, the ESOP stock price may
influence crash risk.
To examine the influence of ESOP price on crash risk, we use two variables to
measure ESOP price: the estimated share price disclosed in the firm’s “ESOP draft”
(Price_ESOPi,t-1), and the ratio of Price_ESOPi,t-1 to the closing price on the ESOP
announcement day (R_Price_ESOPi,t-1).
Then we run the following equation and report our findings in Table 11.
CrashRiski;t ¼ α0 þ α1 � Price ESOPi;t−1ðR price ESOPi;t−1Þ þ α2 � ESOPi;t−1
þα3 � Control Variablest−1 þ εi;t :ð10Þ
The regression results in Table 11 show that when measured by the absolute price
(Price_ESOPi,t-1), the regression coefficients of the share price are significant and posi-
tive. The higher the share price, the higher the firm’s crash risk. The regression coeffi-
cient between relative ESOP price (R_Price_ESOPi,t-1) and crash risk is not significant.
Results in Table 11 are also inconsistent with the signaling effects. If ESOPs
reduce crash risk by sending positive signals to capital markets, a higher share
price would seem to suggest stronger insider confidence, reducing crash risk rather
than increasing it.
Li et al. Frontiers of Business Research in China (2019) 13:14 Page 25 of 33

We attribute these contradictory results to the particular market situation during the
2015 crash. As before, we divide our sample period into three sub-samples and run Eq.
(10) respectively. We find similar results to 5.3.1. We do not present this table in the
paper to focus on our main findings.
Other tests
Tests on the signaling effect of ESOPs show that employees participating in ESOPs are
more motivated to disclose firms’ bad news. Does this affect executives’ behavior and
Table 10 ESOP scale and crash risk
Variable NCSKEW (1) NCSKEW (2) DUVOL (3) DUVOL (4)
Size_ESOPi,t-1 − 0.003 − 0.004
(−0.38) (−0.62)
Stock_ESOPi,t-1 −0.003c −0.006
(−2.37) (−4.03)
ESOPi,t-1 −0.054c −0.031c − 0.004b −0.038c
(−2.71) (−4.24) (−2.08) (− 3.03)
Dturni,t-1 0.008 0.008 0.007 0.007
(1.02) (1.03) (1.27) (1.27)
Hreti,t-1 0.705c 0.705c 0.515c 0.515c
(11.82) (11.81) (10.91) (10.89)
Sigmai,t-1 −2.79 −2.779 −1.02 − 1.022
(−1.33) (− 1.33) (−0.65) (−0.66)
MBi,t-1 0.016c 0.016c 0.009c 0.009c
(3.73) (3.76) (2.89) (2.87)
Sizei,t-1 −0.012 −0.011 −0.021a − 0.022a
(−0.73) (− 0.67) (−1.73) (−1.84)
Levi,t-1 0.121 0.121 0.04 0.039
(1.55) (1.56) (0.70) (0.68)
ROAi,t-1 −0.03c −0.03c −0.031c − 0.031c
(−4.65) (−4.62) (−6.55) (−6.59)
DAi,t-1 −0.135 −0.135 − 0.106 −0.106
(−1.27) (−1.28) (−1.34) (− 1.35)
NCSKEWi,t-1 0.108c 0.108c
(6.88) (6.88)
DUVOLi,t-1 0.119c 0.119c
(7.02) (7.01)
Intercept 0.342 0.317 0.561b 0.586b
(0.89) (0.84) (1.97) (2.08)
Fix_ind Yes Yes Yes Yes
Fix_time Yes Yes Yes Yes
Adj-R2 0.1551 0.1551 0.1799 0.1799
No. of obs. 4832 4832 4832 4832
Notes. This table presents the influence of ESOP scale on stock price crash risk. The empirical test equation is:CrashRiski;t ¼ α0 þ α1 � Size ESOPi;t−1ðStock ESOPi;t−1Þ þ α2 � ESOPi;t−1 þ α3 � Control Variablest−1 þ εi;tThe t-statistics, reported in parentheses, are based on standard errors clustered by both firm and time. Time and industryfixed effects are included. Here a, b, and c indicate statistical significance at the 10%, 5%, and 1% levels, respectively
Li et al. Frontiers of Business Research in China (2019) 13:14 Page 26 of 33

thus play an internal supervisory role? This issue is also worth testing. ESOPs link em-
ployee benefits with firm value (Hall and Murphy 2000, 2002, 2003; Huddart and Lang
1996; Jensen and Murphy 1990; Kim and Ouimet 2011). Employees of firms with
ESOPs are more likely to pay attention to stock price and its influencing factors which
include executive behavior. Employees are likely to be more motivated to supervise ex-
ecutives and express their opinions about executives’ misconduct, which produces add-
itional pressure on executives to work within ethical and legal bounds, thus reducing
both the possibility of the concealment of bad news and the level of crash risk.
Table 11 ESOP price and crash risk
Variable NCSKEW (1) NCSKEW (2) DUVOL (3) DUVOL (4)
Price_ESOPi,t-1 0.002a 0.001
(1.70) (1.17)
R_Price_ESOPi,t-1 − 0.039 −0.033
(−1.34) (−1.52)
ESOPi,t-1 −0.057b −0.011c − 0.054c −0.015c
(−2.06) (−3.05) (− 2.63) (−5.70)
Dturni,t-1 0.008 0.007 0.007 0.007
(1.03) (0.99) (1.27) (1.22)
Hreti,t-1 0.705c 0.709c 0.514c 0.518c
(11.82) (11.88) (10.88) (10.96)
Sigmai,t-1 −2.931 −2.697 −1.103 −0.942
(−1.40) (− 1.29) (− 0.71) (− 0.60)
MBi,t-1 0.015c 0.016c 0.009c 0.009c
(3.63) (3.73) (2.79) (2.86)
Sizei,t-1 −0.009 −0.012 −0.021a − 0.023a
(−0.54) (− 0.72) (−1.75) (−1.89)
Levi,t-1 0.113 0.121 0.035 0.039
(1.45) (1.56) (0.61) (0.68)
ROAi,t-1 −0.031c −0.029c −0.032c − 0.031c
(−4.83) (−4.61) (−6.69) (−6.56)
DAi,t-1 −0.131 −0.133 − 0.104 −0.104
(−1.23) (−1.25) (−1.32) (− 1.33)
NCSKEWi,t-1 0.107c 0.109c
(6.75) (6.90)
DUVOLi,t-1 0.117c 0.119c
(6.92) (7.04)
Intercept 0.282 0.333 0.567b 0.596b
(0.74) (0.88) (2.01) (2.11)
Fix_ind Yes Yes Yes Yes
Fix_time Yes Yes Yes Yes
Adj-R2 0.1556 0.1554 0.1801 0.1803
No. of obs. 4832 4832 4832 4832
Notes. This table presents the influence of ESOP price on stock price crash risk. The empirical test equation is:CrashRiski;t ¼ α0 þ α1 � Price ESOPi;t−1ðR Price ESOPi;t−1Þ þ α2 � ESOPi;t−1
þα3 � Control Variablest−1 þ εi;tThe t-statistics, reported in parentheses, are based on standard errors clustered by both firm and time. Time and industryfixed effects are included. Here a, b, and c indicate statistical significance at the 10%, 5%, and 1% levels, respectively
Li et al. Frontiers of Business Research in China (2019) 13:14 Page 27 of 33

It is more difficult to conceal bad news when a firm has good corporate governance
and effectively supervises executive power. Crash risk will be lower and additional over-
sight of executives will play less of a role in reducing crash risk in this case. Conversely,
executives may easily conceal bad news and a firm’s crash risk is high under poor gov-
ernance, without mechanisms for checks and balances of executive power. Oversight of
executives is more effective in preventing information manipulation and reducing crash
risk. Therefore, from the perspective of internal supervision, we predict that the influ-
ence of ESOPs on crash risk will be more pronounced for firms with poor corporate
governance and unrestricted executive power.
To examine the ESOP internal supervision effect on crash risk, we design the follow-
ing empirical model:
CrashRiski;t ¼ α0 þ α1 � ESOPi;t−1 �Monitori;t−1 þ α2 � ESOPi;t−1
þα3 �Monitori;t−1 þ α4 � Control Variablest−1 þ εi;t;ð11Þ
where Monitori,t-1 is the level of other types of supervision imposed on executives. We
employ three proxy variables to depict a firm’s existing oversight, which includes the
proportion of independent directors on the board of directors (Independent), a dummy
variable of whether the firm is audited by the Big Four (Big4) and executive sharehold-
ing ratio (ExcHold).These represent the firm’s internal corporate governance, external
audit supervision and executive power respectively.
However, all these regression results show that there is no significant interaction between
ESOPs and firms’ level of oversight, which indicates that the impact of ESOPs on crash risk
does not vary with changes in firms’ formal supervision of executives. To control for the
length of this paper and focus on our main findings, we do not report these results.
Robustness tests
The effectiveness of PSM
Since most of our empirical tests are based on PSM matched samples, if the matching
itself is invalid, the conclusion of this paper would also be invalid. To test the effective-
ness of our PSM method, we first run Logit regressions and t-tests on the full sample
and matched sample (not presented).
Regression results show that firm size (Sizei,t-1) is positively related to the adoption of
an ESOP at the 1% level, and the shareholding ratio of the largest shareholder (Fitsti,t-1)
is negatively related, which means that an ESOP is influenced by these firm characteris-
tics. The relationship between firm characteristics and the adoption of an ESOP is no
longer significant after PSM. T-test results also show that there is no significant differ-
ence on firm size, return on assets, shareholding ratio of the largest shareholder, and le-
verage ratio between ESOP firms and paired ones. These empirical results indicate that
our PSM approach controls the differences in characteristics between two types of
firms and effectively eliminates the self-selection problem of ESOP adoption.
Endogenous test using the difference-in-difference model
The decision to adopt an ESOP is made in light of various factors, including a firm’s
characteristics and the previous level of crash risk. Though we use a PSM approach to
control variables affecting crash risk following previous studies, endogeneity due to
omitted variables may still be a problem. The relationship between ESOPs and price
Li et al. Frontiers of Business Research in China (2019) 13:14 Page 28 of 33

crash risk may be caused by factors not considered in this paper which affect ESOP
adoption and crash risk simultaneously.
To further eliminate the endogeneity problems, we add a new variable After in the
newly built panel data. The variable After is valued according to the observation date
and the ESOP announcement date in ESOP firms. If the observation date is later than
its ESOP announcement date, the variable After equals to 1, and 0 otherwise. We ex-
tend the sample period to 2013 to capture firm characteristics before the ESOP an-
nouncement. The ESOP announcement date for matched firms is the same as the
ESOP firms they are matched with. Then we re-examine the influence of ESOPs on
stock price crash risk using the DID model as follows:
CrashRiski;t ¼ α0 þ α1 � ESOPi;t−1 � Af ter þ α2 � ESOPi;t−1 þ α3 � Af ter
þα4 � Control Variablest−1 þ εi;t :ð12Þ
Table 12 shows that the regression coefficients of ESOPi,t-1 × Afteri,t are significantly
negative at the 1% level, indicating that the crash risk of firms adopting ESOP drops re-
markably after the announcement of an ESOP compared with the control group. This
finding is consistent with our conclusion and our main results in Table 4 are robust.
ESOPs versus executive equity incentives
Kim et al. (2011b) suggest that executive equity incentives will influence stock price
crash risk. In particular, they find that CFO stock option incentives significantly in-
crease future crash risk. As mentioned above, ESOPs are similar to executive equity in-
centives to some extent, and ESOPs in China do not exclude executive involvement,
which may also contribute to the relationship between ESOPs and crash risk. To con-
trol for the influence of executive equity incentives on crash risk, we add executive
equity incentives into the control variables and redo the regression analysis in Table 4.
After these tests, our main conclusions are still robust.
The justification of ESOP announcements
We take the date in which an ESOP draft is disclosed as the ESOP announcement day;
however disclosure of the ESOP draft does not mean complete adoption of an ESOP. It
needs approval from the subsequent shareholders’ meeting. Therefore, we collect data
on shareholders’ meetings and check whether the ESOP draft is voted on and adopted
at the meeting to confirm the ESOP date. We then replace the ESOP announcement
date with this one and re-estimate all the regressions above. After these tests, our main
conclusions are still robust.
Excluding free ESOPs
Shareholding in partial ESOPs are offered by substantial shareholders for free in China.
We measure the size and price of these ESOPs as 0 in previous tests, which is not en-
tirely accurate and may in fact influence our conclusions. Therefore, we eliminate “free
ESOP participation” in the robustness tests, and run all regressions above again. Our
main findings remain the same.
Li et al. Frontiers of Business Research in China (2019) 13:14 Page 29 of 33
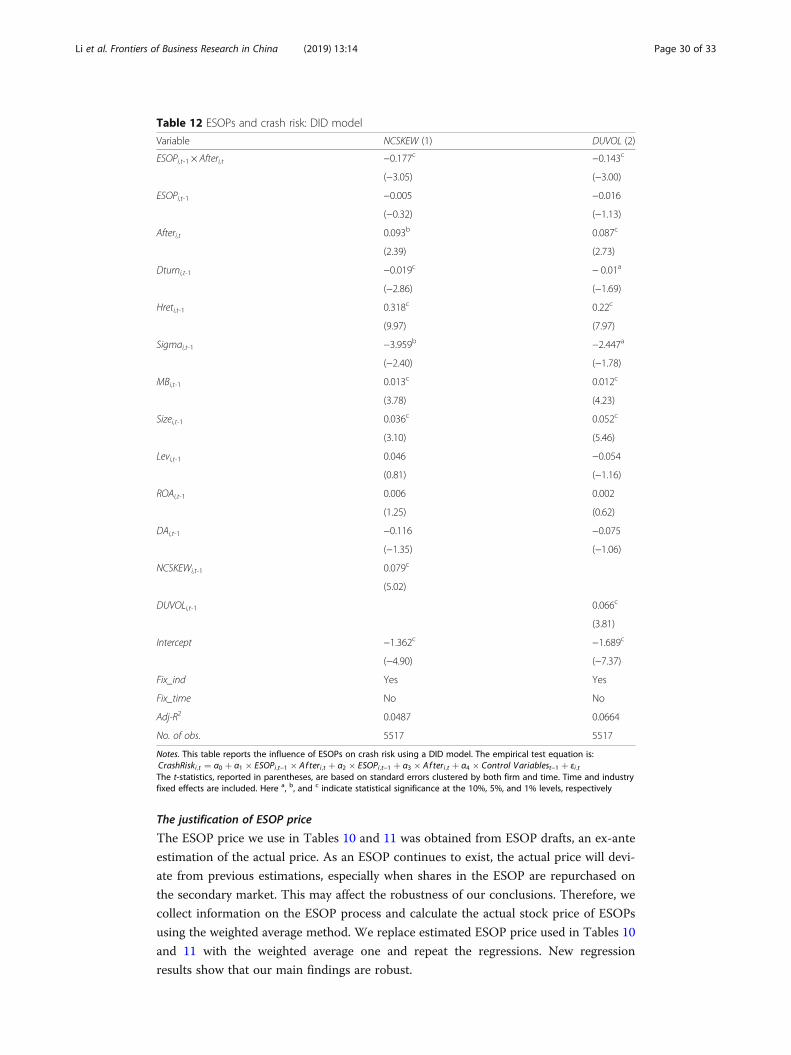
The justification of ESOP price
The ESOP price we use in Tables 10 and 11 was obtained from ESOP drafts, an ex-ante
estimation of the actual price. As an ESOP continues to exist, the actual price will devi-
ate from previous estimations, especially when shares in the ESOP are repurchased on
the secondary market. This may affect the robustness of our conclusions. Therefore, we
collect information on the ESOP process and calculate the actual stock price of ESOPs
using the weighted average method. We replace estimated ESOP price used in Tables 10
and 11 with the weighted average one and repeat the regressions. New regression
results show that our main findings are robust.
Table 12 ESOPs and crash risk: DID model
Variable NCSKEW (1) DUVOL (2)
ESOPi,t-1 × Afteri,t −0.177c −0.143c
(−3.05) (−3.00)
ESOPi,t-1 −0.005 −0.016
(−0.32) (−1.13)
Afteri,t 0.093b 0.087c
(2.39) (2.73)
Dturni,t-1 −0.019c − 0.01a
(−2.86) (−1.69)
Hreti,t-1 0.318c 0.22c
(9.97) (7.97)
Sigmai,t-1 −3.959b −2.447a
(−2.40) (−1.78)
MBi,t-1 0.013c 0.012c
(3.78) (4.23)
Sizei,t-1 0.036c 0.052c
(3.10) (5.46)
Levi,t-1 0.046 −0.054
(0.81) (−1.16)
ROAi,t-1 0.006 0.002
(1.25) (0.62)
DAi,t-1 −0.116 −0.075
(−1.35) (−1.06)
NCSKEWi,t-1 0.079c
(5.02)
DUVOLi,t-1 0.066c
(3.81)
Intercept −1.362c −1.689c
(−4.90) (−7.37)
Fix_ind Yes Yes
Fix_time No No
Adj-R2 0.0487 0.0664
No. of obs. 5517 5517
Notes. This table reports the influence of ESOPs on crash risk using a DID model. The empirical test equation is:CrashRiski;t ¼ α0 þ α1 � ESOPi;t−1 � Af teri;t þ α2 � ESOPi;t−1 þ α3 � Af teri;t þ α4 � Control Variablest−1 þ εi;tThe t-statistics, reported in parentheses, are based on standard errors clustered by both firm and time. Time and industryfixed effects are included. Here a, b, and c indicate statistical significance at the 10%, 5%, and 1% levels, respectively
Li et al. Frontiers of Business Research in China (2019) 13:14 Page 30 of 33
ConclusionAs an important initiative to comprehensively deepen reform and promote the
healthy development of China’s capital markets, ESOPs have received extensive at-
tention from the government, listed firms and investors since they were first pro-
posed. It is worthwhile to examine the influence of ESOPs on capital markets in
the fields of both theory and practice. To better understand the impact of ESOPs
in China, we conduct empirical tests using listed firms’ announced ESOPs in A-
share markets during the time period 2014 to 2017 and their matched samples
using a PSM approach.
The findings show that the adoption of ESOPs can reduce future crash risk mainly
through signaling effects: ESOPs convey positive signals to capital markets that insiders
are optimistic about firms’ future value, which helps enhance investors’ confidence, re-
duce the negative influence of bad information on stock price, and thus reduce stock
price crash risk. Finally, we find that ESOP heterogeneity is of great importance to the
influence of ESOPs on stock price crash risk. Larger scale, lower-priced, and non-lever-
aged ESOPs are more likely to reduce abnormal stock price fluctuations and decrease
crash risk, while higher-priced and leveraged ESOPs only have a limited effect on crash
risk reduction and sometimes may even raise the risk.
Abbreviations“Opinions”: Guiding Opinions on the Pilot Program for the Implementation of the Employee Share Ownership Plans byListed Companies; CSRC: China Securities Regulatory Commission; ESOP: Employee Stock Ownership Plan; SOE: State-Owned Enterprise
AcknowledgementsWe appreciate the helpful comments and suggestions from reviewers and editors. This project is supported byCollaborative Innovation Center for State-Owned Assets Administration of Beijing Technology and Business University(CICSOAA). We thank Qingbin Meng, Xue Wang, and workshop participants at Renmin University of China, for theirmany excellent comments on earlier versions of our paper.
Authors’ contributionsYL is a senior professor of Finance Department, Renmin University of China, she is also the doctoral supervisor of BS.As the first author, YL proposed the original research question, pointed out feasible research directions, and providedresources for field interviews. She also provided valuable modify advices and did much effort in the process of revisionon earlier versions of the paper. BS is a doctoral candidate in Renmin University of China. He reviewed the existingliterature and conducted most of the field interviews in the research, which makes the research topic to more specificdetail. He also made some contributions in collecting research data manually. SY is an assistant professor of BeijingTechnology and Business University. He did most of the empirical analysis and interpreted the results. He alsocollected part of the research data manually and did some literature review work. All authors read and approved thefinal manuscript.
FundingNational Natural Science Foundation of China (No. 71272150, and No. 71602005),Key Projects of the National Social Science Research Fund of China (No. 15AZD012),Humanities and Social Sciences Fund of the Ministry of Education (No. 15YJC630164).
Availability of data and materialsThe datasets generated and analyzed during the current study are available in the CSMAR (http://cn.gtadata.com/) andWIND (http://www.wind.com.cn/) repository, which are two of the most publicly used and widely accepted databasein financial and economic research. Partial characteristic data of ESOPs, such as ESOP size, price, and leverage ratio, arecollected manually from provisional announcements of listed companies. They are available from the correspondingauthor on reasonable request.
Competing interestsThe authors declare that they have no competing interests.
Author details1Business School, Renmin University of China, Beijing 100872, China. 2Business School, Beijing Technology and BusinessUniversity, Beijing 100048, China.
Li et al. Frontiers of Business Research in China (2019) 13:14 Page 31 of 33

Received: 27 September 2018 Accepted: 8 July 2019
ReferencesAgrawal, A., & Mandelker, G. N. (1987). Managerial incentives and corporate investment and financing decisions. The Journal
of Finance, 42(4), 823–837.Ahrens, C. (2018). The effect of stock based incentives on individual manager performance. In Academy of management
proceedings (2018, 1, 16304). Briarcliff Manor: Academy of Management.Akerlof, G. A. (1982). Labor contracts as partial gift exchange. The Quarterly Journal of Economics, 97(4), 543–569.Banerjee, A., Lampel, J., Bhalla, A. (2017). Employee ownership schemes as resilience signals during economic crisis and
recovery. In Academy of management proceedings (2017, 1, 15243). Briarcliff Manor: Academy of Management.Beatty, A. (1994). An empirical analysis of the corporate control, tax and incentive motivations for adopting leveraged
employee stock ownership plans. Managerial and Decision Economics, 15(4), 299–315.Beatty, A. (1995). The cash flow and informational effects of employee stock ownership plans. Journal of Financial Economics,
38(2), 211–240.Brecher, A. G., Lazarus, S., III, & Gray, W. A. (1983). The function of employee retirement plans as an impediment to takeovers.
The Business Lawyer, 38(2), 503–513.Brown, S., Fakhfakh, F., & Sessions, J. G. (1999). Absenteeism and employee sharing: An empirical analysis based on French
panel data, 1981–1991. ILR Review, 52(2), 234–251.Buchko, A. A. (1992). Effects of employee ownership on employee attitudes: A test of three theoretical perspectives. Work and
Occupations, 19(1), 59–78.Chang, S. (1990). Employee stock ownership plans and shareholder wealth: An empirical investigation. Financial Management,
19(1), 48–58.Chang, S., & Mayers, D. (1992). Managerial vote ownership and shareholder wealth: Evidence from employee stock ownership
plans. Journal of Financial Economics, 32(1), 103–131.Chaplinsky, S., & Niehaus, G. (1990). The tax and distributional effects of leveraged ESOPs. Financial Management, 19(1), 29–38.Chaplinsky, S., & Niehaus, G. (1994). The role of ESOPs in takeover contests. The Journal of Finance, 49(4), 1451–1470.Chen, J., Hong, H., & Stein, J. C. (2001). Forecasting crashes: Trading volume, past returns, and conditional skewness in stock prices.
Journal of Financial Economics, 61(3), 345–381.Chu, J., & Fang, J. X. (2016). Margin-trading, short-selling and the deterioration of crash risk. Economic Research Journal, (5), 143–158.Cohen, R. B., Hall, B. J., & Viceira, L. M. (2000). Do executive stock options encourage risk-taking.Comment, R., & Jarrell, G. A. (1987). Two-tier and negotiated tender offers: The imprisonment of the free-riding shareholder.
Journal of Financial Economics, 19(2), 283–310.Conte, M., & Tannenbaum, A. S. (1978). Employee-owned companies: Is the difference measurable. Monthly Labor Review,
101(7), 23–28.Conte, M. A., Blasi, J., Kruse, D., & Jampani, R. (1996). Financial returns of public ESOP companies: Investor effects vs. manager
effects. Financial Analysts Journal, 52(4), 51–61.Core, J. E., & Guay, W. R. (2001). Stock option plans for non-executive employees. Journal of Financial Economics, 61(2), 253–287.De Fusco, R. A., Johnson, R. R., & Zorn, T. S. (1990). The effect of executive stock option plans on stockholders and
bondholders. The Journal of Finance, 45(2), 617–627.Ding, D. K., & Sun, Q. (2001). Causes and effects of employee stock option plans: Evidence from Singapore. Pacific-Basin
Finance Journal, 9(5), 563–599.Dyck, A., Morse, A., & Zingales, L. (2010). Who blows the whistle on corporate fraud? The Journal of Finance, 65(6), 2213–2253.Fang, H., Nofsinger, J. R., & Quan, J. (2015). The effects of employee stock option plans on operating performance in Chinese
firms. Journal of Banking & Finance, 54, 141–159.Goldstein, I., & Guembel, A. (2008). Manipulation and the allocational role of prices. The Review of Economic Studies, 75(1), 133–164.Gordon, L. A., & Pound, J. (1990). ESOPs and corporate control. Journal of Financial Economics, 27(2), 525–555.Hall, B. J., & Murphy, K. J. (2000). Optimal exercise prices for executive stock options. American Economic Review, 90(2),
209–214.Hall, B. J., & Murphy, K. J. (2002). Stock options for undiversified executives. Journal of Accounting and Economics, 33(1), 3–42.Hall, B. J., & Murphy, K. J. (2003). The trouble with stock options. Journal of Economic Perspectives, 17(3), 49–70.Hammer, T. H., Landau, J. C., & Stern, R. N. (1981). Absenteeism when workers have a voice: The case of employee ownership.
Journal of Applied Psychology, 66(5), 561.Haugen, R. A., & Senbet, L. W. (1981). Resolving the agency problems of external capital through options. The Journal of
Finance, 36(3), 629–647.Holden, S., & van Derhei, J. (2003). 401 (k) plan asset allocation, account balances, and loan activity in 2002. EBRI Issue
Brief, 28(261), 1.Huddart, S. (1994). Employee stock options. Journal of Accounting and Economics, 18(2), 207–231.Huddart, S., & Lang, M. (1996). Employee stock option exercises an empirical analysis. Journal of Accounting and
Economics, 21(1), 5–43.Hutton, A. P., Marcus, A. J., & Tehranian, H. (2009). Opaque financial reports, R2, and crash risk. Journal of Financial Economics,
94(1), 67–86.Ismail, Z., Mahjom, N., Hashim, E., & Dockery, E. (2016). Executive stock options plans and its effect on short-run corporate
performance. Journal of Contemporary Issues and Thought, 6, 102–114.Jensen, M. C., & Murphy, K. J. (1990). Performance pay and top-management incentives. Journal of Political Economy,
98(2), 225–264.Jin, L., & Myers, S. C. (2006). R2 around the world: New theory and new tests. Journal of Financial Economics, 79(2), 257–292.Jones, D. C., & Pliskin, J. (1997). Determinants of the incidence of group incentives: Evidence from Canada. Canadian Journal
of Economics, 30(4b), 1027–1045.Kim, E. H., & Ouimet, P. (2011). Employee stock ownership plans: Employee compensation and firm value. SSRN Electronic
Journal. https://doi.org/10.2139/ssrn.1823745
Li et al. Frontiers of Business Research in China (2019) 13:14 Page 32 of 33

Kim, E. H., & Ouimet, P. (2014). Broad-based employee stock ownership: Motives and outcomes. The Journal of Finance,69(3), 1273–1319.
Kim, J. B., Li, Y., & Zhang, L. (2011a). Corporate tax avoidance and stock price crash risk: Firm-level analysis. Journal of FinancialEconomics, 100(3), 639–662.
Kim, J. B., Li, Y., & Zhang, L. (2011b). CFOs versus CEOs: Equity incentives and crashes. Journal of Financial Economics,101(3), 713–730.
Kumbhakar, S. C., & Dunbar, A. E. (1993). The elusive ESOP—Productivity link: Evidence from US firm-level data. Journal ofPublic Economics, 52(2), 273–283.
Mitchell, O. S., & Utkus, S. P. (2002). The role of company stock in defined contribution plans (NBER working papers no.w9250. Cambridge: National Bureau of Economic Research.
Park, H. (2017). Company stock in defined contribution plans: Evidence from proxy voting. Financial Management,46(1), 155–202.
Piotroski, J. D., Wong, T. J., & Zhang, T. (2015). Political incentives to suppress negative information: Evidence from Chineselisted firms. Journal of Accounting Research, 53(2), 405–459.
Poterba, J. (2004). Valuing assets in retirement saving accounts (NBER working papers no. w10395. Cambridge: National Bureauof Economic Research.
Pugh, W. N., Oswald, S. L., & Jahera, J. S., Jr. (2000). The effect of ESOP adoptions on corporate performance: Are there reallyperformance changes? Managerial and Decision Economics, 21(5), 167–180.
Quarrey, M., Blasi, J. R., & Rosen, C. M. (1986). Taking stock: Employee ownership at work. Cambridge, MA: Ballinger PublishingCompany.
Rajgopal, S., & Shevlin, T. (2002). Empirical evidence on the relation between stock option compensation and risk taking.Journal of Accounting and Economics, 33(2), 145–171.
Rauh, J. D. (2006). Own company stock in defined contribution pension plans: A takeover defense? Journal of FinancialEconomics, 81(2), 379–410.
Rosen, C., & Quarrey, M. (1987). How well is employee ownership working? Harvard Business Review, 65(5), 126–132.Shackelford, D. A. (1991). The market for tax benefits: Evidence from leveraged ESOPs. Journal of Accounting and Economics,
14(2), 117–145.Tehranian, H., & Waegelein, J. F. (1985). Market reaction to short-term executive compensation plan adoption. Journal of
Accounting and Economics, 7(1–3), 131–144.Triki, T., & Ureche-Rangau, L. (2012). Stock options and firm performance: New evidence from the French market. Journal of
International Financial Management & Accounting, 23(2), 154–185.Xu, N., Jiang, X., Chan, K. C., & Yi, Z. (2013). Analyst coverage, optimism, and stock price crash risk: Evidence from China.
Pacific-Basin Finance Journal, 25, 217–239.
Publisher’s NoteSpringer Nature remains neutral with regard to jurisdictional claims in published maps and institutional affiliations.
Li et al. Frontiers of Business Research in China (2019) 13:14 Page 33 of 33