ACCURACY OF ULTRASOUND IN ACUTE AND CHRONIC ...
113
ACCURACY OF ULTRASOUND IN ACUTE AND CHRONIC ABDOMINAL CONDITIONS. BY DR.SANTHOSH LAXMAN Dissertation Submitted to the Rajiv Gandhi University of Health Sciences, Bangalore, Karnataka, in partial fulfillments of the requirements for the degree of M. S. (GENERAL SURGERY) Under the guidance of DR.GURUSHANTHAPPA YALAGACHIN. M.S.DNB. FMAS, FIAGES. & under the co-guidance of Dr. G.C. PATIL. MDRD DEPARTMENT OF GENERAL SURGERY KARNATAKA INSTITUTE OF MEDICAL SCIENCES, HUBLI. 2011 I
-
Upload
khangminh22 -
Category
Documents
-
view
5 -
download
0
Transcript of ACCURACY OF ULTRASOUND IN ACUTE AND CHRONIC ...
ACCURACY OF ULTRASOUND IN ACUTE AND CHRONIC ABDOMINAL
CONDITIONS.
BY
DR.SANTHOSH LAXMAN
Dissertation Submitted to the Rajiv Gandhi University of Health Sciences, Bangalore,
Karnataka, in partial fulfillments of the requirements for the degree of
M. S. (GENERAL SURGERY)
Under the guidance of
DR.GURUSHANTHAPPA YALAGACHIN. M.S.DNB. FMAS, FIAGES.
& under the co-guidance of
Dr. G.C. PATIL. MDRD
DEPARTMENT OF GENERAL SURGERY
KARNATAKA INSTITUTE OF MEDICAL SCIENCES, HUBLI.
2011
I

II
RAJIV GANDHI UNIVERSITY OF HEALTH SCIENCES, KARNATAKA, BANGALORE.
DECLARATION BY THE CANDIDATE
I hereby declare that this dissertation/thesis entitled “Accuracy of Ultrasonography in
Acute and Chronic Abdominal conditions in KIMS, HUBLI” is a Bonafied and
Genuine research work carried out by me under the guidance of
Dr.GURUSHANTHAPPA YALAGACHIN.M.S.DNB.FMAS,FIAGES. Professor
Department of General Surgery, and under the co-guidance of Dr. G.C. PATIL.
MDRD Professor and Head of the Department of Radiology KIMS, HUBLI.
This dissertation has not been submitted by me on any previous occasion to any university for the award of any degree.
Date : Dr. SANTHOSH LAXMAN Place: Hubli Post Graduate student
Department Of General surgery KARNATAKA INSTITUTE OF MEDICAL SCIENCES, HUBLI.
III
CERTIFICATE BY THE GUIDE
This is to certify that the dissertation entitled ““Accuracy of Ultrasonography in Acute
and Chronic Abdominal conditions in KIMS, HUBLI” is a Bonafied research work,
done by Dr.SANTHOSH LAXMAN in partial fulfillment of the requirement for the
degree of M.S. General Surgery.
DATE: Dr.GURUSHANTHAPPA YALAGACHIN M.S.DNB,FMAS, FIAGES. Place: Hubli Professor Department of General Surgery KIMS, HUBLI.
IV
CERTIFICATE BY THE CO - GUIDE
This is to certify that the dissertation entitled ““Accuracy of Ultrasonography in Acute
and Chronic Abdominal conditions in KIMS, HUBLI” is a Bonafied research work,
done by Dr.SANTHOSH LAXMAN in partial fulfillment of the requirement for the
degree of M.S. General Surgery.
DATE: Dr. G.C. PATIL. MDRD. PLACE: Professor & Head of the Department Of Radiology,
KIMS, HUBLI.
V
ENDORSMENT BY THE HOD, DEPARTMENT OF SURGERY
This is to certify that the dissertation entitled ““Accuracy of Ultrasonography in Acute
and Chronic Abdominal conditions in KIMS, HUBLI” is a Bonafied research work
done by Dr.SANTHOSH LAXMAN. Under the guidance of
Dr.GURUSHANTHAPPA YALAGACHIN. M.S.DNB.FMAS,FIAGES. Professor
Department of General Surgery, & under the Co- Guidance of Dr. G.C.PATIL. MDRD
Professor & Head of the Department of Radiology. KIMS,HUBLI.
DATE: Dr.B.S.MADAKATTI
PLACE : Hubli PROFESSOR AND HEAD DEPARTMENT OF GENERAL SURGERY
KIMS HUBLI.
VI
ENDORSMENT BY THE, PRINCIPAL/HEAD OF THE INSTITUTION
This is to certify that the dissertation entitled ““Accuracy of Ultrasonography in
Acute and Chronic Abdominal conditions in KIMS, HUBLI” is a Bonafied research
work done by Dr.SANTHOSH LAXMAN under the guidance of
Dr.GURUSHANTHAPPA YALAGACHIN. M.S. FMAS,FIAGES,DNB. Professor
Department of General Surgery, & under the Co- Guidance of Dr. G.C.PATIL. MDRD
Professor & Head of the Department of Radiology KIMS, HUBLI.
Date: Dr.U.S.HUNGARGA.MD. PRINCIPAL Place: Hubli KIMS HUBLI.
VII
COPY RIGHT
DECLARATION BY THE CANDIDATE
I hereby declare that Rajiv Gandhi University Of Health Sciences, Karnataka. Shall have
the rights to preserve, use and disseminate this dissertation/thesis in print or electronic
format for academic/research purpose.
DATE: Dr. SANTHOSH LAXMAN Post Graduate student Place: Hubli Department Of General surgery
KIMS HUBLI
© Rajiv Gandhi University of Health Sciences, Karnataka

VIII
ACKNOWLEDGEMENT
It gives me immense pleasure to express my gratitude and respect to my
beloved teacher and guide Dr.GURUSHANTAPPA YALAGACHIN
M . S . D N B , F M A S , F I A G E S Professor, Department of General Surgery, KIMS,
Hubli,& Dr.G.C.PATIL.MDRD.Professor and Head of the Department of
Radiology,KIMS,Hubli for their priceless guidance, affection and constant
encouragement during the course of this dissertation.
I express my deepest sense of gratitude and sincere thanks to my beloved
teacher Dr. B. S. MADAKATTI M.S, Professor & Head, Department of
General Surgery, KIMS, Hubli, for his unceasing guidance, invaluable
supervision and continuous support.
I express my humble thanks to my respected teachers
Dr.M.B.BARIGIDAD.M.S,Professor, Dr.Ishwar Hosmani.M . S , Professor,
Dr.Ramesh Hosmani M . S , Associate Professor, Dr.N.I.Hebsur M.S,
Associate Professor, Dr.Ravikumar Jadhav M . S, Associate Professor ,
Dr.Suresh Hucchannavar M . S , Assistant professor , Dr.Vijay Kamath M . S ,
Assistant professor , Dr.B.P.Sanganal M . S , Assistant Professor, for their
guidance and encouragement throughout the course of this study.
I also express my sincere thanks to the rest of the Teaching Faculty and all
my friends of Department of Surgery for their valuable suggestions and kind
cooperation.
I am also thankful to Professor and Head,department of pathology,
department of Anaesthesia and department of Radiology and their respective
staff whose help in completing this work has been immense.
I am grateful to Director, Principal, Superintendent and RMO of KIMS, for
permitting to utilize resources in completion of this work.
IX
Above all, I am eternally indebted to God, to my parents for everything they
have done, or sacrificed in shaping my career.
I express my sincere thanks to all the patients without whose consent and co-
operation, this study would not have been possible.
DATE: Dr. SANTHOSH LAXMAN Post Graduate Student PLACES: HUBLI Department of Surgery KIMS, Hubli.
X
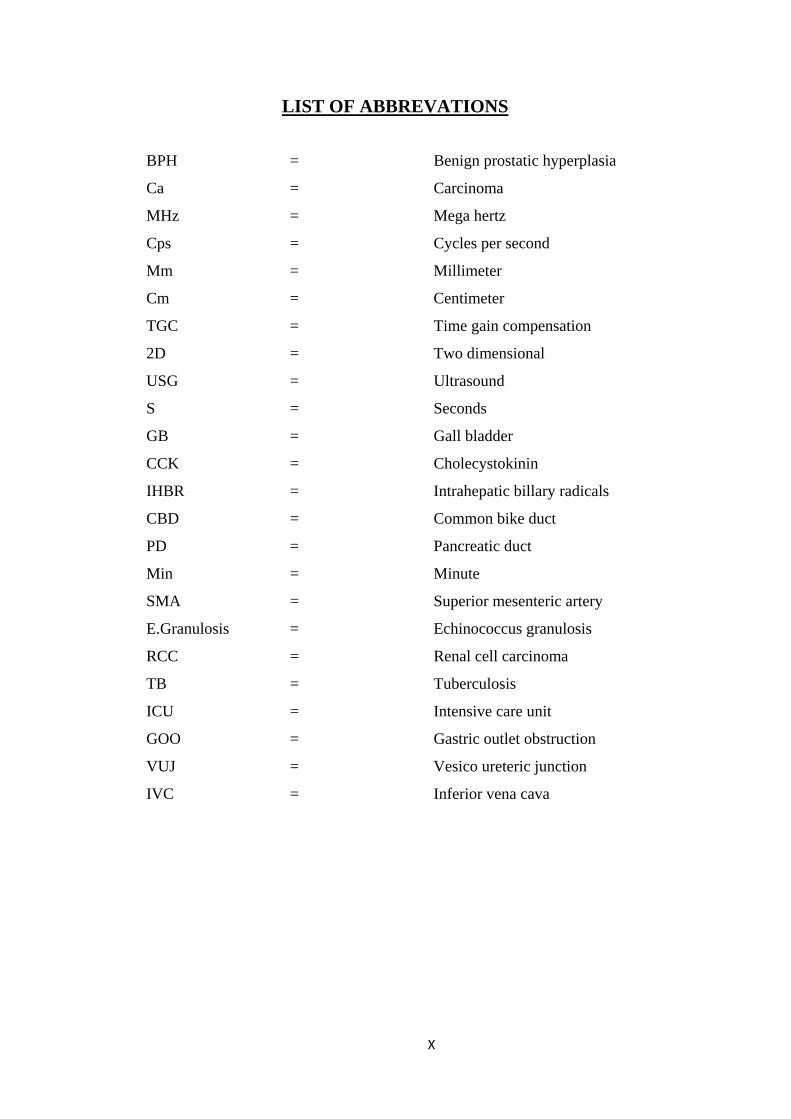
LIST OF ABBREVATIONS
BPH = Benign prostatic hyperplasia
Ca = Carcinoma
MHz = Mega hertz
Cps = Cycles per second
Mm = Millimeter
Cm = Centimeter
TGC = Time gain compensation
2D = Two dimensional
USG = Ultrasound
S = Seconds
GB = Gall bladder
CCK = Cholecystokinin
IHBR = Intrahepatic billary radicals
CBD = Common bike duct
PD = Pancreatic duct
Min = Minute
SMA = Superior mesenteric artery
E.Granulosis = Echinococcus granulosis
RCC = Renal cell carcinoma
TB = Tuberculosis
ICU = Intensive care unit
GOO = Gastric outlet obstruction
VUJ = Vesico ureteric junction
IVC = Inferior vena cava
XI
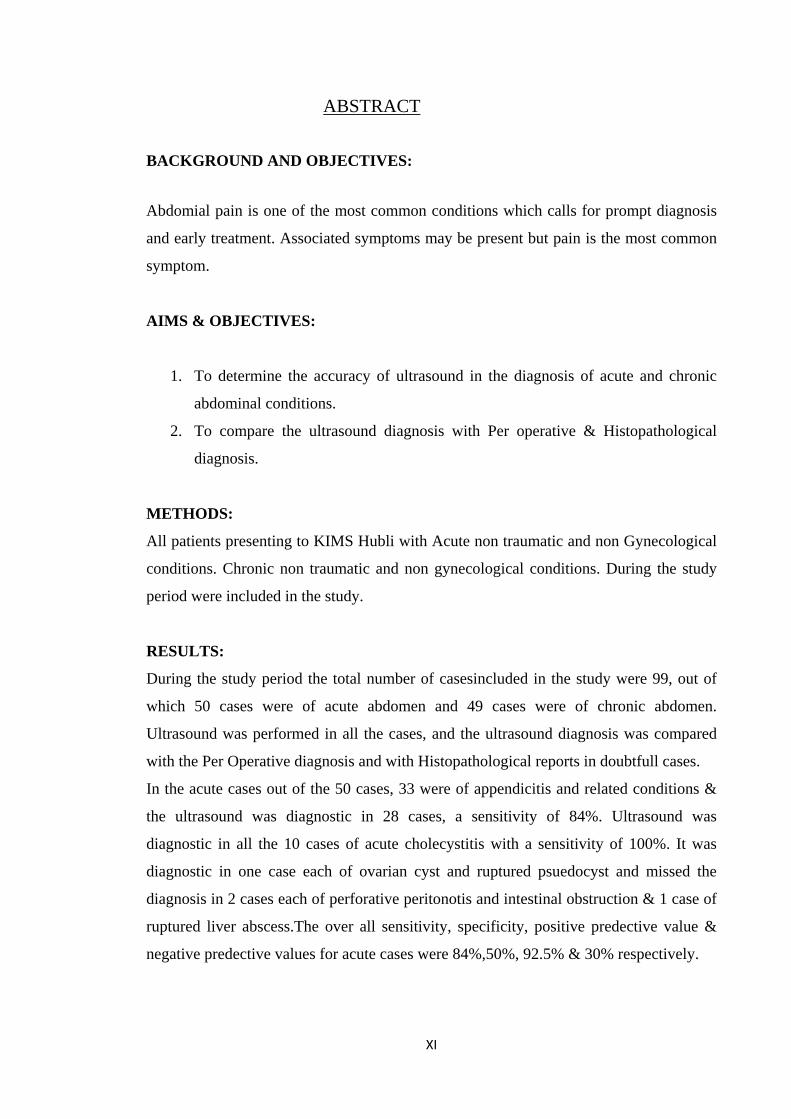
ABSTRACT
BACKGROUND AND OBJECTIVES:
Abdomial pain is one of the most common conditions which calls for prompt diagnosis
and early treatment. Associated symptoms may be present but pain is the most common
symptom.
AIMS & OBJECTIVES:
1. To determine the accuracy of ultrasound in the diagnosis of acute and chronic
abdominal conditions.
2. To compare the ultrasound diagnosis with Per operative & Histopathological
diagnosis.
METHODS:
All patients presenting to KIMS Hubli with Acute non traumatic and non Gynecological
conditions. Chronic non traumatic and non gynecological conditions. During the study
period were included in the study.
RESULTS:
During the study period the total number of casesincluded in the study were 99, out of
which 50 cases were of acute abdomen and 49 cases were of chronic abdomen.
Ultrasound was performed in all the cases, and the ultrasound diagnosis was compared
with the Per Operative diagnosis and with Histopathological reports in doubtfull cases.
In the acute cases out of the 50 cases, 33 were of appendicitis and related conditions &
the ultrasound was diagnostic in 28 cases, a sensitivity of 84%. Ultrasound was
diagnostic in all the 10 cases of acute cholecystitis with a sensitivity of 100%. It was
diagnostic in one case each of ovarian cyst and ruptured psuedocyst and missed the
diagnosis in 2 cases each of perforative peritonotis and intestinal obstruction & 1 case of
ruptured liver abscess.The over all sensitivity, specificity, positive predective value &
negative predective values for acute cases were 84%,50%, 92.5% & 30% respectively.
XII
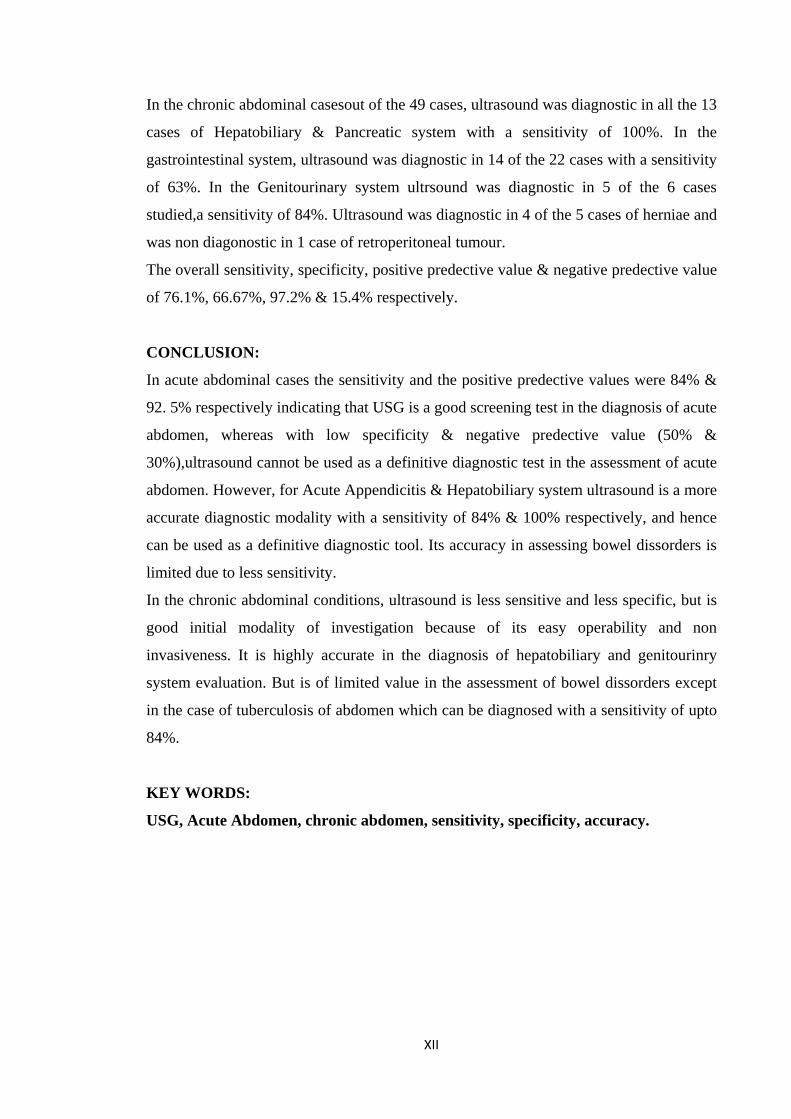
In the chronic abdominal casesout of the 49 cases, ultrasound was diagnostic in all the 13
cases of Hepatobiliary & Pancreatic system with a sensitivity of 100%. In the
gastrointestinal system, ultrasound was diagnostic in 14 of the 22 cases with a sensitivity
of 63%. In the Genitourinary system ultrsound was diagnostic in 5 of the 6 cases
studied,a sensitivity of 84%. Ultrasound was diagnostic in 4 of the 5 cases of herniae and
was non diagonostic in 1 case of retroperitoneal tumour.
The overall sensitivity, specificity, positive predective value & negative predective value
of 76.1%, 66.67%, 97.2% & 15.4% respectively.
CONCLUSION:
In acute abdominal cases the sensitivity and the positive predective values were 84% &
92. 5% respectively indicating that USG is a good screening test in the diagnosis of acute
abdomen, whereas with low specificity & negative predective value (50% &
30%),ultrasound cannot be used as a definitive diagnostic test in the assessment of acute
abdomen. However, for Acute Appendicitis & Hepatobiliary system ultrasound is a more
accurate diagnostic modality with a sensitivity of 84% & 100% respectively, and hence
can be used as a definitive diagnostic tool. Its accuracy in assessing bowel dissorders is
limited due to less sensitivity.
In the chronic abdominal conditions, ultrasound is less sensitive and less specific, but is
good initial modality of investigation because of its easy operability and non
invasiveness. It is highly accurate in the diagnosis of hepatobiliary and genitourinry
system evaluation. But is of limited value in the assessment of bowel dissorders except
in the case of tuberculosis of abdomen which can be diagnosed with a sensitivity of upto
84%.
KEY WORDS:
USG, Acute Abdomen, chronic abdomen, sensitivity, specificity, accuracy.
XIII
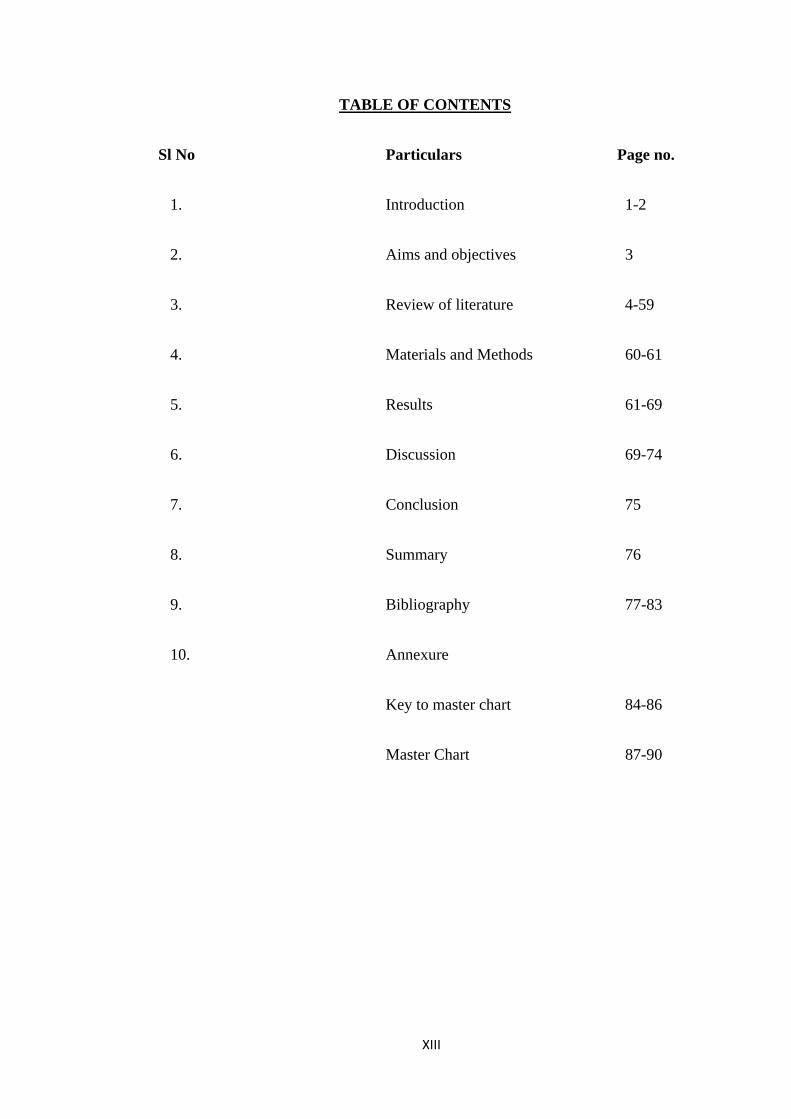
TABLE OF CONTENTS
Sl No Particulars Page no.
1. Introduction 1-2
2. Aims and objectives 3
3. Review of literature 4-59
4. Materials and Methods 60-61
5. Results 61-69
6. Discussion 69-74
7. Conclusion 75
8. Summary 76
9. Bibliography 77-83
10. Annexure
Key to master chart 84-86
Master Chart 87-90
XIV
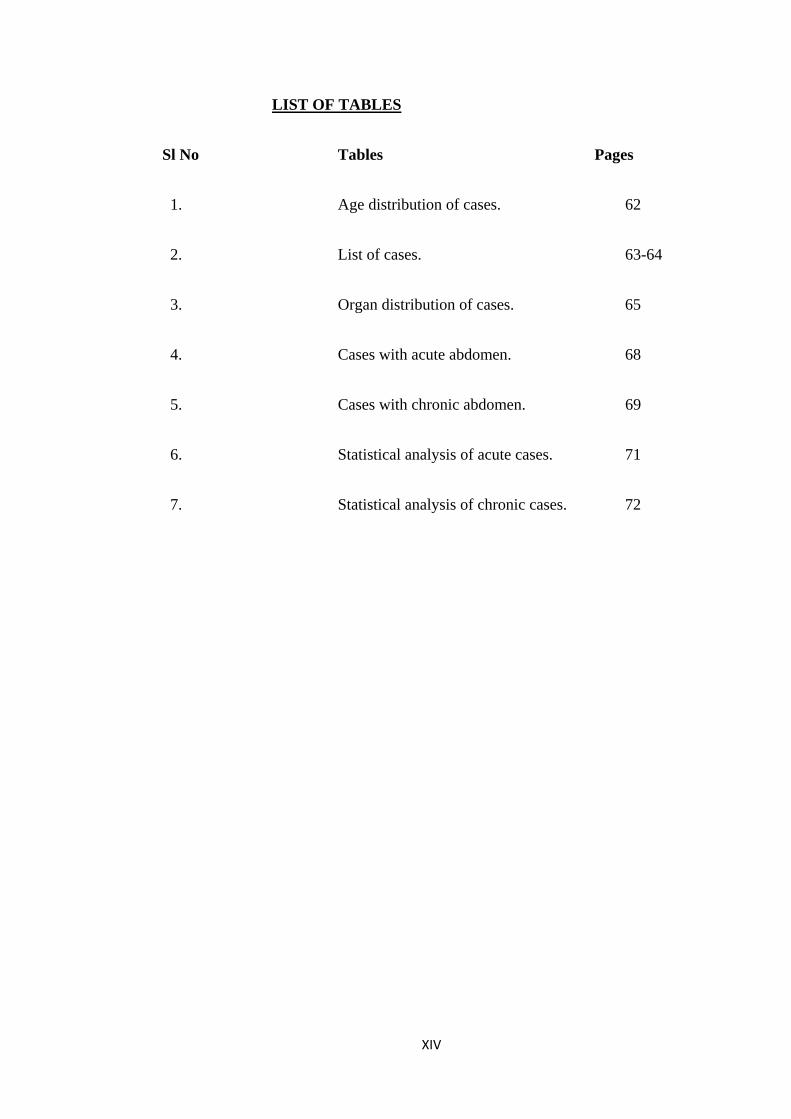
LIST OF TABLES
Sl No Tables Pages
1. Age distribution of cases. 62
2. List of cases. 63-64
3. Organ distribution of cases. 65
4. Cases with acute abdomen. 68
5. Cases with chronic abdomen. 69
6. Statistical analysis of acute cases. 71
7. Statistical analysis of chronic cases. 72
XV
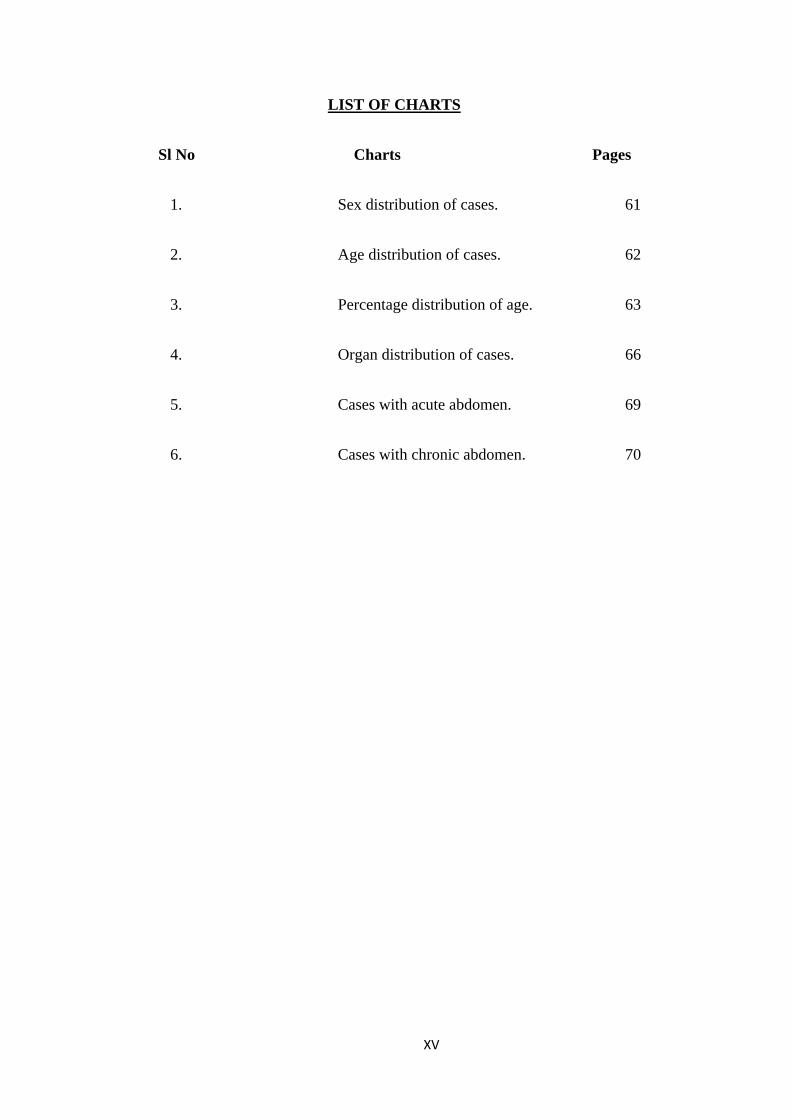
LIST OF CHARTS
Sl No Charts Pages
1. Sex distribution of cases. 61
2. Age distribution of cases. 62
3. Percentage distribution of age. 63
4. Organ distribution of cases. 66
5. Cases with acute abdomen. 69
6. Cases with chronic abdomen. 70
XVI
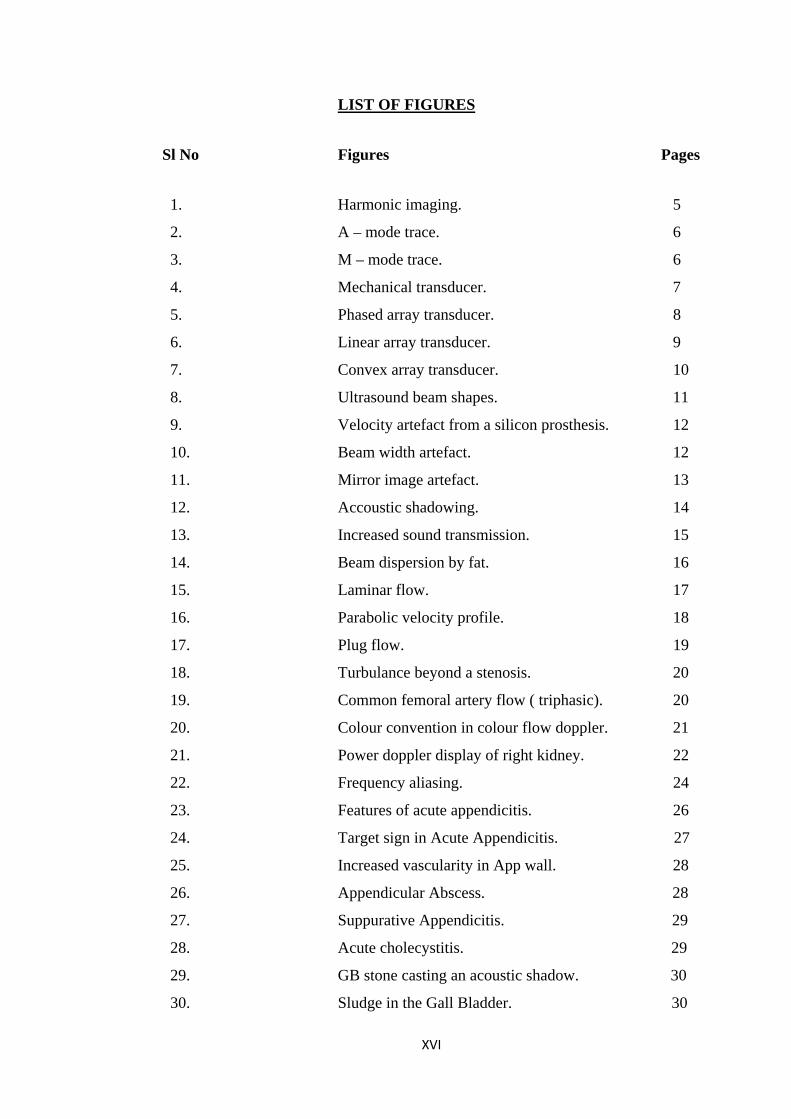
LIST OF FIGURES
Sl No Figures Pages
1. Harmonic imaging. 5
2. A – mode trace. 6
3. M – mode trace. 6
4. Mechanical transducer. 7
5. Phased array transducer. 8
6. Linear array transducer. 9
7. Convex array transducer. 10
8. Ultrasound beam shapes. 11
9. Velocity artefact from a silicon prosthesis. 12
10. Beam width artefact. 12
11. Mirror image artefact. 13
12. Accoustic shadowing. 14
13. Increased sound transmission. 15
14. Beam dispersion by fat. 16
15. Laminar flow. 17
16. Parabolic velocity profile. 18
17. Plug flow. 19
18. Turbulance beyond a stenosis. 20
19. Common femoral artery flow ( triphasic). 20
20. Colour convention in colour flow doppler. 21
21. Power doppler display of right kidney. 22
22. Frequency aliasing. 24
23. Features of acute appendicitis. 26
24. Target sign in Acute Appendicitis. 27
25. Increased vascularity in App wall. 28
26. Appendicular Abscess. 28
27. Suppurative Appendicitis. 29
28. Acute cholecystitis. 29
29. GB stone casting an acoustic shadow. 30
30. Sludge in the Gall Bladder. 30
XVII
31. Gangrenous Cholecystitis. 31
32. Emphysematous Cholecystitis. 32
33. The Double Arc Sign. 32
34. GB Sludge with dirty shadowing. 33
35. CBD Stone casting an acoustic shadow. 34
36. Choledochal cyst. 35
37. Acute pancreatitis. 36
38. Chronic pancreatitis with stone in the PD. 37
39. Psuedopancreatic cyst. 39
40. Carcinoma pancreas. 39
41. Liver abscess. 40
42. Portal vein thrombosis. 41
43. Honey coomb appearance in HC Liver. 42
44. Daughter cyst. 43
45. Double Rim Sign in Hydatid Cyst. 43
46. Water Lilly Sign. 44
47. Floating membranes in Hydatid cyst. 44
48. Liver Metastasis. 45
49. Target lesions in Hepatic metastasis 46
50. Portal Hypertension. 46
51. Acute Intestinal Obstruction 47
52. Peritoneal Tuberculosis. 48
53. Omental Tuberculosis. 49
54. Club sandwich sign. 50
55. TB Lymphadenitis. 50
56. Ileocecal Tuberculosis. 51
57. Pulled up cecum. 52
58. Normal kidney & Hydronephrosis. 52
59. Suprapubic US of Bladder. 53
60. Bilateral Undescended testes. 54
61. Seminoma. 55
62. Teratoma of testis 56
63. Renal calculus. 57
64. Hydronephrosis. 57

XVIII
XIX
INTRODUCTION
Abdominal pain is one of the most common conditions which calls for prompt diagnosis
and early treatment, associated symptoms may be present, but pain is the most common
Symptom.
CAUSES FOR ACUTE ABDOMEN
Gastro intestinal system
1. Acute intestinal obstruction
2. Acute perforative peritonitis
3. Acute appendicitis
4. Acute colonic diverticulitis
5. Acute regional enteritis
6. Ulcerative colitis
7. Acute mesenteric ischemia
Hepato-Billiary and Pancreatic system
1. Acute cholecystitis
2. Acute pancreatitis
3. Empyema of gall bladder
4. Portal vein thrombosis
5. Hepatic vein thrombosis/Budd Chiari Syndrome
6. Liver abscess
7. Subphernic/Subhepatic abscess
Genito Urinary system
1. Ureteric colic
2. Acute retention of urine
3. Perinephric abscess
4. Pyonephrosis
Retroperitoneum
1. Ruptured aortic aneurysm
2. Retroperitoneal abscess
Miscellaneous
1. Omphalitis
2. Rectus sheath hematoma
XX
CAUSES OF CHRONIC ABDOMEN
Gastro intestinal system
1. Gastric out let obstruction
2. Abdominal kochs
3. Inflammatory bowel disease
4. Carcinoma rectum/colon
5. Small intestinal tumors
Hepato billary and Pancretic system
1. Chronic cholecystitis 2. Cholelithiasis
2. Choledocolithisis
3. Chronic Pancreatitis
4. Choledochal cysts
5. Pseudocysts of pancreas
6. Carcinoma pancreas
7. Hydatid cyst of liver
8. Hepatoma
9. Metastatic liver disease
10. Portal hypertension
Genito Urinary system:
1. Bph
2. Undescended testis.
3. Ca. Testis.
4. Vesical calculus.
Retroperitoneum.
1. Retroperitoneal tumor.
2. Aortic aneurysm.
XXI
AIMS AND OBJECTIVES
1. To determine the Accuracy of Ultrasound in the Diagnosis of Acute and
Chronic Abdominal conditions.
2. To compare the Ultrasound Diagnosis with Per Operative and
Histopathological Diagnosis.
XXII
REVIEW OF LITERATURE
Ultrasonography:1
General principles:
Ultrasound is simply a sound with a frequency above the limits of human
Hearing. Frequencies in the range of 2-20MHz (million cps) are used corresponding to
the wave length of 1(0.1mm in the tissue).
Ultrasonic transducers:
Ultrasound is generated by piezoelectric materials which have the property of changing
thickness when a voltage is applied across them. Lead Zirconate Titanate (PZT) is most
widely used. Piezoelectric effect is derived from movements of heavily charged lead
atoms that is loosely bound within a complex crystal. When an electric field is applied,
an atom moves and distorts the crystal.
PZT is a ceramic that is cast as a thin plate that may be disk shaped or more usually is
formed into a strip that is then sliced into several hundred tiny elements as an array with
metal electrodes on two surfaces. it is polarized by heating above the critical level and
then allowing it to cool in an electric field. When electrically pulsed, the crystal rings at
a resonant frequency that is mainly determined by its thickness. Higher frequency
crystals are thinner and thus more difficult to manufacture.
The Piezo electric effect is reversible so that a same or a similar crystal is used as the
receiver to produce small electric signals when struck by an ultrasound wave.
The crystal is mounted in a conveniently shaped holder, which contains the electrodes
and any associated electrons, as well as the lenses and the matching layers required to
improve beam shape. The whole assembly is known as a probe, transducer or head.
Propagation in tissues:
Ultrasound travels through tissues as a beam that is usually focused to improve lateral
resolution. It propagates as a sequence of compression and rarefaction waves transmitted
by the electric forces between adjacent tissue particles. The particals move in the same
direction as the wave. Thus ultrasound is a longitudinal wave. The constant speed of
ultrasound in tissues (1540m\ sec) allows the depth of reflecting structures to be
calculated by measuring the delay in return of echoes after the ultrasound pulse has been
transmitted. This is the essence of pulse echo method used in USG and Doppler. The
position of reflecting structures across the image is determined by the direction in which
ultrasound beam is transmitted.
Attenuation:
Ultrasound energy is lost to receiving transducer if it is reflected or refracted away from
the returning line of sight or if the beam diverges. Total loss from all these mechanisms
is called attenuation. High frequency ultrasonic waves give good resolution because of
its short wave length, but rapidly attenuates. Frequency upto 20MHz can be used when
only few mm of tissues are to be traversed. e.g. Eye, Skin & Intravascular Ultrasound.
For Superficial tissues 10-15MHz can be used. For Heart, Abdomen and 2nd and 3rd
Trimester Obstetrics scan 3-7MHz can be used. For Abdomen in Obese and Transcranial
Ultrasound frequency of 1-2MHz can be used.
Reflection:
Some of the transmitted energy is reflected whenever the beam crosses an interface.
Where the transmission properties change, the proportion depending on the degree of
Impedance is matched. Ultrasound that is not reflected passes through and is available
for imaging deeper tissues. 2-10% reflection occurs at each soft tissue interface. Total
reflection occurs at tissue gas interface. 2/3rd reflection occurs at tissue bone or tissue
calculus interface. aerated lung is opaque to Ultrasound.
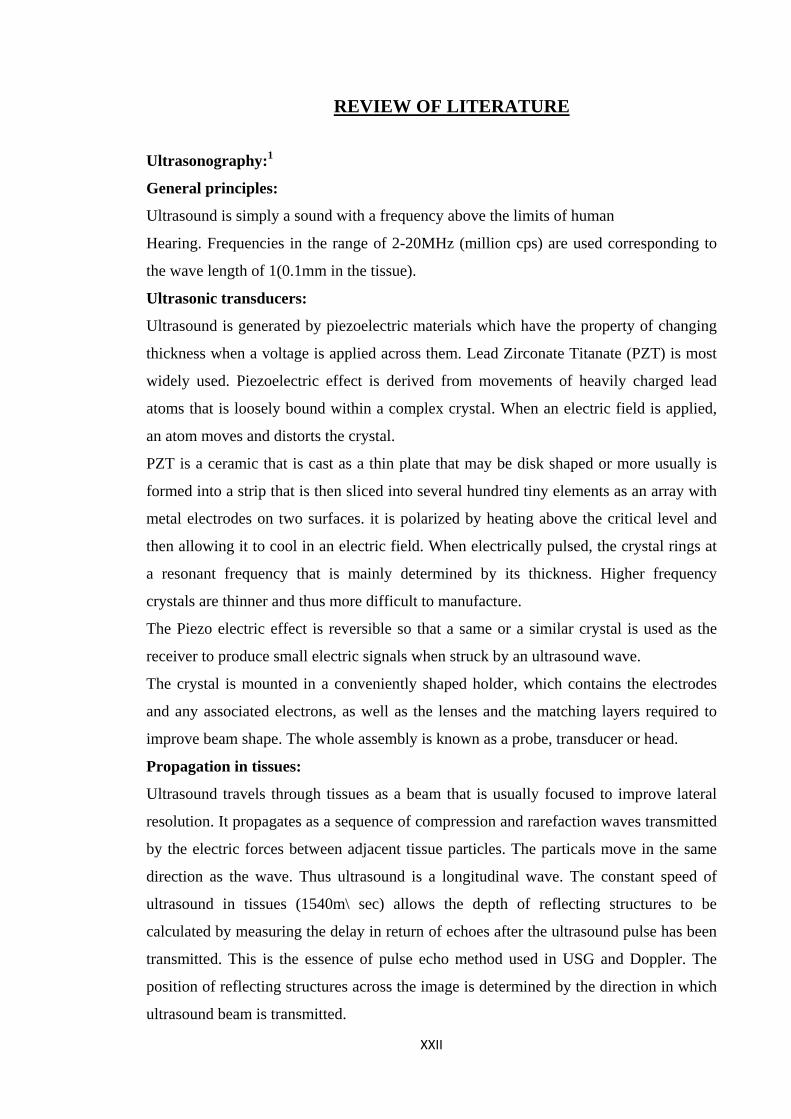
Figure 1. Harmonic imaging. (a) Conventional grey scale image through the
gallbladder shows an echogenic mass within it. (b) Harmonic mode the image has much
higher contrast and the gallstones (arrowhead), together with the shadowing they
produce, are clearly visualized.
FIGURE 1
XXIII
IMAGING METHODS
Pulse -Echo method:
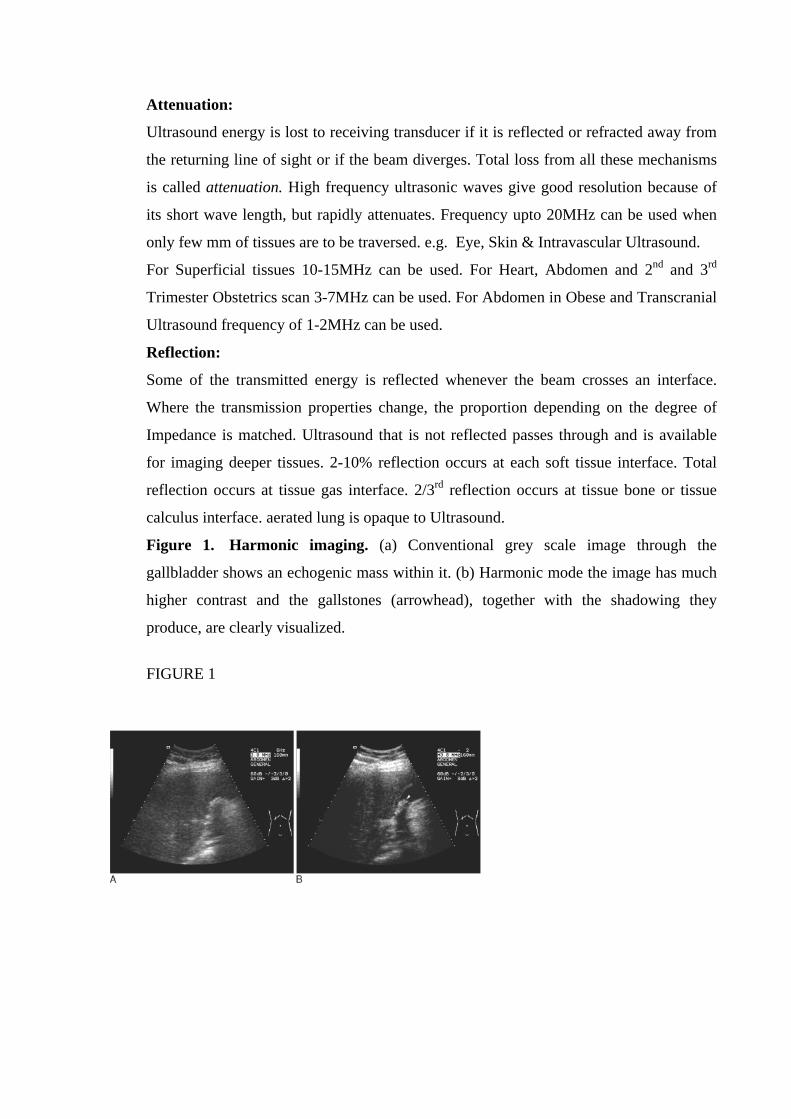
1. A-Mode(Amplitude):
Only the depth of interface is determined.
Figure 2. A-Mode trace. Indicating echo intensity tissue with depth. There is a fluid
space (6–10 cm) from which no echoes arise. Tissues superficial and deep to this
produce echoes of varying intensities and there is a particularly strong echo from the
skin (0–5 cm). The time gain compensation (TGC) curve is also shown. FIGURE 2
2. M-Mode (Movement): Shows depth vs time. e.g 2D-Echo.
Figure 3. M-mode trace. The echo intensity is displayed as brightness and the trace is
swept across the screen so that the x-axis represents time. This is an m-mode
echocardiogram showing the rapid movement of the mitral valve apparatus within the
left ventricle (LV), with thicker proximal and distal moving bands representing the
myocardium. RV = right ventricle.
FIGURE 3
3. B-Mode (Brightness): Also known as Grey scale, it is the commonest mode used for Ultrasound imaging
XXIV
Beam Steering:
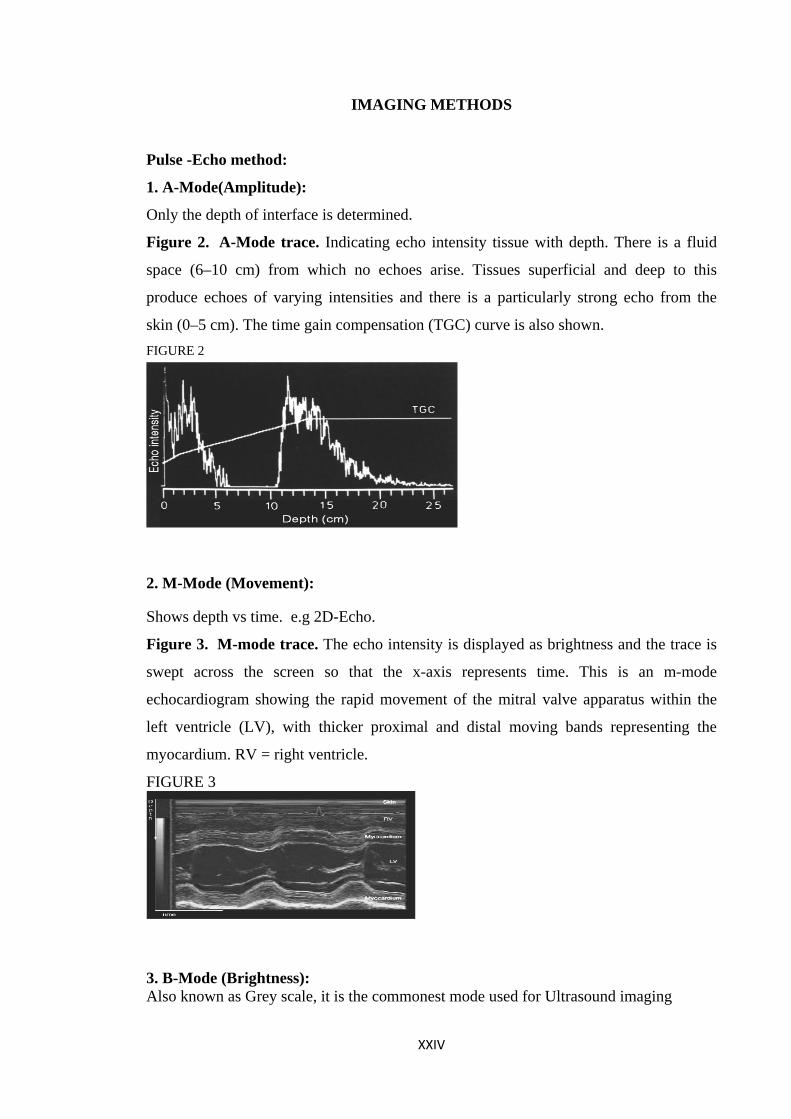
1. Mechanical:
Used for intra cavitatory examination of Trans rectal or Trans vaginal examination.
Figure 4 Mechanical Transducer. (a) A motor rotates the transducer assembly to
sweep out a circular path. (b) Trans rectal image covering a 2.2 cm axial section showing
the layers of the rectal wall with defects of both the internal and the external sphincter
(arrowheads) anteriorly. This is a classic sphincter tear that resulted from a forceps
delivery. A = Anterior, ES = External sphincter, IS = Internal sphincter, M = mucosa, R
= right, Tx = Transducer.
FIGURE 4
XXV
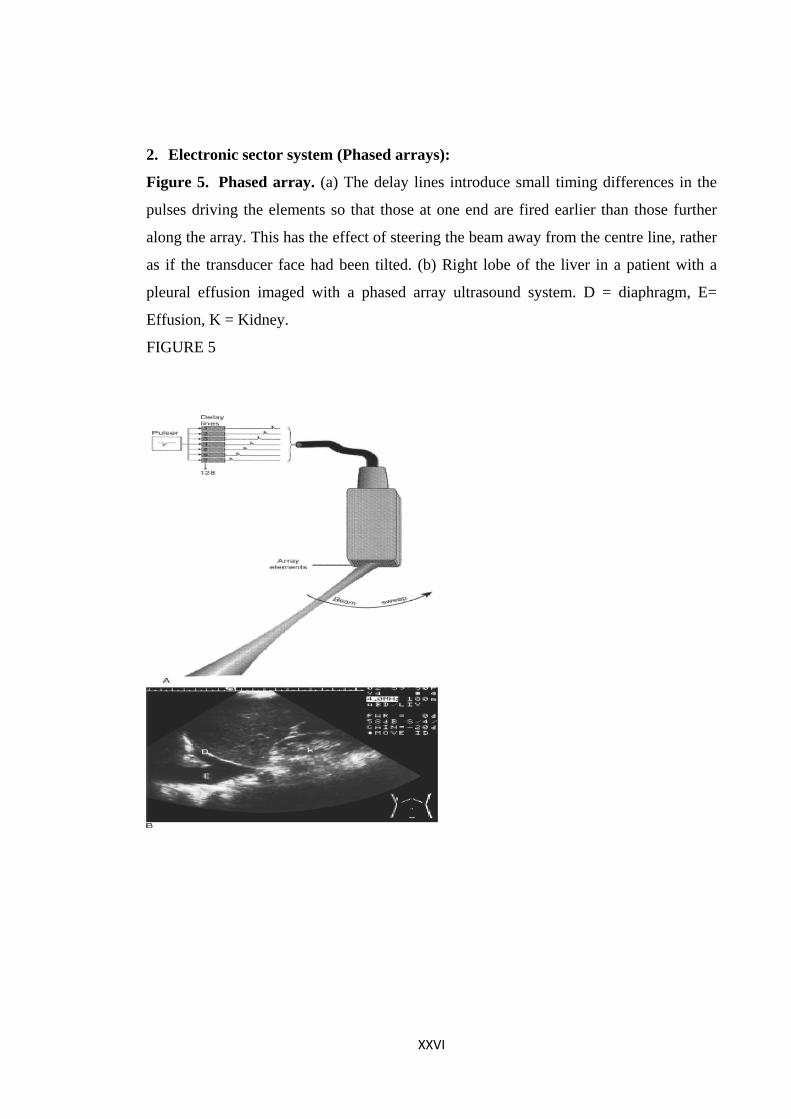
2. Electronic sector system (Phased arrays):
Figure 5. Phased array. (a) The delay lines introduce small timing differences in the
pulses driving the elements so that those at one end are fired earlier than those further
along the array. This has the effect of steering the beam away from the centre line, rather
as if the transducer face had been tilted. (b) Right lobe of the liver in a patient with a
pleural effusion imaged with a phased array ultrasound system. D = diaphragm, E=
Effusion, K = Kidney.
FIGURE 5
XXVI
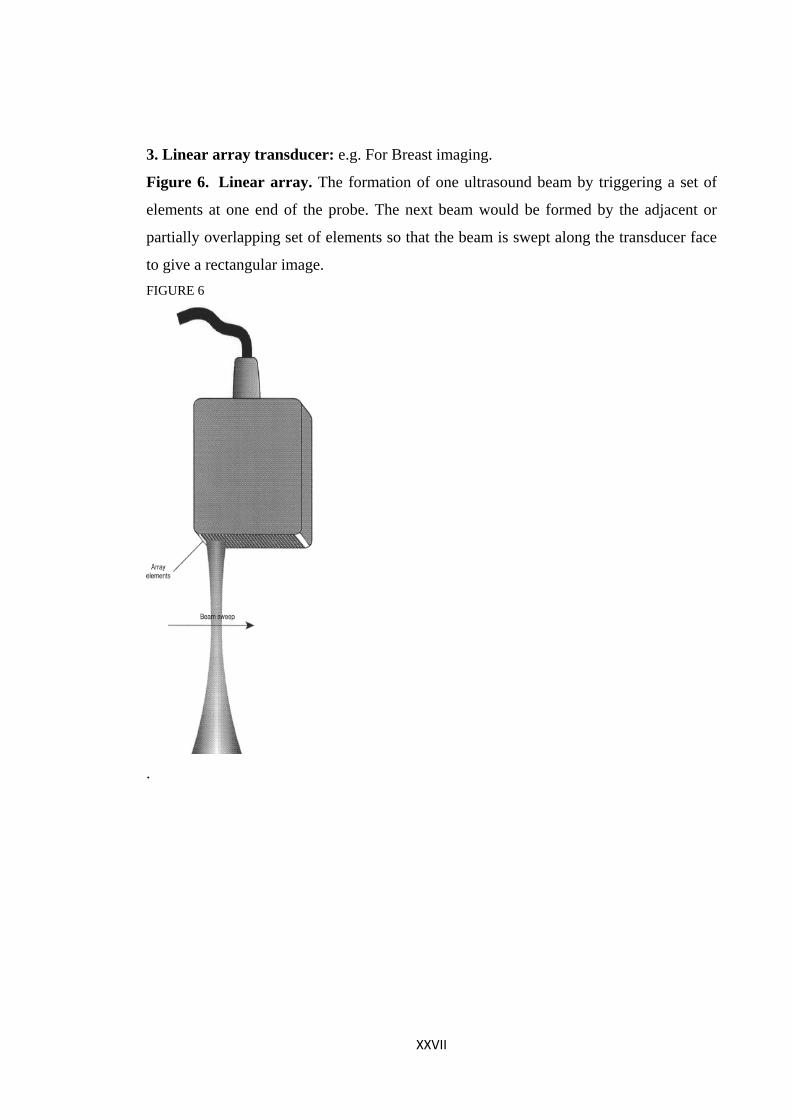
3. Linear array transducer: e.g. For Breast imaging.
Figure 6. Linear array. The formation of one ultrasound beam by triggering a set of
elements at one end of the probe. The next beam would be formed by the adjacent or
partially overlapping set of elements so that the beam is swept along the transducer face
to give a rectangular image. FIGURE 6
.
XXVII
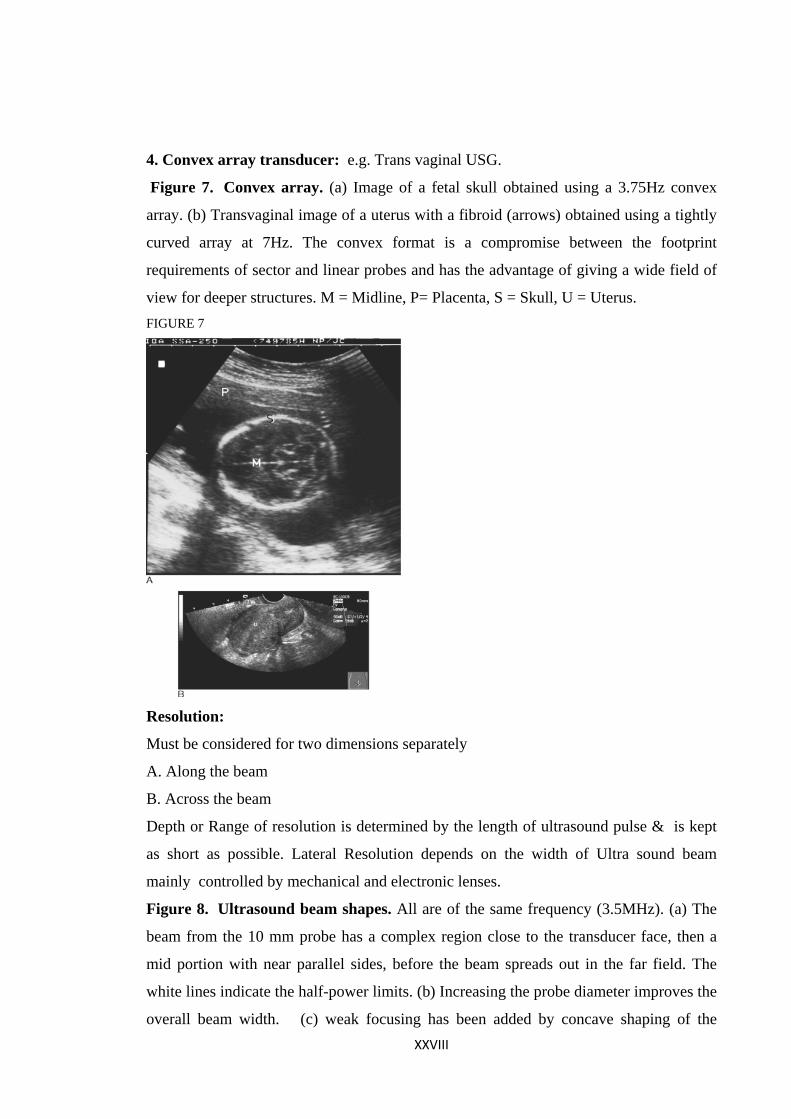
4. Convex array transducer: e.g. Trans vaginal USG.
Figure 7. Convex array. (a) Image of a fetal skull obtained using a 3.75Hz convex
array. (b) Transvaginal image of a uterus with a fibroid (arrows) obtained using a tightly
curved array at 7Hz. The convex format is a compromise between the footprint
requirements of sector and linear probes and has the advantage of giving a wide field of
view for deeper structures. M = Midline, P= Placenta, S = Skull, U = Uterus. FIGURE 7
Resolution:
Must be considered for two dimensions separately
A. Along the beam
B. Across the beam
Depth or Range of resolution is determined by the length of ultrasound pulse & is kept
as short as possible. Lateral Resolution depends on the width of Ultra sound beam
mainly controlled by mechanical and electronic lenses.
Figure 8. Ultrasound beam shapes. All are of the same frequency (3.5MHz). (a) The
beam from the 10 mm probe has a complex region close to the transducer face, then a
mid portion with near parallel sides, before the beam spreads out in the far field. The
white lines indicate the half-power limits. (b) Increasing the probe diameter improves the
overall beam width. (c) weak focusing has been added by concave shaping of the XXVIII
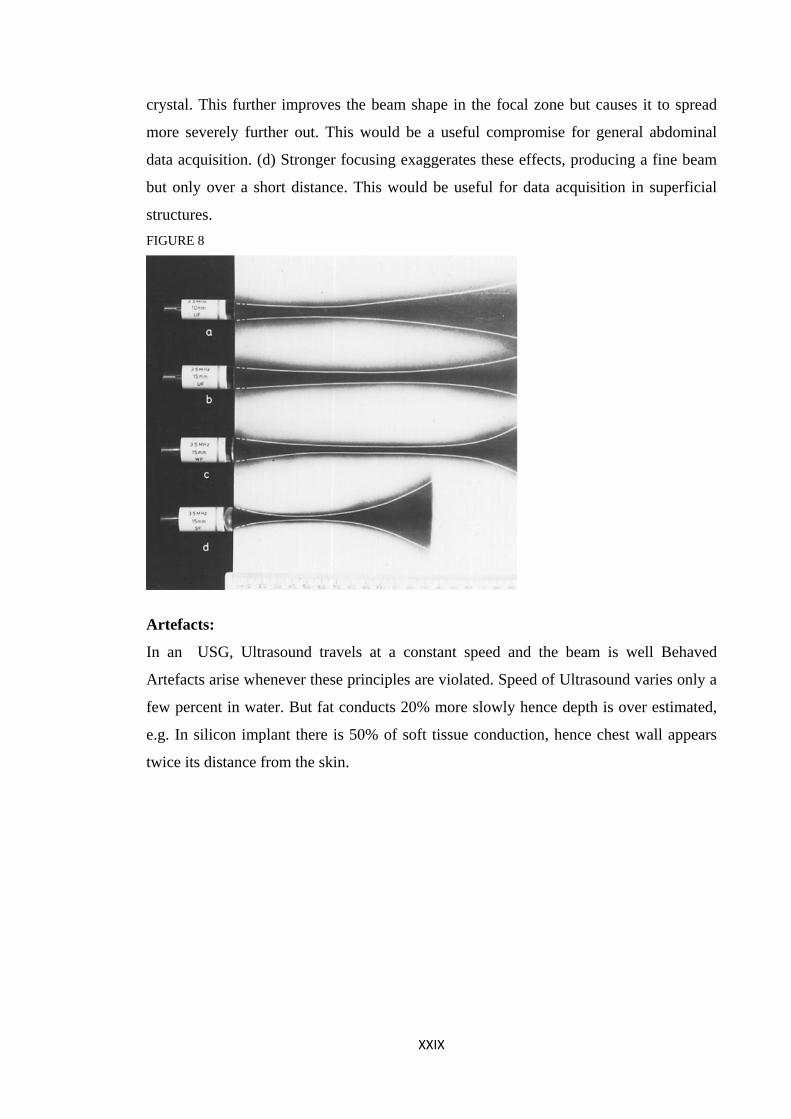
crystal. This further improves the beam shape in the focal zone but causes it to spread
more severely further out. This would be a useful compromise for general abdominal
data acquisition. (d) Stronger focusing exaggerates these effects, producing a fine beam
but only over a short distance. This would be useful for data acquisition in superficial
structures. FIGURE 8
Artefacts:
In an USG, Ultrasound travels at a constant speed and the beam is well Behaved
Artefacts arise whenever these principles are violated. Speed of Ultrasound varies only a
few percent in water. But fat conducts 20% more slowly hence depth is over estimated,
e.g. In silicon implant there is 50% of soft tissue conduction, hence chest wall appears
twice its distance from the skin.
XXIX
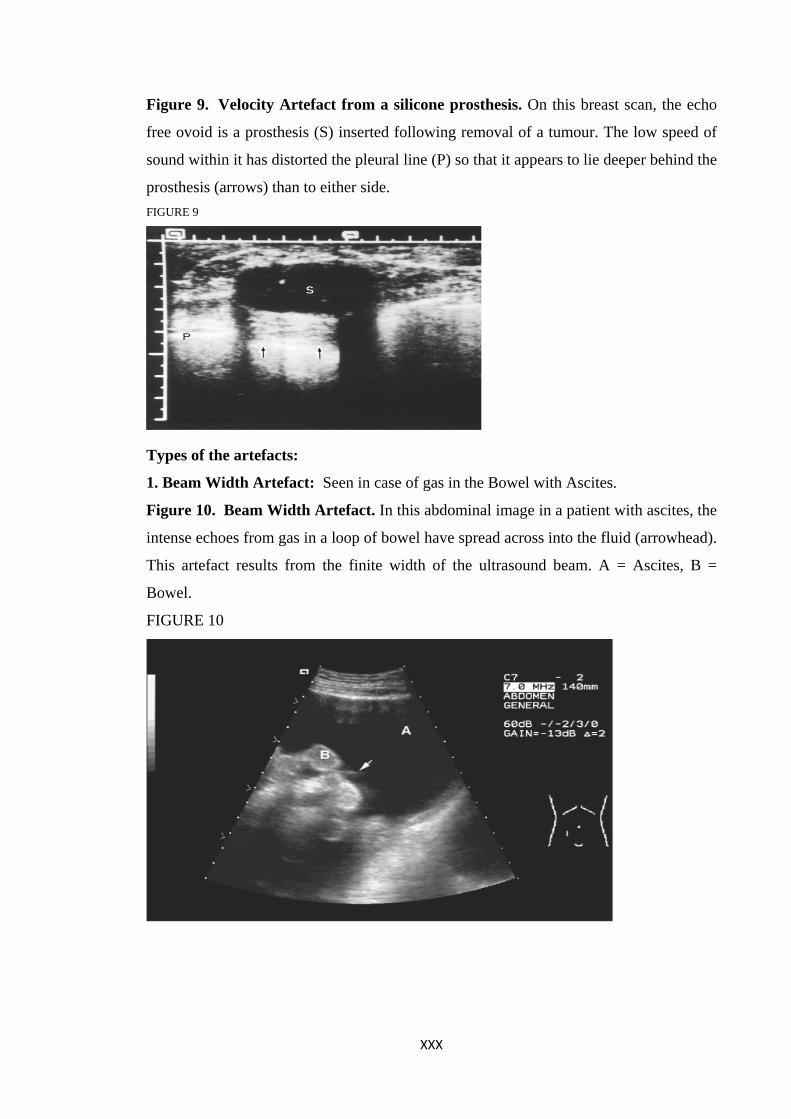
Figure 9. Velocity Artefact from a silicone prosthesis. On this breast scan, the echo
free ovoid is a prosthesis (S) inserted following removal of a tumour. The low speed of
sound within it has distorted the pleural line (P) so that it appears to lie deeper behind the
prosthesis (arrows) than to either side. FIGURE 9
Types of the artefacts:
1. Beam Width Artefact: Seen in case of gas in the Bowel with Ascites.
Figure 10. Beam Width Artefact. In this abdominal image in a patient with ascites, the
intense echoes from gas in a loop of bowel have spread across into the fluid (arrowhead).
This artefact results from the finite width of the ultrasound beam. A = Ascites, B =
Bowel.
FIGURE 10
XXX
2. Linear artifact:
3. Comet tail artifact:
Seen in closely packed focuses in the bowel.
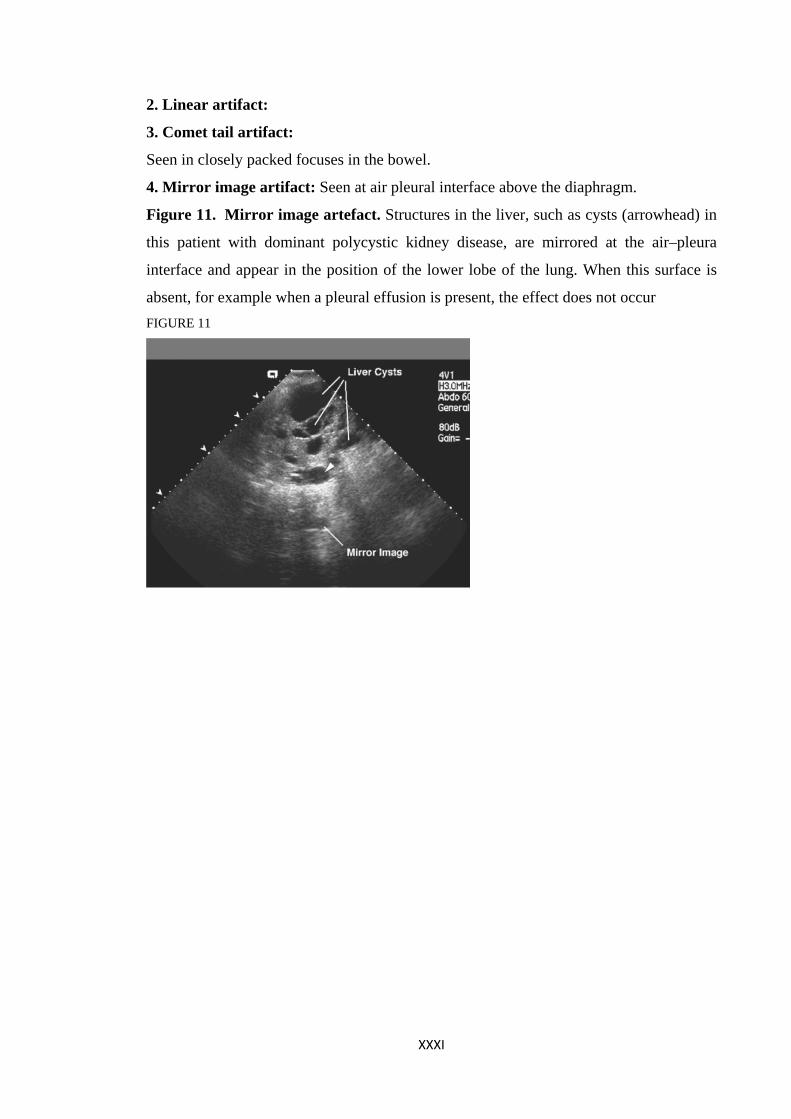
4. Mirror image artifact: Seen at air pleural interface above the diaphragm.
Figure 11. Mirror image artefact. Structures in the liver, such as cysts (arrowhead) in
this patient with dominant polycystic kidney disease, are mirrored at the air–pleura
interface and appear in the position of the lower lobe of the lung. When this surface is
absent, for example when a pleural effusion is present, the effect does not occur FIGURE 11
XXXI
INTERPRETATIVE PRINCIPLES
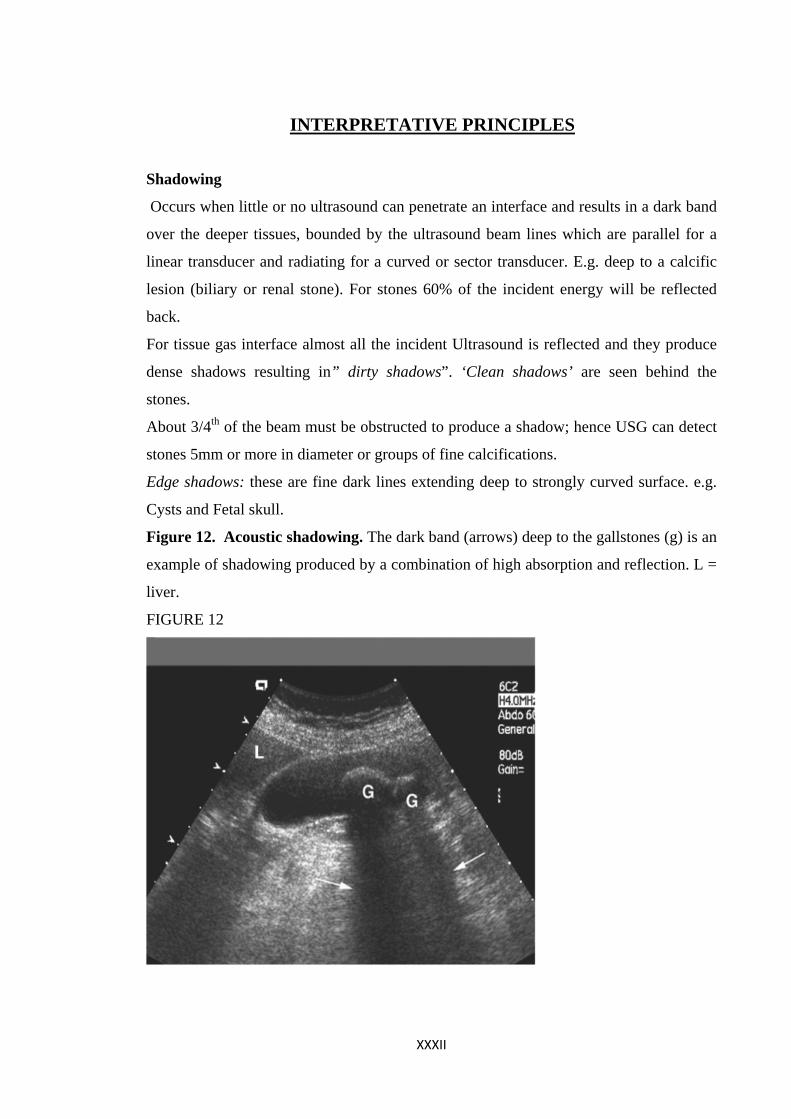
Shadowing
Occurs when little or no ultrasound can penetrate an interface and results in a dark band
over the deeper tissues, bounded by the ultrasound beam lines which are parallel for a
linear transducer and radiating for a curved or sector transducer. E.g. deep to a calcific
lesion (biliary or renal stone). For stones 60% of the incident energy will be reflected
back.
For tissue gas interface almost all the incident Ultrasound is reflected and they produce
dense shadows resulting in” dirty shadows”. ‘Clean shadows’ are seen behind the
stones.
About 3/4th of the beam must be obstructed to produce a shadow; hence USG can detect
stones 5mm or more in diameter or groups of fine calcifications.
Edge shadows: these are fine dark lines extending deep to strongly curved surface. e.g.
Cysts and Fetal skull.
Figure 12. Acoustic shadowing. The dark band (arrows) deep to the gallstones (g) is an
example of shadowing produced by a combination of high absorption and reflection. L =
liver.
FIGURE 12
XXXII
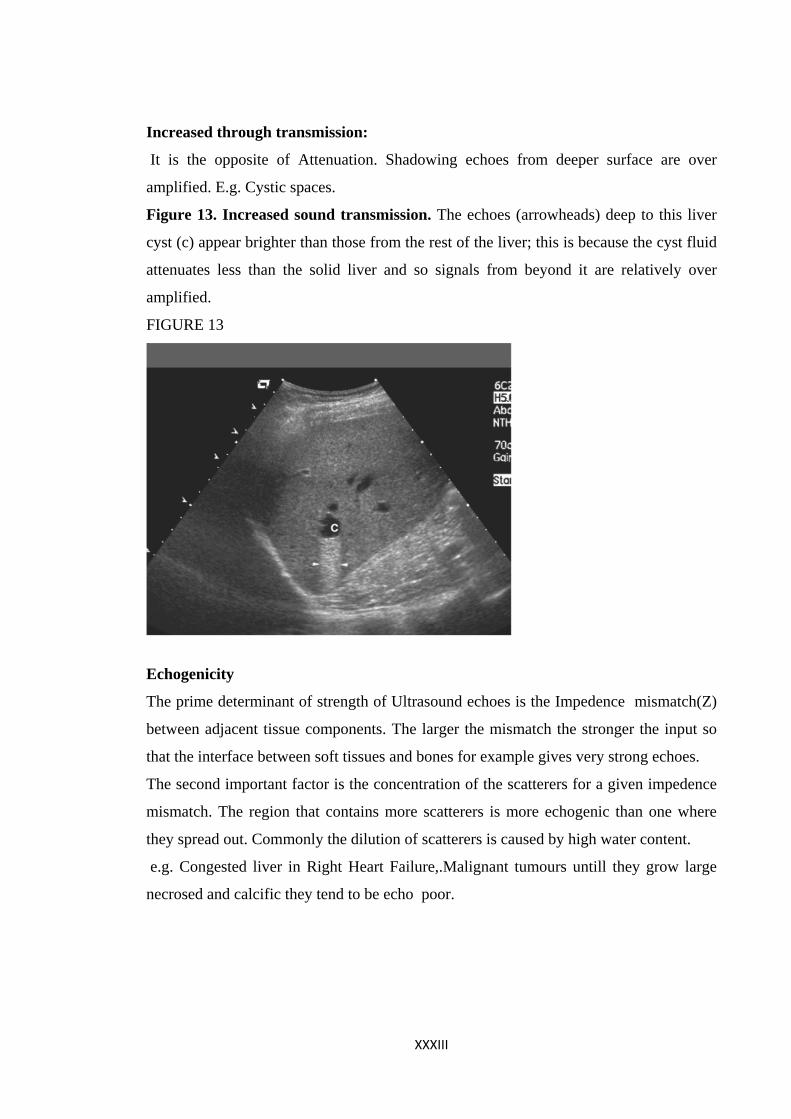
Increased through transmission:
It is the opposite of Attenuation. Shadowing echoes from deeper surface are over
amplified. E.g. Cystic spaces.
Figure 13. Increased sound transmission. The echoes (arrowheads) deep to this liver
cyst (c) appear brighter than those from the rest of the liver; this is because the cyst fluid
attenuates less than the solid liver and so signals from beyond it are relatively over
amplified.
FIGURE 13
Echogenicity
The prime determinant of strength of Ultrasound echoes is the Impedence mismatch(Z)
between adjacent tissue components. The larger the mismatch the stronger the input so
that the interface between soft tissues and bones for example gives very strong echoes.
The second important factor is the concentration of the scatterers for a given impedence
mismatch. The region that contains more scatterers is more echogenic than one where
they spread out. Commonly the dilution of scatterers is caused by high water content.
e.g. Congested liver in Right Heart Failure,.Malignant tumours untill they grow large
necrosed and calcific they tend to be echo poor.
XXXIII
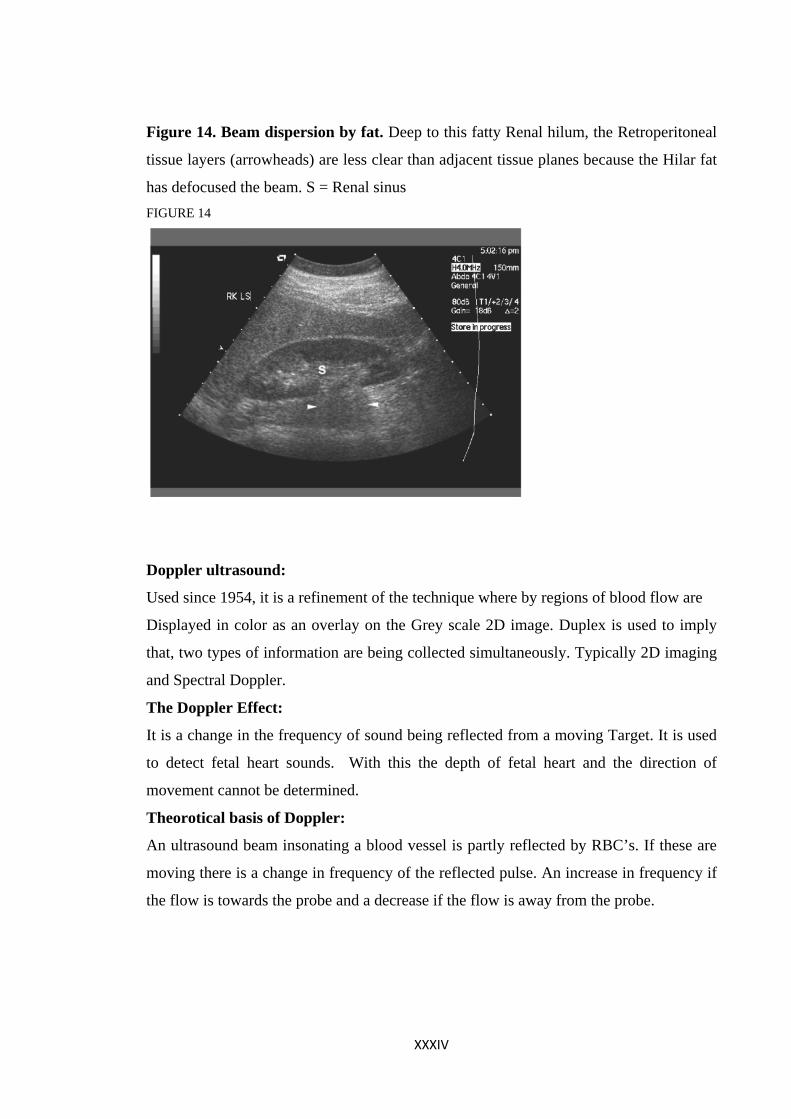
Figure 14. Beam dispersion by fat. Deep to this fatty Renal hilum, the Retroperitoneal
tissue layers (arrowheads) are less clear than adjacent tissue planes because the Hilar fat
has defocused the beam. S = Renal sinus FIGURE 14
Doppler ultrasound:
Used since 1954, it is a refinement of the technique where by regions of blood flow are
Displayed in color as an overlay on the Grey scale 2D image. Duplex is used to imply
that, two types of information are being collected simultaneously. Typically 2D imaging
and Spectral Doppler.
The Doppler Effect:
It is a change in the frequency of sound being reflected from a moving Target. It is used
to detect fetal heart sounds. With this the depth of fetal heart and the direction of
movement cannot be determined.
Theorotical basis of Doppler:
An ultrasound beam insonating a blood vessel is partly reflected by RBC’s. If these are
moving there is a change in frequency of the reflected pulse. An increase in frequency if
the flow is towards the probe and a decrease if the flow is away from the probe.
XXXIV
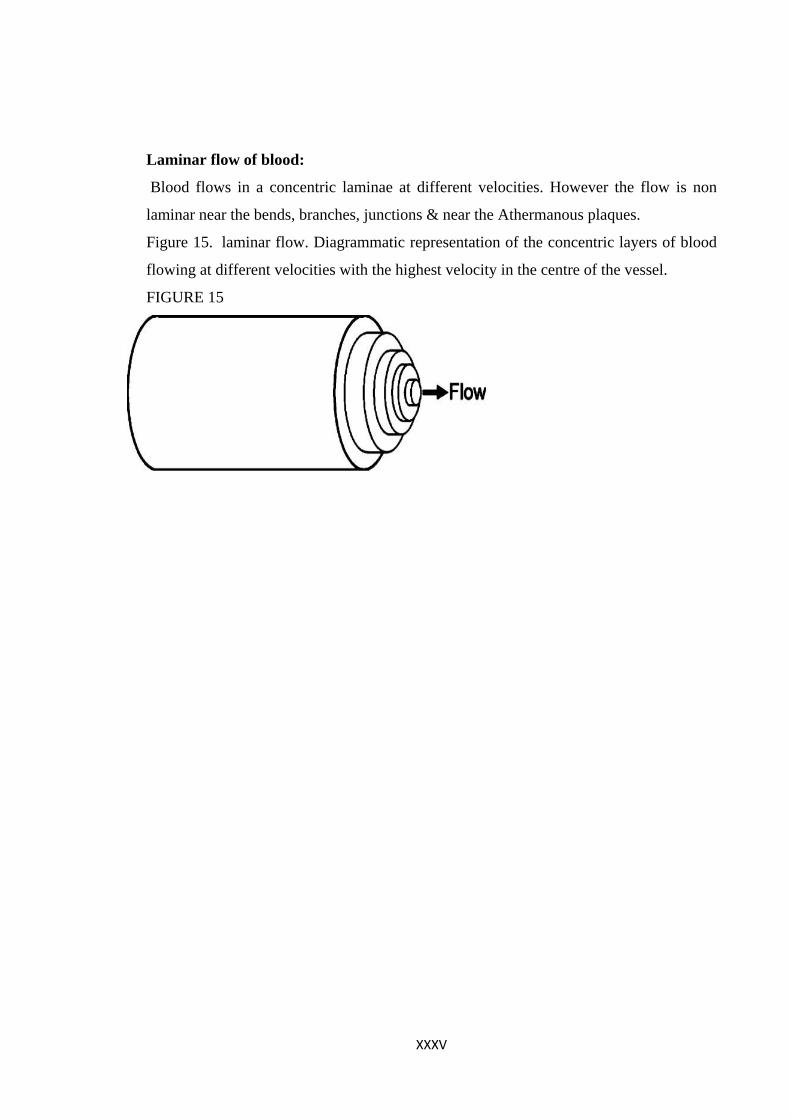
Laminar flow of blood:
Blood flows in a concentric laminae at different velocities. However the flow is non
laminar near the bends, branches, junctions & near the Athermanous plaques.
Figure 15. laminar flow. Diagrammatic representation of the concentric layers of blood
flowing at different velocities with the highest velocity in the centre of the vessel.
FIGURE 15
XXXV
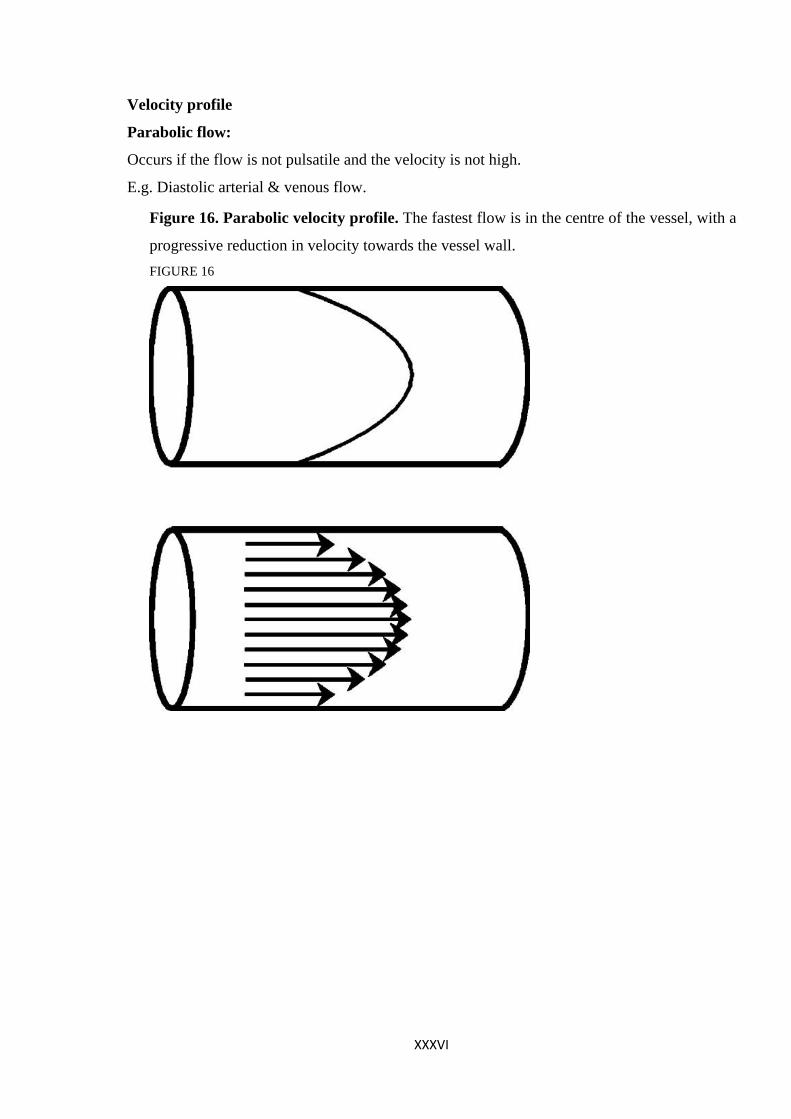
Velocity profile
Parabolic flow:
Occurs if the flow is not pulsatile and the velocity is not high.
E.g. Diastolic arterial & venous flow.
Figure 16. Parabolic velocity profile. The fastest flow is in the centre of the vessel, with a
progressive reduction in velocity towards the vessel wall. FIGURE 16
XXXVI
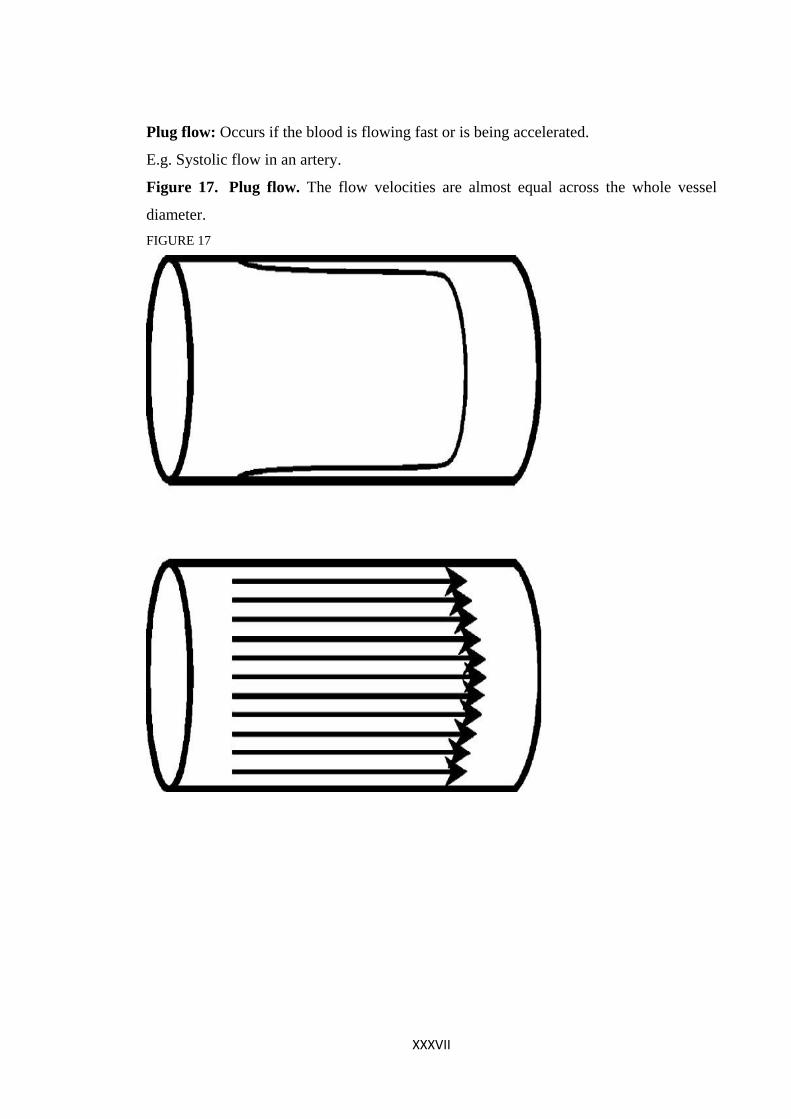
Plug flow: Occurs if the blood is flowing fast or is being accelerated.
E.g. Systolic flow in an artery.
Figure 17. Plug flow. The flow velocities are almost equal across the whole vessel
diameter. FIGURE 17
XXXVII
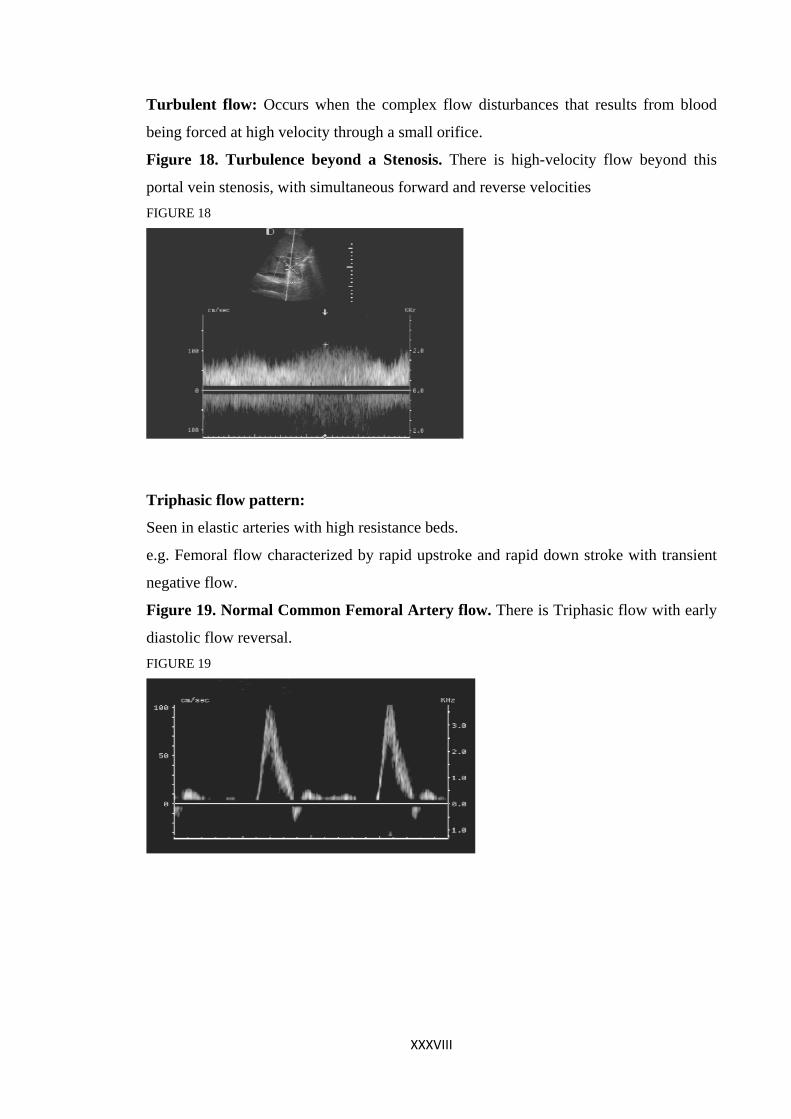
Turbulent flow: Occurs when the complex flow disturbances that results from blood
being forced at high velocity through a small orifice.
Figure 18. Turbulence beyond a Stenosis. There is high-velocity flow beyond this
portal vein stenosis, with simultaneous forward and reverse velocities FIGURE 18
Triphasic flow pattern:
Seen in elastic arteries with high resistance beds.
e.g. Femoral flow characterized by rapid upstroke and rapid down stroke with transient
negative flow.
Figure 19. Normal Common Femoral Artery flow. There is Triphasic flow with early
diastolic flow reversal. FIGURE 19
XXXVIII
Uniphasic flow pattern:
In this forward flow is seen throughout the Diastole. E.g. Internal Carotid, Hepatic &
Renal arteries. In an arterial stenosis, depending on the cross sectional area and the
diameter of the lumen occlusion, the following can occur.
A. Moderate spectral broadening.
B. Complete spectral broadening.
C. Turbulence beyond a stenosis.
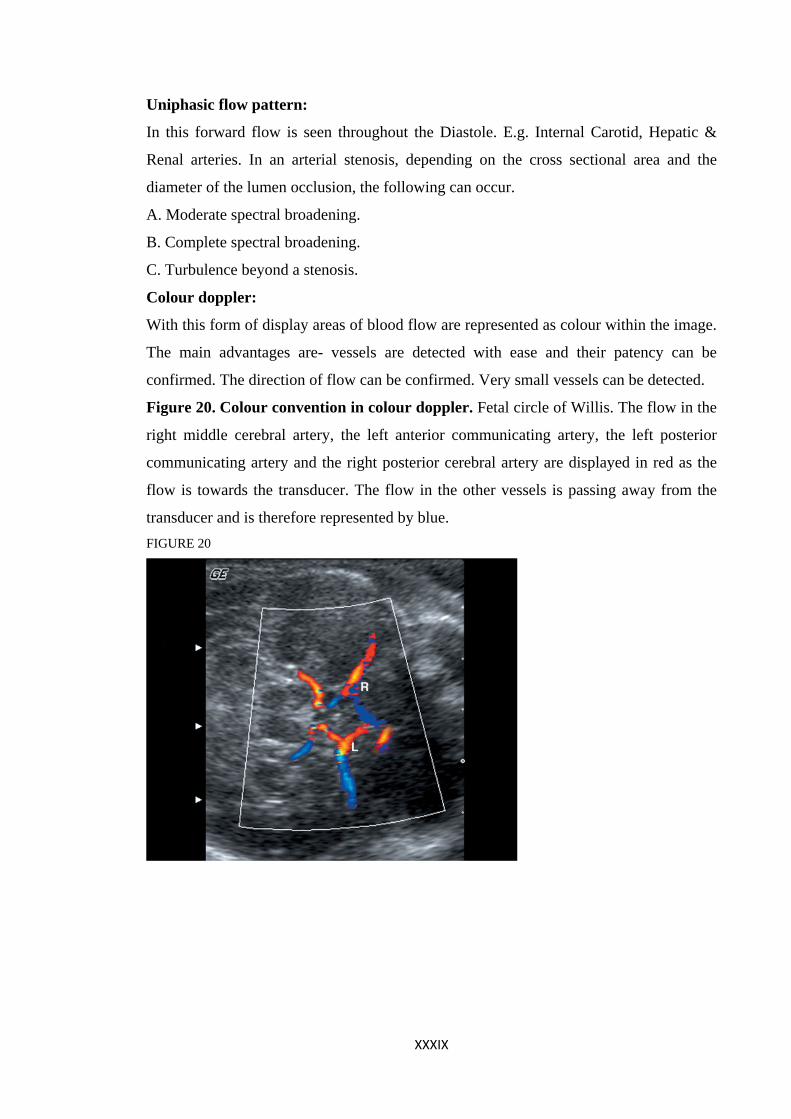
Colour doppler:
With this form of display areas of blood flow are represented as colour within the image.
The main advantages are- vessels are detected with ease and their patency can be
confirmed. The direction of flow can be confirmed. Very small vessels can be detected.
Figure 20. Colour convention in colour doppler. Fetal circle of Willis. The flow in the
right middle cerebral artery, the left anterior communicating artery, the left posterior
communicating artery and the right posterior cerebral artery are displayed in red as the
flow is towards the transducer. The flow in the other vessels is passing away from the
transducer and is therefore represented by blue. FIGURE 20
XXXIX
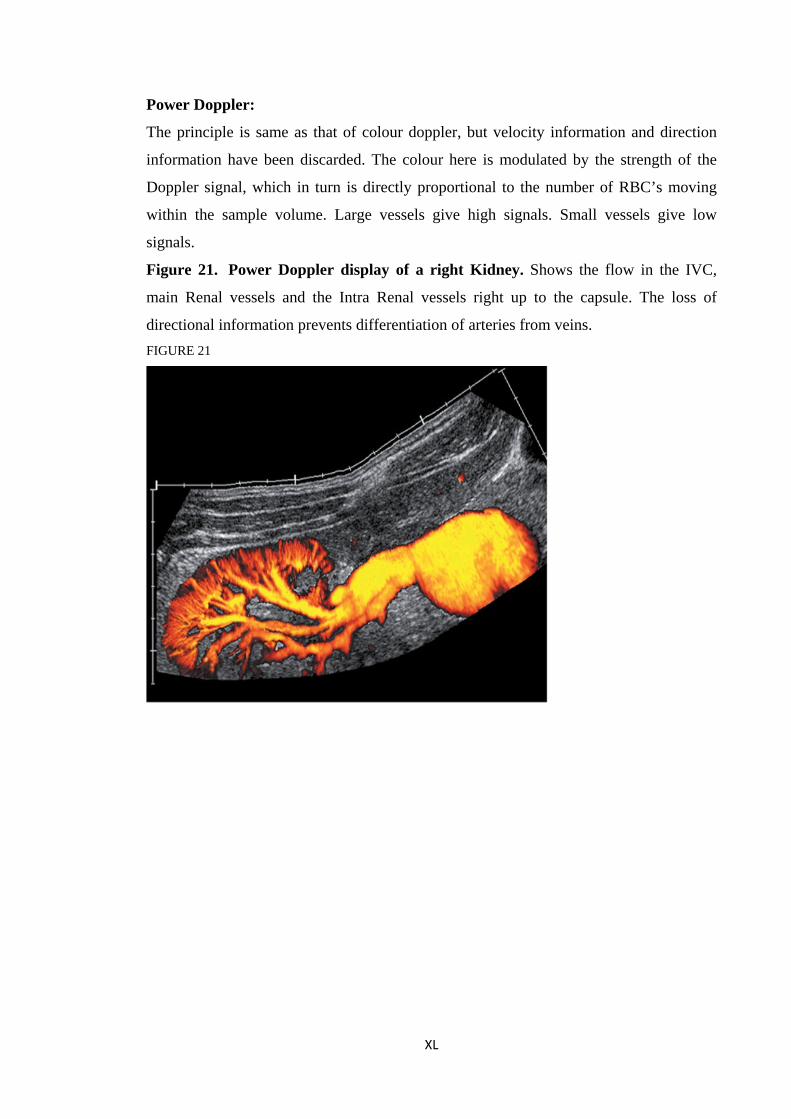
Power Doppler:
The principle is same as that of colour doppler, but velocity information and direction
information have been discarded. The colour here is modulated by the strength of the
Doppler signal, which in turn is directly proportional to the number of RBC’s moving
within the sample volume. Large vessels give high signals. Small vessels give low
signals.
Figure 21. Power Doppler display of a right Kidney. Shows the flow in the IVC,
main Renal vessels and the Intra Renal vessels right up to the capsule. The loss of
directional information prevents differentiation of arteries from veins. FIGURE 21
XL
XLI
DOPPLER ARTEFACTS, ERRORS & PIT FALLS Sample volume, size & position:
If the sample volume is too small or does not encompass the whole cross section of the
vessel, the resulting spectrum underestimates the range of velocities present within the
vessel. If the sample volume is small and the vessel to be studied is mobile, a
discontinuous Doppler signal results. If the range gate or beam widths are too large,
more than one vessel may lie in the beam, at the same time and give rise to a confusing
spectral display especially if the flow in both the vessels is in the same direction.
Sometimes such a feature is advantageous.
E.g. When searching for renal vein alongside a renal artery.
Velocity information:
An important source of error when attempting a velocity calculation is the effect of beam
or vessel angle. At angles >50 degrees there is a rapid increase in the error that
approaches 100% at 80 degrees.
Aliasing:
Pulse repetation frequency of the ultrasound system imposes limitations on the range of
Doppler frequency that can be measured. In order to allow time for the echoes to be
received before the next pulse is transmitted about 250 microseconds must elapse
between pulses. Thus the pulses can only be repeated at about 4000/s. The Doppler
detectors can only measure frequencies accurately if they are less than half of pulse
repetation frequency (nyquist limit) i.e. <2 kHz. Doppler shift frequencies above this
level are frequently encountered in the abdomen and are misinterpreted by the apparatus
and displayed on the wrong side of the baseline, giving rise to a characteristic
discontinuous wave form display. This is known as aliasing. It may be overcome by
measuring the vessel from a steeper angle, using lower US frequency, a high PRF or
Doppler beam or by electronic correction.
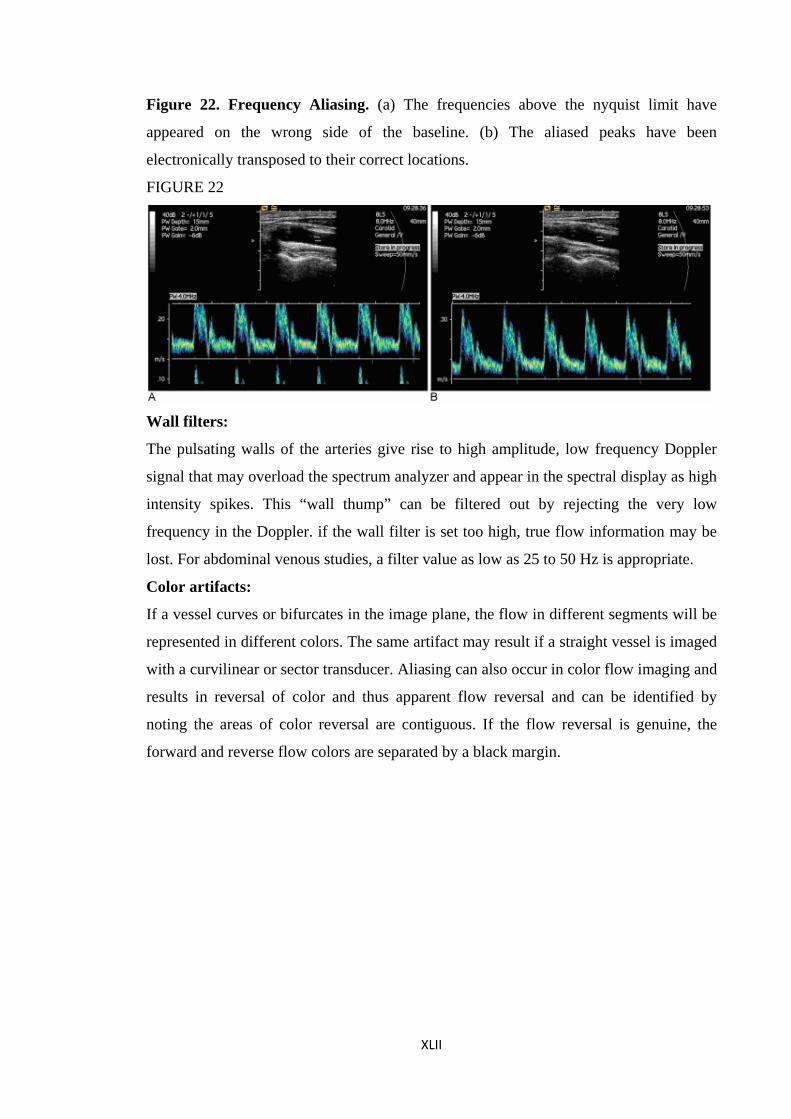
Figure 22. Frequency Aliasing. (a) The frequencies above the nyquist limit have
appeared on the wrong side of the baseline. (b) The aliased peaks have been
electronically transposed to their correct locations.
FIGURE 22
Wall filters:
The pulsating walls of the arteries give rise to high amplitude, low frequency Doppler
signal that may overload the spectrum analyzer and appear in the spectral display as high
intensity spikes. This “wall thump” can be filtered out by rejecting the very low
frequency in the Doppler. if the wall filter is set too high, true flow information may be
lost. For abdominal venous studies, a filter value as low as 25 to 50 Hz is appropriate.
Color artifacts:
If a vessel curves or bifurcates in the image plane, the flow in different segments will be
represented in different colors. The same artifact may result if a straight vessel is imaged
with a curvilinear or sector transducer. Aliasing can also occur in color flow imaging and
results in reversal of color and thus apparent flow reversal and can be identified by
noting the areas of color reversal are contiguous. If the flow reversal is genuine, the
forward and reverse flow colors are separated by a black margin.
XLII
XLIII
Developments in ultrasound:
3d imaging:
Used to visualise the fetal face and uterus in coronal planes for developmental
anamolies.
Elasticity imaging or Elastography:
The principle here is to obtain signals before & after applying a distorting force ( stress)
that moves the tissues by a few mm and creates an image of the tissues response(strain)
by comparing the two.
Contrast agents:
Microbubble agents- to enhance ultrasound signals. Used in heart disease.
To detect hcc in cirrhotics. Etc.
Ultrasound therapy:
Used in tissue ablative therapy particularly in oncology.
Uses the thermal effects of high power ultrasound beam that are tightly focused, so that
very small target tissue regions can be heated and coagulated.
Ultrasound findings in different condition:
1) Acute Appendicitis:
USG is the initial screening modality of choice for the evaluation of suspected acute
appendicitis.2 the sensitivity & specificity & accuracy of USG in diagnosing Acute
Appendicits are 80 to 93% , 94 to 100% & 95 to 97% respectively.3 a 5 to 9mhz4
ultrasound probe is applied with gradually increased pressure (Puylaert method of graded
compression)5 over the right iliac fossa in order to displace the bowel loops and examine
the appendix.
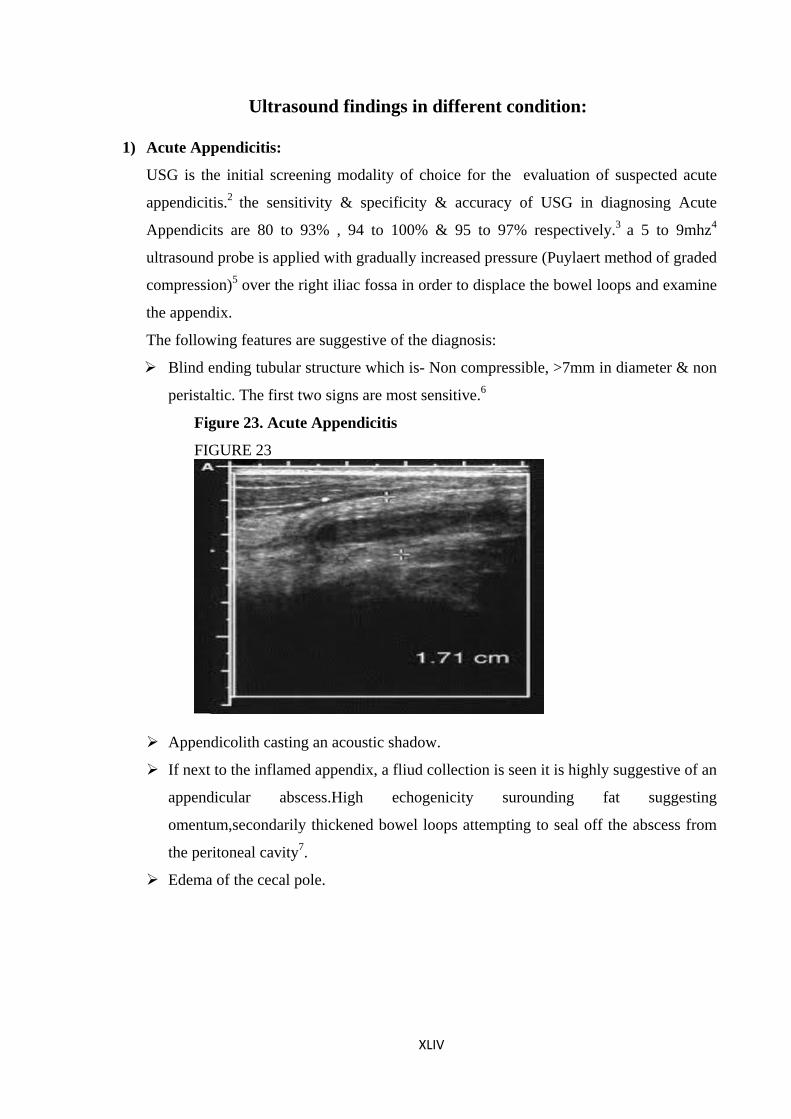
The following features are suggestive of the diagnosis:
Blind ending tubular structure which is- Non compressible, >7mm in diameter & non
peristaltic. The first two signs are most sensitive.6
Figure 23. Acute Appendicitis
FIGURE 23
Appendicolith casting an acoustic shadow.
If next to the inflamed appendix, a fliud collection is seen it is highly suggestive of an
appendicular abscess.High echogenicity surounding fat suggesting
omentum,secondarily thickened bowel loops attempting to seal off the abscess from
the peritoneal cavity7.
Edema of the cecal pole.
XLIV
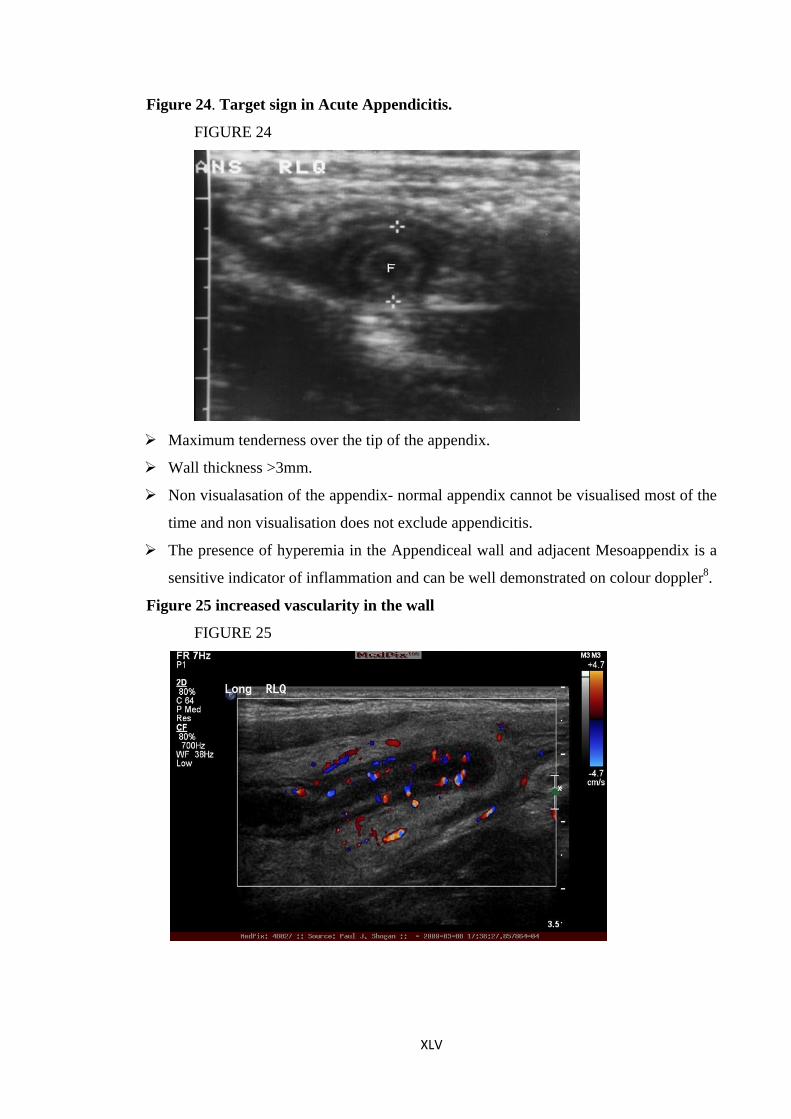
Figure 24. Target sign in Acute Appendicitis.
FIGURE 24
Maximum tenderness over the tip of the appendix.
Wall thickness >3mm.
Non visualasation of the appendix- normal appendix cannot be visualised most of the
time and non visualisation does not exclude appendicitis.
The presence of hyperemia in the Appendiceal wall and adjacent Mesoappendix is a
sensitive indicator of inflammation and can be well demonstrated on colour doppler8.
Figure 25 increased vascularity in the wall
FIGURE 25
XLV
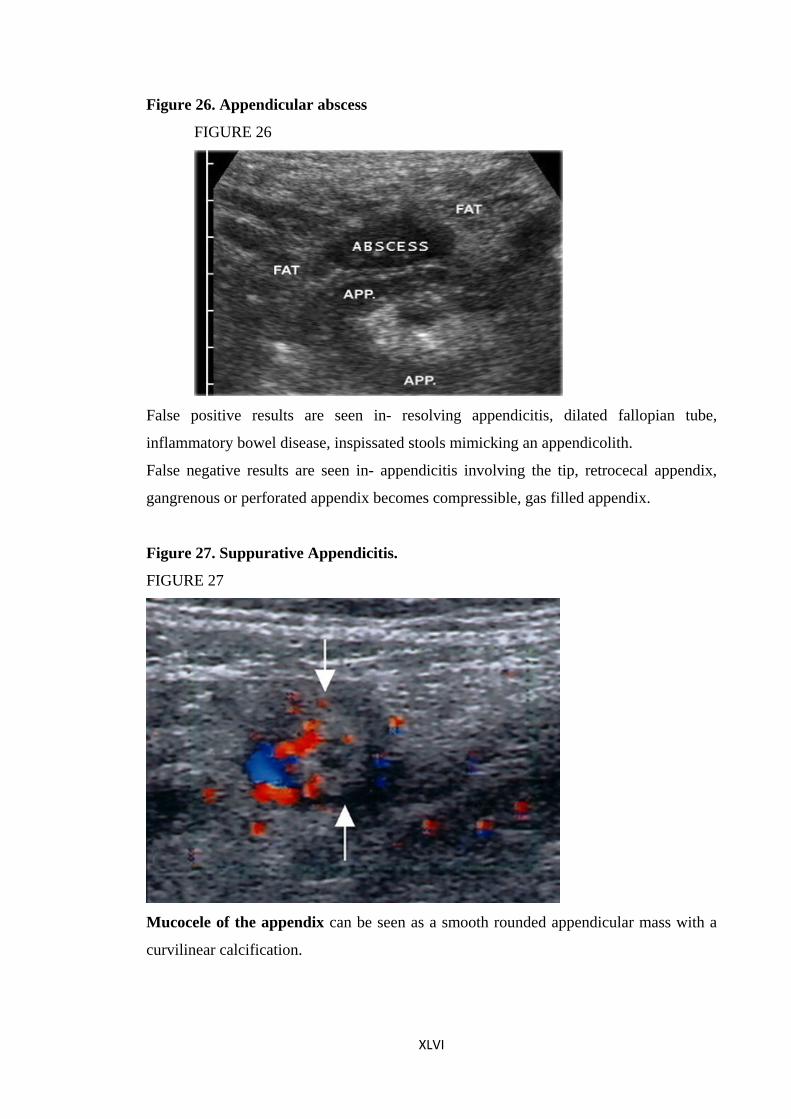
Figure 26. Appendicular abscess
FIGURE 26
False positive results are seen in- resolving appendicitis, dilated fallopian tube,
inflammatory bowel disease, inspissated stools mimicking an appendicolith.
False negative results are seen in- appendicitis involving the tip, retrocecal appendix,
gangrenous or perforated appendix becomes compressible, gas filled appendix.
Figure 27. Suppurative Appendicitis.
FIGURE 27
Mucocele of the appendix can be seen as a smooth rounded appendicular mass with a
curvilinear calcification.
XLVI
HEPATOBILIARY & PANCREATIC SYSTEM
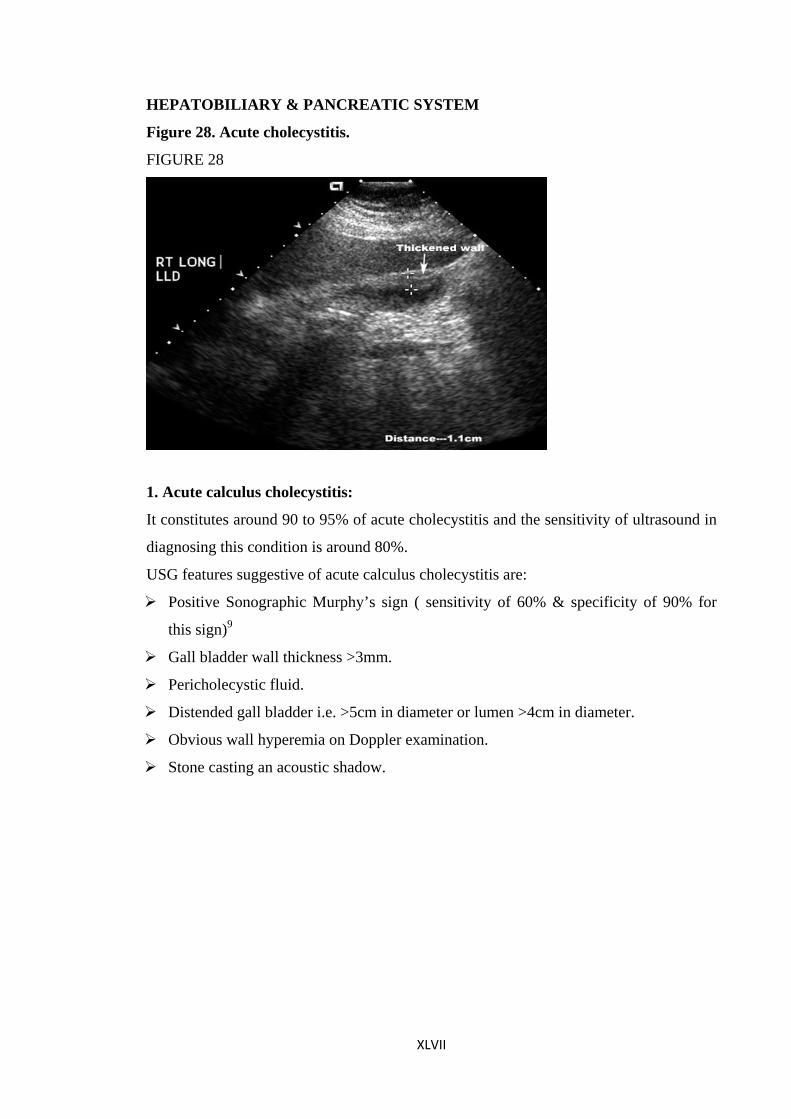
Figure 28. Acute cholecystitis.
FIGURE 28
1. Acute calculus cholecystitis:
It constitutes around 90 to 95% of acute cholecystitis and the sensitivity of ultrasound in
diagnosing this condition is around 80%.
USG features suggestive of acute calculus cholecystitis are:
Positive Sonographic Murphy’s sign ( sensitivity of 60% & specificity of 90% for
this sign)9
Gall bladder wall thickness >3mm.
Pericholecystic fluid.
Distended gall bladder i.e. >5cm in diameter or lumen >4cm in diameter.
Obvious wall hyperemia on Doppler examination.
Stone casting an acoustic shadow.
XLVII
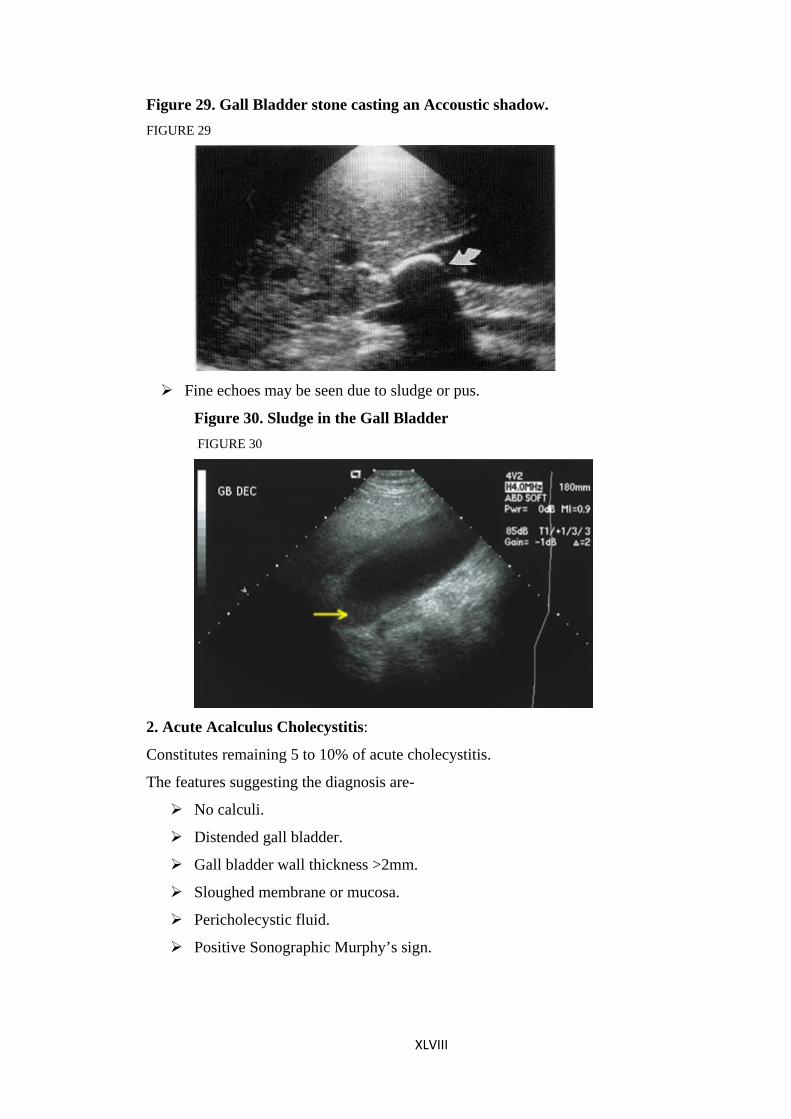
Figure 29. Gall Bladder stone casting an Accoustic shadow. FIGURE 29
Fine echoes may be seen due to sludge or pus.
Figure 30. Sludge in the Gall Bladder FIGURE 30
2. Acute Acalculus Cholecystitis:
Constitutes remaining 5 to 10% of acute cholecystitis.
The features suggesting the diagnosis are-
No calculi.
Distended gall bladder.
Gall bladder wall thickness >2mm.
Sloughed membrane or mucosa.
Pericholecystic fluid.
Positive Sonographic Murphy’s sign.
XLVIII
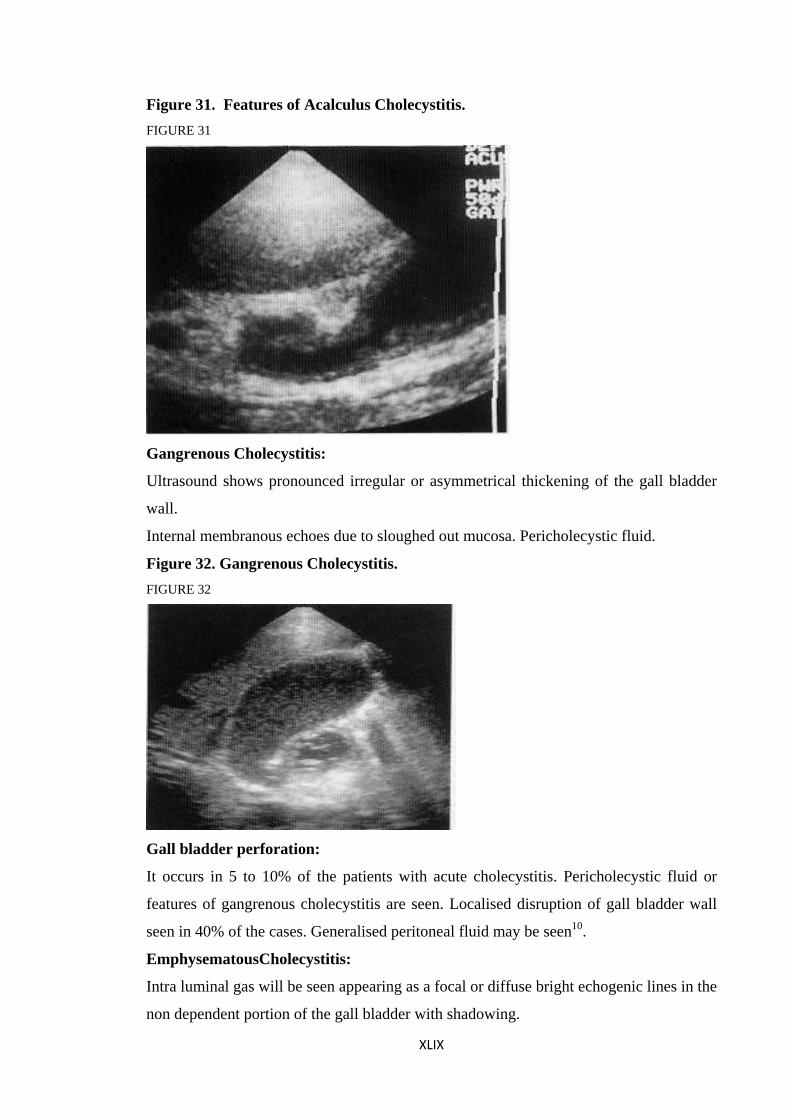
Figure 31. Features of Acalculus Cholecystitis. FIGURE 31
Gangrenous Cholecystitis:
Ultrasound shows pronounced irregular or asymmetrical thickening of the gall bladder
wall.
Internal membranous echoes due to sloughed out mucosa. Pericholecystic fluid.
Figure 32. Gangrenous Cholecystitis. FIGURE 32
Gall bladder perforation:
It occurs in 5 to 10% of the patients with acute cholecystitis. Pericholecystic fluid or
features of gangrenous cholecystitis are seen. Localised disruption of gall bladder wall
seen in 40% of the cases. Generalised peritoneal fluid may be seen10.
EmphysematousCholecystitis:
Intra luminal gas will be seen appearing as a focal or diffuse bright echogenic lines in the
non dependent portion of the gall bladder with shadowing.
XLIX
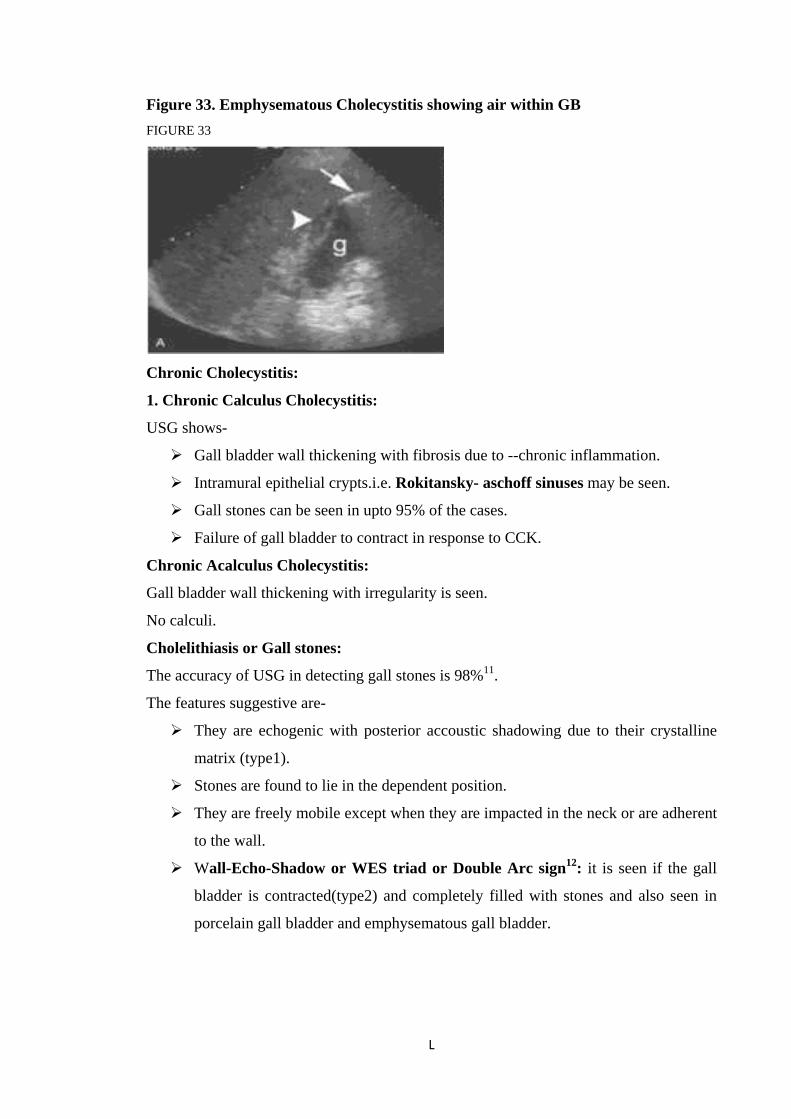
Figure 33. Emphysematous Cholecystitis showing air within GB FIGURE 33
Chronic Cholecystitis:
1. Chronic Calculus Cholecystitis:
USG shows-
Gall bladder wall thickening with fibrosis due to --chronic inflammation.
Intramural epithelial crypts.i.e. Rokitansky- aschoff sinuses may be seen.
Gall stones can be seen in upto 95% of the cases.
Failure of gall bladder to contract in response to CCK.
Chronic Acalculus Cholecystitis:
Gall bladder wall thickening with irregularity is seen.
No calculi.
Cholelithiasis or Gall stones:
The accuracy of USG in detecting gall stones is 98%11.
The features suggestive are-
They are echogenic with posterior accoustic shadowing due to their crystalline
matrix (type1).
Stones are found to lie in the dependent position.
They are freely mobile except when they are impacted in the neck or are adherent
to the wall.
Wall-Echo-Shadow or WES triad or Double Arc sign12: it is seen if the gall
bladder is contracted(type2) and completely filled with stones and also seen in
porcelain gall bladder and emphysematous gall bladder.
L
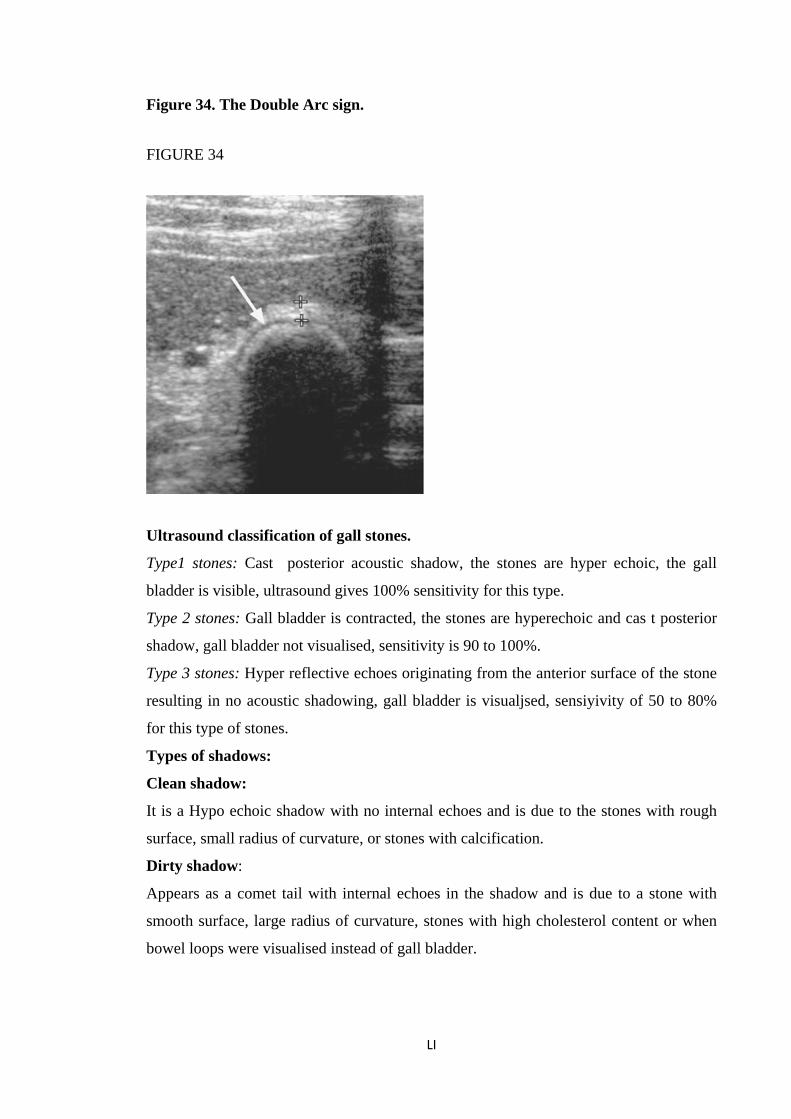
Figure 34. The Double Arc sign.
FIGURE 34
Ultrasound classification of gall stones.
Type1 stones: Cast posterior acoustic shadow, the stones are hyper echoic, the gall
bladder is visible, ultrasound gives 100% sensitivity for this type.
Type 2 stones: Gall bladder is contracted, the stones are hyperechoic and cas t posterior
shadow, gall bladder not visualised, sensitivity is 90 to 100%.
Type 3 stones: Hyper reflective echoes originating from the anterior surface of the stone
resulting in no acoustic shadowing, gall bladder is visualjsed, sensiyivity of 50 to 80%
for this type of stones.
Types of shadows:
Clean shadow:
It is a Hypo echoic shadow with no internal echoes and is due to the stones with rough
surface, small radius of curvature, or stones with calcification.
Dirty shadow:
Appears as a comet tail with internal echoes in the shadow and is due to a stone with
smooth surface, large radius of curvature, stones with high cholesterol content or when
bowel loops were visualised instead of gall bladder.
LI
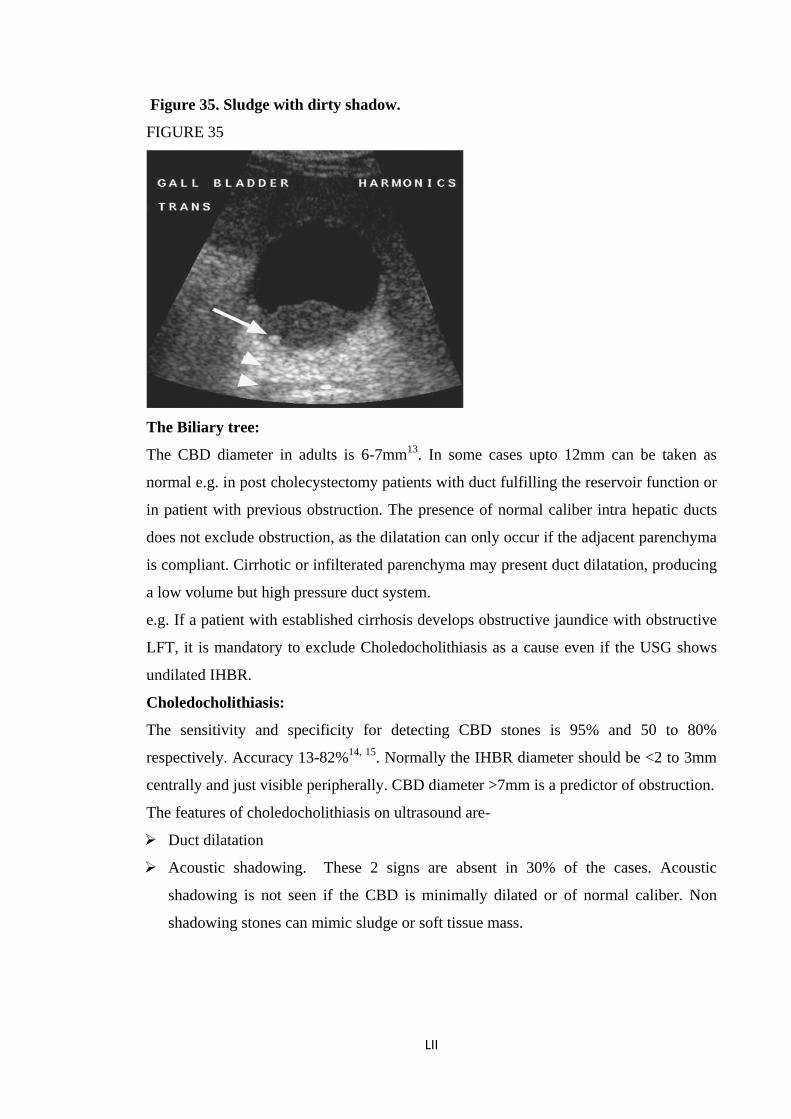
Figure 35. Sludge with dirty shadow.
FIGURE 35
The Biliary tree:
The CBD diameter in adults is 6-7mm13. In some cases upto 12mm can be taken as
normal e.g. in post cholecystectomy patients with duct fulfilling the reservoir function or
in patient with previous obstruction. The presence of normal caliber intra hepatic ducts
does not exclude obstruction, as the dilatation can only occur if the adjacent parenchyma
is compliant. Cirrhotic or infilterated parenchyma may present duct dilatation, producing
a low volume but high pressure duct system.
e.g. If a patient with established cirrhosis develops obstructive jaundice with obstructive
LFT, it is mandatory to exclude Choledocholithiasis as a cause even if the USG shows
undilated IHBR.
Choledocholithiasis:
The sensitivity and specificity for detecting CBD stones is 95% and 50 to 80%
respectively. Accuracy 13-82%14, 15. Normally the IHBR diameter should be <2 to 3mm
centrally and just visible peripherally. CBD diameter >7mm is a predictor of obstruction.
The features of choledocholithiasis on ultrasound are-
Duct dilatation
Acoustic shadowing. These 2 signs are absent in 30% of the cases. Acoustic
shadowing is not seen if the CBD is minimally dilated or of normal caliber. Non
shadowing stones can mimic sludge or soft tissue mass.
LII
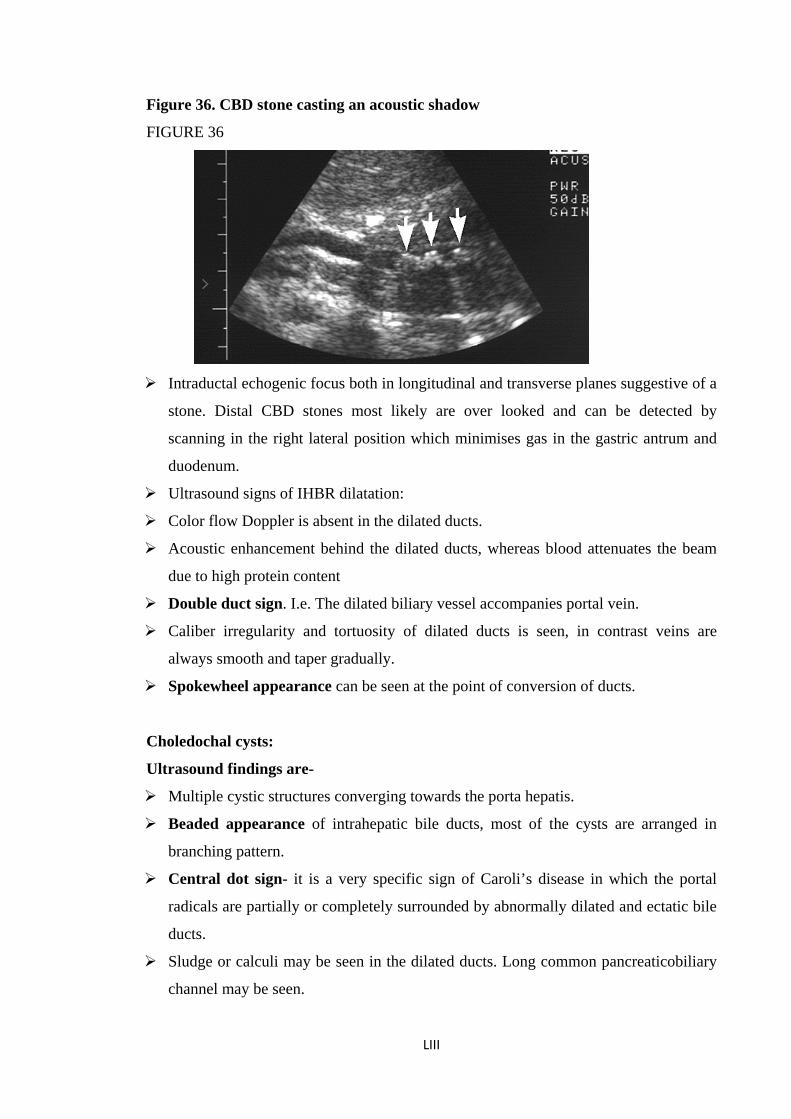
Figure 36. CBD stone casting an acoustic shadow
FIGURE 36
Intraductal echogenic focus both in longitudinal and transverse planes suggestive of a
stone. Distal CBD stones most likely are over looked and can be detected by
scanning in the right lateral position which minimises gas in the gastric antrum and
duodenum.
Ultrasound signs of IHBR dilatation:
Color flow Doppler is absent in the dilated ducts.
Acoustic enhancement behind the dilated ducts, whereas blood attenuates the beam
due to high protein content
Double duct sign. I.e. The dilated biliary vessel accompanies portal vein.
Caliber irregularity and tortuosity of dilated ducts is seen, in contrast veins are
always smooth and taper gradually.
Spokewheel appearance can be seen at the point of conversion of ducts.
Choledochal cysts:
Ultrasound findings are-
Multiple cystic structures converging towards the porta hepatis.
Beaded appearance of intrahepatic bile ducts, most of the cysts are arranged in
branching pattern.
Central dot sign- it is a very specific sign of Caroli’s disease in which the portal
radicals are partially or completely surrounded by abnormally dilated and ectatic bile
ducts.
Sludge or calculi may be seen in the dilated ducts. Long common pancreaticobiliary
channel may be seen.
LIII

Ultrasound reveals an anechoic cystic structure separate from gall bladder that
communicates with hepatic ducts.16,17
Figure 37 choledochal cyst
The pancreas:
The pancreas is visualised using a curved array transducer with magnifying 3.8MHz
frequency. Ingestion of 250 ml of water will act as an acoustic window. In standing
position, the pancreas which is a retroperitoneal structure remains fixed and stomach &
liver will descend and act as an acoustic window. This may allow gas and fecal matter in
the transverse colon to descend down to allow better visualisation.
Normal Anatomy:
Pancreas is visualised as a comma shaped structure draped over the anterior surface of
the Aorta, IVC or Anterior Aortic branches, the tail extends into the Splenic Hilum
which is difficult to visualise by USG due to bowel gas. There is a gradual increase in
the echogenicity of the pancreas after the age of 40 due to increased fat deposition. The
deposition is less in the ventral pancreas, and hence the difference in the echogenicity
may be visualised as a pseudo mass effect.
The pancreatic duct: the normal PD is rarely seen in its entirity in young individuals,
segments of the duct may be visualised as the duct courses in and out of the plane of
scan. They appear as short segment parallel lines measuring <1mm in diameter.
Size of PD in different age groups- 18 to 29yrs -1.5mm
40 to49yrs -1.9mm
>80yrs -2.3mm
LIV
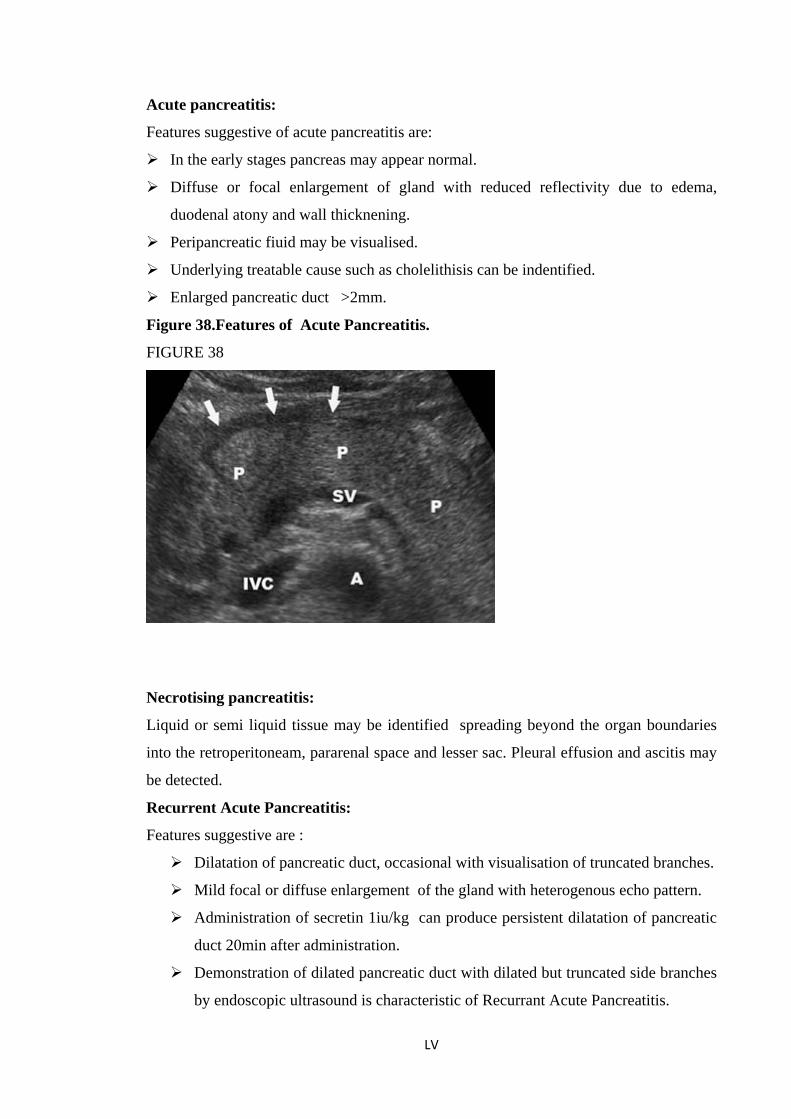
Acute pancreatitis:
Features suggestive of acute pancreatitis are:
In the early stages pancreas may appear normal.
Diffuse or focal enlargement of gland with reduced reflectivity due to edema,
duodenal atony and wall thicknening.
Peripancreatic fiuid may be visualised.
Underlying treatable cause such as cholelithisis can be indentified.
Enlarged pancreatic duct >2mm.
Figure 38.Features of Acute Pancreatitis.
FIGURE 38
Necrotising pancreatitis:
Liquid or semi liquid tissue may be identified spreading beyond the organ boundaries
into the retroperitoneam, pararenal space and lesser sac. Pleural effusion and ascitis may
be detected.
Recurrent Acute Pancreatitis:
Features suggestive are :
Dilatation of pancreatic duct, occasional with visualisation of truncated branches.
Mild focal or diffuse enlargement of the gland with heterogenous echo pattern.
Administration of secretin 1iu/kg can produce persistent dilatation of pancreatic
duct 20min after administration.
Demonstration of dilated pancreatic duct with dilated but truncated side branches
by endoscopic ultrasound is characteristic of Recurrant Acute Pancreatitis.
LV
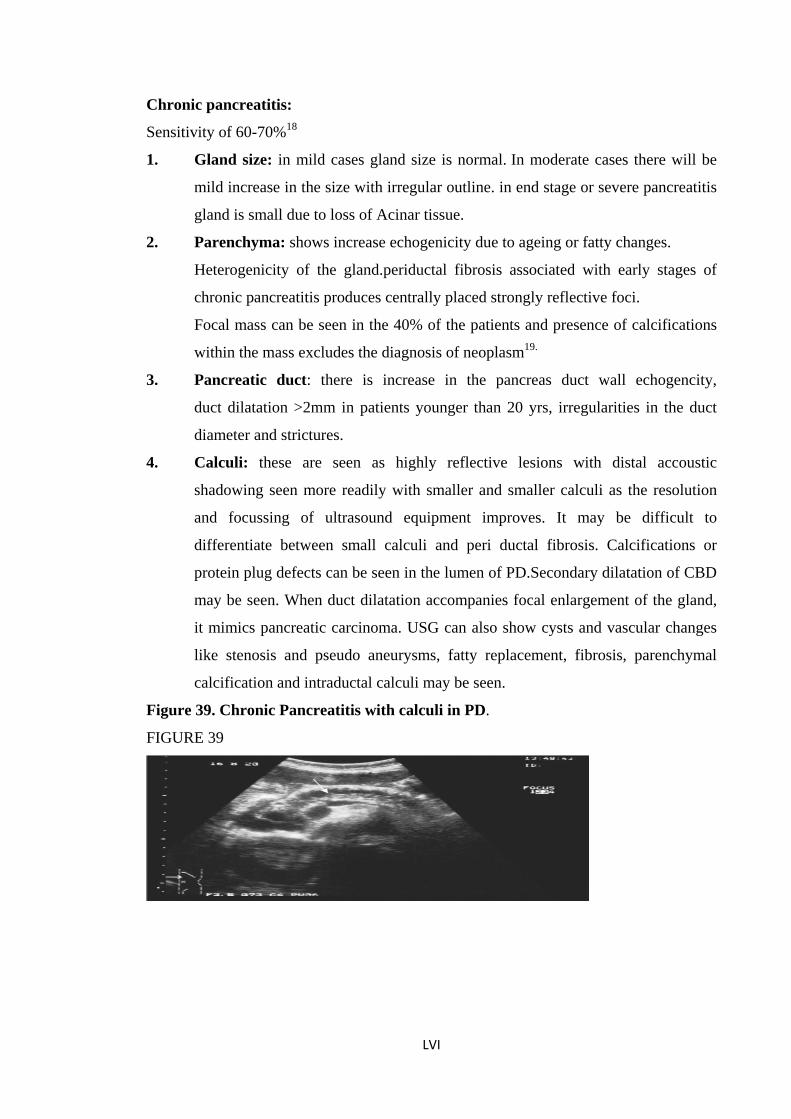
Chronic pancreatitis:
Sensitivity of 60-70%18
1. Gland size: in mild cases gland size is normal. In moderate cases there will be
mild increase in the size with irregular outline. in end stage or severe pancreatitis
gland is small due to loss of Acinar tissue.
2. Parenchyma: shows increase echogenicity due to ageing or fatty changes.
Heterogenicity of the gland.periductal fibrosis associated with early stages of
chronic pancreatitis produces centrally placed strongly reflective foci.
Focal mass can be seen in the 40% of the patients and presence of calcifications
within the mass excludes the diagnosis of neoplasm19.
3. Pancreatic duct: there is increase in the pancreas duct wall echogencity,
duct dilatation >2mm in patients younger than 20 yrs, irregularities in the duct
diameter and strictures.
4. Calculi: these are seen as highly reflective lesions with distal accoustic
shadowing seen more readily with smaller and smaller calculi as the resolution
and focussing of ultrasound equipment improves. It may be difficult to
differentiate between small calculi and peri ductal fibrosis. Calcifications or
protein plug defects can be seen in the lumen of PD.Secondary dilatation of CBD
may be seen. When duct dilatation accompanies focal enlargement of the gland,
it mimics pancreatic carcinoma. USG can also show cysts and vascular changes
like stenosis and pseudo aneurysms, fatty replacement, fibrosis, parenchymal
calcification and intraductal calculi may be seen.
Figure 39. Chronic Pancreatitis with calculi in PD.
FIGURE 39
LVI
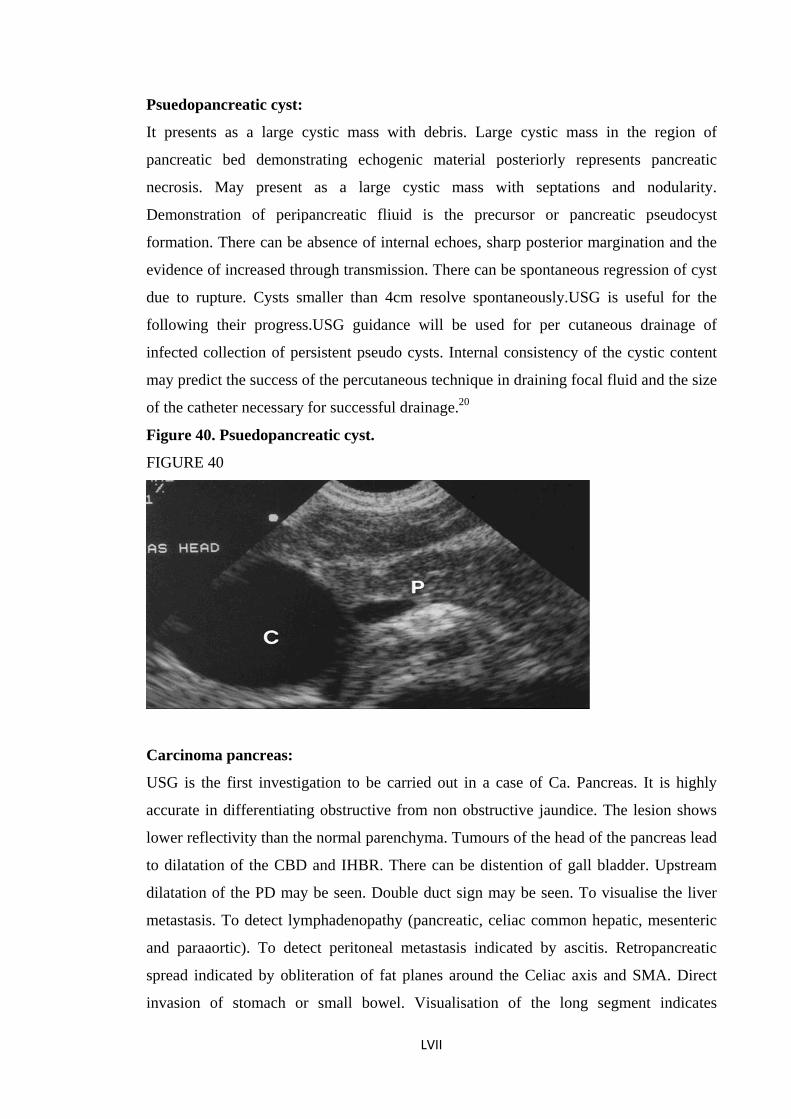
Psuedopancreatic cyst:
It presents as a large cystic mass with debris. Large cystic mass in the region of
pancreatic bed demonstrating echogenic material posteriorly represents pancreatic
necrosis. May present as a large cystic mass with septations and nodularity.
Demonstration of peripancreatic fliuid is the precursor or pancreatic pseudocyst
formation. There can be absence of internal echoes, sharp posterior margination and the
evidence of increased through transmission. There can be spontaneous regression of cyst
due to rupture. Cysts smaller than 4cm resolve spontaneously.USG is useful for the
following their progress.USG guidance will be used for per cutaneous drainage of
infected collection of persistent pseudo cysts. Internal consistency of the cystic content
may predict the success of the percutaneous technique in draining focal fluid and the size
of the catheter necessary for successful drainage.20
Figure 40. Psuedopancreatic cyst.
FIGURE 40
Carcinoma pancreas:
USG is the first investigation to be carried out in a case of Ca. Pancreas. It is highly
accurate in differentiating obstructive from non obstructive jaundice. The lesion shows
lower reflectivity than the normal parenchyma. Tumours of the head of the pancreas lead
to dilatation of the CBD and IHBR. There can be distention of gall bladder. Upstream
dilatation of the PD may be seen. Double duct sign may be seen. To visualise the liver
metastasis. To detect lymphadenopathy (pancreatic, celiac common hepatic, mesenteric
and paraaortic). To detect peritoneal metastasis indicated by ascitis. Retropancreatic
spread indicated by obliteration of fat planes around the Celiac axis and SMA. Direct
invasion of stomach or small bowel. Visualisation of the long segment indicates
LVII
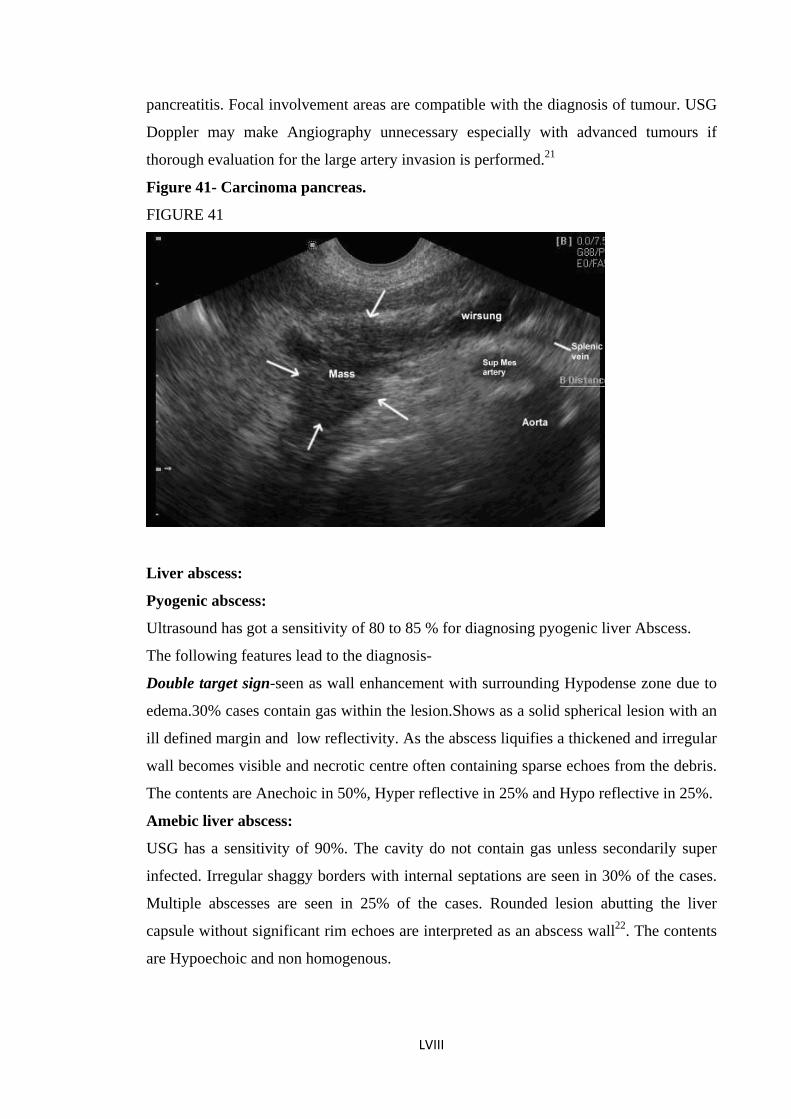
pancreatitis. Focal involvement areas are compatible with the diagnosis of tumour. USG
Doppler may make Angiography unnecessary especially with advanced tumours if
thorough evaluation for the large artery invasion is performed.21
Figure 41- Carcinoma pancreas.
FIGURE 41
Liver abscess:
Pyogenic abscess:
Ultrasound has got a sensitivity of 80 to 85 % for diagnosing pyogenic liver Abscess.
The following features lead to the diagnosis-
Double target sign-seen as wall enhancement with surrounding Hypodense zone due to
edema.30% cases contain gas within the lesion.Shows as a solid spherical lesion with an
ill defined margin and low reflectivity. As the abscess liquifies a thickened and irregular
wall becomes visible and necrotic centre often containing sparse echoes from the debris.
The contents are Anechoic in 50%, Hyper reflective in 25% and Hypo reflective in 25%.
Amebic liver abscess:
USG has a sensitivity of 90%. The cavity do not contain gas unless secondarily super
infected. Irregular shaggy borders with internal septations are seen in 30% of the cases.
Multiple abscesses are seen in 25% of the cases. Rounded lesion abutting the liver
capsule without significant rim echoes are interpreted as an abscess wall22. The contents
are Hypoechoic and non homogenous.
LVIII
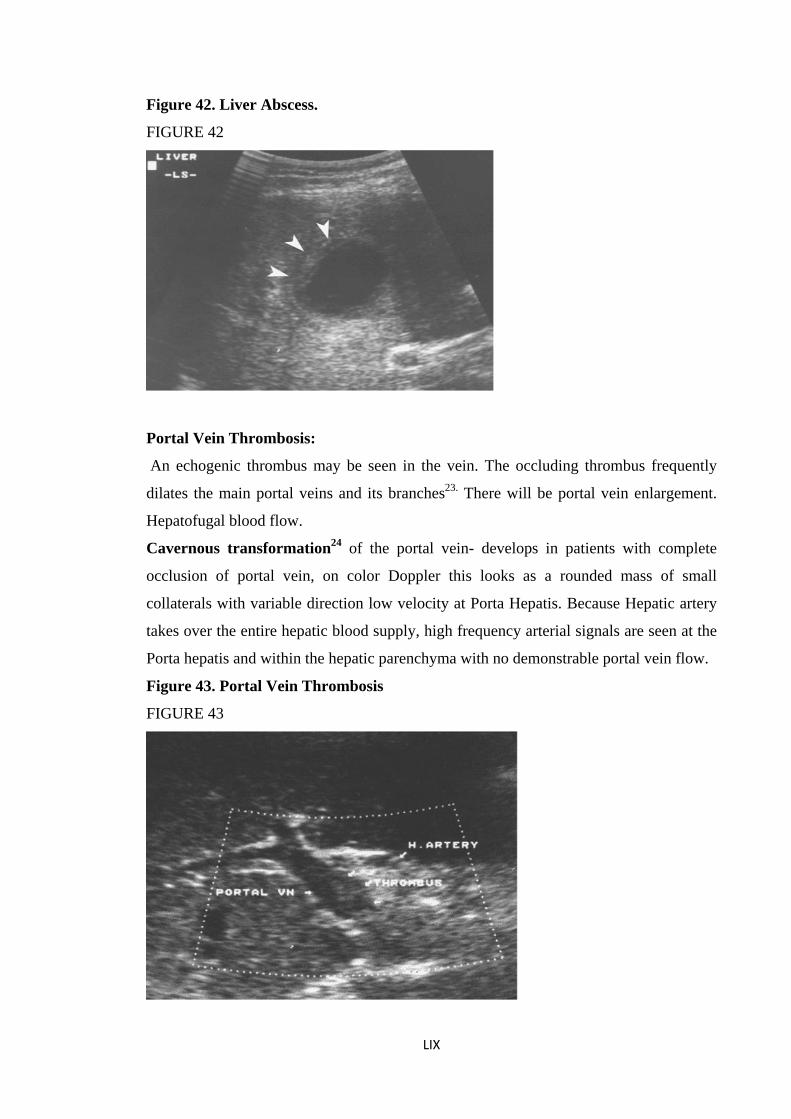
Figure 42. Liver Abscess.
FIGURE 42
Portal Vein Thrombosis:
An echogenic thrombus may be seen in the vein. The occluding thrombus frequently
dilates the main portal veins and its branches23. There will be portal vein enlargement.
Hepatofugal blood flow.
Cavernous transformation24 of the portal vein- develops in patients with complete
occlusion of portal vein, on color Doppler this looks as a rounded mass of small
collaterals with variable direction low velocity at Porta Hepatis. Because Hepatic artery
takes over the entire hepatic blood supply, high frequency arterial signals are seen at the
Porta hepatis and within the hepatic parenchyma with no demonstrable portal vein flow.
Figure 43. Portal Vein Thrombosis
FIGURE 43
LIX
Hepatic Vein Thrombosis or Budd Chiari Syndrome:
Thrombus may be identified within the hepatic veins. Lack of colour flow within the
normal vein24. Abnormal collateral vessels may be seen wading towards the surface of
the liver.
Flow in the IVC may be reversed, turbulent, diminished or absent. Flow in the portal
vein may be reversed or diminished. Intrahepatic collateral vessels i.e. comma shaped
venovenous intra hepatic collaterals, 25, 26, 27 may be seen between major hepatic veins.
Narrowing of intrahepatic IVC. Parenchyma shows hemorrhagic infarction, appears
Hypo echoic, caudate lobe is often spared and appears enlarged. There may be damping
of the normally pulsatile hepatic vein form.
Acute Cholangitis:
There may be dilatation of the IHBR and CBD in 70% of the cases.
Pigment stones or sludge may be seen in the intrahepatic bile ducts which is a
pathognomonic sign. Biliary strictures are seen 20% and segmental hepatic atrophy in
30%. Liver abscess or pancreatitis may be detected in few cases.
Subphrenic or Subhepatic Abscess: USG is an excellent modality for the detection of
visceral abscess and is also useful for the screening of intraperitoneal abscess.28 There
will be a transonic area between liver and diaphragm with strands crossing this area
indicating loculation. Helps in draining the abscess.
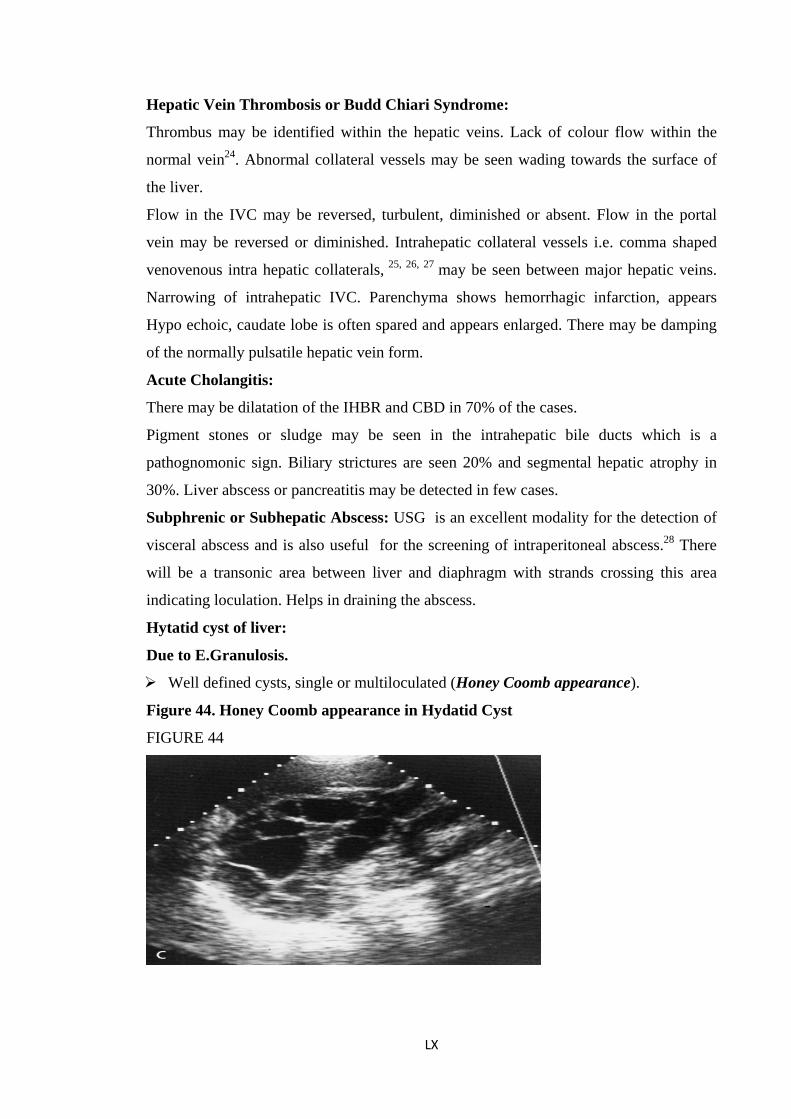
Hytatid cyst of liver:
Due to E.Granulosis.
Well defined cysts, single or multiloculated (Honey Coomb appearance).
Figure 44. Honey Coomb appearance in Hydatid Cyst
FIGURE 44
LX
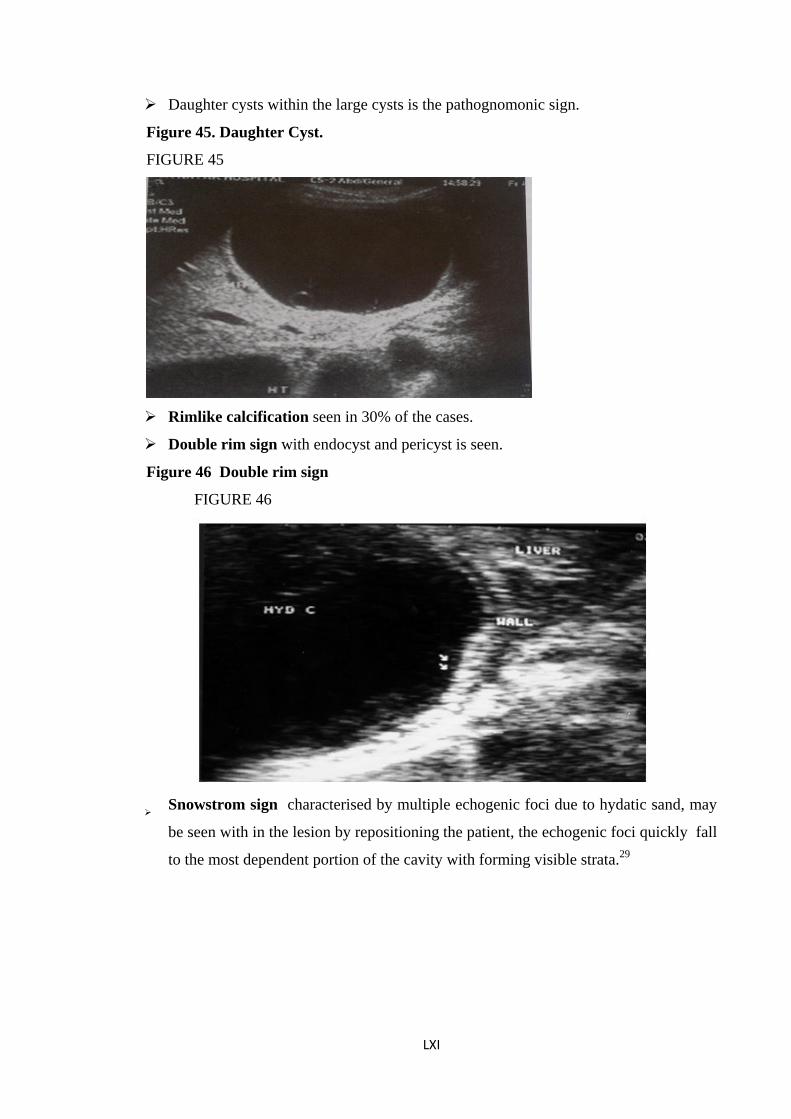
Daughter cysts within the large cysts is the pathognomonic sign.
Figure 45. Daughter Cyst.
FIGURE 45
Rimlike calcification seen in 30% of the cases.
Double rim sign with endocyst and pericyst is seen.
Figure 46 Double rim sign
FIGURE 46
Snowstrom sign characterised by multiple echogenic foci due to hydatic sand, may
be seen with in the lesion by repositioning the patient, the echogenic foci quickly fall
to the most dependent portion of the cavity with forming visible strata.29
LXI
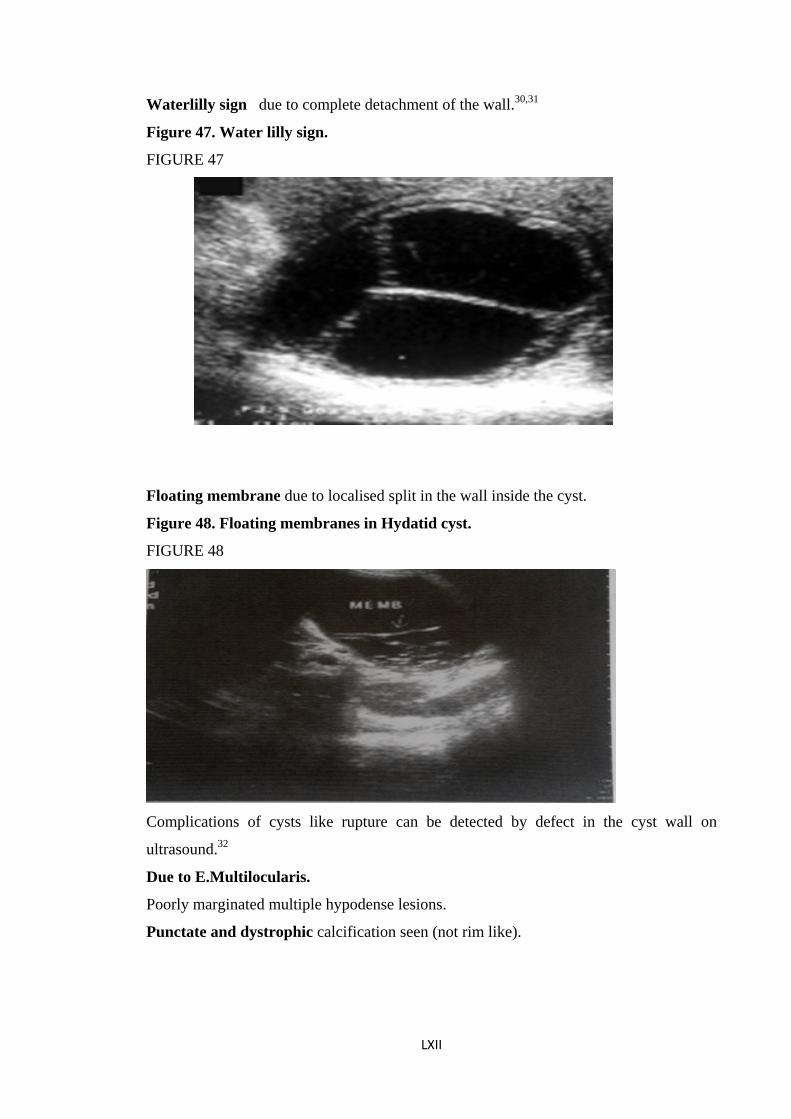
Waterlilly sign due to complete detachment of the wall.30,31
Figure 47. Water lilly sign.
FIGURE 47
Floating membrane due to localised split in the wall inside the cyst.
Figure 48. Floating membranes in Hydatid cyst.
FIGURE 48
Complications of cysts like rupture can be detected by defect in the cyst wall on
ultrasound.32
Due to E.Multilocularis.
Poorly marginated multiple hypodense lesions.
Punctate and dystrophic calcification seen (not rim like).
LXII
Hepatocellular Carcinoma:
Sensitivity of 74-94% Most small HCC’s appear hypoechoic, and the larger ones are
heterogenous. Fibrolamellar variety is heterogenous. By high velocity Doppler feeding
vessel can be visualised. Basket pattern of intralesional vessels can be detected
indicating internal vascularity and shunting may be seen in upto 15% of cases.33
Increased or decreased reflectivity of the lesion in relation to the surrounding
parenchyma. A reduced reflectivity seen in some cases represents thin fibrous capsule.
Large lesions show heterogeneity due to hemorrhage necrosis or fat. There may be
portal vein thrombosis or intravascular tumour. Doppler examination can differentiate
between the tumour and the thrombus as the presence of arterial signals within the
material occluding a portal vein indicates the presence of tumour34. High velocity
Doppler signals from within the lesion occur in majority as a result of arterioportal
shunting commonly found in HCC.
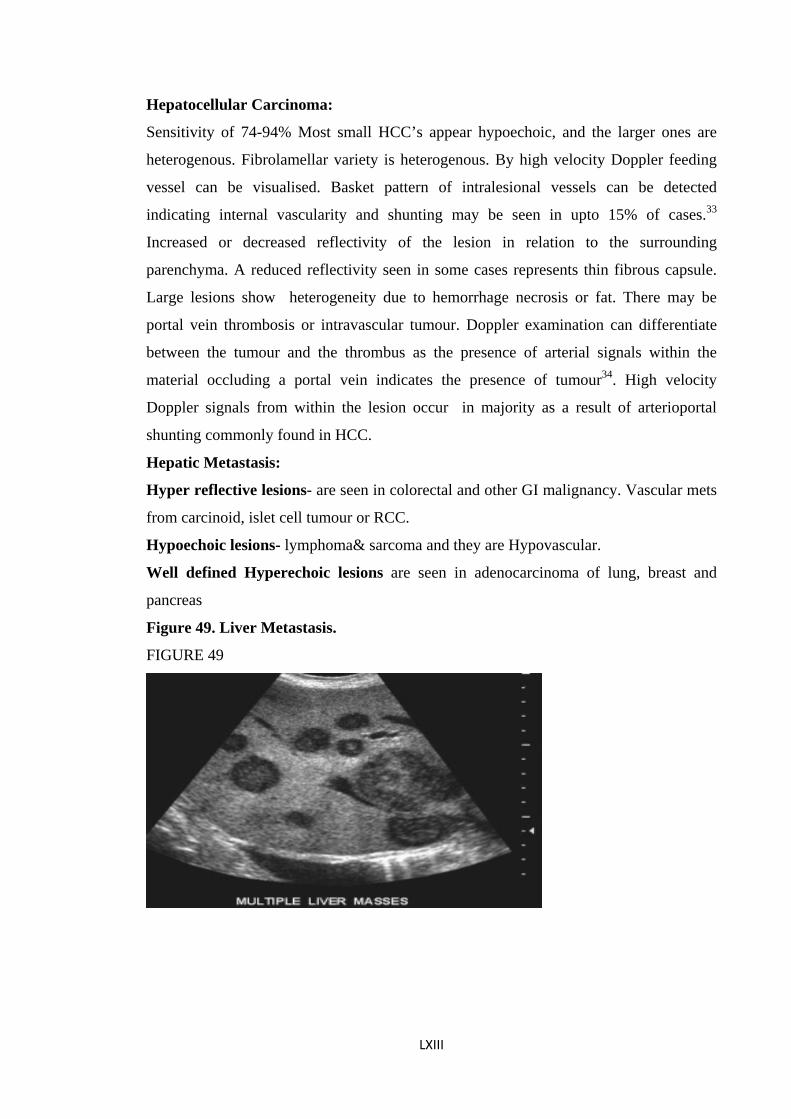
Hepatic Metastasis:
Hyper reflective lesions- are seen in colorectal and other GI malignancy. Vascular mets
from carcinoid, islet cell tumour or RCC.
Hypoechoic lesions- lymphoma& sarcoma and they are Hypovascular.
Well defined Hyperechoic lesions are seen in adenocarcinoma of lung, breast and
pancreas
Figure 49. Liver Metastasis.
FIGURE 49
LXIII
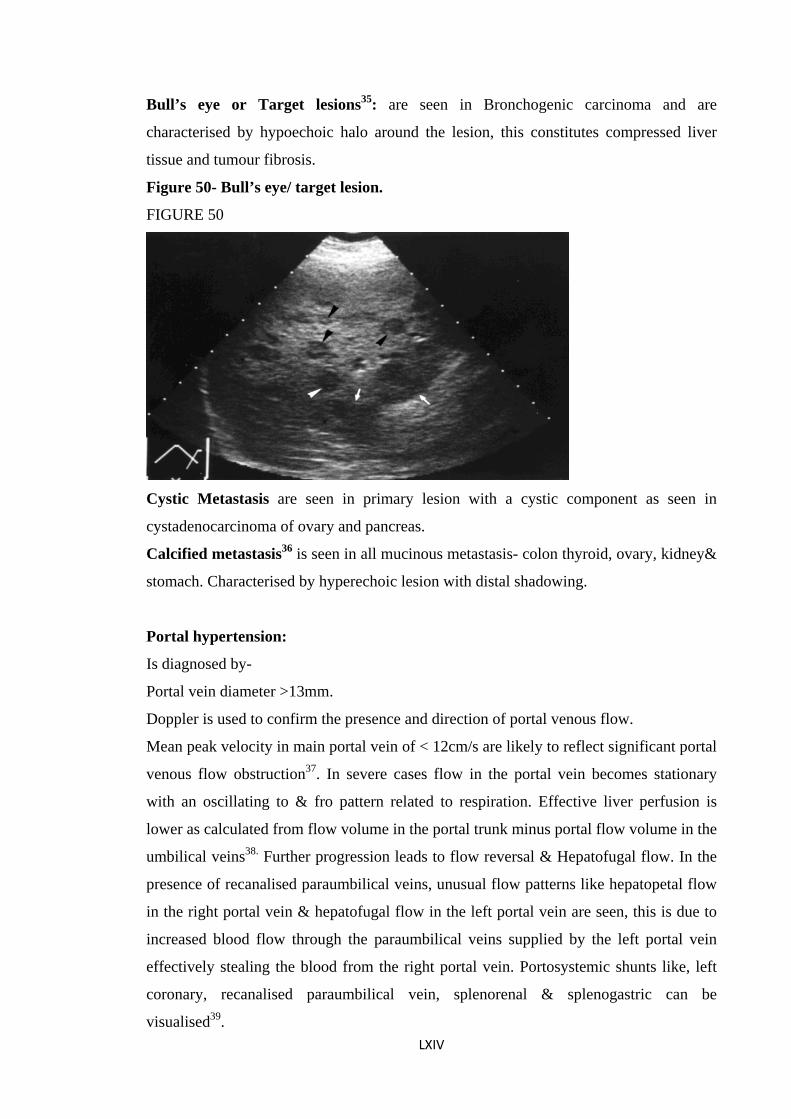
Bull’s eye or Target lesions35: are seen in Bronchogenic carcinoma and are
characterised by hypoechoic halo around the lesion, this constitutes compressed liver
tissue and tumour fibrosis.
Figure 50- Bull’s eye/ target lesion.
FIGURE 50
Cystic Metastasis are seen in primary lesion with a cystic component as seen in
cystadenocarcinoma of ovary and pancreas.
Calcified metastasis36 is seen in all mucinous metastasis- colon thyroid, ovary, kidney&
stomach. Characterised by hyperechoic lesion with distal shadowing.
Portal hypertension:
Is diagnosed by-
Portal vein diameter >13mm.
Doppler is used to confirm the presence and direction of portal venous flow.
Mean peak velocity in main portal vein of < 12cm/s are likely to reflect significant portal
venous flow obstruction37. In severe cases flow in the portal vein becomes stationary
with an oscillating to & fro pattern related to respiration. Effective liver perfusion is
lower as calculated from flow volume in the portal trunk minus portal flow volume in the
umbilical veins38. Further progression leads to flow reversal & Hepatofugal flow. In the
presence of recanalised paraumbilical veins, unusual flow patterns like hepatopetal flow
in the right portal vein & hepatofugal flow in the left portal vein are seen, this is due to
increased blood flow through the paraumbilical veins supplied by the left portal vein
effectively stealing the blood from the right portal vein. Portosystemic shunts like, left
coronary, recanalised paraumbilical vein, splenorenal & splenogastric can be
visualised39. LXIV
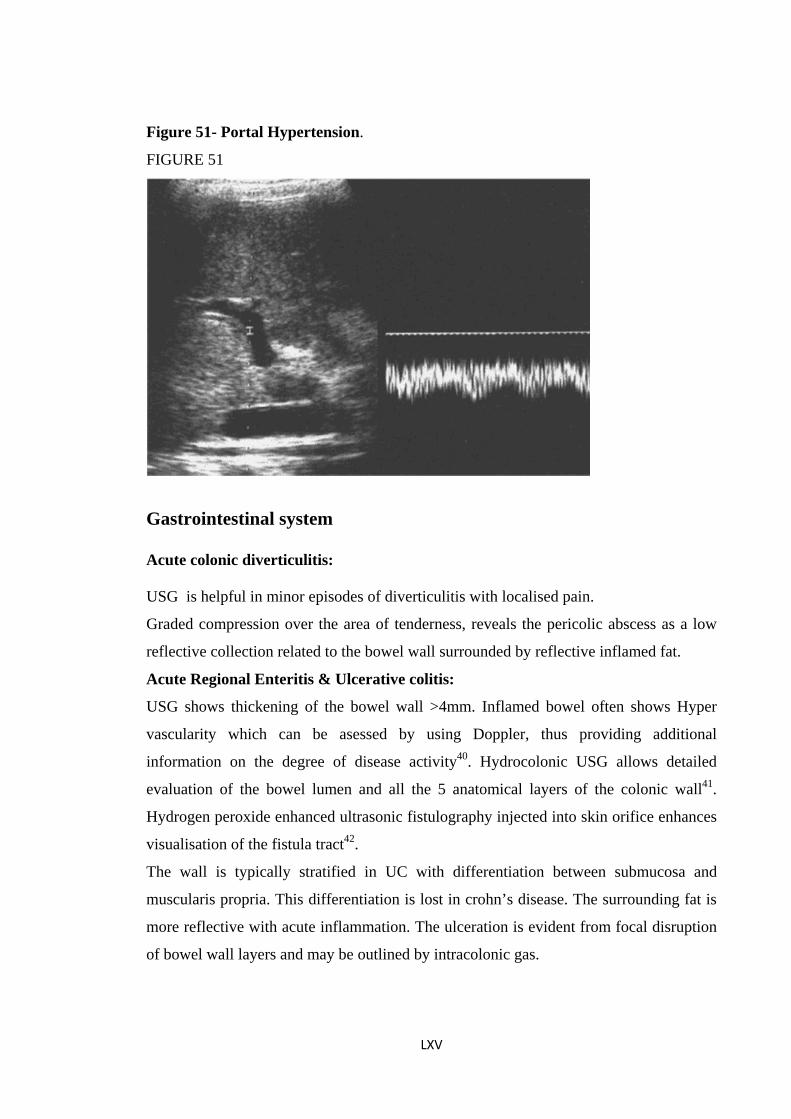
Figure 51- Portal Hypertension.
FIGURE 51
Gastrointestinal system Acute colonic diverticulitis: USG is helpful in minor episodes of diverticulitis with localised pain.
Graded compression over the area of tenderness, reveals the pericolic abscess as a low
reflective collection related to the bowel wall surrounded by reflective inflamed fat.
Acute Regional Enteritis & Ulcerative colitis:
USG shows thickening of the bowel wall >4mm. Inflamed bowel often shows Hyper
vascularity which can be asessed by using Doppler, thus providing additional
information on the degree of disease activity40. Hydrocolonic USG allows detailed
evaluation of the bowel lumen and all the 5 anatomical layers of the colonic wall41.
Hydrogen peroxide enhanced ultrasonic fistulography injected into skin orifice enhances
visualisation of the fistula tract42.
The wall is typically stratified in UC with differentiation between submucosa and
muscularis propria. This differentiation is lost in crohn’s disease. The surrounding fat is
more reflective with acute inflammation. The ulceration is evident from focal disruption
of bowel wall layers and may be outlined by intracolonic gas.
LXV
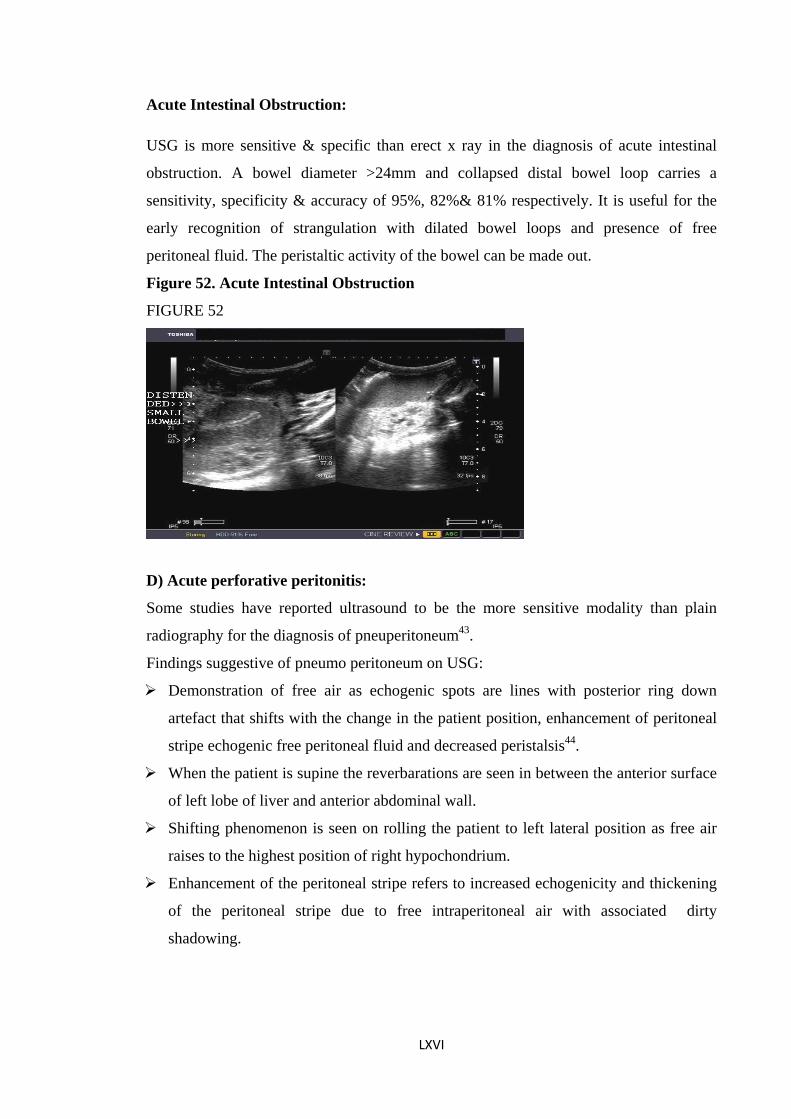
Acute Intestinal Obstruction:
USG is more sensitive & specific than erect x ray in the diagnosis of acute intestinal
obstruction. A bowel diameter >24mm and collapsed distal bowel loop carries a
sensitivity, specificity & accuracy of 95%, 82%& 81% respectively. It is useful for the
early recognition of strangulation with dilated bowel loops and presence of free
peritoneal fluid. The peristaltic activity of the bowel can be made out.
Figure 52. Acute Intestinal Obstruction
FIGURE 52
D) Acute perforative peritonitis:
Some studies have reported ultrasound to be the more sensitive modality than plain
radiography for the diagnosis of pneuperitoneum43.
Findings suggestive of pneumo peritoneum on USG:
Demonstration of free air as echogenic spots are lines with posterior ring down
artefact that shifts with the change in the patient position, enhancement of peritoneal
stripe echogenic free peritoneal fluid and decreased peristalsis44.
When the patient is supine the reverbarations are seen in between the anterior surface
of left lobe of liver and anterior abdominal wall.
Shifting phenomenon is seen on rolling the patient to left lateral position as free air
raises to the highest position of right hypochondrium.
Enhancement of the peritoneal stripe refers to increased echogenicity and thickening
of the peritoneal stripe due to free intraperitoneal air with associated dirty
shadowing.
LXVI
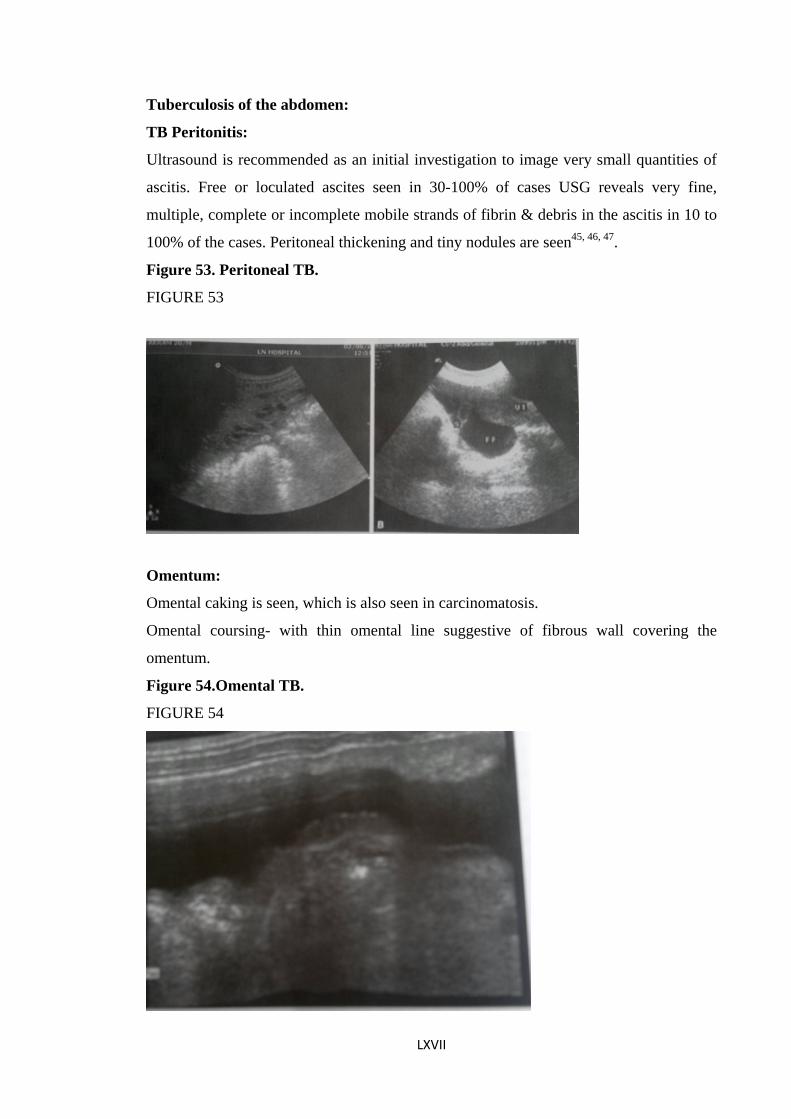
Tuberculosis of the abdomen:
TB Peritonitis:
Ultrasound is recommended as an initial investigation to image very small quantities of
ascitis. Free or loculated ascites seen in 30-100% of cases USG reveals very fine,
multiple, complete or incomplete mobile strands of fibrin & debris in the ascitis in 10 to
100% of the cases. Peritoneal thickening and tiny nodules are seen45, 46, 47.
Figure 53. Peritoneal TB.
FIGURE 53
Omentum:
Omental caking is seen, which is also seen in carcinomatosis.
Omental coursing- with thin omental line suggestive of fibrous wall covering the
omentum.
Figure 54.Omental TB.
FIGURE 54
LXVII
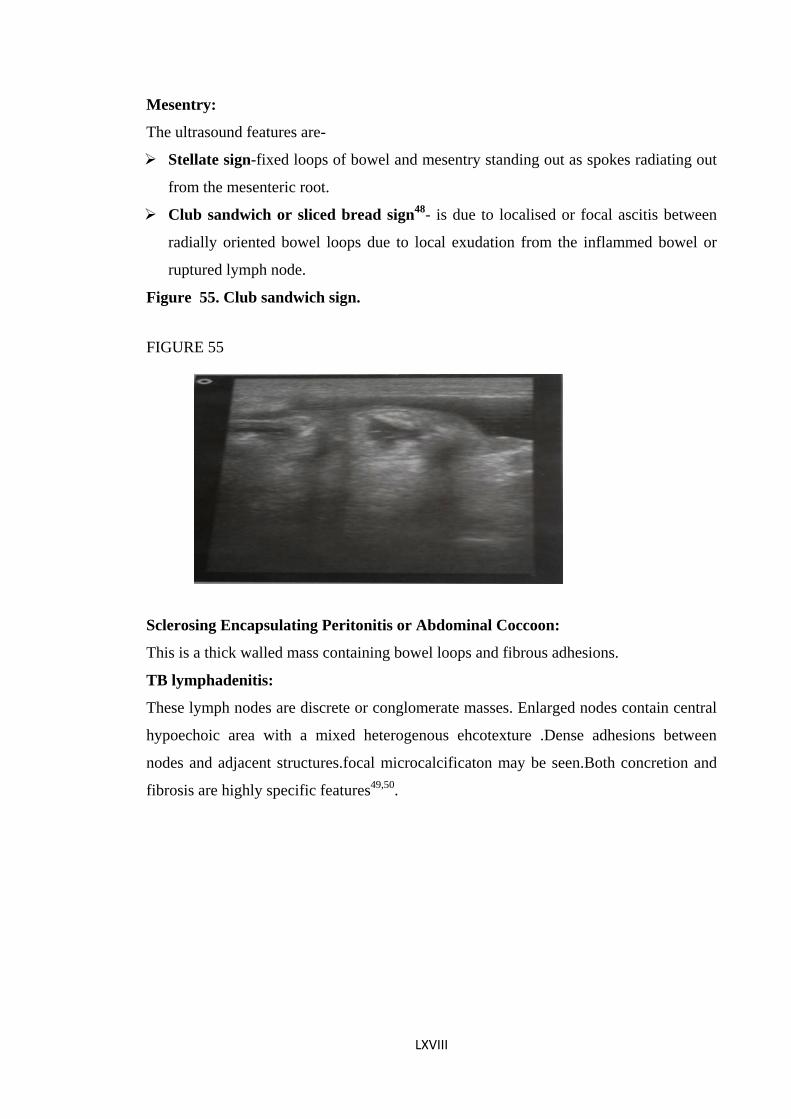
Mesentry:
The ultrasound features are-
Stellate sign-fixed loops of bowel and mesentry standing out as spokes radiating out
from the mesenteric root.
Club sandwich or sliced bread sign48- is due to localised or focal ascitis between
radially oriented bowel loops due to local exudation from the inflammed bowel or
ruptured lymph node.
Figure 55. Club sandwich sign.
FIGURE 55
Sclerosing Encapsulating Peritonitis or Abdominal Coccoon:
This is a thick walled mass containing bowel loops and fibrous adhesions.
TB lymphadenitis:
These lymph nodes are discrete or conglomerate masses. Enlarged nodes contain central
hypoechoic area with a mixed heterogenous ehcotexture .Dense adhesions between
nodes and adjacent structures.focal microcalcificaton may be seen.Both concretion and
fibrosis are highly specific features49,50.
LXVIII
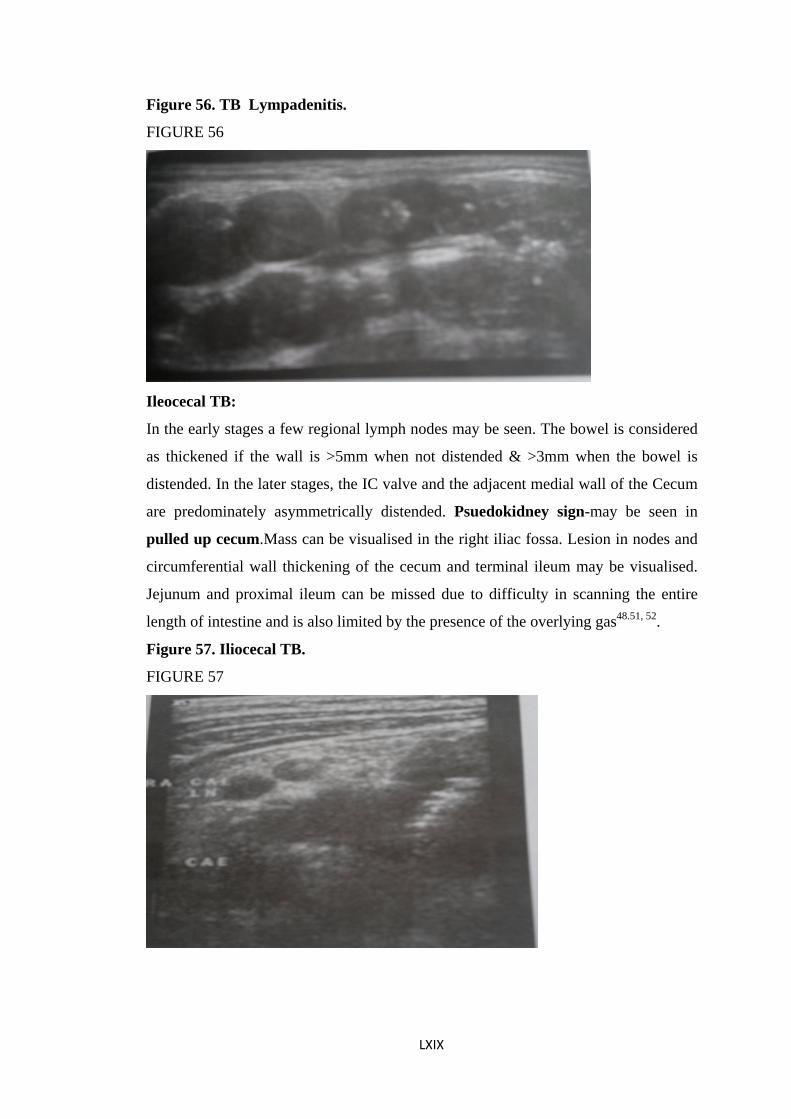
Figure 56. TB Lympadenitis.
FIGURE 56
Ileocecal TB:
In the early stages a few regional lymph nodes may be seen. The bowel is considered
as thickened if the wall is >5mm when not distended & >3mm when the bowel is
distended. In the later stages, the IC valve and the adjacent medial wall of the Cecum
are predominately asymmetrically distended. Psuedokidney sign-may be seen in
pulled up cecum.Mass can be visualised in the right iliac fossa. Lesion in nodes and
circumferential wall thickening of the cecum and terminal ileum may be visualised.
Jejunum and proximal ileum can be missed due to difficulty in scanning the entire
length of intestine and is also limited by the presence of the overlying gas48.51, 52.
Figure 57. Iliocecal TB.
FIGURE 57
LXIX
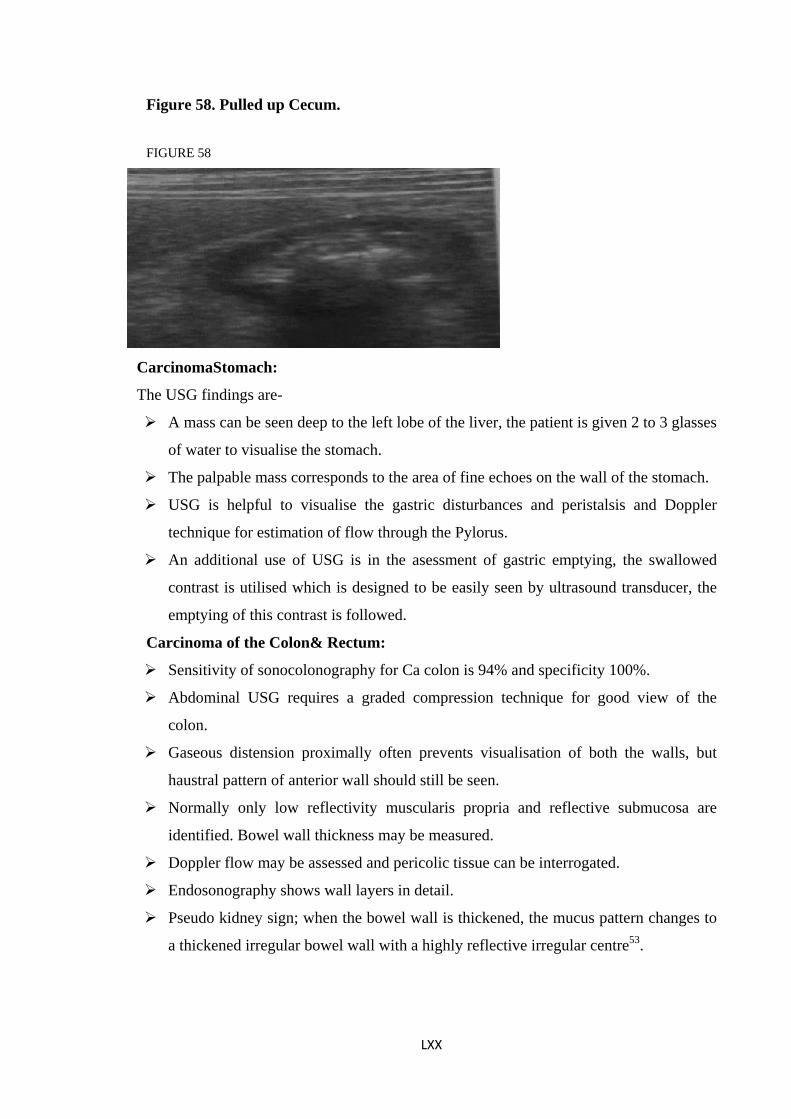
Figure 58. Pulled up Cecum.
FIGURE 58
CarcinomaStomach:
The USG findings are-
A mass can be seen deep to the left lobe of the liver, the patient is given 2 to 3 glasses
of water to visualise the stomach.
The palpable mass corresponds to the area of fine echoes on the wall of the stomach.
USG is helpful to visualise the gastric disturbances and peristalsis and Doppler
technique for estimation of flow through the Pylorus.
An additional use of USG is in the asessment of gastric emptying, the swallowed
contrast is utilised which is designed to be easily seen by ultrasound transducer, the
emptying of this contrast is followed.
Carcinoma of the Colon& Rectum:
Sensitivity of sonocolonography for Ca colon is 94% and specificity 100%.
Abdominal USG requires a graded compression technique for good view of the
colon.
Gaseous distension proximally often prevents visualisation of both the walls, but
haustral pattern of anterior wall should still be seen.
Normally only low reflectivity muscularis propria and reflective submucosa are
identified. Bowel wall thickness may be measured.
Doppler flow may be assessed and pericolic tissue can be interrogated.
Endosonography shows wall layers in detail.
Pseudo kidney sign; when the bowel wall is thickened, the mucus pattern changes to
a thickened irregular bowel wall with a highly reflective irregular centre53.
LXX
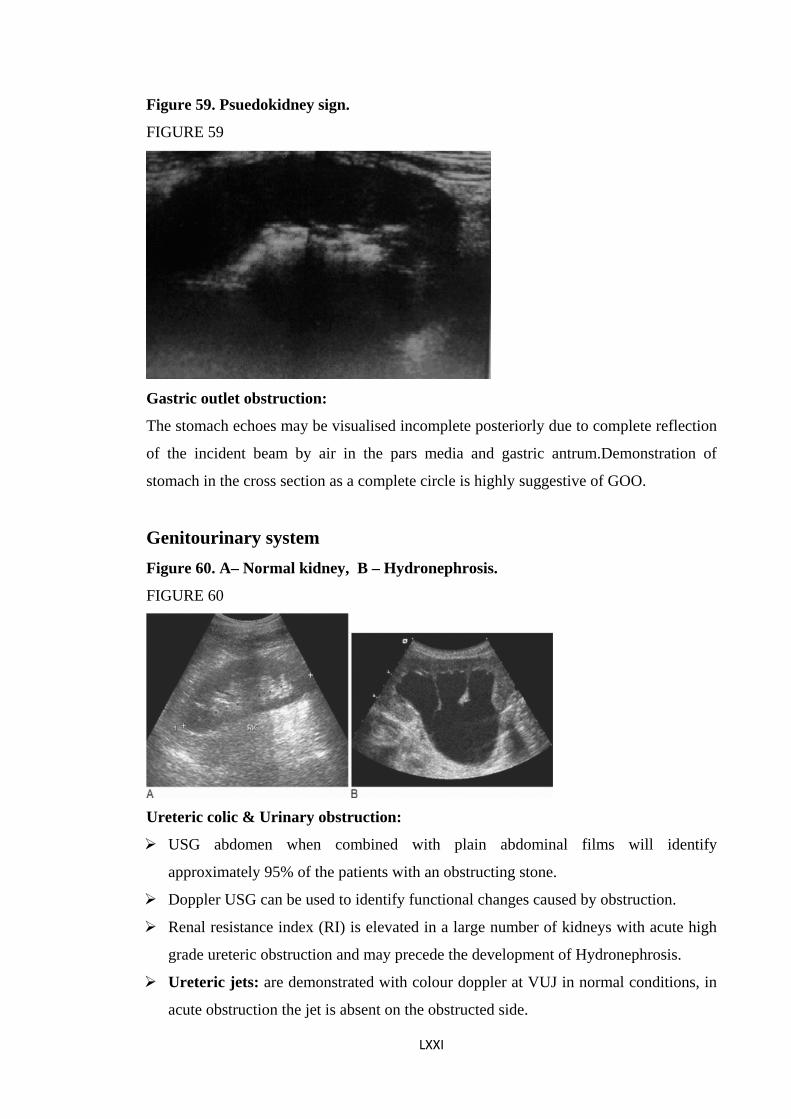
Figure 59. Psuedokidney sign.
FIGURE 59
Gastric outlet obstruction:
The stomach echoes may be visualised incomplete posteriorly due to complete reflection
of the incident beam by air in the pars media and gastric antrum.Demonstration of
stomach in the cross section as a complete circle is highly suggestive of GOO.
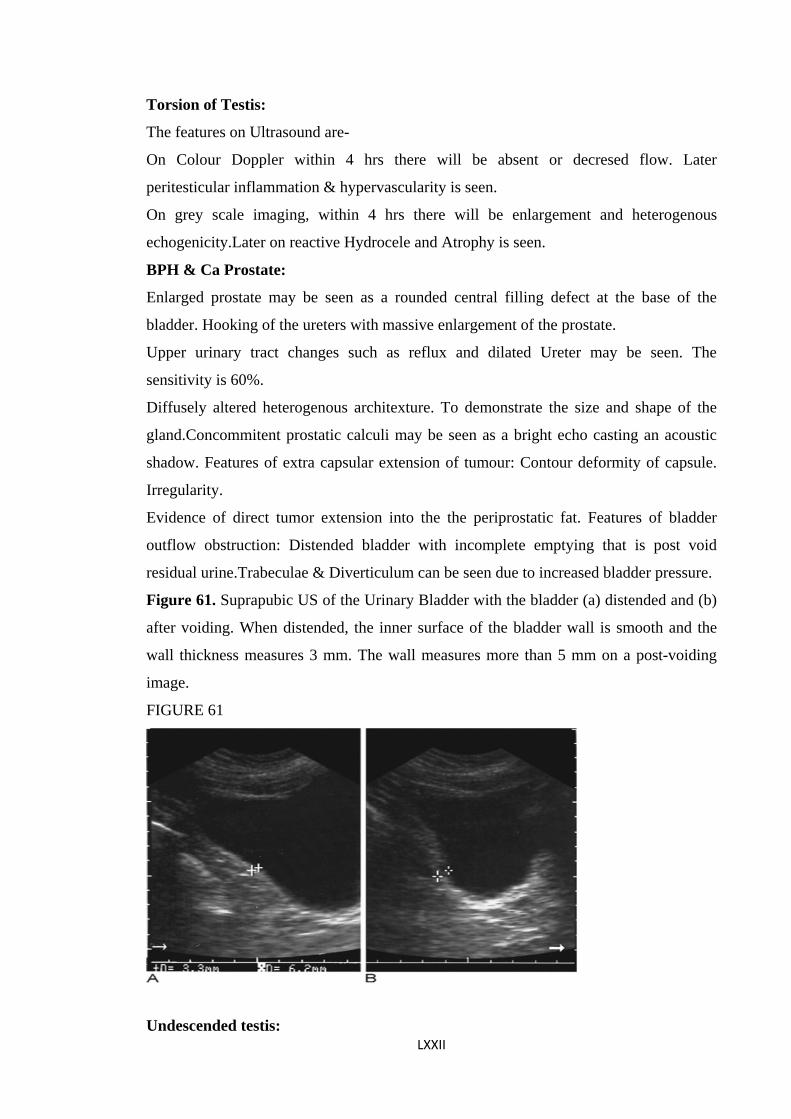
Genitourinary system Figure 60. A– Normal kidney, B – Hydronephrosis.
FIGURE 60
Ureteric colic & Urinary obstruction:
USG abdomen when combined with plain abdominal films will identify
approximately 95% of the patients with an obstructing stone.
Doppler USG can be used to identify functional changes caused by obstruction.
Renal resistance index (RI) is elevated in a large number of kidneys with acute high
grade ureteric obstruction and may precede the development of Hydronephrosis.
Ureteric jets: are demonstrated with colour doppler at VUJ in normal conditions, in
acute obstruction the jet is absent on the obstructed side.
LXXI
LXXII
Torsion of Testis:
The features on Ultrasound are-
On Colour Doppler within 4 hrs there will be absent or decresed flow. Later
peritesticular inflammation & hypervascularity is seen.
On grey scale imaging, within 4 hrs there will be enlargement and heterogenous
echogenicity.Later on reactive Hydrocele and Atrophy is seen.
BPH & Ca Prostate:
Enlarged prostate may be seen as a rounded central filling defect at the base of the
bladder. Hooking of the ureters with massive enlargement of the prostate.
Upper urinary tract changes such as reflux and dilated Ureter may be seen. The
sensitivity is 60%.
Diffusely altered heterogenous architexture. To demonstrate the size and shape of the
gland.Concommitent prostatic calculi may be seen as a bright echo casting an acoustic
shadow. Features of extra capsular extension of tumour: Contour deformity of capsule.
Irregularity.
Evidence of direct tumor extension into the the periprostatic fat. Features of bladder
outflow obstruction: Distended bladder with incomplete emptying that is post void
residual urine.Trabeculae & Diverticulum can be seen due to increased bladder pressure.
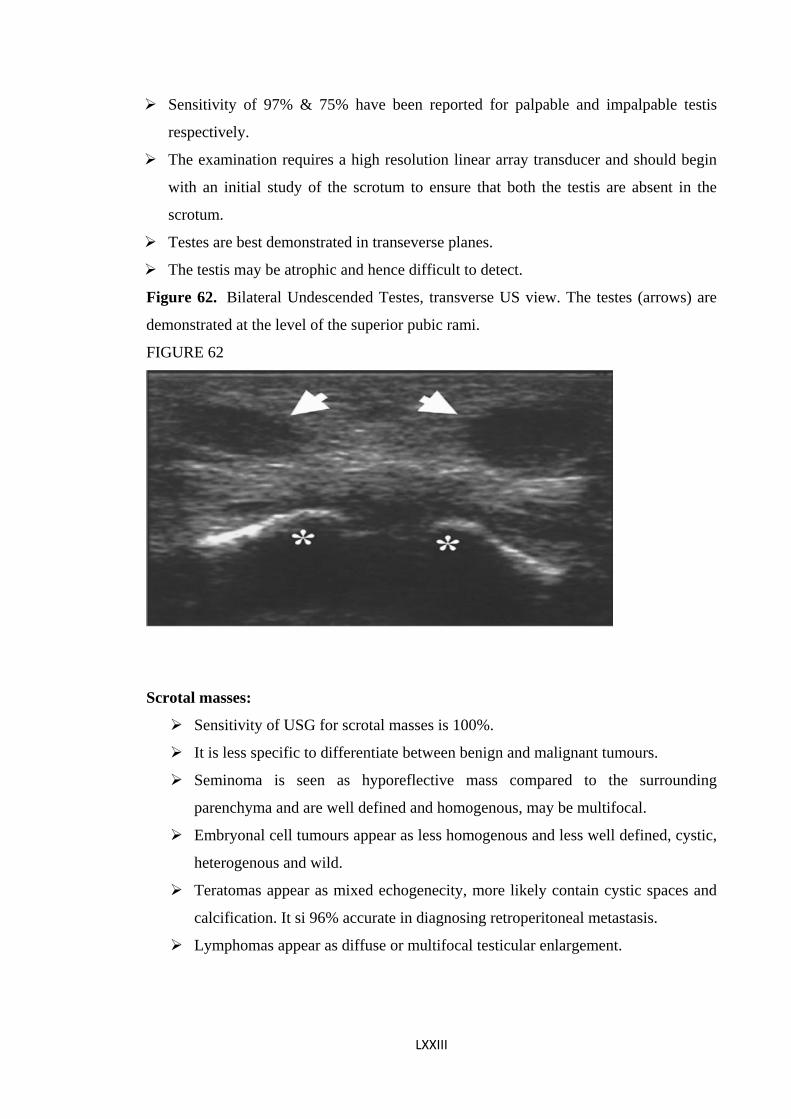
Figure 61. Suprapubic US of the Urinary Bladder with the bladder (a) distended and (b)
after voiding. When distended, the inner surface of the bladder wall is smooth and the
wall thickness measures 3 mm. The wall measures more than 5 mm on a post-voiding
image.
FIGURE 61
Undescended testis:
Sensitivity of 97% & 75% have been reported for palpable and impalpable testis
respectively.
The examination requires a high resolution linear array transducer and should begin
with an initial study of the scrotum to ensure that both the testis are absent in the
scrotum.
Testes are best demonstrated in transeverse planes.
The testis may be atrophic and hence difficult to detect.
Figure 62. Bilateral Undescended Testes, transverse US view. The testes (arrows) are
demonstrated at the level of the superior pubic rami.
FIGURE 62
Scrotal masses:
Sensitivity of USG for scrotal masses is 100%.
It is less specific to differentiate between benign and malignant tumours.
Seminoma is seen as hyporeflective mass compared to the surrounding
parenchyma and are well defined and homogenous, may be multifocal.
Embryonal cell tumours appear as less homogenous and less well defined, cystic,
heterogenous and wild.
Teratomas appear as mixed echogenecity, more likely contain cystic spaces and
calcification. It si 96% accurate in diagnosing retroperitoneal metastasis.
Lymphomas appear as diffuse or multifocal testicular enlargement.
LXXIII
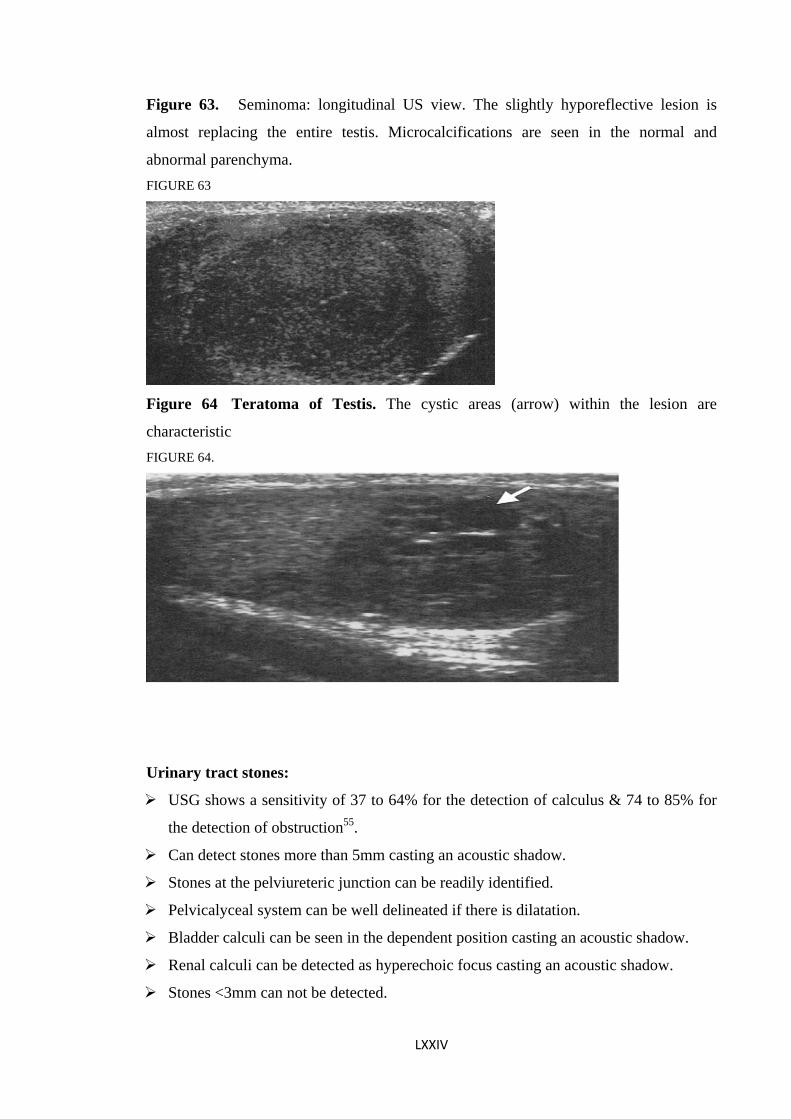
Figure 63. Seminoma: longitudinal US view. The slightly hyporeflective lesion is
almost replacing the entire testis. Microcalcifications are seen in the normal and
abnormal parenchyma. FIGURE 63
Figure 64 Teratoma of Testis. The cystic areas (arrow) within the lesion are
characteristic FIGURE 64.
Urinary tract stones:
USG shows a sensitivity of 37 to 64% for the detection of calculus & 74 to 85% for
the detection of obstruction55.
Can detect stones more than 5mm casting an acoustic shadow.
Stones at the pelviureteric junction can be readily identified.
Pelvicalyceal system can be well delineated if there is dilatation.
Bladder calculi can be seen in the dependent position casting an acoustic shadow.
Renal calculi can be detected as hyperechoic focus casting an acoustic shadow.
Stones <3mm can not be detected.
LXXIV
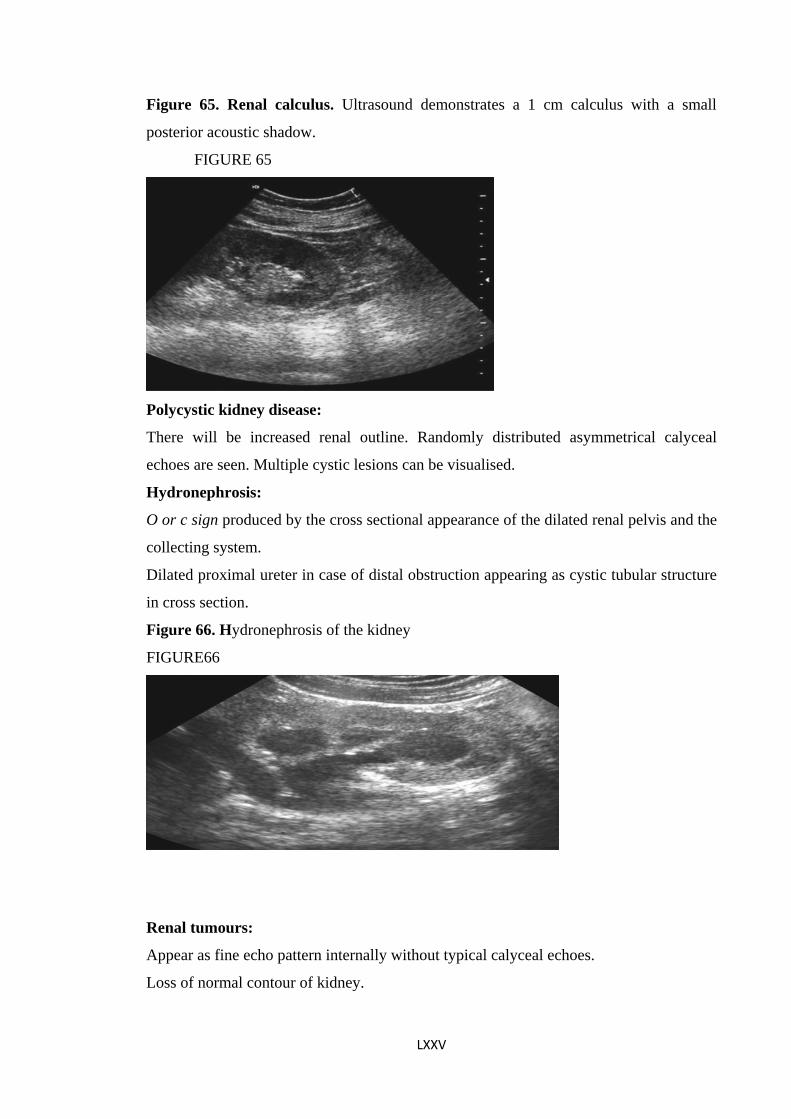
Figure 65. Renal calculus. Ultrasound demonstrates a 1 cm calculus with a small
posterior acoustic shadow.
FIGURE 65
Polycystic kidney disease:
There will be increased renal outline. Randomly distributed asymmetrical calyceal
echoes are seen. Multiple cystic lesions can be visualised.
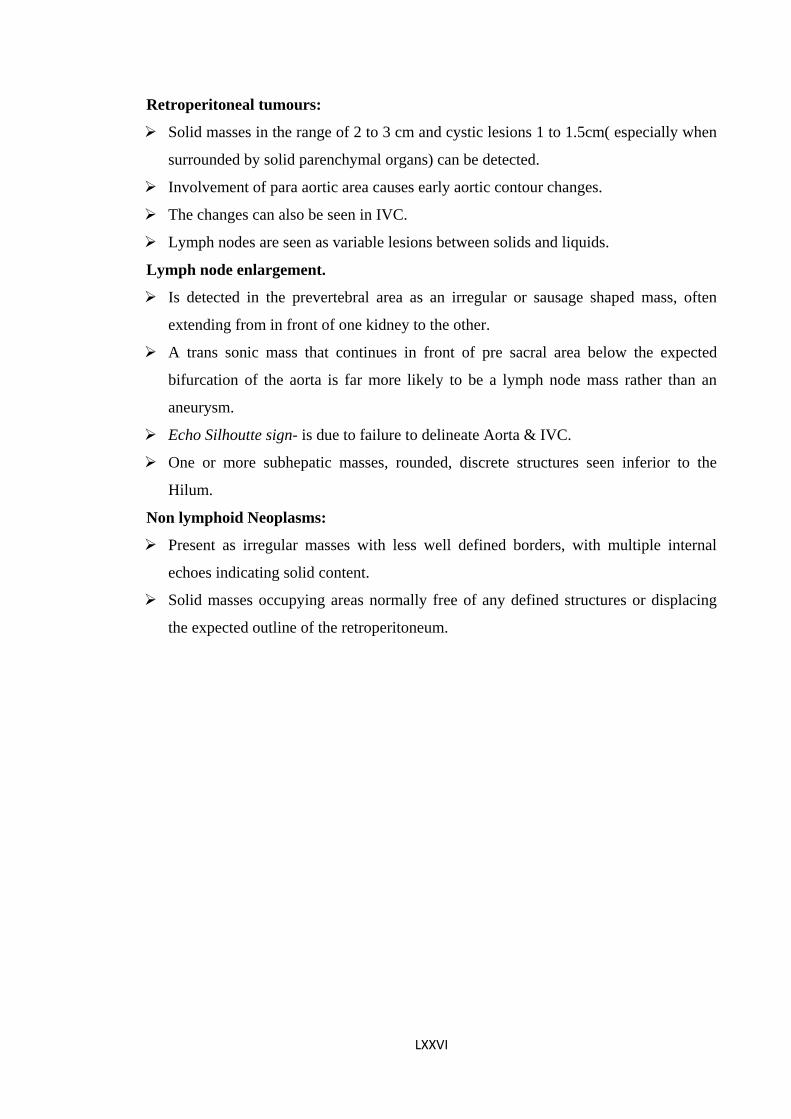
Hydronephrosis:
O or c sign produced by the cross sectional appearance of the dilated renal pelvis and the
collecting system.
Dilated proximal ureter in case of distal obstruction appearing as cystic tubular structure
in cross section.
Figure 66. Hydronephrosis of the kidney
FIGURE66
Renal tumours:
Appear as fine echo pattern internally without typical calyceal echoes.
Loss of normal contour of kidney.
LXXV
LXXVI
Retroperitoneal tumours:
Solid masses in the range of 2 to 3 cm and cystic lesions 1 to 1.5cm( especially when
surrounded by solid parenchymal organs) can be detected.
Involvement of para aortic area causes early aortic contour changes.
The changes can also be seen in IVC.
Lymph nodes are seen as variable lesions between solids and liquids.
Lymph node enlargement.
Is detected in the prevertebral area as an irregular or sausage shaped mass, often
extending from in front of one kidney to the other.
A trans sonic mass that continues in front of pre sacral area below the expected
bifurcation of the aorta is far more likely to be a lymph node mass rather than an
aneurysm.
Echo Silhoutte sign- is due to failure to delineate Aorta & IVC.
One or more subhepatic masses, rounded, discrete structures seen inferior to the
Hilum.
Non lymphoid Neoplasms:
Present as irregular masses with less well defined borders, with multiple internal
echoes indicating solid content.
Solid masses occupying areas normally free of any defined structures or displacing
the expected outline of the retroperitoneum.
LXXVII
Materials & Methods: Source of data:
The present study is a prospective hospital based study conducted in the department of
General Surgery KIMS Hubli, during the study period of November 2008 to October
2009. A total of 99 cases admitted with Acute & Chronic abdominal conditions during
the study period were included in the study.
Method of collection of data:
Inclusion criteria:
All the patients presenting to KIMS Hubli with Acute & Chronic non traumatic & non
Gynaecological abdominal conditions in whom the clinical diagnosis has been done
already (Male or female of more than 10yrs of age) during the study period were
included in the study.
Exclusion criteria:
1) Patients with traumatic abdominal conditions.
2) Patients with Gynaecological disorders.
3) Patients with co-morbid medical conditions.
4) Patients in whom conservative management has been done.
5) Patients in whom Ultrasonography could not be done.
After the initial evaluation at the emergency department for acute cases & in the wards
for stable patients with chronic abdominal conditions, clinical diagnosis was done by
various clinical methods. The clinically diagnosed acute and chronic abdominal cases
were subjected to ultrasound examination. Informed consent was taken prior to the
examination.
Phillips IU 22 & GE Logix alpha 200 machines were used and ultrasound was
performed with high frequency linear array transducer.
Low frequency curvilinear transducer was used only in needy cases. The examination
was commenced in the right upper quadrant in the region of hepatic flexure of colon then
along the ascending colon and ended in the right lower quadrant in the region of the
Cecum. Graded compression technique was used wherever necessary. Scanning at the
point of maximum tenderness was found to be more useful in localising appendix and
that had decreased the duration of time required for examination.
For scanning of the stomach in GOO Ultrasound examination was done using a
frequency of 3 to5MHz. Patients were given water to drink for the stomach to get
LXXVIII
distended, scan was done in longitudinal, transeverse & left sided Subcostal oblique
positions.The kidney and genitourinary system was scanned in the lateral position or
from the back.
For the other cases supine position was preferred. After the Ultrasound diagnosis has
been established, patients in the study group were subjected for Surgery. The Per
operative findings were noted and the per operative diagnosis were compared with the
clinical diagnosis and the USG diagnosis.
The Accuracy of ultrasound was asessed by comparing with per operative diagnosis.
In doubtful cases the specimen resected was sent for Histo pathological examination for
the confirmation of the diagnosis.
Results:
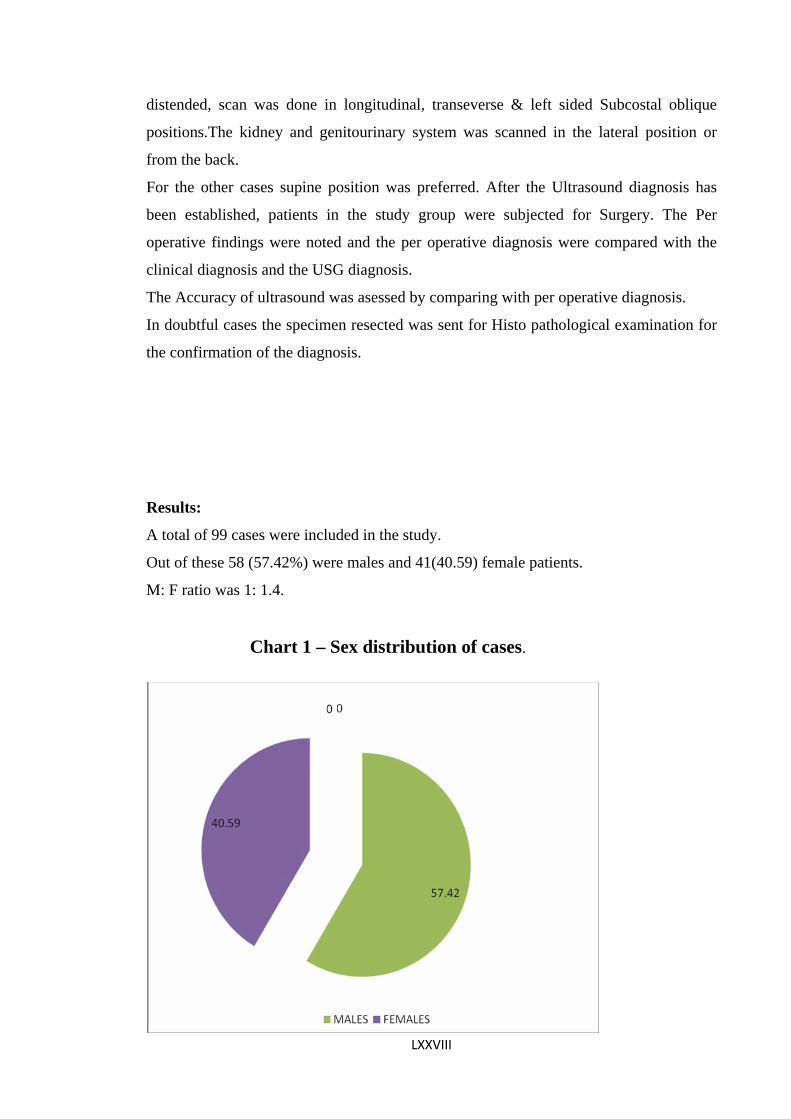
A total of 99 cases were included in the study.
Out of these 58 (57.42%) were males and 41(40.59) female patients.
M: F ratio was 1: 1.4.
Chart 1 – Sex distribution of cases.
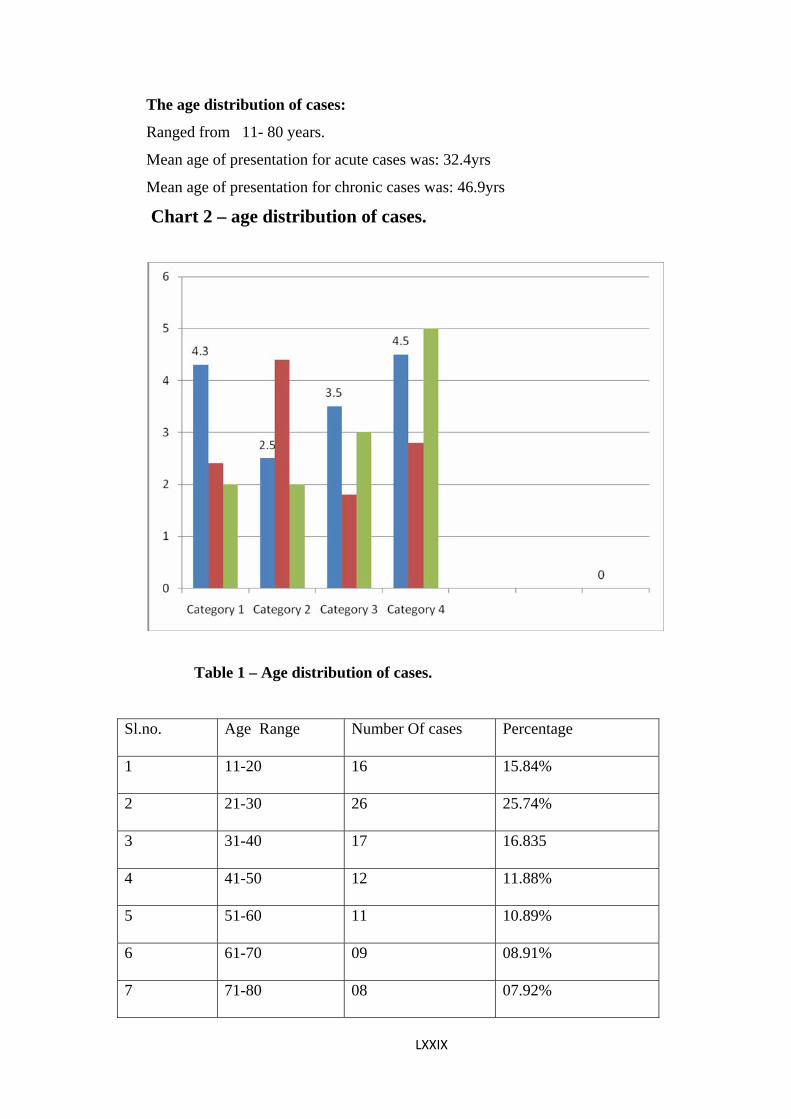
The age distribution of cases:
Ranged from 11- 80 years.
Mean age of presentation for acute cases was: 32.4yrs
Mean age of presentation for chronic cases was: 46.9yrs
Chart 2 – age distribution of cases.
Table 1 – Age distribution of cases.
Sl.no. Age Range Number Of cases Percentage
1 11-20 16 15.84%
2 21-30 26 25.74%
3 31-40 17 16.835
4 41-50 12 11.88%
5 51-60 11 10.89%
6 61-70 09 08.91%
7 71-80 08 07.92%
LXXIX
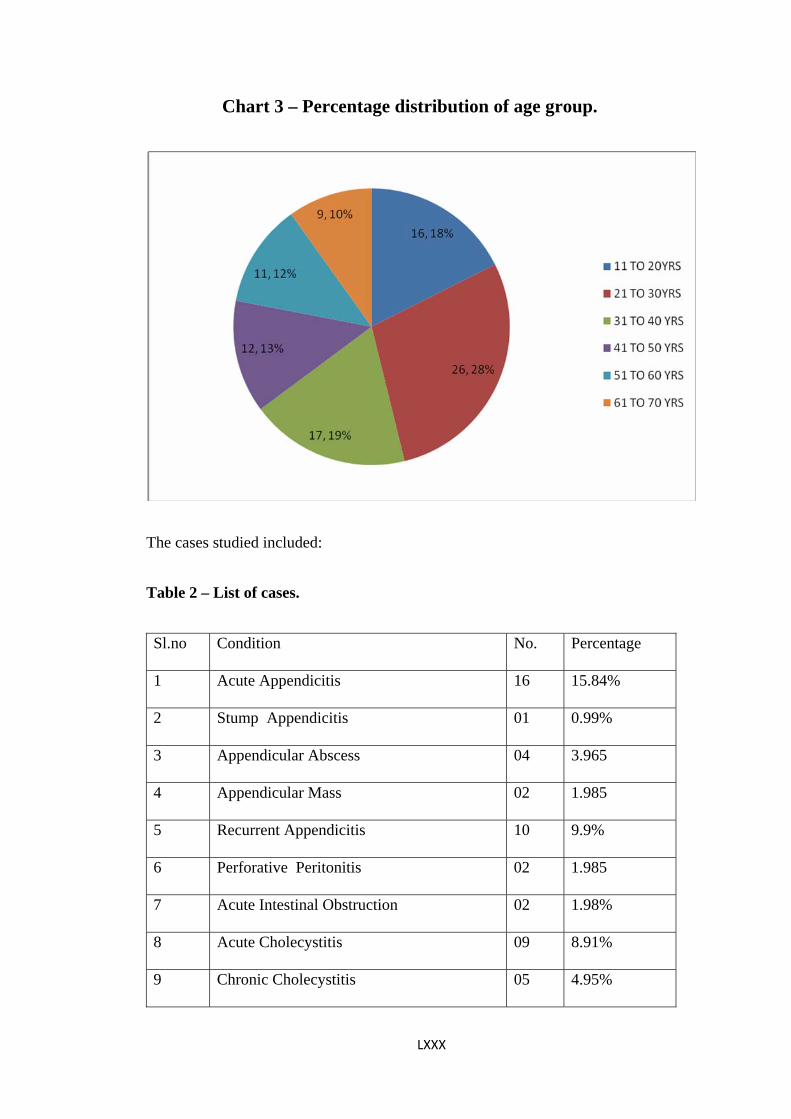
Chart 3 – Percentage distribution of age group.
The cases studied included:
Table 2 – List of cases.
Sl.no Condition No. Percentage
1 Acute Appendicitis 16 15.84%
2 Stump Appendicitis 01 0.99%
3 Appendicular Abscess 04 3.965
4 Appendicular Mass 02 1.985
5 Recurrent Appendicitis 10 9.9%
6 Perforative Peritonitis 02 1.985
7 Acute Intestinal Obstruction 02 1.98%
8 Acute Cholecystitis 09 8.91%
9 Chronic Cholecystitis 05 4.95%
LXXX
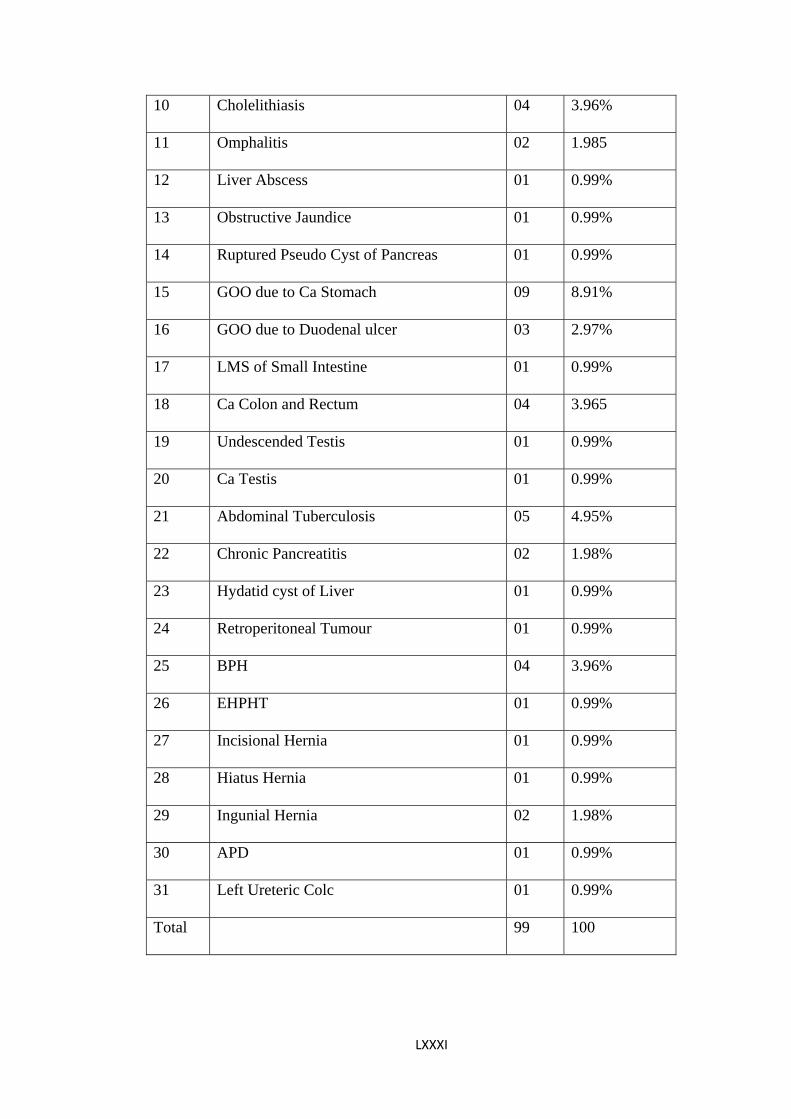
LXXXI
10 Cholelithiasis 04 3.96%
11 Omphalitis 02 1.985
12 Liver Abscess 01 0.99%
13 Obstructive Jaundice 01 0.99%
14 Ruptured Pseudo Cyst of Pancreas 01 0.99%
15 GOO due to Ca Stomach 09 8.91%
16 GOO due to Duodenal ulcer 03 2.97%
17 LMS of Small Intestine 01 0.99%
18 Ca Colon and Rectum 04 3.965
19 Undescended Testis 01 0.99%
20 Ca Testis 01 0.99%
21 Abdominal Tuberculosis 05 4.95%
22 Chronic Pancreatitis 02 1.98%
23 Hydatid cyst of Liver 01 0.99%
24 Retroperitoneal Tumour 01 0.99%
25 BPH 04 3.96%
26 EHPHT 01 0.99%
27 Incisional Hernia 01 0.99%
28 Hiatus Hernia 01 0.99%
29 Ingunial Hernia 02 1.98%
30 APD 01 0.99%
31 Left Ureteric Colc 01 0.99%
Total 99 100
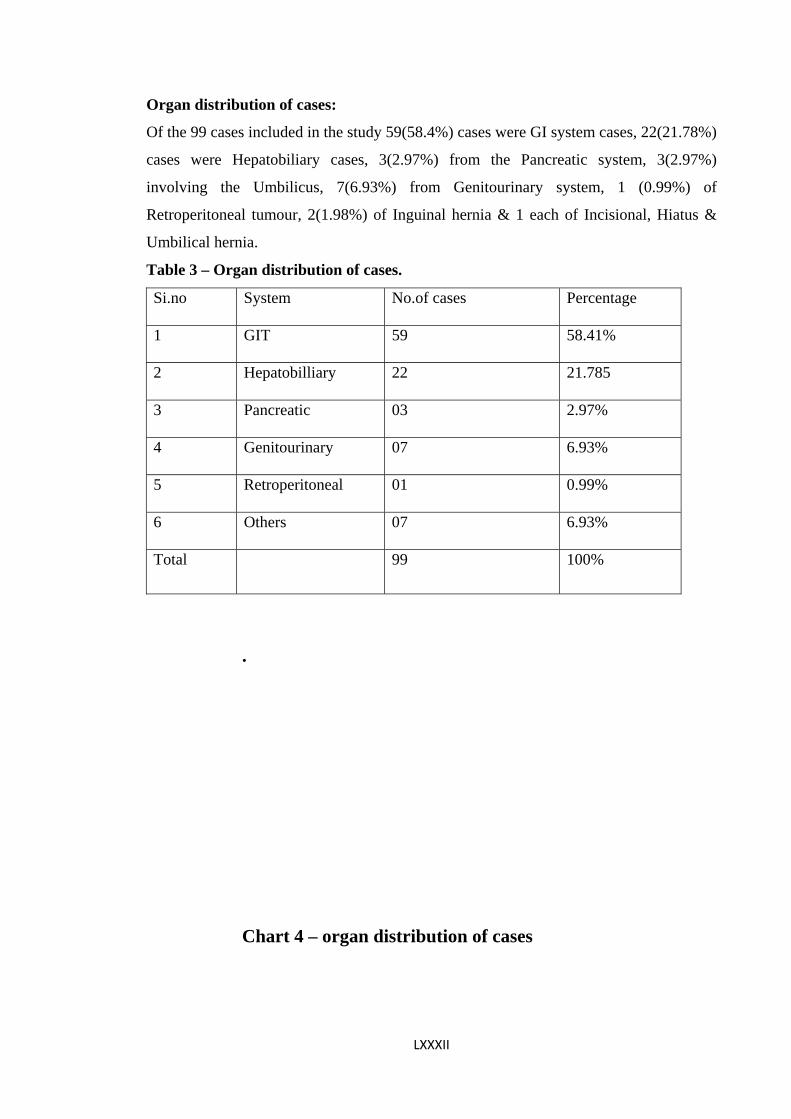
LXXXII
Organ distribution of cases:
Of the 99 cases included in the study 59(58.4%) cases were GI system cases, 22(21.78%)
cases were Hepatobiliary cases, 3(2.97%) from the Pancreatic system, 3(2.97%)
involving the Umbilicus, 7(6.93%) from Genitourinary system, 1 (0.99%) of
Retroperitoneal tumour, 2(1.98%) of Inguinal hernia & 1 each of Incisional, Hiatus &
Umbilical hernia.
Table 3 – Organ distribution of cases.
Si.no System No.of cases Percentage
1 GIT 59 58.41%
2 Hepatobilliary 22 21.785
3 Pancreatic 03 2.97%
4 Genitourinary 07 6.93%
5 Retroperitoneal 01 0.99%
6 Others 07 6.93%
Total 99 100%
.
Chart 4 – organ distribution of cases
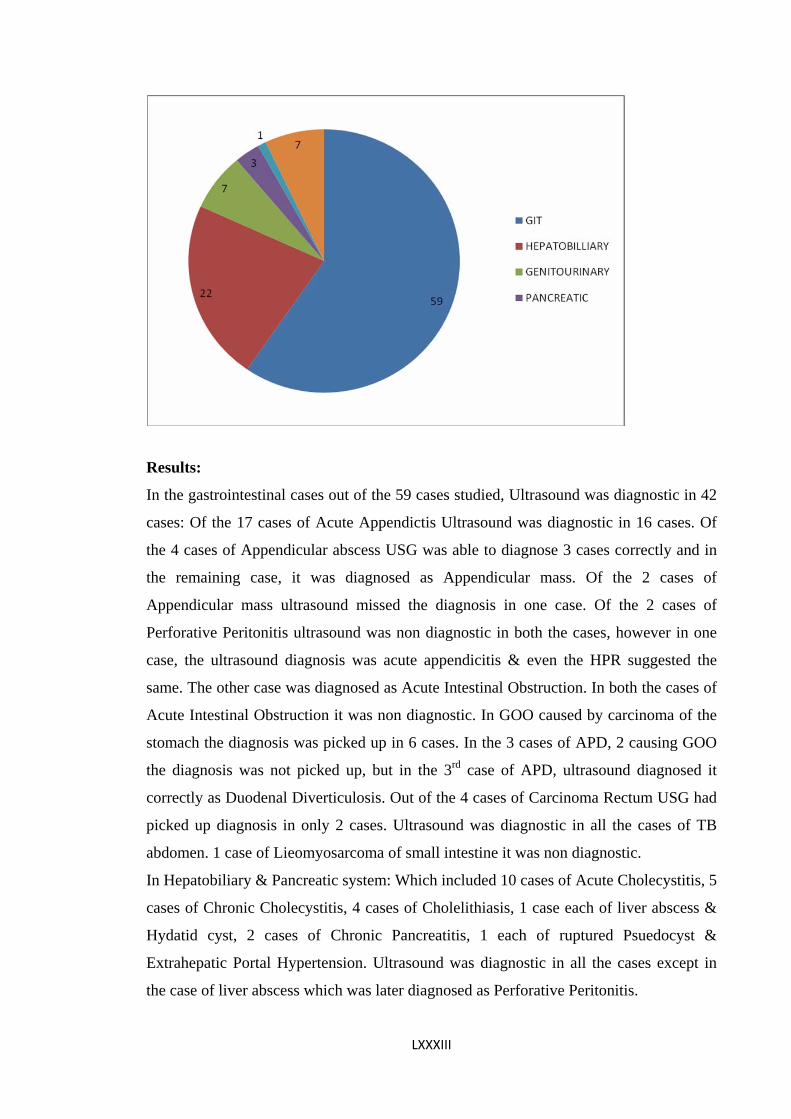
Results:
In the gastrointestinal cases out of the 59 cases studied, Ultrasound was diagnostic in 42
cases: Of the 17 cases of Acute Appendictis Ultrasound was diagnostic in 16 cases. Of
the 4 cases of Appendicular abscess USG was able to diagnose 3 cases correctly and in
the remaining case, it was diagnosed as Appendicular mass. Of the 2 cases of
Appendicular mass ultrasound missed the diagnosis in one case. Of the 2 cases of
Perforative Peritonitis ultrasound was non diagnostic in both the cases, however in one
case, the ultrasound diagnosis was acute appendicitis & even the HPR suggested the
same. The other case was diagnosed as Acute Intestinal Obstruction. In both the cases of
Acute Intestinal Obstruction it was non diagnostic. In GOO caused by carcinoma of the
stomach the diagnosis was picked up in 6 cases. In the 3 cases of APD, 2 causing GOO
the diagnosis was not picked up, but in the 3rd case of APD, ultrasound diagnosed it
correctly as Duodenal Diverticulosis. Out of the 4 cases of Carcinoma Rectum USG had
picked up diagnosis in only 2 cases. Ultrasound was diagnostic in all the cases of TB
abdomen. 1 case of Lieomyosarcoma of small intestine it was non diagnostic.
In Hepatobiliary & Pancreatic system: Which included 10 cases of Acute Cholecystitis, 5
cases of Chronic Cholecystitis, 4 cases of Cholelithiasis, 1 case each of liver abscess &
Hydatid cyst, 2 cases of Chronic Pancreatitis, 1 each of ruptured Psuedocyst &
Extrahepatic Portal Hypertension. Ultrasound was diagnostic in all the cases except in
the case of liver abscess which was later diagnosed as Perforative Peritonitis.
LXXXIII
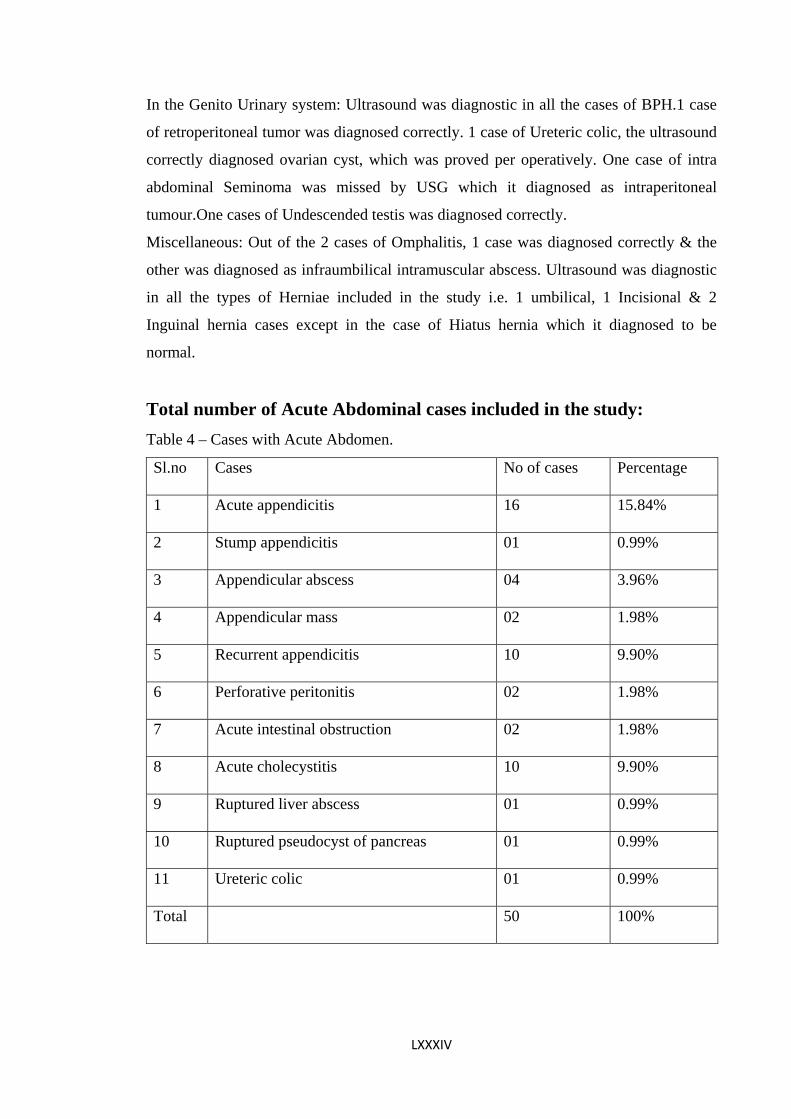
LXXXIV
In the Genito Urinary system: Ultrasound was diagnostic in all the cases of BPH.1 case
of retroperitoneal tumor was diagnosed correctly. 1 case of Ureteric colic, the ultrasound
correctly diagnosed ovarian cyst, which was proved per operatively. One case of intra
abdominal Seminoma was missed by USG which it diagnosed as intraperitoneal
tumour.One cases of Undescended testis was diagnosed correctly.
Miscellaneous: Out of the 2 cases of Omphalitis, 1 case was diagnosed correctly & the
other was diagnosed as infraumbilical intramuscular abscess. Ultrasound was diagnostic
in all the types of Herniae included in the study i.e. 1 umbilical, 1 Incisional & 2
Inguinal hernia cases except in the case of Hiatus hernia which it diagnosed to be
normal.
Total number of Acute Abdominal cases included in the study: Table 4 – Cases with Acute Abdomen.
Sl.no Cases No of cases Percentage
1 Acute appendicitis 16 15.84%
2 Stump appendicitis 01 0.99%
3 Appendicular abscess 04 3.96%
4 Appendicular mass 02 1.98%
5 Recurrent appendicitis 10 9.90%
6 Perforative peritonitis 02 1.98%
7 Acute intestinal obstruction 02 1.98%
8 Acute cholecystitis 10 9.90%
9 Ruptured liver abscess 01 0.99%
10 Ruptured pseudocyst of pancreas 01 0.99%
11 Ureteric colic 01 0.99%
Total 50 100%
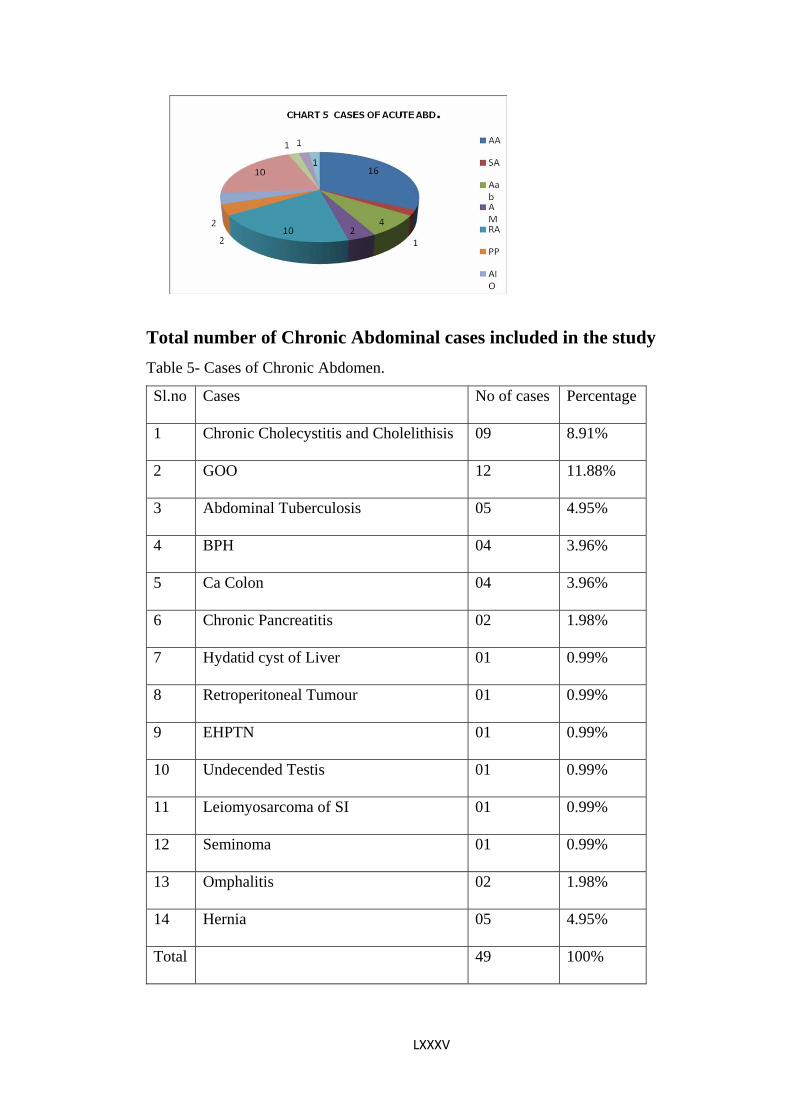
Total number of Chronic Abdominal cases included in the study
Table 5- Cases of Chronic Abdomen.
Sl.no Cases No of cases Percentage
1 Chronic Cholecystitis and Cholelithisis 09 8.91%
2 GOO 12 11.88%
3 Abdominal Tuberculosis 05 4.95%
4 BPH 04 3.96%
5 Ca Colon 04 3.96%
6 Chronic Pancreatitis 02 1.98%
7 Hydatid cyst of Liver 01 0.99%
8 Retroperitoneal Tumour 01 0.99%
9 EHPTN 01 0.99%
10 Undecended Testis 01 0.99%
11 Leiomyosarcoma of SI 01 0.99%
12 Seminoma 01 0.99%
13 Omphalitis 02 1.98%
14 Hernia 05 4.95%
Total 49 100%
LXXXV

Chart 6 – cases 0f chronic abdomen.
DISCUSSION:
Out of the 33 Acute Appendicitis & related conditions ultrasound was diagnostic in 27
cases. With a sensitivity of 83.9%. Ultasound was diagnostic in all the 10 cases of acute
cholecystitis.Ultrasound correctly diagnosed an ovarian cyst which was diagnosed as
Ureteric colic clinically. Ultrasound correctly identified the ruptured Psuedocyst. It was
not diagnostic in 2 cases of perforative peritonitis, 2 cases of acute intestinal obstruction,
1 case of ruptured liver abscess.
In Chronic Abdominal Conditions- ultrasound was diagnostic in all the 9 cases of
Chronic Cholecystitis & Cholelithiasis, 4 of the 5 cases of TB abdomen, all the 4 cases
of BPH, 1 case each of undescended testis, retroperitoneal tumour, & Hydatid cyst &
EHPHTN, 2 cases of chronic pancreatitis. Ultrasound diagnosed 6 of the 9 cases of Ca
Stomach & was non diagnostic in 2 cases of APD leading to GOO, but in one case it
correctly diagnosed Duodenal Diverticulosis which was missed clinically, was
diagnostic in 1 of the 2 cases of Omphalitis,was nondiagnostic in 1 Seminoma, 1 TB
Abdomen & 2 of the 4 cases of Ca Colon. Ultrasound was diagnostic in 4 of the 5 cases
of hernia
LXXXVI
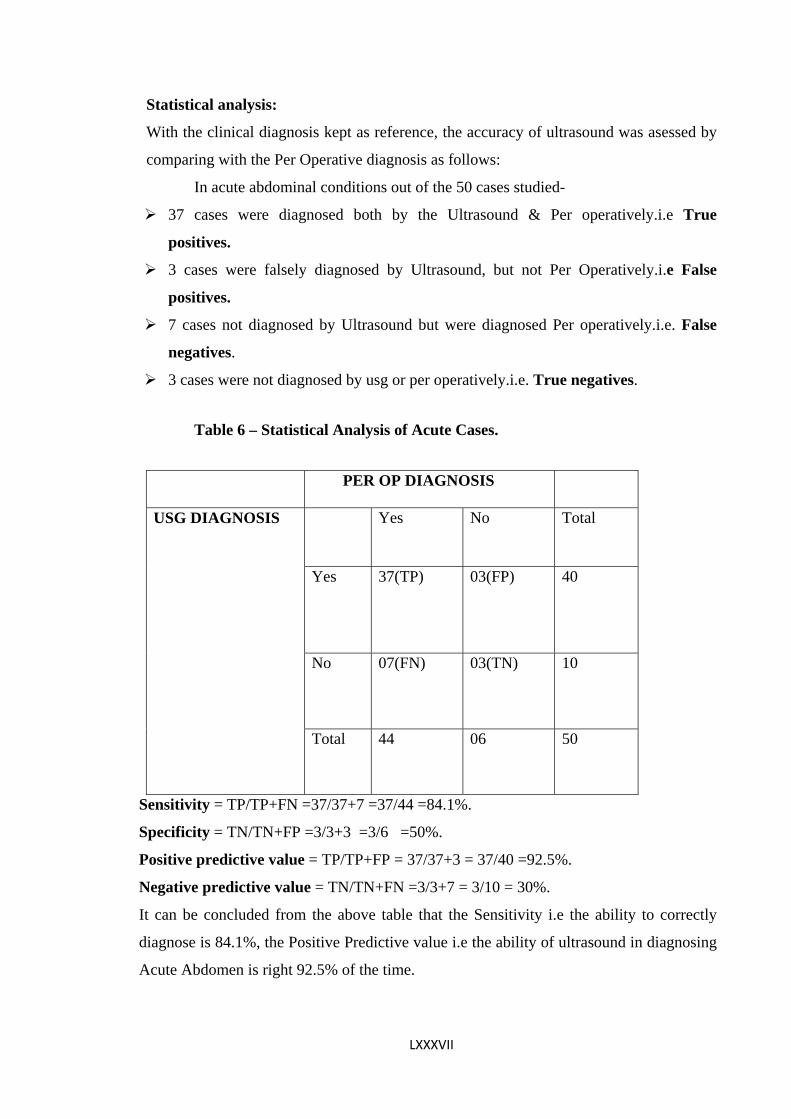
LXXXVII
Statistical analysis:
With the clinical diagnosis kept as reference, the accuracy of ultrasound was asessed by
comparing with the Per Operative diagnosis as follows:
In acute abdominal conditions out of the 50 cases studied-
37 cases were diagnosed both by the Ultrasound & Per operatively.i.e True
positives.
3 cases were falsely diagnosed by Ultrasound, but not Per Operatively.i.e False
positives.
7 cases not diagnosed by Ultrasound but were diagnosed Per operatively.i.e. False
negatives.
3 cases were not diagnosed by usg or per operatively.i.e. True negatives.
Table 6 – Statistical Analysis of Acute Cases.
PER OP DIAGNOSIS
Yes No Total
Yes 37(TP) 03(FP) 40
No 07(FN) 03(TN) 10
USG DIAGNOSIS
Total 44 06 50
Sensitivity = TP/TP+FN =37/37+7 =37/44 =84.1%.
Specificity = TN/TN+FP =3/3+3 =3/6 =50%.
Positive predictive value = TP/TP+FP = 37/37+3 = 37/40 =92.5%.
Negative predictive value = TN/TN+FN =3/3+7 = 3/10 = 30%.
It can be concluded from the above table that the Sensitivity i.e the ability to correctly
diagnose is 84.1%, the Positive Predictive value i.e the ability of ultrasound in diagnosing
Acute Abdomen is right 92.5% of the time.
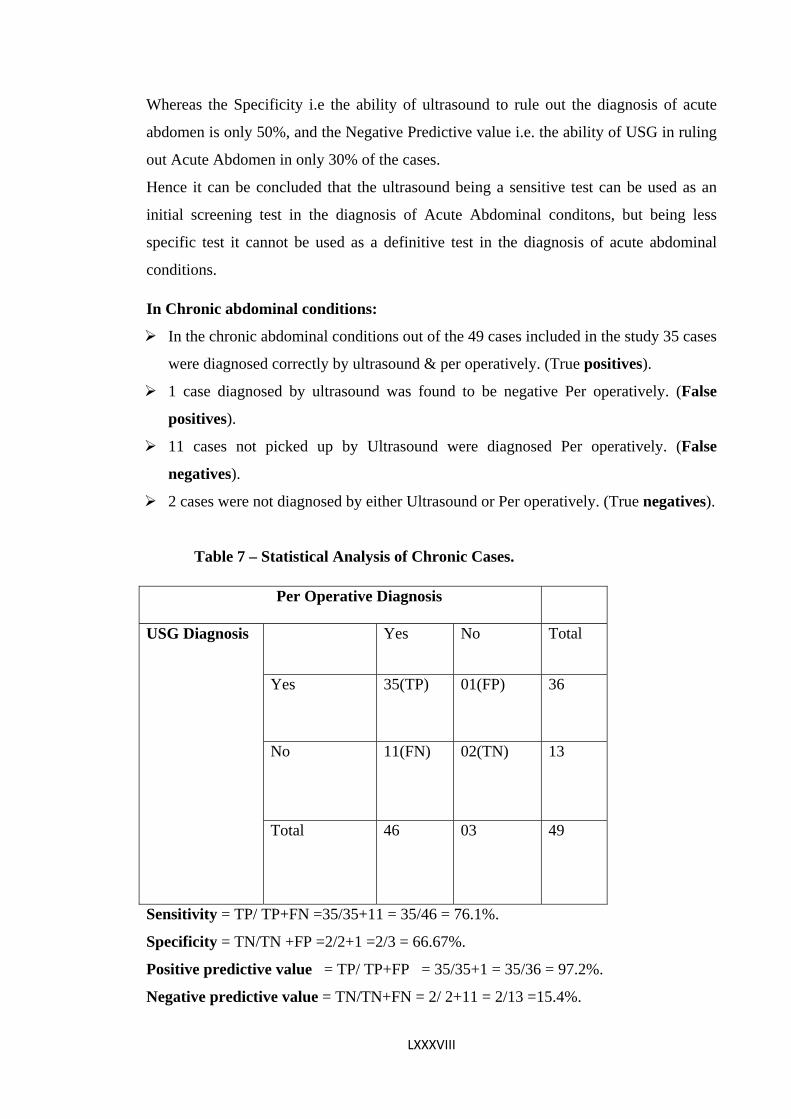
Whereas the Specificity i.e the ability of ultrasound to rule out the diagnosis of acute
abdomen is only 50%, and the Negative Predictive value i.e. the ability of USG in ruling
out Acute Abdomen in only 30% of the cases.
Hence it can be concluded that the ultrasound being a sensitive test can be used as an
initial screening test in the diagnosis of Acute Abdominal conditons, but being less
specific test it cannot be used as a definitive test in the diagnosis of acute abdominal
conditions.
In Chronic abdominal conditions:
In the chronic abdominal conditions out of the 49 cases included in the study 35 cases
were diagnosed correctly by ultrasound & per operatively. (True positives).
1 case diagnosed by ultrasound was found to be negative Per operatively. (False
positives).
11 cases not picked up by Ultrasound were diagnosed Per operatively. (False
negatives).
2 cases were not diagnosed by either Ultrasound or Per operatively. (True negatives).
Table 7 – Statistical Analysis of Chronic Cases.
Sensitivity = TP/ TP+FN =35/35+11 = 35/46 = 76.1%.
Per Operative Diagnosis
Yes No Total
Yes 35(TP) 01(FP) 36
No 11(FN) 02(TN) 13
USG Diagnosis
Total 46 03 49
Specificity = TN/TN +FP =2/2+1 =2/3 = 66.67%.
Positive predictive value = TP/ TP+FP = 35/35+1 = 35/36 = 97.2%.
Negative predictive value = TN/TN+FN = 2/ 2+11 = 2/13 =15.4%.
LXXXVIII
LXXXIX
From the above table it can be concluded that ultrasound being less sensitive & less
specific investigation cannot be used in Accurately diagnosing Chronic abdominal
conditions however it is more sensitive & specific in diagnosing Hepatobiliary &
Genitourinary system, but is less sensitive & specific in diagnosing the gastrointestinal
tract.

XC
Comparision with other studies:
S. Singh. V Chowdhury. Et al. Evaluated the efficacy of high resolution
transabdominal ultrasound in the diagnosis of fluid filled stomach in the
evaluation of Gastric carcinoma, and concluded that, High Resolution
Sonography is a supportive diagnostic modality & is supplementary diagnostic
procedure to endoscopy. In their study Sonography had diagnosed all the cases of
gastric cancer where as Endoscopy had missed the diagnosis in one case out of
17. However in our study out of the 9 cases of gastric cancer included in the
study ultrasound diagnosed only 6 cases
(Sensitivity of 66.67%).
Khanal BR, Ansari MA, Pradhan S et al. Assessed the accuracy of ultrasound in
the diagnosis of Acute Appendicitis & got a sensitivity & specificity of 85.7%
and 100% respectively and concluded that, USG has a high degree of accuracy in
the diagnosis of acute appendicitis. Whereas in our study the sensitivity of
ultrasound in the diagnosis of acute appendicitis was 94%.
S. Hollerbach, A.Geissler et al. Studied the accuracy of ultrasound in the
diagnosis of Bowel disorders & found a sensitivity of 76%, in our study overall
17 cases included in the study the sensitivity was 71%.
H. Prasad, G. Rodrigues & R. Shenoy et al studied the role of USG in non
traumatic Acute abdomen including 148 patients &found a sensitivity and
specificity as follows- acute appendicitis 66.6% & 100%, ureteric colic 84.6% &
98.4%, acute pancreatitis 73.6% & 97.7% & acute cholecystitis 92.3% & 100%
and concluded that, the accuracy of ultrasound in diagnosing Hepatobiliary
disorders & gynaecological disorders helps in reducing the negative laparotomy
XCI
rate & is cost effective. Hence should be a part of routine surgical investigation.
In our study the sensitivity of acute appendicitis was 84% and for acute
cholecystitis sensitivity& specificity were 100% .
In a single case of ureteric colic used in the study USG was non diagnostic which
cannot be commented upon
A Lindeliun, S. Torngren et al conducted a randomized study to evaluate the
diagnostic accuracy of surgeon performed ultrasound in the emergency
department for patients presenting with abdominal pain. 800 patients were
randomized to undergo or not to undergo surgeon performed ultrasound and
found diagnostic accuracy to be significantly higher in the group examined with
ultrasound 64.7% versus 56.8% and concluded that that for patients with acute
abdominal pain higher diagnostic accuracy was achieved when the surgeons use
ultrasound as a diagnostic compliment to standard examination. The use of
bedside ultrasound should be considered in emergency departments.
In our study out of 50 cases of acute abdomen the sensitivity, specificity, PPV &
NPV were 84.1%, 50%, 92.5%& 30% respectively.
XCII
CONCLUSION
From our study it could be concluded that, in acute abdominal conditions,
ultrasound is a more sensitive investigation and is non invasive. Hence can be
used as an initial diagnostic tool. However, its value is limited in the definitive
diagnosis of acute abdominal conditions. In acute appendicitis and hepatobiliary
and pancreatic system ultrasound is both sensitive & specific and should be the
initial modality of investigation and can be a good diagnostic tool. It has limited
role in the assessment of bowel disorders.
In the chronic abdominal conditions ultrasound is the initial modality of
investigation as it is non invasive and is more accurate in the diagnosis of
hepatobiliary, pancreatic, genitourinary & in the detection of abdominal
tuberculosis. However it is limited by its inability to detect bowel disorders.
XCIII
SUMMARY
Early diagnosis of acute & chronic abdominal conditions is necessary to decide
about the further management of the condition. Ultrasound being a simple, non
invasive, easily operable is the most common method used for the diagnosis of
these conditions and helps in deciding the need for surgery in most of the cases
and also avoids un necessary surgical intervention preventing the patient from
surgical complications and also helps in ruling out non surgical acute abdominal
conditions. However this being operator dependent, and influenced by factors
like gas in the bowel etc needs proper preparation of the patient prior to the
examination, and high resolution ultrasound has increased the diagnostic
accuracy in diagnosing these conditions. Hence ultrasound should be an initial
diagnostic modality for assessing acute & chronic abdominal conditions.
XCIV
Bibliography:
1.Grainger and Allisons Diagnostic radiology 5th Edition Vol. 1 Sec 1 Chapter 3 page no
55-77.
2.Rao- PM Rhea. JJ, Nomiltine RA et al Helical CT techniques for the diagnosis of
acute Appendicitis: Prospective evaluation of a focused Appendix CT examination.
Radiology 1997:140:139-144.
3.Gaitini D, Beck-Razi N, Mor–Yosef D et al. Diagnosis of acute appendicitis in adults;
Accuracy of color Doppler Sonography and MDCT compared with surgery & clinical
follow up. AJR amj roentgenology 2008;190:1300-1306.
4.Birnbaum BA, Wilson SR. Appendicitis atthe millenium. Radiology 2000;215:337-48.
5.Puylaert JB, Acute Appendicitis Ultrasound evaluation using Graded Compression.
Rad 1986;158:355-60.
6.Abu-Yousef MM, Bleicher JJ, Maher JW et al. High Resolution Sonography of Acute
Appendicitis. AJR 1987;149:53-58.
7. Juien B.C.M. Puylaert.Ultrasonography of the abdomen: Radiological Clinics N Am
2003;41:1227-1242.
8.Quillin SP, Siegel MJ, Appendicitis; efficacy of Colour Doppler Sonography
Radiology 1994;191:557-60.
9.Uggowitzer M, Kugler C, Schramayer G, et al. Sonography of Acute Cholecystitis, a
comparision of Colour & Power Doppler Sonography in detecting a Hypervascular GB
wall. AJR Amj Roentgenology 1997;168:707-12.
XCV
10.Kim PN, Lee KS, Kim IY, Bae WK, Lee BH 1994 Gall Bladder Perforation
comparision of Ultrasound findings with CT abdomen imaging 19:239-42.
11.Hessler PC, Hill DS, Detorie FM, Rocco AF 1981, High Accuracy Sonographic
Recognition of Gall Stones AJR 136;517-520.
12.Raptopoulos V, D Orsi C, Smith E, Reuter K, Moss L, Kleinman P 1982 Dynamic
Cholecystosonography of the contracted Gall Bladder; the Double Arc Shadow Sign
AJR 138;275-278.
13.Niederan C, Muller J, Sonnenberg A et al. Extrahepatic bile ducts in healthy subjects,
in patients with Cholelithiasis and in post Cholecystectomy patients; A prospective US
study.
J Clin Ultrasonography .1983;11:23-27.
14.Koenigsberg M, Wiener SN, Walzer A.The Accuracy of Sonography in the
differential diagnosis of Obstructive Jaundice: A comparision with Cholangiography.
Radiology 1979;133:157-65.
15.Bhargava S, Vashisht S, Kakaria A. et al. Choledocholithiasis- An Ultrasound study
with comparative evaluation with ERCP/PTC. Australas Radiol 1988;32:220-226.
16.Reuter K, Raptopoulos VD, Contelmo N. et al. The diagnosis of a Choledochal cyst
by Ultrasound. Radiology 1980;136:437-38.
17.Aggarwal S, Tandon RK, Vashist S. Radiologic approach to Choledochal cyst Ind J
Gastroenterol 1989;8:107-08.
18.Bolondi L,Li Bassi S et al. Sonography of Chronic Pancreatitis. Radiol Clin North
Am 1989;27: 815- 833.
XCVI
19.Alpern MB, Sandler MA, Kellman GM et al. Chronic Pancreatitis: Ultrasound
features. Radiology 1985;155:215-219.
20.D.E.Morgan,T.H.Baron,J.K.Smith et al. Pancreatic fluid collections prior to
interventional evaluation with MRI compared with CT & USG. Radiology 1997;
203(3):773-78.
21.Tomiyama T, Veno N, Tano S. et al, Assesment of arterial invasion in pancreatic
cancers using Colour Doppler us Amj Gastroenterol 1996;195:327-32.
22.Phillips RL. Computed Tomography and USG in the diagnosis and treatment of Liver
Abscesses. Australian Radiology 1994;38:165-69.
23.Zwiebel W.J. Vascular disorders of the liver. In Zwiebel (ed). Introduction to
Vascular USG 4th edition WB Saunders Company 2000.
24.Noguera A.M, Montserrat E, Torrubia S. et al. Doppler in Hepatic Cirrhosis and
Chronic Hepatitis. Seminars in Ultrasound, CT&MRI; 2002;23(1):19-36.
25. Arora a, sharna mp, recent trends in the diagnosis and treatment of budd chiari
syndromej assoc. Physicains of india 1992; 40:533-36.
26.Floyd JL. The Radiographic Gamut of BCS Amj Gastroenterol 1981;76:381-87.
27.Menu Y, Alison D, Lorphelin JM et al.BCS Ultrasound evaluation. Radiology 1985;
157:761-64.
28. Joseph A.E.A, Macvicar D. Ultrasound in the diagnosis of Abdominal Abscesses.
Clin Radiol 1990;42:154- 56.
29.Marti-Bonmati L,Serrano F.M. Complications of Hepatic Hydatid cysts.USG,CT
&MRI diagnosis Gastroint Radiolog 1990;15:119- 25.
XCVII
30.Beggs I, The radiology of Hydatid disease AJR 1985;145:639-48.
31.Von Sinner, Walther N. New diagnostic sign in Hydatid disease; Radiography, USG
CT & MRI correlated to pathology. Eur J Radiol 1990;12:150-59.
32.De Diego J, KlumberriFJj, Franguart J. et al CT in Hepatic Ecchinococcosis Ajr
1998;139:699-702.
33.Brannigan M, Burns PN, Wilson ST. Blood flow pattern in focal liver lesions ay
microbubble enhanced uUSG Radiographics 2004;24:912 -35.
34.Yu S.C.H, Yeung D.T.KJ, So N.M.C. Imaging features of HCC. Clin Radiol
2004;59:145-56.
35.Ross PR, Erturk SM. Malignant tumors of the liver. In Gore RM, Levine MS (eds);
Text book of Gastroint radiol Phiedelphia, Saunders 2008;1623-62.
36.Paky MR, Ros PR. Hepatic metastasis. Hepatic imaging Radiol Clin N Am
1998;6(2): 349-64.
37.Baker EL. Kertan RK jr in Gazelle GS, Saini S, Mueller P (eds). Hepatobiliary and
Pancreatic Radiology Imaging and Intervention. Imaging of Portal HTN 1998.
38.Bolandi L, Gaiani S, Piscalylia F. et al the Portal venous system. Hylton B, Meire H,
Cosgrove D, Dewbury K, Farrant P (eds); Abdominal and General ultrasound 2nd edition
Churchill Livingstone 2001.page 69 -79.
39.Zwiebel WJ. Vascular disorders of the liver. In Zwiebel(ed) introduction to vascular
USG 4th edition WB Saunders company 2000.
40.Horsthuis K, Peter C.F Stokkers,& Stocker J. Detection of IBD. Diagnostic
performance of cross sectional imaging modalities Abd Imaging 2008;33:407-416.
XCVIII
41.valette PJ Rioux M, pilluel F. et al USG of Chronic inflammatory Bowel diseases.
Eur Radiol 2001;11:1859-66.
42.Maconi G, Parente F, Porro G. Hydrogen Peroxide Enhanced Ultrasound
Fistulography in the assesment of Enterocutaneous fistulas complicating Crohn’s
disease.
GUT 1999;45:874-878.
43.Chen SC, Wang HP, Chen WJ. et al. Selective use of Ultrasonography for the
detection of Pnuemoperitoneum. ACAD. Emerg. Med 2002;9:643- 645.
44.Jones R. Recognition of Pneumoperitoneum using bedside ultrasound in critically ill
patients presenting with Acute Abdominal pain AMJ Emerg Med 2007;25:838-41.
45.Hulnick DH, Megibow AJ, Naidich DP, et al Abd TB: CT evaluation. Radiology
1985;157:199-204.
46.Lundstedt C, Nymon R, Brimsar J, Hugosson C, Kagevi I. Imaging of Abd TB,
abdominal manifestations in 112 patients Acta Radiol. 1996;37:489-95.
47.Malik A, Saxena NC. Ultrasound in Abd TB. Abdominal imaging 2003;29:574-579.
48.Kedar RP, Shah PP, Shivde RS. et al. Sonographic findings in GI & Peritoneal TB.
Clin Radiol 1994;49:24-29.
49.Jain R, Sawhney S, Bhargava DK.et al. diagnosis of Abd TB. Sonographic findings in
pts with early disease AJR 1995;165:1391-95.
50.Ganeshan S, Indrajeet IK. Ultrasound in abdominal lymph node TB a review of 42
cases Ind J of Radiol Imaging 1993;3:231-36.
XCIX
51.Batra A, Gulati MS, Sarma D, Paul SB, Sonographic appearance in abdominal
Tuberculosis. J Clin USG 2000; 28:233-45.
52.Leder RA, Low VH. Tuberculosis of abdomen. Radiol Clin North Am 1995;33:691-
705.
53.Dubbins PA. The Small Bowel and Colon in abdominal and general Ultrasound.
Cosgrove D, Mere H, Dewbury K(eds) Churchill Livingstone 1993;2:765-76.
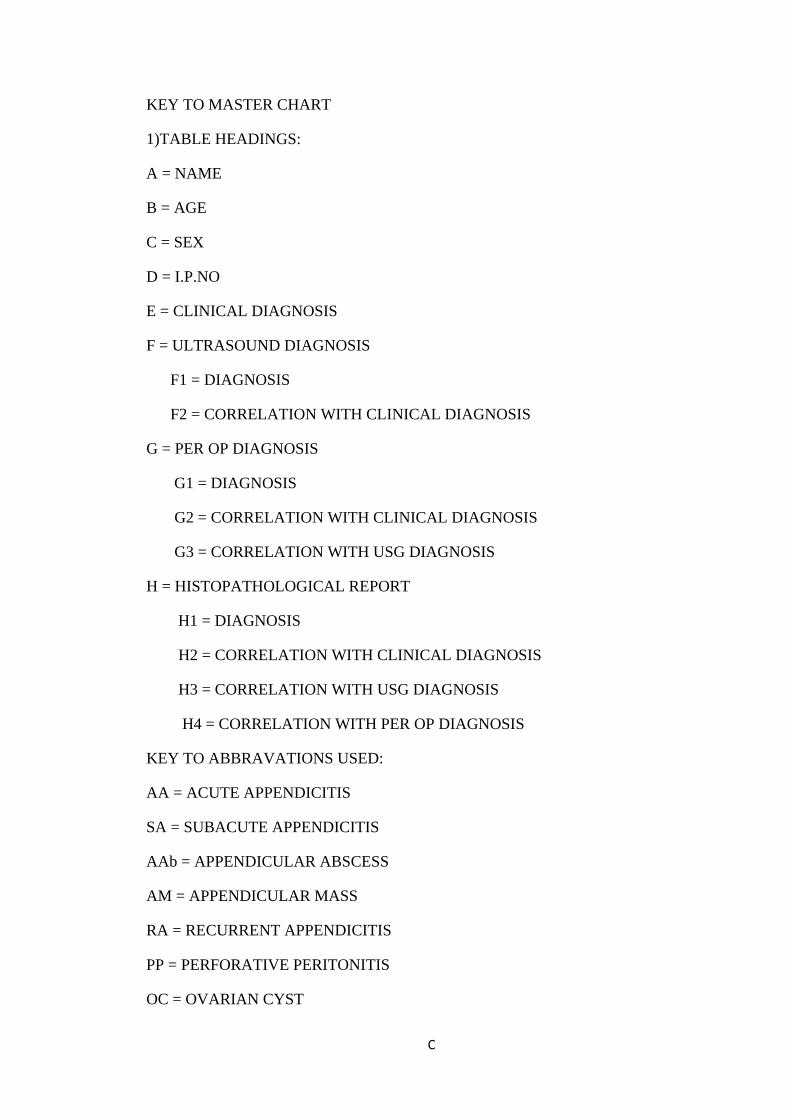
C
KEY TO MASTER CHART
1)TABLE HEADINGS:
A = NAME
B = AGE
C = SEX
D = I.P.NO
E = CLINICAL DIAGNOSIS
F = ULTRASOUND DIAGNOSIS
F1 = DIAGNOSIS
F2 = CORRELATION WITH CLINICAL DIAGNOSIS
G = PER OP DIAGNOSIS
G1 = DIAGNOSIS
G2 = CORRELATION WITH CLINICAL DIAGNOSIS
G3 = CORRELATION WITH USG DIAGNOSIS
H = HISTOPATHOLOGICAL REPORT
H1 = DIAGNOSIS
H2 = CORRELATION WITH CLINICAL DIAGNOSIS
H3 = CORRELATION WITH USG DIAGNOSIS
H4 = CORRELATION WITH PER OP DIAGNOSIS
KEY TO ABBRAVATIONS USED:
AA = ACUTE APPENDICITIS
SA = SUBACUTE APPENDICITIS
AAb = APPENDICULAR ABSCESS
AM = APPENDICULAR MASS
RA = RECURRENT APPENDICITIS
PP = PERFORATIVE PERITONITIS
OC = OVARIAN CYST
CI
RC = RENAL CALCULUS
OT = OVARIAN TORSION
ICM = ILIOCECAL MASS
Co = COLITIS
ChrA = CHRONIC APPENDICITIS
AIO = ACUTE INTESTINAL OBSTRUCTION
AC = ACUTE CHOLECYSTITIS
ACC = ACUTE CALCULUS CHOLECYSTITIS
OM = OMPHALITIS
LA = LIVER ABSCESS
EGB = EMPYEMA OF GALL BLADDER
UC = URETERIC COLIC
OJ = OBSTRUCTIVE JAUNDICE
ChrC = CHRONIC CHOLECYSTITIS
ChrCC = CHRONIC CALCULUS CHOLECYSTITIS
Chol =CHOLELITHIASIS
RPC =RUPTURED PSUEDOPANCREATIC CYST
Ca.S = CARCINOMA STOMACH
GOO = GARTRIC OUTLET OBSTRUCTION
DU=DUODENAL ULCER
IMAb=INTRAMUSCULAR ABSCESS
Isch Col=ISCHENIC COLITIS
PUD=PEPTIC ULCER DISEASE
LMS OF SI=LEIOMYOSARCOMA OF SMALL INTESTINE
IH=INGUINAL HERNIA
CaR= CARCINOMA RECTUM
CII
Ca COL= CARCINOMA COLON
UT= UNDECENDED TESTIS
IC GROWTH=ILEOCECAL GROWTH
IC TB= ILEOCECAL TUBERCULOSIS
Chr P= CHRONIC PANCREATITIS
HC= HYDATID CYST
RPT=RETROPERITONEAL TUMOUR
LUT=LEFT UNDECENDED TESTIS
BPH=BENIGN PROSTATIC HYPERTROPHY
VC=VESICAL CALCULUS
EHPHTN WITH PPF=EXTRA HEPATIC PORTAL HYPERTENSION WITH PERIPORTAL FIBROSIS
UH=UMBILICAL HERNIA
In H= INCISIONAL HERNIA
HH=HIATUS HERNIA
APD=ACID PEPTIC DISEASE
Divert= DIVERTICULOSIS
Intra Per MASS= INTRA PERITONEAL MASS
PPC=PSEUDO PANCREATIC CYST
BOO= BLADDER OUT LET OBSTRUCTION
PVT=PORTAL VEIN THROMBOSIS
PUH= PARAUMBILICAL HERNIA
DJ FLEXURE=DUODENOJEJUNAL FLEXURE
Ca T= CARCINOMA TESTIS
CVC SPLEEN=CHRONIC VENOUS CONGESTION OF SPLEEN

CIII

CIV

CV

CVI

107

108

109
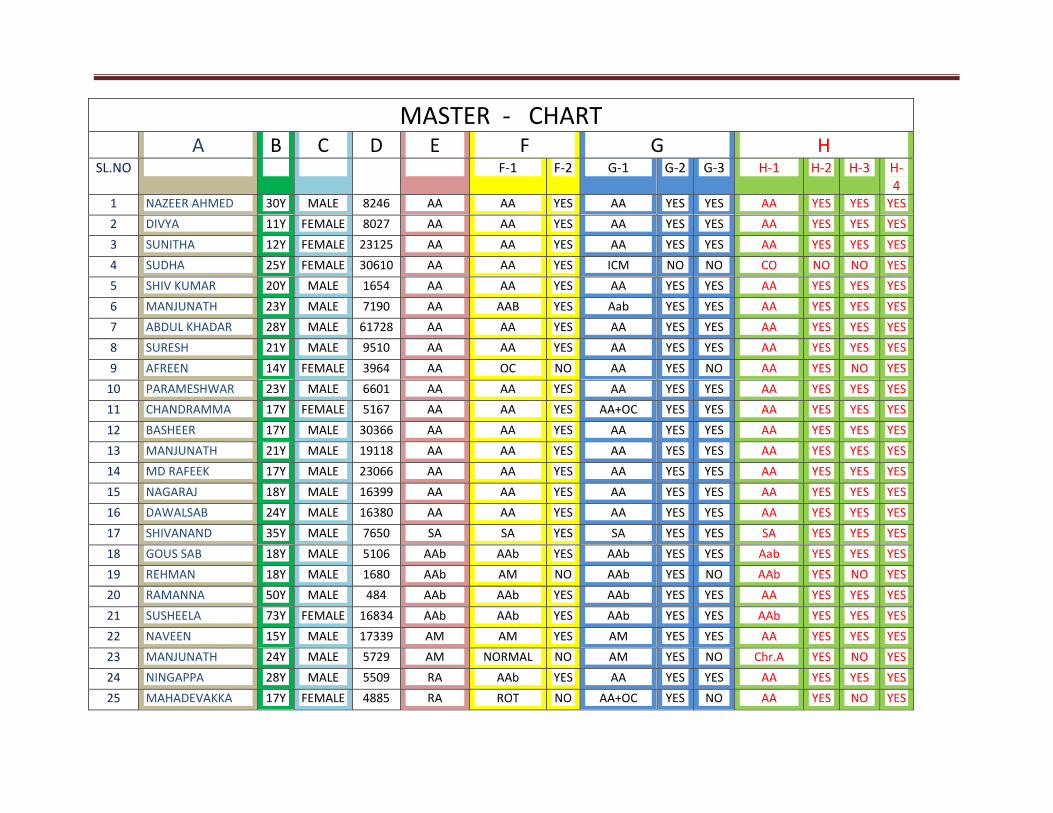
MASTER ‐ CHART A B C D E F G H
SL.NO F‐1 F‐2 G‐1 G‐2 G‐3 H‐1 H‐2 H‐3 H‐4
1 NAZEER AHMED 30Y MALE 8246 AA AA YES AA YES YES AA YES YES YES
2 DIVYA 11Y FEMALE 8027 AA AA YES AA YES YES AA YES YES YES
3 SUNITHA 12Y FEMALE 23125 AA AA YES AA YES YES AA YES YES YES
4 SUDHA 25Y FEMALE 30610 AA AA YES ICM NO NO CO NO NO YES
5 SHIV KUMAR 20Y MALE 1654 AA AA YES AA YES YES AA YES YES YES
6 MANJUNATH 23Y MALE 7190 AA AAB YES Aab YES YES AA YES YES YES
7 ABDUL KHADAR 28Y MALE 61728 AA AA YES AA YES YES AA YES YES YES
8 SURESH 21Y MALE 9510 AA AA YES AA YES YES AA YES YES YES
9 AFREEN 14Y FEMALE 3964 AA OC NO AA YES NO AA YES NO YES
10 PARAMESHWAR 23Y MALE 6601 AA AA YES AA YES YES AA YES YES YES
11 CHANDRAMMA 17Y FEMALE 5167 AA AA YES AA+OC YES YES AA YES YES YES
12 BASHEER 17Y MALE 30366 AA AA YES AA YES YES AA YES YES YES
13 MANJUNATH 21Y MALE 19118 AA AA YES AA YES YES AA YES YES YES
14 MD RAFEEK 17Y MALE 23066 AA AA YES AA YES YES AA YES YES YES
15 NAGARAJ 18Y MALE 16399 AA AA YES AA YES YES AA YES YES YES
16 DAWALSAB 24Y MALE 16380 AA AA YES AA YES YES AA YES YES YES
17 SHIVANAND 35Y MALE 7650 SA SA YES SA YES YES SA YES YES YES
18 GOUS SAB 18Y MALE 5106 AAb AAb YES AAb YES YES Aab YES YES YES
19 REHMAN 18Y MALE 1680 AAb AM NO AAb YES NO AAb YES NO YES
20 RAMANNA 50Y MALE 484 AAb AAb YES AAb YES YES AA YES YES YES
21 SUSHEELA 73Y FEMALE 16834 AAb AAb YES AAb YES YES AAb YES YES YES
22 NAVEEN 15Y MALE 17339 AM AM YES AM YES YES AA YES YES YES
23 MANJUNATH 24Y MALE 5729 AM NORMAL NO AM YES NO Chr.A YES NO YES
24 NINGAPPA 28Y MALE 5509 RA AAb YES AA YES YES AA YES YES YES
25 MAHADEVAKKA 17Y FEMALE 4885 RA ROT NO AA+OC YES NO AA YES NO YES
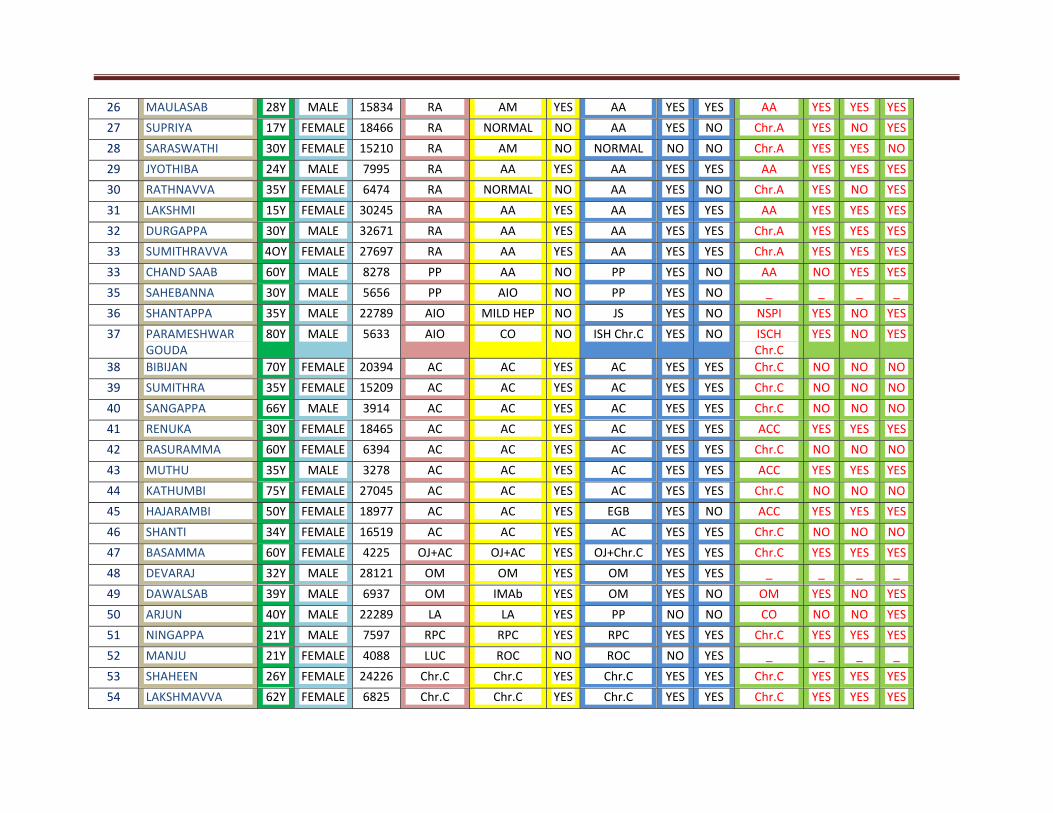
26 MAULASAB 28Y MALE 15834 RA AM YES AA YES YES AA YES YES YES
27 SUPRIYA 17Y FEMALE 18466 RA NORMAL NO AA YES NO Chr.A YES NO YES
28 SARASWATHI 30Y FEMALE 15210 RA AM NO NORMAL NO NO Chr.A YES YES NO
29 JYOTHIBA 24Y MALE 7995 RA AA YES AA YES YES AA YES YES YES
30 RATHNAVVA 35Y FEMALE 6474 RA NORMAL NO AA YES NO Chr.A YES NO YES
31 LAKSHMI 15Y FEMALE 30245 RA AA YES AA YES YES AA YES YES YES
32 DURGAPPA 30Y MALE 32671 RA AA YES AA YES YES Chr.A YES YES YES
33 SUMITHRAVVA 4OY FEMALE 27697 RA AA YES AA YES YES Chr.A YES YES YES
33 CHAND SAAB 60Y MALE 8278 PP AA NO PP YES NO AA NO YES YES
35 SAHEBANNA 30Y MALE 5656 PP AIO NO PP YES NO _ _ _ _
36 SHANTAPPA 35Y MALE 22789 AIO MILD HEP NO JS YES NO NSPI YES NO YES
37 PARAMESHWAR GOUDA
80Y MALE 5633 AIO CO NO ISH Chr.C YES NO ISCH Chr.C
YES NO YES
38 BIBIJAN 70Y FEMALE 20394 AC AC YES AC YES YES Chr.C NO NO NO
39 SUMITHRA 35Y FEMALE 15209 AC AC YES AC YES YES Chr.C NO NO NO
40 SANGAPPA 66Y MALE 3914 AC AC YES AC YES YES Chr.C NO NO NO
41 RENUKA 30Y FEMALE 18465 AC AC YES AC YES YES ACC YES YES YES
42 RASURAMMA 60Y FEMALE 6394 AC AC YES AC YES YES Chr.C NO NO NO
43 MUTHU 35Y MALE 3278 AC AC YES AC YES YES ACC YES YES YES
44 KATHUMBI 75Y FEMALE 27045 AC AC YES AC YES YES Chr.C NO NO NO
45 HAJARAMBI 50Y FEMALE 18977 AC AC YES EGB YES NO ACC YES YES YES
46 SHANTI 34Y FEMALE 16519 AC AC YES AC YES YES Chr.C NO NO NO
47 BASAMMA 60Y FEMALE 4225 OJ+AC OJ+AC YES OJ+Chr.C YES YES Chr.C YES YES YES
48 DEVARAJ 32Y MALE 28121 OM OM YES OM YES YES _ _ _ _
49 DAWALSAB 39Y MALE 6937 OM IMAb YES OM YES NO OM YES NO YES
50 ARJUN 40Y MALE 22289 LA LA YES PP NO NO CO NO NO YES
51 NINGAPPA 21Y MALE 7597 RPC RPC YES RPC YES YES Chr.C YES YES YES
52 MANJU 21Y FEMALE 4088 LUC ROC NO ROC NO YES _ _ _ _
53 SHAHEEN 26Y FEMALE 24226 Chr.C Chr.C YES Chr.C YES YES Chr.C YES YES YES
54 LAKSHMAVVA 62Y FEMALE 6825 Chr.C Chr.C YES Chr.C YES YES Chr.C YES YES YES
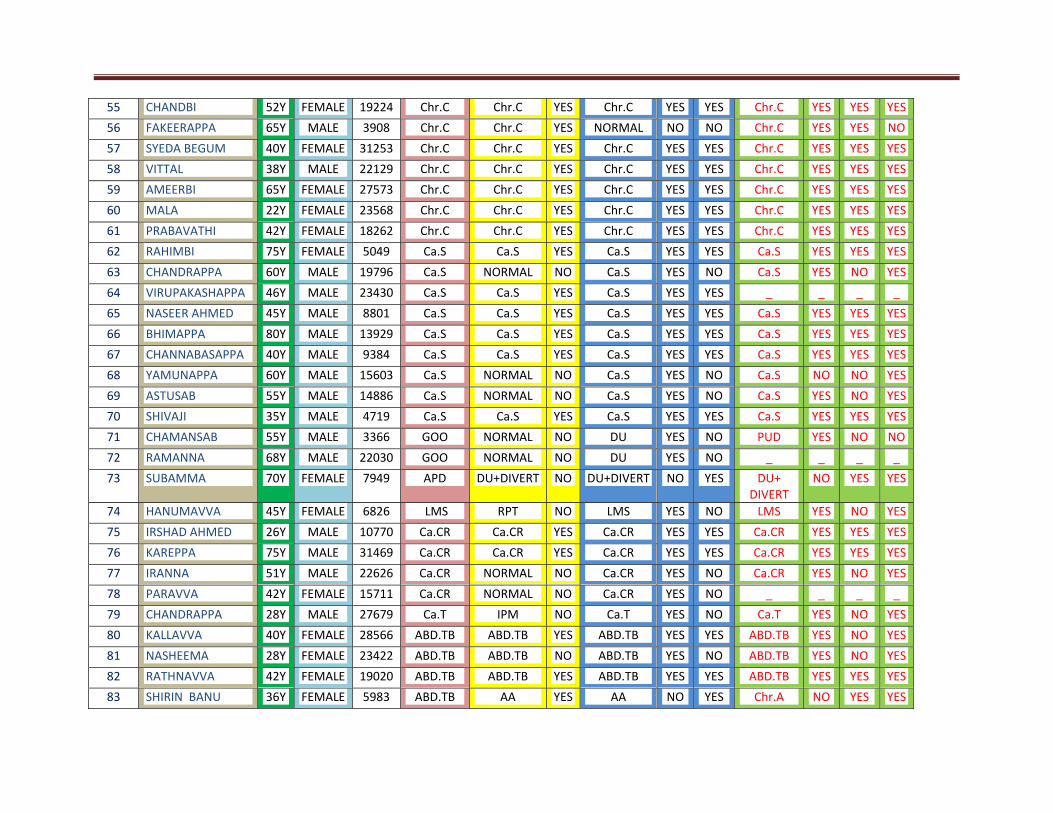
55 CHANDBI 52Y FEMALE 19224 Chr.C Chr.C YES Chr.C YES YES Chr.C YES YES YES
56 FAKEERAPPA 65Y MALE 3908 Chr.C Chr.C YES NORMAL NO NO Chr.C YES YES NO
57 SYEDA BEGUM 40Y FEMALE 31253 Chr.C Chr.C YES Chr.C YES YES Chr.C YES YES YES
58 VITTAL 38Y MALE 22129 Chr.C Chr.C YES Chr.C YES YES Chr.C YES YES YES
59 AMEERBI 65Y FEMALE 27573 Chr.C Chr.C YES Chr.C YES YES Chr.C YES YES YES
60 MALA 22Y FEMALE 23568 Chr.C Chr.C YES Chr.C YES YES Chr.C YES YES YES
61 PRABAVATHI 42Y FEMALE 18262 Chr.C Chr.C YES Chr.C YES YES Chr.C YES YES YES
62 RAHIMBI 75Y FEMALE 5049 Ca.S Ca.S YES Ca.S YES YES Ca.S YES YES YES
63 CHANDRAPPA 60Y MALE 19796 Ca.S NORMAL NO Ca.S YES NO Ca.S YES NO YES
64 VIRUPAKASHAPPA 46Y MALE 23430 Ca.S Ca.S YES Ca.S YES YES _ _ _ _
65 NASEER AHMED 45Y MALE 8801 Ca.S Ca.S YES Ca.S YES YES Ca.S YES YES YES
66 BHIMAPPA 80Y MALE 13929 Ca.S Ca.S YES Ca.S YES YES Ca.S YES YES YES
67 CHANNABASAPPA 40Y MALE 9384 Ca.S Ca.S YES Ca.S YES YES Ca.S YES YES YES
68 YAMUNAPPA 60Y MALE 15603 Ca.S NORMAL NO Ca.S YES NO Ca.S NO NO YES
69 ASTUSAB 55Y MALE 14886 Ca.S NORMAL NO Ca.S YES NO Ca.S YES NO YES
70 SHIVAJI 35Y MALE 4719 Ca.S Ca.S YES Ca.S YES YES Ca.S YES YES YES
71 CHAMANSAB 55Y MALE 3366 GOO NORMAL NO DU YES NO PUD YES NO NO
72 RAMANNA 68Y MALE 22030 GOO NORMAL NO DU YES NO _ _ _ _
73 SUBAMMA 70Y FEMALE 7949 APD DU+DIVERT NO DU+DIVERT NO YES DU+ DIVERT
NO YES YES
74 HANUMAVVA 45Y FEMALE 6826 LMS RPT NO LMS YES NO LMS YES NO YES
75 IRSHAD AHMED 26Y MALE 10770 Ca.CR Ca.CR YES Ca.CR YES YES Ca.CR YES YES YES
76 KAREPPA 75Y MALE 31469 Ca.CR Ca.CR YES Ca.CR YES YES Ca.CR YES YES YES
77 IRANNA 51Y MALE 22626 Ca.CR NORMAL NO Ca.CR YES NO Ca.CR YES NO YES
78 PARAVVA 42Y FEMALE 15711 Ca.CR NORMAL NO Ca.CR YES NO _ _ _ _
79 CHANDRAPPA 28Y MALE 27679 Ca.T IPM NO Ca.T YES NO Ca.T YES NO YES
80 KALLAVVA 40Y FEMALE 28566 ABD.TB ABD.TB YES ABD.TB YES YES ABD.TB YES NO YES
81 NASHEEMA 28Y FEMALE 23422 ABD.TB ABD.TB NO ABD.TB YES NO ABD.TB YES NO YES
82 RATHNAVVA 42Y FEMALE 19020 ABD.TB ABD.TB YES ABD.TB YES YES ABD.TB YES YES YES
83 SHIRIN BANU 36Y FEMALE 5983 ABD.TB AA YES AA NO YES Chr.A NO YES YES
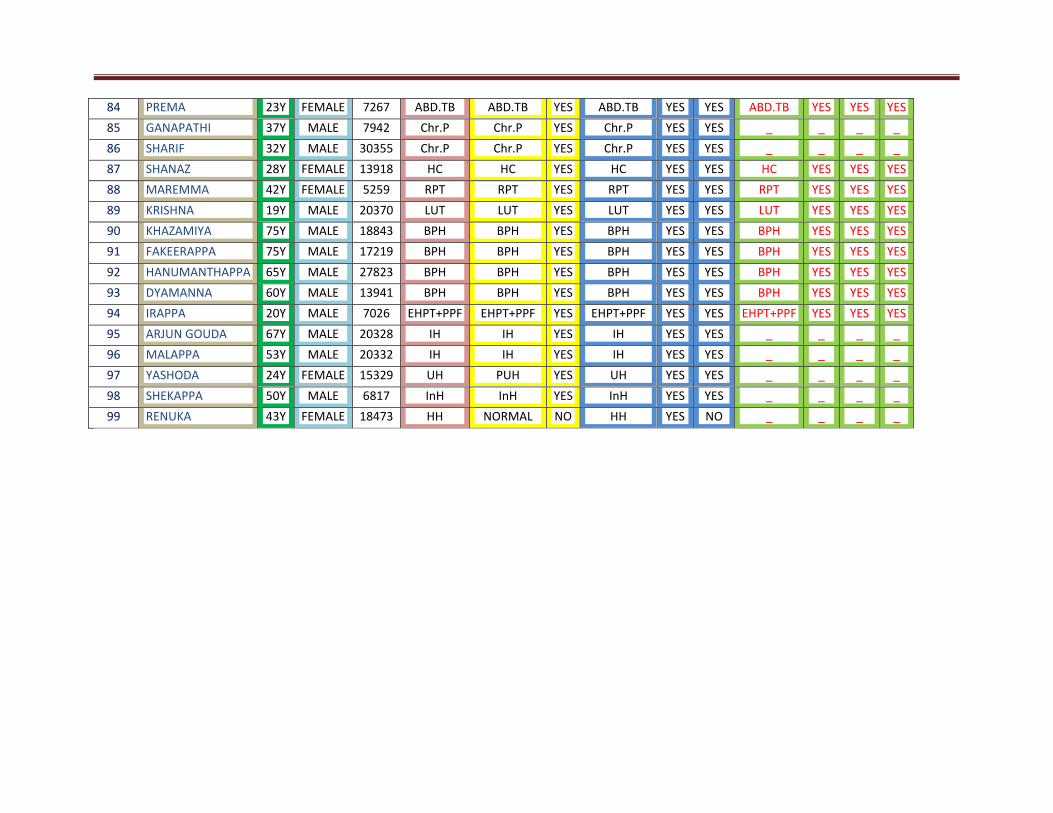
84 PREMA 23Y FEMALE 7267 ABD.TB ABD.TB YES ABD.TB YES YES ABD.TB YES YES YES
85 GANAPATHI 37Y MALE 7942 Chr.P Chr.P YES Chr.P YES YES _ _ _ _
86 SHARIF 32Y MALE 30355 Chr.P Chr.P YES Chr.P YES YES _ _ _ _
87 SHANAZ 28Y FEMALE 13918 HC HC YES HC YES YES HC YES YES YES
88 MAREMMA 42Y FEMALE 5259 RPT RPT YES RPT YES YES RPT YES YES YES
89 KRISHNA 19Y MALE 20370 LUT LUT YES LUT YES YES LUT YES YES YES
90 KHAZAMIYA 75Y MALE 18843 BPH BPH YES BPH YES YES BPH YES YES YES
91 FAKEERAPPA 75Y MALE 17219 BPH BPH YES BPH YES YES BPH YES YES YES
92 HANUMANTHAPPA 65Y MALE 27823 BPH BPH YES BPH YES YES BPH YES YES YES
93 DYAMANNA 60Y MALE 13941 BPH BPH YES BPH YES YES BPH YES YES YES
94 IRAPPA 20Y MALE 7026 EHPT+PPF EHPT+PPF YES EHPT+PPF YES YES EHPT+PPF YES YES YES
95 ARJUN GOUDA 67Y MALE 20328 IH IH YES IH YES YES _ _ _ _
96 MALAPPA 53Y MALE 20332 IH IH YES IH YES YES _ _ _ _
97 YASHODA 24Y FEMALE 15329 UH PUH YES UH YES YES _ _ _ _
98 SHEKAPPA 50Y MALE 6817 InH InH YES InH YES YES _ _ _ _
99 RENUKA 43Y FEMALE 18473 HH NORMAL NO HH YES NO _ _ _ _