Abnormal autonomic and associated brain activities during rest in autism spectrum disorder
19
BRAIN A JOURNAL OF NEUROLOGY Abnormal autonomic and associated brain activities during rest in autism spectrum disorder Tehila Eilam-Stock, 1,2,3 Pengfei Xu, 4 Miao Cao, 4 Xiaosi Gu, 5,6 Nicholas T. Van Dam, 1,3 Evdokia Anagnostou, 3,7 Alexander Kolevzon, 3,7 Latha Soorya, 3,7 Yunsoo Park, 3 Michael Siller, 8 Yong He, 4 Patrick R. Hof 9 and Jin Fan 1,2,3,7,9 1 Department of Psychology, Queens College, City University of New York, Flushing, NY 11367, USA 2 The Graduate Centre, City University of New York, New York, NY 10016, USA 3 Department of Psychiatry, Icahn School of Medicine at Mount Sinai, New York, NY 10029, USA 4 State Key Laboratory of Cognitive Neuroscience and Learning and International Data Group/McGovern Institute for Brain Research, Beijing Normal University, Beijing, 100875, China 5 Wellcome Trust Centre for Neuroimaging, University College London, London WC1N 3BG, UK 6 Virginia Tech Carilion Research Institute, Roanoke, VA 24016, USA 7 Seaver Autism Centre for Research and Treatment, Icahn School of Medicine at Mount Sinai, New York, NY 10029, USA 8 Department of Psychology, Hunter College, City University of New York, New York, NY 10065, USA 9 Fishberg Department of Neuroscience and Friedman Brain Institute, Icahn School of Medicine at Mount Sinai, New York, NY 10029, USA Correspondence to: Jin Fan, PhD, Department of Psychology, Queens College, City University of New York, Flushing, NY 11367, USA E-mail: [email protected] Autism spectrum disorders are associated with social and emotional deficits, the aetiology of which are not well understood. A growing consensus is that the autonomic nervous system serves a key role in emotional processes, by providing physiological signals essential to subjective states. We hypothesized that altered autonomic processing is related to the socio-emotional deficits in autism spectrum disorders. Here, we investigated the relationship between non-specific skin conductance response, an objective index of sympathetic neural activity, and brain fluctuations during rest in high-functioning adults with autism spectrum disorder relative to neurotypical controls. Compared with control participants, individuals with autism spectrum dis- order showed less skin conductance responses overall. They also showed weaker correlations between skin conductance re- sponses and frontal brain regions, including the anterior cingulate and anterior insular cortices. Additionally, skin conductance responses were found to have less contribution to default mode network connectivity in individuals with autism spectrum disorders relative to controls. These results suggest that autonomic processing is altered in autism spectrum disorders, which may be related to the abnormal socio-emotional behaviours that characterize this condition. Keywords: autism; autonomic nervous system; emotion; skin conductance; resting state Abbreviations: ADI-R = Autism Diagnostic Interview-Revised; ASD = autism spectrum disorders; DMN = default mode network; SCR = skin conductance response doi:10.1093/brain/awt294 Brain 2014: 137; 153–171 | 153 Received March 21, 2013. Revised August 21, 2013. Accepted September 5, 2013 ß The Author (2014). Published by Oxford University Press on behalf of the Guarantors of Brain. All rights reserved. For Permissions, please email: [email protected] at University College London on January 15, 2014 http://brain.oxfordjournals.org/ Downloaded from
Transcript of Abnormal autonomic and associated brain activities during rest in autism spectrum disorder

BRAINA JOURNAL OF NEUROLOGY
Abnormal autonomic and associated brainactivities during rest in autism spectrum disorderTehila Eilam-Stock,1,2,3 Pengfei Xu,4 Miao Cao,4 Xiaosi Gu,5,6 Nicholas T. Van Dam,1,3
Evdokia Anagnostou,3,7 Alexander Kolevzon,3,7 Latha Soorya,3,7 Yunsoo Park,3 Michael Siller,8
Yong He,4 Patrick R. Hof9 and Jin Fan1,2,3,7,9
1 Department of Psychology, Queens College, City University of New York, Flushing, NY 11367, USA
2 The Graduate Centre, City University of New York, New York, NY 10016, USA
3 Department of Psychiatry, Icahn School of Medicine at Mount Sinai, New York, NY 10029, USA
4 State Key Laboratory of Cognitive Neuroscience and Learning and International Data Group/McGovern Institute for Brain Research, Beijing Normal
University, Beijing, 100875, China
5 Wellcome Trust Centre for Neuroimaging, University College London, London WC1N 3BG, UK
6 Virginia Tech Carilion Research Institute, Roanoke, VA 24016, USA
7 Seaver Autism Centre for Research and Treatment, Icahn School of Medicine at Mount Sinai, New York, NY 10029, USA
8 Department of Psychology, Hunter College, City University of New York, New York, NY 10065, USA
9 Fishberg Department of Neuroscience and Friedman Brain Institute, Icahn School of Medicine at Mount Sinai, New York, NY 10029, USA
Correspondence to: Jin Fan, PhD,
Department of Psychology,
Queens College,
City University of New York,
Flushing,
NY 11367,
USA
E-mail: [email protected]
Autism spectrum disorders are associated with social and emotional deficits, the aetiology of which are not well understood.
A growing consensus is that the autonomic nervous system serves a key role in emotional processes, by providing physiological
signals essential to subjective states. We hypothesized that altered autonomic processing is related to the socio-emotional
deficits in autism spectrum disorders. Here, we investigated the relationship between non-specific skin conductance response,
an objective index of sympathetic neural activity, and brain fluctuations during rest in high-functioning adults with autism
spectrum disorder relative to neurotypical controls. Compared with control participants, individuals with autism spectrum dis-
order showed less skin conductance responses overall. They also showed weaker correlations between skin conductance re-
sponses and frontal brain regions, including the anterior cingulate and anterior insular cortices. Additionally, skin conductance
responses were found to have less contribution to default mode network connectivity in individuals with autism spectrum
disorders relative to controls. These results suggest that autonomic processing is altered in autism spectrum disorders, which
may be related to the abnormal socio-emotional behaviours that characterize this condition.
Keywords: autism; autonomic nervous system; emotion; skin conductance; resting state
Abbreviations: ADI-R = Autism Diagnostic Interview-Revised; ASD = autism spectrum disorders; DMN = default mode network;SCR = skin conductance response
doi:10.1093/brain/awt294 Brain 2014: 137; 153–171 | 153
Received March 21, 2013. Revised August 21, 2013. Accepted September 5, 2013
� The Author (2014). Published by Oxford University Press on behalf of the Guarantors of Brain. All rights reserved.
For Permissions, please email: [email protected]
at University C
ollege London on January 15, 2014
http://brain.oxfordjournals.org/D
ownloaded from

IntroductionAutism spectrum disorder (ASD) manifests early in development,
and is characterized by deficits in social interaction and communi-
cation, as well as stereotyped and repetitive behaviours, and re-
stricted interests in domains of activities (American Psychiatric
Association, 2013). Individuals with ASD also exhibit difficulties
in emotional processing, particularly in self-awareness of feelings
(Hill et al., 2004; Silani et al., 2008) and in the interpretation of
feelings of others (Hobson et al., 1988; Baron-Cohen, 1991; Bal
et al., 2010). Despite the extensive investigation into the aetiology
of ASD, the psychophysiological correlates of the socio-emotional
deficits that characterize the disorder are not yet clear. Further
exploration of the physiological and neural substrates of social
and emotional processes is critical for better understanding, diag-
nosis, and treatment of ASD.
The autonomic nervous system regulates the physiological
events associated with emotional experiences, including changes
in heart rate, respiration, pupil dilation and sweating (Craig, 2002;
Barrett et al., 2007). James (1884) and Lange (1885) proposed
that these physiological changes are essential precursors for the
subjective feeling of emotions. This idea has since been supported
and extended by studies demonstrating that different emotional
stimuli generate distinct autonomic activities, which are interpreted
by the brain as different emotional experiences (Ekman, 1983;
Rainville et al., 2006; Harrison et al., 2010). False physiological
feedback affects emotional attributions (Valins, 1966; Liebhart,
1977), and emotional interpretation of ambiguous stimuli (Truax,
1983; Gray et al., 2007). As social situations are often ambiguous
and require rapid interpretation of emotional cues, autonomic ner-
vous system signals play a critical role in socio-emotional
processing.
The initial processing of autonomic signals takes place in the
reticular formation, brainstem and thalamic nuclei, and the hypo-
thalamus, whereas higher-order processing of these signals takes
place mainly in the somatosensory cortex, supplementary motor
area, anterior insular cortex, and anterior cingulate cortex
(Boucsein, 1992; Damasio et al., 2000; Craig, 2002; Porges,
2003; Critchley, 2005). Specifically, the anterior insular cortex,
through bidirectional neural connections with the thalamus, amyg-
dala, nucleus accumbens, anterior cingulate cortex and orbitofron-
tal cortex, is suggested to have a critical role in the integration of
bottom-up interoceptive and exteroceptive signals with top-down
predictions and evaluations of emotional states (Craig, 2002, 2003;
Gray et al., 2007; Harrison et al., 2010; Critchley et al., 2011; Seth
et al., 2011; Gu et al., 2013). The anterior insular cortex and an-
terior cingulate cortex are involved in socio-emotional processing
(Damasio et al., 2000; Adolphs, 2002; Phillips et al., 2003; Frith
and Frith, 2007; Gu et al., 2012, 2013) in addition to their role in
autonomic nervous system regulation, further supporting the
important relationship between socio-emotional processing and
autonomic activity. Abnormal autonomic nervous system activity
may, therefore, be a potential source of the socio-emotional def-
icits that characterize ASD.
Physiological studies have demonstrated abnormal autonomic
nervous system activity in ASD. Abnormal autonomic activity
related to external stimuli has been found in individuals with
ASD, particularly when those stimuli were of a social or emotional
nature (Hirstein et al., 2001; Kylliainen and Hietanen, 2006;
Vaughan Van Hecke et al., 2009). Abnormalities in basal auto-
nomic activity have been observed in ASD as well, including
reduced baseline cardiac parasympathetic activity (Ming et al.,
2005), lower amplitude of respiratory sinus arrhythmia
(Bal et al., 2010), and larger baseline pupil dilation (Anderson
and Colombo, 2009; Anderson et al., 2013) when compared
with matched neurotypical control subjects. Gastrointestinal
symptoms have also been found to be significantly more prevalent
in ASD than in neurotypical samples (Horvath et al., 1999; Molloy
and Manning-Courtney, 2003; White, 2003). These findings of
increased sympathetic and decreased parasympathetic activity sug-
gest an imbalance between these two systems in ASD.
Autonomic activity has also been linked to functional connect-
ivity patterns in the resting brain (Birn et al., 2008; Iacovella and
Hasson, 2011; Fan et al., 2012; Chang et al., 2013). In a recent
study we showed significant contributions of skin conductance
response (SCR) signal, an objective and sensitive marker of sym-
pathetic neural activity (Vetrugno et al., 2003), to the connectivity
strength of the default mode network (DMN) in a healthy cohort
(Fan et al., 2012). Previous investigations of resting-state func-
tional connectivity in ASD have demonstrated weaker connectivity
of the DMN compared with neurotypical control subjects
(Kennedy and Courchesne, 2008b; Monk et al., 2009; Assaf
et al., 2010; Weng et al., 2010). It is possible that these findings
of weaker DMN connectivity in ASD may be explained, at least in
part, by differences in autonomic nervous system activity between
the groups.
We hypothesized that ASD is associated with abnormal auto-
nomic and correlated brain activities. This may stem from alter-
ations in the central generation of autonomic response, the
peripheral conductance of autonomic nervous system signals,
and/or the central representations of physiological changes. To
test our hypothesis, we recorded skin conductance and simultan-
eously measured brain activity during rest using functional MRI
from high-functioning adults with ASD, as well as from demo-
graphically matched neurotypical control subjects. We predicted
that the rate of non-specific (not task-evoked) SCR would differ
between the groups, and that there would be differences in brain
activity and connectivity associated with SCR, such that (i) SCR
would be associated with subcortical and cortical brain regions
that process and modulate autonomic activity to a lesser extent
in ASD compared with neurotypical controls; and (ii) differences in
DMN connectivity strength between ASD and neurotypical
controls could be explained, at least partially, by differences in
autonomic nervous system activity.
Materials and methods
ParticipantsSeventeen high-functioning adults with autism (n = 12) or Asperger’s
syndrome (n = 5) (ASD group) and 15 matched neurotypical control
participants were evaluated at the Seaver Autism Centre for Research
154 | Brain 2014: 137; 153–171 T. Eilam-Stock et al.
at University C
ollege London on January 15, 2014
http://brain.oxfordjournals.org/D
ownloaded from

and Treatment, Icahn School of Medicine at Mount Sinai (Table 1 for
demographic data). All participants underwent a diagnostic evaluation
consisting of psychiatric, medical, and developmental assessments, as
well as IQ measurement using the Wechsler Adult Intelligence Scale
(WAIS-III) (Wechsler, 1997). Diagnoses of autism or Asperger’s syn-
drome were determined by psychiatric interview according to the
Diagnostic and Statistical Manual for Mental Disorders, Fourth
Edition (DSM-IV-TR), and confirmed by the Autism Diagnostic
Observation Schedule-Generic (ADOS-G) (Lord et al., 2000), as well
as the Autism Diagnostic Interview-Revised (ADI-R) (Lord et al.,
1994). Exclusion criteria included epilepsy, history of schizophrenia,
schizoaffective disorder or other Axis I mental disorders, except for
obsessive-compulsive disorder (given the phenotypic overlap with
ASD), and use of depot neuroleptic medication or other psychoactive
drugs within the 5 weeks prior to participation. Participants who had a
lifetime history of substance/alcohol dependence and/or abuse within
the last year were also excluded. For the healthy control group, par-
ticipants were excluded based on medical illness or history in first-
degree relatives of developmental disorders, learning disabilities,
autism, affective disorders, and anxiety disorders. All participants pro-
vided written informed consent, approved by the Icahn School of
Medicine at Mount Sinai Institutional Review Board.
Data acquisition
Skin conductance response acquisition
SCR was acquired according to the procedure described by Fan et al.
(2012). Briefly, SCR was recorded using the GSR100C amplifier
(BIOPAC Systems), together with the base module MP150 and the
AcqKnowledge software (version 3.9.1.6). The GSR100C measures
skin conductance by applying a constant voltage of 0.5 V between
two electrodes that are attached to the skin. This allows for the meas-
urements of both skin conductance level and SCR, which vary with
sweat gland activity due to stress, arousal or emotional excitement.
Skin conductance (measured in mS) was recorded using a 2000-Hz
sampling rate (gain = 2 mS/V, both high-pass filters = DC, low-pass
filter = 10 Hz). After cleaning the skin with alcohol swabs, two EL507
disposable EDA (isotonic gel) electrodes were placed on the palmar
surface of the distal phalanges of the big and second toes of left foot.
The electrode leads were shielded and the signal was low-pass filtered
(using the MRI-Compatible MRI CBL/FILTER System MECMRI-
TRANS) to reduce radiofrequency interference from the scanner.
BIOPAC recording was synchronized to the E-Prime (Psychology
Software Tools) program through the parallel port of the computers
to enable precise time alignment of skin conductance recording with
scan onsets.
Image acquisition
All brain images were obtained using a 3 T Siemens Allegra MRI
system at the Icahn School of Medicine at Mount Sinai, and were
acquired parallel to the anterior-posterior commissures axis (AC-PC).
Foam padding was used to reduce head motion. Whole-brain
anatomical T2-weighted images were acquired in high-resolution
using a turbo spin-echo plus sequence: 40 axial slices of 4 mm thick-
ness; skip = 0 mm; repetition time = 4050 ms; echo time = 99 ms; flip
angle = 170�; field of view = 240 mm; matrix size = 448 � 512; voxel
size = 0.47 � 0.47 � 4 mm. After the anatomical image acquisition,
one run of T2*-weighted images was obtained during rest,
corresponding to the T2-weighted images localization, using a 6 min
gradient echoplanar imaging sequence for resting-state functional
MRI: 40 axial slices, 4-mm thick; skip = 0 mm; repetition
time = 2500 ms; echo time = 27 ms; flip angle = 82�; field of view =
240 mm; matrix size = 64 � 64; in-plane resolution = 3.75 � 3.75 mm.
The resting-state functional MRI run started with two dummy volumes
before the onset of the fixation to allow for equilibration of T1 satur-
ation effects, followed by 144 image volumes. Refer to the
Supplementary material for a detailed procedure of the eyes-open
resting-state scan.
Data analysis
Skin conductance analysis
Skin conductance level was calculated as the average of all data points
on the skin conductance waveform for each of the participants. A
Table 1 Demographic data (means � SD) of ASD and neurotypical control groups
Subject characteristics ASD NC t P(n = 17) (n = 15)
Age (years) 26.1 � 6.5 27.1 � 8.2 0.37 0.72
Handedness score 60.0 � 53.40 87.3 � 11.6 2.06 0.06
Years of educationa 14.90 � 2.3 16.2 � 1.8 1.7 0.10
Parents’ socio-economic status 88.35 � 18.73 90.73 � 23.19 0.32 0.75
Full-scale IQ 110.3 � 18.6 112.6 � 12.5 0.42 0.68
ASD diagnosis (autism/Asperger’s) 12/5
ADI-Rb
Social 18.3 � 8.0
Verbal communication 16.0 � 4.8
Repetitive behaviour 5.9 � 3.0
Development 3.0 � 1.6
ADOS-G
Communication 3.1 � 1.5
Social 7.3 � 2.6
Imagination 0.7 � 0.5
Stereotyped behaviours 1.4 � 1.4
aYears of education data was not available for five participants, therefore ASD: n = 14, neurotypical controls (NC): n = 13.bADI-R scores were not available for one participant, therefore n = 16 for this measure.
Abnormal autonomic and brain activities in autism Brain 2014: 137; 153–171 | 155
at University C
ollege London on January 15, 2014
http://brain.oxfordjournals.org/D
ownloaded from

t-test was conducted between the skin conductance level values of the
groups to examine possible differences in basal skin conductance
levels. AcqKnowledge software (version 4.2) was used in order to
identify and count SCRs (Supplementary material). The number of
valid SCR events was determined for each participant, and a t-test
was then conducted to examine possible group differences in the
number of SCRs.
Regression analysis
To correlate SCR with brain fluctuations, the skin conductance wave-
form was down-sampled by averaging the data points in each 2.5-s
bin matching the repetition time (2.5 s) of the echoplanar imaging scan
of functional image acquisition. Because relaxation causes skin con-
ductance level to decrease slowly in a linear fashion, the SCR wave-
form was detrended and band-pass filtered with the same frequency
range (0.01–0.08 Hz) that is used in a typical resting-state functional
MRI analysis. The similarity between the SCR and haemodynamic re-
sponse function curves (Bach et al., 2010a, b) allows for using SCR as
a regressor in the model directly without transformations, using the
same filtering band for both SCR and blood oxygenation level-depend-
ent signals (0.01–0.08 Hz) (Fan et al., 2012). SCR was then entered as
a regressor in a general linear model (Friston et al., 1995) using stat-
istical parametric mapping package (SPM8; Wellcome Trust Centre for
Neuroimaging, London, UK). Numbers of SCR were not equated be-
tween the groups to avoid specification error (Supplementary mater-
ial). The echoplanar imaging scans were realigned to the first volume,
timing corrected, coregistered to the T2 image, normalized to a stand-
ard template (MNI, Montreal Neurological Institute), resampled to a
2 � 2 � 2 mm voxel size, and spatially smoothed with an 8 mm full-
width at half-maximum Gaussian kernel. The general linear model was
then conducted with the SCR time series as a predictor of the
observed blood oxygen level-dependent signals. Low-frequency drifts
in signal were removed using a standard high-pass filter with a 128 s
cut-off. Serial correlation was estimated using an autoregressive AR(1)
model. To remove non-neural noise from the data, ventricle and
white-matter signals were extracted using corresponding masks and
were entered as covariates. In addition, the six parameters generated
during motion correction were also entered as covariates. Head mo-
tions (for all participants) did not exceed 2.5 mm of displacement or
2.5� of rotation in any direction. Finally, mean voxel value was used
for global calculation and grand mean scaling, applied with global
normalization to further remove non-specific noise (Van Dijk et al.,
2010). Detailed justifications for using the global mean correction
can be found in the Supplementary material.
The contrast images from the participants in each group were
entered into a second-level random effect group analysis. The resultant
voxel-wise statistical maps were thresholded for significance using a
cluster-size algorithm that protects against an inflation of the false-
positive rate of multiple comparisons; an uncorrected P-value of 0.05
for the height (intensity) threshold of each activated voxel and extent
threshold of k = 120 was used based on Monte Carlo simulation
(Slotnick and Schacter, 2004). Assuming an individual voxel type I
error of P5 0.05, a cluster extent of 120 contiguous resampled
voxels (2 � 2 � 2 mm) was indicated as necessary to correct for mul-
tiple voxel comparisons at P5 0.05. Statistical results were mapped
onto the standardized surface of the cerebral cortex.
Functional connectivity analysis of the default modenetwork
To investigate the relationship between non-specific SCR and brain
connectivity during rest, a functional connectivity analysis was
conducted using a seed region within the posterior cingulate cortex
as in previous studies (Koshino et al., 2005). Specifically, time-series
volumes of functional MRI scan images were preprocessed for each
participant using the Data Processing Assistant for Resting-State fMRI
(DPARSF) toolbox (Yan and Zang, 2010). This included slice timing
correction, realignment, coregistration, normalization and spatial
smoothing (using an 8 mm full-width at half-maximum Gaussian
kernel) as in the regression analysis. In addition, de-trending (to
remove the systematic drift) and temporal filtering (band-pass, 0.01–
0.08 Hz, to reduce the effect of low-frequency drift and high-fre-
quency physiological signal or noise) were applied. Time course of
the posterior cingulate cortex (left and right combined) was then ex-
tracted using the automated anatomical labelling template (Tzourio-
Mazoyer et al., 2002), and a voxel-wise linear correlation between the
mean time course of the posterior cingulate cortex and the time course
of each voxel in the whole brain was calculated using the resting-state
functional MRI data analysis toolkit (Song et al., 2011). The six head
motion parameters, global mean signal, white matter signal, and CSF
signal were included as covariates. A two-sample t-test was then con-
ducted to examine between-group connectivity differences.
To test the effects of SCR on brain connectivity, changes in func-
tional connectivity of the posterior cingulate cortex before and after
regressing out SCR effects were examined and compared between the
groups in an ANOVA model. SCR signals were regressed out as cov-
ariates in a second voxel-wise connectivity analysis, followed by trans-
formations of the correlation coefficients using Fisher’s r-to-z’
transformations. Posterior cingulate cortex time course was also ex-
tracted after regressing out the SCR signal. In addition, to examine
SCR contributions to the posterior cingulate cortex functional connect-
ivity within each group, a paired t-test was conducted for each group
before versus after regressing out SCR signals for the posterior cingu-
late cortex functional connectivity maps. Posterior cingulate cortex
connectivity analysis is reported here because it allows comparisons
with previous studies investigating DMN connectivity in ASD that
used a posterior cingulate cortex seed (Monk et al., 2009; Weng
et al., 2010), and because the posterior cingulate cortex has a more
focal anatomical definition than alternative seed regions. However, the
ventromedial prefrontal cortex, also commonly used as a DMN seed, is
potentially more relevant to ASD abnormalities, emotional processing
and autonomic pathways. We, therefore, conducted an additional
functional connectivity analysis for the time course of the ventromedial
prefrontal cortex, using the coordinates (�1, 47, �4) reported by Fox
et al. (2005), and group differences were examined. To further exam-
ine possible differences in the connectivity of areas that are related to
emotional and autonomic signal processing, we also tested the func-
tional connectivity of the anterior insular cortex (Supplementary ma-
terial). It is important to note that there were no significant differences
in head motion between the two groups, as was indicated by the root
mean squares of both overall head motion displacement and rotation
and the temporal derivatives (Supplementary material).
Functional connectivity analysis of the whole brain
To examine whether SCR contributes to the whole brain connectivity,
a voxel-wise whole brain functional connectivity strength analysis was
performed both before and after regressing out the SCR signal. Images
were preprocessed using DPARSF, similar to the posterior cingulate
cortex functional connectivity analysis, with two exceptions. First,
the resolution of resultant echoplanar imaging was 3 � 3 � 3 mm
after normalization to reduce computational load. Second, to reduce
artificial local correlations between voxels introduced by smoothing, a
4 mm full-width at half-maximum Gaussian kernel was used (instead
of 8 mm as in the posterior cingulate cortex connectivity analysis). For
156 | Brain 2014: 137; 153–171 T. Eilam-Stock et al.
at University C
ollege London on January 15, 2014
http://brain.oxfordjournals.org/D
ownloaded from

each voxel, functional connectivity strength was measured as the
summed weights of all connections linking this voxel and every
other voxel. Pearson correlation coefficients for the time series of
every possible pair of voxels were calculated to obtain the whole
brain correlation matrix for each participant. The calculation was con-
strained within a customized mask (n voxels = 48 159) including all
voxels with grey matter tissue probability 420% on the averaged
grey matter map of all participants. The functional connectivity
strength (FCS) was computed for each voxel as follows:
FCS ið Þ ¼1
N
X
j6¼1
zij, rij40:3
where rij is the correlation coefficient of voxel i and voxel j, zij is the
normalized rij value using Fisher’s r-to-z transformation, and 0.3 is the
threshold set to eliminate the potential contributions of weak connec-
tions arising from noise. To evaluate the reproducibility of our results,
additional functional connectivity strength maps were calculated using
both 0.2 and 0.4 correlation thresholds; these computations led to no
major changes in our primary results. The connectivity map was
then standardized by converting to Z scores so that maps across
participants could be averaged and compared. The Z score transform-
ation is:
Z ið Þ ¼FCS ið Þ � �
�, 1 � i � N,
where � and � are mean and SD of the functional connectivity
strength across all the voxels in the whole-brain map.
Notably, in graph theory, the functional connectivity strength is
referred to as ‘degree centrality’ or ‘degree’ of weighted networks,
and voxels with high functional connectivity strength usually play im-
portant roles in information transformation (Buckner et al., 2009; Cole
et al., 2010; Zuo et al., 2012; Liang et al., 2013; Wang et al., 2013).
To examine the SCR contribution to whole brain connectivity, func-
tional connectivity strength maps before and after regressing out the
SCR signals were compared within each group using paired t-tests.
Between-group differences of SCR signal contribution to whole brain
functional connectivity (i.e. functional connectivity strength maps
before versus after regressing out SCR signals) were examined in an
ANOVA model. All statistical maps were corrected for multiple com-
parisons to a significance level of P5 0.05 by combining the individual
voxel P-value5 0.05 with cluster size467 voxels, based on Monte
Carlo simulation (Ledberg et al., 1998).
Relationship between autism symptom severity, skinconductance and imaging data
Correlations between the ADI-R subscale scores of each of the ASD
participants and number of SCRs and overall skin conductance level
were examined. In addition, correlations between the individual ADI-R
subscale scores and SCR-brain association, posterior cingulate cortex
connectivity, ventromedial prefrontal cortex connectivity, and whole
brain connectivity maps were examined using regression analyses.
The ADI-R four subscales include ratings of social interaction (subscale
A), communication (subscale B), repetitive and restricted behaviour
(subscale C), and early development (subscale D). Higher scores on
each scale indicate higher symptom severity in each of the specific
domains. Note that these exploratory correlation analyses were not
corrected for multiple comparisons.
Modelling central generation and representation of skinconductance response
The central generation and representation (feedback) of SCR were
modelled by shifting the SCR vector in relation to the haemodynamic
response. Two models were created: a generation model in which
brain activation preceded the SCR signal by one repetition time
(2.5 s), and a representation model in which SCR preceded brain
activation by one repetition time (Critchley et al., 2000;
Patterson et al., 2002) (see Supplementary material for details of the
modelling).
Results
Electrodermal activityA t-test revealed no significant difference in skin conductance level
between ASD (15.96 � 1.83 mS) and neurotypical controls
[17.27 � 1.76mS, t(30) = 0.51, P4 0.05, two-tailed] (Fig. 1A).
However, during the scan period, the ASD group had significantly
less non-specific SCRs (4.76 � 1.34) compared with the neuroty-
pical control group [12.2 � 3.13, t(30) = 2.19, P50.05, two-
tailed] (Fig. 1B).
Skin conductance response and restingstate brain activityIn the neurotypical control group, there were significant positive
correlations between SCR and the anterior insular cortex, dorsal
anterior cingulate cortex, supplementary motor area, medial pre-
frontal cortex, thalamus, superior parietal lobule, calcarine cortex,
cuneus, and basal ganglia, as well as negative correlations with the
precentral gyrus, superior parietal lobule, posterior cingulate
cortex, precuneus, and inferior parietal lobule (Table 2 and
Fig. 2A). In the ASD group, SCR was positively correlated with
the lingual gyrus, calcarine cortex, superior and inferior parietal
lobule, precentral and postcentral gyri, middle temporal gyrus,
and inferior frontal gyrus, and was negatively correlated with
the anterior cingulate cortex, supplementary motor area, medial
prefrontal cortex, basal ganglia, inferior parietal and temporal gyri,
posterior midcingulate cortex (see Vogt, 2005 for definition), and
the thalamus (Table 3 and Fig. 2B). A between-group comparison
A B
*
0NC ASD
Num
ber o
f SCR
s
2
4
6
8
10
12
14
16
18
0NC ASD
15
20
10
5
SCL
(μS)
|____ ____
|
Figure 1 (A) Skin conductance level (SCL) and (B) number of
skin conductance responses (SCR) during the entire rest session
(6 min). NC = neurotypical controls.
Abnormal autonomic and brain activities in autism Brain 2014: 137; 153–171 | 157
at University C
ollege London on January 15, 2014
http://brain.oxfordjournals.org/D
ownloaded from

Table 2 Positive and negative correlations between SCR and brain activation in neurotypical controls
Region L/R BA x y z T Z P k
Positive
Mid frontal gyrus R 9 36 46 32 4.73 3.59 0.000 12334
Superior parietal lobule R 7 30 �40 40 4.66 3.56 0.000
Superior frontal gyrus R 6 22 6 62 3.97 3.20 0.001
Thalamus L �12 �4 0 3.93 3.17 0.001
Caudate nucleus R 12 14 18 3.87 3.14 0.001
Thalamus R 14 �8 12 3.82 3.11 0.001
Caudate nucleus L �14 12 10 3.77 3.08 0.001
Lateral globus pallidus R 24 �18 �2 3.76 3.08 0.001
Mid frontal gyrus R 10 38 50 24 3.76 3.08 0.001
Caudate nucleus L �16 18 4 3.74 3.06 0.001
Anterior cingulate cortex R 32 16 20 36 3.74 3.06 0.001
Anterior cingulate cortex L 32 �16 10 46 3.65 3.01 0.001
Anterior cingulate cortex R 32 6 26 38 3.61 2.99 0.001
Anterior insular cortex L �34 26 8 3.59 2.97 0.001
Anterior insular cortex R 32 18 4 3.53 2.93 0.002
Caudate nucleus R 14 18 0 3.49 2.91 0.002
Mid frontal gyrus R 6 42 4 32 3.35 2.83 0.002
Mid frontal gyrus R 9 48 22 26 3.35 2.82 0.002
Orbitofrontal cortex R 11 26 48 �12 3.05 2.63 0.004
Anterior insular cortex R 32 26 6 2.97 2.57 0.005
Mid frontal gyrus L 10 �24 32 18 2.91 2.53 0.006
Inferior frontal gyrus R 44/45 58 22 4 2.88 2.51 0.006
Putamen R 26 18 �6 2.87 2.50 0.006
Superior frontal gyrus L 8 �4 24 44 2.81 2.46 0.007
Precentral gyrus R 6 44 0 42 2.76 2.42 0.008
Mid temporal gyrus R 21/22 52 �22 �2 2.70 2.39 0.009
Supplementary motor area R 8 2 22 50 2.32 2.10 0.018
Inferior parietal gyrus R 40 56 �40 52 4.38 3.42 0.000 253
Supramarginal gyrus R 40 48 �36 42 2.66 2.36 0.009
Dentate nucleus L �26 �40 �36 3.73 3.06 0.001 509
Cerebellum crus VI L �24 �64 �24 3.61 2.98 0.001
Superior parietal lobule L 7 �22 �42 42 3.67 3.02 0.001 309
Calcarine cortex L 17 �16 �76 8 3.13 2.68 0.004 518
Cuneus L 18 �4 �94 10 3.12 2.67 0.004
Calcarine cortex L 17 �12 �82 12 2.77 2.43 0.008
Cuneus R 18 8 �92 16 2.64 2.34 0.010
Calcarine cortex R 17 8 �86 10 2.61 2.32 0.010
Lingual gyrus L 19 �16 �74 0 2.40 2.16 0.015
Precentral gyrus L 6 �24 �16 62 2.34 2.12 0.017
Negative
Precentral gyrus L 6 �2 �20 72 3.70 3.04 0.001 329
Precentral gyrus R 6 6 �22 62 2.34 2.12 0.017
Superior parietal lobule L 7 �22 �58 58 2.76 2.42 0.008 616
Posterior cingulate gyrus L 23 �6 �46 24 2.60 2.31 0.010
Posterior cingulate gyrus R 23 4 �54 22 2.60 2.31 0.011
Precuneus L 7 �8 �58 42 2.25 2.05 0.020
Posterior central gyrus R 31 12 �54 38 2.19 2.00 0.023
Posterior cingulate gyrus L 31 �2 �54 36 2.15 1.97 0.024
Posterior cingulate gyrus R 31 4 �58 30 2.02 1.86 0.031
Inferior parietal lobule L 40/22 �58 �42 24 2.74 2.41 0.008 133
Inferior parietal lobule R 40 64 �22 32 2.66 2.35 0.009 161
Height threshold: T = 1.76, P50.05.Extent threshold: k = 120.
L = left; R = right; BA = Brodmann area.
158 | Brain 2014: 137; 153–171 T. Eilam-Stock et al.
at University C
ollege London on January 15, 2014
http://brain.oxfordjournals.org/D
ownloaded from

similarly revealed that medial frontal brain regions were generally
more correlated with SCR in the neurotypical control group,
whereas posterior and sensory regions were generally more corre-
lated with SCR in the ASD group (Table 4 and Fig. 2C and D).
Skin conductance response and restingstate functional connectivity
Posterior cingulate cortex seed-based analysis results
Using the posterior cingulate cortex as a seed region, the neurotypi-
cal control group had stronger connectivity between the seed and
areas of the DMN, compared to the ASD group, mainly with the
ventromedial prefrontal cortex and the left inferior parietal lobule
(Table 5 and Fig. 3A). Stronger connectivity was found in ASD be-
tween the posterior cingulate cortex and the superior and inferior
occipital gyri, temporal pole, lingual gyrus, fusiform gyrus, amygdala,
hippocampus, posterior insular cortex, supplementary motor area,
and precentral and postcentral gyri (Table 5 and Fig. 3B). The general
linear model revealed a significant interaction between group (ASD
versus neurotypical control subjects) and SCR (before versus after
regressing out SCR), wherein SCR had greater positive effects on
the connectivity between posterior cingulate cortex and medial pre-
frontal and orbitofrontal cortices, precentral and postcentral gyri,
supramarginal gyrus, and superior and inferior parietal gyri in neuro-
typical control subjects than in ASD (Table 6 and Fig. 3C). In contrast,
SCR had a greater positive impact on the connectivity between the
posterior cingulate cortex and the posterior insular cortex, lingual
gyrus, amygdala, hippocampus, parahippocampal and fusiform
gyri, superior and middle occipital gyri, and superior and inferior
temporal gyri in ASD than in neurotypical control subjects (Table 6
and Fig. 3D). For paired t-test results within each group (be-
fore4 after regressing out SCR signal), see Supplementary Table 1
and Supplementary Fig. 1. For ventromedial prefrontal cortex and
anterior insular cortex functional connectivity results, see
Supplementary Tables 2 and 3, and Supplementary Figs 2 and 3.
Voxel-wise whole brain connectivity
A between-group comparison revealed that the neurotypical con-
trol group had higher functional connectivity strength in the
Figure 2 Positive and negative correlations between non-specific SCR and brain fluctuations during rest in (A) neurotypical control
subjects, and (B) adults with ASD. Red indicates voxels with positive correlations, whereas blue indicates voxels with negative correlations.
(C) Stronger correlations in neurotypical control subjects compared with ASD (neurotypical controls4ASD), and (D) stronger correlations
in ASD compared with neurotypical control subjects (ASD4neurotypical controls). These hemispheric surfaces were visualized using
BrainNet Viewer (http://www.nitrc.org/projects/bnv/, Xia et al., 2013).
Abnormal autonomic and brain activities in autism Brain 2014: 137; 153–171 | 159
at University C
ollege London on January 15, 2014
http://brain.oxfordjournals.org/D
ownloaded from

posterior cingulate cortex, precuneus, medial prefrontal cortex,
anterior cingulate cortex, gyrus rectus, posterior insular cortex,
superior temporal gyrus, and inferior temporal, parietal, and oc-
cipital gyri (Table 7 and Fig. 4A). The ASD group had higher
functional connectivity strength in the hippocampus, inferior tem-
poral gyrus, temporal pole, lingual gyrus, calcarine cortex and
amygdala, all on the left, as well as the cerebellum bilaterally
(Table 7 and Fig. 4B). A significant interaction (Group � SCR)
Table 3 Positive and negative correlations between SCR and brain activation in ASD
Region L/R BA x y z T Z P k
Positive
Lingual gyrus R 19 14 �58 �6 3.67 3.08 0.001 4196
Superior occipital gyrus R 19 16 �82 20 3.48 2.96 0.002
Lingual gyrus R 18/19 16 �80 �4 3.44 2.93 0.002
Calcarine cortex L 17 �14 �82 2 3.28 2.82 0.002
Inferior parietal lobule L 40 �48 �50 48 3.27 2.82 0.002
Cerebellum crus VI R 24 �58 �26 3.21 2.78 0.003
Superior parietal lobule L 7 �30 �64 58 3.17 2.75 0.003
Fusiform gyrus L 19 �22 �62 �10 2.95 2.60 0.005
Inferior parietal lobule L 40 �32 �52 42 2.89 2.55 0.005
Fusiform gyrus R 19 28 �68 �10 2.61 2.35 0.009
Parahippocampal gyrus L 28 �14 �44 2 2.52 2.28 0.011
Lingual gyrus R 37 28 �48 �6 2.42 2.20 0.014
Cerebellum crus IV R 2 �50 �16 2.4 2.19 0.014
Calcarine cortex L 17/18 �6 �66 18 2.36 2.15 0.016
Parahippocampal gyrus R 27 12 �38 �4 2.35 2.15 0.016
Cerebellum crus VI L �2 �74 �10 2.3 2.11 0.018
Mid temporal gyrus R 21 58 �32 �10 3.58 3.03 0.001 222
Precentral gyrus L 6 �36 �2 56 3.29 2.84 0.002 127
Postcentral gyrus L 2 �64 �18 32 3.19 2.76 0.003 352
Superior temporal gyrus L 42 �52 �14 14 2.84 2.52 0.006
Mid temporal gyrus L 21 �52 �46 �2 2.92 2.58 0.005 483
Mid temporal gyrus L 21 �62 �26 2 2.39 2.18 0.015
Inferior frontal gyrus L 47 �40 40 �8 2.54 2.29 0.011 173
Inferior parietal lobule R 40 38 �58 48 2.3 2.11 0.018 121
Negative
Posterior mid cingulate cortex L 31 �4 �18 42 3.33 2.86 0.002 850
Anterior cingulate cortex L 24 �4 6 38 2.6 2.34 0.010
Supplementary motor area L 6 �4 �22 58 2.21 2.04 0.021
Anterior cingulate cortex R 32 2 28 30 1.95 1.83 0.034
Superior frontal gyrus (medial) R 10 8 60 6 3.19 2.76 0.003 2221
Superior frontal gyrus (medial) R 6 2 12 60 3.17 2.75 0.003
Superior frontal gyrus (medial) R 9 6 62 30 3.03 2.65 0.004
Superior frontal gyrus R 8 12 28 60 2.88 2.54 0.005
Anterior cingulate cortex (pregenual) L 24 �14 46 �4 2.57 2.32 0.010
Superior frontal gyrus (medial) R 8 2 48 44 2.51 2.27 0.012
Superior temporal gyrus L 42 �48 �28 18 3.15 2.74 0.003 279
Inferior parietal lobule L 40 �58 �40 34 2.82 2.50 0.006
Putamen R 16 16 �6 3 2.63 0.004 294
Putamen R 24 �2 4 2.08 1.93 0.027
Red nucleus 0 �22 2 2.99 2.62 0.004 208
Inferior parietal gyrus R 40 56 �32 32 2.78 2.48 0.007 203
Thalamus R 8 �14 14 2.72 2.43 0.008 311
Caudate nucleus L �10 �4 16 2.68 2.40 0.008
Inferior temporal gyrus R 37 34 �74 6 2.55 2.30 0.011 136
Parahippocampal gyrus L 36 �30 2 �30 2.47 2.24 0.013 124
Putamen L �20 6 �8 2.08 1.94 0.026
Cerebellum crus VII L �22 �70 �40 2.39 2.18 0.015 178
Anterior cingulate cortex (subgenual) R 32 10 30 �8 2.37 2.16 0.015 213
Height threshold: T = 1.74, P50.05.
Extent threshold: k = 120.L = left; R = right; BA = Brodmann area.
160 | Brain 2014: 137; 153–171 T. Eilam-Stock et al.
at University C
ollege London on January 15, 2014
http://brain.oxfordjournals.org/D
ownloaded from
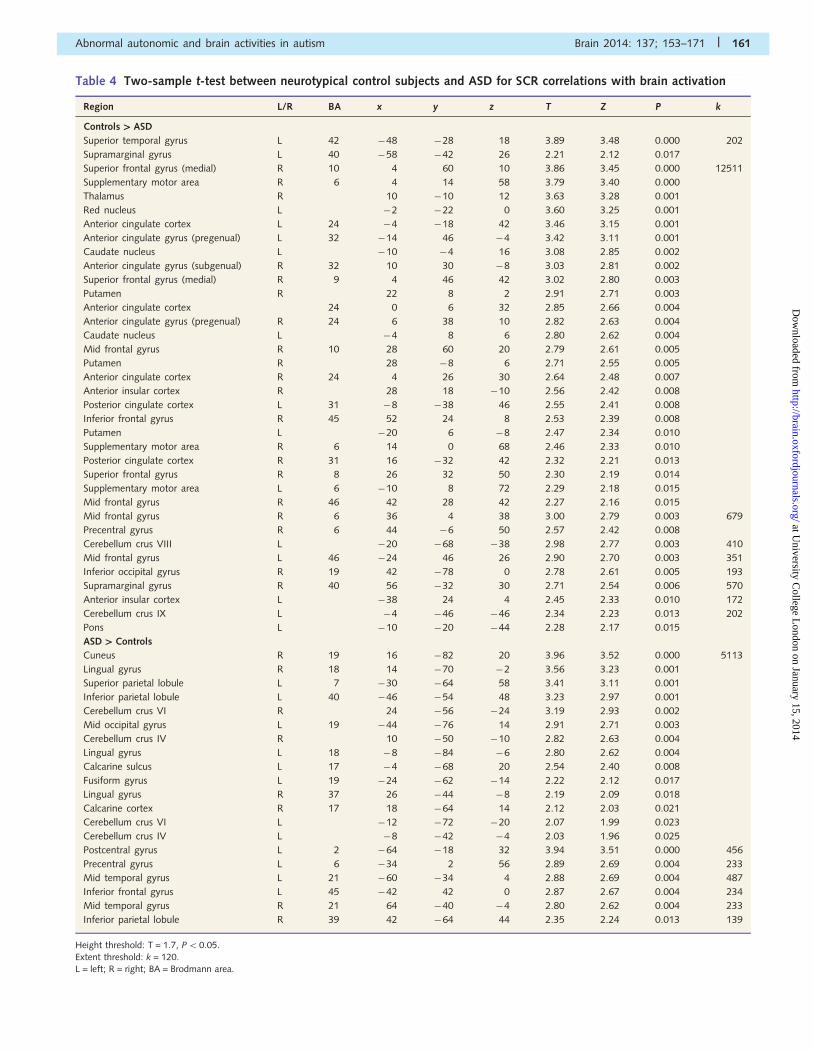
Table 4 Two-sample t-test between neurotypical control subjects and ASD for SCR correlations with brain activation
Region L/R BA x y z T Z P k
Controls`ASD
Superior temporal gyrus L 42 �48 �28 18 3.89 3.48 0.000 202
Supramarginal gyrus L 40 �58 �42 26 2.21 2.12 0.017
Superior frontal gyrus (medial) R 10 4 60 10 3.86 3.45 0.000 12511
Supplementary motor area R 6 4 14 58 3.79 3.40 0.000
Thalamus R 10 �10 12 3.63 3.28 0.001
Red nucleus L �2 �22 0 3.60 3.25 0.001
Anterior cingulate cortex L 24 �4 �18 42 3.46 3.15 0.001
Anterior cingulate gyrus (pregenual) L 32 �14 46 �4 3.42 3.11 0.001
Caudate nucleus L �10 �4 16 3.08 2.85 0.002
Anterior cingulate gyrus (subgenual) R 32 10 30 �8 3.03 2.81 0.002
Superior frontal gyrus (medial) R 9 4 46 42 3.02 2.80 0.003
Putamen R 22 8 2 2.91 2.71 0.003
Anterior cingulate cortex 24 0 6 32 2.85 2.66 0.004
Anterior cingulate gyrus (pregenual) R 24 6 38 10 2.82 2.63 0.004
Caudate nucleus L �4 8 6 2.80 2.62 0.004
Mid frontal gyrus R 10 28 60 20 2.79 2.61 0.005
Putamen R 28 �8 6 2.71 2.55 0.005
Anterior cingulate cortex R 24 4 26 30 2.64 2.48 0.007
Anterior insular cortex R 28 18 �10 2.56 2.42 0.008
Posterior cingulate cortex L 31 �8 �38 46 2.55 2.41 0.008
Inferior frontal gyrus R 45 52 24 8 2.53 2.39 0.008
Putamen L �20 6 �8 2.47 2.34 0.010
Supplementary motor area R 6 14 0 68 2.46 2.33 0.010
Posterior cingulate cortex R 31 16 �32 42 2.32 2.21 0.013
Superior frontal gyrus R 8 26 32 50 2.30 2.19 0.014
Supplementary motor area L 6 �10 8 72 2.29 2.18 0.015
Mid frontal gyrus R 46 42 28 42 2.27 2.16 0.015
Mid frontal gyrus R 6 36 4 38 3.00 2.79 0.003 679
Precentral gyrus R 6 44 �6 50 2.57 2.42 0.008
Cerebellum crus VIII L �20 �68 �38 2.98 2.77 0.003 410
Mid frontal gyrus L 46 �24 46 26 2.90 2.70 0.003 351
Inferior occipital gyrus R 19 42 �78 0 2.78 2.61 0.005 193
Supramarginal gyrus R 40 56 �32 30 2.71 2.54 0.006 570
Anterior insular cortex L �38 24 4 2.45 2.33 0.010 172
Cerebellum crus IX L �4 �46 �46 2.34 2.23 0.013 202
Pons L �10 �20 �44 2.28 2.17 0.015
ASD`Controls
Cuneus R 19 16 �82 20 3.96 3.52 0.000 5113
Lingual gyrus R 18 14 �70 �2 3.56 3.23 0.001
Superior parietal lobule L 7 �30 �64 58 3.41 3.11 0.001
Inferior parietal lobule L 40 �46 �54 48 3.23 2.97 0.001
Cerebellum crus VI R 24 �56 �24 3.19 2.93 0.002
Mid occipital gyrus L 19 �44 �76 14 2.91 2.71 0.003
Cerebellum crus IV R 10 �50 �10 2.82 2.63 0.004
Lingual gyrus L 18 �8 �84 �6 2.80 2.62 0.004
Calcarine sulcus L 17 �4 �68 20 2.54 2.40 0.008
Fusiform gyrus L 19 �24 �62 �14 2.22 2.12 0.017
Lingual gyrus R 37 26 �44 �8 2.19 2.09 0.018
Calcarine cortex R 17 18 �64 14 2.12 2.03 0.021
Cerebellum crus VI L �12 �72 �20 2.07 1.99 0.023
Cerebellum crus IV L �8 �42 �4 2.03 1.96 0.025
Postcentral gyrus L 2 �64 �18 32 3.94 3.51 0.000 456
Precentral gyrus L 6 �34 2 56 2.89 2.69 0.004 233
Mid temporal gyrus L 21 �60 �34 4 2.88 2.69 0.004 487
Inferior frontal gyrus L 45 �42 42 0 2.87 2.67 0.004 234
Mid temporal gyrus R 21 64 �40 �4 2.80 2.62 0.004 233
Inferior parietal lobule R 39 42 �64 44 2.35 2.24 0.013 139
Height threshold: T = 1.7, P50.05.
Extent threshold: k = 120.L = left; R = right; BA = Brodmann area.
Abnormal autonomic and brain activities in autism Brain 2014: 137; 153–171 | 161
at University C
ollege London on January 15, 2014
http://brain.oxfordjournals.org/D
ownloaded from

Table 5 Two sample t-test between neurotypical control subjects and ASD for the functional connectivity of the posteriorcingulate cortex
Region L/R BA x y z T Z P k
Controls`ASD
Mid frontal gyrus L 10 �24 44 22 5.35 4.45 0.000 7314
Superior frontal gyrus R 10 16 52 20 4.34 3.79 0.000
Anterior cingulate cortex R 24 20 10 30 3.99 3.54 0.000
Superior frontal gyrus L 6 �14 16 60 3.29 3.01 0.001
Anterior cingulate cortex (subgenual) R 32 8 28 �4 3.27 3.00 0.001
Superior frontal gyrus L 6 �6 28 58 3.21 2.96 0.002
Anterior cingulate cortex R 32 14 28 30 3.18 2.92 0.002
Mid frontal gyrus L 6 �38 2 58 3.11 2.87 0.002
Superior frontal gyrus R 8 10 32 58 3.06 2.83 0.002
Superior frontal gyrus (medial) 32 0 44 28 2.84 2.65 0.004
Caudate nucleus L �6 2 12 2.58 2.43 0.007
Caudate nucleus R 6 2 14 2.49 2.36 0.009
Orbitofrontal cortex L 11 �6 38 �18 2.26 2.15 0.016
Anterior cingulate cortex (subgenual) L 32 �6 30 �4 2.17 2.07 0.019
Caudate nucleus L �12 8 16 2.12 2.03 0.021
Cerebral peduncle R 14 �20 �32 3.56 3.23 0.001
Cerebral peduncle L �18 �20 �30 3.34 3.06 0.001
Posterior cingulate cortex L 31 �10 �46 36 3.97 3.53 0.000 1852
Posterior cingulate cortex R 31 8 �44 28 3.37 3.08 0.001
Precuneus R 7 2 �72 30 2.89 2.69 0.004
Precuneus L 7 �8 �62 36 2.49 2.36 0.009
Temporal parietal junction L 22 �52 �56 24 3.48 3.16 0.001 1193
Cerebellum crus II R 32 �78 �46 3.42 3.12 0.001 682
Mid temporal gyrus L 21 �64 �34 �10 3.37 3.08 0.001 783
Inferior temporal gyrus L 21 �58 �22 �20 3.01 2.79 0.003
Superior frontal gyrus R 6 22 2 74 3.36 3.07 0.001 128
Mid temporal gyrus L 21 �52 4 �34 3.02 2.80 0.003 147
Superior parietal lobule R 7 14 �58 74 2.63 2.47 0.007 131
Inferior frontal gyrus L 47 �50 34 �2 2.42 2.29 0.011 196
ASD`Controls
Cuneus L 18 �18 �92 14 4.55 3.94 0.000 16754
Superior occipital gyrus L 19 �24 �80 14 4.47 3.88 0.000
Inferior occipital gyrus R 18 28 �86 �8 4.31 3.77 0.000
Superior parietal lobule R 7 26 �70 38 4.07 3.60 0.000
Superior occipital gyrus R 19 24 �70 24 3.94 3.51 0.000
Fusiform gyrus R 19 42 �70 �14 3.90 3.48 0.000
Cerebellum crus IV R 14 �40 �18 3.79 3.40 0.000
Inferior longitudinal fasciculus R 41 40 �30 0 3.71 3.34 0.000
Medial occipital gyrus R 18 28 �80 10 3.70 3.33 0.000
Fusiform gyrus R 19 32 �76 0 3.69 3.32 0.000
Inferior temporal gyrus R 37 52 �58 �10 3.64 3.29 0.001
Cerebellum crus IV R 2 �50 �2 3.22 2.96 0.002
Superior occipital gyrus R 19 16 �82 30 3.21 2.95 0.002
Inferior occipital gyrus R 19 40 �78 0 3.17 2.92 0.002
Parahippocampal gyrus R 36 28 0 �28 3.08 2.85 0.002
Lingual gyrus R 19 16 �76 �10 3.05 2.82 0.002
Pons R 10 �24 �26 2.91 2.71 0.003
Hippocampus L 34 �30 �20 �8 2.88 2.68 0.004
Inferior occipital gyrus L 19 �40 �80 2 2.87 2.67 0.004
Pons L �2 �30 �14 2.86 2.67 0.004
Fusiform gyrus L 19 �28 �66 �14 2.78 2.60 0.005
Superior parietal lobule L 19 �22 �64 30 2.78 2.60 0.005
Lingual gyrus L 18 �8 �64 �4 2.77 2.59 0.005
Amygdala R 22 0 �18 2.66 2.50 0.006
Temporal pole R 38 32 8 �40 2.44 2.31 0.010
Cerebellum crus VII L 4/43 �8 �72 �36 3.53 3.21 0.001 450
Rolandic operculum L �40 �8 18 3.37 3.08 0.001 757
(continued)
162 | Brain 2014: 137; 153–171 T. Eilam-Stock et al.
at University C
ollege London on January 15, 2014
http://brain.oxfordjournals.org/D
ownloaded from

Table 5 Continued
Region L/R BA x y z T Z P k
Superior temporal gyrus L 22 �64 �6 6 2.78 2.60 0.005
Posterior insular cortex L �44 0 4 2.56 2.42 0.008
Inferior frontal gyrus R 45 48 20 8 3.15 2.90 0.002 945
Rolandic operculum R 4/43 42 0 14 2.71 2.54 0.006
Posterior insular cortex R 44 8 2 2.35 2.24 0.013
Temporal pole L 38 �28 18 �34 3.14 2.90 0.002 227
Precentral gyrus R 4 44 �10 34 2.91 2.71 0.003 412
Precentral gyrus R 6 50 �4 46 2.72 2.55 0.005
Postcentral gyrus L 3 �42 �22 48 2.90 2.70 0.003 263
Supplementary motor area L 6 �6 �4 60 2.88 2.68 0.004 424
Supplementary motor area R 6 8 6 58 2.67 2.51 0.006
Inferior parietal lobule R 40 42 �38 60 2.69 2.53 0.006 309
Height threshold: T = 1.7, P50.05.Extent threshold: k = 120.L = left; R = right; BA = Brodmann area.
Figure 3 Functional connectivity of the posterior cingulate cortex, and an interaction between group (neurotypical controls versus ASD)
and SCR (before versus after regressing out SCR signal) on posterior cingulate cortex connectivity. (A) Stronger connectivity in neuro-
typical controls compared with ASD (neurotypical controls4ASD). (B) Stronger connectivity in ASD, compared to neurotypical controls
(ASD4neurotypical controls). (C) Stronger effects of SCR on posterior cingulate cortex connectivity in neurotypical control subjects
compared to ASD [neurotypical controls (with-without SCR)4ASD (with-without SCR)]. (D) Stronger effects of SCR on posterior cin-
gulate cortex connectivity in ASD compared with neurotypical control subjects [ASD (with-without SCR)4 neurotypical controls (with-
without SCR)].
Abnormal autonomic and brain activities in autism Brain 2014: 137; 153–171 | 163
at University C
ollege London on January 15, 2014
http://brain.oxfordjournals.org/D
ownloaded from

Table 6 Interaction of group (neurotypical controls versus ASD) and SCR (with SCR versus without SCR) for the functionalconnectivity of the posterior cingulate cortex
Region L/R BA x y z T Z P k
Controls (with-without)`ASD (with-without)
Posterior cingulate cortex R 31 6 �48 36 4.85 4.13 0.000 3566
Posterior cingulate cortex L 31 �12 �40 40 4.63 3.99 0.000
Superior parietal lobule L 7 �34 �36 66 4.17 3.67 0.000
Supramarginal gyrus L 40 �62 �42 30 4.04 3.58 0.000
Inferior parietal lobule L 40 �42 �36 56 3.86 3.45 0.000
Posterior cingulate cortex R 23 4 �28 40 3.64 3.29 0.001
Precuneus R 7 2 �46 46 3.58 3.24 0.001
Postcentral gyrus L 3 �20 �38 54 3.22 2.96 0.002
Postcentral gyrus L 2 �42 �20 56 3.16 2.91 0.002
Precentral gyrus L 6 �36 �22 66 3.05 2.82 0.002
Postcentral gyrus R 2 62 �8 38 2.69 2.52 0.006
Precentral gyrus L 6 �54 0 44 4.07 3.60 0.000 266
Mid frontal gyrus L 10 �8 54 20 3.98 3.54 0.000 443
Mid frontal gyrus 10 0 58 22 3.66 3.30 0.000
Mid frontal gyrus R 9 2 46 24 2.70 2.53 0.006
Superior frontal gyrus L 6 �14 �6 72 3.92 3.49 0.000 256
Gyrus rectus L 11 �10 20 �16 3.11 2.87 0.002
Cerebellum crus VIIIB R 16 �58 �58 3.67 3.31 0.000 128
Posterior cingulate cortex L 26 �6 �42 6 3.60 3.25 0.001 124
Cerebellum crus VI R 14 �70 �24 3.57 3.23 0.001 264
Cerebellum crus I R 36 �68 �30 2.91 2.71 0.003
Angular gyrus L 39 �46 �70 32 3.57 3.23 0.001 215
Dentate nucleus R 12 �48 �26 3.48 3.16 0.001 178
Cerebellum crus I L �28 �88 �30 3.32 3.04 0.001 146
Superior parietal lobule R 7 34 �48 58 3.28 3.01 0.001 895
Postcentral gyrus R 2 16 �40 58 3.06 2.83 0.002
Superior parietal lobule R 7 20 �62 60 2.69 2.52 0.006
Mid temporal gyrus R 21 60 �52 4 3.05 2.82 0.002
Inferior temporal gyrus R 37 52 �62 2 2.58 2.43 0.008
Precentral gyrus R 6 26 �14 66 2.92 2.72 0.003 203
Mid frontal gyrus R 6 30 �8 60 2.89 2.69 0.004
Inferior frontal gyrus L 47 �50 32 �14 2.88 2.69 0.004 126
Inferior frontal gyrus L 47 �34 24 �16 2.80 2.62 0.004
Supplementary motor area R 6 8 �8 58 2.86 2.67 0.004 194
ASD (with-without)`Controls (with-without)
Posterior insular cortex R 42 �10 �12 4.98 4.21 0.000 1464
Putamen R 26 �10 8 4.73 4.06 0.000
Superior temporal gyrus R 42 46 �28 6 3.30 3.02 0.001
Posterior insular cortex R 46 2 0 3.24 2.97 0.001
Hippocampus R 34 32 �10 �20 2.94 2.73 0.003
Parahippocampal gyrus R 28 30 �10 �32 2.62 2.47 0.007
Amygdala R 32 �2 �28 2.45 2.32 0.010
Posterior insular cortex L �44 0 2 4.72 4.05 0.000 5420
Transverse temporal gyrus L 41 �40 �26 6 4.66 4.00 0.000
Fusiform gyrus R 37 22 �52 �10 4.39 3.82 0.000
Parahippocampal gyrus L 28 �28 �22 �30 4.12 3.64 0.000
Mid temporal gyrus L 21 �50 �14 �4 3.84 3.44 0.000
Lingual gyrus R 19 14 �56 �4 3.81 3.41 0.000
Lingual gyrus L 19 �12 �70 0 3.80 3.40 0.000
Hippocampus L 34 �16 �32 �2 3.56 3.23 0.001
Fusiform gyrus L 20 �36 �32 �10 3.36 3.07 0.001
Superior temporal gyrus L 42 �56 �28 6 3.23 2.97 0.001
Precuneus R 31 6 �66 26 2.99 2.78 0.003
Superior parietal lobule L 19 �22 �80 46 2.94 2.74 0.003
Calcarine cortex L 17/18 �24 �64 4 2.91 2.71 0.003
Precuneus L 7 �2 �78 42 2.55 2.41 0.008
(continued)
164 | Brain 2014: 137; 153–171 T. Eilam-Stock et al.
at University C
ollege London on January 15, 2014
http://brain.oxfordjournals.org/D
ownloaded from

was also found; SCR signal contributed significantly to the con-
nectivity of the posterior cingulate cortex, medial prefrontal
cortex, anterior cingulate cortex, inferior parietal lobule, and the
right anterior and posterior insular cortex in neurotypical control
subjects, compared with ASD (Table 8 and Fig. 4C). In ASD there
was significant contribution of SCR signal to the connectivity of
the hippocampus, amygdala, nucleus accumbens, calcarine cortex,
and the fusiform, lingual, and inferior occipital gyri, compared with
neurotypical control subjects (Table 8 and Fig. 4D). For within-
group paired t-test results (before4 after SCR regression), see
Supplementary Table 4 and Supplementary Fig. 4.
Correlations with clinical symptomsNo significant correlations were found between the number of
SCRs, or overall skin conductance level, and any of the four
ADI-R subscales, all P’s40.05. However, ADI-R subscales for
social interaction and communication were negatively correlated
with posterior cingulate cortex connectivity with the medial and
lateral prefrontal cortices, and with the posterior cingulate cortex
and precuneus, respectively. Positive correlations with posterior
cingulate cortex connectivity were found in sensory and temporal
regions, as well as within the thalamus (Supplementary Table 5
and Supplementary Fig. 5) with all four subscales. Symptom se-
verity on the social interaction and communication subscales was
also correlated with decreased ventromedial prefrontal cortex con-
nectivity with the posterior cingulate cortex (i.e. decreased DMN
connectivity), as well as increased connectivity with the anterior
insular cortex and anterior cingulate cortex (i.e. reduced anticor-
relations with the task-positive network) (Supplementary Table 6
and Supplementary Fig. 6A and B). ADI-R correlations with whole
brain connectivity revealed negative correlations with the posterior
cingulate cortex/precuneus and supplementary motor area (social
interaction and communication subscales), and positive correl-
ations with the anterior cingulate cortex and medial prefrontal
cortex (restricted behaviour and early development subscales)
(Supplementary Table 7 and Supplementary Fig. 7). For ADI-R
subscale correlation with brain activity that is associated with
SCR, see Supplementary Table 8 and Supplementary Fig. 8.
Central generation and representation of skinconductance responses
One-sample t-tests of both generation and representation models
revealed comparable brain activation associated with SCR to the
original data in both groups (i.e. anterior brain regions in neuro-
typical controls, and posterior brain activation in ASD). When the
two models were compared within each group, no significant dif-
ferences were found between representation and generation (rep-
resentation4 generation) in neurotypical control subjects, or
between the two models in ASD. There was, however, significant
activation in the right thalamus and the left cerebellum in the
generation model, as compared with the representation model
(generation4 representation), in neurotypical control subjects
(Supplementary Table 9 and Supplementary Fig. 9).
Discussion
Skin conductance response and itscorrelations with brain activityThe results demonstrate a reduced number of spontaneous SCRs,
as well as abnormal correlations of SCR with brain activation
during rest in ASD. This could result from either abnormal periph-
eral conductance of autonomic nervous system signals, or from
alterations in the central generation and/or representation of vis-
ceral autonomic arousal states. Previous studies have found abnor-
mal basal autonomic nervous system activity in ASD (Horvath
et al., 1999; Molloy and Manning-Courtney, 2003; White,
2003; Ming et al., 2005; Anderson and Colombo, 2009; Bal
et al., 2010; Anderson et al., 2013). However, all of these findings
indicate increased sympathetic/parasympathetic balance. Our find-
ing of decreased number of SCRs in ASD, therefore, is unlikely to
Table 6 Continued
Region L/R BA x y z T Z P k
Anterior cingulate cortex L 24 �12 8 38 4.36 3.80 0.000 512
Anterior cingulate cortex R 24 2 6 42 3.10 2.86 0.002
Superior occipital gyrus R 19 22 �92 24 4.22 3.71 0.000 846
Superior occipital gyrus L 18 �16 �96 20 3.96 3.52 0.000
Mid occipital gyrus R 18 30 �86 18 3.68 3.32 0.000
Mid frontal gyrus L 11 �34 62 �12 4.08 3.61 0.000 295
Fusiform gyrus R 37 34 �38 �20 3.90 3.48 0.000 826
Inferior temporal gyrus R 37 54 �62 �10 3.57 3.23 0.001
Cerebellum crus I R 50 �68 �28 3.33 3.05 0.001
Superior temporal gyrus R 22 66 �22 4 3.72 3.34 0.000 344
Mid frontal gyrus R 10 36 52 �6 3.19 2.94 0.002 180
Paracentral lobule L 4 �8 �28 68 2.59 2.44 0.007 170
Caudate nucleus R 14 20 0 2.50 2.36 0.009 197
Height threshold: T = 1.7, P50.05.Extent threshold: k = 120.L = left; R = right; BA = Brodmann area.
Abnormal autonomic and brain activities in autism Brain 2014: 137; 153–171 | 165
at University C
ollege London on January 15, 2014
http://brain.oxfordjournals.org/D
ownloaded from

be a result of hypoactivation of the sympathetic autonomic ner-
vous system. Moreover, skin conductance level did not differ be-
tween groups, consistent with previous studies (Zahn et al., 1987;
Schoen et al., 2008; Mathersul et al., 2013), further suggesting
that the electrodermal abnormality in ASD is not of peripheral
origin. Thus, the results are likely to reflect alterations in the cen-
tral generation and/or representation of SCR signals.
SCR is a sensitive index of sympathetic neural activity and can
detect even subtle changes in autonomic arousal due to mental
activity and thought processes (Nikula, 1991). Our results may,
therefore, reflect differences in the central generation of SCR,
stemming from different mental activity. More specifically, in neu-
rotypical controls, SCR was positively correlated with the anterior
insular cortex, a brain region involved in interoceptive awareness
(Craig, 2002, 2009; Critchley et al., 2002; Pollatos et al., 2007;
Gu et al., 2013), and with the medial prefrontal cortex, which is
implicated in self-referential processing (Craik et al., 1999; Kelley
et al., 2002; Macrae et al., 2004; Northoff et al., 2006; Jenkins
and Mitchell, 2011). In ASD, however, SCR was highly correlated
with visual and auditory cortices. Thus, it is possible that when
neurotypical control participants lay in the scanner at rest, they
were aware of their inner bodily sensations and were engaged in
self-referential thoughts, which drove their SCRs. On the other
hand, when participants with ASD were resting in the scanner,
they may have concentrated on the noises and the visual infor-
mation inside the scanner and that may have been the driving
force of their autonomic responses.
The results may also reflect alterations in the central represen-
tation of autonomic signals. The thalamus, supplementary motor
area, anterior insular cortex, and anterior cingulate cortex were
positively correlated with SCR in neurotypical controls, but were
either not correlated, or negatively correlated with SCR in indivi-
duals with ASD. These brain regions were previously implicated in
autonomic nervous system signal processing (Boucsein, 1992;
Damasio et al., 2000; Craig, 2002; Porges, 2003; Critchley,
2005; Gu et al., 2013). The anterior insular cortex, specifically,
was indicated to have a key role in the representation of auto-
nomic signals. Anterior insular cortex was not associated with SCR
in the ASD group, further supporting abnormal central autonomic
nervous system representation in ASD.
Results from our additional analyses did not reveal significant
differences in cortical regions that were uniquely associated with
the generation or representation of SCR in both groups, suggest-
ing the involvement of similar brain regions in both the generation
and the representation of SCR. These regions corresponded with
brain areas that were positively correlated with SCR in each of the
groups in our original regression analysis, suggesting that the dif-
ferences that were originally found between the groups are
Table 7 Two sample t-test between neurotypical controls and ASD for whole-brain functional connectivity
Region L/R BA x y z T Z P k
Controls`ASD
Superior temporal gyrus R 38 42 6 �15 4.88 4.15 0.000 104
Posterior insular cortex R 45 �12 0 3.03 2.81 0.002
Inferior temporal gyrus R 37 42 �63 �9 3.77 3.38 0.000 119
Inferior occipital gyrus R 19 48 �75 0 3.31 3.03 0.001
Gyrus rectus L 11 �3 36 �18 3.75 3.37 0.000 361
Superior frontal gyrus (medial) R 8 9 33 39 3.60 3.26 0.001
Anterior cingulate cortex L 32 �9 42 9 3.52 3.19 0.001
Anterior cingulate cortex (subgenual) R 32 6 30 �6 3.42 3.12 0.001
Superior frontal gyrus (medial) R 9 6 51 36 3.17 2.92 0.002
Anterior cingulate cortex R 24 12 36 9 3.08 2.85 0.002
Superior frontal gyrus (medial) L 9 �3 45 24 3.07 2.84 0.002
Inferior parietal lobule R 39 45 �54 36 3.45 3.14 0.001 101
Posterior cingulate cortex L 23 �3 �36 39 3.34 3.05 0.001 376
Precuneus L 31 �9 �57 36 2.74 2.57 0.005
Precuneus R 19 9 �54 30 2.56 2.42 0.008
ASD`Controls
Hippocampus L �30 �21 �12 4.61 3.98 0.000 120
Inferior temporal gyrus L 20 �45 �27 �21 2.65 2.49 0.006
Amygdala L �27 3 �18 2.29 2.18 0.015
Calcarine cortex L 17 �3 �63 9 4.02 3.57 0.000 79
Lingual gyrus L 19 �12 �48 3 3.63 3.28 0.001
Cerebellum crus VIII L �36 �63 �54 4.02 3.57 0.000 119
Cerebellum crus II R 30 �78 �48 3.99 3.55 0.000 112
Temporal pole L 38 �39 15 �30 2.99 2.77 0.003
Cerebellum crus VII L �30 �39 �39 3.60 3.25 0.001 130
Cerebellum crus I R 39 �57 �33 3.41 3.11 0.001 81
Height threshold: T = 1.7, P50.05.Extent threshold: k = 67.L = left, R = right; BA = Brodmann area.
166 | Brain 2014: 137; 153–171 T. Eilam-Stock et al.
at University C
ollege London on January 15, 2014
http://brain.oxfordjournals.org/D
ownloaded from

present both in the generation phase and the representation phase
of SCR signals. The higher activation in the right thalamus and left
cerebellum that was found during the generation of SCRs in neu-
rotypical controls may suggest that there is an increased auto-
nomic arousal during the generation phase, compared with the
representation phase. These results differ from previous findings
of brain regions that are uniquely activated in the generation or
representation of SCR in a healthy cohort (Critchley et al., 2000).
However, differences in methods may account for the discrepancy
between the results of these studies. For a more detailed discus-
sion of the afferent and efferent SCR pathways see the online
Supplementary material.
Skin conductance response contributionto default mode network and voxel-wiseconnectivityOur functional connectivity findings replicated recent work show-
ing reduced connectivity of the DMN in individuals with ASD
compared with neurotypical controls (Kennedy and Courchesne,
2008a, b; Monk et al., 2009; Assaf et al., 2010; Weng et al.,
2010), and added a critical component: the difference in DMN
connectivity between the groups was significantly associated
with SCR. Thus, by examining the interaction between SCR
signal and group difference in posterior cingulate cortex connect-
ivity, our data indicated significantly higher contributions of the
SCR signal to the DMN connectivity in the neurotypical control
group, compared to the ASD group. Decreased DMN connectivity
in ASD was also found using the ventromedial prefrontal cortex as
a seed; however, SCR did not have significant contributions to this
network in this analysis. Because the ventromedial prefrontal
cortex is a relatively large brain region, these negative results
may be associated with the specific seed region of the ventro-
medial prefrontal cortex that was used in this analysis [based on
the coordinates reported by Fox et al. (2005)]. Nevertheless, dif-
ferences in autonomic-related brain activity may account, at least
in part, for the previously observed under-connectivity of the
DMN in ASD.
Figure 4 Voxel-wise whole brain functional connectivity, and an interaction between group (neurotypical controls versus ASD) and SCR
(before versus after regressing out the SCR signal) in voxel-wise whole-brain connectivity. (A) Stronger connectivity in neurotypical
controls compared with ASD (neurotypical controls4ASD). (B) Stronger connectivity in ASD, compared to neurotypical control subjects
(ASD4neurotypical controls). (C) Stronger effects of SCR on whole-brain connectivity in neurotypical control subjects compared to ASD
[neurotypical controls (with-without SCR)4ASD (with-without SCR)]. (D) Stronger effects of SCR on whole-brain connectivity in ASD
compared to neurotypical control subjects [ASD (with-without SCR)4neurotypical controls (with-without SCR)].
Abnormal autonomic and brain activities in autism Brain 2014: 137; 153–171 | 167
at University C
ollege London on January 15, 2014
http://brain.oxfordjournals.org/D
ownloaded from

Voxel-wise whole-brain connectivity analysis results were strik-
ingly similar to those obtained for the posterior cingulate cortex
connectivity analysis, providing converging evidence for a
decreased connectivity in DMN-related brain regions, and
increased connectivity along the medial temporal lobe in ASD.
Moreover, symptom severity on the social interaction and com-
munication subscales of the ADI-R were negatively correlated with
DMN connectivity strength in the posterior cingulate cortex,
ventromedial prefrontal cortex and whole brain connectivity ana-
lyses. The analysis of the interaction between whole-brain con-
nectivity and SCR revealed significant contributions of SCR
signals to the connectivity patterns in both groups, suggesting
that differences in autonomic-related brain activity between the
groups may account, at least in part, for the differences in brain
connectivity.
Possible differences in thought content, as previously discussed,
may also account for the differences in DMN connectivity.
Previous studies have linked the DMN to the generation of spon-
taneous thoughts (Mason et al., 2007; Andrews-Hanna et al.,
2010) and self-referential mental activity (Whitfield-Gabrieli
et al., 2011). Thus, the weaker connectivity of the DMN and
higher connectivity of visual and auditory cortices in ASD may
indicate an inability to shift attention from exteroceptive to intero-
ceptive signals during rest in those individuals. This interpretation
supports a recent model in which ASD is associated with abnorm-
alities in the salience network (Uddin and Menon, 2009; Menon
and Uddin, 2010). The salience network is comprised of the
anterior insular cortex and anterior cingulate cortex, and is postu-
lated to play a key role in switching between the externally ori-
ented executive control network and the internally oriented DMN
(Uddin and Menon, 2009; Menon and Uddin, 2010). Indeed,
several studies have found neuropathological and functional
abnormalities of the anterior insular cortex in ASD (Di Martino
et al., 2009; Ebisch et al., 2011; Santos et al., 2011), and altered
Table 8 Interaction of group (neurotypical controls versus ASD) and SCR (with SCR versus without SCR) for the functionalconnectivity of the whole brain
Region L/R BA x y z T Z P k
Controls (with-without)`ASD (with-without)
Anterior cingulate cortex R 32 6 42 18 5.08 4.28 0.000 606
Superior frontal gyrus (medial) L 8 �3 30 60 4.13 3.65 0.000
Superior frontal gyrus (medial) R 8 6 33 42 4.03 3.57 0.000
Anterior cingulate cortex (pregenual) L 24 �6 33 6 3.95 3.51 0.000
Anterior cingulate cortex (subgenual) R 25 6 24 �6 2.96 2.75 0.003
Inferior frontal gyrus R 45 48 21 3 4.17 3.67 0.000 157
Anterior insular cortex R 33 21 �9 2.76 2.59 0.005
Posterior insular cortex R 42 �15 �6 4.13 3.65 0.000 78
Cerebellum crus II L �9 �84 �24 3.26 2.99 0.001 87
Mid frontal gyrus R 8 33 15 54 3.20 2.95 0.002 197
Mid frontal gyrus R 8 42 24 42 3.08 2.85 0.002
Posterior cingulate cortex 23 0 �12 30 3.20 2.94 0.002 230
Posterior cingulate cortex R 26 3 �42 27 2.97 2.76 0.003
Posterior cingulate cortex L 31 �3 �27 36 2.89 2.69 0.004
Precuneus L 31 �12 �57 36 2.81 2.62 0.004
Inferior parietal lobule L 40 �51 �51 39 3.12 2.88 0.002 99
Angular gyrus L 39 �57 �60 27 2.58 2.43 0.007
Inferior parietal lobule R 40 36 �51 42 2.96 2.75 0.003 92
Vermis IV R 6 �54 �21 2.64 2.48 0.007 78
ASD (with-without)`Controls (with-without)
Hippocampus L �30 �21 �12 4.43 3.86 0.000 74
Amygdala L �21 �3 �15 2.16 2.07 0.019
Cerebellum crus VII R 39 �69 �54 2.76 2.58 0.005 80
Nucleus accumbens L �21 9 �15 3.67 3.31 0.000 92
Caudate nucleus L �6 12 �3 3.08 2.85 0.002
Calcarine cortex R 18 3 �90 12 3.53 3.20 0.001 203
Calcarine cortex L 17 �9 �66 9 3.34 3.05 0.001
Cuneus L 19 3 �81 36 2.51 2.37 0.009
Cerebellum crus VI L �12 �72 �18 3.19 2.93 0.002 92
Inferior occipital gyrus L 18 �18 �90 �6 2.33 2.22 0.013
Fusiform gyrus R 37 42 �60 �15 3.11 2.87 0.002 145
Lingual gyrus R 18 15 �54 0 2.93 2.73 0.003
Inferior occipital gyrus R 18 33 �93 �12 3.06 2.83 0.002 109
Height threshold: T = 1.7, P50.05.Extent threshold: k = 67.L = left; R = right; BA = Brodmann area.
168 | Brain 2014: 137; 153–171 T. Eilam-Stock et al.
at University C
ollege London on January 15, 2014
http://brain.oxfordjournals.org/D
ownloaded from

functional connectivity patterns of the anterior insular cortex in the
ASD group were found in our data set too. It is possible, therefore,
that the focus of the ASD participants on visual and auditory in-
formation during the scan may have not only driven their SCR, but
in fact influenced whole brain connectivity patterns, including con-
nectivity of the DMN. This model, together with the significant
contributions of SCR to the connectivity patterns, supports the
importance of autonomic activity in modulating resting-state func-
tional connectivity.
This work adds an important element to an emerging line of
research showing significant contributions of autonomic nervous
system signals to resting state network connectivity in the normal
population (Birn et al., 2008; Iacovella and Hasson, 2011; Fan
et al., 2012). These studies suggest that incorporating measure-
ments of autonomic signals in resting-state functional MRI con-
nectivity analysis, rather than regressing them out as noise, may
provide better insight into the driving forces of brain fluctuations,
and the representation of brain activity and connectivity during
‘rest’. The current findings further suggest that examining auto-
nomic nervous system contributions to brain connectivity during
rest may significantly improve our understanding of alterations in
resting state functional connectivity patterns that were previously
observed in a variety of patient populations, such as in individuals
with depression (Greicius et al., 2007; Bluhm et al., 2009), schizo-
phrenia (Garrity et al., 2007; Whitfield-Gabrieli et al., 2009;
Ongur et al., 2010), bipolar disorder (Ongur et al., 2010) and
attention-deficit hyperactivity disorder (Uddin et al., 2008; Cao
et al., 2009), in addition to ASD (Kennedy and Courchesne,
2008b; Monk et al., 2009; Assaf et al., 2010; Weng et al., 2010).
Clinical implicationsOur data may have important clinical implications for the diagnosis
and treatment of ASD. Autonomic measures are relatively easy
and inexpensive to obtain, even with individuals of a very young
age. Detecting autonomic abnormalities may aid in an early diag-
nosis of ASD, a process that could be critical to the effectiveness
of existing behavioural treatments (Eaves and Ho, 2004;
Granpeesheh et al., 2009). In addition, treatments targeting auto-
nomic abnormalities may also reduce autistic symptoms (Murphy
et al., 2000; Binstock, 2001; Porges, 2003; Field and Diego,
2008). For example, Murphy et al. (2000) observed that autistic
symptoms were significantly reduced after vagal nerve stimulation
in four patients with severe autistic behaviours. More research is
needed, however, to determine the benefits of such treatments for
ASD.
ConclusionOur data provide evidence for abnormal associations between
spontaneous SCR and brain activity and connectivity during rest
in ASD. The observed autonomic abnormalities may contribute to
the socio-emotional deficits in ASD because autonomic signals are
essential to emotional processing. Taking autonomic measure-
ments during investigation of resting state brain activity and con-
nectivity may be critical for between-group comparisons,
especially if one of the groups exhibits emotional abnormality, as
is the case in many forms of psychopathology.
FundingThis research was supported by the National Institute of Health
(NIH) Grant R21 MH083164 and two Research Enhancement
Awards from Queens College, City University of New York, to
J.F., along with the National Center for Research Resources
(NCRR) Grant UL1 RR029887, and a James S. McDonnell
Foundation grant (22002078, to P.R.H.). Two additional grants,
from the National Natural Science Foundation (Grant No.
81030028) and the National Science Fund for Distinguished
Young Scholars (Grant No. 81225012) of China to Y.H., helped
in supporting this study. The contents are the sole responsibility of
the authors and do not necessarily represent the official views of
the aforementioned funding agencies. We would like to acknow-
ledge the Beatrice and Samuel A. Seaver Foundation for their sup-
port. The authors report no biomedical financial interests or
potential conflicts of interest.
Supplementary materialSupplementary material is available at Brain online.
ReferencesAdolphs R. Neural systems for recognizing emotion. Curr Opin Neurobiol
2002; 12: 169–77.
American Psychiatric Association. DSM-5 Task Force. Diagnostic and
statistical manual of mental disorders. DSM-5. 5th edn. Arlington,
VA: American Psychiatric Association; 2013.
Anderson CJ, Colombo J. Larger tonic pupil size in young children with
autism spectrum disorder. Dev Psychobiol 2009; 51: 207–11.
Anderson CJ, Colombo J, Unruh KE. Pupil and salivary indicators of
autonomic dysfunction in autism spectrum disorder. Dev Psychobiol
2013; 55: 465–82.Andrews-Hanna JR, Reidler JS, Huang C, Buckner RL. Evidence for the
default network’s role in spontaneous cognition. J Neurophysiol 2010;
104: 322–35.Assaf M, Jagannathan K, Calhoun VD, Miller L, Stevens MC, Sahl R,
et al. Abnormal functional connectivity of default mode sub-networks
in autism spectrum disorder patients. NeuroImage 2010; 53: 247–56.
Bach DR, Daunizeau J, Friston KJ, Dolan RJ. Dynamic causal modelling of
anticipatory skin conductance responses. Biol Psychol 2010a; 85:
163–70.
Bach DR, Flandin G, Friston KJ, Dolan RJ. Modelling event-related skin
conductance responses. Int J Psychophysiol 2010b; 75: 349–56.
Bal E, Harden E, Lamb D, Van Hecke AV, Denver JW, Porges SW.
Emotion recognition in children with autism spectrum disorders: rela-
tions to eye gaze and autonomic state. J Autism Dev Disord 2010; 40:
358–70.Baron-Cohen S. Do people with autism understand what causes emo-
tion? Child Dev 1991; 62: 385–95.Barrett LF, Mesquita B, Ochsner KN, Gross JJ. The experience of
emotion. Annu Rev Psychol 2007; 58: 373–403.Binstock T. Anterior insular cortex: linking intestinal pathology and brain
function in autism-spectrum subgroups. Med Hypotheses 2001; 57:
714–17.
Abnormal autonomic and brain activities in autism Brain 2014: 137; 153–171 | 169
at University C
ollege London on January 15, 2014
http://brain.oxfordjournals.org/D
ownloaded from

Birn RM, Murphy K, Bandettini PA. The effect of respiration variations on
independent component analysis results of resting state functional
connectivity. Hum Brain Mapp 2008; 29: 740–50.
Bluhm R, Williamson P, Lanius R, Theberge J, Densmore M, Bartha R,
et al. Resting state default-mode network connectivity in early depres-
sion using a seed region-of-interest analysis: decreased connectivity
with caudate nucleus. Psychiatry Clin Neurosci 2009; 63: 754–61.
Boucsein W. Electrodermal activity. New York: Plenum; 1992.
Buckner RL, Sepulcre J, Talukdar T, Krienen FM, Liu H, Hedden T, et al.
Cortical hubs revealed by intrinsic functional connectivity: mapping,
assessment of stability, and relation to Alzheimer’s disease.
J Neurosci 2009; 29: 1860–73.Cao X, Cao Q, Long X, Sun L, Sui M, Zhu C, et al. Abnormal resting-
state functional connectivity patterns of the putamen in medication-
naive children with attention deficit hyperactivity disorder. Brain Res
2009; 1303: 195–206.
Chang C, Metzger CD, Glover GH, Duyn JH, Heinze HJ, Walter M.
Association between heart rate variability and fluctuations in resting-
state functional connectivity. NeuroImage 2013; 68: 93–104.Cole MW, Pathak S, Schneider W. Identifying the brain’s most globally
connected regions. NeuroImage 2010; 49: 3132–48.Craig AD. How do you feel? Interoception: the sense of the physiological
condition of the body. Nat Rev Neurosci 2002; 3: 655–66.Craig AD. Interoception: the sense of the physiological condition of the
body. Curr Opin Neurobiol 2003; 13: 500–5.Craig AD. How do you feel–now? The anterior insula and human aware-
ness. Nat Rev Neurosci 2009; 10: 59–70.
Craik FIM, Moroz TM, Moscovitch M, Stuss DT, Winocur G, Tulving E,
et al. In search of the self: a positron emission tomography study.
Psychol Sci 1999; 10: 26–34.
Critchley HD. Neural mechanisms of autonomic, affective, and cognitive
integration. J Comp Neurol 2005; 493: 154–66.
Critchley HD, Elliott R, Mathias CJ, Dolan RJ. Neural activity relating to
generation and representation of galvanic skin conductance responses:
a functional magnetic resonance imaging study. J Neurosci 2000; 20:
3033–40.
Critchley HD, Melmed RN, Featherstone E, Mathias CJ, Dolan RJ.
Volitional control of autonomic arousal: a functional magnetic reson-
ance study. NeuroImage 2002; 16: 909–19.
Critchley HD, Nagai Y, Gray MA, Mathias CJ. Dissecting axes of auto-
nomic control in humans: insights from neuroimaging. Auton Neurosci
2011; 161: 34–42.Damasio AR, Grabowski TJ, Bechara A, Damasio H, Ponto LL, Parvizi J,
et al. Subcortical and cortical brain activity during the feeling of self-
generated emotions. Nat Neurosci 2000; 3: 1049–56.
Di Martino A, Ross K, Uddin LQ, Sklar AB, Castellanos FX, Milham MP.
Functional brain correlates of social and nonsocial processes in autism
spectrum disorders: an activation likelihood estimation meta-analysis.
Biol Psychiatry 2009; 65: 63–74.
Eaves LC, Ho HH. The very early identification of autism: outcome to
age 4 1/2-5. J Autism Dev Disord 2004; 34: 367–78.
Ebisch SJ, Gallese V, Willems RM, Mantini D, Groen WB, Romani GL,
et al. Altered intrinsic functional connectivity of anterior and posterior
insula regions in high-functioning participants with autism spectrum
disorder. Hum Brain Mapp 2011; 32: 1013–28.Ekman P, Levenson RW, Friesen WV. Autonomic nervous-system activity
distinguishes among emotions. Science 1983; 221: 1208–10.Fan J, Xu P, Van Dam NT, Eilam-Stock T, Gu X, Luo YJ, et al.
Spontaneous brain activity relates to autonomic arousal. J Neurosci
2012; 32: 11176–86.
Field T, Diego M. Vagal activity, early growth and emotional develop-
ment. Infant Behav Dev 2008; 31: 361–73.
Fox MD, Snyder AZ, Vincent JL, Corbetta M, Van Essen DC, Raichle ME.
The human brain is intrinsically organized into dynamic, anticorrelated
functional networks. Proc Natl Acad Sci USA 2005; 102: 9673–8.
Friston KJ, Holmes AP, Worsley KJ, Poline J-P, Frith CD, Frackowiak RSJ.
Statistical parametric maps in functional imaging: a general linear ap-
proach. Hum Brain Mapp 1995; 2: 189–210.
Frith CD, Frith U. Social cognition in humans. Curr Biol 2007; 17:
R724–32.
Garrity AG, Pearlson GD, McKiernan K, Lloyd D, Kiehl KA, Calhoun VD.
Aberrant “default mode” functional connectivity in schizophrenia. Am
J Psychiatry 2007; 164: 450–7.
Gray MA, Harrison NA, Wiens S, Critchley HD. Modulation of emotional
appraisal by false physiological feedback during fMRI. PLoS one 2007;
2: e546.
Granpeesheh D, Dixon DR, Tarbox J, Kaplan AM, Wilke AE. The effects
of age and treatment intensity on behavioral intervention outcomes
for children with autism spectrum disorders. Res Autism Spectr Disord
2009; 3: 1014–22.
Greicius MD, Flores BH, Menon V, Glover GH, Solvason HB, Kenna H,
et al. Resting-state functional connectivity in major depression: abnor-
mally increased contributions from subgenual cingulate cortex and
thalamus. Biol Psychiatry 2007; 62: 429–37.
Gu X, Gao Z, Wang X, Liu X, Knight RT, Hof PR, et al. Anterior insular
cortex is necessary for empathetic pain perception. Brain 2012; 135 (Pt
9): 2726–35.
Gu X, Hof PR, Friston KJ, Fan J. Anterior insular cortex and emotional
awareness. J Comp Neurol 2013; 521: 3371–88.
Harrison NA, Gray MA, Gianaros PJ, Critchley HD. The embodiment of
emotional feelings in the brain. J Neurosci 2010; 30: 12878–84.
Hill E, Berthoz S, Frith U. Brief report: cognitive processing of own emo-
tions in individuals with autistic spectrum disorder and in their rela-
tives. J Autism Dev Disord 2004; 34: 229–35.
Hirstein W, Iversen P, Ramachandran VS. Autonomic responses of aut-
istic children to people and objects. Proc Biol Sci 2001; 268: 1883–8.Hobson RP, Ouston J, Lee A. Emotion recognition in autism: coordinat-
ing faces and voices. Psychol Med 1988; 18: 911–23.
Horvath K, Papadimitriou JC, Rabsztyn A, Drachenberg C, Tildon JT.
Gastrointestinal abnormalities in children with autistic disorder.
J Pediatr 1999; 135: 559–63.
Iacovella V, Hasson U. The relationship between BOLD signal and auto-
nomic nervous system functions: implications for processing of
“physiological noise". J Magn Reson Imag 2011; 29: 1338–45.
James W. What is an emotion? Mind 1884; 9: 188–205.
Jenkins AC, Mitchell JP. Medial prefrontal cortex subserves diverse forms
of self-reflection. Soc Neurosci 2011; 6: 211–18.
Kelley WM, Macrae CN, Wyland CL, Caglar S, Inati S, Heatherton TF.
Finding the self? An event-related fMRI study. J Cogn Neurosci 2002;
14: 785–94.Kennedy DP, Courchesne E. Functional abnormalities of the default net-
work during self- and other-reflection in autism. Soc Cogn Affect
Neurosci 2008a; 3: 177–90.Kennedy DP, Courchesne E. The intrinsic functional organization of the
brain is altered in autism. NeuroImage 2008b; 39: 1877–85.
Koshino H, Carpenter PA, Minshew NJ, Cherkassky VL, Keller TA,
Just MA. Functional connectivity in an fMRI working memory task
in high-functioning autism. Neuroimage 2005; 24: 810–21.
Kylliainen A, Hietanen JK. Skin conductance responses to another per-
son’s gaze in children with autism. J Autism Dev Disord 2006; 36:
517–25.
Lange CG. The mechanism of the emotions. In: Rand B, editor. The
classical psychologist. Boston, MA: Houghton Mifflin; 1885.
p. 672–85.
Ledberg A, Akerman S, Roland PE. Estimation of the probabilities of 3D
clusters in functional brain images. NeuroImage 1998; 8: 113–28.Liang X, Zou Q, He Y, Yang Y. Coupling of functional connectivity and
regional cerebral blood flow reveals a physiological basis for network
hubs of the human brain. Proc Natl Acad Sci USA 2013; 110:
1929–34.
Liebhart EH. Effects of false heart rate feedback and task instructions on
information search, attributions, and stimulus ratings. Psychol Res
1977; 39: 185–202.
Lord C, Risi S, Lambrecht L, Cook EH Jr, Leventhal BL, DiLavore PC,
et al. The autism diagnostic observation schedule-generic: a standard
170 | Brain 2014: 137; 153–171 T. Eilam-Stock et al.
at University C
ollege London on January 15, 2014
http://brain.oxfordjournals.org/D
ownloaded from

measure of social and communication deficits associated with thespectrum of autism. J Autism Dev Disord 2000; 30: 205–23.
Lord C, Rutter M, Le Couteur A. Autism diagnostic interview-revised: a
revised version of a diagnostic interview for caregivers of individuals
with possible pervasive developmental disorders. J Autism Dev Disord1994; 24: 659–85.
Macrae CN, Moran JM, Heatherton TF, Banfield JF, Kelley WM. Medial
prefrontal activity predicts memory for self. Cereb Cortex 2004; 14:
647–54.Mason MF, Norton MI, Van Horn JD, Wegner DM, Grafton ST,
Macrae CN. Wandering minds: the default network and stimulus-in-
dependent thought. Science 2007; 315: 393–5.Mathersul D, McDonald S, Rushby JA. Autonomic arousal explains social
cognitive abilities in high-functioning adults with autism spectrum dis-
order. Int J Psychophysiol 2013; 89: 475–482.
Menon V, Uddin LQ. Saliency, switching, attention and control: a net-work model of insula function. Brain Struct Funct 2010; 214: 655–67.
Ming X, Julu PO, Brimacombe M, Connor S, Daniels ML. Reduced car-
diac parasympathetic activity in children with autism. Brain Dev 2005;
27: 509–16.Molloy CA, Manning-Courtney P. Prevalence of chronic gastrointestinal
symptoms in children with autism and autistic spectrum disorders.
Autism 2003; 7: 165–71.
Monk CS, Peltier SJ, Wiggins JL, Weng SJ, Carrasco M, Risi S, et al.Abnormalities of intrinsic functional connectivity in autism spectrum
disorders. NeuroImage 2009; 47: 764–72.
Murphy JV, Wheless JW, Schmoll CM. Left vagal nerve stimulation in sixpatients with hypothalamic hamartomas. Pediatr Neurol 2000; 23:
167–8.
Nikula R. Psychological correlates of nonspecific skin conductance re-
sponses. Psychophysiology 1991; 28: 86–90.Northoff G, Heinzel A, de Greck M, Bermpohl F, Dobrowolny H,
Panksepp J. Self-referential processing in our brain–a meta-analysis
of imaging studies on the self. NeuroImage 2006; 31: 440–57.
Ongur D, Lundy M, Greenhouse I, Shinn AK, Menon V, Cohen BM,et al. Default mode network abnormalities in bipolar disorder and
schizophrenia. Psychiatry Res 2010; 183: 59–68.
Patterson JC II, Ungerleider LG, Bandettini PA. Task-independent func-tional brain activity correlation with skin conductance changes: an
fMRI study. NeuroImage 2002; 17: 1797–806.
Phillips ML, Drevets WC, Rauch SL, Lane R. Neurobiology of emotion
perception I: the neural basis of normal emotion perception. BiolPsychiatry 2003; 54: 504–14.
Pollatos O, Gramann K, Schandry R. Neural systems connecting intero-
ceptive awareness and feelings. Hum Brain Mapp 2007; 28: 9–18.
Porges SW. The polyvagal theory: phylogenetic contributions to socialbehavior. Physiol Behav 2003; 79: 503–13.
Rainville P, Bechara A, Naqvi N, Damasio AR. Basic emotions are asso-
ciated with distinct patterns of cardiorespiratory activity. Int J
Psychophysiol 2006; 61: 5–18.Santos M, Uppal N, Butti C, Wicinski B, Schmeidler J, Giannakopoulos P,
et al. Von Economo neurons in autism: a stereologic study of the
frontoinsular cortex in children. Brain Res 2011; 1380: 206–17.Schoen SA, Miller LJ, Brett-Green B, Hepburn SL. Psychophysiology of
children with autism spectrum disorder. Res Autism Spectr Disord
2008; 2: 417–29.
Seth AK, Suzuki K, Critchley HD. An interoceptive predictive codingmodel of conscious presence. Front Psychol 2011; 2: 395.
Silani G, Bird G, Brindley R, Singer T, Frith C, Frith U. Levels of emotional
awareness and autism: an fMRI study. Soc Neurosci 2008; 3: 97–112.
Slotnick SD, Schacter DL. A sensory signature that distinguishes truefrom false memories. Nat Neurosci 2004; 7: 664–72.
Song XW, Dong ZY, Long XY, Li SF, Zuo XN, Zhu CZ, et al. REST: a
toolkit for resting-state functional magnetic resonance imaging data
processing. PLoS ONE 2011; 6: e25031.Truax SR. Active search, mediation, and the manipulation os cue dimen-
sions: emotion attribution in the false feedback paradigm. Motiv Emot
1983; 7: 41–59.Tzourio-Mazoyer N, Landeau B, Papathanassiou D, Crivello F, Etard O,
Delcroix N, et al. Automated anatomical labeling of activations in SPM
using a macroscopic anatomical parcellation of the MNI MRI single-
subject brain. Neuroimage 2002; 15: 273–89.
Uddin LQ, Kelly AM, Biswal BB, Margulies DS, Shehzad Z, Shaw D, et al.
Network homogeneity reveals decreased integrity of default-mode
network in ADHD. J Neurosci Methods 2008; 169: 249–54.
Uddin LQ, Menon V. The anterior insula in autism: under-connected and
under-examined. Neurosci Biobehav Rev 2009; 33: 1198–203.
Valins S. Cognitive effects of false heart-rate feedback. J Pers Soc
Psychol 1966; 4: 400–8.Van Dijk KR, Hedden T, Venkataraman A, Evans KC, Lazar SW,
Buckner RL. Intrinsic functional connectivity as a tool for human con-
nectomics: theory, properties, and optimization. J Neurophysiol 2010;
103: 297–321.
Vaughan Van Hecke A, Lebow J, Bal E, Lamb D, Harden E, Kramer A,
et al. Electroencephalogram and heart rate regulation to familiar and
unfamiliar people in children with autism spectrum disorders. Child
Dev 2009; 80: 1118–33.
Vetrugno R, Liguori R, Cortelli P, Montagna P. Sympathetic skin re-
sponse: basic mechanisms and clinical applications. Clin Auton Res
2003; 13: 256–70.
Vogt BA. Pain and emotion interactions in subregions of the cingulate
gyrus. Nat Rev Neurosci 2005; 6: 533–44.Wang L, Dai Z, Peng H, Tan L, Ding Y, He Z, et al. Overlapping and
segregated resting-state functional connectivity in patients with major
depressive disorder with and without childhood neglect. Hum Brain
Mapp 2013; doi: 10.1002/hbm.22241.
Wechsler D. Wechsler adult intelligence scale. 3rd edn. New York:
Psychological Corporation; 1997.
Weng SJ, Wiggins JL, Peltier SJ, Carrasco M, Risi S, Lord C, et al.
Alterations of resting state functional connectivity in the default net-
work in adolescents with autism spectrum disorders. Brain Res 2010;
1313: 202–14.
White JF. Intestinal pathophysiology in autism. Exp Biol Med (Maywood)
2003; 228: 639–49.Whitfield-Gabrieli S, Moran JM, Nieto-Castanon A, Triantafyllou C,
Saxe R, Gabrieli JD. Associations and dissociations between default
and self-reference networks in the human brain. NeuroImage 2011;
55: 225–32.
Whitfield-Gabrieli S, Thermenos HW, Milanovic S, Tsuang MT,
Faraone SV, McCarley RW, et al. Hyperactivity and hyperconnectivity
of the default network in schizophrenia and in first-degree relatives of
persons with schizophrenia. Proc Natl Acad Sci USA 2009; 106:
1279–84.
Xia M, Wang J, He Y. BrainNet Viewer: A Network Visualization Tool for
Human Brain Connectomics. PLoS ONE 2013; 8 (7): e68910.
Yan C-G, Zang Y-F. DPARSF: a MATLAB toolbox for “pipeline” data
analysis of resting-state fMRI. Front Syst Neurosci 2010; 4: 13.Zahn TP, Rumsey JM, Van Kammen DP. Autonomic nervous system
activity in autistic, schizophrenic, and normal men: effects of stimulus
significance. J Abnorm Psychol 1987; 96: 135–44.
Zuo XN, Ehmke R, Mennes M, Imperati D, Castellanos FX, Sporns O,
et al. Network centrality in the human functional connectome. Cereb
Cortex 2012; 22: 1862–75.
Abnormal autonomic and brain activities in autism Brain 2014: 137; 153–171 | 171
at University C
ollege London on January 15, 2014
http://brain.oxfordjournals.org/D
ownloaded from