
The Information Content of Abnormal Trading Volume
29
Journal of Business Finance & Accounting, 37(7) & (8), 950–978, September/October 2010, 0306-686X doi: 10.1111/j.1468-5957.2010.02197.x The Information Content of Abnormal Trading Volume Emanuele Bajo* Abstract: This paper investigates the way in which abnormal trading volume reveals new information to market participants. It is generally thought that trading volume is an efficient proxy for information flow and enhances the information set of investors. However, no research has related the presence of abnormal trading volume to firm characteristics, such as ownership and governance structure, which also have a theoretical link to information quality. I find strong excess returns around extreme trading levels, which are only moderately attributable to information disclosure. Moreover, these returns are not caused by liquidity fluctuations since prices do not reverse over the following period. In contrast, there is evidence of price momentum, suggesting that traders can implement successful portfolio strategies based on observation of current volumes. Keywords: abnormal trading volume, Italian equity market, insider trading 1. INTRODUCTION The traditional definition of semi-strong market efficiency assumes that all public information is reflected in market prices, and that trading volume plays no role. When new information flows into the market, prices adjust to a new equilibrium level and any increase in volume is the resulting effect of informed trades. However, empirical evidence suggests that new information, concomitant price changes and heightened trading volume are not necessarily simultaneous phenomena, as market efficiency would imply. More specifically, stock markets often show sudden and large changes in price and volume without any new information disclosure. A number of reasons help to explain this phenomenon. These include unreported news (more likely for small firms), informal communication between financial analysts or advisors and their clients, and trading based on private information. A possible question is inevitably posed: how often is large and unexplained (by new information) trading volume due to the activity of investors trading on private information? Surprisingly, despite the fact that trading volume is used by stock exchange authorities to *The author is from the Department of Management, University of Bologna, Italy. He would like to thank the editor, the anonymous referees, Marco Bigelli, Sandro Sandri, Giovanni Petrella, Raghavendra Rau, Nikhil Varaiya and Petko Kalev for their valuable and helpful suggestions. He would also like to thank Elena Sapienza and Stefano Mengoli for providing him with some of the data. The author is solely responsible for any remaining errors. (Paper received September 2006, revised version accepted October 2009) Address for correspondence: Emanuele Bajo, Department of Management, University of Bologna, Via Capo di lucca, 34 - 40126 Bologna, Italy. e-mail: [email protected] C 2010 Blackwell Publishing Ltd, 9600 Garsington Road, Oxford OX4 2DQ, UK and 350 Main Street, Malden, MA 02148, USA. 950 Journal of Business Finance & Accounting
Transcript of The Information Content of Abnormal Trading Volume

Journal of Business Finance & Accounting, 37(7) & (8), 950–978, September/October 2010, 0306-686Xdoi: 10.1111/j.1468-5957.2010.02197.x
The Information Content of AbnormalTrading Volume
Emanuele Bajo*
Abstract: This paper investigates the way in which abnormal trading volume reveals newinformation to market participants. It is generally thought that trading volume is an efficientproxy for information flow and enhances the information set of investors. However, no researchhas related the presence of abnormal trading volume to firm characteristics, such as ownershipand governance structure, which also have a theoretical link to information quality. I findstrong excess returns around extreme trading levels, which are only moderately attributableto information disclosure. Moreover, these returns are not caused by liquidity fluctuations sinceprices do not reverse over the following period. In contrast, there is evidence of price momentum,suggesting that traders can implement successful portfolio strategies based on observation ofcurrent volumes.
Keywords: abnormal trading volume, Italian equity market, insider trading
1. INTRODUCTION
The traditional definition of semi-strong market efficiency assumes that all publicinformation is reflected in market prices, and that trading volume plays no role. Whennew information flows into the market, prices adjust to a new equilibrium level andany increase in volume is the resulting effect of informed trades. However, empiricalevidence suggests that new information, concomitant price changes and heightenedtrading volume are not necessarily simultaneous phenomena, as market efficiencywould imply. More specifically, stock markets often show sudden and large changesin price and volume without any new information disclosure.
A number of reasons help to explain this phenomenon. These include unreportednews (more likely for small firms), informal communication between financial analystsor advisors and their clients, and trading based on private information. A possiblequestion is inevitably posed: how often is large and unexplained (by new information)trading volume due to the activity of investors trading on private information?Surprisingly, despite the fact that trading volume is used by stock exchange authorities to
*The author is from the Department of Management, University of Bologna, Italy. He would like to thankthe editor, the anonymous referees, Marco Bigelli, Sandro Sandri, Giovanni Petrella, Raghavendra Rau,Nikhil Varaiya and Petko Kalev for their valuable and helpful suggestions. He would also like to thank ElenaSapienza and Stefano Mengoli for providing him with some of the data. The author is solely responsible forany remaining errors. (Paper received September 2006, revised version accepted October 2009)
Address for correspondence: Emanuele Bajo, Department of Management, University of Bologna, Via Capodi lucca, 34 - 40126 Bologna, Italy.e-mail: [email protected]
C© 2010 Blackwell Publishing Ltd, 9600 Garsington Road, Oxford OX4 2DQ, UKand 350 Main Street, Malden, MA 02148, USA. 950
Journal of Business Finance & Accounting

INFORMATION CONTENT OF ABNORMAL TRADING VOLUME 951
detect market abuses and that practitioners use abnormal volume as a signal of forth-coming public announcements, no prior research has investigated the link betweenunexplained trading volume and any possible violation of insider trading laws.
Observing trading volume alone is not sufficient to draw any conclusions regardinga breach in insider trading laws. However, the unobservability of illegal trades doesnot prevent us from conjecturing that, in a country with low investor protectionand poor law enforcement, insiders can expropriate minority shareholders usingtheir information advantage by trading the firm’s stocks in advance of a publicannouncement. Italy, with its weak legal protection for minority shareholders, analmost complete lack of enforcement of insider trading laws and a high ownershipconcentration obtained through pyramidal groups and non-voting shares is a perfectsetting to test this hypothesis.
The presented hypothesis is also consistent with Bigelli et al. (2007) and Meulbroek(1992). Bigelli et al. (2007) argue that Italian majority shareholders are able to transferwealth from minority shareholders through dual class share unification. Due to thehuge discount at which nonvoting shares usually trade, a one-to-one conversion leads tostrong price movements around the announcement and the opportunity of enormousprofits for those who trade in advance of information disclosure. Meulbroek (1992)documents that, in the event of a violation of insider trading laws, the abnormal tradingvolume is almost equal to the volume generated by insiders’ transactions. Hence, sheproves the relation between the violation of insider trading law and abnormal volumes,but she does not suggest a potential inverse relation between extreme trading levelsand breaches of insider trading law. Moreover, whereas she analyzes a small subset ofvolume events, I take into consideration the entire population. In this sense, a moregeneral study can add a significant contribution to this field of research.
During the past twenty years a large number of other papers have taken into accountthe possible relevance of volume, but no prior work has explored the informationcontent of extreme peaks in trading volume with specific regard to those events whereno new public information has been disclosed. Rather than analyzing the volume perse, I examine the information content of sudden and abnormal changes in volume.I believe the informative role of volume has not been fully exploited and a specificinvestigation of the determinants of its large change can contribute to the literature inthis area.
The rest of the paper is organized as follows. Section 2 develops the testable hypothe-sis. Section 3 describes the data, samples, selection procedures and methodology, whileSection 4 presents the results. Finally, Section 5 concludes.
2. RELATED LITERATURE AND TESTABLE HYPOTHESES
The first contribution to the returns-volume relationship is Epps (1975), who formal-ized the Wall Street saying that bull (bear) stock market periods are usually associatedwith high (low) trading volume cycles. Comiskey et al. (1984) find a significant andpositive correlation between trading volume and the absolute value of price changes for211 individual common stocks. Karpoff (1987 and 1985) confirms this relation in bothequity and futures markets. Trading volume also plays an important role in information-based models, where prices alone are unable to provide full information about themagnitude and precision of news signals. Glosten and Milgrom (1985) demonstratehow trade imbalances might force prices to their full information value. In fact, if
C© 2010 Blackwell Publishing Ltd.

952 BAJO
informed traders continue trading on the same side of the market – buying (selling)when in possession of good (bad) news – observation of trade concentration becomesinformative.
Easley and O’Hara (1987) enhance this insight by considering trade size. Intheir model, informed investors can vary the quantity of their trades, producingdifferent effects on security prices. A common characteristic of these models is thatprices immediately adjust to a public announcement, but not to private information.Consequently, the price adjustment is not instantaneous to its full informative level. Thesequence of trading is also important (Easley and O’Hara, 1992). As trades arise notjust from information but also for liquidity reasons, the observation of a single trade ishardly revealing. Given the informed behaviour of trades’ repetition, the observationof a trading sequence becomes informative. The relation between trading volume,price and private information has also been investigated in the derivative markets(Easley et al., 1998; and Pan and Poteshman, 2006). In fact, the leverage embeddedin derivatives offers informed traders a way of enlarging their trading profits. Theobservation of trading volume and the imbalance between call and put options canprovide an indication of future stock prices.
The common idea of these approaches is that the observation of trading volumeor some of its characteristics (magnitude or timing of the trades) may enhance theinformation set. However, none of these studies suggest a role for a large and suddenchange in trading volume, particularly when no contemporaneous information isdisclosed. The main empirical hypothesis to be tested in this paper is the following:
H1: Large and unexplained changes in volume predict future price changes.
The positive relation between volume and excess returns is well documented.However, the above-mentioned hypothesis differs in a number of ways from what hasalready been proposed. First, this is the first study that looks at extreme changes involume. Pritamani et al. (2001) investigate the information content of large pricechanges, but no similar prior analysis has been conducted on trading volume. Second,the investigation of trading volume is generally associated with its ability to conveyinformation to the market, but no prior work has related the presence of a high levelof trading with firm characteristics, such as ownership and governance structure.
It is well known that the combination of high ownership (diluted through pyramidalstructures and nonvoting shares) and low investor protection determines potentialexpropriation from minority shareholders by their controlling counterparts. In thecontext of the present study, the finance literature offers strong evidence of poorshareholder protection in Italy. Using a sample of Italian dual class firms, Zingales(1994) and Nenova (2003) find an average voting premium which is amongst thehighest in the world. Based on controlling block sales in 39 countries, Dyck and Zingales(2004) document the value of control in Italy at 37% (compared to a 14% cross-countryaverage), the highest level after the Czech Republic and Brazil. The high value of thevoting premium is generally due to the private benefits of control, consisting of anumber of potential harmful actions which can expropriate minority shareholders. Acomprehensive list of the ways in which controlling shareholders can tunnel resourcesaway from minority shareholders is presented in Johnson et al. (2000): selling assets,goods, or services to the company through self-dealing transactions, obtaining loans onpreferential terms, or transferring assets from the listed company to other companiesunder their control.
C© 2010 Blackwell Publishing Ltd.

INFORMATION CONTENT OF ABNORMAL TRADING VOLUME 953
In a recent paper, Bigelli et al. (2007) show how dual class unification in Italycan serve to expropriate wealth from minority shareholders. The authors presenta number of cases where the majority shareholders buy large stakes of non-votingshares before conversion. Due to the large discount at which non-voting shares trade,these actions represent an important loss for minority voting shareholders. Although alarge number of examples have been described, no prior studies explicitly suggest thatmajority shareholders might use private information to further extract private benefitsfrom control. According to this idea, two possible arguments can be put forward: theseparation between voting and cash-flow rights might create an incentive for majorityshareholders to exploit their informational advantage, trading with some anticipationof a public announcement. However, a counter-argument is also acceptable: the higherthe separation, the easier it is for the controlling shareholder to expropriate minorityshareholders through a number of more effective and profitable techniques. In thissense, a high degree of separation should be associated with a lower probabilityof trading driven by undisclosed private information. Therefore, two contrastinghypotheses can be proposed:
H2a: The relation between abnormal trading volume and subsequent price changeis positively related to the degree of separation of ownership from control.
H2b: The relation between abnormal trading volume and subsequent price changeis negatively related to the degree of separation of ownership from control.
The exploitation of undisclosed information is intuitively negatively related to thelevel of monitoring over those subjects who have a direct access to the informationsource (insiders). In Italy, insiders are typically majority shareholders. The monitoringof this category of insiders is determined by a combination of several factors, bothinternal and external to the firm. However, the presence of other relevant shareholdersis probably among the most effective device. Ceteribus paribus, a lower control stakeimplies the presence of other relevant shareholders, higher monitoring over thecontrolling shareholders and a lower chance of exploiting private information throughinformed trading. Hence, I hypothesize:
H3: The information content of abnormal trading volume is positively associatedwith the level of control.
According to their ultimate owner, Italian listed companies1 can be classified into threemain categories: financial institutions, state and families (when one or more individualsdirectly or through other companies control the firm). In family firms the controlis usually shared among a large number of family members. Hence, information isspread over a higher number of insiders and their relatives. In such a setting, informedinvestors trading in possession of undisclosed information is more likely. The resultinghypothesis is:
H4: The information content of abnormal volume is higher for family-controlledfirms.
1 Not accounting for other residual cases (i.e., foreign or public companies).
C© 2010 Blackwell Publishing Ltd.

954 BAJO
A number of studies (Ball and Brown, 1968; Bernard and Thomas, 1990; Ikenberryet al., 1995 and 1996; Loughran and Ritter, 1995; and Michaely et al., 1995) provideevidence of under-reaction to news relating to different types of corporate events.Pritamani et al. (2001), analyzing a sample of large price changes, document theexistence of price continuation for some specific categories of events, but no workhas yet examined trading volume and its under or over-reaction to corporate news.According to information-based models, and consistent with the main hypothesis ofthis study, an increase in trading volume is caused by informed investor (or insider)trading behavior. In a setting where all informed traders simultaneously have accessto private information, high trading volume is likely to be informative only on thesame day. Unusual trading can eventually take place afterwards, but only throughmarket herding.2 If private information slowly filters through insiders, trading willlast for a longer period (volume-continuation) and prices will need a longer timeto fully incorporate any embedded information. In the event of volume persistence(corroborated by price continuation), we should expect lower excess returns on theevent day (as prices do not fully reflect the fundamental value). Hence, the fourthhypothesis is the following:
H5: The information content of abnormal volumes is negatively associated with ahigher degree of volume-continuation.
3. METHODOLOGY AND SAMPLE SELECTION
The main hypothesis driving this study is that large changes in trading volume haveinformation content. Hence, what becomes crucial is not the observation of tradingvolume per se, but rather the recognition of unusual volume. In other words, thephenomenon to be detected is not a high level of trading volume, but rather the extremedeviation from what can be considered standard trading activity. This interpretationof abnormal trading is suitably captured by the normalized abnormal volume (NAV), firstused by Jarrell and Poulsen (1989).3 The NAV for stock i on day t is computed as:
NAVi,t = TVi,t − μi,t
σi,t
where μi,t = 166
66∑
t=1
TVi,t
and σi,t =√√√√ 1
65
66∑
t=1
(TVi,t − μTV
i,t
)2.
TVi,t is trading volume4 for stock i on day t; μ and σ are the mean andstandard deviation of trading volume in the 66 day window immediately prior to the
2 Recent literature about herding suggests that trading initiated by those in possession of private informationcan represent a signal for uninformed traders. In such a framework, uninformed traders, who cannot observethe identity of the person who initiated the trade but only the large trading activity, can herd causing an evenhigher trading volume and a longer length of abnormal market conditions (price continuation).3 A similar approach is used in Pritamani and Singal (2001) for detecting large price changes.4 Computed as the natural logarithm of (trading volume + 1).
C© 2010 Blackwell Publishing Ltd.
INFORMATION CONTENT OF ABNORMAL TRADING VOLUME 955
observation.5 Contrasting with Jarrell and Poulsen (1989), the number of days wherethe mean and standard deviation are computed does not include days with no trading.In the event that a zero-trading day is found, the estimation window goes back tohaving 66 days with positive trading. This methodology is intended to avoid any possiblebias arising from less liquid stocks. In effect, the inclusion of non-trading days in anestimation model6 causes a downward bias in the estimate of the average trading volumeand a resulting upward bias in NAV. This means that normal trading activity (albeitinfrequent) resembles abnormal trading activity. A simple example can illustrate theproblem. Consider two equivalent stocks with a different level of liquidity: stock A istraded once a day, whereas stock B only once a month. For both, investors trade onlyone share. Supposing that today one share of both is traded, the NAV of stock A is zero;the NAV of stock B is zero if zero-trading days are excluded from the estimation windowor otherwise 4.54. The probability of observing a value of 4.54 in a standard normaldistribution is lower than 0.1%, which would signal extreme and informative tradingactivity when this is not the case.
Table 1 shows the empirical distribution of the NAV. Since NAV is re-estimated ona daily basis for each firm, the universe of observations consists of roughly 650,000estimations that go down to 450,000 after the exclusion of days with no trading. Thedistribution is only approximately normal, as it is slightly skewed to the right and hasfatter tails.7
Excess returns are computed using a standard event study methodology. Marketadjusted and market and risk adjusted returns are estimated in a window of 36 days [−5,+30] around the event. The estimation of beta is based on a five year (monthly returns)pre-event window. In order to avoid potential bias deriving from infrequent trading, Iuse an aggregated coefficient method proposed by Dimson (1979), using a two weeklag and lead factor. Data on prices and volumes are obtained from Datastream; news iscollected from the electronic version of Il sole 24 ore (main Italian financial newspaper).
(i) Sample Selection
To test the hypothesis of information content in abnormal volume, the initial sampleconsists of the entire population (320) of firms listed on the Milan Stock Exchange(Borsa Italiana) over the 1997-2003 period. The daily computation of NAV for theentire sample is close to 650,000 values. An extreme level of daily trading volume iscalled an event. A level of trading is said to be ‘extreme’ if the daily trading volume ismore than 2.33 standard deviations away from the mean.8 This selection generates asample of 10,104 events, approximately 36 events per day.9
5 The choice of mean – rather than median – as a benchmark to detect abnormal trading volume does notaffect our results. I also estimated, for each company, the difference between the daily trading volume andthe median calculated over the same defined estimation period (66 working days with positive volumes) withvirtually no difference in sample composition and excess returns around days of abnormal trading (resultsare not shown in the paper).6 Infrequently traded stocks have a large proportion of days with zero trading volume.7 Both the Kolmogorov-Smirnov and Jarque-Bera tests reject the hypothesis of normality at a 1% level.8 To guarantee robustness and remove the possible bias introduced by an arbitrary choice of the cut-off, asensitivity analysis is carried out, replicating the sample creation using two different levels of NAV: 1.64 and3.09, corresponding to 5% and 0.1% of the extreme values drawn from a (standard) normal distribution.9 The top 1% of the total observations should lead to roughly 4,500 events. Nonetheless, the NAVdistribution, showing higher kurtosis, presents extreme events with a higher frequency than a normaldistribution would predict.
C© 2010 Blackwell Publishing Ltd.

956 BAJO
Table 1NAV Descriptive Statistics
Percentiles 0.1 1 5 10 20 30 40 50 60 70 80 90 95 99 99.9
NAV -3.78 -2.52 -1.73 -1.34 -0.88 -0.55 -0.25 0.00 0.18 0.48 0.85 1.38 1.84 2.79 4.04
Observations 665,600 Mean -0.005
Days of zero trading 216,723 Median 0
Standard Deviation 1.0888
NAV Values 448,877 Skewness 0.1563
Events (NAV > 2.33) 10,104 Kurtosis 3.9530
NAV Empirical Distribution
NAV Values
x 104
9
8
7
6
5
4
3
2
-15 -10 -5 0 5 10
1
0
Freq
uenc
y
Notes:The NAV (Normalized Abnormal Volume) detects unusual trading activity and it is computed as:
NAVi,t = TVi,t − μi,t
σi,twhere μi,t = 1
66
66∑
t=1TVi,t and σi,t =
√√√√ 165
66∑
t=1
(TVi,t − μTV
i,t
)2
TVi,t is the trading volume for stock i on day t; μ and σ are the mean and the standard deviation of tradingvolume (for stock i on day t) in a 66 preceding days window. In the event that a zero-trading day is found,the estimation window goes backwards to have 66 days with positive trading. The NAV is computed forthe whole sample (303 firms) and for the entire period considered (1997-2003), obtaining nearly 450,000observations. The distribution of NAV and some descriptive statistics are reported here. This distributionappears slightly right skewed and shows fatter tails. Both Kolmogorov-Smirnov and Jarque-Bera tests rejectthe hypothesis of normality at the 1% level.
C© 2010 Blackwell Publishing Ltd.

INFORMATION CONTENT OF ABNORMAL TRADING VOLUME 957
Next, I select those observations with no large volume over the preceding 30 tradingdays. This criterion is needed to ensure that there are no multiple events in the sameperiod for the same firm. In fact, in the case of an event, an increase in trading tendsto occur for a number of consecutive days. In order to remove this problem and keepunique observations, I exclude repeated abnormal trading events from the samplethat occurs over the 30 preceding days. This reduces the final sample to 3,353 events,consisting of 303 securities with an average of 11.06 observations per firm. According tothis figure, the events are well spread out over the sample, meaning that results cannotbe considered firm-specific in any sense. Table 2 reports some descriptive statistics ofthe firms belonging to the sample with regards to financial, ownership and governancecharacteristics. The typical presence of a majority shareholder is well reflected inthe very high ownership stake and level of control of the ultimate shareholder. The
Table 2Firms’ Descriptive Statistics
Mean Median Min Max
Panel A: Financial Characteristics for Industrial Firms (242)Market capitalization (mln €) 1,351 152 5 41,436Total assets (mln €) 2,177 249 9 62,114Market to book 2.42 1.55 0.00 31.83Return on Equity (%) 6.13 6.89 −22.55 23.88Debt/Asset at market value (%) 31.83 26.72 0.00 0.81EBIT/Total Asset (%) 4.38 5.75 −86.75 38.29EBITDA/Total Asset (%) 9.02 10.51 −74.59 50.53
Panel B: Financial Characteristics for Financial Firms (61)Market capitalization (mln €) 2,269 788 7 19,787Total assets (mln €) 10,100 2,252 7 71,193Market to book 1.77 1.28 0.00 6.36Return on Equity (%) 6.29 6.72 −22.32 19.92Debt/Asset at market value (%) 52.77 76.63 0.00 0.99EBIT/Total Asset (%) 0.29 1.48 −28.51 4.12EBITDA/Total Asset (%) 0.33 1.24 −28.44 4.72
Panel C: Ownership and Governance CharacteristicsOwnership by ultimate shareholder (%) 41.61 46.92 0.00 91.10Control by ultimate shareholder (%) 45.68 50.49 0.00 91.10Ownership/Control 0.85 1.00 0.00 1.00
Family Firms (138)Ownership by ultimate shareholder (%) 42.87 48.53 0.32 88.02Control by ultimate shareholder (%) 48.02 50.13 4.11 88.02Ownership/Control 0.86 1.00 0.01 1.00
Firms State-owned (19)Ownership by ultimate shareholder (%) 43.55 51.00 3.94 74.58Control by ultimate shareholder (%) 47.51 51.00 9.45 74.58Ownership/Control 0.87 1.00 0.42 1.00
Notes:Financial, ownership and governance characteristics for the 303 firms belonging to the sample. Descriptivestatistics for industrial and financial firms’ financial characteristics are reported in Panels A and B. Panel Creports ownership and governance characteristics referred to the year of the first inclusion in the sample.Ownership and Control respectively measure the percentage of cash flows and votes pertaining to theultimate shareholder.
C© 2010 Blackwell Publishing Ltd.

958 BAJO
mean (median) ownership of the ultimate shareholder is 41.61% (46.92%), while thepercentage of voting rights is moderately higher (45.68% and 50.49% respectively inmean and median). The difference between the percentage of ownership and control isa result of a number of legal devices, such as pyramidal structures or non-voting shares,which allow the majority shareholder to dilute the ownership stake without losingvoting rights. The table also shows the same statistics for the subsample of firms wherethe ultimate shareholder is a family or the state. In both cases the three ownershipcharacteristics do not dramatically differ from the whole sample. Family and state-owned firms tend to show a slightly higher level of both ownership and control and alesser degree of separation between voting and cash-flow rights.
4. RESULTS
According to the main hypothesis of this study, abnormal and unexplained volumeconveys information to the market. The evidence seems to confirm this, as the priceresponse to high volume does not revert over the following days as a result of simpleliquidity effects (i.e., price-pressure). In contrast, the findings show a price continuationthe day after abnormal trading volume, allowing a potential herder to implement aportfolio strategy based on an observation of trading volume alone. Consistent withthe hypotheses presented in the second section of this study, the information contentis also related to some ownership characteristics, such as the level of control and family-firm status.
The results are organized as follows. In the first part, I examine the informationcontent of abnormal trading volume with no regard to the presence of contemporane-ous information disclosure. The second part focuses only on the investigation of theprice-news relation in a setting of extreme trading activity. The third part is dedicatedto an understanding of the determinants (ownership and control, firm characteristics,trading volume and news disclosure) of the market response to abnormal volume.Finally, in the last section a possible portfolio strategy is proposed and analyzed.
(i) The Relation Between Abnormal Volume and Excess Returns
The first section investigates the relation between abnormal trading volume and excessreturns, ignoring the presence of contemporaneous information disclosure. Table 3presents abnormal returns (AR) and cumulative abnormal returns (CAR) for the wholesample using three different possible NAV cut-offs: 1.64, 2.33 and 3.09 correspondingto the 5, 1 and 0.1 percentiles of the theoretical distribution. Results do not differsignificantly between the two methodologies used (market and market and risk adjusted),the statistical tests (parametric or non-parametric) or the NAV cut-offs. Firms earnpositive and significant excess returns in the three days around the event [−1, +1].More extreme events (higher NAV) tend to show higher ARs and a higher degree ofanticipation (relative to the event day). The mean of ARs on the event day ranges from1.67% (NAV > 1.64) to 3.65% (NAV > 3.09). Given the impossibility of discriminatingbetween positive and negative underlying information, this result suggests that a suddenchange in volume more often embeds good news.
There are a number of possible reasons which help to explain this phenomenon.Stock exchanges and regulators often impose restrictions on short selling, making itmore difficult to exploit undisclosed negative information. In such an environment,
C© 2010 Blackwell Publishing Ltd.

INFORMATION CONTENT OF ABNORMAL TRADING VOLUME 959
insiders in possession of negative information can only exploit their informationaladvantage if they are already in possession of their firm’s stock. Consistent with thecentral hypothesis presented in this study, if most of the informed trading is driven byinsiders in possession of undisclosed information, it is more likely that they are willingto exploit positive information rather than speculate on negative events affecting theircompany. This is unlikely to be the case if insider interests are not aligned with thoseof shareholders.
Table 3Abnormal Volumes and Excess Returns
NAV > 1.64 (6,429 Observations)
Market Adjusted Market and Risk Adjusted
Day AAR T Test Sign Test AAR T Test Sign Test
−5 −0.05% −(2.24) −(3.31)a 0.01% (0.56) −(1.95)b
−4 −0.11% −(4.56)a −(2.83)a −0.01% −(0.38) −(0.53)−3 −0.08% −(3.56)a −(2.73)a 0.05% (1.90)b (0.04)−2 0.01% (0.61) (0.91) 0.09% (3.62)a (1.29)a
−1 0.38% (15.92)a (9.27)a 0.47% (18.45)a (10.42)a
0 1.67% (69.99)a (29.05)a 1.78% (70.08)a (26.20)a
1 0.78% (32.82)a (16.30)a 0.78% (30.48)a (12.99)a
2 −0.04% −(1.50) −(4.20)a −0.03% −(1.31) −(5.62)a
3 −0.08% −(3.45)a −(3.06)a −0.10% −(4.00)a −(5.22)a
4 −0.01% −(0.47) −(1.38) 0.01% (0.36) −(1.29)5 0.05% (2.16)a −(0.76) 0.11% (4.22)a −(1.40)
Window CAR T Test Sign Test CAR T Test Sign Test[−5,−1] 0.15% (2.76)a −(0.59) 0.61% (11.55)a (7.53)a
[0,5] 2.37% (40.64)a (19.67)a 2.54% (43.58)a (20.24)a
[0,10] 2.37% (30.07)a (16.18)a 3.66% (30.82)a (17.64)a
[0,30] 2.27% (17.16)a (9.57)a 3.82% (19.17)a (12.47)a
NAV > 2.33 (3,353 Observations)
Market Adjusted Market and Risk Adjusted
Day AAR T Test Sign Test AAR T Test Sign Test
−5 0.00% −(0.74) −(0.27) 0.04% (1.25) −(0.21)−4 −0.03% −(1.64) −(0.03) 0.00% −(0.12) −(0.47)−3 −0.02% −(1.00) −(0.20) 0.09% (2.42)a (0.51)−2 0.17% (4.16)a (4.94)a 0.29% (8.22)a (3.74)a
−1 0.88% (22.13)a (15.00)a 1.12% (31.29)a (13.00)a
0 2.48% (66.52)a (27.85)a 2.71% (75.53)a (22.73)a
1 1.02% (28.18)a (14.41)a 1.14% (31.90)a (10.83)a
2 −0.20% −(5.53)a −(4.21)a −0.34% −(9.48)a −(7.86)a
3 −0.11% −(3.29)a −(2.90)a −0.11% −(3.21)a −(4.72)a
4 0.01% −(0.58) (1.07) 0.03% (0.88) −(1.44)5 0.04% (0.98) (0.07) 0.03% (0.74) −(2.17)a
Window CAR T Test Sign Test CAR T Test Sign Test[−5,−1] 1.00% (15.56)a (4.61)a 1.54% (19.26)a (9.79)a
[0,5] 3.23% (42.54)a (19.75)a 3.45% (39.34)a (20.19)a
[0,10] 3.42% (31.00)a (17.35)a 3.66% (30.82)a (17.62)a
[0,30] 3.22% (17.37)a (9.77)a 3.82% (19.17)a (12.32)a
C© 2010 Blackwell Publishing Ltd.

960 BAJO
Table 3 (Continued)
NAV > 3.09 (881 Observations)
Market Adjusted Market and Risk Adjusted
Day AAR T Test Sign Test AAR T Test Sign Test
−5 −0.01% −(0.20) (0.10) −0.01% −(0.12) −(0.90)−4 −0.09% −(1.46) −(1.52) 0.00% −(0.06) −(0.51)−3 0.21% (3.31)a (0.17) 0.29% (4.37)a (2.23)a
−2 0.53% (8.56)a (2.32)a 0.60% (9.16)a (2.62)a
−1 1.74% (27.97)a (9.06)a 1.86% (28.34)a (8.34)a
0 3.65% (58.71)a (14.18)a 3.49% (53.35)a (12.88)a
1 1.08% (17.39)a (5.83)a 1.08% (16.55)a (4.66)a
2 −0.61% −(9.88)a −(5.09)a −0.66% −(10.11)a −(4.66)a
3 −0.35% −(5.68)a −(3.74)a −0.34% −(5.22)a −(4.11)a
4 0.04% (0.67) −(0.57) 0.07% (1.02) −(1.29)5 −0.16% −(2.54)a −(0.77) −0.10% −(1.46) −(1.06)
Window CAR T Test Sign Test CAR T Test Sign Test[−5,−1] 2.37% (15.56)a (6.57)a 2.73% (18.65)a (7.08)a
[0,5] 3.65% (42.54)a (9.20)a 3.54% (22.10)a (9.74)a
[0,10] 3.42% (31.00)a (8.19)a 3.29% (15.14)a (8.41)a
[0,30] 2.09% (17.37)a (1.65)c 2.44% (6.69)a (4.11)a
Notes:The table analyzes the relation between extreme trading activity and excess returns. The abnormal tradingis detected using the normalized abnormal volume index (NAV). In order to assure higher robustness ofresults, different NAV’s cut-offs are considered: 1.64, 2.33, 3.09 corresponding to 5%, 1% and 0.1% of thecumulative probabilities (on the right tail) embedded in a standard normal distribution. Abnormal returnsand cumulative abnormal returns are reported respectively for a [−5,+5] and [−5,30] window period.Excess returns are computed both with a market adjusted and with a market and risk adjusted methodology.The statistical significance is evaluated using parametric (T -test) and non-parametric (Sign test) tests. a, b, cindicate that the coefficients are significantly different from zero at the 1%, 5% and 10% levels respectively.
In Italy, directors and top management are typically appointed by the majorityshareholder and often they are members of the controlling family. In the event ofnegative news, it is likely that insiders would prefer to hide or at least lessen the outcryderiving from it. Trading on private and negative information would increase thepossibility of the market detecting the signal and harm the controlling shareholder’sreputation in the event that these speculative trades become public.
Table 3 also shows how excess returns persist beyond the event day. This finding isconsistent with Pritamani et al. (2001). Analyzing excess returns around large pricechanges, they find returns are significantly persistent on the day after the event andthat there is no price-reversal over the following month. However, in this study, themarket rises by 1.02% the day following large trading activity in contrast to the 0.25%(−0.29%) documented in Pritamani et al. (2001) for a sample of positive (negative)large changes in price. This seems to suggest that abnormal trading volume is a morerelevant signal for detecting forthcoming information than price changes.
The last important insight derives from the analysis of CAR (0, 30). The simplestexplanation for the excess returns found around the event period could be liquidity.If a stock experiences days with abnormal trading activity, its price is likely to divergefrom its current level, moving up or down depending on which side of the marketgenerates the trades. However, the lack of price reversal over the subsequent 30 days
C© 2010 Blackwell Publishing Ltd.

INFORMATION CONTENT OF ABNORMAL TRADING VOLUME 961
excludes the possibility that such returns are due to some kind of price-pressure causedby large trading volume. This is an important confirmation that abnormal tradingvolume contains information not yet reflected in prices. The analysis of the pre-eventperiod does not reveal any particular insight. CAR (−5,−1) is statistically significant,but this result is almost fully driven by the AR (−1).
(ii) The Effect of News Disclosure
Previous analyses investigate the relationship between abnormal trading and excessreturn predictability, but the examination is performed with no regard to the possiblepresence of news disclosure. To reflect the impact of new information, I split thesample according to the presence of contemporaneous news events. The aim istwofold: evaluating the informative role of extreme trading when no contemporaneousannouncements are observed and providing a small contribution to the existing debateon the market reaction to public news. This section analyzes the second aspect,the return-volume relationship when news is contemporaneously disclosed. The nextsection investigates the informative role of apparently unjustified abnormal trading.
In order to check for the possible presence of contemporaneous news, I searched forany firm-specific news item published in Italian newspapers (collected from the Il sole24 ore online database) and examined the abnormal trading volume and price changeswithin a four-day period (−1,+2) around the event. The data collection ultimatelyresulted in 564 abnormal trading volume events.10 Each announcement was examinedand manually classified in terms of the signal conveyed (good, bad or neutral), precisionof the announcement (news or rumour), timing of disclosure (with respect to the eventday) and information content.11
This classification necessarily involves some degree of subjectivity in the attributionof good/bad news and the distinction between news and rumours. The classificationhas been developed using a personal – and not unequivocal – judgement.12 However, inorder to minimize the risk of false attributions, I made an extensive use of the category‘neutral’ whenever the announcement was not detailed, was previously released,involved immaterial monetary values, or when the information set was not sufficient toinfer the expected price impact of the news story.13
The category ‘rumours’ includes any article where the information (often reportedin response to the unusual behaviour of trading volume or returns) was presentedas the author’s supposition or market expectation rather than as an official firmannouncement. Table 4 shows some news distribution statistics. Announcementsembedding positive information (191) are roughly three times as much as the bad news
10 Approximately, 17% of the whole sample.11 Using the same classification proposed by Pritamani and Singal (2001). The seven types of announcementare the following: (1) Actual earnings by management; (2) Forecast of earnings by management; (3) Analystrecommendations by security analysts and information regarding credit ratings by rating agencies; (4) Capitalstructure related information (dividends, stock repurchases, stock/debt issues and preferred stock/debtredemption); (5) Restructuring related information (mergers, acquisitions, asset sales, hiring and firing oftop management); (6) General business related information (sales, product related information, businesscontracts and joint ventures); (7) Miscellaneous information (legal and legislative announcements, labordisputes).12 The Appendix reports a number of examples of news classification in terms of information content (type)and signal conveyed (good/bad/neutral news).13 For instance, the announcement was reporting the earnings but there was no information about whathad been previously declared or what the market expectation was.
C© 2010 Blackwell Publishing Ltd.

962 BAJO
Tab
le4
The
Eff
ecto
fNew
sD
iscl
osur
eSi
gnal
Prec
isio
nT
imin
g
Win
dow
Typ
eA
llG
ood
Bad
Neu
tral
New
sR
umor
Day
0D
ay1
Day
2
Act
ualE
arni
ngs
113
7222
1910
85
5144
18Fo
reca
stof
Ear
ning
s24
184
223
114
44
Ana
lyst
reco
mm
end.
2518
61
196
716
2C
apita
lStr
uctu
re79
254
5073
644
287
Res
truc
turi
ng16
419
514
012
935
7667
19G
ener
alB
usin
ess
107
2710
7097
1042
4122
Mis
cella
neou
s52
1216
2445
718
2311
Tota
l56
419
167
306
494
7025
222
383
All
Goo
dB
adN
eutr
alN
ews
Rum
orD
ay0
Day
1D
ay2
CA
RT
ype
[−5,
−1]
Act
ualE
arni
ngs
0.60
%(1
.23)
0.85
%(1
.26)
0.14
%(0
.15)
0.18
%0.
42%
(0.8
4)4.
38%
0.00
%(0
.00)
0.16
%(0
.25)
2.48
%Fo
reca
stof
Ear
ning
s−2
.05%
−(2.
35)b
−1.1
5%−3
.87%
−6.5
3%−2
.11%
−(2.
35)b
−0.7
2%0.
00%
−0.4
2%−3
.90%
Ana
lyst
reco
mm
end.
−2.1
1%−(
2.89
)a−1
.70%
−3.1
2%−3
.51%
−2.7
3%−0
.14%
−3.0
7%−1
.95%
−0.0
5%C
apita
lStr
uctu
re1.
37%
(2.8
8)a
1.82
%(2
.24)
b−4
.81%
1.64
%(2
.66)
b1.
56%
(3.1
4)a
−0.9
0%1.
63%
(2.5
0)b
0.65
%(0
.81)
2.62
%R
estr
uctu
ring
0.97
%(2
.94)
a1.
27%
−5.3
5%1.
15%
(3.2
4)a
0.30
%(0
.81)
3.43
%(4
.65)
a0.
45%
(0.9
6)1.
50%
(2.7
5)a
1.42
%G
ener
alB
usin
ess
0.74
%(1
.95)
c0.
16%
(0.2
1)0.
58%
0.99
%(2
.10)
b0.
50%
(1.2
6)3.
06%
0.23
%(0
.37)
0.96
%(1
.49)
1.17
%(1
.52)
Mis
cella
neou
s0.
59%
(1.0
0)0.
91%
−0.9
3%1.
44%
(1.8
0)c
0.80
%(1
.30)
−0.7
8%1.
10%
−0.1
6%−(
0.16
)1.
31%
Tota
l0.
61%
(3.3
2)a
0.50
%(1
.46)
−1.2
9%−(
2.53
)b1.
09%
(4.6
1)a
0.37
%(1
.89)
c2.
29%
(4.4
5)a
0.40
%(1
.41)
0.58
%(2
.01)
b1.
38%
(3.2
0)a
All
Goo
dB
adN
eutr
alN
ews
Rum
orD
ay0
Day
1D
ay2
[0]
Typ
eA
ctua
lEar
ning
s1.
60%
(6.5
8)a
3.09
%(9
.17)
a−2
.76%
−(6.
06)a
1.01
%1.
67%
(6.6
8)a
0.06
%1.
93%
(4.4
2)a
1.47
%(4
.59)
a0.
99%
Fore
cast
ofE
arni
ngs
0.72
%(1
.64)
2.53
%−4
.40%
−5.4
0%1.
16%
(2.6
0)b
−9.5
9%1.
64%
0.79
%−2
.64%
Ana
lyst
reco
mm
end.
1.94
%(5
.33)
a2.
73%
−0.3
6%1.
58%
1.04
%4.
81%
3.60
%1.
29%
1.39
%C
apita
lStr
uctu
re2.
81%
(11.
81)a
5.03
%(1
2.37
)a−7
.36%
2.51
%(8
.15)
a3.
19%
(12.
87)a
−1.8
1%2.
74%
(8.4
4)a
2.87
%(7
.10)
a2.
98%
Res
truc
turi
ng3.
43%
(20.
85)a
6.42
%−6
.71%
3.39
%(1
9.09
)a2.
89%
(15.
71)a
5.44
%(1
4.75
)a2.
39%
(10.
35)a
4.56
%(1
6.77
)a3.
57%
Gen
eral
Bus
ines
s2.
81%
(14.
80)a
4.53
%(1
2.30
)a−4
.16%
3.15
%(1
3.33
)a2.
51%
(12.
61)a
5.72
%3.
63%
(11.
99)a
2.37
%(7
.35)
a2.
12%
(5.4
8)a
Mis
cella
neou
s0.
22%
(0.7
5)6.
23%
−7.4
1%2.
30%
(5.7
6)a
−0.4
2%−(
1.35
)4.
32%
−0.2
5%−0
.29%
−(0.
59)
2.05
%To
tal
2.38
%(2
6.10
)a3.
99%
(23.
43)a
−4.5
3%−(
17.7
7)a
2.89
%(2
4.45
)a2.
14%
(21.
91)a
4.09
%(1
5.95
)a2.
37%
(16.
64)a
2.53
%(1
7.64
)a2.
02%
(9.3
8)a
All
Goo
dB
adN
eutr
alN
ews
Rum
orD
ay0
Day
1D
ay2
[−1,
1]T
ype
Act
ualE
arni
ngs
3.24
%(1
3.32
)a5.
98%
(17.
74)a
−4.2
5%−(
9.33
)a1.
56%
3.25
%(1
2.97
)a3.
17%
3.21
%(7
.34)
a3.
62%
(11.
29)a
2.43
%Fo
reca
stof
Ear
ning
s0.
07%
(0.1
7)3.
45%
−8.0
0%−1
4.13
%0.
75%
(1.6
8)−1
5.52
%1.
71%
−0.9
2%−6
.26%
Ana
lyst
reco
mm
end.
3.74
%(1
0.24
)a6.
10%
−3.1
1%2.
36%
2.11
%8.
89%
8.10
%2.
32%
−0.1
7%C
apita
lStr
uctu
re4.
69%
(19.
71)a
6.76
%(1
6.64
)a−8
.49%
4.70
%(1
5.26
)a5.
08%
(20.
53)a
−0.1
6%4.
28%
(13.
15)a
4.64
%(1
1.50
)a7.
43%
Res
truc
turi
ng5.
66%
(34.
39)a
9.96
%−1
3.53
%5.
76%
(32.
47)a
4.32
%(2
3.48
)a10
.61%
(28.
78)a
2.96
%(1
2.78
)a8.
35%
(30.
70)a
7.51
%G
ener
alB
usin
ess
4.77
%(2
5.09
)a6.
16%
(16.
74)a
−4.2
9%5.
52%
(23.
40)a
4.23
%(2
1.23
)a9.
97%
4.86
%(1
6.06
)a4.
74%
(14.
68)a
4.61
%(1
1.93
)a
Mis
cella
neou
s1.
18%
(4.0
0)a
10.0
3%−8
.29%
3.07
%(7
.68)
a0.
49%
(1.5
9)5.
60%
0.34
%1.
08%
(2.1
9)b
2.75
%To
tal
4.13
%(4
5.28
)a6.
53%
(38.
35)a
−6.2
9%−(
24.6
6)a
4.92
%(4
1.57
)a3.
58%
(36.
64)a
8.05
%(3
1.34
)a3.
44%
(24.
16)a
4.94
%(3
4.38
)a4.
15%
(19.
26)a
C© 2010 Blackwell Publishing Ltd.

INFORMATION CONTENT OF ABNORMAL TRADING VOLUME 963
[0,1
0]A
ctua
lEar
ning
s1.
41%
(1.8
3)c
4.29
%(4
.02)
a−8
.41%
−(5.
83)a
1.85
%1.
31%
(1.6
5)3.
57%
2.79
%(2
.02)
b1.
66%
(1.6
3)−3
.11%
Fore
cast
ofE
arni
ngs
−0.5
2%−(
0.38
)2.
03%
−7.1
9%−1
0.07
%0.
09%
(0.0
7)−1
4.60
%−0
.17%
3.21
%−8
.78%
Ana
lyst
reco
mm
end.
6.39
%(5
.53)
a9.
17%
0.23
%−6
.85%
5.56
%8.
99%
10.0
6%5.
72%
−1.1
9%C
apita
lStr
uctu
re2.
76%
(3.6
7)a
3.61
%(2
.81)
a−9
.56%
3.32
%(3
.41)
a3.
06%
(3.9
0)a
−0.8
3%1.
02%
(0.9
9)4.
60%
(3.6
0)a
6.40
%R
estr
uctu
ring
3.87
%(7
.44)
a4.
13%
−13.
38%
4.45
%(7
.93)
a3.
22%
(5.5
4)a
6.27
%(5
.38)
a1.
70%
(2.3
2)b
5.46
%(6
.35)
a8.
43%
Gen
eral
Bus
ines
s4.
20%
(6.9
9)a
2.95
%(2
.53)
b3.
38%
4.80
%(6
.43)
a3.
83%
(6.0
8)a
7.79
%1.
92%
(2.0
1)c
5.45
%(5
.34)
a6.
47%
(5.2
9)a
Mis
cella
neou
s−1
.09%
−(1.
17)
8.40
%−1
1.05
%0.
81%
(0.6
4)−1
.12%
−(1.
15)
−0.8
8%−0
.39%
−3.7
2%−(
2.37
)b3.
26%
Tota
l2.
75%
(9.5
3)a
4.50
%(8
.36)
a−6
.87%
−(8.
52)a
3.77
%(1
0.07
)a2.
45%
(7.9
2)a
4.91
%(6
.04)
a1.
81%
(4.0
3)a
3.63
%(8
.00)
a3.
49%
(5.1
2)a
All
Goo
dB
adN
eutr
alN
ews
Rum
orD
ay0
Day
1D
ay2
CA
RT
ype
[0,3
0]A
ctua
lEar
ning
s1.
07%
(0.8
0)4.
51%
(2.4
4)b
−7.7
8%−(
3.11
)a−1
.72%
1.09
%(0
.79)
0.72
%4.
03%
(1.6
8)c
1.30
%(0
.74)
−7.8
7%Fo
reca
stof
Ear
ning
s−1
.42%
−(0.
59)
1.20
%−9
.35%
−9.0
7%−1
.21%
−(0.
49)
−6.2
5%−3
.46%
7.50
%−6
.93%
Ana
lyst
reco
mm
end.
4.71
%(2
.36)
b7.
42%
−0.7
3%−1
1.43
%4.
13%
6.57
%12
.36%
1.39
%4.
48%
Cap
italS
truc
ture
3.52
%(2
.70)
a5.
07%
(2.2
8)b
5.78
%2.
56%
(1.5
2)3.
31%
(2.4
4)b
5.99
%2.
25%
(1.2
6)4.
89%
(2.2
1)b
5.97
%R
estr
uctu
ring
2.15
%(2
.39)
b4.
21%
−10.
25%
2.32
%(2
.38)
b0.
92%
(0.9
1)6.
69%
(3.3
1)a
−1.9
0%−(
1.50
)5.
72%
(3.8
4)a
7.42
%G
ener
alB
usin
ess
4.92
%(4
.73)
a4.
16%
(2.0
6)b
4.88
%5.
22%
(4.0
4)a
4.12
%(3
.77)
a12
.71%
2.40
%(1
.45)
6.11
%(3
.46)
a8.
47%
(4.0
0)a
Mis
cella
neou
s−5
.32%
−(3.
30)a
6.05
%−2
2.62
%0.
53%
(0.2
4)−1
.27%
−(0.
75)
−31.
37%
−9.6
3%−5
.64%
−(2.
08)b
2.39
%To
tal
1.92
%(3
.85)
a4.
56%
(4.8
9)a
−8.2
7%−(
5.92
)a2.
51%
(3.8
7)a
1.76
%(3
.29)
a3.
06%
(2.1
8)b
0.50
%(0
.64)
3.36
%(4
.28)
a2.
83%
(2.4
0)b
Not
es:
The
tabl
eex
hibi
tsth
ean
alys
isof
CA
Rs
for
the
subs
ampl
ew
ithco
rrel
ated
new
s(5
64ob
serv
atio
ns).
Usi
ngth
esa
me
clas
sific
atio
npr
opos
edby
Prita
man
iand
Sing
al(2
001)
,the
anno
unce
men
tsar
eca
tego
rize
das
follo
ws:
(1)
Act
uale
arni
ngs
bym
anag
emen
t;(2
)Fo
reca
stof
earn
ings
bym
anag
emen
t;(3
)A
naly
stre
com
men
datio
nsby
secu
rity
anal
ysts
and
info
rmat
ion
rega
rdin
gcr
edit
ratin
gsby
ratin
gag
enci
es;(
4)C
apita
lstr
uctu
rere
late
din
form
atio
n;(5
)R
estr
uctu
ring
rela
ted
info
rmat
ion;
(6)
Gen
eral
busi
ness
rela
ted
info
rmat
ion
(sal
es,p
rodu
ctre
late
din
form
atio
n,bu
sine
ssco
ntra
cts
and
join
tven
ture
s);(
7)M
isce
llane
ous
info
rmat
ion
(leg
alan
dle
gisl
ativ
ean
noun
cem
ents
,la
bor
disp
utes
).A
llth
eev
ents
are
grou
ped
acco
rdin
gto
the
follo
win
gcr
iteri
a:th
esi
gnal
invo
lved
(goo
d,ba
dor
neut
ral)
;th
epr
ecis
ion
ofth
ein
form
atio
n(n
ewso
rru
mou
rs)
and
the
timin
gof
the
disc
losu
re(f
rom
day
0to
day
2).T
hein
form
atio
nfo
rda
y-1
isno
trep
orte
dbe
caus
eof
the
low
num
ber
ofev
ents
invo
lved
.New
sis
obta
ined
from
the
mai
nIt
alia
nfin
anci
alne
wsp
aper
(IlS
ole
24O
re).
Inpa
rent
hesi
sth
eT
stat
istic
issh
own
only
for
the
sub-
sam
ples
with
am
inim
umof
20ob
serv
atio
nsto
guar
ante
eth
est
atis
tical
sign
ifica
nce
ofth
ere
sults
.a,b
,cin
dica
teth
atth
eco
effic
ient
sar
esi
gnifi
cant
lydi
ffer
ent
from
zero
atth
e1%
,5%
and
10%
leve
lsre
spec
tivel
y.
C© 2010 Blackwell Publishing Ltd.

964 BAJO
(67), but the larger number of announcement falls into the category of ‘neutral’.14
Most of the articles report clear announcements rather than market rumours andare usually published within two days of the abnormal trading volume event (0,+1).Nevertheless, 83 events are associated with announcements published two days afterthe first detection of abnormal trading, showing that extreme trading activity can infact anticipate information disclosure. With respect to the content of announcements,large volume is more commonly associated with restructuring (164) and generalbusiness (107) announcements, whereas few cases of earnings forecast (24) or analystrecommendations (25) are encountered.
In spite of the relatively small sample, this investigation represents an experimentaltest due to the contemporaneous presence of news disclosure and abnormal tradingvolume. In the literature, analysis of market reaction to public news has already takeninto account the role of trading volume, but attention has focused on the distinctionbetween news with high and low volume.15 I believe such an approach does not fullyaddress the potential informative role of volume, as it distinguishes only between highand low volume stocks. Instead, it is crucial to understand the effect of high tradingvolume relative to standard activity. An examination of market reaction to news ina setting with large trading is particularly valuable as the existence of high volumeenhances the precision of the related signal16 and gives more strength to the empiricalfindings.
Many event studies show an under-reaction to news demonstrated by significantpost-event abnormal returns: Ball and Brown (1968) and Bernard and Thomas (1990)for earning announcements; Ikenberry et al. (1995 and 1996) for, respectively, open-market share repurchases and stock splits; Loughran and Ritter (1995) for SEOs; Cusatiset al. (1993) for divestitures; Michaely et al. (1995) for initiating (omitting) dividends. Acontrary result is found in Barber et al. (1993) who analyze post-event price behaviourafter public disclosure of analysts’ stock recommendations, finding a price reversaleffect within 25 trading days. Pritamani et al. (2001) document price continuation forearnings’ announcements (actual and forecasted) and analyst recommendations, butno evidence of under-reaction to news containing other types of information. Chan(2003) and Hong et al. (2000) prove a stronger under-reaction effect for bad news.
Partitioning the sample according to different types of announcement allow usto understand the nature of any market reaction around the event. All the sub-samples, with the exception of announcements of earnings forecasts, show a statisticallysignificant positive market reaction on the event day and the following day. The mostrelevant price impact is determined by information related to a firm’s restructuring,capital structure and analyst recommendations. This result is consistent with Ryan andTaffler (2004), who show that analysts’ output has the most pervasive effect in drivingfirms’ price changes and trading volume. The disproportion between good and badnews found in the sample helps to explain the signs of excess returns and validatethe initial assumption that large volume contains, on average, positive informationcontent. The analysis of post-event behaviour is likewise informative. Evidence of
14 Evidence of the robustness of classification criteria used.15 An exception is represented by Ryan and Taffler (2004) who take into account abnormal trading volumesand excess returns jointly in order to measure the extent to which they are explained by publicly availableinformation and, by difference, the extent to which they are driven by other factors and noise.16 Several theoretical information-based models (Harris and Raviv, 1993; and Kim and Verrecchia, 1994)show how trading volume can capture the signal accuracy.
C© 2010 Blackwell Publishing Ltd.

INFORMATION CONTENT OF ABNORMAL TRADING VOLUME 965
price continuation (or under-reaction) is found only for analyst recommendations(differently from Barber et al., 1993) and general business related information.17
A possible confirmation of the thesis that ‘bad news travels slowly’ (under-reaction tobad news) arises from the distinction between good and bad information. The sampleof good news earns excess returns mainly on the event day (+3.99%). In fact, theanalysis of 10 and 30 day CARs shows a moderate degree of price continuation (+4.50%and +4.56%). The price behaviour in the sample of bad news is different. In spite ofan important negative market reaction on the event day (−4.53%), Table 4 exhibitsunambiguous evidence of the persistence of excess returns over the following month:CAR (0, 10) and CAR (0, 30) are respectively equal to −6.87% and −8.27%.
Table 4 also shows the different market reaction to news and rumours. Besides theapparent problem of selection bias in the rumours sample, which justifies the higherexcess returns, the most interesting insight is its lower statistical significance. This resultis consistent with the hypothesis that volumes enhance the precision of the informationconveyed. The lower accuracy of rumours leads to a wider variability of returns and alower significance of the t-test.
The last comment relates to the timing of the information release. Consistentwith the information content of volume hypothesis, the market reaction largely occurssimultaneously with large volume (event day), even when the announcements are madepublic one or two days after the large trading initiation.
(iii) Multivariate Analysis
Previous results show the positive relation between abnormal trading volume andexcess returns along with some evidence of price continuation. This effect, althoughlimited to the day after the event, is notably stronger than that documented in previousresearch – a puzzling result since it apparently violates the Efficient Markets Hypothesis(EMH). If new information filters slowly into the market, any uninformed investorcan infer the signal by observing abnormal trading activity and implement profitabletrading strategies. Whether the magnitude of excess returns is tradable will be theobject of investigation in this and the next section, which aims to understand the majordeterminants of the information conveyed by abnormal trading.
Such an investigation would crucially benefit from knowledge of the signaltransmitted by each event. However, exclusive observation of trading volume cannotdistinguish between good and bad underlying private information. To reduce theoffsetting bias produced when positive and negative information is pooled, I use excessreturns on the event day to proxy the signal embedded with high trading volume. Inother words, I assume that positive (negative) excess returns are likely to signal good(bad) undisclosed news. It is possible that excess returns may arise simply as the effectof noise. In order to control for this and make the results more robust, regressionsare repeated for two restricted subsamples filtered by 1% and 3% day zero excessreturns.
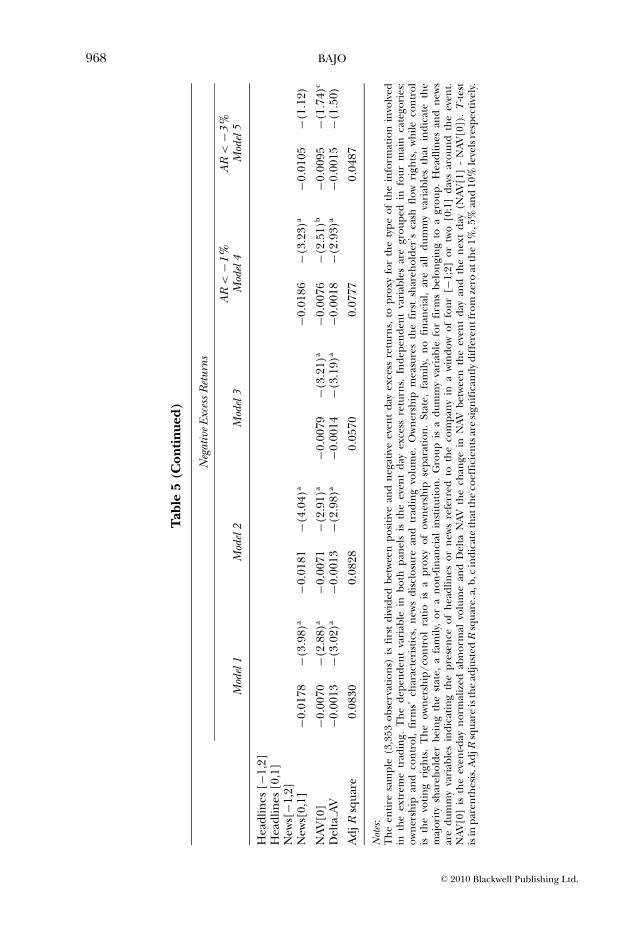
Table 5 shows the effect on the event day excess returns of a number of variablesgrouped by: ownership and control, firm characteristics, trading volume and news
17 Consistent with Pritamani and Singal (2001) and Brookfield and Morris (1992), based respectively onUS and UK data, there is also evidence of market activity for certain news categories in the day precedingthe information disclosure, most likely as an effect of reporting delays or information leakage.
C© 2010 Blackwell Publishing Ltd.

966 BAJO
Tab
le5
Reg
ress
ion
Ana
lysi
s
Posi
tive
Exce
ssR
etur
ns
AR
>1%
AR
>3%
Mod
el1
Mod
el2
Mod
el3
Mod
el4
Mod
el5
Inte
rcep
t0.
0551
(6.1
7)a
0.05
03(6
.16)
a0.
0475
(5.7
7)a
0.05
58(5
.49)
a0.
0753
(5.3
0)a
Ow
ners
hip
(%)
0.00
69(1
.03)
Con
trol
(%)
0.01
28(1
.87)
c0.
0202
(2.1
7)b
Ow
ners
hip/
Con
trol
Rat
io0.
0002
(0.0
3)0.
0044
(1.1
1)−0
.002
9−(
0.60
)−0
.002
5−(
0.36
)St
ate
0.00
53(0
.97)
0.00
18(0
.32)
0.00
32(0
.55)
0.00
57(0
.71)
Fam
ily−0
.001
9−(
0.70
)−0
.001
3−(
0.46
)−0
.001
9−(
0.66
)−0
.001
5−(
0.38
)G
roup
0.00
37(1
.41)
0.00
04(0
.15)
0.00
28(0
.97)
0.00
20(0
.54)
No
Fina
ncia
l−0
.005
6−(
1.59
)−0
.000
9−(
0.27
)−0
.006
6−(
1.60
)−0
.016
5−(
2.91
)a
Mea
nT
radi
ngva
lue
(Ln)
−0.0
040
−(5.
38)a
Mar
ketC
apita
lizat
ion
(Ln)
−0.0
070
−(7.
73)a
−0.0
062
−(9.
19)a
−0.0
074
−(7.
84)a
−0.0
086
−(6.
71)a
Ass
etVa
lue
(Ln)
Roe
(%)
−0.0
002
−(1.
52)
−0.0
005
−(3.
58)a
Roa
(%)
(Ebi
t/A
sset
)−0
.000
3−(
1.26
)−0
.000
1−(
0.18
)D
ivid
end
Yiel
d(%
)−0
.001
9−(
3.05
)a−0
.002
2−(
3.48
)a−0
.001
9−(
3.09
)a−0
.001
9−(
2.96
)a−0
.001
7−(
1.82
)c
Bet
a0.
0021
(1.0
6)0.
0020
(0.8
6)0.
0036
(1.2
2)M
arke
tto
Boo
k0.
0020
(2.4
2)b
0.00
07(0
.82)
0.00
17(1
.79)
c0.
0008
(0.6
5)D
ebt/
Ass
et(%
)(M
arke
t)−0
.011
0−(
2.74
)a−0
.008
8−(
1.94
)c−0
.010
7−(
1.72
)c
Deb
t/E
quity
(Mar
ket)
−0.0
015
−(0.
65)
Hea
dlin
es[−
1,2]
Hea
dlin
es[0
,1]
0.00
72(2
.99)
a
New
s[−1
,2]
New
s[0,
1]0.
0118
(3.7
6)a
0.01
18(3
.81)
a0.
0091
(2.7
6)a
0.01
03(2
.37)
b
NAV
[0]
0.01
06(5
.06)
a0.
0103
(4.9
1)a
0.01
05(5
.06)
a0.
0134
(5.8
0)a
0.01
39(4
.43)
a
Del
taAV
0.00
05(1
.63)
0.00
05(1
.53)
0.00
02(0
.43)
−0.0
007
−(1.
28)
Adj
Rsq
uare
0.07
650.
0594
0.07
440.
0815
0.07
54
C© 2010 Blackwell Publishing Ltd.

INFORMATION CONTENT OF ABNORMAL TRADING VOLUME 967
Neg
ativ
eEx
cess
Ret
urns
AR
<−1
%A
R<
−3%
Mod
el1
Mod
el2
Mod
el3
Mod
el4
Mod
el5
Inte
rcep
t−0
.016
4−(
1.43
)−0
.018
3−(
1.67
)c−0
.012
3−(
1.16
)−0
.039
6−(
2.60
)a−0
.077
8−(
2.69
)a
Ow
ners
hip
(%)
−0.0
047
−(0.
49)
Con
trol
(%)
−0.0
110
−(1.
19)
−0.0
133
−(1.
66)c
−0.0
131
−(1.
10)
−0.0
399
−(1.
70)c
Ow
ners
hip/
Con
trol
Rat
io−0
.000
9−(
0.14
)−0
.001
8−(
0.26
)0.
0020
(0.2
5)0.
0102
(0.6
4)St
ate
−0.0
022
−(0.
31)
−0.0
022
−(0.
31)
−0.0
033
−(0.
47)
−0.0
091
−(0.
93)
−0.0
172
−(0.
95)
Fam
ily−0
.008
1−(
2.05
)b−0
.008
0−(
2.01
)b−0
.009
0−(
2.26
)b−0
.009
0−(
1.77
)c−0
.004
5−(
0.49
)G
roup
0.00
39(1
.12)
0.00
38(1
.09)
0.00
47(1
.36)
0.00
42(0
.91)
0.00
08(0
.09)
No
Fina
ncia
l−0
.002
6−(
0.48
)−0
.004
2−(
0.80
)0.
0022
(0.4
5)0.
0019
(0.2
7)0.
0130
(0.9
7)
Mea
nT
radi
ngva
lue
(Ln)
Mar
ketC
apita
lizat
ion
(Ln)
0.00
16(1
.39)
0.00
15(1
.46)
0.00
09(0
.77)
0.00
32(2
.12)
b0.
0086
(2.9
3)a
Ass
etVa
lue
(Ln)
Roe
(%)
0.00
02(0
.84)
Roa
(%)
(Ebi
t/A
sset
)0.
0012
(2.9
1)a
0.00
13(3
.20)
a0.
0009
(1.7
2)c
0.00
04(0
.40)
Div
iden
dYi
eld
(%)
0.00
27(2
.96)
a0.
0027
(2.9
3)a
0.00
28(3
.00)
a0.
0028
(2.1
1)b
0.00
41(1
.36)
Bet
a−0
.000
6−(
0.19
)−0
.000
3−(
0.08
)−0
.010
2−(
1.29
)M
arke
tto
Boo
k−0
.002
2−(
1.87
)c−0
.002
2−(
1.95
)c−0
.001
7−(
1.48
)−0
.001
8−(
1.14
)−0
.001
2−(
0.44
)D
ebt/
Ass
et(%
)(M
arke
t)−0
.001
0−(
0.16
)0.
0003
(0.0
3)−0
.015
0−(
0.92
)D
ebt/
Equ
ity(M
arke
t)0.
0006
(0.1
8)
C© 2010 Blackwell Publishing Ltd.
968 BAJO
Tab
le5
(Con
tinu
ed)
Neg
ativ
eEx
cess
Ret
urns
AR
<−1
%A
R<
−3%
Mod
el1
Mod
el2
Mod
el3
Mod
el4
Mod
el5
Hea
dlin
es[−
1,2]
Hea
dlin
es[0
,1]
New
s[−1
,2]
New
s[0,
1]−0
.017
8−(
3.98
)a−0
.018
1−(
4.04
)a−0
.018
6−(
3.23
)a−0
.010
5−(
1.12
)
NAV
[0]
−0.0
070
−(2.
88)a
−0.0
071
−(2.
91)a
−0.0
079
−(3.
21)a
−0.0
076
−(2.
51)b
−0.0
095
−(1.
74)c
Del
taAV
−0.0
013
−(3.
02)a
−0.0
013
−(2.
98)a
−0.0
014
−(3.
19)a
−0.0
018
−(2.
93)a
−0.0
015
−(1.
50)
Adj
Rsq
uare
0.08
300.
0828
0.05
700.
0777
0.04
87
Not
es:
The
entir
esa
mpl
e(3
,353
obse
rvat
ions
)is
first
divi
ded
betw
een
posi
tive
and
nega
tive
even
tda
yex
cess
retu
rns,
topr
oxy
for
the
type
ofth
ein
form
atio
nin
volv
edin
the
extr
eme
trad
ing.
The
depe
nden
tva
riab
lein
both
pane
lsis
the
even
tda
yex
cess
retu
rns.
Inde
pend
ent
vari
able
sar
egr
oupe
din
four
mai
nca
tego
ries
:ow
ners
hip
and
cont
rol,
firm
s’ch
arac
teri
stic
s,ne
ws
disc
losu
rean
dtr
adin
gvo
lum
e.O
wne
rshi
pm
easu
res
the
first
shar
ehol
der’
sca
shflo
wri
ghts
,w
hile
cont
rol
isth
evo
ting
righ
ts.
The
owne
rshi
p/co
ntro
lra
tiois
apr
oxy
ofow
ners
hip
sepa
ratio
n.St
ate,
fam
ily,
nofin
anci
al,
are
all
dum
my
vari
able
sth
atin
dica
teth
em
ajor
itysh
areh
olde
rbe
ing
the
stat
e,a
fam
ily,
ora
non-
finan
cial
inst
itutio
n.G
roup
isa
dum
my
vari
able
for
firm
sbe
long
ing
toa
grou
p.H
eadl
ines
and
new
sar
edu
mm
yva
riab
les
indi
catin
gth
epr
esen
ceof
head
lines
orne
ws
refe
rred
toth
eco
mpa
nyin
aw
indo
wof
four
[−1;
2]or
two
[0;1
]da
ysar
ound
the
even
t.N
AV[0
]is
the
even
t-day
norm
aliz
edab
norm
alvo
lum
ean
dD
elta
NAV
the
chan
gein
NAV
betw
een
the
even
tda
yan
dth
ene
xtda
y(N
AV[1
]-
NAV
[0])
.T
-test
isin
pare
nthe
sis.
Adj
Rsq
uare
isth
ead
just
edR
squa
re.a
,b,c
indi
cate
that
the
coef
ficie
ntsa
resi
gnifi
cant
lydi
ffer
entf
rom
zero
atth
e1%
,5%
and
10%
leve
lsre
spec
tivel
y.
C© 2010 Blackwell Publishing Ltd.

INFORMATION CONTENT OF ABNORMAL TRADING VOLUME 969
disclosure. Relative to the first group, the control seems the only variable with anextensive influence, while the family dummy is only statistically significant in thesample of negative information. The former confirms the initial hypothesis of a positiveassociation between control and the information content of excess trading. In fact,Table 5 shows how high levels of control lead to more positive (negative) excess returnsin the sample of positive (negative) information. According to the first hypothesis, firmswith higher levels of control imply lower monitoring by other relevant shareholders,making it easier for the insider to trade when in possession of important undisclosedinformation. A confirmation of the third hypothesis is also found in the sample ofnegative information, as family-controlled firms are associated with a more severenegative price drop. The larger number of insiders (related family members) enhancesthe dissemination of private information and the informative role of trading volume.Quite surprisingly, and in contrast to the second hypothesis, the ownership-controlseparation variable has no effect on the magnitude of event day excess returns. Theseparation between voting and cash-flow rights causes expropriation and tunnellingof resources. In this study, I also argue that it may lead to the exploitation of privateinformation. However, some valid arguments can either support a positive or a negativerelation as a higher separation incentivises not only information exploitation butalso the use of alternative and more effective expropriation techniques. Probablydue to the mixing effect, the results do not corroborate any of the two conflictinghypotheses.
In terms of firm characteristics, higher event day excess returns are positivelyassociated with market-to-book and have a negative relationship with size, liquidityand dividends. The market-to-book ratio is generally identified as a proxy for firms’growth opportunities. Hence, the positive regression coefficient signals that strongerexpected growth leads to larger excess returns. This result is perfectly explainableif we interpret the phenomenon in terms of the potential relevance of undisclosedinformation. Firms with higher growth opportunities normally show a stronger marketreaction to news announcements, as the potential for value creation is greater. If theinformation content of trading volume is determined by informed trades, the largerexcess returns are necessarily associated with younger and growing firms. Besides, astrading in anticipation to public news will more likely take place when the expectedprofit is larger, high market-to-book firms will exhibit more informative trading volume.The relation to firm size is consistent with the main hypothesis of this study, assmaller firms are more seriously affected by information asymmetry problems. Forthose firms, the proportion of trades initiated by informed traders is larger and theinformation content of abnormal trading volume is presumably higher. Liquidity isanother important feature, as the transactions initiated by informed investors are likelyto produce a stronger price-impact for less traded stocks. Lastly, the negative relationto dividend yield is mainly due to an industry-effect. In fact, higher dividend yields areusually associated with regulated industries (such as utilities), for which the degree ofinformation asymmetry is generally lower.
Trading volume is obviously a critical variable in explaining the magnitude of excessreturns. According to the main hypothesis of this study, extreme levels of tradingactivity convey information, producing significant price changes. The positive relationbetween abnormal trading volume and excess returns is the resulting outcome ofthis phenomenon, probably corroborated by a liquidity effect. Above and beyondthis relation, I also take into account the role of volume-persistency. This effect is
C© 2010 Blackwell Publishing Ltd.

970 BAJO
captured by the change in abnormal trading volume in the window (0,1). If privateinformation slowly filters across insiders, positive serial correlation is expected (priceand volume continuation), either for abnormal volumes and/or excess returns. Inother words, in the event of volume persistence (corroborated by price continuation),a higher change in abnormal trading volume should be associated with lower excessreturns on the event day (as prices do not fully reflect the fundamental value),which means a negative (positive) coefficient for the positive-information (negative-information) sample. The statistical significance is limited to the negative-informationsample, whose negative coefficient contradicts the hypothesis of the informative role ofvolume-continuation.
To conclude, the regression models are controlled for information disclosure aroundthe event. Given the hypothesis of this investigation, this aspect becomes critical.Two dummies are considered as a proxy for information disclosure: headlines andnews. The former detects the existence of any article published in the main Italianfinancial newspaper (Il Sole 24 Ore) in a narrow window around the event18 citingthe company’s name either in the headline or inside the text. The latter refersonly to those articles which contain relevant and previously undisclosed information.Although the observations accompanied by information disclosure exhibit a strongermarket reaction, large excess returns still persist when no public information iscontemporaneously released.
(iv) A Possible Portfolio Strategy
To some extent, assessing the profitability of volume-based portfolios is a test of a semi-strong form of market efficiency. If abnormal trading volume is a reliable signal forinformed trades, prices should adjust in an efficient market to their full informativevalue at the time the anomaly becomes apparent, thus avoiding tradable and profitableopportunities for mimickers. Previous findings show that abnormal trading volumegenerally anticipates future excess returns, although this pattern is mainly bounded onthe first day after the high trading activity. Nevertheless, a portfolio strategy based onan observation of extreme trading can still be profitable in apparent violation of theEMH.
An uninformed investor willing to undertake a volume-based portfolio strategy canobserve a stock experiencing abnormal volume,19 but he will be able to detect thevolume anomaly only at the market closing. Hence, I assume that he initiates the trade(at opening price) only at the beginning of the following day. However, observing onlyabnormal trading volume cannot help the uninformed investor to discover whetherabnormal trading activity is driven by positive or negative undisclosed information,but the same investor can infer that by looking at price changes. Following theseconsiderations, a portfolio strategy can be based on the observation of abnormal tradingvolume in order to detect the opportune timing of the trades and excess returns tochoose the trade direction (buy or sell).
18 Two window periods: (−1,+2) and (0,+1).19 This strategy is based on the assumption that volume data is continuously known by the market. The ItalianStock Exchange releases directly, and indirectly through a number of financial information providers, realtime data on trading volume for each listed company for an inexpensive subscription. 20 minutes tradingvolume data is offered with no charge in the Italian Stock Exchange and many other financial web sites.
C© 2010 Blackwell Publishing Ltd.
INFORMATION CONTENT OF ABNORMAL TRADING VOLUME 971
Given that, on average, excess returns tend to persist for one day after the event, Iassume that the uninformed investor prefers closing his position within the same day,that is, selling (buying) at the last ask (bid) price. Taking into consideration the bid-askspread involved in a round-trip transaction allows us to assess the real profitability ofsuch a volume-based strategy. Nevertheless, for the sake of comparability, I also estimatethe theoretical profit earned by the same uninformed investor who initiates the trade atthe end of the event date, buying and selling at closing prices. Such a strategy does notreflect the loss coming from the bid-ask spread embedded in the round-trip trade andrequires the investor to trade at the end of the event date, when the abnormal volume isnot necessarily known.20 The resulting profit represents the theoretical gain obtainablein the absence of market frictions. In terms of market efficiency expectations, thistheoretical profit should disappear after transaction costs.
The different portfolio strategies are analyzed throughout the whole sample period(1997–2003) and for all observations. In order to ensure the reliability of the findings,some standard filters are used to check for the correctness of the bid-ask spread data.Specifically, in order to be included in the sample, the following conditions needto be met (in parentheses the number of excluded observations): bid-ask price dataavailability (168), ask price higher than bid price (149), ask price not larger than 1.9times the bid price (2). After the exclusion of these observations, the final sampleconsists of 3,040 events (6,080 transactions).
In terms of composition rules, I consider equally-weighted portfolios. Hence,whenever a stock is added, the entire portfolio is rebalanced among the securities.If no stock experiences abnormal trading volume, the portfolio is eventually emptied.The portfolio return is compared to a market index replicating portfolio (buy andhold strategy). Table 6 shows the results obtained by the several strategies adopted,reporting both implementable and theoretical returns. The former (indicated as a‘feasible strategy’) accounts for round-trip transaction costs (bid-ask) and initiates thetrade the day next to the event; the latter (labelled as a ‘theoretical strategy’) – reportedas a theoretical benchmark and not implementable – assumes that trading begins atthe end of the event days and it does not reflect any transaction costs.
The first portfolio is based, regardless of the information deriving from theobservation of price changes, on a pure long strategy with a one day holding period.This strategy leads to more than six thousand transactions over the seven year period.The daily return is negative (−0.24%) and statistically significant at the 5% level.Table 6 also shows that comparing theoretical portfolio returns earns a stronglysignificant positive return (0.96% market adjusted), meaning that the different tradingtiming and, more importantly, the transaction costs can make the gains vanish. Thechoice of a one day holding period is consistent with prior findings, as the persistenceof excess returns is essentially concentrated on the day after abnormal trading. However,the restriction of a long portfolio is necessarily inefficient since the information of theprice change on the event day is not used. The uninformed investor can in fact exploitthe sign of excess returns to discriminate between positive or negative underlyinginformation and the magnitude to infer any relevant information. According to
20 The uninformed investor can observe trading volume and estimate abnormal volumes in real time.However, before the last trade, he is only able to detect abnormal trading if the NAV is already above thethreshold. In other words, the investor can pursue this strategy only if the last trade’s volume is not neededto pass the abnormal volume cut-off.
C© 2010 Blackwell Publishing Ltd.

972 BAJO
Tab
le6
Port
folio
Stra
tegi
es
Feas
ible
Stra
tegy
Ret
urns
The
oret
ical
Stra
tegy
Ret
urns
Hol
ding
Peri
odA
R0’
sN
umbe
rof
Num
ber
ofSe
curi
ties
Port
folio
(Day
s)C
utof
fT
rans
actio
ns(A
vera
ge)
Row
Mkt
Adj
Row
Mkt
Adj
Port
folio
1W
hole
Port
folio
1–
6,08
01.
46−0
.242
b−0
.252
b0.
97a
0.96
a
Port
folio
2L
ong
Port
folio
11%
3,92
90.
94−0
.002
−0.0
521.
39a
1.34
a
Shor
tPor
tfol
io1
−1%
1,15
50.
28−1
.073
a−1
.123
a0.
130.
08W
hole
Port
folio
5,08
41.
22−0
.499
a−0
.549
a0.
85a
0.80
a
Port
folio
3L
ong
Port
folio
13%
2,67
60.
640.
378b
0.31
8b1.
64a
1.58
a
Shor
tPor
tfol
io1
−3%
569
0.14
−0.7
93b
−0.8
83b
0.65
c0.
56W
hole
Port
folio
3,24
60.
78−0
.036
−0.1
061.
25a
1.18
a
Port
folio
4L
ong
Port
folio
15%
1,52
90.
370.
481b
0.39
1c2.
07a
1.98
a
Shor
tPor
tfol
io1
−5%
305
0.07
−2.3
84a
−2.3
14a
1.04
b1.
11b
Who
lePo
rtfo
lio1,
833
0.44
−0.0
14−0
.074
1.69
a1.
63a
Port
folio
5L
ong
Port
folio
13%
2,67
60.
640.
378b
0.31
8b1.
64a
1.58
a
Shor
tPor
tfol
io5
−3%
569
0.68
−1.2
03−1
.213
0.24
0.23
Who
lePo
rtfo
lio3,
246
1.32
−0.6
06c
−0.6
36c
0.68
b0.
65b
Port
folio
6L
ong
Port
folio
11%
3,92
90.
94−0
.002
−0.0
521.
391.
34Sh
ortP
ortf
olio
5−3
%56
90.
68−1
.203
−1.2
130.
240.
23W
hole
Port
folio
4,49
91.
63−0
.646
−0.6
760.
640.
61
Not
es:
The
tabl
ere
port
sth
epr
ofits
earn
edby
som
evo
lum
e-ba
sed
port
folio
s.T
heco
lum
n‘F
easi
ble
stra
tegy
’sh
ows
the
outc
omes
ofth
eim
plem
enta
ble
stra
tegy
cons
istin
gin
buyi
ng(l
ong
port
folio
s)or
selli
ng(s
hort
port
folio
s)at
the
open
ing
pric
eof
the
day
afte
rth
eev
enta
ndcl
osin
gth
epo
sitio
nat
the
last
ask
(bid
)pr
ice
asin
dica
ted
inth
eho
ldin
gpe
riod
colu
mn.
The
colu
mn
‘The
oret
ical
port
folio
’re
port
sth
epr
ofita
bilit
yof
the
sam
est
rate
gyas
sum
ing
tobe
gin
trad
ing
atth
een
dof
the
even
tda
tean
dw
ithou
tinc
urri
ngin
the
bid-
ask
spre
adco
stem
bedd
edin
the
roun
d-tr
iptr
ade.
Des
pite
the
impo
ssib
ility
toun
dert
ake
such
ast
rate
gy,t
heth
eore
tical
prof
itsea
rned
are
repo
rted
for
the
sake
ofco
mpa
rabi
lity.
Topo
tent
ially
dist
ingu
ish
betw
een
posi
tive
and
nega
tive
info
rmat
ion,
the
sign
ofab
norm
alre
turn
onth
eev
ent
day
isus
ed,a
ssum
ing
that
posi
tive
(neg
ativ
e)ex
cess
retu
rns
are
the
likel
yef
fect
ofgo
od(b
ad)
undi
sclo
sed
info
rmat
ion.
Eac
hpo
rtfo
liogo
esfr
omth
ebe
ginn
ing
of19
97to
the
end
of20
03.T
hepo
rtfo
liois
cont
inuo
usly
reba
lanc
edan
deq
ually
-wei
ghte
dam
ong
the
secu
ritie
s.a,
ban
dc
indi
cate
that
the
coef
ficie
nts
are
sign
ifica
ntly
diff
eren
tfro
mze
roat
the
1%,5
%an
d10
%le
vels
resp
ectiv
ely.
C© 2010 Blackwell Publishing Ltd.

INFORMATION CONTENT OF ABNORMAL TRADING VOLUME 973
this intuition, the next three portfolios (2 to 4) use the information embedded inthe event date’s price changes, setting long (short) portfolios for observations withpositive (negative) excess returns. The three portfolios use different excess returnthresholds (1%, 3% and 5%) in order to evaluate the magnitude effect. In terms ofexpected portfolio profitability, two counter-arguments could be discussed. A strongermarket movement is generally a consequence of more important information reflectedin prices, suggesting the prospect of earning higher trading profits. However, astronger price change on the event date makes it more likely that information isfully incorporated into prices, leaving negligible trading profits on the following day.Table 6 shows that the first hypothesis seems to be verified. Trading initiated at the endof the event date leads to positive and strongly significant returns (gross of transactioncosts) for long strategies and the profit magnitude increases as the event date pricechange is more pronounced. Short strategies appear profitable only for high excessreturn thresholds, confirming the importance of the price change in predicting thenext day return. In terms of real profitability, transaction costs can make most of thetheoretical gains disappear. Short strategies lead to significant losses, but long strategiesare still profitable mainly when the information coming from the price change is used.The portfolio market adjusted daily return is 0.32% and 0.39% for the 3% and 5%thresholds respectively, both are statistically significant.
The last set of portfolios (5 and 6) is based on a different holding period for theshort strategy. In fact, previous analyses reveal a longer price persistency for the samplewith negative excess returns. This is consistent with the literature, according to whichbad news tends to travel slowly. Following this idea, setting a longer holding periodmight lead to higher portfolio profitability. Results contradict this supposition, as sucha strategy leads to weaker portfolio returns, which become strongly negative whentransaction costs are taken into consideration.
5. CONCLUSION
This paper examines the informative role of abnormal trading volume on the Italianstock market. If information is not perfectly inculcated into the market but held by moreinformed traders, the observation of trading volume may enhance the information set.The hypothesis is that large changes in trading volume (not accompanied by newsdisclosure) incorporate non-public information and signal future excess returns. Thisphenomenon could be much more important in a country with low investor protectionand poor law enforcement, as insiders can expropriate minority shareholders usingtheir information advantage.
The hypothesis is consistent with most of the findings. In a three-day window aroundabnormal trading I find excess returns that are not driven by price-pressure, as they donot revert over the following days. In contrast, there is evidence of price-persistenceafter large trading activity, which may suggest a slow filtering of information into pricesand the possibility of a profitable portfolio strategy.
Interestingly, excess returns are influenced by news disclosure, but the marketreaction for the uninformative sample (observations with no contemporaneous news)is almost as high as the opposite sample. As hypothesized, the information content isalso related to some ownership characteristics: higher control shares (lower monitoringover the majority shareholders) and family-firm status (larger number of insiders andhigher probability of private information-based trades) contribute positively to the
C© 2010 Blackwell Publishing Ltd.

974 BAJO
magnitude of excess returns. More information content is found for smaller companieswhere agency problems are greater between majority and minority shareholders(stock market), and for firms with higher market-to-book ratios, where undisclosedinformation is likely to be more price-sensitive.
Finally, some portfolios based on volume signal are analyzed. In order to exploitthe persistence of excess returns after large trading, tested portfolios include anystock experiencing extreme trading volume. As the trading signal is known only atthe end of the day, the uninformed trader is assumed to trade the day after theevent, selling (buying) at the open price and buying (selling) at the last ask (bid)price. For the sake of comparability, portfolio returns are evaluated relative to thetheoretical profit earned by the same uninformed investor who initiates trading at theend of the event date and does not incur any transaction cost from the round-triptrade. Different tested portfolios indicate that the theoretical volume-based profits areimportant and statistically significant, particularly for long strategies. However, aftertaking into consideration transaction costs and the different trade timing, profits tendto vanish with the exception of long portfolios that include only stocks experiencingstrong price changes on the event date.
APPENDIX
Examples of News Classification
The attribution of news among different types of information categories necessarilyinvolves some degree of judgment subjectivity. This Appendix is meant to clarify,through some examples, the criteria used for classifying the announcements interms of information content and the signal conveyed. In order to show the fullspectrum of possible cases, I randomly selected a single article for each of theseven types of announcements under two constraints: first, the article had to bepublished in English and, second, no more than three articles had to fall into eachof the good/bad/neutral group. The first imposed constraint means the news can bereported as it appeared in the mind of the author, so avoiding biased translation fromItalian to English. The second constraint simply assures that the announcements areequally distributed among the three classes of signal conveyed. The news selectionhas produced two lots of ‘good’, three lots of ‘neutral’ and two lots of ‘bad’news.
The analysis of news disclosure (paragraph 4.2) is based on 564 announcementsselected from the online database of Il sole 24 ore (main Italian financial newspaper).The database reports the entire number of articles published (in Italian) in printedcopy. A subset of these announcements is also published in English and it is availablethrough the online database Lexis-Nexis. In order to satisfy the first constraint, I havechecked in Lexis-Nexis whether the randomly selected article was also reported inEnglish. If so, the article has been reported in the list below; if not, another randomselection occurred until the condition (presence in Lexis-Nexis) was met. The potentialselection bias – news which is more likely to be relevant and important is also reportedin English – does not affect the aim of this Appendix which is to simply show theclassification process.
C© 2010 Blackwell Publishing Ltd.

INFORMATION CONTENT OF ABNORMAL TRADING VOLUME 975
Type 1. Actual earnings by management
November 14, 2003
ENEL ANNOUNCES BETTER-THAN-EXPECTED RESULTSENEL’s managing director Paolo Scaroni has every reason to celebrate as his group’s results forthe first nine months this year suggest that it is on the right track towards registering its highestever figures at the end of the year. At the end of September the electricity group registered a 5.3 percent gain in net revenue and a 33.8 per cent rise in EBITDA. ENEL’s net profit total for the firstnine months leapt 28.6 per cent to Euro 1.593 billion. Mr. Scaroni confirmed, ‘all our targetshave been exceeded’, and the former electricity monopoly will now proceed ‘with determination tofocus on energy and the development of our business plan’.
Classified: ‘Good’The article states in the headline that the reported results are above expectations.Without this specification the information on quarterly results would be classified asneutral due to the impossibility of verifying whether the magnitude of the increase wasin line with the budget target.
Type 2. Forecast of earnings by management
December 18, 1998
MONRIF REDUCES ITS DEBT BY 60%Monrif, the Italian holding company of the publishing group Poligrafici Editoriale, has announcedpredicted 1998 full-year profits in excess of L4 billion and consequently the prospects of a dividendfor its shareholders. Notably, these results, which follow last year’s losses of L10 billion, will enablethe company to reduce its debts from the circa L100 billion of 1997 to L40 billion. The group’spublishing activities under Poligrafici Editoriale Spa are expected to make profits in 1998 of L23billion on a revenue of L310 billion. The group’s overall performance has been boosted notably byits activities in the hotels sector.
Classified: ‘Good’Given the magnitude of predicted results and the significant break relative to pastperformance, this announcement contains a potential positive price impact on thecompany’s stock.
Type 3. Analyst recommendations by analysts and information regarding credit ratingsby rating agencies
March 15, 2003
MERRILL LYNCH ISSUES BUY RATING FOR DE LONGHIIn its first report on the group, Merrill Lynch has issued a buy rating for De Longhi and a targetprice of Euro 4.3. The analysts believe the group is currently undervalued by 30 per cent. Theshare is currently being traded on the stock market at Euro 2.9.
Classified: ‘Neutral’In spite of the apparent good news, the article is conservatively considered neutral. Infact, it is well known that analysts can often be generous when granting a ‘buy’ rating sothat this announcement can hardly be interpreted as ‘good news’. That is potentiallyeven more the case given the possible conflict of interest of Merrill Lynch (not reportedin the article nor in the report), which acted as global coordinator of the company’sIPO in 2001.
C© 2010 Blackwell Publishing Ltd.

976 BAJO
Type 4. Capital structure related information (dividends, buy-back, stock/debt issuesand redemption)
March 28, 2003
NO DIVIDEND AS FIAT STAYS IN THE RED2002 was a bad year for Fiat. The Italian group’s board of directors approved the final figuresfor the year, which included a consolidated losses total of Euro 4.2 billion and Euro 2 billion forFiat SpA alone. This means that there will be no dividend for investors this year. The group’smanagement is currently working hard to find a way out of the crisis. It has recently closed the dealon the sale of its financial arm Fidis and has agreed to sell insurance group Toro to De Agostinifor Euro 2.4 billion. Fiat is also negotiating the sale of aerospace group Fiat Avio.
Classified: ‘Bad’This news contains some information regarding the bad economic performance bothat group and company level. However, the negative trend is likely to be known bythe market from previously disclosed quarterly results. In this sense, this is neutralnews. The information on dividends is more relevant. Even if an uninformed investormight suspect the possibility of a dividend cut, the company is now announcingthat shareholders will not receive any dividend payment for 2002 (unlike 2001). Thesuspension of dividend and its negative implications are unlikely fully discounted intoprices.
Type 5. Restructuring related information (M&A, asset sales, hiring and firing of topmanagement)
May 1, 2003
LUXOTTICA LAUNCHES TAKEOVER BID IN SYDNEYLuxottica Group has launched a friendly takeover bid on retail group OPSM, listed on the Sydneystock exchange. The two companies announced the move yesterday, explaining that the offer wouldbe made at AUSD 3.9 per share, which sets the total value of OPSM at AUSD 550 million. Throughthe deal, Luxottica will gain control of the biggest retail chain in Australia, which boasts 481stores and three brands.
Classified: ‘Neutral’The friendly acquisition is likely to produce some value creation due to the synergiesbetween the two companies. Through OPSM Luxottica opens to the Australian marketwith expected higher future revenues. However, the information contained in thearticle is insufficient to unreservedly classify the news under the ‘Good’ category.Specifically, it is not clear to what extent the price paid for acquiring the retail groupis fair, nor does the article report precise indications relative to the impact of thisacquisition to the Luxottica’s books.
Type 6. General business related information (sales, products, business contracts andjoint ventures)
October 16, 1997
PAGNOSSIN FORMS A JOINT VENTURE WITH GANPagnossin the steel manufacturing group has signed a joint venture with Grupo Acerero del Norte(Gan), its Mexican competitor, for the construction of a steel mill in the northern part of Mexico.The two companies will invest $ 10m in the operation; the plant is expected to start production inOctober 1998.
C© 2010 Blackwell Publishing Ltd.

INFORMATION CONTENT OF ABNORMAL TRADING VOLUME 977
Classified: ‘Neutral’The information is not sufficiently precise to infer the potential price impact onPagnossin’s stocks. The size of the investment does not seem capable to significantlyaffect the value of the company.
Type 7. Miscellaneous information (legal and legislative announcements, labordisputes)
December 7, 2003
LIQUIDITY MOVES BETWEEN MALTA AND THE CARIBBEANThe complex financial web of the Italian food group Parmalat is growing, as it has now beendiscovered that some of the group’s liquidity is kept in tax havens, across the globe, from theMediterranean to the Caribbean. It has also been revealed that one of Parmalat’s Italian registeredfinancial holding groups Geslat has also signed an agreement with Buconero, a Switzerlandregistered Citigroup subsidiary. A closer examination of Geslat’s accounts could provide someanswers to some queries surrounding the group’s debt.
Classified: ‘Bad’Even under an ex-ante perspective – that is, one which is not influenced by knowledgeof the massive bankruptcy that befell Parmalat not long after – Parmalat’s intention tomove liquidly away from the country appears clearly in this article. Given the seriousconcerns regarding Parmalat’s financial condition and the reliability of its financialstatement, this information would seem to confirm the suspicion that the company isillegally hiding its assets from its creditors.
REFERENCES
Ball, R. and P. Brown (1968), ‘An Empirical Evaluation of Accounting Income Numbers’, Journalof Accounting Research, Vol. 6, pp. 159–78.
Barber, B.M. and D. Loeffler (1993), ‘The Dartboard Column, Second-hand Information andPrice Pressure’, The Journal of Financial and Quantitative Analysis, Vol. 28, pp. 273–84.
Bernard, V. and J. Thomas (1990), ‘Evidence that Stock Prices do not Fully Reflect theImplications of Current Earnings for Future Earnings’, Journal of Accounting and Economics,Vol. 13, p. 305.
Bigelli, M., V. Mehrotra and R. Rau (2007), ‘Expropriation, Unification and CorporateGovernance in Italy’, ECGI - Finance Working Paper No. 180/2007.
Brookfield, D. and R. Morris (1992), ‘The Market Impact of UK Company News Announcements’,Journal of Business Finance & Accounting , Vol. 19, pp. 585–602.
Brown, S.J. and J.B. Warner (1985), ‘Using Daily Stock Returns, the Case of Event Studies’, Journalof Financial Economics, Vol. 14, pp. 3–31.
Chan, W.S. (2003), ‘Stock Price Reaction to News and No-news, Drift and Reversal afterHeadlines’, Journal of Financial Economics, Vol. 70, pp. 223–60.
Comiskey, E., R. Walkling and M. Weeks (1984), ‘Dispersion of Expectations and TradingVolume’, Journal of Business Finance & Accounting , Vol. 14, pp. 229–39.
Cusatis, P., J. Miles and J. Woolridge (1993), ‘Restructuring through Spinoffs’, Journal of FinancialEconomics, Vol. 33, pp. 293–311.
Dyck, A. and L. Zingales (2004), ‘Private Benefits of Control, an International Comparison’,Journal of Finance, Vol. 59, pp. 537–600.
Easley, D. and M. O’Hara (1987), ‘Price, Trade Size, and Information in Securities Markets’,Journal of Financial Economics, Vol. 19, pp. 69–90.
——— ——— (1992), ‘Adverse Selection and Large Trade Volume, the Implications for MarketEfficiency’, Journal of Financial and Quantitative Analysis, Vol. 27, pp. 185–206.
——— ——— and P.S. Srinivas (1998), ‘Option Volume and Stock Prices, Evidence on whereInformed Traders Trade’, Journal of Finance, Vol. 53, pp. 431–65.
C© 2010 Blackwell Publishing Ltd.
978 BAJO
Epps, T. (1975), ‘Security Price Changes and Transaction Volumes, Theory and Evidence’,American Economic Review, Vol. 65, pp. 586–97.
Fama, E. (1970), ‘Efficient Capital Markets, a Review of Theory and Empirical Work’, Journal ofFinance, Vol. 25, pp. 383–417.
Gervais, S., R. Kaniel and D.H. Mingelgrin (2001), ‘The High-volume Return Premium’, Journalof Finance, Vol. 56, pp. 877–919.
Glosten, L.R. and P.R. Milgrom (1985), ‘Bid, Ask and Transaction Prices in a Specialist Marketwith Heterogeneously Informed Traders’, Journal of Financial Economics, Vol. 14, pp. 71–100.
Harris, M. and A. Raviv (1993), ‘Differences of Opinion Make a Horse Race’, Review of FinancialStudies, Vol. 6, pp. 473–506.
Hirshleifer, D. and S.H Teoh (2003), ‘Herd Behaviour and Cascading in Capital Markets, aReview and Synthesis’, European Financial Management, Vol. 9, pp. 25–66.
Ikenberry, D., J. Lakonishok and T. Vermaelen (1995), ‘Market Undereaction to Open MarketShare Repurchases’, Journal of Financial Economics, Vol. 39, pp. 181–208.
———, G. Rankine and E. Stice (1996), ‘What do Stock Splits Really Signal?’, Journal of Financialand Quantitative Analysis, Vol. 31, pp. 357–77.
Jarrel, G. and A.B. Poulsen (1989), ‘Stock Trading before the Announcement of Tender Offers,Insider Trading or Market Anticipation?’, Journal of Law and Organization, Vol. 5, pp. 225–48.
Johnson, S., R. La Porta, F. Lopez-de-Silanes and A. Shleifer (2000), ‘Tunnelling’, The AmericanReview, Vol. 90, pp. 22–27.
Karpoff, J.M. (1985), ‘A Theory of Trading Volume’, Journal of Finance, Vol. 41, pp. 1069–87.——— (1987), ‘The Relation between Price Changes and Trading Volume, a Survey’, Journal of
Financial and Quantitative Analysis, Vol. 22, pp. 109–26.Kim, O. and R.E. Verrecchia (1994), ‘Market Liquidity and Volume around Earnings Announce-
ments’, Journal of Accounting and Economics, Vol. 17, pp. 41–67.Kyle, A.S. (1985), ‘Continuous Auctions and Insider Trading’, Econometrica, Vol. 53, pp. 1315–35.Loughran, T. and J.R. Ritter (1995), ‘The New Issues Puzzle’, Journal of Finance, Vol. 50, pp. 23–51.Meulbroek, L. (1992), ‘An Empirical Analysis of Illegal Insider Trading’, Journal of Finance,
Vol. 47, pp. 1661–700.Michaely, R., R. Thaler and K. Womack (1995), ‘Price Reactions to Dividend Initiations and
Omissions, Overreaction or Drift?’, Journal of Finance, Vol. 50, pp. 573–608.Nenova, T. (2003), ‘The Value of Corporate Votes and Control Benefits, a Cross-Country Analysis’,
Journal of Financial Economics, Vol. 68, pp. 325–51.Pan, J. and A.M. Poteshman (2006), ‘The Information in Option Volume for Future Stock Prices’,
Review of Financial Studies, Vol. 19, pp. 871–908.Pritamani, M. and V. Singal (2001), ‘Return Predictability Following Large Price Changes and
Information Releases’, Journal of Banking and Finance, Vol. 25, pp. 631–56.Ryan, P. and R.J. Taffler (2004), ‘Are Economically Significant Stock Returns and Trading
Volumes Driven by Firm-specific News Releases?’, Journal of Business Finance & Accounting ,Vol. 31, pp. 49–82.
Zingales, L. (1994), ‘The Determinants of the Voting Premium in Italy, a Study of the Milan StockExchange’, Review of Financial Studies, Vol. 7, pp. 125–48.
C© 2010 Blackwell Publishing Ltd.