
Design, dimensioning and construction of the suspension of ...
Upload
khangminh22Category
view
0download
0
Barros, Júlio; Cortez, Paulo; Carvalho, Maria S.
Article
A systematic literature review about dimensioningsafety stock under uncertainties and risks in theprocurement process
Operations Research Perspectives
Provided in Cooperation with:Elsevier
Suggested Citation: Barros, Júlio; Cortez, Paulo; Carvalho, Maria S. (2021) : A systematicliterature review about dimensioning safety stock under uncertainties and risks in theprocurement process, Operations Research Perspectives, ISSN 2214-7160, Elsevier,Amsterdam, Vol. 8, pp. 1-25,https://doi.org/10.1016/j.orp.2021.100192
This Version is available at:http://hdl.handle.net/10419/246453
Standard-Nutzungsbedingungen:
Die Dokumente auf EconStor dürfen zu eigenen wissenschaftlichenZwecken und zum Privatgebrauch gespeichert und kopiert werden.
Sie dürfen die Dokumente nicht für öffentliche oder kommerzielleZwecke vervielfältigen, öffentlich ausstellen, öffentlich zugänglichmachen, vertreiben oder anderweitig nutzen.
Sofern die Verfasser die Dokumente unter Open-Content-Lizenzen(insbesondere CC-Lizenzen) zur Verfügung gestellt haben sollten,gelten abweichend von diesen Nutzungsbedingungen die in der dortgenannten Lizenz gewährten Nutzungsrechte.
Terms of use:
Documents in EconStor may be saved and copied for yourpersonal and scholarly purposes.
You are not to copy documents for public or commercialpurposes, to exhibit the documents publicly, to make thempublicly available on the internet, or to distribute or otherwiseuse the documents in public.
If the documents have been made available under an OpenContent Licence (especially Creative Commons Licences), youmay exercise further usage rights as specified in the indicatedlicence.
https://creativecommons.org/licenses/by-nc-nd/4.0/

Operations Research Perspectives 8 (2021) 100192
A2
Contents lists available at ScienceDirect
Operations Research Perspectives
journal homepage: www.elsevier.com/locate/orp
A systematic literature review about dimensioning safety stock underuncertainties and risks in the procurement processJúlio Barros a,∗, Paulo Cortez b, M. Sameiro Carvalho c
a ALGORITMI Research Centre, University of Minho, Guimarães 4800–058, Portugalb ALGORITMI Research Centre, Department of Information Systems, University of Minho, Guimarães 4800–058, Portugalc ALGORITMI Research Centre, Department of Production and Systems, University of Minho, Braga 4710–057, Portugal
A R T I C L E I N F O
Keywords:Safety stocksInventory managementProcurementSupply chain risk managementUncertainty factorsSystematic literature review
A B S T R A C T
This paper analyses literature contributions in the search for safety stock problem under uncertainties and risksin the procurement process, focusing on the dimensioning problem (determination of the safety stock level).We perform a systematic literature review (SLR) from 1995 to 2019 in relevant journals, covering 193 selectedarticles. These selected articles were classified into three safety stock main issues: safety stock dimensioning,safety stock management, and safety stock positioning, allocation or placement. The SLR analysis allowed theidentification of literature gaps and research opportunities, thus providing a road map to guide future researchon this topic.
1. Introduction
The supply chain is a complex and unique network that integratesdifferent business processes involved in fulfilling the customer needs,which includes planning, procurement, production, distribution andcustomer interface [3,4]. All these are involved in the entire productlife cycle, from procurement to manufacturing, distribution and cus-tomer service [5]. The importance of the supply chain management inbusiness strategy, in attracting and retaining customers and markets,in the effectiveness of operation management and the profitability ofcompanies results becomes a valuable way to ensure the competitiveadvantage and improving the organizational performance [5–7]. Logis-tics plays an essential role in supply chain management and it is one ofthe crucial factors of the supply chain success. The logistics planningmanagement processes aims at establishing the right product, in theright quantity, in the right condition, to the right place, at the righttime, and at the right cost (i.e., minimal cost).
The supply chain management deals with a significant numberof uncertainty factors that affect its performance. These uncertaintyfactors introduce a large number of random factors and events, af-fecting all dimensions of the supply chain activities, and also makethe risk and vulnerability a major challenge for organizations [8].Risks and uncertainty factors have a direct influence on both customersatisfaction levels and supply chain related costs. To deal with someof these factors, buffering techniques such as safety stock is included
∗ Corresponding author.E-mail addresses: [email protected] (J. Barros), [email protected] (P. Cortez), [email protected] (M.S. Carvalho).
1 Systematic Literature Review (SLR) is the main method of synthesis that aimed for identifying, evaluating and interpreting the best quality research studieson a specific topic, research question or phenomenon of interest [1,2].
as the way for aiding the operational planning of manufacturing stagesto cover both demand and supply uncertainties so that to provide thepromised service level to the customers [9,10]. Although a higher safetystock level represents a higher service level, it must be optimized inorder to not increase the total costs of the supply chain [10].
Several authors have studied the safety stock research problem andproposed their inventory models considering different types of uncer-tainty and risks, using different approaches. The research problemsrelated to safety stock involve typically issues such as dimensioning,management, and positioning, placement or allocation [11]. Safetystock dimensioning consists of setting the appropriate safety stock levelfor each item. Safety stock management involves setting of both thesafety stock levels and the time for replenishments. And, safety stockallocation, positioning or placement consists on setting safety stocklevels and determine where to allocate them on supply chain structure.There are several terminologies in the literature for the same problemof safety stock placement. Safety stock placement, safety stock alloca-tion and safety stock positioning represent the same problem [12–14].In this Systematic Literature Review (SLR)1 we adopt the terminologysafety stock placement to portray this problem.
Although the scope of this research is on safety stock dimensioningstrategies, we extend it and consider all safety stock dimensions (thisis, dimensioning, management and placement), since the dimensioningissue is present in each of these dimensions. Schmidt et al. [15] argued
vailable online 22 June 2021214-7160/© 2021 The Author(s). Published by Elsevier Ltd. This is an open access a
https://doi.org/10.1016/j.orp.2021.100192Received 27 January 2021; Received in revised form 1 June 2021; Accepted 9 Jun
rticle under the CC BY license (http://creativecommons.org/licenses/by/4.0/).
e 2021

Operations Research Perspectives 8 (2021) 100192J. Barros et al.
that is very difficult to survey scientific publication related to safetystock dimensioning. Within our knowledge, there are only three sur-veys/reviews that cover totally or partially the safety stock problem.Caridi and Cigolini [11] analysed and classified safety stock dampingmethods for manufacturing systems by considering uncertainty factors.Schmidt et al. [15] analysed mathematical methods for safety stockdimensioning and perform a simulation study to compare these meth-ods regarding service and safety stock level. Finally, Eruguz et al. [16]focused only on safety stock placement issue, more specifically on theguaranteed-service modelling approach.
A comprehensive SLR was made by analysing research papers from1995 to 2019 of safety stock research efforts by considering uncer-tainty factors or risks, or even both, in the procurement process. Theselected papers were filtered manually and reduced to 193 papers inthis review and classified into three dimensions of safety stock problem:safety stock dimensioning, safety stock management, and safety stockplacement, allocation or positioning. Furthermore, literature gaps wereidentified, allowing to disclose future research opportunities.
This paper is organized as follows. Firstly, Section 2 provides anoverview of the main concepts related to procurement, supply chainrisk and uncertainty, sources of uncertainty and risk in procurementprocesses and some traditional safety stock dimension strategies. Sec-tion 3 presents the review methodology followed for analysing theliterature contributions. Section 4, we present a descriptive and co-occurrence analysis of selected papers. Then, in Section 5, the selectedpapers are categorized according to the research problem. Section 6presents the literature gaps and research opportunities. Finally, weconclude this paper in Section 7.
2. Theoretical background
2.1. Procurement: sourcing and purchasing
The terms purchasing and procurement are often used as the sameconcept, although they differ in scope. Purchasing is related to theactual buying of materials and the buying process activities. On theother hand, procurement has a broader scope comparing with pur-chasing [17,18]. It includes purchasing, warehousing, and all activitiesof receiving inbound materials [17]. Purchasing is the first step inprocurement within a process-based supply chain.
Chopra and Meindl [3] defined Procurement as ‘‘the process of ob-taining goods and services within a supply chain’’. Also, the [19] providesa definition for Procurement: ‘‘the activities associated with acquiringproducts or services. The range of activities can vary widely between organi-zation to include all of the parts of the functions of Procurement planning,purchasing, inventory control, traffic, receiving, incoming inspection, andsalvage operations’’.
Procurement represents one of the key processes in the supply chainand can influence the success of the entire organization. It ensure thesufficient supplies of raw materials at the right price, of the requiredquantity, in the right place and at the right time [20].
The procurement process includes activities such as the ‘‘make orbuy’’ decision process, purchasing and appraisal of both supplier andcontractor. Fig. 1 represents the procurement cycle in a resumed way.
2.1.1. SourcingSourcing, also known as strategic procurement consists of a set of
business processes that are required to purchase goods and services [3,21]. It includes processes such as formalize specification, selectingsuppliers and contracting process [6,21].
• Formalizing specifications — in this process are defined therequirements of purchasing, as well as the ‘‘make or buy’’ decision(decision to make goods or provide a service rather than buyingthis goods/service) [6,20]. The first step of this process consiststo define functional and technical specifications of items to be
2
purchased [6];
• Selecting suppliers — this process consists of searching andidentifying suppliers in the market [6,21]. Important decisions,such as the method of subcontracting to be adopted (e.g., partialor total subcontracting, payment in fixed-price or in refundablecost), the criteria for the preliminary qualification of potentialssuppliers, the requisition and analysis of received proposals andselection of suppliers are necessary to be taken [6,20];
• Contracting — in this process are defined the terms of thecontract (e.g., delivery conditions and price, payments conditions,penalty clauses, and warranty conditions) and afterwards thesigning of the contract [6].
2.1.2. PurchasingPurchasing or operational procurement consists of the processes of
buying goods and services [21]. For efficient purchasing is necessary toknow the on-hand stock quantity so that to order the correct amount.An efficient purchasing requires inventory control management. Hence,safety stock as an extra inventory held to deal with uncertainties indemand and supply is used to plan future purchase quantities.
Purchasing includes processes such as the ordering of material andservices, monitoring and evaluation [6].
• Ordering — this process consists to submit the purchasing or-der, but firstly is necessary to guarantee the definition of thecontracting terms and consequently the signature of the contract;
• Monitoring — this process involves a set of different tasks relatedto the monitoring of submitted orders, such as visits to suppliersfacilities, as well as negotiations related to changes regardingtechnical specifications, requisition of production plans and ex-pected delivery date, verification of concordance of the deliveredproducts with the agreed specifications, and lastly, the exchangeof the commercial correspondences with customers;
• Evaluation — this process consists basically of the execution ofcomplaints, activation of penalty clauses (when is applicable),and organization of documentation related to the project andsupplier.
2.2. Supply chain risk and uncertainty
Often-times, the risk is confused with uncertainty, but these twoterms are not the same [22,23]. Knight [24] differentiate risk fromuncertainty arguing that risk is something measurable while uncer-tainty is not quantifiable and unpredictable (with unknown outcomes).Manuj and Mentzer [25] argues that risk is an expected outcome of anuncertain event, and Rao and Goldsby [26] view risk as an event anduncertainty as possible outcomes.
There are several definitions in the literature regarding the riskin the supply chain context. But, do not exists a universal definition,although there have been several attempts [27,28]. Tables 1 and 2presents some of the key definition of risks and Supply Chain Risks(SCR).
2.3. Uncertainty factors and risks in the procurement process
There are a variety of uncertainty factors and risks associated tothe procurement process, such as uncertain lead time, demand fluctu-ations, variations of prices, uncertain yield, supplier delays and ordercrossover, as follows described.
• Lead time uncertainty — supply lead time represents the av-erage of time between when the order is placed and when theproduct arrives [3,38]. The uncertainty in supply lead time mustbe controlled properly in order to not increase the total cost andreduce customer service level [39]. Besides that, the high varia-tion of supply lead-time increases the difficulty in procurementplanning [40], more properly to perform the Material Require-
ment Planning (MRP) process. For an efficient production is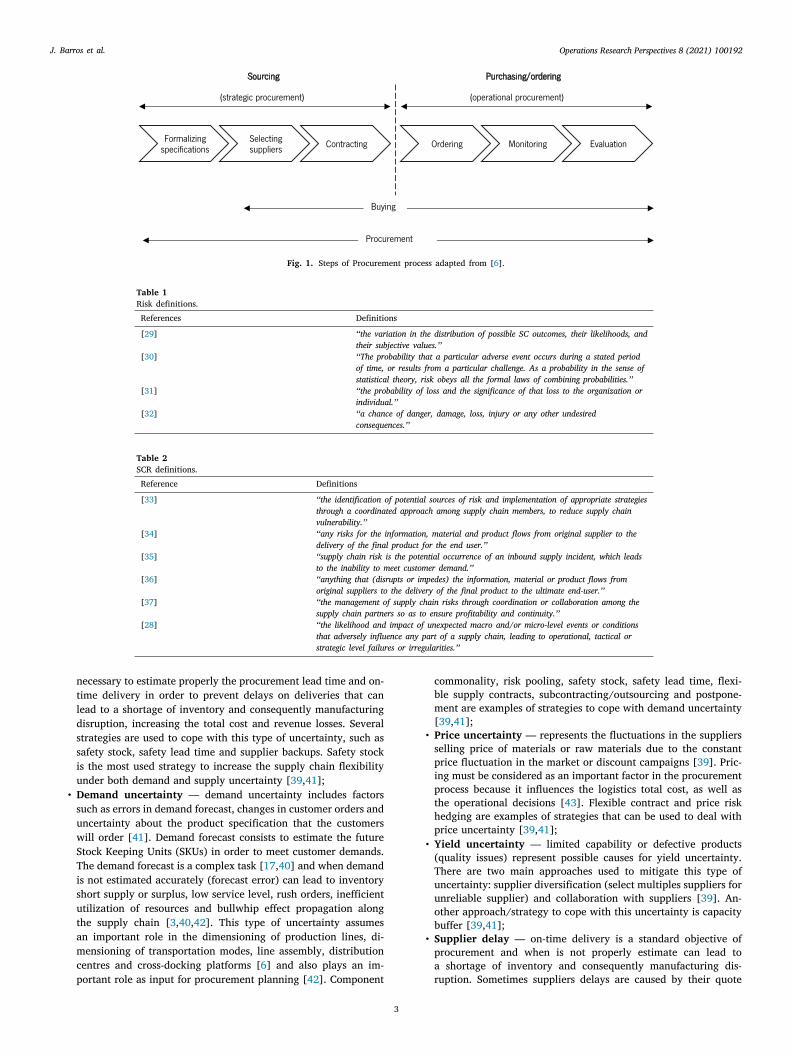
Operations Research Perspectives 8 (2021) 100192J. Barros et al.
Fig. 1. Steps of Procurement process adapted from [6].
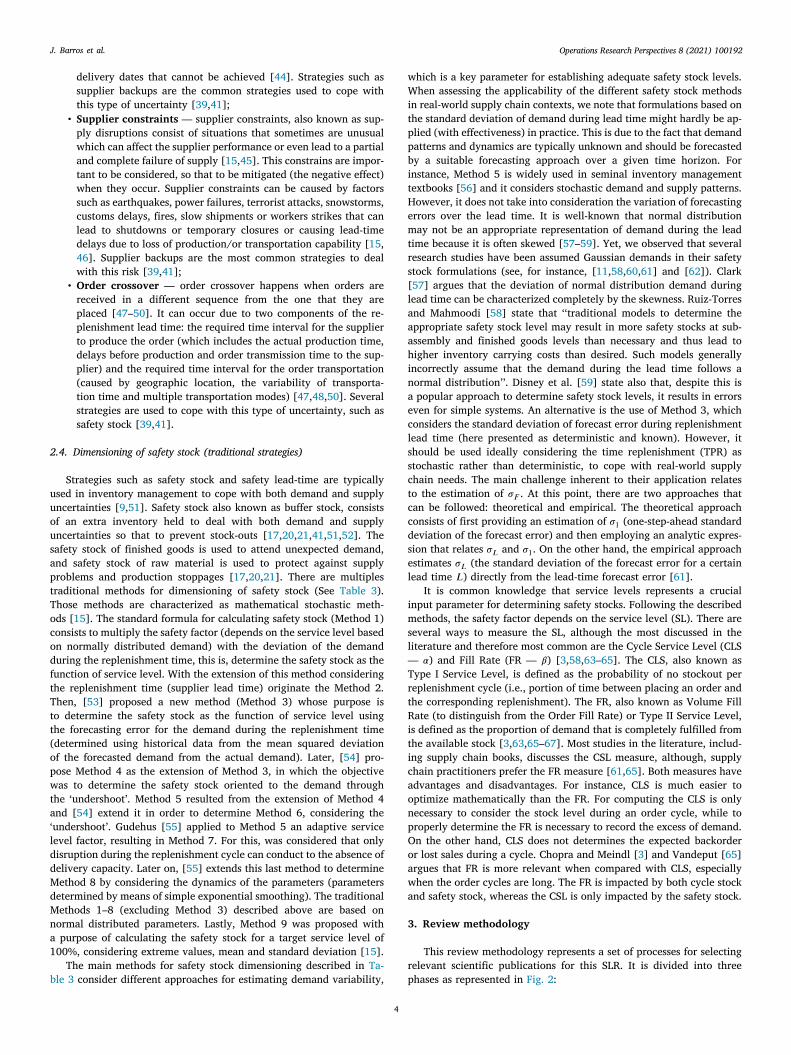
Table 1Risk definitions.References Definitions
[29] ‘‘the variation in the distribution of possible SC outcomes, their likelihoods, andtheir subjective values.’’
[30] ‘‘The probability that a particular adverse event occurs during a stated periodof time, or results from a particular challenge. As a probability in the sense ofstatistical theory, risk obeys all the formal laws of combining probabilities.’’
[31] ‘‘the probability of loss and the significance of that loss to the organization orindividual.’’
[32] ‘‘a chance of danger, damage, loss, injury or any other undesiredconsequences.’’
Table 2SCR definitions.Reference Definitions
[33] ‘‘the identification of potential sources of risk and implementation of appropriate strategiesthrough a coordinated approach among supply chain members, to reduce supply chainvulnerability.’’
[34] ‘‘any risks for the information, material and product flows from original supplier to thedelivery of the final product for the end user.’’
[35] ‘‘supply chain risk is the potential occurrence of an inbound supply incident, which leadsto the inability to meet customer demand.’’
[36] ‘‘anything that (disrupts or impedes) the information, material or product flows fromoriginal suppliers to the delivery of the final product to the ultimate end-user.’’
[37] ‘‘the management of supply chain risks through coordination or collaboration among thesupply chain partners so as to ensure profitability and continuity.’’
[28] ‘‘the likelihood and impact of unexpected macro and/or micro-level events or conditionsthat adversely influence any part of a supply chain, leading to operational, tactical orstrategic level failures or irregularities.’’
necessary to estimate properly the procurement lead time and on-time delivery in order to prevent delays on deliveries that canlead to a shortage of inventory and consequently manufacturingdisruption, increasing the total cost and revenue losses. Severalstrategies are used to cope with this type of uncertainty, such assafety stock, safety lead time and supplier backups. Safety stockis the most used strategy to increase the supply chain flexibilityunder both demand and supply uncertainty [39,41];
• Demand uncertainty — demand uncertainty includes factorssuch as errors in demand forecast, changes in customer orders anduncertainty about the product specification that the customerswill order [41]. Demand forecast consists to estimate the futureStock Keeping Units (SKUs) in order to meet customer demands.The demand forecast is a complex task [17,40] and when demandis not estimated accurately (forecast error) can lead to inventoryshort supply or surplus, low service level, rush orders, inefficientutilization of resources and bullwhip effect propagation alongthe supply chain [3,40,42]. This type of uncertainty assumesan important role in the dimensioning of production lines, di-mensioning of transportation modes, line assembly, distributioncentres and cross-docking platforms [6] and also plays an im-portant role as input for procurement planning [42]. Component
3
commonality, risk pooling, safety stock, safety lead time, flexi-ble supply contracts, subcontracting/outsourcing and postpone-ment are examples of strategies to cope with demand uncertainty[39,41];
• Price uncertainty — represents the fluctuations in the suppliersselling price of materials or raw materials due to the constantprice fluctuation in the market or discount campaigns [39]. Pric-ing must be considered as an important factor in the procurementprocess because it influences the logistics total cost, as well asthe operational decisions [43]. Flexible contract and price riskhedging are examples of strategies that can be used to deal withprice uncertainty [39,41];
• Yield uncertainty — limited capability or defective products(quality issues) represent possible causes for yield uncertainty.There are two main approaches used to mitigate this type ofuncertainty: supplier diversification (select multiples suppliers forunreliable supplier) and collaboration with suppliers [39]. An-other approach/strategy to cope with this uncertainty is capacitybuffer [39,41];
• Supplier delay — on-time delivery is a standard objective ofprocurement and when is not properly estimate can lead toa shortage of inventory and consequently manufacturing dis-ruption. Sometimes suppliers delays are caused by their quote
Operations Research Perspectives 8 (2021) 100192J. Barros et al.
2
uuousaptTocodftTtt(opwta‘lddMdMna1
b
delivery dates that cannot be achieved [44]. Strategies such assupplier backups are the common strategies used to cope withthis type of uncertainty [39,41];
• Supplier constraints — supplier constraints, also known as sup-ply disruptions consist of situations that sometimes are unusualwhich can affect the supplier performance or even lead to a partialand complete failure of supply [15,45]. This constrains are impor-tant to be considered, so that to be mitigated (the negative effect)when they occur. Supplier constraints can be caused by factorssuch as earthquakes, power failures, terrorist attacks, snowstorms,customs delays, fires, slow shipments or workers strikes that canlead to shutdowns or temporary closures or causing lead-timedelays due to loss of production/or transportation capability [15,46]. Supplier backups are the most common strategies to dealwith this risk [39,41];
• Order crossover — order crossover happens when orders arereceived in a different sequence from the one that they areplaced [47–50]. It can occur due to two components of the re-plenishment lead time: the required time interval for the supplierto produce the order (which includes the actual production time,delays before production and order transmission time to the sup-plier) and the required time interval for the order transportation(caused by geographic location, the variability of transporta-tion time and multiple transportation modes) [47,48,50]. Severalstrategies are used to cope with this type of uncertainty, such assafety stock [39,41].
.4. Dimensioning of safety stock (traditional strategies)
Strategies such as safety stock and safety lead-time are typicallysed in inventory management to cope with both demand and supplyncertainties [9,51]. Safety stock also known as buffer stock, consistsf an extra inventory held to deal with both demand and supplyncertainties so that to prevent stock-outs [17,20,21,41,51,52]. Theafety stock of finished goods is used to attend unexpected demand,nd safety stock of raw material is used to protect against supplyroblems and production stoppages [17,20,21]. There are multiplesraditional methods for dimensioning of safety stock (See Table 3).hose methods are characterized as mathematical stochastic meth-ds [15]. The standard formula for calculating safety stock (Method 1)onsists to multiply the safety factor (depends on the service level basedn normally distributed demand) with the deviation of the demanduring the replenishment time, this is, determine the safety stock as theunction of service level. With the extension of this method consideringhe replenishment time (supplier lead time) originate the Method 2.hen, [53] proposed a new method (Method 3) whose purpose iso determine the safety stock as the function of service level usinghe forecasting error for the demand during the replenishment timedetermined using historical data from the mean squared deviationf the forecasted demand from the actual demand). Later, [54] pro-ose Method 4 as the extension of Method 3, in which the objectiveas to determine the safety stock oriented to the demand through
he ‘undershoot’. Method 5 resulted from the extension of Method 4nd [54] extend it in order to determine Method 6, considering theundershoot’. Gudehus [55] applied to Method 5 an adaptive serviceevel factor, resulting in Method 7. For this, was considered that onlyisruption during the replenishment cycle can conduct to the absence ofelivery capacity. Later on, [55] extends this last method to determineethod 8 by considering the dynamics of the parameters (parameters
etermined by means of simple exponential smoothing). The traditionalethods 1–8 (excluding Method 3) described above are based on
ormal distributed parameters. Lastly, Method 9 was proposed withpurpose of calculating the safety stock for a target service level of
00%, considering extreme values, mean and standard deviation [15].The main methods for safety stock dimensioning described in Ta-
le 3 consider different approaches for estimating demand variability,
4
which is a key parameter for establishing adequate safety stock levels.When assessing the applicability of the different safety stock methodsin real-world supply chain contexts, we note that formulations based onthe standard deviation of demand during lead time might hardly be ap-plied (with effectiveness) in practice. This is due to the fact that demandpatterns and dynamics are typically unknown and should be forecastedby a suitable forecasting approach over a given time horizon. Forinstance, Method 5 is widely used in seminal inventory managementtextbooks [56] and it considers stochastic demand and supply patterns.However, it does not take into consideration the variation of forecastingerrors over the lead time. It is well-known that normal distributionmay not be an appropriate representation of demand during the leadtime because it is often skewed [57–59]. Yet, we observed that severalresearch studies have been assumed Gaussian demands in their safetystock formulations (see, for instance, [11,58,60,61] and [62]). Clark[57] argues that the deviation of normal distribution demand duringlead time can be characterized completely by the skewness. Ruiz-Torresand Mahmoodi [58] state that ‘‘traditional models to determine theappropriate safety stock level may result in more safety stocks at sub-assembly and finished goods levels than necessary and thus lead tohigher inventory carrying costs than desired. Such models generallyincorrectly assume that the demand during the lead time follows anormal distribution’’. Disney et al. [59] state also that, despite this isa popular approach to determine safety stock levels, it results in errorseven for simple systems. An alternative is the use of Method 3, whichconsiders the standard deviation of forecast error during replenishmentlead time (here presented as deterministic and known). However, itshould be used ideally considering the time replenishment (TPR) asstochastic rather than deterministic, to cope with real-world supplychain needs. The main challenge inherent to their application relatesto the estimation of 𝜎𝐹 . At this point, there are two approaches thatcan be followed: theoretical and empirical. The theoretical approachconsists of first providing an estimation of 𝜎1 (one-step-ahead standarddeviation of the forecast error) and then employing an analytic expres-sion that relates 𝜎𝐿 and 𝜎1. On the other hand, the empirical approachestimates 𝜎𝐿 (the standard deviation of the forecast error for a certainlead time 𝐿) directly from the lead-time forecast error [61].
It is common knowledge that service levels represents a crucialinput parameter for determining safety stocks. Following the describedmethods, the safety factor depends on the service level (SL). There areseveral ways to measure the SL, although the most discussed in theliterature and therefore most common are the Cycle Service Level (CLS— 𝛼) and Fill Rate (FR — 𝛽) [3,58,63–65]. The CLS, also known asType I Service Level, is defined as the probability of no stockout perreplenishment cycle (i.e., portion of time between placing an order andthe corresponding replenishment). The FR, also known as Volume FillRate (to distinguish from the Order Fill Rate) or Type II Service Level,is defined as the proportion of demand that is completely fulfilled fromthe available stock [3,63,65–67]. Most studies in the literature, includ-ing supply chain books, discusses the CSL measure, although, supplychain practitioners prefer the FR measure [61,65]. Both measures haveadvantages and disadvantages. For instance, CLS is much easier tooptimize mathematically than the FR. For computing the CLS is onlynecessary to consider the stock level during an order cycle, while toproperly determine the FR is necessary to record the excess of demand.On the other hand, CLS does not determines the expected backorderor lost sales during a cycle. Chopra and Meindl [3] and Vandeput [65]argues that FR is more relevant when compared with CLS, especiallywhen the order cycles are long. The FR is impacted by both cycle stockand safety stock, whereas the CSL is only impacted by the safety stock.
3. Review methodology
This review methodology represents a set of processes for selectingrelevant scientific publications for this SLR. It is divided into threephases as represented in Fig. 2:

Operations Research Perspectives 8 (2021) 100192J. Barros et al.
3
rieaFaqawod
Lo
irgrs
Table 3Traditional methods for safety stock dimensioning [15,52].Method Formula
1 𝑆𝑆𝐿 = 𝑆𝐹 (𝑆𝐿) ∗ 𝜎𝐷2 𝑆𝑆𝐿 = 𝑆𝐹 (𝑆𝐿) ∗ 𝜎𝐷 ∗
√
𝑇𝑅𝑃3 𝑆𝑆𝐿 = 𝑆𝐹 (𝑆𝐿) ∗ 𝜎𝐹 ∗
√
𝑇𝑅𝑃
4 𝑆𝑆𝐿 = 𝑆𝐹 (𝑆𝐿) ∗√
𝑉 𝑎𝑟(𝑈 ) + 𝑇𝑅𝑃 ∗ 𝜎2𝐷
5 𝑆𝑆𝐿 = 𝑆𝐹 (𝑆𝐿) ∗√
𝑇𝑅𝑃 ∗ 𝜎2𝐷 +𝐷2 ∗ 𝜎2
𝑇𝑅𝑃
6 𝑆𝑆𝐿 = 𝑆𝐹 (𝑆𝐿) ∗√
𝑉 𝑎𝑟(𝑈 ) + 𝑇𝑅𝑃 ∗ 𝜎2𝐷 +𝐷2 ∗ 𝜎2
𝑇𝑅𝑃
7 𝑆𝑆𝐿 = 𝑆𝐹 (1 − (1−𝑆𝐿)∗𝑄𝑅𝑃𝑇𝑅𝑃∗𝐷
) ∗√
𝑇𝑅𝑃 ∗ 𝜎2𝑁 +𝐷2 ∗ 𝜎2
𝑇𝑅𝑃 ,∀𝑄𝑅𝑃 > 𝑇𝑅𝑃 ∗ 𝐷
8 𝑆𝑆𝐿 = 𝑆𝐹 (1 − (1−𝛼)∗𝑄𝑅𝑃𝑇𝑅𝑃 (𝑡)∗𝐷(𝑡)
) ∗√
𝑇𝑅𝑃 ∗ 𝜎𝑁 (𝑡)2 +𝐷(𝑡)2 ∗ 𝜎𝑇𝑅𝑃 (𝑡)2 ,∀𝑄𝑅𝑃 > 𝑇𝑅𝑃 ∗ 𝐷9 𝑆𝑆𝐿 = 𝐿𝑆𝐿0(𝑆𝐿2 − 1) + 𝑆𝑆𝐿100% ∗
√
1 − (1 − 𝑆𝐿)𝑐𝐿𝑆𝐿0 =
𝑄𝑅𝑃2
𝑆𝑆𝐿100% =√
(𝐷𝑉 +𝑑,𝑚𝑎𝑥 ∗ 𝐷)2 + ((𝐷𝑚𝑎𝑥 −𝐷) ∗ 𝑇𝑅𝑃 )2 + (𝐷𝑉 −
𝑄𝑅𝑃 ,𝑚𝑎𝑥)2
Legend
SSL — Safety Stock Level [units];SF — Safety factor (depends on the service level);SL — Service Level;𝜎𝐷 — Standard deviation on-demand [units/SCD];SCD — Shop Calendar Day;TRP — Time Replenishment [SCD];𝜎𝐹 — the standard deviation of the forecast error for the demand during TRP [units/SCD];Var(U) — Variance of the undershoot [𝑢𝑛𝑖𝑡𝑠2/𝑆𝐶𝐷2];D — mean demand per period [units/SCD];𝜎𝑇𝑅𝑃 — the standard deviation of replenishment time [SCD];QRP — replenishment quantity [units];TRP(t) — replenishment time forecasted for period t [SCD];N(t) — mean demand per period forecasted for period t [units/SCD];𝜎𝑁 (𝑡) — the std. deviation of demand during replenishment time forecasted for period t[units/SCD];𝜎𝑇𝑅𝑃 (𝑡) — the standard deviation of replenishment time forecasted for period t [SCD];LSL0 — lot stock level [units];C — C-Norm parameter;𝐷𝑉 +
𝑑,𝑚𝑎𝑥 — max. positive Deviation from the due date [SCD];𝐷𝑉𝑚𝑎𝑥 — maximum demand per period [units/SCD];𝐷𝑉𝑚𝑎𝑥-𝐷𝑉 −
𝑄𝑅𝑃 ,𝑚𝑎𝑥 — max. negative Deviation in replenishment quality [units];
• The first phase (Searching phase) involves the definition of theresearch query and searching for scientific publication in bothWeb of Science and Scopus databases;
• The second phase (Selecting phase) aims to exclude scientificpublications that did not meet the defined criteria or did notaddress safety stock research problems;
• Lastly, the third phase (Analysing phase) consists to select rele-vant articles for conducting this study.
.1. Searching phase
The majority of scientific publications are published in peer-eviewed scientific journals and the more relevant ones are indexedn two of the major online databases: Thomson Reuters’ Web of Sci-nce (WoS) and Elsevier Scopus. The coverage of journals in WoS ispproximately 13.600 journals and in Scopus is 20.346 journals [68].or this first phase of review methodology, all scientific publicationsre searched in both Web of Science and Scopus databases using theuery described in Table 4. The search query considers keywords suchs ‘‘safety stock’’ and ‘‘safety inventory’’ so that to capture in broaderay topics related to safety stock problem. Keywords related to factorsf uncertainty and supply chain risks in the sourcing process, such asemand, price, lead-time, yield, order crossover, suppliers delay, variability,
variation, fluctuation, uncertain and uncertainty are also considered.astly, the query excludes all deterministic terms, aiming to focus onlyn uncertainty factors.
After performing this searching in the Scopus database resultedn a sample of 937 bibliographic references and 649 bibliographiceferences in the Web of Science database. All these resultant biblio-raphic references (from both databases) are merged and all duplicatedeferences are removed. After that, a total of 1149 references areelected for the next phase of this review methodology.
5
3.2. Selecting phase
For the selecting phase are defined three screening criteria levelsin order to exclude bibliographic references that did not meet thedefined criteria. For the first level of screening criteria, the choice ofthe consulted references was based on the following criteria:
• The bibliographic references searched included only articles fromthe peer-reviewed journals;
• Research articles published from 1995 to 2019, a period of24 years;
• Publications written in English language.
In the second level of screening criteria, the SCImago Journal Rank(SJR) indicator and the subsequent journal Quartile was defined asthe main selection criteria of articles for the next phase (Analysingphase). In this level of screening criteria, only articles published injournals ranked as Q1 and Q2 (Quartiles) in SJR were selected. Themain objective is to consider/select relevant articles for this SystematicLiterature Review (SLR) and exclude articles that did not meet thedefined criteria.
The third level of screening criteria involves the reading of theabstract of selected articles, thereby excluding articles that did notaddress the safety stock research problem considering at least oneof risks or uncertainty factors described previously. After this phase,a total of 193 references are selected for the next phase (Analysingphase).
The co-occurrence analysis was performed in order to validatethe filtering process and selection criteria of research papers (see,Section 4.2).

Operations Research Perspectives 8 (2021) 100192J. Barros et al.
Table 4Query for searching of bibliographic references (Literature analysis).
Research query (Literature analysis) ((‘‘safety stock’’ OR ‘‘safety inventory’’) AND (demand OR price OR ‘‘lead time’’ ORyield OR ‘‘order crossover’’ OR ‘‘supplier delay’’ OR variability OR variation ORfluctuation OR uncertain OR uncertainty)) *AND NOT deterministic
Results in Scopus 937Results in Web of Science 649Results (bibliographic references mergedand duplicates removed)
1149
*AND operator is not necessary to search for bibliographic references on the WoS database.
Fig. 2. Adopted review methodology.
3.3. Analysing phase
This last phase aims to read the whole text of the article and selectthe more relevant ones and those that meet the purpose of this inves-tigation. After a final manual inspection of the obtained references, atotal of 193 articles was selected as the primary bibliographic referencefor this Systematic Literature Review (SLR).
After that, all articles were classified following the safety stockresearch problem present in [11], therefore classified into three safetystock research problems: safety stock dimensioning, safety stock man-agement, or safety stock positioning (allocation or placement). Thisclassification was made by reading each article and identifying thefocus of it. Some of the articles contain explicitly the research focus(research problem), but in the majority of selected articles, this classi-fication was made exclusively through our perception where the article
6
fits regarding the safety stock research problem.
4. Descriptive and co-occurrence analysis
4.1. Descriptive analysis
The descriptive analysis was performed using the BibExcel tool.This tool allowed to execute the initial bibliometric and statisticalanalysis, which included data from the Web of Science and Scopusdatabases [69]. Then, the tool output was exported to the Excel tool,allowing to execute other graphical statistical analyses. The selectedarticles were analysed according to the number or the frequency ofpublications over the years, the venue of publication (name of thejournal where the article is published), the research problem studiedin the article, the author’s influence and affiliations, and the approachadopted for modelling the problem.
4.1.1. Year of publicationFig. 3 illustrates the number of scientific publications published
(annually) in the period from 1995 to 2019. The safety stock researchproblem has been gained attention from researchers especially since2007 until now. Only 10.88% of articles were published from a period
of 1995 to 1999, and 9.33% were published in the period from 2000
Operations Research Perspectives 8 (2021) 100192J. Barros et al.
Fig. 3. Distribution of scientific publication over the years.
Fig. 4. Distribution of publication and their percentage per journal.
to 2006. From 2007 to 2019, 79.79% of articles were published,representing the increase of importance or attention of this researchtopic by researchers and practitioners.
4.1.2. Venue of publicationRegarding the journals where the articles were published, Fig. 4
shows the distribution of publications and their percentage per journal.There are 62 different journals where the reviewed articles wherepublished. Fig. 4 explicitly represents the considered journals that haveat least three articles selected withing this SLR.
International Journal of Production Economics, International Jour-nal of Production Research and European Journal of Operational Re-search represent the top 3 journals that mostly contributed with pub-lished articles. The first journal contributed with 41 articles that rep-resents 21.24% of a total of reviewed articles. The second journalcontributed with 14 published articles, that represents 7.25% of thereviewed articles. Finally, the third journals contributed with 13 pub-lished articles, representing 6.74% of the reviewed articles.
4.1.3. Research problemThe reviewed articles involve different safety stock research prob-
lem as shown in Fig. 5. The problem of safety stock dimensioning is themost studied problem in the reviewed articles (a total of 79 articles,that corresponds 40.93% of safety stock research problems covered allarticles). Figs. 6 and 7 illustrate the distribution of the articles for eachsafety stock problem in the period from 1995 to 2019.
7
Fig. 5. Distribution of publications for each safety stock research problem.
Fig. 6. Distribution of publications for each safety stock research problem over theyears.
Fig. 7. Distribution of publication for each safety stock problem under differentuncertainty factors and risks.
4.1.4. Authors influence and affiliationsTable 5 describes the main authors who the most contribute with
articles within the 193 articles selected. Only 26 per cent of all authorshave contributed with more than one article, and the remaining 74 percent of authors contributed with just only one research article.
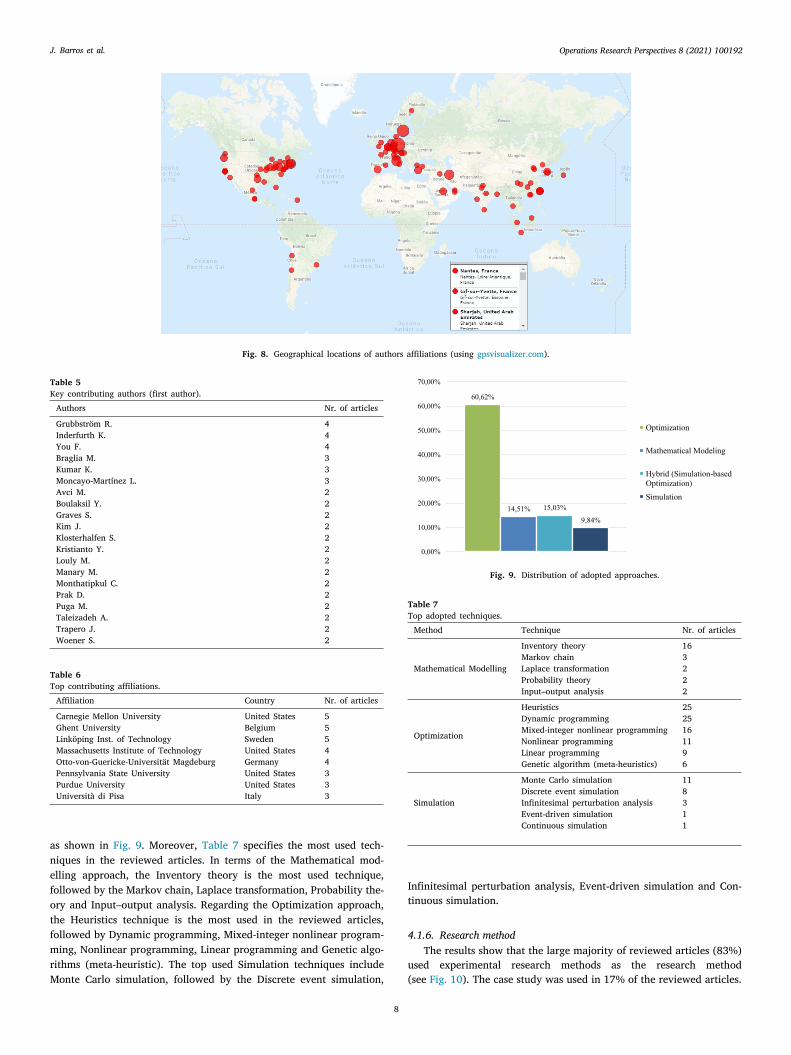
The affiliation of the authors is illustrated geographically in Fig. 8.Both the city and country of the author’s affiliation were extracted,allowing to perform their graphical visualization using the websitegpsvisualizer.com. The size of the red circle represents the occurrenceof this affiliation, this is, the greater is the red cycle, more occur-rence this affiliation have. Table 6 summarizes the number of articlespublished by the top contributing affiliations.
4.1.5. Approach followedIn terms of the approach adopted to tackle safety stock research
problems, four main approaches were used in the reviewed articles,
Operations Research Perspectives 8 (2021) 100192J. Barros et al.
Fig. 8. Geographical locations of authors affiliations (using gpsvisualizer.com).
Table 5Key contributing authors (first author).
Authors Nr. of articles
Grubbström R. 4Inderfurth K. 4You F. 4Braglia M. 3Kumar K. 3Moncayo-Martínez L. 3Avci M. 2Boulaksil Y. 2Graves S. 2Kim J. 2Klosterhalfen S. 2Kristianto Y. 2Louly M. 2Manary M. 2Monthatipkul C. 2Prak D. 2Puga M. 2Taleizadeh A. 2Trapero J. 2Woener S. 2
Table 6Top contributing affiliations.
Affiliation Country Nr. of articles
Carnegie Mellon University United States 5Ghent University Belgium 5Linköping Inst. of Technology Sweden 5Massachusetts Institute of Technology United States 4Otto-von-Guericke-Universität Magdeburg Germany 4Pennsylvania State University United States 3Purdue University United States 3Università di Pisa Italy 3
as shown in Fig. 9. Moreover, Table 7 specifies the most used tech-niques in the reviewed articles. In terms of the Mathematical mod-elling approach, the Inventory theory is the most used technique,followed by the Markov chain, Laplace transformation, Probability the-ory and Input–output analysis. Regarding the Optimization approach,the Heuristics technique is the most used in the reviewed articles,followed by Dynamic programming, Mixed-integer nonlinear program-ming, Nonlinear programming, Linear programming and Genetic algo-rithms (meta-heuristic). The top used Simulation techniques includeMonte Carlo simulation, followed by the Discrete event simulation,
8
Fig. 9. Distribution of adopted approaches.
Table 7Top adopted techniques.
Method Technique Nr. of articles
Mathematical Modelling
Inventory theory 16Markov chain 3Laplace transformation 2Probability theory 2Input–output analysis 2
Optimization
Heuristics 25Dynamic programming 25Mixed-integer nonlinear programming 16Nonlinear programming 11Linear programming 9Genetic algorithm (meta-heuristics) 6
Simulation
Monte Carlo simulation 11Discrete event simulation 8Infinitesimal perturbation analysis 3Event-driven simulation 1Continuous simulation 1
Infinitesimal perturbation analysis, Event-driven simulation and Con-tinuous simulation.
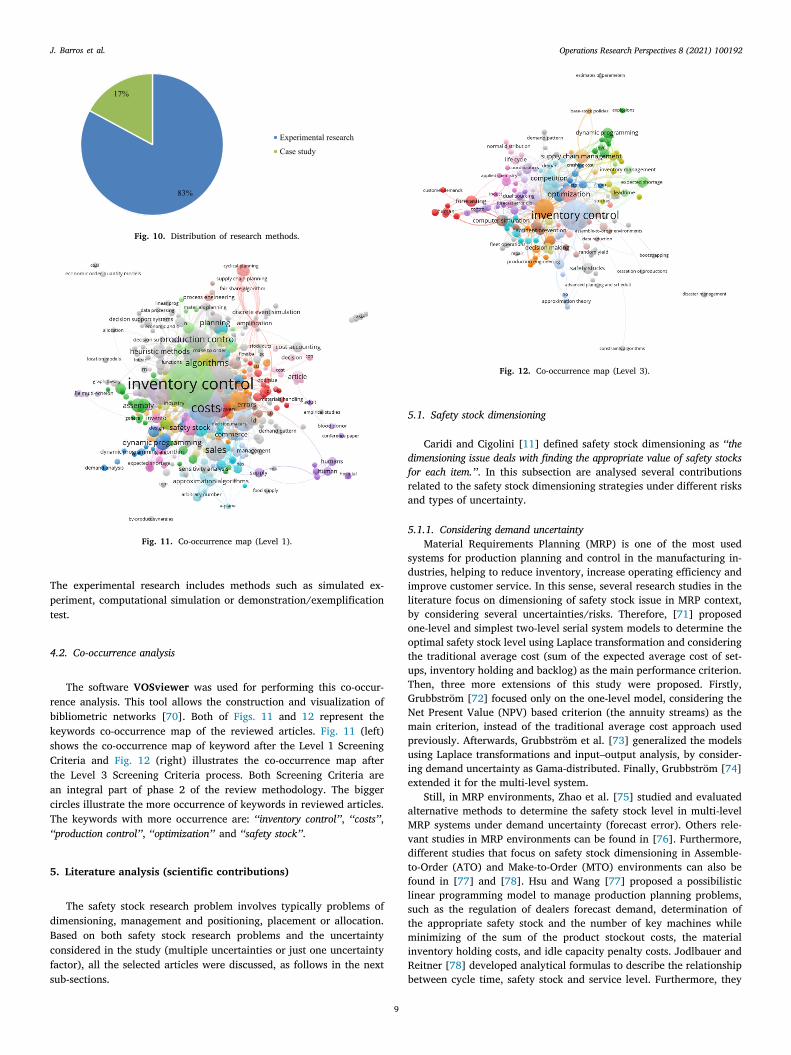
4.1.6. Research methodThe results show that the large majority of reviewed articles (83%)
used experimental research methods as the research method(see Fig. 10). The case study was used in 17% of the reviewed articles.
Operations Research Perspectives 8 (2021) 100192J. Barros et al.
Fig. 10. Distribution of research methods.
Fig. 11. Co-occurrence map (Level 1).
The experimental research includes methods such as simulated ex-periment, computational simulation or demonstration/exemplificationtest.
4.2. Co-occurrence analysis
The software VOSviewer was used for performing this co-occur-rence analysis. This tool allows the construction and visualization ofbibliometric networks [70]. Both of Figs. 11 and 12 represent thekeywords co-occurrence map of the reviewed articles. Fig. 11 (left)shows the co-occurrence map of keyword after the Level 1 ScreeningCriteria and Fig. 12 (right) illustrates the co-occurrence map afterthe Level 3 Screening Criteria process. Both Screening Criteria arean integral part of phase 2 of the review methodology. The biggercircles illustrate the more occurrence of keywords in reviewed articles.The keywords with more occurrence are: ‘‘inventory control’’, ‘‘costs’’,‘‘production control’’, ‘‘optimization’’ and ‘‘safety stock’’.
5. Literature analysis (scientific contributions)
The safety stock research problem involves typically problems ofdimensioning, management and positioning, placement or allocation.Based on both safety stock research problems and the uncertaintyconsidered in the study (multiple uncertainties or just one uncertaintyfactor), all the selected articles were discussed, as follows in the nextsub-sections.
9
Fig. 12. Co-occurrence map (Level 3).
5.1. Safety stock dimensioning
Caridi and Cigolini [11] defined safety stock dimensioning as ‘‘thedimensioning issue deals with finding the appropriate value of safety stocksfor each item.’’. In this subsection are analysed several contributionsrelated to the safety stock dimensioning strategies under different risksand types of uncertainty.
5.1.1. Considering demand uncertaintyMaterial Requirements Planning (MRP) is one of the most used
systems for production planning and control in the manufacturing in-dustries, helping to reduce inventory, increase operating efficiency andimprove customer service. In this sense, several research studies in theliterature focus on dimensioning of safety stock issue in MRP context,by considering several uncertainties/risks. Therefore, [71] proposedone-level and simplest two-level serial system models to determine theoptimal safety stock level using Laplace transformation and consideringthe traditional average cost (sum of the expected average cost of set-ups, inventory holding and backlog) as the main performance criterion.Then, three more extensions of this study were proposed. Firstly,Grubbström [72] focused only on the one-level model, considering theNet Present Value (NPV) based criterion (the annuity streams) as themain criterion, instead of the traditional average cost approach usedpreviously. Afterwards, Grubbström et al. [73] generalized the modelsusing Laplace transformations and input–output analysis, by consider-ing demand uncertainty as Gama-distributed. Finally, Grubbström [74]extended it for the multi-level system.
Still, in MRP environments, Zhao et al. [75] studied and evaluatedalternative methods to determine the safety stock level in multi-levelMRP systems under demand uncertainty (forecast error). Others rele-vant studies in MRP environments can be found in [76]. Furthermore,different studies that focus on safety stock dimensioning in Assemble-to-Order (ATO) and Make-to-Order (MTO) environments can also befound in [77] and [78]. Hsu and Wang [77] proposed a possibilisticlinear programming model to manage production planning problems,such as the regulation of dealers forecast demand, determination ofthe appropriate safety stock and the number of key machines whileminimizing of the sum of the product stockout costs, the materialinventory holding costs, and idle capacity penalty costs. Jodlbauer andReitner [78] developed analytical formulas to describe the relationshipbetween cycle time, safety stock and service level. Furthermore, they

Operations Research Perspectives 8 (2021) 100192J. Barros et al.
tsiblptatsab
smdwo(Pl
presented algorithms to find the pair cycle time and safety stock whichminimize the relevant costs.
Several real-world case studies in worldwide companies have beenreported (see, e.g., [79–85] and [86]). For instance, Caridi and Cigolini[79] proposed and implemented a new methodology for both dimen-sioning and managing safety stock in an Italian leader company inthe electromechanical components brand industry by considering de-mand forecast error as an uncertain factor. Persona et al. [80] focusedon safety stock dimensioning on both MTO and ATO environments.This study proposed models to determine optimal safety stocks forpre-assembled modules (ATO production systems) and manufactur-ing components (MTO production systems) used in final products.These models were applied in two Italian companies that operatein different sectors. However, Kanyalkar and Adil [81] considered atrade-off among the plan change costs, safety stock violation penaltyand inventory carrying costs for a capacitated multi-item productionsystem in their proposed linear programming model. This model aimedat determining the optimal level of safety stock in rolling horizon.Boulaksil et al. [82] focus on dimensioning of safety stock in multi-item multi-stage inventory system. The author proposed an approachand then implemented on a worldwide biopharmaceutical company,so-called Organon. Using the simulation based-optimization approach,Chen et al. [83] proposed a framework to determine the appropriatelevel of pooled safety stock levels by considering demand forecast. Thisframework was applied to a clinical trial company. On the other hand,Prawira et al. [86] based on inventory control theory to proposed theirmodel. This model focusing on determine the most reasonable amountof safety stock in the Indonesian oil and gas service companies.
Concerning the Economic Lot Scheduling problem (ELSP) withsafety stock, Brander and Forsberg [87] presented a model to determinethe safety stock for the problem of scheduling the production ofmultiple items on a single facility, both with and without the existenceof the idle time. Without the presence of idle time in the system, thesafety stock level is calculated from the service level considering thedemand variation during lead time. On the other hand, for dealing withidle time a control model is presented. In the control model, the safetystock level is calculated for time to safety stock or TSS (time to reachthe safety stock level).
Dey [88] focused on safety stock dimensioning in single-vendorsingle-buyer supply chain context. This study proposed an integratedproduction–inventory model and also a methodology for determiningthe optimal values of the number of shipments from the vendor to thebuyer, the safety stock, the buyer’s order quantity and the probability ofthe production process goes ‘‘out-of-control’’. This methodology aimedo minimize the crisp equivalent of the total cost of the integratedystem. Before this research of [88], other studies have been conductedn this context. For instance, Glock [89] studied a single-vendor single-uyer integrated model with stochastic demand and lot-size dependentead time under different methods for lead time reduction (and their im-act on expected total costs and safety stock). This model aimed to findhe approximate optimal solution. Afterwards, Mou et al. [90] proposedn extension of the integrated model, by considering transportationime as the main performance criteria and assuming two different safetytocks. However, is important to underline that nowadays is rarely tosupply chain operate in an environment with only one vendor and
uyer.Over times, analytical approaches have been explored to establish
afety stock. For instance, Krupp [91] proposed approaches for deter-ining safety stock based on classic statistical theory. Wang et al. [56]eveloped formulas to determine the reorder point and safety stockhen lead time and demand are correlated. Moeeni et al. [92] basedn the basic traditional inventory models to proposed three modelsfor different scenarios) for determining safety stock and reorder point.rak et al. [93] derive closed-form expressions for the correct reorderevel under uncertainty of both the mean and the variance of the
10
demand. Moreover, both optimization and hybrid (e.g., simulation-based optimization) approaches have been also used. Hoque and Goyal[94] developed a heuristic solution procedure to determine safety stockin an integrated inventory system under controllable lead-time betweena vendor and a buyer. Srivastav and Agrawal [95] used the multi-objective particle swarm optimization (MOPSO) algorithm to solvetheir multi-objective hybrid backorder inventory model and generatePareto curves. Huang et al. [96] developed an optimization modelto determine the optimal combination of reactive capacity and safetystock to cope with random demand, in order to minimize the total costsrelated to the minimum service-level constraint. Beutel and Minner[97] developed two data-driven frameworks to determine safety stockwhen demand depends on external factors (e.g., prices fluctuations andweather condition).
Zhou and Viswanathan [98] proposed a new method for determin-ing the safety stock under intermittent demand so-called bootstrappingmethod. The authors compared this new method through computa-tional experiments with the parametric method. They concluded thatthe bootstrapping method works better with a large amount of ran-domly generated data. However, the parametric method works betterwith data generated in a real industry environment.
Recently, Trapero et al. [61] and Trapero et al. [62] based on em-pirical methods to deal with safety stock dimensioning issue. Traperoet al. [61] proposed empirical methods based on kernel density esti-mation (non-parametric) and Generalized Autoregressive ConditionalHeteroscedastic (GARCH (1,1)) models (parametric) for calculating thesafety stock levels under standard deviation of the lead time forecasterror. On the other hand, Trapero et al. [62] proposed an optimalcombination of the alternative empirical methods for calculating thesafety stock levels, so that to minimize the piecewise linear loss function(tick loss).
Concerning of safety stock dimensioning in a production systemwith limited/constrained capacity, Altendorfer [99] proposed a modelfor optimizing planning parameters (lot size, safety stock and plannedlead time) for a multi-item single-stage production system with lim-ited capacity. On the other hand, Helber et al. [66], besides copingwith this environment (capacity constrained production system), theyalso concerned with Stochastic Capacitated lot-sizing Problem (SCLSP).They proposed two different approximation models and used a fix-and-optimize algorithm to solve them, in order to determine productionquantities and safety stock.
Other research studies of setting safety stock regarding just-in-time(JIT) production system [100]; joint optimization of responsive supplychain design with inventory and safety stock [105]; inventory manage-ment decision problem with service constraints [106]; serial inventorysystem [108]; periodic review inventory system with lost sales [109]demand-driven materials requirement planning (DDMRP) replenish-ment context [113]; supply chain reliability requirements [111]; re-manufacturing system with production smoothing [112]; cyclic produc-tion schedules [114] have been also conducted.
This section encompasses the problem of safety stock dimensioningunder demand uncertainty and comprises 48 articles (24.87% of thetotal sample) as described in Table 8.
5.1.2. Considering lead time uncertaintyAbdel-Malek et al. [115], Louly and Dolgui [116], Digiesi et al.
[117] and [118] are four studies that address the problem of safetystock dimensioning incorporating the lead time as the uncertaintyfactor (see Table 9). These four studies represent 2.07% of the totalsample considered in this SLR. Abdel-Malek et al. [115] proposed aframework based on Markovian modelling and queueing theory (tan-dem queues and sojourn times) that estimates the safety stock foroutsourcing strategies in the multi-layered supply chain, consideringlead time uncertainty. The authors highlight that in some case, long-
term partnership applies better than competitive bidding/E-bidding
Operations Research Perspectives 8 (2021) 100192J. Barros et al.
Table 8Chronological scientific contributions on safety stock dimensioning under demand uncertainty.
Reference AFa Tb SLMc Main criteria
[100] O G – Min. the expected average cost per period[101] MM ST FR Service level[71] O G – Traditional average cost (set-ups, holding and backlog costs)[91] MM IT ND Safety stock carrying cost; recouped profit[102] O G CSL Min. expected annual total cost[103] O H – –[72] O G – Max. of the annuity stream[73] MM LT, IOA – Min. the average costs or max. of the net present value of production[74] MM LT, IOA – Net present value (the annuity stream)[77] O PLP, ZFP FR Min. of costs[75] S G CSL Total cost, schedule instability and SL[79] S G ND Nr. of stock-outs, stock-out quantity and nr. of replenishments for safety buffers[94] O H – Min. of the total cost, inventory holding and lead-time crashing[87] S ND CSL Min. of the total costs[80] O ND CSL Min. of the total cost[104] S MCS ND Service level[105] O MINLP FR Max. the net present value and min. the expected lead time[81] O LP CSL Min. the overall cost[82] S ND FR Min. total costs (holding & backorder cost)[56] MM IT, PT – –[106] O LP – Lost sales; probability stock-out during LT[98] S ND CSL Total inventory-related cost, average inventory level, fill rate and stock out rate[107] SO SP, IPA FR Min. total inventory holding and shortage costs[78] O G FR Min. the total relevant cost[97] O LP CSL, FR Min. the service level and costs[89] SO G – Min. the expected total costs[92] MM IT ND Service level[108] O H – Min. the total cost[109] MM IT FR Fill rate[83] SO DES, MILP CSL Min. the operational cost[66] O MILP, PLA P Min. the expected costs[84] O MILP CSL Min. the total direct rail car cost and the number of rail car types[76] O ND – Min. the long-run expected costs[110] SO DES, VNS, RSM, OQ FR Service level[95] O MOPSO, MOGA FR Min. the total cost, stockout units and the frequency of stockouts[96] O ND CSL Min. long-run average cost[93] O ND CSL –[90] O ND – Min. the expected cost[111] MM PT – Total cost[112] O NLP – Min. the expected total cost[85] SO DES CSL Min. the inventory holding and rush ordering costs[99] O H ND Min. inventory and backorder costs[86] O ND ND Min. the costs (storage and inventory ordering costs)[113] MM IT CSL Average inventory level and shortage rate[61] S ND CSL –[62] O MCS CSL Min. the tick loss function[88] MM FRV – Min. the crisp equivalent of the expected annual integrated total cost[114] S MCS ND Min. the safety stock and holding costs, and improving the service level
aApproach followed (AF): MM — Mathematical modelling, O — Optimization, S — Simulation, SO — Simulation-based optimization.bTechnique (T): DES — Discrete event simulation, FRV — Fuzzy random variable, G — Generic procedure, H — Heuristics, IOA — Input–output analysis, IPA — Infinitesimalperturbation analysis, IT — Inventory theory, LP — Linear programming, LT — Laplace transformation, MCS — Monte Carlo simulation, MILP — Mixed-integer linearprogramming, MINLP — Mixed-integer nonlinear programming, MOGA — Multi-objective genetic algorithm, MOPSO — Multi-objective particle swarm optimization, NLP —Nonlinear programming, OQ — OptQuest, PLA — Piecewise linear approximation, PLP — Possibility linear programming, PT — Probability theory, RSM — Response surfacemethodology, SP — Stochastic programming, ST — Statistical Theory, VNS — Variable neighbourhood search, ZFP — Zimmermann’s fuzzy programming.cService level measure (SLM): CSL — Cycle service level, FR — Fill rate, ND — Non-disclosed, P — Proposed service level measure.
strategies, inasmuch as the gains achieved in competitive bidding/E-bidding strategies related to the lower price and higher flexibility isdissipated by the increase of the safety stock level, and consequentlythe increase of inventory costs. In the context of single-level just-in-time (JIT) assembly systems, Louly and Dolgui [116] developed a novelapproach based on original lower bound and dominance properties,and a branch and bound algorithm that focus only in determining theoptimal safety stock of components under lead time uncertainty.
Regarding a real-world case study, Digiesi et al. [117] proposed anextension of Sustainable Order Quantity (SOQ) model by consideringlead time uncertainty and external cost of freight transport in orderto identify optimal order quantity, reorder level and safety stock. Aprocedure was also developed to solve this model and applied to a spareparts inventory from the automotive industry.
11
Last but not least, Sellitto [118] developed a method to calculatethe lead-time, inventory and safety stock in a make-to-order (MTO)job-shop manufacturing context.
5.1.3. Considering yield uncertaintyThis section describes the scientific research regarding the problem
of safety stock dimensioning under yield uncertainty. In this subject,there are only 6 articles (3.11% of the total sample considered) whichproposed their models, approaches or frameworks following differentapproaches for solving this problem of safety stock dimensioning (seeTable 10). In the research study of [120], a framework of productionpolicy was developed to determine the required quantity (this is, theoptimal value) of safety stock, production rate and production lotsize to minimize the total expected system costs, considering machinebreakdown as an uncertainty factor.

Operations Research Perspectives 8 (2021) 100192J. Barros et al.
diuibwcptwctmftrpecap
5
obstshlhcooaoda
m
Table 9Chronological scientific contributions on safety stock dimensioning under lead time uncertainty.Reference AFa Tb SLMc Main criteria
[115] S ND ND Annual cost[116] O BB ND Min. the average holding cost[117] O G ND Logistics cost[118] SO ND – –
aApproach followed (AF): O — Optimization, SO — Simulation-based optimization.bTechnique (T): BB — Branch and bound algorithm, G — Generic procedure, ND — Non-disclosed.cService level measure (SLM): CSL — Cycle service level, FR — Fill rate, ND — Non-disclosed.
Table 10Chronological scientific contributions on safety stock dimensioning under yield uncertainty.Reference AFa Tb SLMc Main criteria
[119] MM MC – Min. of the average demand loss/backlog cost[120] MM MC – Min. the total expected system cost[121] O RO, DP ND Max. the profits[122] O ND – Min. the total costs[123] O ND – Min. the costs[124] SO MIP, MCS CSL Max. the total production amount
aApproach followed (AF): MM — Mathematical modelling, O — Optimization, SO — Simulation-based optimization.bTechnique (T): DP — Dynamic programming, MC — Markov chain, MCS — Monte Carlo simulation, MIP — Mixed-integer programming, ND —Non-disclosed, RO — Real options technique.cService level measure (SLM): CSL — Cycle service level, FR — Fill rate, ND — Non-disclosed.
In the context of the manufacturing environment with imperfect/efective products, Taleizadeh et al. [122] proposed an integratednventory model for determining the optimal lot size and productionptime under random machine breakdown. The safety stock was usedn the proposed model to prevent shortages in the case of machinereakdown. Recently, a similar study on manufacturing environmentith defective production was conducted by [123]. The study was
onducted to obtain the optimal safety stock level, optimal controllableroduction rate and the optimal amount of production quality duringhe random machine breakdown under optimum energy consumptionithin the framework of smart production management. A real-world
ase study from the mining sector could be found in [121]. In this study,he authors proposed a new real options method (modified real optionsethod) for determining the safety stock of ore for mining production
rom Kittilä mine. By comparing both this new method and the conven-ional Economic Order Quantity (EOQ) methods, they highlight that theeal options method provides higher accuracy, better profits and robusterformance when procurement costs are changed. Other relevant sci-ntific contributions on safety stock dimensioning in the manufacturingontext or contribution that consider the safety stock dimensionings one of the multiple features for solving production/manufacturingroblems, can be found in [119] and [124].
.1.4. Considering multiple uncertainties and risksSeveral types of research studies have been investigating the issue
f safety stock dimensioning in the MRP system. In [125], a simulation-ased optimization study was proposed to jointly optimize lot-sizes,afety stock and safety lead times considering both demand and lead-ime uncertainty. The author performed a comparison between safetytock and safety lead time in order to determine the best method. Heighlights that both lead time and demand variability influences theevel of optimal safety lead time and optimal safety stock. Furthermore,e also highlights that safety stock method is the best choice in thease of a low level of stockout/inventory holding cost ratio, high levelf demand variability and low level of lead time variability. On thether hand, the safety lead time is the best choice in the case ofhigh level of stockout/inventory holding cost ratio and high level
f demand variability. Still, Guide and Srivastava [126] studied theimensioning of safety stock in the MRP system modified for use inre-manufacturing environment under random demand and lead time.
Besides MRP contexts, studies in the literature focusing on di-ensioning safety stock in Master Production Scheduling (MPS) and
12
Available-To-Promise (ATP) environments can be found in [127] and[128]. Therefore, Campbell [127] proposed a new method so-called‘‘optimal safety stock’’ from two most known methods (constant cycleservice level and constant safety stock) for establishing the safety stockin MPS environment under demand and lead time uncertainties. On theother hand, Hung and Chang [128] considered the lead time and yielduncertainties on their proposed method for ATP environment.
Real-world case studies have been already reported by [129,134,138,141,142] and [143] regarding this issue of safety stock dimen-sioning by considering multiples uncertainties/risks. Thereupon, Tal-luri et al. [129] applied their model for managing the made-to-stockinventories in a multinational pharmaceutical company. They consid-ering both demand and lead time uncertainty. As a result of com-paring this model with existing models, costs benefits were achievedwith the proposed model. Kanet et al. [134] proposed a softwaresystem for production planning so-called Dynamic Planned Safety Stock(DPSS) for planning a time-phased set of safety stock over a planninghorizon. As a result of applying this in industry, significant savingswere achieved. Another real case study was reported by [138], whichaimed to apply optimal safety stocks in nursing workforce manage-ment. Recently, Avci and Selim [141] proposed multi-objective frame-work for supply chain inventory optimization and then developed adecomposition-based multi-objective differential evolution algorithm(MODE/D) for this framework. This aimed to determine supplier flexi-bility and safety stock levels in a real-world multi-national automotivesupply chain. Lastly, Saad et al. [142] developed a mechanism andintegrated with SAP to determine adequate safety stock under therequired service level. After testing the mechanism at Wavim company,the authors highlight that the mechanism should be considered as anew development for the manufacturing industry.
Inderfurth and Vogelgesang [135] proposed an approach for deter-mining dynamic safety stock by considering different yield uncertain-ties and random demand. Besides that, they presented ways to convertthese dynamic safety stocks into static one, in order to be applied easilyin practice. Keskin et al. [136] proposed a mathematical programmingmodel (MILP) to optimize simultaneously production, inventory andbackorder quantities for multi-product, multi-period real-life problemby considering demand and yield uncertainties.
Kumar and Evers [137] proposed an alternative approach to therandom sums approach (traditional approach for determining safetystock). This alternative approach, so-called multiplication approach,

Operations Research Perspectives 8 (2021) 100192J. Barros et al.
b
c
apd
Table 11Chronological scientific contributions on safety stock dimensioning under multiple uncertainties and risks.
Reference URa AFb Tc SLMd Main criteria
[127] D, LT MM IT CSL Total cost[126] D, LT S ND CSL Stock-out percentage; SS level[125] D, LT SO SA ND Total cost[128] Y, LT S LP ND –[129] D, LT MM IT CSL Min. costs and efficiency improvement[130] D, LT O NLP ND Min. total cost[131] D, LT O G CSL, FR Min. expected inventory costs; max. the expected profit[132] D, LT MM IT ND Total logistics costs[133] D, Y MM IT CSL Production, holding and shortage costs[134] D, LT O LP, G FR Min. total inventory and average annual fill rate[135] D, Y S ND FR Min. the backlog and holding costs[136] D, Y O MILP, GrA, GA – Min. the total cost of the production plan; lot sizes[137] D, LT S ND – Min. the total supply chain costs[138] D, LT O ARMA ND –[139] D, Y MM IT CSL Service and inventory level[140] D, Y O H – Min. the inventory costs[141] D, SD SO MODE/D, NSGA-II – Total holding cost; premium freight ratio[142] D, LT O G ND Customer service, inventory and operating cost[64] D, LT S EDS FR Fill rate[143] D, SC S SD FR Expected total cost[144] LT, OC O GA – Expected total cost
aUncertainty or risk (UR): D — Demand, LT — Lead time, OC — Order crossover, SC — Supplier constrains, SD — Supplier delay, Y — Yield.Approach followed (AF): MM — Mathematical modelling, O — Optimization, S — Simulation, SO — Simulation-based optimization.Technique (T): ARMA — Autoregressive moving average, EDS — Event-driven simulations, G — Generic procedure, GA — Genetic algorithm (meta-heuristics), GrA — Greedlgorithm, H — Heuristics, IT — Inventory theory, LP — Linear programming, MODE/D — Multi-objective differential evolution algorithm, ND — Non-disclosed, NLP — Nonlinearrogramming, NSGA-II — Non-dominated sorting genetic algorithm II, SA — Simulated annealing, SD — System dynamics.Service level measure (SLM): CSL — Cycle service level, FR — Fill rate, ND — Non-disclosed.
consider data quality issues, as well as the correlation between demandand lead time (both stochastic) for setting safety stock.
Based on analysis from stochastic inventory control theory, In-derfurth [133] and Lu et al. [139] proposed their research studiesfor different environments. The first author, Inderfurth [133], stud-ied the issue of safety stock dimensioning in the production controlenvironment, more concretely in MRP control systems by taking intoconsideration both demand and yield uncertainty. On the other hand,Lu et al. [139] studied also this issue in construction material envi-ronment, considering non-stationary stochastic demand and randomsupply yield.
In the recent past, Chaturvedi and Martínez-De-Albéniz [140] pro-posed a modelling framework based on queueing and inventory theorythat optimized simultaneously inventory (safety stock), excess capacityand diversification of supply source under yield (supply capacity) anddemand uncertainties. The main objective of this framework was tominimize the inventory costs (holding and shortage costs). The authorsconsidered an infinite-horizon periodic-review inventory model forsolving this problem. Recently, Ben-Ammar et al. [144] studied theproblem of multi-period supply planning. Aiming to solve this prob-lem, a general probabilistic model under random lead-time and ordercrossover was proposed. Then, they developed a genetic algorithm (GA)for this model to determine planned lead-times and safety stock level,by minimizing expected total costs (sum of expected backlogging costand expected inventory holding costs).
This section encompasses the problem of safety stock dimension-ing under multiple uncertainties and risks and comprises 21 articles(10.88% of the total sample) as described in Table 11.
5.2. Safety stock management
Safety stock management is crucial for organizations so that aims tomaintain customer service levels, as well as controlling the costs. Caridiand Cigolini [11] defined safety stock management as ‘‘the managingissue deals with finding the appropriate time for safety stocks replenishmentsand with setting the appropriate delivery dates for replenishments’’. Indeed,the safety stock management intends to answer two main questions:‘‘when to order? And, how to order?’’. To this, there are several models
13
in which answer in a different way to these two questions. The mostknown models are continuous review, periodic review and EconomicOrder Quantity (EOQ) [6].
5.2.1. Considering demand uncertaintyThis section encompasses the problem of safety stock management
under demand uncertainty and comprises 21 articles (10.88% of thetotal sample) as described in Table 12.
The main inventory management models are applied in environ-ments where the demand or supply is random or uncertain. Generically,the studies proposed in the literature takes advantage of this inventorymanagement models considering the demand as a distribution function(e.g., normal, gamma, and other) or as time series forecasting. By con-sidering continuous-review inventory control system under stochasticdemand during lead time, Kim and Benton [145] studied the interrela-tionship between lot size and lead time and their implication on lot sizeand safety stock decisions (how much to order and when). The authorsproposed an interactive algorithm for determining simultaneously thelot size and safety stock and then compared it with a conventionalsequential approach (EOQ). As a result, they concluded that the al-gorithm provides better results in terms of cost savings. On the otherhand, Urban [146] developed an algorithm for solving a periodic-review problem with stochastic, serially correlated and inventory leveldependent demand.
Based on optimization techniques such as Multi-Objective ParticleSwarm Optimization (MOPSO) and Multi-objective electromagnetism-like optimization (MOEMO), Tsou [147] addressed the problem ofmulti-objective inventory control, so that to minimize the expectedtotal cost annually under lost sales. Other optimization-based tech-niques, such as Mixed-integer nonlinear programming (MINLP) andMixed-integer linear programming (MILP) was also used to optimizesimultaneously the safety stock, reserve and base stock levels in tandemwith the material flow in supply chain planning (see, [148]).
Overall in this topic, only two studies report a real-world casestudy (see, [149] and [150]). For instance, You and Grossmann [149]developed a computational framework for simultaneously optimizedthe tank-sizing decisions, safety stock levels and estimated vehicle rout-ing costs. This framework consists of stochastic approximation model(MINLP problem) under random demand.

Operations Research Perspectives 8 (2021) 100192J. Barros et al.
Table 12Chronological scientific contributions on safety stock management under demand uncertainty.Reference AFa Tb SLMc Main criteria
[145] O G CSL –[151] MM IT ND –[152] O G FR Fill rate[153] SO AVM, RL ND Average service level[146] MM IT – Max. the expected profit[154] O NLP ND Min. expected cost; optimal frozen period[155] O H – Min. the expected total cost[147] O MOEMO, MOPSO ND Min. the expected total cost, number of
stockouts and stocked item annually[156] O AA CSL Min. total order and holding cost[149] O MINLP, BR CSL Min. the total expected costs[157] MM IT FR Fixed manufacturing and holding costs[158] O NLP – Min. the total expected inventory costs[159] MM DT CSL Min. the expected inventory costs[150] O H FR Target fill rates[160] O ABC – Safety stock; total inventory cost[60] O SA CSL Total cost[161] SO ND ND Min. inventory holding cost[162] O MINLP FR Min. the costs[148] SO MILP, MINLP CSL Min. transportation and inventory costs[163] O H FR Min. total inventory costs[164] MM ND – Min. expected cost
aApproach followed (AF): MM — Mathematical modelling, O — Optimization.bTechnique (T): AA — Approximation algorithm, ABC — Artificial Bee Colony algorithm, AVM — Action-value method, BR — Branch-and-refinealgorithm, DT — Diffusion theory, G — Generic procedure, H — Heuristics, IT — Inventory theory, MILP — Mixed-integer programming, MINLP— Mixed-integer nonlinear programming, MOEMO — Multi-objective electromagnetism-like optimization, MOPSO — Multi-objective particle swarmoptimization, NLP — Nonlinear programming, ND — Non-disclosed, RL — Reinforcement learning, SA — Simulated annealing.cService level measure (SLM): CSL — Cycle service level, FR — Fill rate, ND — Non-disclosed.
From a different perspective of earlier studies in the literature re-garding safety stock management problem, Hsueh [157] considered inhis research study the product life cycle (introduction, growth, maturityand decline), inventory control and manufacturing/remanufacturingsystem simultaneously. The author studied inventory control policiesduring the Product Life Cycle (PLC) and presented closed-form formulasof optimal lot size, reorder point and safety stock during each phase ofthe PLC. Yue et al. [160] also considered the PLC and inventory controlin their research. They proposed a method so-called Improved ABC-PFbased on PLC theory. A PLC model based on cubic polynomial withtwo stages was developed and then was used Artificial Bee Colony —ABC (machine learning algorithm) to optimize the parameters of thetwo-stage PLC model. The proposed method allows also to determinethe safety stock during each PLC phase and replenishments in order toprevent stockouts.
Some of the research studies dealt with inventory control problem inmulti-echelon supply chain systems. The studies proposed by [153,156]and [163] are some examples. Chu and Shen [156] applied a POT(Power-of-two) policy to multi-echelon stochastic inventory model. Theauthors developed a polynomial-time algorithm to derive a closed-to-optimal POT policy for a given target service level. On the otherhand, Kim et al. [153] proposed two adaptive inventory control model(centralized and decentralized models) under non-stationary demandfor solving the issue in two-echelon supply chain system (one supplierand multiple retailers). The proposed models consider the target servicelevel predefined for each retailer as the main performance criteria.Recently, Sakulsom and Tharmmaphornphilas [163] proposed a heuris-tics for determining an ordering policy in a divergent two-echeloninventory system (single warehouse and N non-identical retailers). Bycomparing this heuristic with MIP models, the authors concluded thatthe heuristic provides goods solutions as MIP models. Based on stockdiffusion theory (SDT), Braglia et al. [159] proposed a dynamic modelfor inventory control under non-stationary demand. The authors usedthe Fokker Planck (FP) equations for obtaining both the time-dependentprobability distribution of the stock consumption and the reorder time.
Braglia et al. [60] focused on safety stock management issue in asingle-vendor single-buyer supply chain context under continuous re-view and Gaussian demand, adopting the PV criterion. They presentedboth approximated and exact algorithms for optimizing the safety stock.
14
Other studies used inventory management models considering de-mand as time series forecasting. Demand forecast has become an essen-tial component in safety stock management. An inaccurate forecast canlead to inventory shortages or even overstocks and also to low customerservice level. Lian et al. [154] dealt with this issue, considering alsothe frozen period. They studied the frozen period in a periodic reviewinventory model considering forecast demands and then developed anon-linear programme so-called order policy (OOP). By comparing theforecast order policy (FOP) model with the proposed OOP models, theyconcluded that both present similar and consistent results, confirmingthe FOP as a very good heuristic order policy and the OOP a goodalternative. Other relevant studies proposed through consecutive effortsby [151,155,158,161,162] and [164].
5.2.2. Considering lead time and yield uncertaintyAs shown in Table 13, there are few studied that address both the
problem of safety stock management considering lead time uncertaintyand considering yield uncertainty, regarding the sample consideredin this SLR. A total of 4 articles (2.07%) address this problem underlead time uncertainty, namely. Louly et al. [165],Chandra and Grabis[166],Wang and Wang [167] and [168]. Cobb [169], is the uniquestudy that considered the yield uncertainty in this topic (0.52% oftotal considered articles). For instance, Louly et al. [165], developeda model and approach of inventory control for a single-level assemblysystem under random component lead times. The authors highlightthat this model could be used for determining safety stock or safetylead time in the MRP context for each component under lead timeuncertainty. Chandra and Grabis [166] proposed a research study onintegrating procurement costs and inventory models by considering thevariable lead-time. Wang and Wang [167], developed a mathematicalmodel and deviation to determine the linkage relationship betweentwo key parameters in inventory management: lead time uncertaintyand safety stock. Focusing on addressing this problem by consideringyield uncertainty, Cobb [169] proposed an integrated inventory controlmodel for the inspection, repair, and purchase of returnable transportitems in a closed-looping supply chain. In this model, the safety stockis determined under uncertain return, so that to buffer the inventory of
used and repairable containers.
Operations Research Perspectives 8 (2021) 100192J. Barros et al.
b
c
d
5
hu[pStOptsddasur(rppp
pi[ddoficphOcb
spu(toeItp
sap
Table 13Chronological scientific contributions on safety stock management under lead time and yield uncertainties.
Reference URa AFb Td SLMc Main criteria
[165] LT O BB ND Min. average holding cost[166] LT O G – Min. total inventory and procurement costs[167] LT MM MD CSL –[168] LT O H – Min. total cost of the supply chain[169] Y MM ND ND Min. expected costs
aUncertainty or risk (UR): LT — Lead time, Y — Yield.Approach followed (AF): MM — Mathematical modelling, O — Optimization, SO — Simulation-based optimization.Technique (T): BB — Branch and bound algorithm, G — Generic procedure, H — Heuristics, MD — Mathematical derivation, ND — Non-disclosed.Service level measure (SLM): CSL — Cycle service level, FR — Fill rate, ND — Non-disclosed.
.2.3. Considering multiple uncertainties and risksIn the literature, many authors addressed different problems in-
erent to safety stock management by considering different types ofncertainties and risks. Based on optimization approaches, Tang et al.170] developed an algorithm using Lagrangian relation for solving theroblem of raw material inventory faced by Shanghai Baoshan Iron andteel Complex (Baosteel) company. The algorithm aims to determinehe fixed order size and fixed interval of the replenishment process.n the other hand, for solving multi-buyer multi-vendor supply chainroblem, Taleizadeh et al. [171] proposed a harmony search algorithmo determine the reorder points, the safety stocks, and the numbers ofhipments and packets in each shipment of the products under randomemand and lead time. Some of these research works have dealt withynamic inventory control policies under non-stationary demand, suchs [172]. The authors developed an approach for the inventory controlystem (focused on a single-stage and single-item inventory system)nder non-stationary demand incurring to the use of forecasts andandom lead-time. It was developed a dynamic periodic re-order pointrk, Q) control policy for controlling the system at the end of everyeview period. This (rk, Q) dynamic policy was evaluated in terms oferformance (service level achieved) and compared to the static (r, Q)olicy. The authors concluded that both policies are similar in terms oferformance.
In the past few years appeared many research studies that integratedricing and inventory models, since pricing decision has become anmportant issue in supply chain management. Here, Zhou and Chao179] studied this issue in a periodic-review inventory system withual supply modes (regular and expedited) in order to mitigate theemand uncertainty under deterministic procurement costs. On thether hand, Xiao et al. [181] focused on the effect of procurementluctuations in the optimal pricing and sourcing policy, providing newnsights related to this impact (namely to the fact that procurementost fluctuation can alter the strategic relationship between dynamicricing and dual sourcing, and the risk-neutral firm can achieve aigher expected profit under a more volatile spot market cost process).ther investigation that considers price sensitive (demand are auto-orrelated and dependent on selling price) in their inventory model cane found in [175].
Zhang et al. [177] proposed an inventory-theory-based intervaltochastic programming (IB-ISP) model for addressing the inventoryroblem in the electric-power generation system, considering demandncertainty (forecast of the electricity demand) and yield uncertaintytransportation problems). The proposed model consists of planninghe resources purchase patterns and electricity generation schemesf the coal-fired plants. By testing the model with real data of realnvironment (Beijing’s electric-power generation system planning), theB-ISP model performed better than the traditional EOQ model, sincehis model can provide effective measures for not-timely coal supplyingattern with reduced system-failure risk.
Recently, an real-world case study in a multi-national automotiveupply chain was reported by [183] as an extension of [141]. Theuthors developed an approach for solving the inventory replenishment
15
roblem with premium freights using simulation-based optimization
techniques. They used the decomposition-based multi-objective differ-ential evolution algorithm (MODE/D) for determining several param-eters, such as demand forecast adjustment factor, safety stock andsupplier flexibility in order to minimize the total holding cost, inboundand outbound premium freight ratios. Another real case study can befound in [176] and [174].
Some research studies have already been proposed in the literaturefocusing on determining the reorder point. Hayya et al. [49] discussedthis issue considering demand uncertainty, lead time uncertainty andorder crossover, where demand and lead time are independently andidentically (iid) random variables. They developed regression equationsfor calculating the optimal cost, optimal order quantity and optimalreorder point. Another research study based on reorder point, but nowconsidering just random demand and random lead time, was proposedby [58]. The authors presented an alternative reorder point model(EVR method) that aimed to determine the safety stock and possibleoutcomes of the replenishment cycle (how much and when to replenishthe inventory) without considered any distributional assumptions.
Other relevant studies proposed through consecutive efforts by[59,173,178,180,182] and [48]. This section encompasses the problemof safety stock management under multiple uncertainties and risksand comprises 18 articles (9.33% of the total sample) as described inTable 14.
5.3. Safety stock allocation, positioning or placement
In the literature, there are several terminologies for the same prob-lem of safety stock placement. Safety stock placement, safety stockallocation and safety stock positioning represent the same problem [12–14]. In this SLR is adopted the terminology safety stock placementto portray this problem. The problem of safety stock placement isconcerned with the question of where to position the safety stock andhow much is needed [12]. Caridi and Cigolini [11] defined safety stockplacement as ‘‘the positioning issue deals with finding the appropriate itemsin the bills of materials where safety stocks are to be placed’’.
The problem of safety stock placement is divided into two mainresearch streams widely studied: safety stock placement for multi-stage or multi-echelon supply chain and supply chain network designwith safety stock placement [184]. The complexity of these safetystock problems is directly related to the structure of the supply chain.There are three main structures, as depicted in Fig. 13: serial network,spanning tree and general acyclic network [14,185]. The assembly(convergent) network and distribution (divergent) network representstwo special cases of spanning tree structure. The divergent networkis represented with a single and central stage and several successors,and the convergent network consists of a one-end stage with severalpredecessors.
The serial network consists of sequential dependencies among sup-ply chain stage, this is, each stage of the supply chain has a singlepredecessor and successor [14,185]. The general acyclic network is acombination of the previous structures [185]. There are two modellingapproaches in multi-stage or multi-echelon safety stock placement:stochastic-service model and guaranteed-service model. The differencebetween these two approaches lies in the way that the replenishment
mechanism between stages in the supply chain is modelled [186].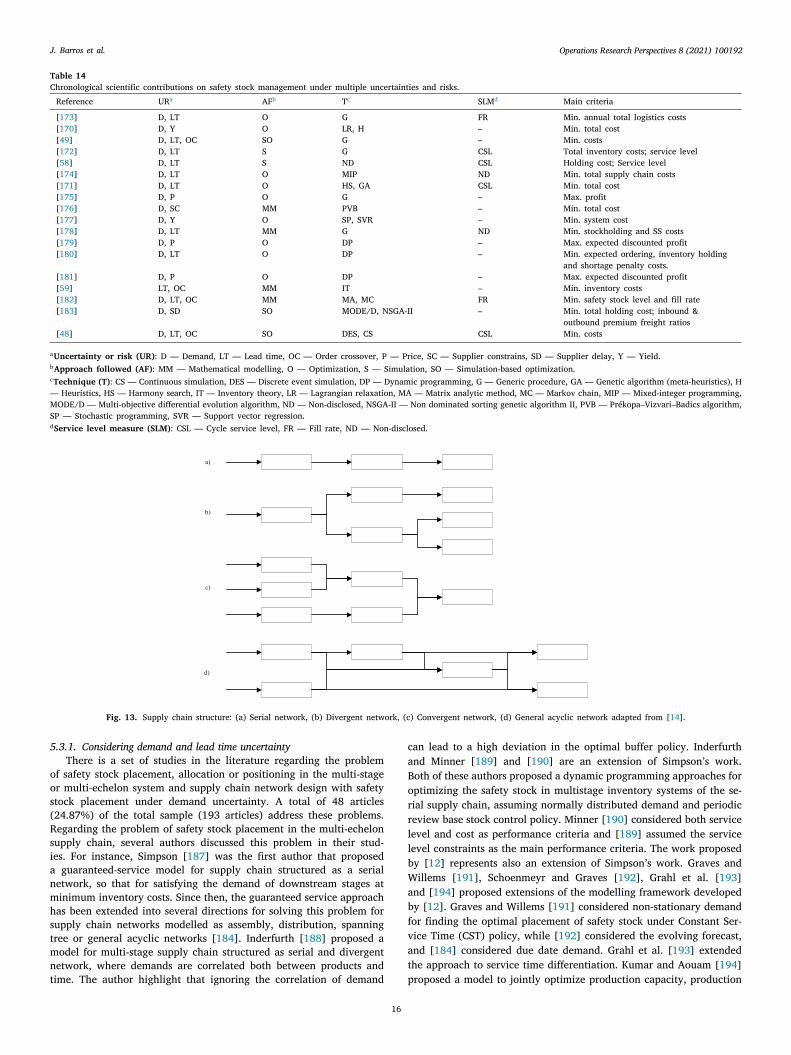
Operations Research Perspectives 8 (2021) 100192J. Barros et al.
b
c
—MSd
5
oos(Rsianmhstmnt
Table 14Chronological scientific contributions on safety stock management under multiple uncertainties and risks.
Reference URa AFb Tc SLMd Main criteria
[173] D, LT O G FR Min. annual total logistics costs[170] D, Y O LR, H – Min. total cost[49] D, LT, OC SO G – Min. costs[172] D, LT S G CSL Total inventory costs; service level[58] D, LT S ND CSL Holding cost; Service level[174] D, LT O MIP ND Min. total supply chain costs[171] D, LT O HS, GA CSL Min. total cost[175] D, P O G – Max. profit[176] D, SC MM PVB – Min. total cost[177] D, Y O SP, SVR – Min. system cost[178] D, LT MM G ND Min. stockholding and SS costs[179] D, P O DP – Max. expected discounted profit[180] D, LT O DP – Min. expected ordering, inventory holding
and shortage penalty costs.[181] D, P O DP – Max. expected discounted profit[59] LT, OC MM IT – Min. inventory costs[182] D, LT, OC MM MA, MC FR Min. safety stock level and fill rate[183] D, SD SO MODE/D, NSGA-II – Min. total holding cost; inbound &
outbound premium freight ratios[48] D, LT, OC SO DES, CS CSL Min. costs
aUncertainty or risk (UR): D — Demand, LT — Lead time, OC — Order crossover, P — Price, SC — Supplier constrains, SD — Supplier delay, Y — Yield.Approach followed (AF): MM — Mathematical modelling, O — Optimization, S — Simulation, SO — Simulation-based optimization.Technique (T): CS — Continuous simulation, DES — Discrete event simulation, DP — Dynamic programming, G — Generic procedure, GA — Genetic algorithm (meta-heuristics), H
Heuristics, HS — Harmony search, IT — Inventory theory, LR — Lagrangian relaxation, MA — Matrix analytic method, MC — Markov chain, MIP — Mixed-integer programming,ODE/D — Multi-objective differential evolution algorithm, ND — Non-disclosed, NSGA-II — Non dominated sorting genetic algorithm II, PVB — Prékopa–Vizvari–Badics algorithm,
P — Stochastic programming, SVR — Support vector regression.Service level measure (SLM): CSL — Cycle service level, FR — Fill rate, ND — Non-disclosed.
Fig. 13. Supply chain structure: (a) Serial network, (b) Divergent network, (c) Convergent network, (d) General acyclic network adapted from [14].
.3.1. Considering demand and lead time uncertaintyThere is a set of studies in the literature regarding the problem
f safety stock placement, allocation or positioning in the multi-stager multi-echelon system and supply chain network design with safetytock placement under demand uncertainty. A total of 48 articles24.87%) of the total sample (193 articles) address these problems.egarding the problem of safety stock placement in the multi-echelonupply chain, several authors discussed this problem in their stud-es. For instance, Simpson [187] was the first author that proposed
guaranteed-service model for supply chain structured as a serialetwork, so that for satisfying the demand of downstream stages atinimum inventory costs. Since then, the guaranteed service approachas been extended into several directions for solving this problem forupply chain networks modelled as assembly, distribution, spanningree or general acyclic networks [184]. Inderfurth [188] proposed aodel for multi-stage supply chain structured as serial and divergentetwork, where demands are correlated both between products andime. The author highlight that ignoring the correlation of demand
16
can lead to a high deviation in the optimal buffer policy. Inderfurthand Minner [189] and [190] are an extension of Simpson’s work.Both of these authors proposed a dynamic programming approaches foroptimizing the safety stock in multistage inventory systems of the se-rial supply chain, assuming normally distributed demand and periodicreview base stock control policy. Minner [190] considered both servicelevel and cost as performance criteria and [189] assumed the servicelevel constraints as the main performance criteria. The work proposedby [12] represents also an extension of Simpson’s work. Graves andWillems [191], Schoenmeyr and Graves [192], Grahl et al. [193]and [194] proposed extensions of the modelling framework developedby [12]. Graves and Willems [191] considered non-stationary demandfor finding the optimal placement of safety stock under Constant Ser-vice Time (CST) policy, while [192] considered the evolving forecast,and [184] considered due date demand. Grahl et al. [193] extendedthe approach to service time differentiation. Kumar and Aouam [194]proposed a model to jointly optimize production capacity, production

Operations Research Perspectives 8 (2021) 100192J. Barros et al.
I
smoothing and service times in a multi-stage supply chain structuredas spanning tree network.
Several of these research studies were applied in real-world con-texts by world-wide recognized companies, such as Intel [195,196],Microsoft and Case New Holland [197], CIFUNSA [198] and Tera-dyne, Inc. Schoenmeyr and Graves [192]. Other examples of real-worldapplications in companies operating in the automotive industry canbe found in [199–201] and [202] is also an example of a real-worldimplementation at an industrial electronics industry.
Manary and Willems [195] developed adjustment procedures for de-termining the appropriate inventory target under demand uncertainty(forecast bias) for solving the problem faced by Intel in their multi-echelon inventory optimization model so-called ‘‘MEIO’’ regarding thepresence of bias in the sales forecast data. Manary et al. [196] extendedthe adjustment procedures developed in [195] considering forecastbias, non-normal forecast errors and forecast error heterogeneity.
Neale and Willems [197] and Schoenmeyr and Graves [192] pro-posed extensions of [12] for incorporating the non-stationary demandand evolving forecast. Moncayo-Martínez and Zhang [198] proposedan extension of the [186] using meta-heuristics algorithms regardingthe cost and lead time minimization of products in the generic bill ofmaterials.
Both [200] and [202] proposed studies for addressing the problemof safety stock placement for the automotive industry. The first studyused meta-heuristics or modern optimization algorithms (swarm intel-ligent algorithms: ant colony and intelligent water drop) and in thesecond study developed a framework.
Other relevant studies proposed through consecutive efforts by[185,203–205] are found in the literature. All these studies aim tooptimize the multi-echelon inventory system under guaranteed serviceapproach.
The problem of supply chain network design with safety stock place-ment represents a classical problem in operational research [184]. Thisconsists to jointly optimize design decisions of the supply chain withsafety stock placement. Studies proposed by [184,198,212,214,217]and [225] address this kind of problem. Yao et al. [214] proposeda mixed-integer nonlinear programming model to address the facilitylocation–allocation and inventory problem. A solution procedure wasdeveloped also to solve the proposed model. You and Grossmann [212]presented a mixed-integer nonlinear programming model for determin-ing the optimal transportation, inventory level and network structurein a multi-echelon supply chain. Liao et al. [217] in its turn, proposed amixed-integer programming model for multi-objective optimization ofthe supply chain network and a multi-objective evolutionary algorithmapproach. This model considers the total cost, customer service level(fill rate) and flexibility as the main performance criteria.
Funaki [184] proposed a multi-echelon safety stock placementmodel in supply chain design under due-date demand and an opti-mization procedure for this model. This multi-echelon safety stockplacement model represents an extension of guaranteed-service modelproposed in [12] and [189]. Moncayo-Martínez and Zhang [198]developed an approach based on the MAX–MIN ant system for solvingsafety stock placement problem in which to minimize the total supplychain cost and product lead time. Other relevant studies regarding theproblem of supply chain network design with safety stock placementcan be found in [13,219] and [232].
Lastly, [149,208,210,211,213,216,218,220,222–224,226–230] and[233] also proposed their model for solving safety stock placementproblem considering demand as uncertainty factor.
Only 0.52% (1 article) address this problem of safety stock place-ment considering uncertain lead-time. Schneider et al. [206] proposedapproximations of two-echelon periodic review inventory model underlead time uncertainty, using the power approximation. Table 15 pro-vides an overview of all articles considered to this topic of safety stockplacement under demand and lead time uncertainty. This overviewincludes the description of the type of uncertainty considered by theauthor, as well as the approach followed and the main performance
17
criteria. t
5.3.2. Considering multiple uncertainties and risksRegarding the problem of safety stock placement for multi-stage
or multi-echelon supply chain, Simchi-Levi and Zhao [235] proposeda framework for evaluating and coordinating inventory policies forsupply chains with three network structures (serial, assembly anddistribution systems) following the stochastic service model approachand considering demand and lead time uncertainties. Each stage ofthis structure controls its inventory with continuous base-stock policy.Osman and Demirli [236] proposed a safety stock placement models(decentralized and centralized) for determining and placing the safetyamounts in a multistage supply chain under demand and lead timeuncertainty. The fill rate and safety stocks at each stage of the supplychain are determined in order to minimize the safety stock placementcosts through the entire supply chain. Unlike studies proposed in [237]and [238] where the guaranteed service model for general acyclicsupply chain was extended considering the demand uncertainty anddeterministic lead time, Humair et al. [239] extended the guaranteedservice model incorporating both demand and lead time uncertainties.The guaranteed service model proposed in [205] applied the studyof [240], but for two-stage serial line supply chain instead for thespanning tree network as considered by these authors. This config-uration model aimed for determining the chosen option (cost andlead time pairing) and inventory stocking level at each stage of thesupply chain under demand and lead time uncertainty. Graves andSchoenmeyr [241] generalized the guaranteed-service model for safetystock placement incorporating the yield (capacity constraints) anddemand uncertainties. Other relevant studies regarding the problemof safety stock placement under multiple uncertainties/risks can befound in [242,243] and [244]. Sonntag and Kiesmüller [242] proposeda model of in-house multi-stage serial production systems with randomyield and demand, in order to calculate the optimal safety stock andpositions of quality inspections through the production stages andoptimize the position of inspections. Woerner et al. [243] developeda simulation-based optimization model for determining the optimalbase stock level of a multi-echelon assembly system under capacityconstraints (yield uncertainty) and uncertain demand. The authorscompared this model with guaranteed service model providing betterresults in terms of reducing costs keeping the same service level. Lastbut not least, De Smet et al. [244] proposed two modelling approaches(extensions of the guaranteed-service models and the stochastic ser-vice model) for multi-echelon inventory optimization problem in adistribution network under lead time and demand uncertainties.
Recently, Schuster Puga et al. [256] addressed a study related to theproblem of supply chain network design with safety stock placement.They formulated a model for two-stage supply chain design for jointlyintegrate the safety stock placement and delivery strategy decisionsconsidering demand and lead time uncertainties, in order to minimizethe costs of transportation, facility opening, cycle inventory, orderingand safety stocks. In this work, the guaranteed-service approach wasused for modelling the safety stock placement decisions.
Other relevant scientific studies regarding this topic of safety stockplacement can be found in [10,207,245–253] and [254]. This topic re-lated to the problems of safety stock placement has been widely studiedby several authors, considering different types of uncertainty factors,performance criteria and following different modelling approaches, asshown in Table 16. Considering the total sample of considered articles(193) to this SLR, 21 of these articles (10.88%) addressed this problem.
6. Literature gaps and research opportunities
Considering the literature analysis described in Section 5, we iden-tify in this section some research gaps. Moreover, research opportuni-ties and a Literature Map2 are also provided.
2 Literature Map is a visual representation of the literature search results.t allows to identify the relationships between research work results and alsoo illustrate the literature gaps [257].

Operations Research Perspectives 8 (2021) 100192J. Barros et al.
c
Table 15Chronological scientific contributions on safety stock allocation, positioning and placement under demand and lead time uncertainties.
Reference URa AFb Tc SLMd Main criteria
[188] D O G CSL Min. expected holding costs[206] LT SO G CSL Min. overall costs[190] D O DP CSL Min. average holding costs[189] D O NLP CSL Min. of costs, service level[207] D O NLP CSL Min. the total cost[208] D O H – Min. the total expected units short[209] D O LP FR Min. of the total cost[199] D O DP CSL Min. inventory levels[195] D O G CSL Units of product[210] D O LR CSL Min. the sum of facility location, transportation, inventory costs[185] D S MCS ND Service level[191] D O DP – Min. safety stock holding costs[211] D O H ND Min. of costs[196] D O G ND Min. production costs, lost-sales costs and deviation cost[197] D O ND CSL Min. safety stock holding cost[192] D O DP ND Min. inventory holding costs[212] D O MINLP CSL Min. total supply chain design cost[213] D O NLP CSL Total cost[214] D O MINLP CSL Min. expected total cost[215] D SO H – Min. lost sales[149] D O MINLP CSL Min. the annualized cost and the maximum GS* times of the markets[216] D O LP ND Max. profits and min. safety stock costs[217] D O MINLP, NSGAII FR Min. total cost, Max. fill rates, responsive level[184] D O DP CSL Min. total costs[218] D O MINLP CSL Min. the total cost over[198] D O ACO, IWD ND Min. total supply chain cost and product lead time[200] D O DP – Min. safety stock cost[203] D O H ND Min. long-run average expected inventory and backorder costs[201] D O DP CSL Min. total safety stock holding cost[219] D O MINLP CSL Min. cost of the supply chain[204] D O DP CSL Minimization of the average total cost[220] D SO G FR Min. transportation and holding costs[193] D O GA CSL Min. total holding costs[202] D O ACO, IWD – Min. inventory cost and lead time[221] D O ND – Min. total safety stock cost[222] D S G Min. holding and backorder cost[223] D O MINLP, H CSL Min. the total annual cost[224] D O CQMIP, H CSL Min. the location, transportation and inventory costs[225] D O MINLP CSL Min. the total cost[226] D O H CSL Min. the total holding cost[227] D O MINLP CSL Min. the facility location, transportation and inventory cost[228] D O PSO, STA ND Min. the overall cost of the SC[229] D O MINLP ND Max. total net profit[230] D SO G FR Min. overall holding costs[13] D SO DP ND Min. system-wide production and inventory costs subject[231] D O DP ND Min. WIP and holding costs; setup time reduction investment[232] D O ND – Min. total costs[233] D O DP – Min. expected total cost[234] D O DP CSL Min. expected total cost
aUncertainty or risk: D — Demand, LT — Lead time.bApproach followed: O — Optimization, S — Simulation, SO — Simulation-based optimization.Technique: ACO — Ant colony optimization (meta-heuristics), CQMIP — Conic quadratic mixed-integer programming, DP — Dynamic programming, G — Generic procedure, GA
— Genetic algorithm (meta-heuristics), H — Heuristics, IWD — Intelligent water drop algorithm (meta-heuristics), LP — Linear programming, LR — Lagrangian relaxation, MCS— Monte Carlo simulation, ND — Non-disclosed, MINLP — Mixed-integer nonlinear programming, NLP — Nonlinear programming, NSGA-II — Non-dominated sorting geneticalgorithm II, PSO — Particle swarm optimization algorithm (meta-heuristics), STA — Spanning tree-based algorithm.dService level measure (SLM): CSL — Cycle service level, FR — Fill rate, ND — Non-disclosed.* GS — Guaranteed service.
Fig. 15 illustrates the Literature Map resulted from this SLR, provid-ing an overview of distinct proposed formulations of the safety stockproblem in the literature. The Literature Map consists of four levelsof iterations. The first level shows the literature gaps identified inthe literature. The second level describes the safety stock problems,namely Safety stock dimensioning, Safety stock management and Safetystock placement (allocation or positioning). The third level describesseveral uncertainties factors and risks associated with the procurementprocess and therefore considered as input to address safety stock relatedproblems, namely Demand uncertainty, Lead-time Uncertainty, Yielduncertainty and Multiple uncertainties and risks. The last level repre-sents different approaches followed, as well as scientific contributionsthat use these same approaches to solve safety stock related problems.
Analysing Fig. 15 we highlight that:
18
• In general, the Optimization approach is the most used to addresssafety stock problem and techniques such as heuristics, dynamicprogramming and mixed-integer nonlinear programming are themost used techniques related to the Optimization approach (asdescribed in Table 7).
• Demand uncertainty is the most common uncertainty factor in theproposed inventory models. On the other hand, there is a lack ofstudies that considered the lead time uncertainty, as well as theyield uncertainty.
• Recent data-driven approaches, such as Business Analytics (BA)and Big Data Analytics (BDA), are producing a strong impactin diverse research fields, including supply chain management.However, BA and BDA has not yet been explored to solve safety
stock related problems.
Operations Research Perspectives 8 (2021) 100192J. Barros et al.
b
c
Table 16Chronological scientific contributions on safety stock allocation, positioning and placement under multiple uncertainties and risks.
Reference URa AFb Tc SLMd Main criteria
[245] D, Y O SP – Min. sum of stockout and holding costs[246] D, LT, SD O NLP CSL Min. total inventory capital[247] D, LT, Y SO H, MCS CSL Min. costs[235] D, LT SO DP, MCS FR Min. inventory cost[248] D, LT O ND ND Total safety stock cost[10] D, Y SO LP, DES ND Min. total expected inventory[249] D, LT SO DES FR Min. components fill rate[250] D, Y O G ND Min. global empty container costs[236] D, LT O BD FR Min. safety stock costs[251] D, LT SO GA, MCS ND Backorders and inventory level[252] D, LT O H ND Nr. of backorders, safety stock level and
lead time variability[239] D, LT O NLP ND Min. inventory costs[253] D, LT, SD O DP – Min. total safety stock and project cost[205] D, LT O ND – Min. total supply chain costs[241] D, Y O DP, H – Min. holding cost[242] D, Y O H CSL Min. overall costs[243] D, Y SO CLM, IPA FR Min. holding costs[254] D, LT S SysD CSL Min. inventory costs[255] D, LT O G ND Min. total cost[256] D, LT O CQMIP CSL Min. overall costs[244] D, LT O G FR, CSL Min. holding, fixed order and operating
flexibility costs
aUncertainty or risk (UR): D — Demand, LT — Lead time, SD — Supplier delay, Y — Yield.Approach followed (AF): O — Optimization, S — Simulation, SO — Simulation-based optimization.Technique: BD — Benders decomposition, CLM — Constrained level method, CQMIP — Conic quadratic mixed-integer programming, DES — Discrete event simulation, DP —
Dynamic programming, G — Generic procedure, GA — Genetic algorithm (meta-heuristics), H — Heuristics, IPA — Infinitesimal perturbation analysis, LP — Linear programming,MCS — Monte Carlo simulation, MINLP — Mixed-integer nonlinear programming, ND — Non-disclosed, NLP — Nonlinear Programming, NLP — Nonlinear programming, SP —Stochastic programming, SysD — System Dynamics.dService level measure (SLM): CSL — Cycle service level, FR — Fill rate, ND — Non-disclosed.
Fig. 14. Distribution of Service level measure adopted.
After conducting a critical literature analyses, described in Sec-tion 5, some research gaps are identified and discussed herein, as wellas the research opportunities:
• Several studies in the literature and leading supply chain books,as well as inventory management software tools, assume that thedemand during the lead time follows a normal distribution. Yet,several authors have already warned that such assumption may beflawed because lead time demand is often skewed (see, [58,106,113]). This statistical assumption can lead to higher service levelthan desired, resulting an overestimation of safety stock and con-sequently higher inventory costs [58]. Hence, in practice, futuredemands must be forecasted based on historical observations.
• The majority of peer-reviewed articles focus on determiningsafety stock/inventory based on statistical parameters (e.g., stan-dard deviation or mean of demand) and simplifications (e.g., dis-tribution of statistical parameters, parameters are known) [15].There is a lack of articles that focus on providing dynamic modelsthat consider the knowledge of future volatility of parameters fordetermining safety stock. More research is needed to explore not
19
only the application of more realistic safety stock closed-formstochastic approaches considering the variation of forecastingerrors rather than the variation of demand, especially in multi-product multi-echelon inventory management settings, but alsoto study the benefits of such safety stock methods in case studieswith practical interest. Moreover, empirical non-parametric ap-proaches for estimating the variability of forecast errors (see, [61,62,258]) could be further exploited using for example businessanalytics techniques. Note that BA and BDA techniques allow theuse of predictive analytics for applying machine learning tech-niques on real data in order to learn or obtain knowledge fromdata and predict future supply chain demand based on historicaland current data. In this context, the prediction capabilities couldbe also optimized using metaheuristics.
• Several methods for calculating safety stock can be found in theliterature based on two main service level measures, namely cycleservice level and fill rate. Although the cycle service level hasbeen criticized for not being relevant from a customer perspectiveand also not recommended for inventory control practice [64,67],it remains the most used in the literature, as illustrated in Fig. 14.Several studies and supply chain books considered the CSL mea-sure because, unlike the FR measure, it is of easy computation.Chopra and Meindl [3],Vandeput [65],Tyworth [259] argued thenecessity of transition from CLS to FR because fill rate is a morerelevant measure.
• The inventory control problem under lead-time uncertainty isnot sufficiently studied, particularly in assembly networks [165].Demand uncertainty is the most considered factor in the liter-ature (see Figs. 7 and 15). Several studies considered constantlead time, which is not realistic for major of supply chain en-vironments due to the unexpected events that can occur caus-ing random delays. These delays may require to incurring thespecial/premium freight so that to avoid stockouts and conse-quently an extra cost for organizations. Moreover, there are fewstudies that address the safety stock problems on MRP environ-ment considering the lead time uncertainty. Herein, empirical
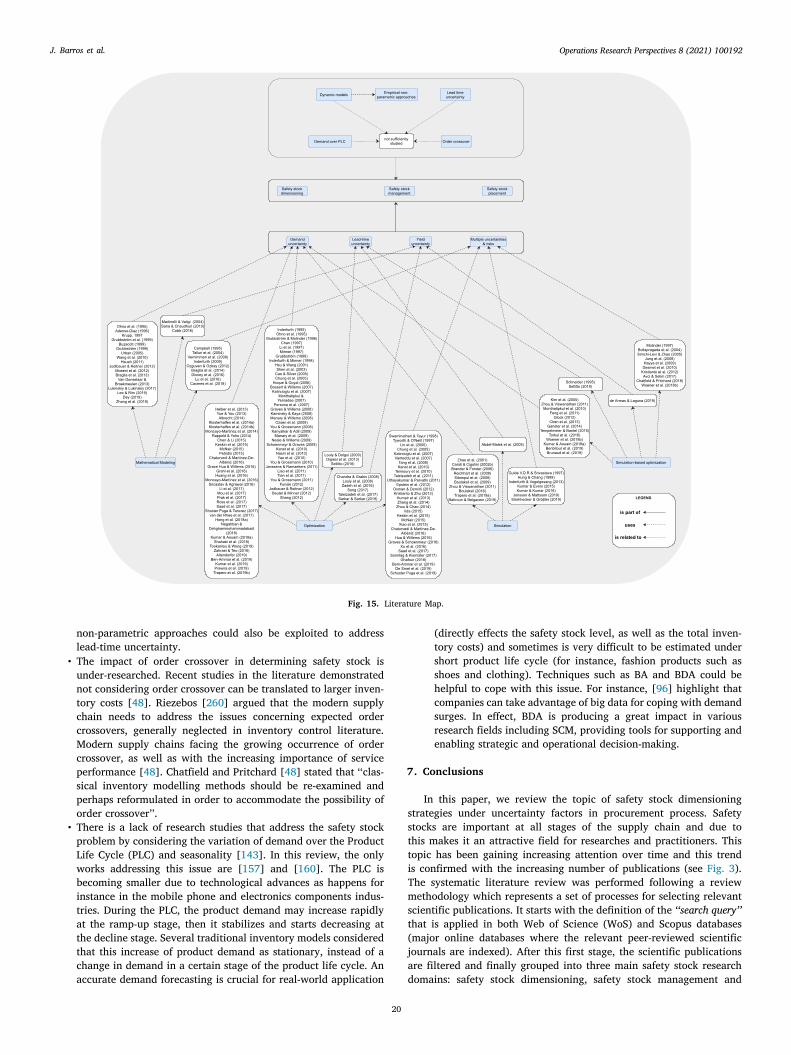
Operations Research Perspectives 8 (2021) 100192J. Barros et al.
Fig. 15. Literature Map.
7
ssttiTmst(jad
non-parametric approaches could also be exploited to addresslead-time uncertainty.
• The impact of order crossover in determining safety stock isunder-researched. Recent studies in the literature demonstratednot considering order crossover can be translated to larger inven-tory costs [48]. Riezebos [260] argued that the modern supplychain needs to address the issues concerning expected ordercrossovers, generally neglected in inventory control literature.Modern supply chains facing the growing occurrence of ordercrossover, as well as with the increasing importance of serviceperformance [48]. Chatfield and Pritchard [48] stated that ‘‘clas-sical inventory modelling methods should be re-examined andperhaps reformulated in order to accommodate the possibility oforder crossover’’.
• There is a lack of research studies that address the safety stockproblem by considering the variation of demand over the ProductLife Cycle (PLC) and seasonality [143]. In this review, the onlyworks addressing this issue are [157] and [160]. The PLC isbecoming smaller due to technological advances as happens forinstance in the mobile phone and electronics components indus-tries. During the PLC, the product demand may increase rapidlyat the ramp-up stage, then it stabilizes and starts decreasing atthe decline stage. Several traditional inventory models consideredthat this increase of product demand as stationary, instead of achange in demand in a certain stage of the product life cycle. Anaccurate demand forecasting is crucial for real-world application
20
(directly effects the safety stock level, as well as the total inven-tory costs) and sometimes is very difficult to be estimated undershort product life cycle (for instance, fashion products such asshoes and clothing). Techniques such as BA and BDA could behelpful to cope with this issue. For instance, [96] highlight thatcompanies can take advantage of big data for coping with demandsurges. In effect, BDA is producing a great impact in variousresearch fields including SCM, providing tools for supporting andenabling strategic and operational decision-making.
. Conclusions
In this paper, we review the topic of safety stock dimensioningtrategies under uncertainty factors in procurement process. Safetytocks are important at all stages of the supply chain and due tohis makes it an attractive field for researches and practitioners. Thisopic has been gaining increasing attention over time and this trends confirmed with the increasing number of publications (see Fig. 3).he systematic literature review was performed following a reviewethodology which represents a set of processes for selecting relevant
cientific publications. It starts with the definition of the ‘‘search query’’hat is applied in both Web of Science (WoS) and Scopus databasesmajor online databases where the relevant peer-reviewed scientificournals are indexed). After this first stage, the scientific publicationsre filtered and finally grouped into three main safety stock researchomains: safety stock dimensioning, safety stock management and

Operations Research Perspectives 8 (2021) 100192J. Barros et al.
pagp
r
Ir4ctpasts
D
ci
A
T2
safety stock allocation or positioning or placement. As a result, a setof 193 scientific publications was selected from 1995 to 2019. A co-occurrence analysis is performed in order to identify research conceptsrelated to the safety stock problem. This review might have limitations,even with a large number of scientific publications analysed (is notdevoid of limitations). Two main limitations are pointed out. Firstly,some of the relevant publication could be non-identified due to the‘‘search query’’ developed in the review methodology. Secondly, weonly considered publications that meet the defined criteria in three‘‘screening criteria’’ of our review methodology (e.g., only consideredeer-reviewed publications while excluding the conference proceedingsnd only considers publication written in English). The current researchaps and research opportunities are identified and discussed so that torovides a road map to guide future research agenda on this topic.
Considering the presented literature review, we highlight severalelevant insights regarding different contexts:
• For the MRP context under both demand and lead time uncer-tainty, the safety stock is the best technique in case of the lowlevel of stockout/inventory holding cost, and also in case of a highlevel of demand variability and low level of lead time variability.On the other hand, safety lead time is the best technique in case ofa high level of stockout/inventory holding cost ratio and in caseof a high level of demand and lead time variability [125];
• For the manufacturing/remanufacturing context under stochasticdemand, should be adopted different inventory control policiesfor different PLC phases (introduction, growth, maturity and de-cline); Moreover, the inventory control policy is not sensitive tothe phase length and the demand changing rate [157];
• Demand uncertainty is the most considered factor for determiningsafety stock in different contexts, in contrast, lead-time uncer-tainty is not sufficiently studied, especially in the MRP environ-ment [165]. Fig. 7 reinforces this statement, showing that demanduncertainty is the most considered uncertainty factor in proposedstudies in the literature;
• There are several factors/parameters that should be considered,such as the PLC, demand uncertainty (demand forecast and fore-cast errors), lead time uncertainty, price fluctuations (e.g., pricefluctuation in the market, discount campaigns, promotions), sea-sonality (sales pattern) and supplier constraints or supply disrup-tions. Considering only basic parameters (e.g., lead time, actualdemand, forecast demand and forecast errors) for calculatingsafety stock is insufficient. The ERP systems widely used bycompanies consider values of these parameters from past data tocalculate the safety stock using statistical formulas.
n conclusion, the safety stock problem is still an interesting topic foresearches and practitioners, since, with the emergence of the industry.0 new challenges have been arisen in all processes of the supplyhain. Although the safety stock is used in inventory managemento deal with demand and supply uncertainties, it does not solve allroblems related to this domain. Other techniques or strategies, suchs buffering (reactive) and redesigning (proactive) can also be used forolving or mitigating inventory management problems, such as safetyime or capacity buffer. The use of these techniques depends on thepecific case study and the context.
eclaration of competing interest
The authors declare that they have no known competing finan-ial interests or personal relationships that could have appeared tonfluence the work reported in this paper.
cknowledgement
This work has been supported by FCT — Fundação para a Ciência eecnologia, Portugal within the R&D Units Project Scope: UIDB/00319/
21
020 and the doctoral scholarship grant: PD/BDE/142895/2018.
References
[1] Kitchenham Barbara. Procedures for performing systematic reviews. Tech. rept.1, Keele University; 2004, p. 33.
[2] Kitchenham Barbara, Pearl Brereton O, Budgen David, Turner Mark,Bailey John, Linkman Stephen. Systematic literature reviews in soft-ware engineering - A systematic literature review. Inf Softw Technol2009;51(1):7–15.
[3] Chopra Sunil, Meindl Peter. Supply chain management: Strategy, planning, andoperation. Person Education Limited; 2016, p. 541.
[4] Council of Supply Chain Management Professional - CSCMP. Supply chainmanagement concepts. In: Council of supply chain management professional.2013, p. 1.
[5] Balfaqih Hasan, Nopiah Zulkifli Mohd, Saibani Nizaroyani, Al-Nory Malak T.Review of supply chain performance measurement systems: 1998–2015. ComputInd 2016;82:135–50.
[6] Carvalho José Crespo, Guedes Acibídes Paulo, Arantes Amílcar José Martins,Martins Ana Lúcia, Póvoa Ana Paula Barbosa, Luís Cristina Alves, et al. Logísticae Gestão da Cadeia de Abastecimento. 2nd ed. Edições Sílabo, Lda; 2017, p.722.
[7] Trkman Peter, McCormack Kevin, De Oliveira Marcos Paulo Valadares,Ladeira Marcelo Bronzo. The impact of business analytics on supply chainperformance. Decis Support Syst 2010;49(3):318–27.
[8] Yu Y, Xiong W, Cao Y. A conceptual model of supply chain risk mitigation: Therole of supply chain integration and organizational risk propensity. J Coast Res2015;95–8.
[9] Chang C Alec. The interchangeability of safety stocks and safety lead time. JOper Manage 1985;6(1):35–42.
[10] Jung JY, Blau G, Pekny JF, Reklaitis GV, Eversdyk D. Integrated safetystock management for multi-stage supply chains under production capacityconstraints. Comput Chem Eng 2008;32(11):2570–81.
[11] Caridi M, Cigolini R. Improving materials management effectiveness: A steptowards agile enterprise. Int J Phys Distrib Logist Manage 2002;32(7):556–76.
[12] Graves SC, Willems SP. Optimizing strategic safety stock placement in supplychains. Manuf Serv Oper Manag 2000;2(1):68–83.
[13] Kumar K, Aouam T. Integrated lot sizing and safety stock placement in anetwork of production facilities. Int J Prod Econ 2018;195:74–95.
[14] Li Haitao, Jiang Dali. New model and heuristics for safety stock placement ingeneral acyclic supply chain networks. Comput Oper Res 2012;39(7):1333–44.
[15] Schmidt Matthias, Hartmann Wiebke, Nyhuis Peter. Simulation based com-parison of safety-stock calculation methods. CIRP Ann - Manuf Technol2012;61(1):403–6.
[16] Eruguz Ayse Sena, Sahin Evren, Jemai Zied, Dallery Yves. A comprehensivesurvey of guaranteed-service models for multi-echelon inventory optimization.Int J Prod Econ 2016;172:110–25.
[17] Lambert Douglas M, Stock James R, Ellram Lisa M. Fundamentals of logisticsmanagement. 1st ed. Gary Burke; 1998, p. 622.
[18] Monczka Robert M, Handfield Robert B, Giunipero Larry C, Patterson James L,Waters Donald. Purchasing & supply chain management. Cengage LearningEMEA; 2010, p. 511.
[19] Council of Supply Chain Management Professional - CSCMP. CSCMP supplychain management definitions and glossary. In: Professionals, Council of SupplyChain Management. 2013, p. 1.
[20] Rushton Alan, Croucher Phil, Baker Peter. The handbook of logistics anddistribution management. 5th ed. Kogan Page Limited; 2014, p. 721.
[21] Sanders Nada R. Supply chain management: A global perspective. John Wiley& Sons, Inc; 2012, p. 428.
[22] Colicchia Claudia, Strozzi Fernanda. Supply chain risk management: Anew methodology for a systematic literature review. Supply Chain Manag.2012;17(4):403–18.
[23] Sydow J, Frenkel SJ. Labor, risk, and uncertainty in global supply networks -exploratory insights. J Bus Logist 2013;34(3):236–47.
[24] Knight Frank H. Risk, uncertainty, and profit. Boston: Houghton Mifflin; 1921,p. 388.
[25] Manuj I, Mentzer JT. Global supply chain risk management strategies. Int JPhys Distrib Logist Manag 2008;38(3):192–223.
[26] Rao Shashank, Goldsby Thomas J. Supply chain risks: A review and typology.Int J Logist Manage 2009;20(1):97–123.
[27] Baryannis George, Validi Sahar, Dani Samir, Antoniou Grigoris. Supply chainrisk management and artificial intelligence: state of the art and future researchdirections. Int J Prod Res 2019;57(7):2179–202.
[28] Ho W, Zheng T, Yildiz H, Talluri S. Supply chain risk management: A literaturereview. Int J Prod Res 2015;53(16):5031–69.
[29] March James G, Shapira Zur. Managerial perspectives on risk and risk taking.Manage Sci 1987;33(1):1404–18.
[30] Society Royal. Risk : Analysis, perception and management. London: The RoyalSociety; 1992.
[31] Mitchell Vincent-Wayne W. Organizational risk perception and reduction: A
literature review. Br J Manage 1995;6(2):115–33.
Operations Research Perspectives 8 (2021) 100192J. Barros et al.
[32] Harland Christine, Brenchley Richard, Walker Helen. Risk in supply networks.J Purch Supply Manag 2003;9(2):51–62.
[33] Christopher Martin. Understanding supply chain risk : A self-assessment work-book. Bedford,: Cranfield University, Cranfield School of Management, Centrefor Logistics and Supply Chain Management; 2003, p. 54.
[34] Jüttner U, Peck H, Christopher M. Supply chain risk management: Outlining anagenda for future research. Int J Logist: Res Appl 2003;6(4):197–210.
[35] Zsidisin George A. Managerial perceptions of supply risk. J Supply Chain Manag2003;39(4):14–26.
[36] Peck H. Reconciling supply chain vulnerability, risk and supply chainmanagement. Int J Logist Res Appl 2006;9(2):127–42.
[37] Tang Christopher S. Perspectives in supply chain risk management. Int J ProdEcon 2006;103(2):451–88.
[38] Disney SM, Farasyn I, Lambrecht M, Towill DR, de Velde WV. Taming thebullwhip effect whilst watching customer service in a single supply chainechelon. European J Oper Res 2006;173(1):151–72.
[39] Hong Zhen, Lee CKM, Zhang Linda. Procurement risk management underuncertainty: a review. Ind Manag Data Syst 2018;118(7):1547–74.
[40] Ho Chin-Fu, Tai Yi-Ming, Tai Yi-Ming, Chi Yen-Ping. A structural ap-proach to measuring uncertainty in supply chains. Int J Electron Commer2018;9(3):91–114.
[41] Angkiriwang Reina, Pujawan I Nyoman, Santosa Budi. Managing uncertaintythrough supply chain flexibility: reactive vs. proactive approaches. Prod ManufRes 2014;2(1):50–70.
[42] Nenni ME, Schiraldi MM. Validating virtual safety stock effectiveness throughsimulation. Int J Eng Bus Manage 2013;5(1).
[43] Choi Tsan Ming, Govindan Kannan, Li Xiang, Li Yongjian. Innovative supplychain optimization models with multiple uncertainty factors. Ann Oper Res2017;257(1–2):1–14.
[44] Baily Peter, Farmer David, Crocker Barry, Jessop David, Jones David. Pro-curement: Principles and Management. 5th ed. Edition, Eleventh; 2015, p.611.
[45] Tinani Khimya S, Kandpal Deepa H. Literature review on supply uncertaintyproblems: Yield uncertainty and supply disruption. J Indian Soc Probab Stat2017;18(2):89–109.
[46] He Bo, Huang He, Yuan Kaifu. The comparison of two procurement strategiesin the presence of supply disruption. Comput Ind Eng 2015;85:296–305.
[47] Bradley James R, Robinson Lawrence W. Improved base-stock approximationsfor independent stochastic lead times with order crossover. Manuf Serv OperManag 2005;7(4):319–29.
[48] Chatfield Dean C, Pritchard Alan M. Crossover aware base stock decisions forservice-driven systems. Transp Res E 2018;114:312–30.
[49] Hayya Jack C, Harrison Terry P, Chatfield Dean C. A solution for the intractableinventory model when both demand and lead time are stochastic. Int J ProdEcon 2009;122(2):595–605.
[50] Srivastav Achin, Agrawal Sunil. On a single item single stage mixture inventorymodels with independent stochastic lead times. Oper Res 2018;1–39.
[51] Van Kampen Tim J, Van Donk Dirk Pieter, Van Der Zee Durk Jouke D-J. Safetystock or safety lead time: Coping with unreliability in demand and supply. IntJ Prod Res 2010;48(24):7463–81.
[52] Yamazaki T, Shida K, Kanazawa T. An approach to establishing a method forcalculating inventory. Int J Prod Res 2016;54(8):2320–31.
[53] Alicke Knut. Planung Und Betrieb Von Logistiknetzwerken. 2nd ed. Berlin:Springer-Verlag Berlin Heidelberg; 2005, p. 350.
[54] Herrmann Frank. Operative Planung in IT-Systemen FÜR Die Produktionspla-nung Und -Steuerung. 1st ed. Wiesbaden: Vieweg+Teubner Verlag; 2011, p.349.
[55] Gudehus Timm. Dynamische disposition. 3rd ed. Berlin: Springer-Verlag BerlinHeidelberg; 2012, p. 283.
[56] Wang P, Zinn W, Croxton KL. Sizing inventory when lead time and demandare correlated. Prod Oper Manage 2010;19(4):480–4.
[57] Clark Charles E. Mathematical analysis of an inventory case. Oper Res1957;5(5):627–43.
[58] Ruiz-Torres AJ, Mahmoodi F. Safety stock determination based on parametriclead time and demand information. Int J Prod Res 2010;48(10):2841–57.
[59] Disney Stephen M, Maltz Arnold, Wang Xun, Warburton Roger DHH. Inventorymanagement for stochastic lead times with order crossovers. European J OperRes 2016;248(2):473–86.
[60] Braglia M, Castellano D, Frosolini M. A novel approach to safety stockmanagement in a coordinated supply chain with controllable lead time usingpresent value. Appl Stoch Models Bus Ind 2016;32(1):99–112.
[61] Trapero JR, Cardós M, Kourentzes N. Empirical safety stock estimation basedon kernel and GARCH models. Omega (United Kingdom) 2019;84:199–211.
[62] Trapero JR, Cardós M, Kourentzes N. Quantile forecast optimal combination toenhance safety stock estimation. Int J Forecast 2019;35(1):239–50.
[63] Coleman BJ. Determining the correct service level target. Prod. InventoryManage. J. 2000;41(1):19–23, cited By 10.
[64] Jonsson P, Mattsson S-A. An inherent differentiation and system level assess-ment approach to inventory management: A safety stock method comparison.Int J Logist Manag 2019;30(2):663–80.
22
[65] Vandeput N. Inventory optimization: Models and simulations. De Gruyter; 2020,p. 1–292, cited By 0.
[66] Helber S, Sahling F, Schimmelpfeng K. Dynamic capacitated lot sizing withrandom demand and dynamic safety stocks. OR Spectrum 2013;35(1):75–105.
[67] Axsäter Sven. Inventory control. International series in operations research &management science, vol. 225, Cham: Springer International Publishing; 2015.
[68] Mongeon Philippe, Paul-Hus Adèle. The journal coverage of web of science andscopus: a comparative analysis. Scientometrics 2016;106(1):213–28.
[69] Fahimnia Behnam, Tang Christopher S, Davarzani Hoda, Sarkis Joseph. Quanti-tative models for managing supply chain risks: A review. European J Oper Res2015;247(1):1–15.
[70] van Eck Nees Jan, Waltman Ludo. Software survey: Vosviewer, a computerprogram for bibliometric mapping. Scientometrics 2010;84(2):523–38.
[71] Grubbström RW, Molinder A. Safety production plans in MRP-systems1 usingtransform methodology. Int J Prod Econ 1996;46–47:297–309.
[72] Grubbström RW. A net present value approach to safety stocks in plannedproduction. Int J Prod Econ 1998;56–57:213–29.
[73] Grubbström RW, Tang O, Grubbstrom RW, Tang O. Further developments onsafety stocks in an MRP system applying Laplace transforms and input-outputanalysis. Int J Prod Econ 1999;60:381–7.
[74] Grubbström RW. Net present value approach to safety stocks in a multi-levelMRP system. Int J Prod Econ 1999;59(1):361–75.
[75] Zhao XD, Lai F, Lee TS. Evaluation of safety stock methods in mul-tilevel material requirements planning (MRP) systems. Prod Plan Control2001;12(8):794–803.
[76] Rappold JA, Yoho KD. Setting safety stocks for stable rotation cycle schedules.Int J Prod Econ 2014;156:146–58.
[77] Hsu H-M, Wang W-P. Possibilistic programming in production planning ofassemble-to-order environments. Fuzzy Sets and Systems 2001;119(1):59–70.
[78] Jodlbauer H, Reitner S. Optimizing service-level and relevant cost fora stochastic multi-item cyclic production system. Int J Prod Econ2012;136(2):306–17.
[79] Caridi M, Cigolini R. Managing safety and strategic stocks to improve materialsrequirements planning performance. Proc Inst Mech Eng B 2002;216(7):1061–5.
[80] Persona A, Battini D, Manzini R, Pareschi A. Optimal safety stock lev-els of subassemblies and manufacturing components. Int J Prod Econ2007;110(1–2):147–59.
[81] Kanyalkar AP, Adil GK. Determining the optimum safety stock under rollingschedules for capacitated multi-item production systems. Int J Serv Oper Manag2009;5(4):498–519.
[82] Boulaksil Y, Fransoo JC, Van Halm ENG. Setting safety stocks in multi-stageinventory systems under rolling horizon mathematical programming models.OR Spectrum 2009;31(1):121–40.
[83] Chen Y, Pekny JF, Reklaitis GV. Integrated planning and optimization ofclinical trial supply chain system with risk pooling. Ind Eng Chem Res2013;52(1):152–65.
[84] Klosterhalfen ST, Kallrath J, Fischer G. Rail car fleet design: Optimization ofstructure and size. Int J Prod Econ 2014;157(1):112–9.
[85] Benbitour Mohammed Hichame, Sahin Evren, Dallery Yves. The use ofrush deliveries in periodic review assemble-to-order systems. Int J Prod Res2019;57(13):4078–97.
[86] Prawira AY, Yuliani ENS, Iridiastadi H. Proposed inventory strategy of NSRmaterial in Cikarang-Indonesia oil and gas: Services company. Jordan J MechInd Eng 2019;12(3):179–88.
[87] Brander P, Forsberg R. Determination of safety stocks for cyclic schedules withstochastic demands. Int J Prod Econ 2006;104(2):271–95.
[88] Dey O. A fuzzy random integrated inventory model with imperfect productionunder optimal vendor investment. Oper Res 2019;19(1):101–15.
[89] Glock Christoph H. Lead time reduction strategies in a single-vendor-single-buyer integrated inventory model with lot size-dependent lead times andstochastic demand. Int J Prod Econ 2012;136(1):37–44.
[90] Mou Q, Cheng Y, Liao H. A note on ‘‘lead time reduction strategies in a single-vendor-single-buyer integrated inventory model with lot size-dependent leadtimes and stochastic demand’’. Int J Prod Econ 2017;193:827–31.
[91] Krupp JAG. Safety stock management. Prod Inventory Manage J 1997;38(3):11–8.
[92] Moeeni F, Replogle S, Chaudhury Z, Syamil A. A refinement of the classicalorder point model. Int J Inf Syst Supply Chain Manage 2012;5(3):43–57.
[93] Prak Dennis, Teunter Ruud, Syntetos Aris. On the calculation of safety stockswhen demand is forecasted. European J Oper Res 2017;256(2):454–61.
[94] Hoque MA, Goyal SK. A heuristic solution procedure for an integrated inven-tory system under controllable lead-time with equal or unequal sized batchshipments between a vendor and a buyer. Int J Prod Econ 2006;102(2):217–25.
[95] Srivastav A, Agrawal S. Multi-objective optimization of hybrid backorderinventory model. Expert Syst Appl 2016;51:76–84.
[96] Huang L, Song J-S, Tong J. Supply chain planning for random demand surges:Reactive capacity and safety stock. Manuf Serv Oper Manag 2016;18(4):509–24.
[97] Beutel A-L, Minner S. Safety stock planning under causal demand forecasting.Int J Prod Econ 2012;140(2):637–45.

Operations Research Perspectives 8 (2021) 100192J. Barros et al.
[98] Zhou C, Viswanathan S. Comparison of a new bootstrapping method withparametric approaches for safety stock determination in service parts inventorysystems. Int J Prod Econ 2011;133(1):481–5.
[99] Altendorfer K. Effect of limited capacity on optimal planning parametersfor a multi-item production system with setup times and advance demandinformation. Int J Prod Res 2019;57(6):1892–913.
[100] Ohno K, Nakashima K, Kojima M. Optimal numbers of two kinds of kanbansin a JIT production system. Int J Prod Res 1995;33(5):1387–401.
[101] Adenso-Diaz B. How many units will be short when stockout occurs?. Int JOper Prod Manag 1996;16(4):112–&.
[102] Li C-L, Erlebacher SJ, Kropp DH. Investment in setup cost, lead time, anddemand predictability improvement in the EOQ model. Prod Oper Manage1997;6(4):341–52.
[103] Chan GH. Eyeballing heuristics for dynamic lot sizing problems with rollinghorizons. Comput Oper Res 1997;24(4):379–85.
[104] Reichhart A, Framinan JM, Holweg M. On the link between inventoryand responsiveness in multi-product supply chains. Internat J Systems Sci2008;39(7):677–88.
[105] You F, Grossmann IE. Design of responsive supply chains under demanduncertainty. Comput Chem Eng 2008;32(12):3090–111.
[106] Janssens GK, Ramaekers KM. A linear programming formulation for an inven-tory management decision problem with a service constraint. Expert Syst Appl2011;38(7):7929–34.
[107] Feng K, Rao US, Raturi A. Setting planned orders in master productionscheduling under demand uncertainty. Int J Prod Res 2011;49(13):4007–25.
[108] Shang KH. Single-stage approximations for optimal policies in serial in-ventory systems with nonstationary demand. Manuf Serv Oper Manag2012;14(3):414–22.
[109] Van Donselaar KH, Broekmeulen RACM. Determination of safety stocks in alost sales inventory system with periodic review, positive lead-time, lot-sizingand a target fill rate. Int J Prod Econ 2013;143(2):440–8.
[110] Gansterer M, Almeder C, Hartl RF. Simulation-based optimization methods forsetting production planning parameters. Int J Prod Econ 2014;151:206–13.
[111] Lukinskiy V, Lukinskiy V. Evaluation of stock management strategies reliabilityat dependent demand. Transp Telecommun 2017;18(1):60–9.
[112] Zahraei SM, Teo C-C. Optimizing a recover-and-assemble remanufacturingsystem with production smoothing. Int J Prod Econ 2018;197:330–41.
[113] Lee C-J, Rim S-C. A mathematical safety stock model for DDMRP inventoryreplenishment. Math Probl Eng 2019;2019.
[114] Bahroun Zied, Belgacem Nidhal. Determination of dynamic safety stocks forcyclic production schedules. Oper Manag Res 2019;12(1–2):62–93.
[115] Abdel-Malek L, Kullpattaranirun T, Nanthavanij S. A framework for compar-ing outsourcing strategies in multi-layered supply chains. Int J Prod Econ2005;97(3):318–28.
[116] Louly M-AOMohamed Aly Ould, Dolgui Alexandre. Calculating safety stocks forassembly systems with random component procurement lead times: A branchand bound algorithm. European J Oper Res 2009;199(3):723–31.
[117] Digiesi S, Mossa G, Mummolo G. Supply lead time uncertainty in a sustainableorder quantity inventory model. Manag Prod Eng Rev 2013;4(4):15–27.
[118] Sellitto MA. Lead-time, inventory, and safety stock calculation in job-shopmanufacturing. Acta Polytech 2018;58(6):395–401.
[119] Martinelli F, Valigi P. Hedging point policies remain optimal under limitedbacklog and inventory space. IEEE Trans Automat Control 2004;49(10):1863–9.
[120] Sana SS, Chaudhuri K. An EMQ model in an imperfect production process.Internat J Systems Sci 2010;41(6):635–46.
[121] Song Z. Determination of inventory for mining production with a real optionsapproach and comparison with other classic methods. Int J Min ReclamatEnviron 2017;31(5):346–63.
[122] Taleizadeh AA, Samimi H, Sarkar B, Mohammadi B. Stochastic machinebreakdown and discrete delivery in an imperfect inventory-production system.J Ind Manag Optim 2017;13(3):1511–35.
[123] Sarkar Mitali, Sarkar Biswajit. Optimization of safety stock under controllableproduction rate and energy consumption in an automated smart productionmanagement. Energies 2019;12(11).
[124] de Armas J, Laguna M. Parallel machine, capacitated lot-sizing and schedulingfor the pipe-insulation industry. Int J Prod Res 2019.
[125] Molinder A. Joint optimization of lot-sizes, safety stocks and safety lead timesin an MRP system. Int J Prod Res 1997;35(4):983–94.
[126] Guide Jr, Srivastava R. Buffering from material recovery uncertainty in arecoverable manufacturing environment. J Oper Res Soc 1997;48(5):519–29.
[127] Campbell GM. Establishing safety stocks for master production schedules. ProdPlan Control 1995;6(5):404–12.
[128] Hung Yi Feng, Chang Ching Bin. Determining safety stocks for productionplanning in uncertain manufacturing. Int J Prod Econ 1999;58(2):199–208.
[129] Talluri S, Cetin K, Gardner AJ. Integrating demand and supply variability intosafety stock evaluations. Int J Phys Distrib Logist Manage 2004;34(1):62–9.
[130] Chung SH, Kang HY, Pearn WL. A service level model for the control waferssafety inventory problem. Int J Adv Manuf Technol 2005;26(5–6):591–7.
[131] Katircioglu K, Brown T, Asghar M. An SQL-based cost-effective inventoryoptimization solution. IBM J Res Dev 2007;51(3–4):433–45.
23
[132] Vernimmen B, Dullaert W, Willemé P, Witlox F. Using the inventory-theoreticframework to determine cost-minimizing supply strategies in a stochasticsetting. Int J Prod Econ 2008;115(1):248–59.
[133] Inderfurth Karl. How to protect against demand and yield risks in MRP systems.Int J Prod Econ 2009;121(2):474–81.
[134] Kanet JJ, Gorman MF, Stosslein M. Dynamic planned safety stocks in supplynetworks. Int J Prod Res 2010;48(22):6859–80.
[135] Inderfurth Karl, Vogelgesang Stephanie. Concepts for safety stock determinationunder stochastic demand and different types of random production yield.European J Oper Res 2013;224(2):293–301.
[136] Keskin Gulsen Aydin, Omurca Sevinc Ilhan, Aydin Nursen, Ekinci Ekin.A comparative study of production-inventory model for determining ef-fective production quantity and safety stock level. Appl Math Model2015;39(20):6359–74.
[137] Kumar Anupam, Evers Philip T. Setting safety stock based on imprecise records.Int J Prod Econ 2015;169:68–75.
[138] McNair DS. Enhancing nursing staffing forecasting with safety stock over leadtime modeling. Nurs Adm Q 2015;39(4):291–6.
[139] Lu Hui, Wang Hongwei, Xie Yong, Li Heng. Construction material safety-stockdetermination under nonstationary stochastic demand and random supply yield.IEEE Trans Eng Manage 2016;63(2):201–12.
[140] Chaturvedi A, Martínez-De-Albéniz V. Safety stock, excess capacity or diversi-fication: Trade-offs under supply and demand uncertainty. Prod Oper Manage2016;25(1):77–95.
[141] Avci MG, Selim H. A multi-objective, simulation-based optimization frameworkfor supply chains with premium freights. Expert Syst Appl 2017;67:95–106.
[142] Saad SM, Merino Perez CD, Vega Alvarado VE. Development of a mechanismto facilitate the safety stock planning configuration in ERP. Prod Manuf Res2017;5(1):42–56.
[143] Strohhecker J, Größler A. Threshold behavior of optimal safety stock coveragein the presence of extended production disruptions. J Model Manage 2019.
[144] Ben-Ammar O, Bettayeb B, Dolgui A. Optimization of multi-period supplyplanning under stochastic lead times and a dynamic demand. Int J Prod Econ2019;218:106–17.
[145] Kim JS, Benton WC. Lot size dependent lead times in a Q, R inventory system.Int J Prod Res 1995;33(1):41–58.
[146] Urban TL. A periodic-review model with serially-correlated, inventory-level-dependent demand. Int J Prod Econ 2005;95(3):287–95.
[147] Tsou C-S. Evolutionary Pareto optimizers for continuous review stochasticinventory systems. European J Oper Res 2009;195(2):364–71.
[148] Brunaud B, Laínez-Aguirre JM, Pinto JM, Grossmann IE. Inventory poli-cies and safety stock optimization for supply chain planning. AIChE J2019;65(1):99–112.
[149] You F, Grossmann IE. Balancing responsiveness and economics in pro-cess supply chain design with multi-echelon stochastic inventory. AIChE J2011;57(1):178–92.
[150] Berling P, Marklund J. Multi-echelon inventory control: An adjusted nor-mal demand model for implementation in practice. Int J Prod Res2014;52(11):3331–47.
[151] Buzacott JA. Dynamic inventory targets revisited. J Oper Res Soc1999;50(7):697–703.
[152] Kim JS, Shin KY, Ahn SE. A multiple replenishment contract with ARIMAdemand processes. J Oper Res Soc 2003;54(11):1189–97.
[153] Kim CO, Jun J, Baek JK, Smith RL, Kim YD. Adaptive inventory con-trol models for supply chain management. Int J Adv Manuf Technol2005;26(9–10):1184–92.
[154] Lian Z, Deshmukh A, Wang J. The optimal frozen period in a dynamicproduction model. Int J Prod Econ 2006;103(2):648–55.
[155] Wang Tong, Toktay Beril L. Inventory management with advance demandinformation and flexible delivery. Manage Sci 2008;54(4):716–32.
[156] Chu LY, Shen Z-JM. A power-of-two ordering policy for one-warehousemultiretailer systems with stochastic demand. Oper Res 2010;58(2):492–502.
[157] Hsueh C-F. An inventory control model with consideration of remanufacturingand product life cycle. Int J Prod Econ 2011;133(2):645–52.
[158] Yang M-F, Lo M-C. Considering single-vendor and multiple-buyers integratedsupply chain inventory model with lead time reductiong. Proc Inst Mech EngB 2011;225(5):747–59.
[159] Braglia M, Gabbrielli R, Zammori F. Stock diffusion theory: A dynamic modelfor inventory control. Int J Prod Res 2013;51(10):3018–36.
[160] Yue L, Wangwei J, Jianguo Z, Junjun G, Jiazhou Z, Aiping J. Product life cyclebased demand forecasting by using artificial bee colony algorithm optimizedtwo-stage polynomial fitting. In: Li K. Xiao Z, editor. J Intell Fuzzy Systems2016;31(2):825–36.
[161] Torkul O, Yı lmaz R, Selvi İH, Cesur MR. A real-time inventory model to managevariance of demand for decreasing inventory holding cost. Comput Ind Eng2016;102:435–9.
[162] Turgut Ö, Taube F, Minner S. Data-driven retail inventory management withbackroom effect. OR Spectrum 2018;40(4):945–68.
[163] Sakulsom Noppadon, Tharmmaphornphilas Wipawee. Heuristics for a periodic-review policy in a two-echelon inventory problem with seasonal demand.Comput Ind Eng 2019;133:292–302.

Operations Research Perspectives 8 (2021) 100192J. Barros et al.
[164] Zhang P, Yan H, Pang KW. Inventory sharing strategy for disposable medicalitems between two hospitals. Sustainability (Switzerland) 2019;11(22).
[165] Louly Mohamed Aly, Dolgui Alexandre, Hnaien Faicel. Supply planning forsingle-level assembly system with stochastic component delivery times andservice-level constraint. Int J Prod Econ 2008;115(1):236–47.
[166] Chandra C, Grabis J. Inventory management with variable lead-time dependentprocurement cost. Omega 2008;36(5):877–87.
[167] Wang H, Wang Z. Reasearch on the real linkage effect between key parametersin inventory management. J Appl Sci 2013;13(18):3752–6.
[168] Zadeh Amir Hassan, Sharda Ramesh, Kasiri Narges. Inventory record inaccuracydue to theft in production-inventory systems. Int J Adv Manuf Technol2016;83(1–4):623–31.
[169] Cobb BR. Inventory control for returnable transport items in a closed-loopsupply chain. Transp Res E 2016;86:53–68.
[170] Tang L, Liu G, Liu J. Raw material inventory solution in iron and steel industryusing Lagrangian relaxation. J Oper Res Soc 2008;59(1):44–53.
[171] Taleizadeh AA, Niaki STA, Barzinpour F. Multiple-buyer multiple-vendormulti-product multi-constraint supply chain problem with stochastic demandand variable lead-time: A harmony search algorithm. Appl Math Comput2011;217(22):9234–53.
[172] Babai MZ, Syntetos AA, Dallery Y, Nikolopoulos K. Dynamic re-order point in-ventory control with lead-time uncertainty: analysis and empirical investigation.Int J Prod Res 2009;47(9):2461–83.
[173] Tyworth JE, O’Neill L. Robustness of the normal approximation of lead-timedemand in a distribution setting. Nav Res Logist 1997;44(2):165–86.
[174] Teimoury E, Modarres M, Ghasemzadeh F, Fathi M. A queueing approach toproduction-inventory planning for supply chain with uncertain demands: Casestudy of PAKSHOO chemicals company. J Manuf Syst 2010;29(2–3):55–62.
[175] Uthayakumar R, Parvathi P. Inventory model with pricing tactics for demandin auto-correlated products. Int J Adv Manuf Technol 2011;52(5–8):833–40.
[176] Ozguven E, Ozbay K. Case study-based evaluation of stochastic multicommodityemergency inventory management model. Transp Res Rec 2012;(2283):12–24.
[177] Zhang ZL, Li YP, Huang GH. An inventory-theory-based interval stochasticprogramming method and its application to Beijing’s electric-power systemplanning. Int J Electr Power Energy Syst 2014;62:429–40.
[178] Braglia M, Castellano D, Frosolini M. Safety stock management in single vendor-single buyer problem under VMI with consignment stock agreement. Int J ProdEcon 2014;154:16–31.
[179] Zhou SX, Chao X. Dynamic pricing and inventory management with regularand expedited supplies. Prod Oper Manage 2014;23(1):65–80.
[180] Iida Tetsuo. Benefits of leadtime information and of its combination withdemand forecast information. Int J Prod Econ 2015;163:146–56.
[181] Xiao G, Yang N, Zhang R. Dynamic pricing and inventory management underfluctuating procurement costs. Manuf Serv Oper Manag 2015;17(3):321–34.
[182] Caceres H, Yu D, Nikolaev A. Evaluating shortfall distributions in periodicinventory systems with stochastic endogenous demands and lead-times. AnnOper Res 2018;271(2):405–27.
[183] Avci MG, Selim H. A multi-objective simulation-based optimization approach forinventory replenishment problem with premium freights in convergent supplychains. Omega (United Kingdom) 2018;80:153–65.
[184] Funaki K. Strategic safety stock placement in supply chain design with due-datebased demand. Int J Prod Econ 2012;135(1):4–13.
[185] Sitompul C, Aghezzaf E-H, Dullaert W, Van Landeghem H. Safetystock placement problem in capacitated supply chains. Int J Prod Res2008;46(17):4709–27.
[186] Graves Stephen C, Willems Sean P. Supply chain design: Safety stock place-ment and supply chain configuration. In: Supply chain management: Design,coordination and operation. Handbooks in operations research and managementscience, vol. 11, Elsevier; 2003, p. 95–132.
[187] Simpson Kenneth F. In-process inventories. Oper Res 1958;6(6):791–908.[188] Inderfurth K. Multi-stage safety stock planning with item demands correlated
across products and through time. Prod Oper Manage 1995;4(2):127–44.[189] Inderfurth K, Minner S. Safety stocks in multi-stage inventory systems under
different service measures. European J Oper Res 1998;106(1):57–73.[190] Minner S. Dynamic programming algorithms for multi-stage safety stock
optimization. OR Spectrum 1997;19(4):261–71.[191] Graves SC, Willems SP. Strategic inventory placement in supply chains:
Nonstationary demand. Manuf Serv Oper Manag 2008;10(2):278–87.[192] Schoenmeyr T, Graves SC. Strategic safety stocks in supply chains with evolving
forecasts. Manuf Serv Oper Manag 2009;11(4):657–73.[193] Grahl J, Minner S, Dittmar D. Meta-heuristics for placing strategic safety stock
in multi-echelon inventory with differentiated service times. Ann Oper Res2016;242(2):489–504.
[194] Kumar Kunal, Aouam Tarik. Extending the strategic safety stock placementmodel to consider tactical production smoothing. European J Oper Res2019;279(2):429–48.
[195] Manary MP, Willems SP. Setting safety-stock targets at intel in the presence offorecast bias. Interfaces 2008;38(2):112–22.
[196] Manary MP, Willems SP, Shihata AF. Correcting heterogeneous and bi-ased forecast error at intel for supply chain optimization. Interfaces2009;39(5):415–27.
24
[197] Neale JJ, Willems SP. Managing inventory in supply chains with nonstationarydemand. Interfaces 2009;39(5):388–99.
[198] Moncayo-Martínez Luis A, Zhang David Z. Optimising safety stock placementand lead time in an assembly supply chain using bi-objective MAX-min antsystem. Int J Prod Econ 2013;145(1):18–28.
[199] Bossert JM, Willems SP. A periodic-review modeling approach for guaranteedservice supply chains. Interfaces 2007;37(5):420–35.
[200] Moncayo-Martinez LA, Resendiz-Flores EO, Mercado D, Sanchez-Ramirez C.Placing safety stock in logistic networks under guaranteed-service time inven-tory models: An application to the automotive industry. J Appl Res Technol2014;12(3):538–50.
[201] Klosterhalfen ST, Minner S, Willems SP. Strategic safety stock placementin supply networks with static dual supply. Manuf Serv Oper Manag2014;16(2):204–19.
[202] Moncayo-Martínez Luis A, Ramírez-López Adán, Recio Gustavo. Managinginventory levels and time to market in assembly supply chains by swarmintelligence algorithms. Int J Adv Manuf Technol 2016;82(1–4):419–33.
[203] Albrecht M. Determining near optimal base-stock levels in two-stage generalinventory systems. European J Oper Res 2014;232(2):342–9.
[204] Chen H, Li P. Optimization of (R, Q) policies for serial inventory systems usingthe guaranteed service approach. Comput Ind Eng 2015;80:261–73.
[205] Hua N Grace, Willems Sean P. Optimally configuring a two-stage serialline supply chain under the guaranteed service model. Int J Prod Econ2016;181:98–106.
[206] Schneider H, Rinks DB, Kelle P. Power approximations for a two-echeloninventory system using service levels. Prod Oper Manage 1995;4(4):381–400.
[207] Shen Z-JM, Coullard C, Daskin MS. A joint location-inventory model. TranspSci 2003;37(1):40–55.
[208] Cao D-B, Silver EA. A dynamic allocation heuristic for centralized safety stock.Nav Res Logist 2005;52(6):513–26.
[209] Monthatipkul Chumpol, Yenradee Pisal. Positioning safety stock in aone-warehouse multi-retailer supply chain controlled by optimal inven-tory/distribution plan. Int J Ind Eng - Theory Appl Pract 2007;14(2):169–78.
[210] Ozsen L, Coullard CR, Daskin MS. Capacitated warehouse location model withrisk pooling. Nav Res Logist 2008;55(4):295–312.
[211] Kaminsky Philip, Kaya Onur. Inventory positioning, scheduling and lead-timequotation in supply chains. Int J Prod Econ 2008;114(1):276–93.
[212] You Fengqi, Grossmann Ignacio E. Integrated multi-echelon supply chain designwith inventories under uncertainty: MINLP models, computational strategies.AIChE J 2010;56(2):419–40.
[213] Nasiri GR, Davoudpour H, Karimi B. The impact of integrated analysis on supplychain management: A coordinated approach for inventory control policy. SupplyChain Manage 2010;15(4):277–89.
[214] Yao Z, Lee LH, Jaruphongsa W, Tan V, Hui CF. Multi-source fa-cility location-allocation and inventory problem. European J Oper Res2010;207(2):750–62.
[215] Monthatipkul C, Das S, Yenradee P. Distribution policy in an M-store regionalsupply chain. Int J Integr Supply Manage 2010;5(3):214–38.
[216] Tian Feng, Willems Sean P, Kempf Karl G. An iterative approach to item-level tactical production and inventory planning. Int J Prod Econ 2011;133(1,SI):439–50.
[217] Liao S, Hsieh C, Lin Y. A multi-objective evolutionary optimization ap-proach for an integrated location-inventory distribution network problem undervendor-managed inventory systems. Ann Oper Res 2011;186(1):213–29.
[218] Yue D, You F. Planning and scheduling of flexible process networks underuncertainty with stochastic inventory: MINLP models and algorithm. AIChE J2013;59(5):1511–32.
[219] Petridis K. Optimal design of multi-echelon supply chain networks undernormally distributed demand. Ann Oper Res 2015;227(1):63–91.
[220] Tempelmeier H, Bantel O. Integrated optimization of safety stock andtransportation capacity. European J Oper Res 2015;247(1):101–12.
[221] Grace Hua N, Willems SP. Analytical insights into two-stage serial line supplychain safety stock. Int J Prod Econ 2016;181:107–12.
[222] Boulaksil Y. Safety stock placement in supply chains with demand forecastupdates. Oper Res Perspect 2016;3:27–31.
[223] Ross Anthony, Khajehnezhad Milad, Otieno Wilkistar, Aydas Osman. Integratedlocation-inventory modelling under forward and reverse product flows in theused merchandise retail sector: A multi-echelon formulation. European J OperRes 2017;259(2):664–76.
[224] Schuster Puga M, Tancrez J-S. A heuristic algorithm for solving largelocation–inventory problems with demand uncertainty. European J Oper Res2017;259(2):413–23.
[225] Li S, Li X, Zhang D, Zhou L. Joint optimization of distribution network designand two-echelon inventory control with stochastic demand and CO2 emissiontax charges. PLoS One 2017;12(1).
[226] van der Rhee B, Schmidt GM, Tsai W. Hold safety inventory before, at, or afterthe fan-out point?. Prod Oper Manage 2017;26(5):817–35.
[227] Shahabi Mehrdad, Tafreshian Amirmahdi, Unnikrishnan Avinash,Boyles Stephen D. Joint production-inventory-location problem withmulti-variate normal demand. Transp Res B 2018;110:60–78.

Operations Research Perspectives 8 (2021) 100192J. Barros et al.
[228] Hong Z, Dai W, Luh H, Yang C. Optimal configuration of a green product supplychain with guaranteed service time and emission constraints. European J OperRes 2018;266(2):663–77.
[229] Negahban A, Dehghanimohammadabadi M. Optimizing the supply chain config-uration and production-sales policies for new products over multiple planninghorizons. Int J Prod Econ 2018;196:150–62.
[230] Woerner Stefan, Laumanns Marco, Wagner Stephan M. Joint optimisation ofcapacity and safety stock allocation. Int J Prod Res 2018;56(13):4612–28.
[231] Kumar K, Aouam T. Effect of setup time reduction on supply chain safety stocks.J Manuf Syst 2018;49:1–15.
[232] Fichtinger J, Chan CW-C, Yates N. A joint network design and multi-echeloninventory optimisation approach for supply chain segmentation. Int J Prod Econ2019;209:103–11.
[233] Tookanlou PB, Wong H. Determining the optimal customization levels, leadtimes, and inventory positioning in vertical product differentiation. Int J ProdEcon 2019.
[234] Kumar M, Garg D, Agarwal A. Cause and effect analysis of inventorymanagement in leagile supply chain. J Manage Inf Decis Sci 2019;22(2):67–100.
[235] Simchi-Levi D, Zhao Y. Safety stock positioning in supply chains with stochasticlead times. Manuf Serv Oper Manag 2005;7(4):295–318.
[236] Osman H, Demirli K. Integrated safety stock optimization for multiplesourced stockpoints facing variable demand and lead time. Int J Prod Econ2012;135(1):299–307.
[237] Humair S, Willems SP. Optimizing strategic safety stock placement in generalacyclic networks. Oper Res 2011;59(3):781–7.
[238] Willems Sean P. Real-world multiechelon supply chains used for inventoryoptimization. Manuf Serv Oper Manag 2008;10(1):19–23.
[239] Humair S, Ruark JD, Tomlin B, Willems SP. Incorporating stochastic leadtimes into the guaranteed service model of safety stock optimization. Interfaces2013;43(5):421–34.
[240] Graves Stephen C, Willems Sean P. Optimizing the supply chain configurationfor new products. Manage Sci 2005;51(8):1165–80.
[241] Graves SC, Schoenmeyr T. Strategic safety-stock placement in supply chainswith capacity constraints. Manuf Serv Oper Manag 2016;18(3):445–60.
[242] Sonntag Danja, Kiesmüller Gudrun P. The influence of quality inspections onthe optimal safety stock level. Prod Oper Manage 2017;26(7):1284–98.
[243] Woerner Stefan, Laumanns Marco, Wagner Stephan M. Simulation-based opti-mization of capacitated assembly systems under beta-service level constraints.Decisi Sci 2018;49(1):180–217.
[244] De Smet Niels, Aghezzaf El-Houssaine, Desmet Bram. Optimising installation(R,Q) policies in distribution networks with stochastic lead times: a compar-ative analysis of guaranteed- and stochastic service models. Int J Prod Res2019;57(13):4148–65.
25
[245] Swaminathan JM, Tayur SR. Managing broader product lines through delayeddifferentiation using vanilla boxes. Manage Sci 1998;44(12, 2):S161–72.
[246] Lin GY, Breitwieser R, Cheng F, Eagen JT, Ettl M. Product hardware complexityand its impact on inventory and customer on-time delivery. Int J Flexible ManufSyst 2000;12(2–3):145–63.
[247] Bollapragada R, Rao US, Zhang J. Managing inventory and supply performancein assembly systems with random supply capacity and demand. Manage Sci2004;50(12):1729–43.
[248] Vanteddu G, Chinnam RB, Yang K, Gushikin O. Supply chain focus dependentsafety stock placement. Int J Flexible Manuf Syst 2007;19(4):463–85.
[249] Desmet B, Aghezzaf E-H, Vanmaele H. A normal approximation model forsafety stock optimization in a two-echelon distribution system. J Oper Res Soc2010;61(1):156–63.
[250] Epstein R, Neely A, Weintraub A, Valenzuela F, Hurtado S, Gonzalez G, et al. Astrategic empty container logistics optimization in a major shipping company.Interfaces 2012;42(1):5–16.
[251] Kristianto Yohanes, Gunasekaran Angappa, Helo Petri, Sandhu Maqsood. Adecision support system for integrating manufacturing and product designinto the reconfiguration of the supply chain networks. Decis Support Syst2012;52(4):790–801.
[252] Kristianto Y, Zhu L. An integration of assembly planning by design into supplychain planning. Int J Adv Manuf Technol 2013;69(5–8):1593–604.
[253] Xu Xin, Zhao Yao, Chen Ching-Yu. Project-driven supply chains: integratingsafety-stock and crashing decisions for recurrent projects. Ann Oper Res2016;241(1–2):225–47.
[254] Kumar D, Kumar D. Managing the essential medicines stock at rural healthcaresystems in India. Int J Health Care Qual Assur 2018;31(8):950–65.
[255] Ghafour KM. Optimising safety stocks and reorder points when the demand andthe lead-time are probabilistic in cement manufacturing. Int J Procure Manag2018;11(3):387–98.
[256] Schuster Puga M, Minner S, Tancrez J-S. Two-stage supply chain design withsafety stock placement decisions. Int J Prod Econ 2019;209:183–93.
[257] Altinay L, Paraskevas A. Planning research in hospitality and tourism. Elsevier;2007, p. 1–247, cited By 10.
[258] Gon calves JNC, Cortez P, Carvalho MS, Frazão NM. A multivariate approachfor multi-step demand forecasting in assembly industries: Empirical evidencefrom an automotive supply chain. Decis Support Syst 2021;142. cited By 0.
[259] Tyworth John E. Modeling transportation-inventory trade-offs in stochasticsetting. J Bus Logist 1992;(2):97–127.
[260] Riezebos J. Inventory order crossovers. Int J Prod Econ 2006;104(2):666–75,cited By 44.
Copyright © 2022 FDOKUMEN