eServGlobal - London Stock Exchange
21
eServGlobal LSE: ESG London Stock Exchange, AIM market ASX: ESV Australian Stock Exchange 25 August 2009
-
Upload
khangminh22 -
Category
Documents
-
view
0 -
download
0
Transcript of eServGlobal - London Stock Exchange

eServGlobal
LSE: ESGLondon Stock Exchange, AIM market
ASX: ESVAustralian Stock Exchange
25 August 2009

Our Role in Essence
�� Telephone companies run complex communications networks
which connect and manage billions of phone calls instantly.
� Intelligent Network (“IN”) software enables the network itself to
provide “value added services” to telephone users in addition to
“making and receiving” calls. We develop, implement and support
this “real time” value-add software.
� eServGlobal specialises in both charging and payments
� Re-charging the balance of a pre-paid mobile phone
� Charging for calls, services and data
� Mobile payments -national and international remittance
� Global IN market valued at US$5billion

eServGlobal provides exposure to…
Software revolution
Telcos compete through promotions & services
Require ability to create personalised offerings
The developing world
World’s highest telecom growth rates
Middle East / Asia / Africa / Latin Am.
In developing world, Telcos are the new banks
Charging and recharge drive their cash flow
Big, sticky customers
Payments revolution
� Our revenue: 77% Middle East / Asia
� Our revenue: 72% Charging & Recharge
� Our revenue: 100% software & related services
� Our customers: 100% telephone operators
Replacing network systems is high risk
Ongoing support annuities in all cases

Product Portfolio
An integrated range of charging and payment solutions:
Built on a network-independent, open and real-time architecture.

FY09 Operational Summary
The key factors which affected our FY09 operational result were:
� The Global Recession, resulting in telecom operators deferring infrastructure capacity investment via headroom reductions
� The distraction due to acquisition discussions and due diligence
� The time consuming personnel reduction process due to complex and convoluted employment regulations
� A lack of high quality sales qualification
� A poorly timed increase in both sales and geographic headcount
Our response to these issues have been:
� The introduction of a new management team (CEO,COO,CTO)
� A 13% reduction in headcount (greater than 100 staff)
� The continuation of cost control measures for the foreseeable future
� A laser focus on new business opportunities

FY09 Financial Summary
EBITDA (before non-recurring) $ 2430
The non-operational adjustments which impacted our financial result were:� Employee reduction restructuring charges $ -7691
� Amortisation arising from 2005 acquisition $ -7783
� Goodwill impairment $-12501
Sub Total $-27975
� Depreciation $ -3284
� Interest $ -262
Operating Result $-29091
Tax Analysis:
� Prima Facie Tax Benefit ($29091 x 30%) $ 8727
� Non-deductible costs $ -1014
� Impairment loss $-3549
� French withholding tax write-offs $-2544
� Provision against potential tax benefits $-8105
� Research tax credits + non-assessable income $ 1270
� Adjustments $ -220
Total Tax $ -5435
Loss After Tax $-34526
� Minority Interest $ 218
Net Loss $-34744
A$000’s
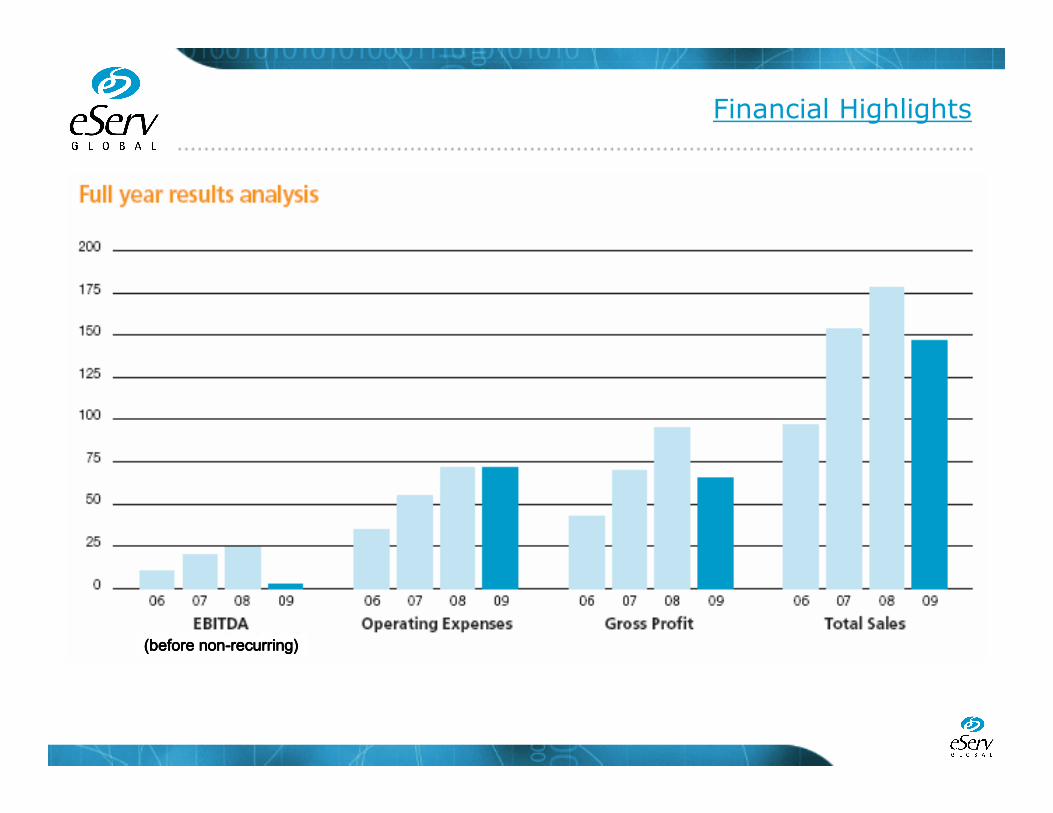
Financial Highlights
(before non(before non(before non(before non----recurring)recurring)recurring)recurring)

p. 8 | Copyright © 2007 eServGlobal. All rights reserved.
FY09 Results

FY09 Balance Sheet
Note Consolidated Company 2009
$’000
2008 $’000
2009 $’000
2008 $’000
Current assets
Cash and cash equivalents 28 (a) 14,135 18,288 11,948 9,626
Trade and other receivables 8 63,493 80,120 12,682 8,493
Inventories 10 623 1,456 - -
Current tax receivables 4 7,368 5,555 - -
Total current assets 85,619 105,419 24,630 18,119
Non-current assets
Trade and other receivables 11 - 5,077 53,389 63,189
Other financial assets 12 - - 38,432 38,432
Property, plant and equipment 13 4,891 5,855 83 85
Goodwill 14 35,483 46,804 - -
Other intangible assets 15 20,383 22,544 - -
Deferred tax assets 4 2,929 6,715 485 675
Total non-current assets 63,686 86,995 92,389 102,381
Total assets 149,305 192,414 117,019 120,500
Current liabilities
Trade and other payables 16 31,963 46,164 742 1,128
Current tax payables 4 930 86 - -
Provisions 17 5,562 5,346 155 128
Other 18 7,219 7,432 2,262 62
Total current liabilities 45,674 59,028 3,159 1,318
Non-current liabilities
Deferred tax liabilities 4 8,040 8,510 390 207
Provisions 17 537 1,331 - -
Total non-current liabilities 8,577 9,841 390 207
Total liabilities 54,251 68,869 3,549 1,525
Net assets 95,054 123,545 113,470 118,975
Equity
Issued capital 19 123,946 115,325 123,946 115,325
Reserves 20 4,411 1,638 1,088 1,042
(Accumulated losses)/retained earnings 21 (33,338) 6,536 (11,564) 2,608
Equity attributable to equity holders of the parent
95,019 123,499 113,470 118,975
Minority interest 35 46 - -
Total equity 95,054 123,545 113,470 118,975

FY09 Cash Flow
Note Consolidated Company 2009
$’000
2008 $’000
2009 $’000
2008 $’000
Cash flows from operating activities Receipts from customers 159,013 176,215 9,113 3,583 Payments to suppliers and employees (165,926) (153,173) (7,219) (7,605) Interest and other costs of finance paid (262) (400) - (1) Income tax (paid)/refunded 5,081 (10,008) (386) (242) Net cash (used in)/provided by operating activities
28(c) (2,094) 12,634 1,508 (4,265)
Cash flows from investing activities Interest received 271 196 228 170 Payment for property, plant and equipment 13 (2,159) (4,184) (54) (59) Software development costs 15 (4,035) - - - Net cash (used in)/provided by investing activities
(5,923) (3,988) 174 111
Cash flows from financing activities Proceeds from issues of equity securities 19 8,460 228 8,460 228 Loans repaid from / (advanced to) subsidiaries
- - (2,689) 15,868
Dividends paid 23 (5,131) (3,408) (5,131) (3,408) Net cash (used in)/provided by financing activities
3,329 (3,180) 640 12,688
Net increase/(decrease) in cash held (4,688) 5,466 2,322 8,534 Cash and cash equivalents at the beginning of the financial year
18,288 12,528 9,626 1,092
Effects of exchange rate changes on the balance of cash held in foreign currencies
535 294 - -
Cash and cash equivalents at the end of the financial year
28(a) 14,135 18,288 11,948 9,626

Metrics FY07 to FY09
0% 5% 10% 15% 20% 25% 30% 35% 40% 45% 50%
Recharge
ChargingMax
Messaging
IN Services
Support
FY09
FY08
FY07
0% 5% 10% 15% 20% 25% 30% 35% 40% 45%
Licence
Development
Prof Services
3rd Party
Support
FY09
FY08
FY07
0% 10% 20% 30% 40% 50% 60% 70%
Middle East
Asia
Europe
Africa
Latin America
FY09
FY08
FY07

FY10: Key Operational Changes
� Get closer to our customers
� Sharpen our focus on new business opportunities and “commit”to them
� Align the product roadmaps with our customers requirements
� Ensure the majority of focus is directed towards the products with unique value propositions and early market acceptance.
� Introduce a license compliance and support sales team.
� Increase and improve the quality of our business partner network.
� Build upon the introduction of the new back office systems whichwere introduced on the 1st of July 2009
� Do the simple things better, faster and with more discipline

eServGlobal Strategy
� Adding value around the transaction
� Ensuring operator engagement with the new subscriber is dynamic (SRM, instant loyalty bonus, 100% mobile-centric transactions)
� End-to-End payments offering
� from national payments and peer-to-peer transfers to international money remittances
� Any account to any account
� mobile wallet (“m-wallet”) to be managed by the telco - bank account, debit/credit card or telco prepaid account
� Open and interoperable
� No financial network dependency, open adapters to all m-wallets

Telecoms Market

Mobile Telecoms: Subscriber Growth
.
Growth of Mobile Connections & Teledensity
100
110
120
130
140
150
160
170
2008 2009 2010 2011 2012 2013
Year
Mo
bil
e c
on
ne
cti
on
sB
as
e u
nit
: 2
00
8 =
10
0
Global Emerging AP Africa Teledensity
60
70
80
Glo
ba
l Te
led
en
sity
(%)
Teledensity♦
♦right hand scale
100
‘Emerging AP’ = Asia Pacific, excluding OECD nations, China and India Data source: Ovum, Dec 2008
()growth Global
7.42% CAGRGlobal
7.42% CAGRAfrica
9% CAGREmerging AP10% CAGR
Teledensity
from 59% to 80%
(6.28% CAGR)

Mobile Payment in Emerging Markets
� The World Bank estimates 3.5 billion people currently lack access to financial services
� Across developing countries 1 billion people have a mobile phone but no bank account. This figure will grow to 1.7 billion in 2012.
� Informa forecasts mobile payments and mobile banking transactions to represent $862.3 billion in 2013
� Juniper Research forecast formal and informal international remittances could exceed $750 billion by 2013. Mobile money transactions could represent more than 17% ($127 billion).

p. 17 | Copyright © 2007 eServGlobal. All rights reserved.

HomeSend Update
� Morocco/Belgium corridor live this quarter
� Asia & Middle East trials commence September
� Plan for seven corridors to be operating by end 2009
� “White-label” agreements in discussion

HomeSend: Key Differentiators
Mobile Centric from Sender-to-Receiver
It is a traditional hubbing business (Belgacom ICS)
Interoperable with different m-wallet or recharge systems
Transparent exchange rate
In-line with emerging industry standards
GSMA & World Bank endorsement

eServ as a mobile commerce enabler
� Today, our systems charge over US$4b every month of
telecoms traffic and payments
� Mobile transactions and commerce� Mobile handset is the ATM + POS + e-Cash device in the developing world
� 6 times more handsets than bank accounts
� Operators need solutions, want revenue-sharing ventures
� 1/3rd of the world’s mobile subscribers are our customers� eServ has unique footprint
� eServ is delivering solutions today
� Deep Telecom and deep financial knowledge� Completely scaleable, 99.999% reliability
� Integrated with major banking networks already

p. 21 | Copyright © 2007 eServGlobal. All rights reserved.
www.eservglobal.com