Geometric dimensioning and tolerancing a tool for concurrent ...
Upload
khangminh22Category
view
0download
0
212
9002( 9( العدد )92المجمد ) العموم الهندسيةمجمة جامعة تشرين لمدراسات والبحوث العممية _ سمسمة
Tishreen University Journal for Studies and Scientific Research- Engineering Sciences Series Vol. (29) No. (2) 2007
Third Generation Networks Radio Dimensioning
Dr. Hassan Abbas*
(Received 27 / 2 / 2007. Accepted 16/7/2007)
ABSTRACT
This research is an evaluation study of the new generation of mobile
communication networks WCDMA in order to provide cellular coverage for the required
area and the number of required node Bs as well as the associated capacity, design, and
dimensioning in terms of methodology, uplink and down link budget calculations, steps,
and analysis.
The planning and design of the third generation networks which provide the mobile
internet and video calling are about 10 times more complicated than second generation
networks.
Key Words: 3G, WCDMA, UMTS, Mobile Communications, Node B Dimensioning,
Network design.
* *Associate Professor, Department of Communications and Electronics, Faculty of Electrical and
Mechanical Engineering, Tishreen University, Lattakia, Syria.

عباس ة والسعة لشبكات الجيل الثالثتصميم وحساب التغطي
220
9002( 9( العدد )92المجمد ) العموم الهندسيةة _ سمسمة مجمة جامعة تشرين لمدراسات والبحوث العممي
Tishreen University Journal for Studies and Scientific Research- Engineering Sciences Series Vol. (29) No. (2) 2007
تصميم وحساب التغطية والسعة لشبكات الجيل الثالث
*الدكتور حسن عباس
(61/2/2007ل لمنشر في ب ق . 9002/ 9/ 92إليداع تاريخ ا)
الممّخص
توضيح طريقة التصميم والحساب لشيكات الجيل الثالث الخميوية من ناحية االسس يهدف هذا البحث الىحطات يجاد العدد الكافي لممإجل التصميم والحساب لمدى التغطية الخميوية وبالتالي Hوالقواعد التي يجب اتباعها من
بالتفصيل جل تامين الخدمة الخميوية الحديثة ومستوى السعة الضروية لهذة الشبكات. حيث يستعرض هذاالبحثأمن عممية التخطيط والتصميم لشبكات الجيل لالتحميل المناسب إلى ضافة ترات الوصمة الصاعدة والهابطة إحساب بارام
وتصميمها ن تخطيط شبكات الجيل الثالث إحيث م جهدا كبيرا يالتصملتخصيط و الثالث التي تتطمب من مهندسي امرات منها أعقد بحوالي عشرهي ةالمكالمات الفيديوي خدمات إلىإضافة يوية النقالة الخم اإلنترنتوالتي تؤمن خدمات .لشبكات الجيل الثاني
.ميم الشبكات الخميويةتص ،ت الشبكا أداء ة،االتصاالت الخميوي ،الجيل الثالث :ةكممات مفتاحي
* .ةأستاذ مساعد قسم هندسة االاتصاالت وااللكترونيات ، كمية الهندسة الميكانيكية والكهربائية ، جامعة تشرين الالذقية، سوري

Tishreen University Journal. Eng. Sciences Series 2002( 2( العدد )22العموم الهندسية المجمد ) مجمة جامعة تشرين
221
Table of Contents:
Abstract
1. Background and Purpose of the Trail
2. Research Methodology
3. Radio Network Dimensioning Methodology
4. Interference Margin
5. Link Budget
5. 1Uplink budget calculation
5. 2downlink budget calculation
6. Results and discussion
6. 1Coverage limited scenario
6. 2Capacity limited scenario
7. Conclusion
8. Acronyms and Terminology
9. References
1. Background and Purpose of the Trail
3G technology offers a fast access to a wide range of mobile internet services. A
good network design enables high quality and performance network for fast end-user
access where it is necessary to calculate the required number of Node Bs and the capacity
which can be provided by those nodes.
This research is an evaluation study of the new generation of mobile
communication networks WCDMA, design and dimensioning in terms of methodology,
calculation steps, and analysis.
This research can be considered an important guide for third generation mobile
networks planning design.
2. Research Methodology
Communication software companies have developed many different PC based
radio network dimensioning tools. Those tools have been developed as internal tools with
the objective of being able to support customer requests for system dimensioning. The
general methodology and guidelines used by those tools have been outlined in the sections
below, in addition to an example of uplink and down link budget calculations.

عباس ة والسعة لشبكات الجيل الثالثتصميم وحساب التغطي
222
3. Radio Network Dimensioning Methodology
-Body loss
-Slant loss
-Antenna gain
-RX/TX losses
(jumpers, etc)
-Penetration loss
-Slow fading/penetration
margins (single cell)
Maximum path loss less body/slant loss
Outdoor path loss
Maximum path loss including body/slant loss
Figure 1 illustrates the overall process.
The first step is to evaluate an initial cell range assuming coverage limited scenario
based upon the maximum permissible system load. This is done using a link budget that
includes the noise rise due to the assumed level of system loading.
Evaluate cell range using max system load and
link budget for user at the cell edge
Compute cell loading from traffic
profile and cell range
Add Carrier/
Decrease cell radius
Compare cell loading with the maximum
permissible system load
Coverage limited max. cell range for
specified max system load
Cell range known
Decrease max
system load
Equal to
Coverage
LimitedCapacity
Limited
Less than Greater
than
Figure 2 – The process used for system dimensioning

Tishreen University Journal. Eng. Sciences Series 2002( 2( العدد )22العموم الهندسية المجمد ) مجمة جامعة تشرين
223
This defines the coverage limited cell range for the specified maximum permissible
system load [1], [8],[16].
Following computation of a cell range, the number of users within each cell can be
evaluated. The traffic profile specified by the user can then be used to determine whether
or not the maximum permissible system loading is exceeded. The fractional load due to
each service type is combined to give the overall system load. The process for computing
fractional loads is illustrated in Figure 3.
Figure 3 – The process used for system dimensioning
Step one: Definition of the traffic per cell. This is usually defined in terms of Erlangs for
voice and real time (RT) data services and in terms of kbits/sec for non real time (NRT)
data services.
Step two: Evaluation of the traffic channel requirement per cell for each service class.
For voice and RT data services the calculations are based upon the Erlang B formula and
for NRT data services upon throughput. The two equations are given below.
Voice and RT data );_( trafficprobblocErlangBchstchs
NRT data Rthroughput
traffictchs
* (1)
عباس ة والسعة لشبكات الجيل الثالثتصميم وحساب التغطي
224
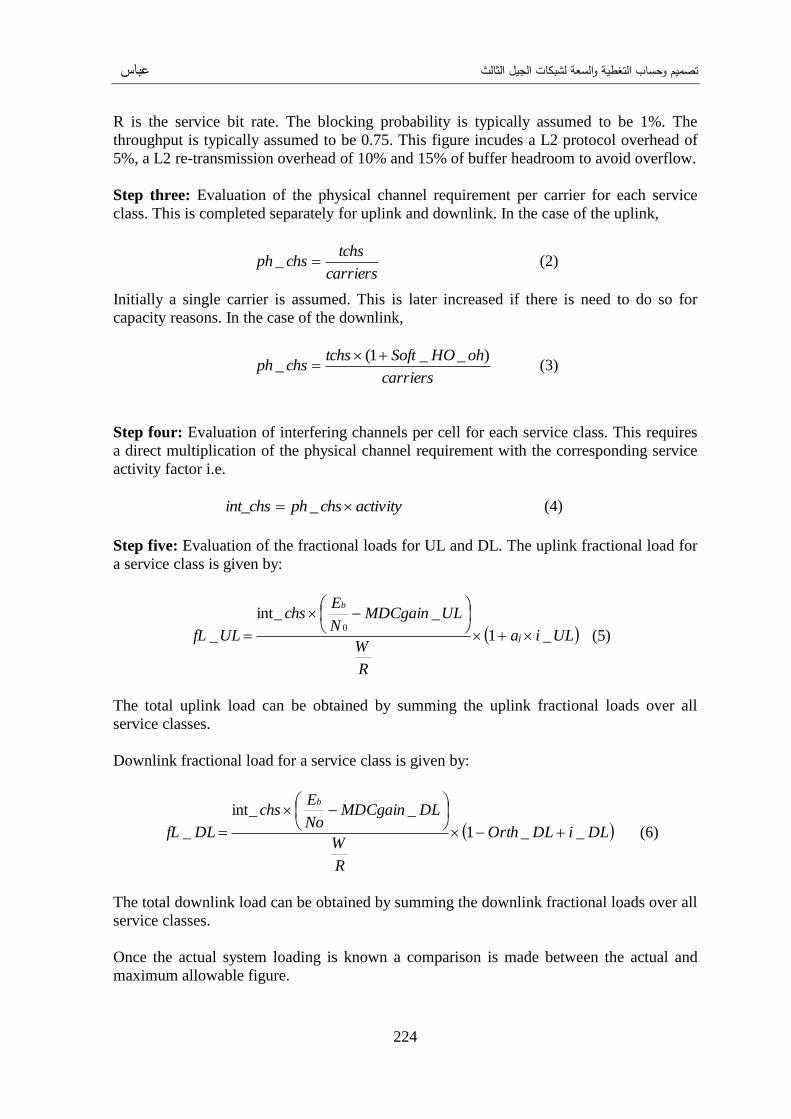
R is the service bit rate. The blocking probability is typically assumed to be 1%. The
throughput is typically assumed to be 0.75. This figure incudes a L2 protocol overhead of
5%, a L2 re-transmission overhead of 10% and 15% of buffer headroom to avoid overflow.
Step three: Evaluation of the physical channel requirement per carrier for each service
class. This is completed separately for uplink and downlink. In the case of the uplink,
carriers
tchschsph _ (2)
Initially a single carrier is assumed. This is later increased if there is need to do so for
capacity reasons. In the case of the downlink,
carriers
ohHOSofttchschsph
)__1(_
(3)
Step four: Evaluation of interfering channels per cell for each service class. This requires
a direct multiplication of the physical channel requirement with the corresponding service
activity factor i.e.
activitychsphint_chs _ (4)
Step five: Evaluation of the fractional loads for UL and DL. The uplink fractional load for
a service class is given by:
ULia
R
W
ULMDCgainN
Echs
ULfL j
b
_1
_int_
_0
(5)
The total uplink load can be obtained by summing the uplink fractional loads over all
service classes.
Downlink fractional load for a service class is given by:
DLiDLOrth
R
W
DLMDCgainNo
Echs
DLfL
b
__1
_int_
_
(6)
The total downlink load can be obtained by summing the downlink fractional loads over all
service classes.
Once the actual system loading is known a comparison is made between the actual and
maximum allowable figure.

Tishreen University Journal. Eng. Sciences Series 2002( 2( العدد )22العموم الهندسية المجمد ) مجمة جامعة تشرين
225
4. Interference Margin
The uplink interference margin defines the allowable uplink noise rise seen in at the
base station. [1], [6],[9], [14] .
The instantaneous noise rise can be related to loading (fraction of pole capacity,
SYSTEMUPM ) by the simple equation (7).
An interference margin of 3 dB is recommended in the long term. In the short term, a
value of 1.5 dB may be used.
Uplink interference level (dB) is above noise rise as a function of the load:
ulI =-10*log (1-systemupM
M) (7)
Where
M- number of users
M systemup- maximum number of users in the uplink
0.00
2.00
4.00
6.00
8.00
10.00
12.00
0.10 0.20 0.30 0.40 0.50 0.60 0.70 0.80 0.90
Relative load
No
ise R
ise
Figure 2.10.1 Classical relation between uplink loading and noise rise
A high noise rise, also known as the cell-breathing effect, is undesirable as it signifies
an unstable service area. A noise rise limit of 3 dB is recommended as a long term
planning assumption, which equates to 0.5% loading.
عباس ة والسعة لشبكات الجيل الثالثتصميم وحساب التغطي
226
In the short term however, a lower noise rise limit maybe assumed in order reflect
the low traffic levels expected in the early network. An initial planning load of 0.3%, or
1.5 dB noise rise has been proposed.
It should be noted that utilisation of such a low noise rise may limit the use of high
speed uplink bearers. This is especially true for a 384 kbps bearer which is estimated to
add a 3.3% load to cell, exceeding the total noise rise limits.
5. Link Budget
5.1 Uplink Budget Calculation
Table 1. shows the uplink link budget calculation for pedestrian/stationary (3 km/h) users
assuming macro cell node B with MHA [1], [3], [11], [14].
Where the equation parameters for the uplink budget will be calculated as fellows:
User equipment effective radiate power:
poweroutput Max gain Antenna UEUEUEEIRP (8)
Node B receives sensitivity:
NFN
ERRX
o
b 30)log(*10174ysensitivit B Node (9)
Receive level at BS antenna:
IMSHOSHORX
RXPCRXRX LossesHeadroomUplink
margin -fading slowgainUplink gain Antenna
ysensitivit B Node
(10)
Path loss inc. body/slant loss:
UplinkEIRPal RXUEPL min (11)
Path loss not incl. body loss or slant loss:
ULTotalalNo SLBLPLPL min (12)
Table 1. Uplink Budget Calculations

Tishreen University Journal. Eng. Sciences Series 2002( 2( العدد )22العموم الهندسية المجمد ) مجمة جامعة تشرين
227
Uplink Link Budget
Speech CS 64 PS 64 PS128 PS384 unit
UE maximum output power 21.0 21.0 21.0 21.0 21.0 dBm
UE Antenna gain 0.0 0.0 0.0 0.0 0.0 dBi
UE EIRP 21.0 21.0 21.0 21.0 21.0
Node B Eb/No 6.9 4.1 3.2 2.6 2.4 dB
Node B noise figure 2.5 2.5 2.5 2.5 2.5 dB
Information rate 12.2 64.0 64.0 128.0 384.0 bps
Node B receive sensitivity -123.7 -119.3 -120.2 -117.8 -113.3 dBm
Power control headroom 2.0 2.0 0.9 0.9 0.9 dB
Base station RX losses 0.5 0.5 0.5 0.5 0.5 dB
Base station antenna gain 18.0 18.0 18.0 18.0 18.0 dB
Uplink SHO combining gain 0.5 0.5 0.5 0.5 0.5 dB
SHO slow fading margin reduction 2.0 2.0 2.0 2.0 2.0 dB
Interference margin 3.0 3.0 3.0 3.0 3.0 dB
Receive level at BS antenna -138.7 -134.3 -136.3 -133.9 -129.4 dBm
Path loss inc. body/slant loss 159.7 155.3 157.3 154.9 150.4 dB
Body loss 5.0 2.0 2.0 2.0 2.0 dB
UL slant loss 2.0 2.0 2.0 2.0 2.0 dB
Path loss not incl. body loss or slant loss
152.7 151.3 153.3 150.9 146.4
5.2 Downlink Budget Calculation
Table 2. shows the uplink link budget calculation for pedestrian/stationary users
assuming macro cell node B with MHA[1], [3], [11], [14].
Where the equation parameters for the down link budget will be calculated as fellows:
Transmit code power:
)log(*10 power Fract.powerCarrier power Code MaxMaxTX (13)
Base station carrier EIRP:
gain AntennapowerCarrier EIRPCarrier TXTXMaxBS losses (14)
Base station code EIRP:
gain Antennapower CodeEIRP Code TXTXTXBS Losses (15)

عباس ة والسعة لشبكات الجيل الثالثتصميم وحساب التغطي
228
Downlink path loss incl. body/slant loss:
margin ULSHOBLPLSLPLPL hfDLULDL (16)
Noise density:
UENFND 174 (17)
Intracell interference density:
)log(*10
PL-orth))N,(*log(*10 gain AntennaDLEIRPCarrier Intracell
W
UECLBSID
(18)
Intercell interference density:
)log(*10
)*log(*10 gain AntennaEIRPCarrier Intercell
W
UEPLCLRPRBSID DL
(19)
Total noise& interference density:
))10/(^10)10/(^10)10/(^10log(*10 Intercell Intracell Total IDIDNDNID (20)
Received code energy:
gain DL EIRP Codeenergy code SHOPLBSTX DL (21)
Max DL cell-edge packet bearer rate:
1000/)10/))(((^10BRMax headroom DLenergy CodeDL PCN
ENIDTX DL
o
b
Total (22)
Table 2. Downlink Budget Calculations.
Downlink maximum bearer rate at UL limit
UL Speech
UL CS 64
UL PS 64
UL PS 128
UL PS 384
Units
Node B max. carrier power 46.0 46.0 46.0 46.0 46.0 dBm
Carrier loading 0.9 0.9 0.9 0.9 0.9 %
Max. fract. power for packet user 0.5 0.5 0.5 0.5 0.5 %
TX code power 42.5 42.5 42.5 42.5 42.5 dBm
Base station TX losses 3.0 3.0 3.0 3.0 3.0 dB
Base station antenna gain 18.0 18.0 18.0 18.0 18.0 dB
BS carrier EIRP 61.0 61.0 61.0 61.0 61.0 dBm
BS code EIRP 57.5 57.5 57.5 57.5 57.5 dBm

Tishreen University Journal. Eng. Sciences Series 2002( 2( العدد )22العموم الهندسية المجمد ) مجمة جامعة تشرين
229
UL Path loss less body/slant loss 152.7 151.3 153.3 150.9 146.4 dB
DL slant loss 2.0 2.0 2.0 2.0 2.0 dB
Higher frequency additional path loss
1.6 1.6 1.6 1.6 1.6 dB
Body loss 5.0 2.0 2.0 2.0 2.0 dB
UL SHO fading margin reduction 2.0 2.0 2.0 2.0 2.0 dB
DL path loss incl. body/slant loss 159.3 154.9 156.9 154.5 150.0 dB
UE noise figure 8.0 8.0 8.0 8.0 8.0 dB
Noise density -166.0 -166.0 -166.0 -166.0 -166.0 dBm/Hz
Non-orthogonality 0.5 0.5 0.5 0.5 0.5
Intracell interference density -167.6 -163.2 -165.2 -162.8 -158.3 dBm/Hz
Other to own cell carrier power ratio 1.0 1.0 1.0 1.0 1.0
Intercell interference density -164.6 -160.2 -162.2 -159.8 -155.3 dBm/Hz
Total noise& interference density -161.2 -157.8 -159.4 -157.4 -153.3 dBm/Hz
DL Eb/No 5.3 5.3 5.3 5.3 5.3 dB
DL power control headroom 0.9 0.9 0.9 0.9 0.9 dB
DL SHO combining gain 2.0 2.0 2.0 2.0 2.0 dB
Received code energy -99.8 -95.4 -97.4 -95.0 -90.4 dBm
Max DL cell-edge packet bearer rate
327.2 413.5 380.1 419.2 460.8 kbps
6. Results and Discussion
Two cases are now possible:
Either the system load factor resulting from the user specified traffic profile is greater
than the maximum permissible level, in which case the system is capacity limited.
Or the system load factor is less than the maximum permissible level in which case the
system is coverage limited.
6.1 Coverage Limited Scenario
In this case the system loading is lower than the level used initially to compute the
cell range. This means that the rise in interference floor used in the link budget calculation
was pessimistic. To achieve a match between the actual system loading and that used in the
link budget, the complete process is repeated with a lower value of system loading. This
will lead to a lower increase in interference floor, a greater cell range, and thus more users
in each cell and a greater actual system loading.
The reduction in system loading used in the link budget calculation is continued
until it matches the actual system loading computed by the traffic profile. This then defines
the final cell range.

عباس ة والسعة لشبكات الجيل الثالثتصميم وحساب التغطي
230
6. 2 Capacity Limited Scenario
In this case the system loading is greater than the level used initially to compute the
cell range. This means that either the cell capacity must be increased or the cell size
decreased. The first option is to increase the cell capacity by adding additional carriers. If
the system loading remains above the maximum permissible level, then the cell range must
be reduced to a level similar to that where there are fewer users loading the cell.
A reduction in cell range is made, and the system loading re-calculated. The reduction in
cell range is done iteratively until the actual system loading matches the maximum
permissible system loading. This then defines the final cell range.
7. Conclusion
The approach to third generation mobile communications WCDMA network
dimensioning should allow the network planner and designer to specify the user traffic
profile and loading of the network, including the data rates, asymmetry factors, user
speeds, coverage and capacity requirements by implementing manufacturer Node Bs and
mobile terminals data sheets and 3GPPs data too.
The path losses provided by the uplink link budget are used to estimate a
supportable bearer rate on the downlink at the cell edge as defined by the uplink.
The limited power at the terminal restricts uplink bearer rates to be lower than those
possible on the downlink. On the downlink, power is shared, and by allocating user a large
fraction of the total carrier power it is possible to support high data rates even at the cell
edge. This sharing of power makes the downlink link budget more elastic than the uplink.
As a result of link budget calculations, man can find the number of base stations
which can provide sufficient coverage as stated in the requirements without exceeding
specified maximum system loading. All should be done by adjusting the coverage and
capacity limiting factors as well as the interference noise rise. The network dimensioning
process ensures that the network is able to support the traffic presented for a range of
different bearer rates without exceeding the maximum system load.

Tishreen University Journal. Eng. Sciences Series 2002( 2( العدد )22العموم الهندسية المجمد ) مجمة جامعة تشرين
231
7. Acronyms and Terminology
Node B 3G base transceiver station
WCDMA Wideband code division multiple access -3G modulation
MHA Mast head amplifier
int_chs Number of interfering channels
Eb/No Target energy per bit to interference spectral density ratio
MDCgain_UL Macro diversity gain on the uplink due to soft handover
aj Increase in transmit power due to power control for the jth user
i_UL Ratio of other to own cell interference for up link
W Chip rate
MDCgain_DL Macro diversity gain on the downlink due to soft handover
Orth_DL Downlink orthogonality
i_DL Ratio of other to own cell interference for down link
M Number of users
M systemup Maximum number of users in the uplink
EIRPUE User equipment effective radiate power
gain AntennaUE UE Antenna gain
poweroutput Max UE UE maximum output power
ysensitivit B NodeRX Node B receive sensitivity
R Information rate
NF Noise figure
UplinkRX Receive level at BS antenna
ysensitivit B NodeRX Node B receive sensitivity
HeadroomPC Power control headroom
LossesRX Base station RX losses
gain AntennaRX Base station antenna gain
gainUplink SHO Uplink SHO combining gain
margin -fading slowSHO SHO slow fading margin reduction
IM Interference margin
alPLmin Path loss inc. body/slant loss
alNoPL min Path loss not incl. body loss or slant loss
TotalPL Path loss inc. body/slant loss
BL Body loss
ULSL UL slant loss
power CodeTX Transmit code power
powerCarrier Max Node B max. carrier power
power Fract.Max Max. fract. power for packet user
EIRPCarrier BS BS carrier EIRP
lossesTX Base station TX losses

عباس ة والسعة لشبكات الجيل الثالثتصميم وحساب التغطي
232
gain AntennaTX Base station antenna gain
EIRP CodeBS BS code EIRP
DLPL DL path loss incl. body/slant loss
ULPL UL Path loss less body/slant loss
DLSL DL slant loss
hfPL Higher frequency additional path loss
margin ULSHO UL SHO fading margin reduction
ND Noise density
IntracellID Intracell interference density
CL Carrier loading
orthN, Non-orthogonality
IntercellID Intercell interference density
RPR Other to own cell carrier power ratio
TotalNID Total noise &interference density
energy codeRX Received code energy
gain DLSHO DL SHO combining gain
DLBRMax Max DL cell-edge packet bearer rate
headroom DLPC DL power control headroom

Tishreen University Journal. Eng. Sciences Series 2002( 2( العدد )22العموم الهندسية المجمد ) مجمة جامعة تشرين
233
REFERENCES:
1. HOLMA, HAND& TOSKALA, A. WCDMA for UMTS (3rdedn, 450 pp.).
Chichester,UK: JohnWiley&Sons,2004,
2. 3GPP Standard in TS 25.101, 1999.
3. „Node B system description‟, Nokia contract document agreed 2 October.
4. „WCDMA Masthead Amplifier(MHA) Product Description’, Nokia User Manual,
DN0114715, issue 1-0 en.
5. 3GPP 25.104, 2000.
6. KARI, SIPILA (Nokia) „WCDMA link performance indicators, simulator principle
and examples’ NET/IMN/WNP/NSR, v 0.1.0.
7. COST-231, Urban Transmission Loss Models for Mobile Radio in the900 and 1800
MHz bands, TD (90) 199 Rev. 1, 1991.
8. KEN, NG „Link budget for a personal communication network‟,
Mo2o,/CDOC/P2.2/KNG/REPT/3253 , Issue 1.0, 6/9/95.
9. WOLFGANG, STOERMER „Comparison of the performance between vertically
polarised and cross polar antennas‟, Brian Williams, One2one/CDOC/6032, Issue
2.0, 21 September 2000.
10. EEM/TG/N-99:0042 „WCDMA radio access network RF dimensioning guidelines’, ,
8/12/99.
11. HATA, M., “Empirical Formula for Propagation Loss in Land Mobile Radio
Services,” IEEE Transactions on Vehicular Technology, vol.VT-29, no. 3, August,
pp. 317–325,1980.
12. KARI, SIPILA „Default power settings for common DL channels in WCDMA RAN1-
1.5‟, , Nokia presentation to TMO radio performance workshop, 18/06/2001
13. ETSI TS GSM 03.30. „Nokia Ultra Site WCDMA Antenna System Product
Overview‟, DN00309809.
14. MIKKO, SIIRA „Nokia WCDMA FDD BTS RF Performance’,15/2/01.
15. LAIHO, J; WACKER; ARANAD, NOVASAD. Radio Network Planning and
Optimization for UMTS(484pp.).Chichester, UK: John Wiley& Sons T(2002).
16. ITU-R.M.1225, "Guidelines for evaluation of radio transmission technologies for
IMT-2000."
Copyright © 2022 FDOKUMEN