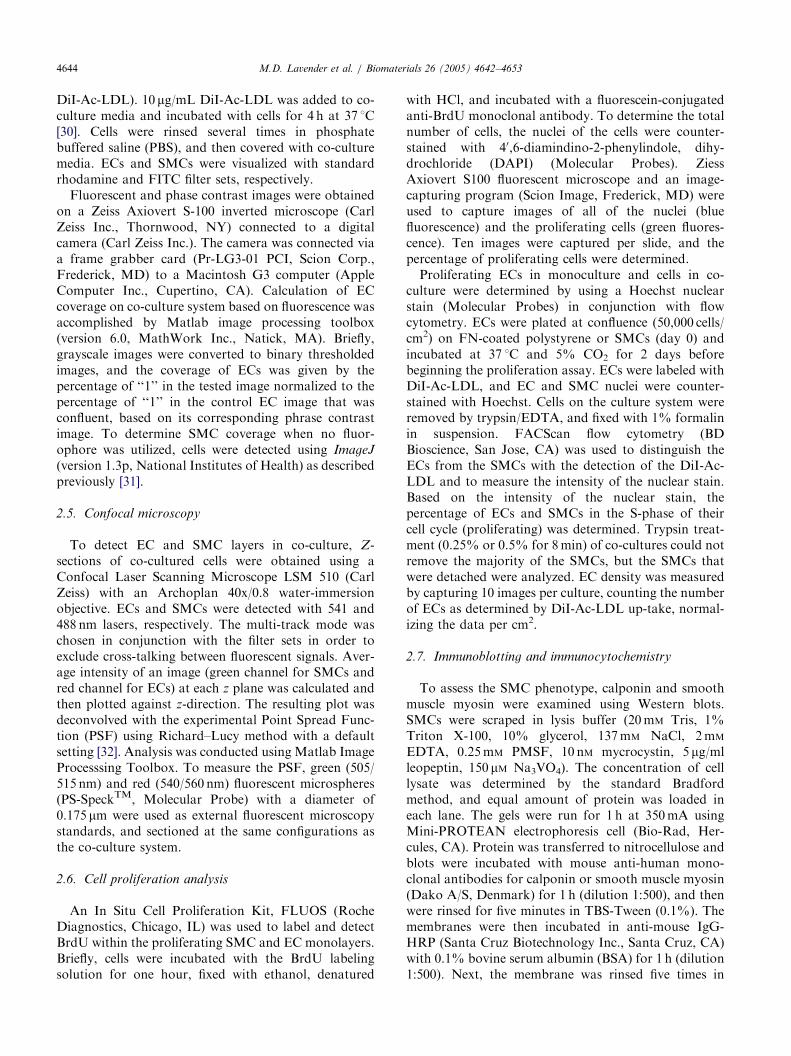
A system for the direct co-culture of endothelium on smooth muscle cells
12
Biomaterials 26 (2005) 4642–4653 A system for the direct co-culture of endothelium on smooth muscle cells Mark D. Lavender a , Zhengyu Pang a , Charles S. Wallace a , Laura E. Niklason a,b , George A. Truskey a, a Department of Biomedical Engineering, Duke University, 136 Hudson Hall, Campus Box 90281, Durham, NC 27708-0281, USA b Department of Anesthesiology, Duke University, Medical Center, Durham, NC 27710, USA Received 3 July 2004; accepted 24 November 2004 Available online 13 January 2005 Abstract The development of a functional, adherent endothelium is one of the major factors limiting the successful development of tissue engineered vascular grafts (TEVGs). The adhesion and function of endothelial cells (ECs) on smooth muscle cells (SMCs) are poorly understood. The goal of this research was to optimize conditions for the direct culture of endothelium on SMCs, and to develop an initial assessment of co-culture on EC function. The co-culture consisted of a culture substrate, a basal adhesion protein, a layer of porcine SMCs, a medial adhesion protein, and a layer of porcine ECs. Conditions that led to successful co-culture were: a polystyrene culture substrate, a quiescent state for SMCs, subconfluent density for SMC seeding and confluent density for EC seeding, and fibronectin (FN) for the basal adhesion protein. EC adhesion was not enhanced by addition of FN, collagen I, collagen IV or laminin (LN) to the medial layer. 3-D image reconstruction by confocal microscopy indicated that SMCs did not migrate over ECs and the cells were present in two distinct layers. Co-cultures could be consistently maintained for as long as 10 days. After exposure to 5 dyne/cm 2 for 7.5 h, ECs remained adherent to SMCs. PECAM staining indicated junction formation between ECs, but at a lower level than that observed with EC monocultures. Co-culturing ECs with SMCs did not change the growth rate of ECs, but EC DiI-Ac-LDL uptake was increased. Thus, a confluent and adherent layer of endothelium can be directly cultured on quiescent SMCs. r 2004 Elsevier Ltd. All rights reserved. Keywords: Co-culture; Smooth muscle cells; Endothelial cells 1. Introduction Tissue engineering represents a promising approach to treat a number of cardiovascular problems including atherosclerosis, damaged valves and heart failure. Development of a functional, adherent endothelium is one of the major factors limiting the successful devel- opment of TEVG [1]. Attachment of endothelial cells (Ecs) on cultured blood vessels is often sub-optimal, and adherent ECs may be pro-coagulant [2]. The phenotype of smooth muscle cells (SMCs) ranges from the growth arrested contractile phenotype present in the normal vessel wall to the proliferating and synthetic phenotype seen in culture or during athero- sclerosis [3,4]. After injury to the endothelium in vivo or culture in vitro with serum, SMCs undergo a phenotypic modulation characterized by increased cell replication, reduced levels of actin and myosin and cell contraction, increased extracellular matrix synthesis, and enrichment of rough endoplasmic reticulum [5]. In culture, growth can be arrested with serum-free media containing insulin, transferrin, selenium and ascorbate [6]. Replica- tion of growth-arrested SMCs can be re-established by the addition of serum [7]. Surface substrate also affects SMC differentiation state [8]. In addition, in vivo and in ARTICLE IN PRESS www.elsevier.com/locate/biomaterials 0142-9612/$ - see front matter r 2004 Elsevier Ltd. All rights reserved. doi:10.1016/j.biomaterials.2004.11.045 Corresponding author. Tel.: +1 919 660 5147; fax: +1 919 684 4488. E-mail address: [email protected] (G.A. Truskey).
-
Upload
independent -
Category
Documents
-
view
2 -
download
0
Transcript of A system for the direct co-culture of endothelium on smooth muscle cells

ARTICLE IN PRESS
0142-9612/$ - se
doi:10.1016/j.bi
�Correspond
fax: +1 919 684
E-mail addr
Biomaterials 26 (2005) 4642–4653
www.elsevier.com/locate/biomaterials
A system for the direct co-culture of endothelium onsmooth muscle cells
Mark D. Lavendera, Zhengyu Panga, Charles S. Wallacea,Laura E. Niklasona,b, George A. Truskeya,�
aDepartment of Biomedical Engineering, Duke University, 136 Hudson Hall, Campus Box 90281, Durham, NC 27708-0281, USAbDepartment of Anesthesiology, Duke University, Medical Center, Durham, NC 27710, USA
Received 3 July 2004; accepted 24 November 2004
Available online 13 January 2005
Abstract
The development of a functional, adherent endothelium is one of the major factors limiting the successful development of tissue
engineered vascular grafts (TEVGs). The adhesion and function of endothelial cells (ECs) on smooth muscle cells (SMCs) are poorly
understood. The goal of this research was to optimize conditions for the direct culture of endothelium on SMCs, and to develop an
initial assessment of co-culture on EC function. The co-culture consisted of a culture substrate, a basal adhesion protein, a layer of
porcine SMCs, a medial adhesion protein, and a layer of porcine ECs. Conditions that led to successful co-culture were: a
polystyrene culture substrate, a quiescent state for SMCs, subconfluent density for SMC seeding and confluent density for EC
seeding, and fibronectin (FN) for the basal adhesion protein. EC adhesion was not enhanced by addition of FN, collagen I, collagen
IV or laminin (LN) to the medial layer. 3-D image reconstruction by confocal microscopy indicated that SMCs did not migrate over
ECs and the cells were present in two distinct layers. Co-cultures could be consistently maintained for as long as 10 days. After
exposure to 5 dyne/cm2 for 7.5 h, ECs remained adherent to SMCs. PECAM staining indicated junction formation between ECs, but
at a lower level than that observed with EC monocultures. Co-culturing ECs with SMCs did not change the growth rate of ECs, but
EC DiI-Ac-LDL uptake was increased. Thus, a confluent and adherent layer of endothelium can be directly cultured on quiescent
SMCs.
r 2004 Elsevier Ltd. All rights reserved.
Keywords: Co-culture; Smooth muscle cells; Endothelial cells
1. Introduction
Tissue engineering represents a promising approachto treat a number of cardiovascular problems includingatherosclerosis, damaged valves and heart failure.Development of a functional, adherent endothelium isone of the major factors limiting the successful devel-opment of TEVG [1]. Attachment of endothelial cells(Ecs) on cultured blood vessels is often sub-optimal, andadherent ECs may be pro-coagulant [2].
e front matter r 2004 Elsevier Ltd. All rights reserved.
omaterials.2004.11.045
ing author. Tel.: +1 919 660 5147;
4488.
ess: [email protected] (G.A. Truskey).
The phenotype of smooth muscle cells (SMCs) rangesfrom the growth arrested contractile phenotype presentin the normal vessel wall to the proliferating andsynthetic phenotype seen in culture or during athero-sclerosis [3,4]. After injury to the endothelium in vivo orculture in vitro with serum, SMCs undergo a phenotypicmodulation characterized by increased cell replication,reduced levels of actin and myosin and cell contraction,increased extracellular matrix synthesis, and enrichmentof rough endoplasmic reticulum [5]. In culture, growthcan be arrested with serum-free media containinginsulin, transferrin, selenium and ascorbate [6]. Replica-tion of growth-arrested SMCs can be re-established bythe addition of serum [7]. Surface substrate also affectsSMC differentiation state [8]. In addition, in vivo and in
ARTICLE IN PRESSM.D. Lavender et al. / Biomaterials 26 (2005) 4642–4653 4643
vitro experiments show that ECs can influence thecontractile and growth properties of vascular SMCs[9,10].
Several co-culture systems have been developed tostudy EC–SMC interactions. These include (1) culture ofSMCs and ECs on opposite sides of membranes [11–15];(2) culture of ECs on collagen gels containing SMCs[16,17]; (3) microcarrier/spheroid-bound ECs or SMCs[18,19]; (4) conditioned media [14,20]; and (5) culture ofECs directly on SMCs [21,22]. Co-culture of ECs andSMCs on opposite sides of a thin membrane stimulatedSMC proliferation [14] and up-regulated VEGF,PDGF-AA, PDGF-BB, and TGF-b gene expressionand down-regulated bFGF gene expression [23]. Cul-tured ECs with SMCs also changed ECs from thenormal polygonal morphology in vitro to an elongatedshape [16], increased EC gene expression of tissue factor[20], VEGF [23], adhesion molecules [11], growth-relatedoncogene-a and monocyte chemotactic protein-1 [12].
Generally, existing co-culture systems bring ECs andSMCs within 10–50mm of each other. The relativelylarge separation distance between ECs and SMCsreduces the likelihood of gap junction formation that isreported to occur between ECs and SMCs [24], althoughSMCs can still make contact with ECs through porespresent in thin membranes [14]. In addition, the distancesignificantly increases the diffusion time between the twocell types, which may limit the effectiveness of short-lived metabolites such as nitric oxide [25]. While thesemodels have helped to elucidate many importantinteractions between the two cell types, a co-culturesystem in which both cell types are in close contact isneeded. In addition, the presence of a synthetic non-degradable membrane interposed between the cells is notapplicable to tissue engineering applications. A morebiomimetic system is needed in order to better replicatethe in vivo spatial arrangement, and to better understandtissue engineered vascular grafts (TEVGs).
While reports of some systems exist in the literature ofthe direct co-culture of ECs on SMCs [19,21–22,26],there has been little effort to optimize the cultureconditions or assess the degree of confluency of ECs,which is essential for developing TEVG. In this study weexamined the substrate material, culture media, cellseeding density, SMC phenotype, and adhesion proteinsin the medial layer in an attempt to establish a stable co-culture with a confluent layer of both cell types. Theeffects of co-culture on EC function were also examined.
2. Materials and methods
2.1. Cells
Porcine SMCs were isolated from carotid artery andaortic explants of Yucatan miniature swine or farm pigs,
as previously described [27]. ECs were scraped directlyfrom the arterial intima. Since SMCs grew faster thanEC did under the culture conditions, the passagenumbers of EC and SMC differed in a given experiment.Passages up to 6 were used for SMCs and passages up to5 used for ECs, while all cells were incubated at 37 1Cand 5% CO2/95% air.
2.2. Culture media
Proliferative media (PM) that stimulated SMCgrowth [28] consisted of DMEM (Gibco, Carlsbad,CA) supplemented with 10% fetal bovine serum (FBS,Gibco), 10% porcine serum (PS, Gibco), 0.05 g/Lvitamin C, 3� 10�6 g/L CuSO4, 0.05 M HEPES, 0.05 g/Lproline, 0.05 g/L alanine, 0.02 g/L glycine, 10� 10�9 g/Lbasic fibroblast growth factor, 10� 10�9 g/L platelet-derived growth factor, and 1x antibiotic/antimycotic(Sigma, St. Louis, MO). To induce quiescence of SMCs,the quiescent media (QM) [29] consisted of DMEM/F12with 0.05 g/L vitamin C, 3� 10�6 g/L CuSO4, 0.05 M
HEPES, 0.05 g/L proline, 0.05 g/L alanine, 0.02 g/Lglycine, 1� insulin, transferrin, and selenium supple-ment (ITS, Gibco), and 1� antibiotic/antimycotic. Priorto co-culture, ECs were grown in PM similar to SMCsexcept with lower serum content (5% FBS and 5% PS).Since ECs would not grow in the absence of serum, co-culture media consisted of 1 part of PM and 5 part ofQM (3.3% serum).
2.3. Co-culture model
The co-culture model consisted of a basal adhesionprotein (FN at 5 mg/cm2, or LN at 2 mg/cm2) adsorbedonto a cell culture surface for 4–8 h at 37 1C or overnightat 4 1C. Next, subconfluent SMCs were seeded onto thecoated protein and allowed to grow for several days. Amedial adhesion protein was then added above the SMClayer for at least 4 h. Last, ECs were seeded over SMCsfor 4 h at 37 1C, after which media removed and replacedwith fresh co-culture media. The cells were co-culturedfor at least 2 days before any tests were performed toallow recovery of cellular functions, such as LDLscavenger receptor activity.
2.4. Live cell staining for ECs and SMCs
To visualize ECs and SMCs in the co-culture, SMCswere nonspecifically incubated with 10 mM Cell TrackerGreen (CTG, 5-chloromethylfluorescein diacetate; Mo-lecular Probes, Eugene, OR) for 45 min at 37 1C beforethe addition of ECs. Media was changed to CTG-freemedia and cells were incubated for another 30 min.Two days post-EC seeding, DiI-Ac-LDL (BiomedicalTechnologies Inc., Stoughton, MA) was used tospecifically label ECs (SMCs did not pick up appreciable
ARTICLE IN PRESSM.D. Lavender et al. / Biomaterials 26 (2005) 4642–46534644
DiI-Ac-LDL). 10 mg/mL DiI-Ac-LDL was added to co-culture media and incubated with cells for 4 h at 37 1C[30]. Cells were rinsed several times in phosphatebuffered saline (PBS), and then covered with co-culturemedia. ECs and SMCs were visualized with standardrhodamine and FITC filter sets, respectively.
Fluorescent and phase contrast images were obtainedon a Zeiss Axiovert S-100 inverted microscope (CarlZeiss Inc., Thornwood, NY) connected to a digitalcamera (Carl Zeiss Inc.). The camera was connected viaa frame grabber card (Pr-LG3-01 PCI, Scion Corp.,Frederick, MD) to a Macintosh G3 computer (AppleComputer Inc., Cupertino, CA). Calculation of ECcoverage on co-culture system based on fluorescence wasaccomplished by Matlab image processing toolbox(version 6.0, MathWork Inc., Natick, MA). Briefly,grayscale images were converted to binary thresholdedimages, and the coverage of ECs was given by thepercentage of ‘‘1’’ in the tested image normalized to thepercentage of ‘‘1’’ in the control EC image that wasconfluent, based on its corresponding phrase contrastimage. To determine SMC coverage when no fluor-ophore was utilized, cells were detected using ImageJ
(version 1.3p, National Institutes of Health) as describedpreviously [31].
2.5. Confocal microscopy
To detect EC and SMC layers in co-culture, Z-sections of co-cultured cells were obtained using aConfocal Laser Scanning Microscope LSM 510 (CarlZeiss) with an Archoplan 40x/0.8 water-immersionobjective. ECs and SMCs were detected with 541 and488 nm lasers, respectively. The multi-track mode waschosen in conjunction with the filter sets in order toexclude cross-talking between fluorescent signals. Aver-age intensity of an image (green channel for SMCs andred channel for ECs) at each z plane was calculated andthen plotted against z-direction. The resulting plot wasdeconvolved with the experimental Point Spread Func-tion (PSF) using Richard–Lucy method with a defaultsetting [32]. Analysis was conducted using Matlab ImageProcesssing Toolbox. To measure the PSF, green (505/515 nm) and red (540/560 nm) fluorescent microspheres(PS-SpeckTM, Molecular Probe) with a diameter of0.175 mm were used as external fluorescent microscopystandards, and sectioned at the same configurations asthe co-culture system.
2.6. Cell proliferation analysis
An In Situ Cell Proliferation Kit, FLUOS (RocheDiagnostics, Chicago, IL) was used to label and detectBrdU within the proliferating SMC and EC monolayers.Briefly, cells were incubated with the BrdU labelingsolution for one hour, fixed with ethanol, denatured
with HCl, and incubated with a fluorescein-conjugatedanti-BrdU monoclonal antibody. To determine the totalnumber of cells, the nuclei of the cells were counter-stained with 40,6-diamindino-2-phenylindole, dihy-drochloride (DAPI) (Molecular Probes). ZiessAxiovert S100 fluorescent microscope and an image-capturing program (Scion Image, Frederick, MD) wereused to capture images of all of the nuclei (bluefluorescence) and the proliferating cells (green fluores-cence). Ten images were captured per slide, and thepercentage of proliferating cells were determined.
Proliferating ECs in monoculture and cells in co-culture were determined by using a Hoechst nuclearstain (Molecular Probes) in conjunction with flowcytometry. ECs were plated at confluence (50,000 cells/cm2) on FN-coated polystyrene or SMCs (day 0) andincubated at 37 1C and 5% CO2 for 2 days beforebeginning the proliferation assay. ECs were labeled withDiI-Ac-LDL, and EC and SMC nuclei were counter-stained with Hoechst. Cells on the culture system wereremoved by trypsin/EDTA, and fixed with 1% formalinin suspension. FACScan flow cytometry (BDBioscience, San Jose, CA) was used to distinguish theECs from the SMCs with the detection of the DiI-Ac-LDL and to measure the intensity of the nuclear stain.Based on the intensity of the nuclear stain, thepercentage of ECs and SMCs in the S-phase of theircell cycle (proliferating) was determined. Trypsin treat-ment (0.25% or 0.5% for 8 min) of co-cultures could notremove the majority of the SMCs, but the SMCs thatwere detached were analyzed. EC density was measuredby capturing 10 images per culture, counting the numberof ECs as determined by DiI-Ac-LDL up-take, normal-izing the data per cm2.
2.7. Immunoblotting and immunocytochemistry
To assess the SMC phenotype, calponin and smoothmuscle myosin were examined using Western blots.SMCs were scraped in lysis buffer (20 mM Tris, 1%Triton X-100, 10% glycerol, 137 mM NaCl, 2 mM
EDTA, 0.25 mM PMSF, 10 nM mycrocystin, 5 mg/mlleopeptin, 150 mM Na3VO4). The concentration of celllysate was determined by the standard Bradfordmethod, and equal amount of protein was loaded ineach lane. The gels were run for 1 h at 350 mA usingMini-PROTEAN electrophoresis cell (Bio-Rad, Her-cules, CA). Protein was transferred to nitrocellulose andblots were incubated with mouse anti-human mono-clonal antibodies for calponin or smooth muscle myosin(Dako A/S, Denmark) for 1 h (dilution 1:500), and thenwere rinsed for five minutes in TBS-Tween (0.1%). Themembranes were then incubated in anti-mouse IgG-HRP (Santa Cruz Biotechnology Inc., Santa Cruz, CA)with 0.1% bovine serum albumin (BSA) for 1 h (dilution1:500). Next, the membrane was rinsed five times in
ARTICLE IN PRESSM.D. Lavender et al. / Biomaterials 26 (2005) 4642–4653 4645
TBS. Enhanced chemiluminescence (ECL, Amersham,Piscataway, NJ) was used to visualize the proteins onfilm. Each film was scanned using a GS 300 Transmit-tance/Reflectance Scanning Densitometer (HoeferScientific Instruments, San Francisco, CA).
To visualize PECAM, cells were rinsed twice withPBS containing Ca2+ and Mg2+, fixed with neutralizedformalin buffer for 10 min, and permeabilized with 0.1%Triton X-100. Then cells were rinsed twice with PBS andincubated for 30 min with 10% goat serum in PBS.Next, 30 ml of anti-PECAM (CD-31, Antigenix-Amer-ica, Huntington Sta., NY) was added to 15 mL to Zenonlabeling reagent (Molecular Probes) and incubated for5 min, after which 255 mL 10% goat serum (Vector,Burlingame, CA) in PBS was added to produce a finalantibody concentration of 10 mg/mL. Labeled antibodywas incubated with cells at room temperature for 60 minin the dark. After two rinses with PBS, cells were post-fixed for 15 min with neutralized formalin solution,mounted and viewed using confocal microscopy withexcitation at 488 nm and emission between 505 and550 nm.
2.8. Flow studies
A parallel plate flow chamber was used to assessadhesion and shape of ECs and SMCs exposed tolaminar flow [33]. ECs, SMCs, or EC/SMC co-cultureswere prepared on 1 inch� 3 inch polystyrene slides(Thermanox, Nunc) as described above. For a volu-metric flow rate Q (cm3/s), and fluid viscosity m (cP), thewall shear stress tw (dyne/cm2) is
tw ¼6mQ
wh2; (1)
where w is the channel width and h is the local channelheight. The flow channel height was 178.5 mm and thewidth was 1.9 cm. For the assay media, the viscosity at37 1C was 0.86 cP.
2.9. Statistical analysis
Results are expressed as mean7SEM. Statisticalanalysis was calculated using InStat software (v. 2.00;Graphpad Software, San Diego, CA). Analysis ofvariance (ANOVA) with repeated measures was utilizedfor data comparisons and a Tukey post-test wasperformed to determine significance between groups.
3. Results
3.1. Effect of surface on SMC morphology and growth
Growth of porcine SMCs was sensitive to thesubstrate. SMCs were plated at 5� 103 cells/cm2 in PM
on surfaces coated with 10 mg/cm2 collagen type I. After5 days, the medium was replaced with QM and cellswere examined after 10 days in culture. On PermanoxTM
and glass, the SMCs were spread and appearedfibroblast-like, whereas on polystyrene the cells wereelongated. In addition, cells grown on polystyrenesurface (6 well cell culture cluster, Corning Inc.,Corning, NY; or SlideFlask, NUNC A/S, Denmark)were more uniformly distributed. SMC coverage was76.175.6%, 59.370.4% and 31.671.7% on polystyr-ene, PermanoxTM and glass, respectively (n ¼ 2). Poly-styrene was used in all co-culture experiments.
3.2. Effect of culture media on EC/SMC phenotype and
proliferation
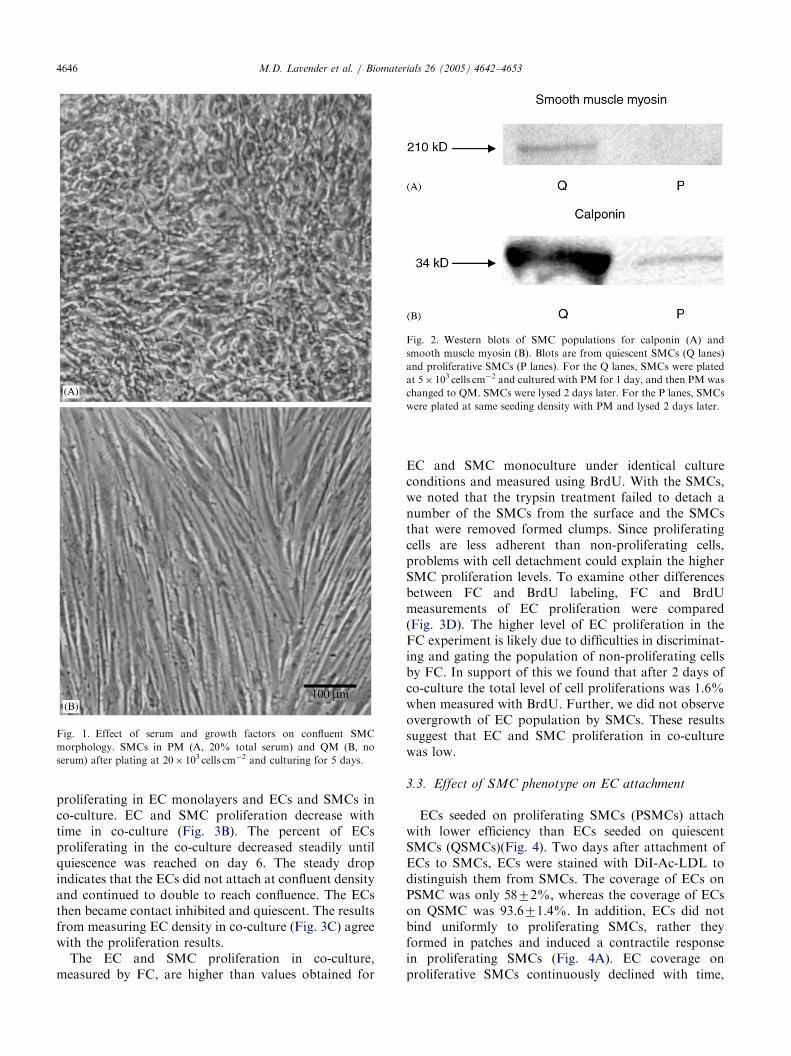
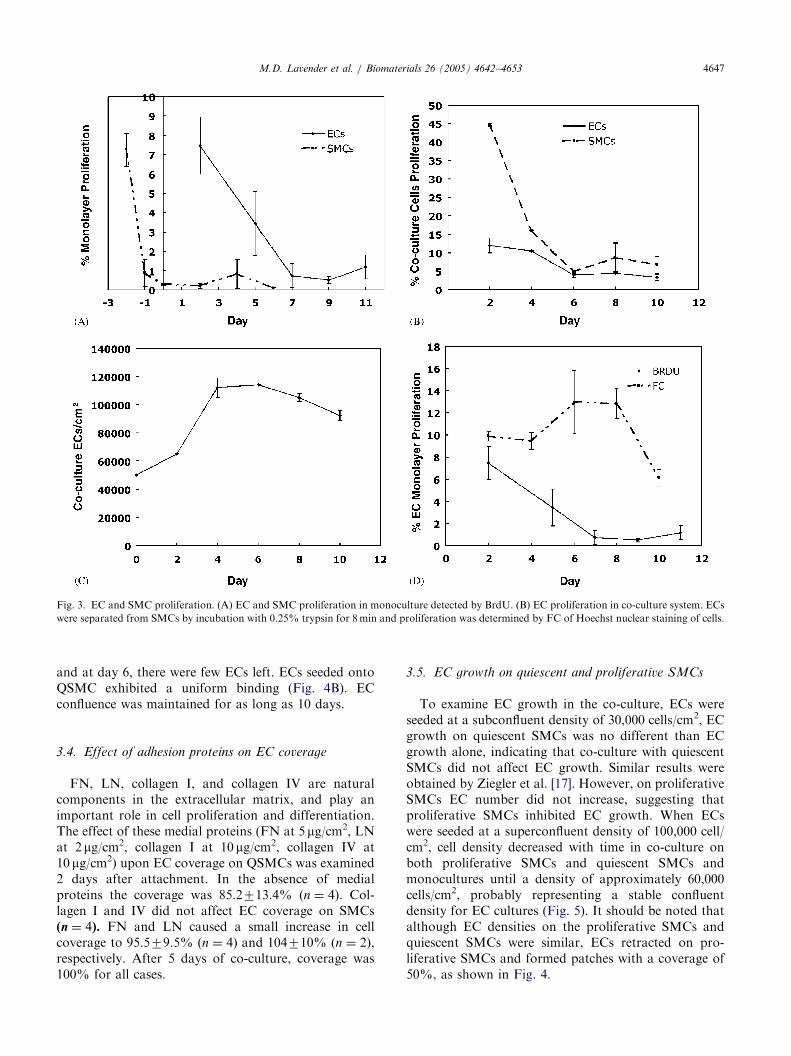
The serum and growth factor components of growthmedia modulated SMC phenotype. With serum, SMCswere polygonal in appearance and proliferated quicklywith overgrowth (Fig. 1A). After shifting culture mediato QM and culturing for 2 days, polygonal SMCsbecame elongated (Fig. 1B). This process could bereversed by addition of serum using PM, and wasindependent of cell density. Two different phenotypes(rhomboid and spindle-shape) were also observed byHao et al. [34] in the cultured SMCs from porcinecoronary artery. In order to validate the phenotypicchange in QM, we used calponin and smooth musclemyosin, two differentiated cell markers, to immunoblotSMC cultures. The blotting indicated that protein levelsof calponin and smooth muscle myosin increased 2 daysafter the medium was shifted from PM to QM (Fig. 2),confirming the change of SMC phenotype fromproliferating state to quiescent state.
ECs required serum to maintain a normal morphol-ogy. The absence of serum in the culture medium led tounhealthy looking ECs characterized by poor spreading,the inability to become confluent, no cobblestonemorphology, and thin appendages. Therefore, 3.3%serum was used for the co-culture.
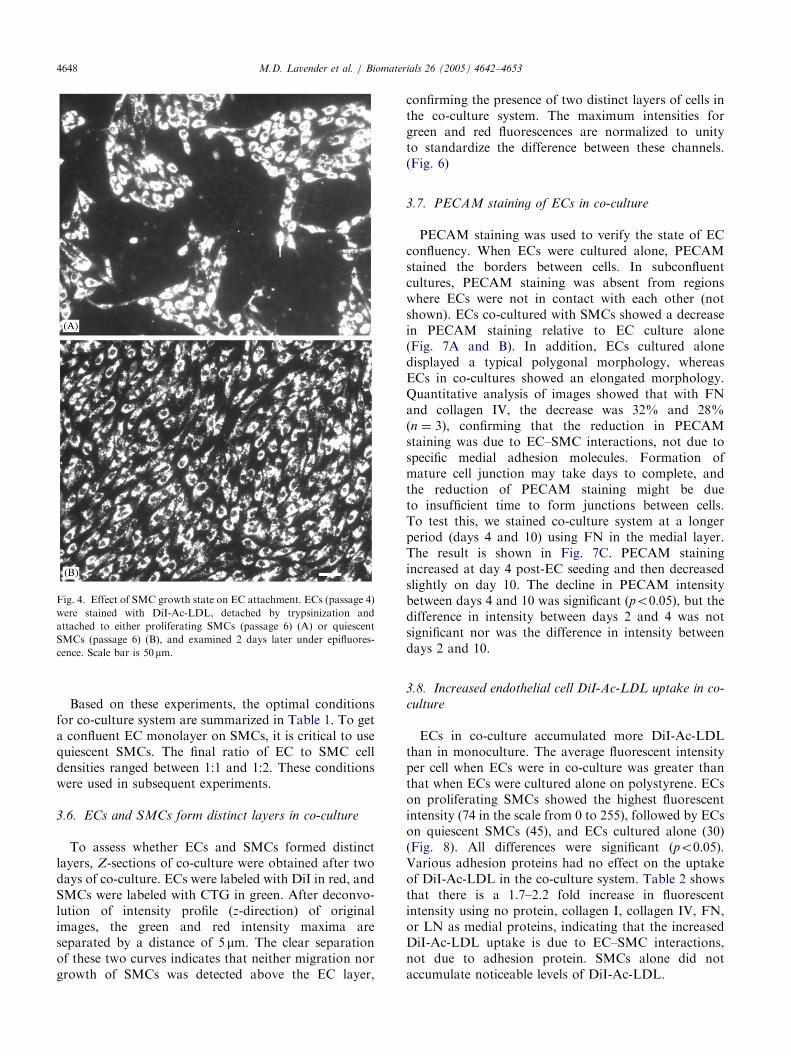
To quantitatively measure cell proliferation, welabeled the cells in S-phase with BrdU. The SMCproliferation stopped 2 days after the medium waschanged from PM to QM (dashed line in Fig. 3A).When 3.3% serum was added on day 2 there was atransient change in SMC proliferation, but the cellsremained in the quiescent phenotype until the end of theexperiment. EC proliferation in monoculture (Fig. 3A)was also measured with BrdU. The results indicate adecrease in cell proliferation over time, which isprobably due to contact inhibition. Co-culture experi-ments were preformed with BrdU, but since the celltypes could not be distinguished, another method tomeasure proliferation was attempted.
Flow cytometry (FC) was used to separate thetwo cell types and to measure the percentage of cells
ARTICLE IN PRESS
Fig. 1. Effect of serum and growth factors on confluent SMC
morphology. SMCs in PM (A, 20% total serum) and QM (B, no
serum) after plating at 20� 103 cells cm�2 and culturing for 5 days.
Fig. 2. Western blots of SMC populations for calponin (A) and
smooth muscle myosin (B). Blots are from quiescent SMCs (Q lanes)
and proliferative SMCs (P lanes). For the Q lanes, SMCs were plated
at 5� 103 cells cm�2 and cultured with PM for 1 day, and then PM was
changed to QM. SMCs were lysed 2 days later. For the P lanes, SMCs
were plated at same seeding density with PM and lysed 2 days later.
M.D. Lavender et al. / Biomaterials 26 (2005) 4642–46534646
proliferating in EC monolayers and ECs and SMCs inco-culture. EC and SMC proliferation decrease withtime in co-culture (Fig. 3B). The percent of ECsproliferating in the co-culture decreased steadily untilquiescence was reached on day 6. The steady dropindicates that the ECs did not attach at confluent densityand continued to double to reach confluence. The ECsthen became contact inhibited and quiescent. The resultsfrom measuring EC density in co-culture (Fig. 3C) agreewith the proliferation results.
The EC and SMC proliferation in co-culture,measured by FC, are higher than values obtained for
EC and SMC monoculture under identical cultureconditions and measured using BrdU. With the SMCs,we noted that the trypsin treatment failed to detach anumber of the SMCs from the surface and the SMCsthat were removed formed clumps. Since proliferatingcells are less adherent than non-proliferating cells,problems with cell detachment could explain the higherSMC proliferation levels. To examine other differencesbetween FC and BrdU labeling, FC and BrdUmeasurements of EC proliferation were compared(Fig. 3D). The higher level of EC proliferation in theFC experiment is likely due to difficulties in discriminat-ing and gating the population of non-proliferating cellsby FC. In support of this we found that after 2 days ofco-culture the total level of cell proliferations was 1.6%when measured with BrdU. Further, we did not observeovergrowth of EC population by SMCs. These resultssuggest that EC and SMC proliferation in co-culturewas low.
3.3. Effect of SMC phenotype on EC attachment
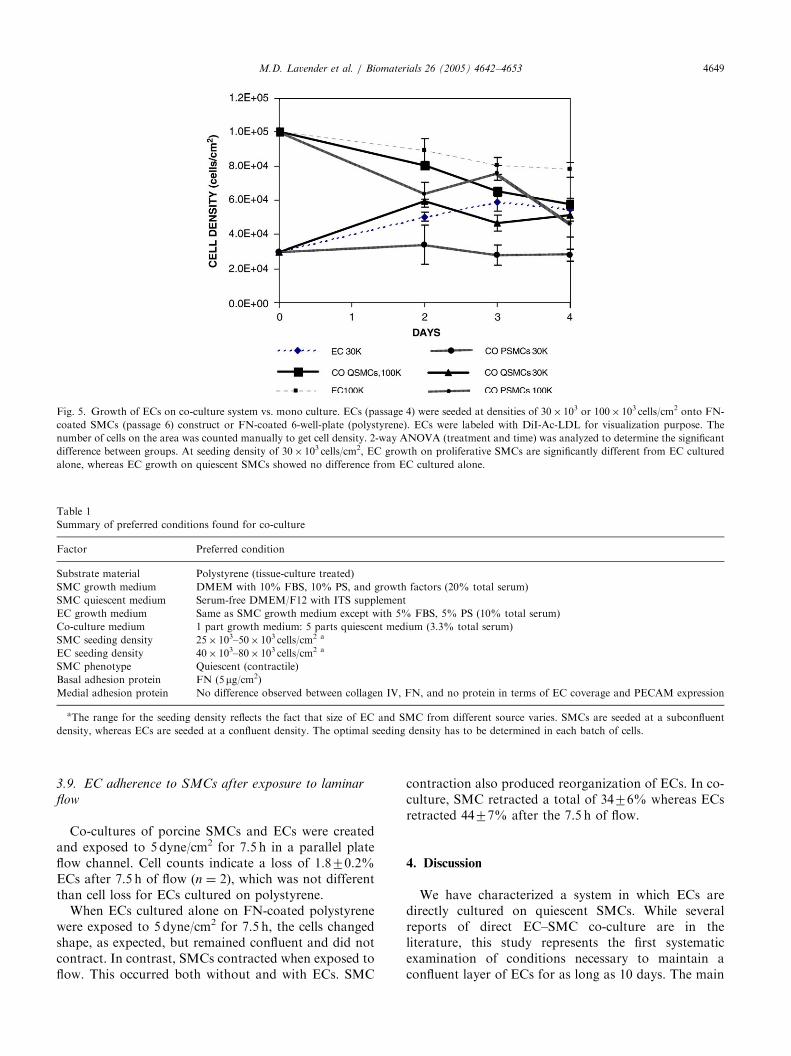
ECs seeded on proliferating SMCs (PSMCs) attachwith lower efficiency than ECs seeded on quiescentSMCs (QSMCs)(Fig. 4). Two days after attachment ofECs to SMCs, ECs were stained with DiI-Ac-LDL todistinguish them from SMCs. The coverage of ECs onPSMC was only 5872%, whereas the coverage of ECson QSMC was 93.671.4%. In addition, ECs did notbind uniformly to proliferating SMCs, rather theyformed in patches and induced a contractile responsein proliferating SMCs (Fig. 4A). EC coverage onproliferative SMCs continuously declined with time,
ARTICLE IN PRESS
Fig. 3. EC and SMC proliferation. (A) EC and SMC proliferation in monoculture detected by BrdU. (B) EC proliferation in co-culture system. ECs
were separated from SMCs by incubation with 0.25% trypsin for 8 min and proliferation was determined by FC of Hoechst nuclear staining of cells.
M.D. Lavender et al. / Biomaterials 26 (2005) 4642–4653 4647
and at day 6, there were few ECs left. ECs seeded ontoQSMC exhibited a uniform binding (Fig. 4B). ECconfluence was maintained for as long as 10 days.
3.4. Effect of adhesion proteins on EC coverage
FN, LN, collagen I, and collagen IV are naturalcomponents in the extracellular matrix, and play animportant role in cell proliferation and differentiation.The effect of these medial proteins (FN at 5 mg/cm2, LNat 2 mg/cm2, collagen I at 10 mg/cm2, collagen IV at10 mg/cm2) upon EC coverage on QSMCs was examined2 days after attachment. In the absence of medialproteins the coverage was 85.2713.4% (n ¼ 4). Col-lagen I and IV did not affect EC coverage on SMCs(n ¼ 4). FN and LN caused a small increase in cellcoverage to 95.579.5% (n ¼ 4) and 104710% (n ¼ 2),respectively. After 5 days of co-culture, coverage was100% for all cases.
3.5. EC growth on quiescent and proliferative SMCs
To examine EC growth in the co-culture, ECs wereseeded at a subconfluent density of 30,000 cells/cm2, ECgrowth on quiescent SMCs was no different than ECgrowth alone, indicating that co-culture with quiescentSMCs did not affect EC growth. Similar results wereobtained by Ziegler et al. [17]. However, on proliferativeSMCs EC number did not increase, suggesting thatproliferative SMCs inhibited EC growth. When ECswere seeded at a superconfluent density of 100,000 cell/cm2, cell density decreased with time in co-culture onboth proliferative SMCs and quiescent SMCs andmonocultures until a density of approximately 60,000cells/cm2, probably representing a stable confluentdensity for EC cultures (Fig. 5). It should be noted thatalthough EC densities on the proliferative SMCs andquiescent SMCs were similar, ECs retracted on pro-liferative SMCs and formed patches with a coverage of50%, as shown in Fig. 4.
ARTICLE IN PRESS
Fig. 4. Effect of SMC growth state on EC attachment. ECs (passage 4)
were stained with DiI-Ac-LDL, detached by trypsinization and
attached to either proliferating SMCs (passage 6) (A) or quiescent
SMCs (passage 6) (B), and examined 2 days later under epifluores-
cence. Scale bar is 50mm.
M.D. Lavender et al. / Biomaterials 26 (2005) 4642–46534648
Based on these experiments, the optimal conditionsfor co-culture system are summarized in Table 1. To geta confluent EC monolayer on SMCs, it is critical to usequiescent SMCs. The final ratio of EC to SMC celldensities ranged between 1:1 and 1:2. These conditionswere used in subsequent experiments.
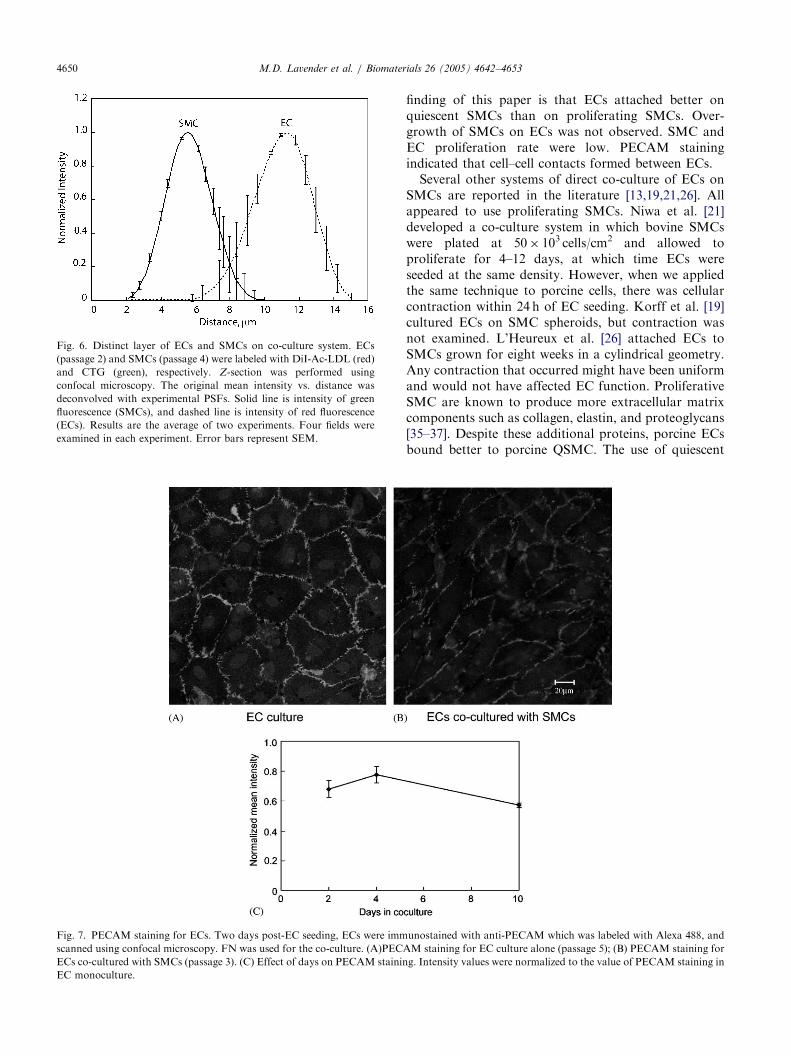
3.6. ECs and SMCs form distinct layers in co-culture
To assess whether ECs and SMCs formed distinctlayers, Z-sections of co-culture were obtained after twodays of co-culture. ECs were labeled with DiI in red, andSMCs were labeled with CTG in green. After deconvo-lution of intensity profile (z-direction) of originalimages, the green and red intensity maxima areseparated by a distance of 5 mm. The clear separationof these two curves indicates that neither migration norgrowth of SMCs was detected above the EC layer,
confirming the presence of two distinct layers of cells inthe co-culture system. The maximum intensities forgreen and red fluorescences are normalized to unityto standardize the difference between these channels.(Fig. 6)
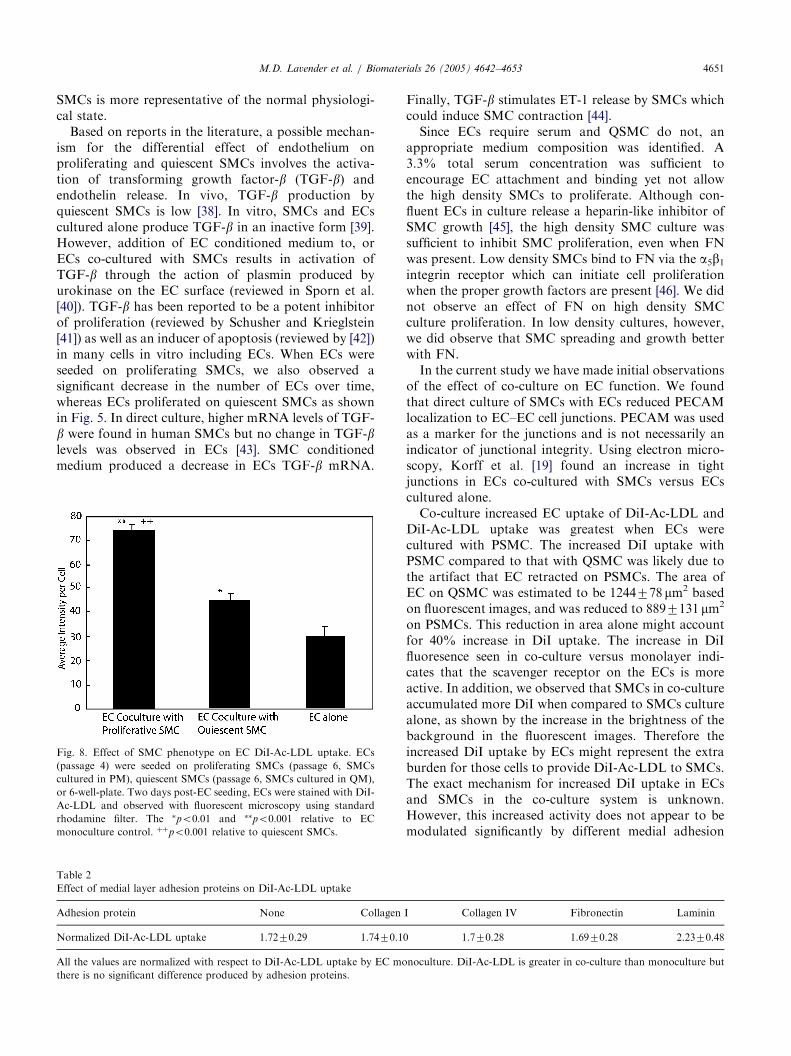
3.7. PECAM staining of ECs in co-culture
PECAM staining was used to verify the state of ECconfluency. When ECs were cultured alone, PECAMstained the borders between cells. In subconfluentcultures, PECAM staining was absent from regionswhere ECs were not in contact with each other (notshown). ECs co-cultured with SMCs showed a decreasein PECAM staining relative to EC culture alone(Fig. 7A and B). In addition, ECs cultured alonedisplayed a typical polygonal morphology, whereasECs in co-cultures showed an elongated morphology.Quantitative analysis of images showed that with FNand collagen IV, the decrease was 32% and 28%(n ¼ 3), confirming that the reduction in PECAMstaining was due to EC–SMC interactions, not due tospecific medial adhesion molecules. Formation ofmature cell junction may take days to complete, andthe reduction of PECAM staining might be dueto insufficient time to form junctions between cells.To test this, we stained co-culture system at a longerperiod (days 4 and 10) using FN in the medial layer.The result is shown in Fig. 7C. PECAM stainingincreased at day 4 post-EC seeding and then decreasedslightly on day 10. The decline in PECAM intensitybetween days 4 and 10 was significant (po0:05), but thedifference in intensity between days 2 and 4 was notsignificant nor was the difference in intensity betweendays 2 and 10.
3.8. Increased endothelial cell DiI-Ac-LDL uptake in co-
culture
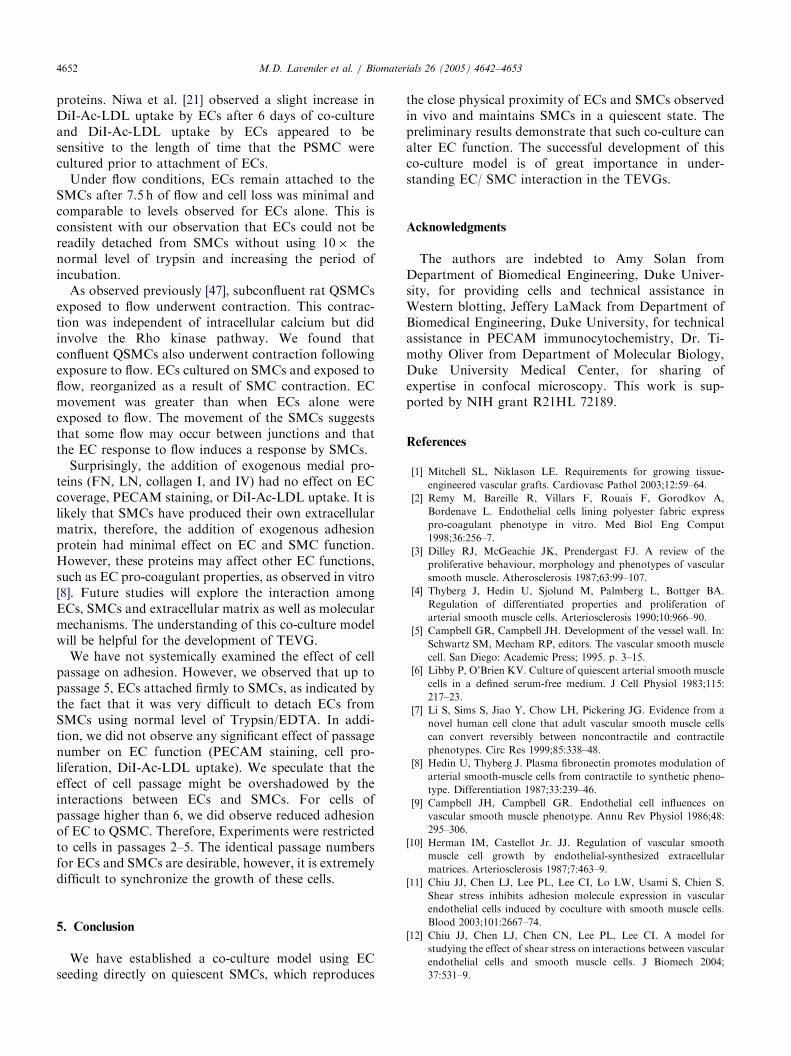
ECs in co-culture accumulated more DiI-Ac-LDLthan in monoculture. The average fluorescent intensityper cell when ECs were in co-culture was greater thanthat when ECs were cultured alone on polystyrene. ECson proliferating SMCs showed the highest fluorescentintensity (74 in the scale from 0 to 255), followed by ECson quiescent SMCs (45), and ECs cultured alone (30)(Fig. 8). All differences were significant (po0:05).Various adhesion proteins had no effect on the uptakeof DiI-Ac-LDL in the co-culture system. Table 2 showsthat there is a 1.7–2.2 fold increase in fluorescentintensity using no protein, collagen I, collagen IV, FN,or LN as medial proteins, indicating that the increasedDiI-Ac-LDL uptake is due to EC–SMC interactions,not due to adhesion protein. SMCs alone did notaccumulate noticeable levels of DiI-Ac-LDL.
ARTICLE IN PRESS
Table 1
Summary of preferred conditions found for co-culture
Factor Preferred condition
Substrate material Polystyrene (tissue-culture treated)
SMC growth medium DMEM with 10% FBS, 10% PS, and growth factors (20% total serum)
SMC quiescent medium Serum-free DMEM/F12 with ITS supplement
EC growth medium Same as SMC growth medium except with 5% FBS, 5% PS (10% total serum)
Co-culture medium 1 part growth medium: 5 parts quiescent medium (3.3% total serum)
SMC seeding density 25� 103–50� 103 cells/cm2 a
EC seeding density 40� 103–80� 103 cells/cm2 a
SMC phenotype Quiescent (contractile)
Basal adhesion protein FN (5mg/cm2)
Medial adhesion protein No difference observed between collagen IV, FN, and no protein in terms of EC coverage and PECAM expression
aThe range for the seeding density reflects the fact that size of EC and SMC from different source varies. SMCs are seeded at a subconfluent
density, whereas ECs are seeded at a confluent density. The optimal seeding density has to be determined in each batch of cells.
Fig. 5. Growth of ECs on co-culture system vs. mono culture. ECs (passage 4) were seeded at densities of 30� 103 or 100� 103 cells/cm2 onto FN-
coated SMCs (passage 6) construct or FN-coated 6-well-plate (polystyrene). ECs were labeled with DiI-Ac-LDL for visualization purpose. The
number of cells on the area was counted manually to get cell density. 2-way ANOVA (treatment and time) was analyzed to determine the significant
difference between groups. At seeding density of 30� 103 cells/cm2, EC growth on proliferative SMCs are significantly different from EC cultured
alone, whereas EC growth on quiescent SMCs showed no difference from EC cultured alone.
M.D. Lavender et al. / Biomaterials 26 (2005) 4642–4653 4649
3.9. EC adherence to SMCs after exposure to laminar
flow
Co-cultures of porcine SMCs and ECs were createdand exposed to 5 dyne/cm2 for 7.5 h in a parallel plateflow channel. Cell counts indicate a loss of 1.870.2%ECs after 7.5 h of flow (n ¼ 2), which was not differentthan cell loss for ECs cultured on polystyrene.
When ECs cultured alone on FN-coated polystyrenewere exposed to 5 dyne/cm2 for 7.5 h, the cells changedshape, as expected, but remained confluent and did notcontract. In contrast, SMCs contracted when exposed toflow. This occurred both without and with ECs. SMC
contraction also produced reorganization of ECs. In co-culture, SMC retracted a total of 3476% whereas ECsretracted 4477% after the 7.5 h of flow.
4. Discussion
We have characterized a system in which ECs aredirectly cultured on quiescent SMCs. While severalreports of direct EC–SMC co-culture are in theliterature, this study represents the first systematicexamination of conditions necessary to maintain aconfluent layer of ECs for as long as 10 days. The main
ARTICLE IN PRESS
Fig. 6. Distinct layer of ECs and SMCs on co-culture system. ECs
(passage 2) and SMCs (passage 4) were labeled with DiI-Ac-LDL (red)
and CTG (green), respectively. Z-section was performed using
confocal microscopy. The original mean intensity vs. distance was
deconvolved with experimental PSFs. Solid line is intensity of green
fluorescence (SMCs), and dashed line is intensity of red fluorescence
(ECs). Results are the average of two experiments. Four fields were
examined in each experiment. Error bars represent SEM.
Fig. 7. PECAM staining for ECs. Two days post-EC seeding, ECs were imm
scanned using confocal microscopy. FN was used for the co-culture. (A)PECA
ECs co-cultured with SMCs (passage 3). (C) Effect of days on PECAM stainin
EC monoculture.
M.D. Lavender et al. / Biomaterials 26 (2005) 4642–46534650
finding of this paper is that ECs attached better onquiescent SMCs than on proliferating SMCs. Over-growth of SMCs on ECs was not observed. SMC andEC proliferation rate were low. PECAM stainingindicated that cell–cell contacts formed between ECs.
Several other systems of direct co-culture of ECs onSMCs are reported in the literature [13,19,21,26]. Allappeared to use proliferating SMCs. Niwa et al. [21]developed a co-culture system in which bovine SMCswere plated at 50� 103 cells/cm2 and allowed toproliferate for 4–12 days, at which time ECs wereseeded at the same density. However, when we appliedthe same technique to porcine cells, there was cellularcontraction within 24 h of EC seeding. Korff et al. [19]cultured ECs on SMC spheroids, but contraction wasnot examined. L’Heureux et al. [26] attached ECs toSMCs grown for eight weeks in a cylindrical geometry.Any contraction that occurred might have been uniformand would not have affected EC function. ProliferativeSMC are known to produce more extracellular matrixcomponents such as collagen, elastin, and proteoglycans[35–37]. Despite these additional proteins, porcine ECsbound better to porcine QSMC. The use of quiescent
unostained with anti-PECAM which was labeled with Alexa 488, and
M staining for EC culture alone (passage 5); (B) PECAM staining for
g. Intensity values were normalized to the value of PECAM staining in
ARTICLE IN PRESSM.D. Lavender et al. / Biomaterials 26 (2005) 4642–4653 4651
SMCs is more representative of the normal physiologi-cal state.
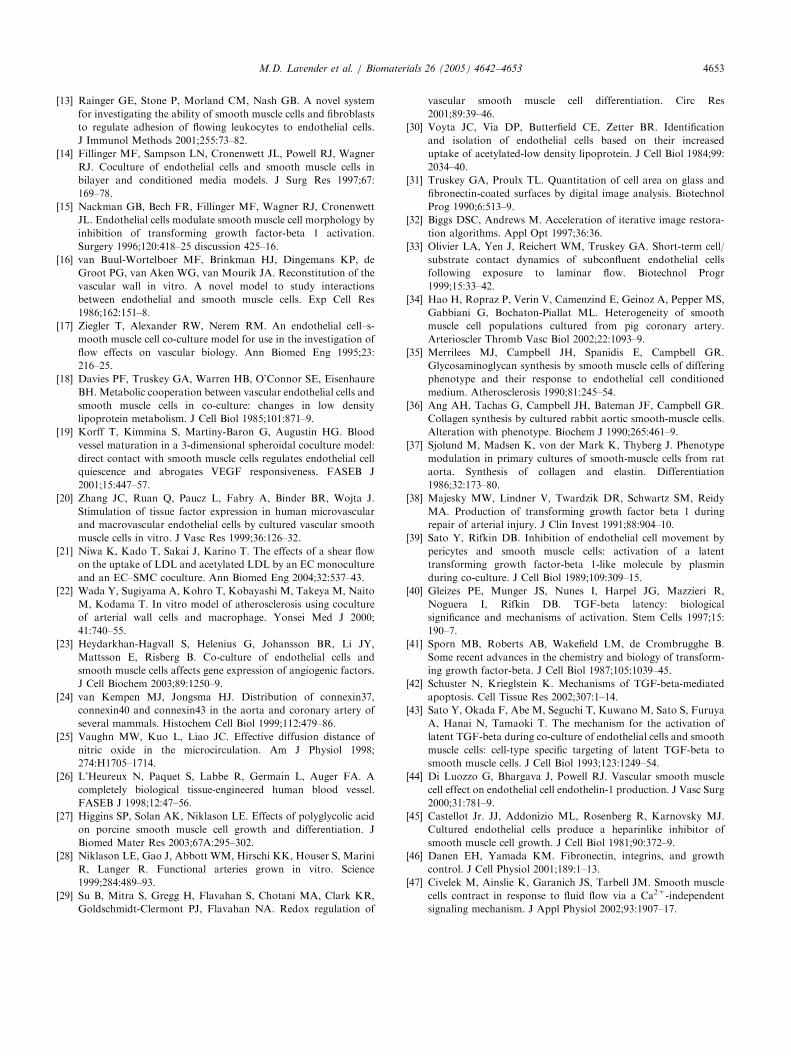
Based on reports in the literature, a possible mechan-ism for the differential effect of endothelium onproliferating and quiescent SMCs involves the activa-tion of transforming growth factor-b (TGF-b) andendothelin release. In vivo, TGF-b production byquiescent SMCs is low [38]. In vitro, SMCs and ECscultured alone produce TGF-b in an inactive form [39].However, addition of EC conditioned medium to, orECs co-cultured with SMCs results in activation ofTGF-b through the action of plasmin produced byurokinase on the EC surface (reviewed in Sporn et al.[40]). TGF-b has been reported to be a potent inhibitorof proliferation (reviewed by Schusher and Krieglstein[41]) as well as an inducer of apoptosis (reviewed by [42])in many cells in vitro including ECs. When ECs wereseeded on proliferating SMCs, we also observed asignificant decrease in the number of ECs over time,whereas ECs proliferated on quiescent SMCs as shownin Fig. 5. In direct culture, higher mRNA levels of TGF-b were found in human SMCs but no change in TGF-blevels was observed in ECs [43]. SMC conditionedmedium produced a decrease in ECs TGF-b mRNA.
Fig. 8. Effect of SMC phenotype on EC DiI-Ac-LDL uptake. ECs
(passage 4) were seeded on proliferating SMCs (passage 6, SMCs
cultured in PM), quiescent SMCs (passage 6, SMCs cultured in QM),
or 6-well-plate. Two days post-EC seeding, ECs were stained with DiI-
Ac-LDL and observed with fluorescent microscopy using standard
rhodamine filter. The �po0:01 and ��po0:001 relative to EC
monoculture control. þþpo0:001 relative to quiescent SMCs.
Table 2
Effect of medial layer adhesion proteins on DiI-Ac-LDL uptake
Adhesion protein None Collagen
Normalized DiI-Ac-LDL uptake 1.7270.29 1.7470.1
All the values are normalized with respect to DiI-Ac-LDL uptake by EC mo
there is no significant difference produced by adhesion proteins.
Finally, TGF-b stimulates ET-1 release by SMCs whichcould induce SMC contraction [44].
Since ECs require serum and QSMC do not, anappropriate medium composition was identified. A3.3% total serum concentration was sufficient toencourage EC attachment and binding yet not allowthe high density SMCs to proliferate. Although con-fluent ECs in culture release a heparin-like inhibitor ofSMC growth [45], the high density SMC culture wassufficient to inhibit SMC proliferation, even when FNwas present. Low density SMCs bind to FN via the a5b1
integrin receptor which can initiate cell proliferationwhen the proper growth factors are present [46]. We didnot observe an effect of FN on high density SMCculture proliferation. In low density cultures, however,we did observe that SMC spreading and growth betterwith FN.
In the current study we have made initial observationsof the effect of co-culture on EC function. We foundthat direct culture of SMCs with ECs reduced PECAMlocalization to EC–EC cell junctions. PECAM was usedas a marker for the junctions and is not necessarily anindicator of junctional integrity. Using electron micro-scopy, Korff et al. [19] found an increase in tightjunctions in ECs co-cultured with SMCs versus ECscultured alone.
Co-culture increased EC uptake of DiI-Ac-LDL andDiI-Ac-LDL uptake was greatest when ECs werecultured with PSMC. The increased DiI uptake withPSMC compared to that with QSMC was likely due tothe artifact that EC retracted on PSMCs. The area ofEC on QSMC was estimated to be 1244778 mm2 basedon fluorescent images, and was reduced to 8897131 mm2
on PSMCs. This reduction in area alone might accountfor 40% increase in DiI uptake. The increase in DiIfluoresence seen in co-culture versus monolayer indi-cates that the scavenger receptor on the ECs is moreactive. In addition, we observed that SMCs in co-cultureaccumulated more DiI when compared to SMCs culturealone, as shown by the increase in the brightness of thebackground in the fluorescent images. Therefore theincreased DiI uptake by ECs might represent the extraburden for those cells to provide DiI-Ac-LDL to SMCs.The exact mechanism for increased DiI uptake in ECsand SMCs in the co-culture system is unknown.However, this increased activity does not appear to bemodulated significantly by different medial adhesion
I Collagen IV Fibronectin Laminin
0 1.770.28 1.6970.28 2.2370.48
noculture. DiI-Ac-LDL is greater in co-culture than monoculture but
ARTICLE IN PRESSM.D. Lavender et al. / Biomaterials 26 (2005) 4642–46534652
proteins. Niwa et al. [21] observed a slight increase inDiI-Ac-LDL uptake by ECs after 6 days of co-cultureand DiI-Ac-LDL uptake by ECs appeared to besensitive to the length of time that the PSMC werecultured prior to attachment of ECs.
Under flow conditions, ECs remain attached to theSMCs after 7.5 h of flow and cell loss was minimal andcomparable to levels observed for ECs alone. This isconsistent with our observation that ECs could not bereadily detached from SMCs without using 10� thenormal level of trypsin and increasing the period ofincubation.
As observed previously [47], subconfluent rat QSMCsexposed to flow underwent contraction. This contrac-tion was independent of intracellular calcium but didinvolve the Rho kinase pathway. We found thatconfluent QSMCs also underwent contraction followingexposure to flow. ECs cultured on SMCs and exposed toflow, reorganized as a result of SMC contraction. ECmovement was greater than when ECs alone wereexposed to flow. The movement of the SMCs suggeststhat some flow may occur between junctions and thatthe EC response to flow induces a response by SMCs.
Surprisingly, the addition of exogenous medial pro-teins (FN, LN, collagen I, and IV) had no effect on ECcoverage, PECAM staining, or DiI-Ac-LDL uptake. It islikely that SMCs have produced their own extracellularmatrix, therefore, the addition of exogenous adhesionprotein had minimal effect on EC and SMC function.However, these proteins may affect other EC functions,such as EC pro-coagulant properties, as observed in vitro[8]. Future studies will explore the interaction amongECs, SMCs and extracellular matrix as well as molecularmechanisms. The understanding of this co-culture modelwill be helpful for the development of TEVG.
We have not systemically examined the effect of cellpassage on adhesion. However, we observed that up topassage 5, ECs attached firmly to SMCs, as indicated bythe fact that it was very difficult to detach ECs fromSMCs using normal level of Trypsin/EDTA. In addi-tion, we did not observe any significant effect of passagenumber on EC function (PECAM staining, cell pro-liferation, DiI-Ac-LDL uptake). We speculate that theeffect of cell passage might be overshadowed by theinteractions between ECs and SMCs. For cells ofpassage higher than 6, we did observe reduced adhesionof EC to QSMC. Therefore, Experiments were restrictedto cells in passages 2–5. The identical passage numbersfor ECs and SMCs are desirable, however, it is extremelydifficult to synchronize the growth of these cells.
5. Conclusion
We have established a co-culture model using ECseeding directly on quiescent SMCs, which reproduces
the close physical proximity of ECs and SMCs observedin vivo and maintains SMCs in a quiescent state. Thepreliminary results demonstrate that such co-culture canalter EC function. The successful development of thisco-culture model is of great importance in under-standing EC/ SMC interaction in the TEVGs.
Acknowledgments
The authors are indebted to Amy Solan fromDepartment of Biomedical Engineering, Duke Univer-sity, for providing cells and technical assistance inWestern blotting, Jeffery LaMack from Department ofBiomedical Engineering, Duke University, for technicalassistance in PECAM immunocytochemistry, Dr. Ti-mothy Oliver from Department of Molecular Biology,Duke University Medical Center, for sharing ofexpertise in confocal microscopy. This work is sup-ported by NIH grant R21HL 72189.
References
[1] Mitchell SL, Niklason LE. Requirements for growing tissue-
engineered vascular grafts. Cardiovasc Pathol 2003;12:59–64.
[2] Remy M, Bareille R, Villars F, Rouais F, Gorodkov A,
Bordenave L. Endothelial cells lining polyester fabric express
pro-coagulant phenotype in vitro. Med Biol Eng Comput
1998;36:256–7.
[3] Dilley RJ, McGeachie JK, Prendergast FJ. A review of the
proliferative behaviour, morphology and phenotypes of vascular
smooth muscle. Atherosclerosis 1987;63:99–107.
[4] Thyberg J, Hedin U, Sjolund M, Palmberg L, Bottger BA.
Regulation of differentiated properties and proliferation of
arterial smooth muscle cells. Arteriosclerosis 1990;10:966–90.
[5] Campbell GR, Campbell JH. Development of the vessel wall. In:
Schwartz SM, Mecham RP, editors. The vascular smooth muscle
cell. San Diego: Academic Press; 1995. p. 3–15.
[6] Libby P, O’Brien KV. Culture of quiescent arterial smooth muscle
cells in a defined serum-free medium. J Cell Physiol 1983;115:
217–23.
[7] Li S, Sims S, Jiao Y, Chow LH, Pickering JG. Evidence from a
novel human cell clone that adult vascular smooth muscle cells
can convert reversibly between noncontractile and contractile
phenotypes. Circ Res 1999;85:338–48.
[8] Hedin U, Thyberg J. Plasma fibronectin promotes modulation of
arterial smooth-muscle cells from contractile to synthetic pheno-
type. Differentiation 1987;33:239–46.
[9] Campbell JH, Campbell GR. Endothelial cell influences on
vascular smooth muscle phenotype. Annu Rev Physiol 1986;48:
295–306.
[10] Herman IM, Castellot Jr. JJ. Regulation of vascular smooth
muscle cell growth by endothelial-synthesized extracellular
matrices. Arteriosclerosis 1987;7:463–9.
[11] Chiu JJ, Chen LJ, Lee PL, Lee CI, Lo LW, Usami S, Chien S.
Shear stress inhibits adhesion molecule expression in vascular
endothelial cells induced by coculture with smooth muscle cells.
Blood 2003;101:2667–74.
[12] Chiu JJ, Chen LJ, Chen CN, Lee PL, Lee CI. A model for
studying the effect of shear stress on interactions between vascular
endothelial cells and smooth muscle cells. J Biomech 2004;
37:531–9.
ARTICLE IN PRESSM.D. Lavender et al. / Biomaterials 26 (2005) 4642–4653 4653
[13] Rainger GE, Stone P, Morland CM, Nash GB. A novel system
for investigating the ability of smooth muscle cells and fibroblasts
to regulate adhesion of flowing leukocytes to endothelial cells.
J Immunol Methods 2001;255:73–82.
[14] Fillinger MF, Sampson LN, Cronenwett JL, Powell RJ, Wagner
RJ. Coculture of endothelial cells and smooth muscle cells in
bilayer and conditioned media models. J Surg Res 1997;67:
169–78.
[15] Nackman GB, Bech FR, Fillinger MF, Wagner RJ, Cronenwett
JL. Endothelial cells modulate smooth muscle cell morphology by
inhibition of transforming growth factor-beta 1 activation.
Surgery 1996;120:418–25 discussion 425–16.
[16] van Buul-Wortelboer MF, Brinkman HJ, Dingemans KP, de
Groot PG, van Aken WG, van Mourik JA. Reconstitution of the
vascular wall in vitro. A novel model to study interactions
between endothelial and smooth muscle cells. Exp Cell Res
1986;162:151–8.
[17] Ziegler T, Alexander RW, Nerem RM. An endothelial cell–s-
mooth muscle cell co-culture model for use in the investigation of
flow effects on vascular biology. Ann Biomed Eng 1995;23:
216–25.
[18] Davies PF, Truskey GA, Warren HB, O’Connor SE, Eisenhaure
BH. Metabolic cooperation between vascular endothelial cells and
smooth muscle cells in co-culture: changes in low density
lipoprotein metabolism. J Cell Biol 1985;101:871–9.
[19] Korff T, Kimmina S, Martiny-Baron G, Augustin HG. Blood
vessel maturation in a 3-dimensional spheroidal coculture model:
direct contact with smooth muscle cells regulates endothelial cell
quiescence and abrogates VEGF responsiveness. FASEB J
2001;15:447–57.
[20] Zhang JC, Ruan Q, Paucz L, Fabry A, Binder BR, Wojta J.
Stimulation of tissue factor expression in human microvascular
and macrovascular endothelial cells by cultured vascular smooth
muscle cells in vitro. J Vasc Res 1999;36:126–32.
[21] Niwa K, Kado T, Sakai J, Karino T. The effects of a shear flow
on the uptake of LDL and acetylated LDL by an EC monoculture
and an EC–SMC coculture. Ann Biomed Eng 2004;32:537–43.
[22] Wada Y, Sugiyama A, Kohro T, Kobayashi M, Takeya M, Naito
M, Kodama T. In vitro model of atherosclerosis using coculture
of arterial wall cells and macrophage. Yonsei Med J 2000;
41:740–55.
[23] Heydarkhan-Hagvall S, Helenius G, Johansson BR, Li JY,
Mattsson E, Risberg B. Co-culture of endothelial cells and
smooth muscle cells affects gene expression of angiogenic factors.
J Cell Biochem 2003;89:1250–9.
[24] van Kempen MJ, Jongsma HJ. Distribution of connexin37,
connexin40 and connexin43 in the aorta and coronary artery of
several mammals. Histochem Cell Biol 1999;112:479–86.
[25] Vaughn MW, Kuo L, Liao JC. Effective diffusion distance of
nitric oxide in the microcirculation. Am J Physiol 1998;
274:H1705–1714.
[26] L’Heureux N, Paquet S, Labbe R, Germain L, Auger FA. A
completely biological tissue-engineered human blood vessel.
FASEB J 1998;12:47–56.
[27] Higgins SP, Solan AK, Niklason LE. Effects of polyglycolic acid
on porcine smooth muscle cell growth and differentiation. J
Biomed Mater Res 2003;67A:295–302.
[28] Niklason LE, Gao J, Abbott WM, Hirschi KK, Houser S, Marini
R, Langer R. Functional arteries grown in vitro. Science
1999;284:489–93.
[29] Su B, Mitra S, Gregg H, Flavahan S, Chotani MA, Clark KR,
Goldschmidt-Clermont PJ, Flavahan NA. Redox regulation of
vascular smooth muscle cell differentiation. Circ Res
2001;89:39–46.
[30] Voyta JC, Via DP, Butterfield CE, Zetter BR. Identification
and isolation of endothelial cells based on their increased
uptake of acetylated-low density lipoprotein. J Cell Biol 1984;99:
2034–40.
[31] Truskey GA, Proulx TL. Quantitation of cell area on glass and
fibronectin-coated surfaces by digital image analysis. Biotechnol
Prog 1990;6:513–9.
[32] Biggs DSC, Andrews M. Acceleration of iterative image restora-
tion algorithms. Appl Opt 1997;36:36.
[33] Olivier LA, Yen J, Reichert WM, Truskey GA. Short-term cell/
substrate contact dynamics of subconfluent endothelial cells
following exposure to laminar flow. Biotechnol Progr
1999;15:33–42.
[34] Hao H, Ropraz P, Verin V, Camenzind E, Geinoz A, Pepper MS,
Gabbiani G, Bochaton-Piallat ML. Heterogeneity of smooth
muscle cell populations cultured from pig coronary artery.
Arterioscler Thromb Vasc Biol 2002;22:1093–9.
[35] Merrilees MJ, Campbell JH, Spanidis E, Campbell GR.
Glycosaminoglycan synthesis by smooth muscle cells of differing
phenotype and their response to endothelial cell conditioned
medium. Atherosclerosis 1990;81:245–54.
[36] Ang AH, Tachas G, Campbell JH, Bateman JF, Campbell GR.
Collagen synthesis by cultured rabbit aortic smooth-muscle cells.
Alteration with phenotype. Biochem J 1990;265:461–9.
[37] Sjolund M, Madsen K, von der Mark K, Thyberg J. Phenotype
modulation in primary cultures of smooth-muscle cells from rat
aorta. Synthesis of collagen and elastin. Differentiation
1986;32:173–80.
[38] Majesky MW, Lindner V, Twardzik DR, Schwartz SM, Reidy
MA. Production of transforming growth factor beta 1 during
repair of arterial injury. J Clin Invest 1991;88:904–10.
[39] Sato Y, Rifkin DB. Inhibition of endothelial cell movement by
pericytes and smooth muscle cells: activation of a latent
transforming growth factor-beta 1-like molecule by plasmin
during co-culture. J Cell Biol 1989;109:309–15.
[40] Gleizes PE, Munger JS, Nunes I, Harpel JG, Mazzieri R,
Noguera I, Rifkin DB. TGF-beta latency: biological
significance and mechanisms of activation. Stem Cells 1997;15:
190–7.
[41] Sporn MB, Roberts AB, Wakefield LM, de Crombrugghe B.
Some recent advances in the chemistry and biology of transform-
ing growth factor-beta. J Cell Biol 1987;105:1039–45.
[42] Schuster N, Krieglstein K. Mechanisms of TGF-beta-mediated
apoptosis. Cell Tissue Res 2002;307:1–14.
[43] Sato Y, Okada F, Abe M, Seguchi T, Kuwano M, Sato S, Furuya
A, Hanai N, Tamaoki T. The mechanism for the activation of
latent TGF-beta during co-culture of endothelial cells and smooth
muscle cells: cell-type specific targeting of latent TGF-beta to
smooth muscle cells. J Cell Biol 1993;123:1249–54.
[44] Di Luozzo G, Bhargava J, Powell RJ. Vascular smooth muscle
cell effect on endothelial cell endothelin-1 production. J Vasc Surg
2000;31:781–9.
[45] Castellot Jr. JJ, Addonizio ML, Rosenberg R, Karnovsky MJ.
Cultured endothelial cells produce a heparinlike inhibitor of
smooth muscle cell growth. J Cell Biol 1981;90:372–9.
[46] Danen EH, Yamada KM. Fibronectin, integrins, and growth
control. J Cell Physiol 2001;189:1–13.
[47] Civelek M, Ainslie K, Garanich JS, Tarbell JM. Smooth muscle
cells contract in response to fluid flow via a Ca2+-independent
signaling mechanism. J Appl Physiol 2002;93:1907–17.