
A synthetic, Electrochemical and Kinetic study of the phosphorus ...
88
1 Synthetic, electrochemical and kinetic studies of phosphinites and their rhodium(I) complexes A dissertation submitted in accordance with the requirements for the degree Magister Scientiae In the Faculty of Natural and Agricultural Science Department of Chemistry At the University of the Free State By Pholani Sakhile Manana Supervisor Dr. E. Erasmus
-
Upload
khangminh22 -
Category
Documents
-
view
2 -
download
0
Transcript of A synthetic, Electrochemical and Kinetic study of the phosphorus ...
1
Synthetic, electrochemical and kinetic studies of
phosphinites and their rhodium(I) complexes
A dissertation submitted in accordance with the requirements for the
degree
Magister Scientiae
In the
Faculty of Natural and Agricultural Science
Department of Chemistry
At the
University of the Free State
By
Pholani Sakhile Manana
Supervisor
Dr. E. Erasmus

2
Acknowledgements
In the beginning was the Word and the Word was with GOD and the Word was GOD, it’s by
GOD and through GOD that I have come this far. And many more still remains.
To my supervisor and my academic mentor, who took her precious time and academic
knowledge to introduce me to the vast world of academia, Dr E. Erasmus, I am greatly
thankful and I can never repay your assistance. I hope to make you proud in my academic
path. Also in the academic world I would like to appreciate Prof. J.C Swarts who was my
first year lecturer and motivator towards pursuing further studies in chemistry, thank you
very much. May you continue to explore gems for the academic world.
To the most beautiful, caring and loving Mother, Thulisile Manana, words can never cover
your character and personality, GOD bless you. To my Daddy Mvuseleli Manana and my
siblings, Lihle, Yenziwe and Mbuyisa thank you for the support.
To the best academic environment Physical Chemistry Group, you rock. Keep the friendships
going, one can never feel out in the office or lab.
As for all the crazy people I call family the head-master Thobile; Mamusa, Khanya, Dika,
Thembani, Ruswa, Majola, Lefa, Muano and the rest High five.
I am also grateful for the financial support I received from the National Research Fund for
making it possible for me fulfil my academic responsibilities.
This is only the beginning….
Mcusi Manana
3
Table of contents
List of Abbreviations 7
1 Introduction and Aim 9
1.1Introduction 9
1.2 Aims of this study 10
1.3 Reference 11
2 Literature Survey 12
2.1 Introduction 12
2.2 Phosphorus chemistry 12
2.2.1 Introduction 12
2.2.2 Chemical properties of phosphorus compounds 12
2.2.3 Phosphines 13
2.2.4 Phosphinite 15
2.2.5 Determining the electronic and steric properties 16
2.3 Rhodium 18
2.3.1 Introduction 18
2.3.2 Catalytic properties 19
2.3.2.1 Carbonylation reaction 19
2.3.2. 2 Hydrogenation 21
2.3.2.3 Hydroformylation 22
2.4 Electrochemistry 23
2.4.1 Introduction 23
2.4.2 Solvents, electrolytes and internal standards 24
2.4.3 Cyclic Voltammetry 25
2.4.4 Electrochemistry of rhodium complexes 27
2.5 Kinetics 29
2.5.1 Introduction 29
2.5.2 Oxidative addition reactions 30
4
2.5.3 Oxidative addition onto rhodium complexes 31
2.5.4 Activation parameters 32
2.6 References 33
3 Results and Discussion 36
3.1 Introduction 36
3.2 Synthesis 36
3.2.1 Synthesis of the organophosphorus ligands 36
3.2.2 Synthesis of the rhodium complexes 39
3.3 Electrochemistry 43
3.3.1 Electrochemistry of the organophosphorus ligands, 6-11 43
3.3.2 Electrochemistry of the rhodium complexes 48
3.4 Kinetics 50
3.4.1 Validation of Beer Lambert law and determination of extinction coefficients 51
3.4.2 The oxidative addition of CH3I onto Rh(H3CCOCHCOCH3)CO(C6H5XPPh2), where X = O
(11), S (14) and NH (15) monitored by UV/Vis spectroscopy 53
3.4.3 The oxidative addition of CH3I onto Rh(H3CCOCHCOCH3)CO(C6H5XPPh2), where X = O
(11), S (14) and NH (15) monitored by IR spectroscopy 58
3.4.4 Correlation of the kinetic rate constants of the reaction between CH3I and
Rh(H3CCOCHCOCH3)CO(C6H5XPPh2), where X = O (11), S (14) and NH (15) as obtained by
various spectroscopic methods 61
3.4.5 Conclusion 61
3.5 References 62
4 Experimental 63
4.1 Introduction 63
4.2 Materials 63
4.3 Spectroscopic measurements 63
4.4 Electrochemistry 64
4.5 Kinetic studies 64
4.6 Synthesis 65
4.6.1 Synthesis of phosphinite ligands 65
5
4.6.1.1 Phenyl diphenylphosphinite, C6H5OPPh2, 6 65
4.6.1.2 Bis(P,P-diphenyl)-P,P-1,4-phenylene ester. para-Ph2POC6H4OPPh2, 7 66
4.6.1.3 Bis(P,P-diphenyl)-P,P-1,3-phenylene ester, meta-Ph2POC6H4OPPh2, 8 67
4.6.1.4 Diphenylphosphinothious acid, C6H5SPPh2, 9 67
4.6.1.5 Diphenylphosphino amide C6H5NHPPh2, 10 68
4.6.2 Synthesis of the Rhodium complexes 68
4.6.2.1 [Rh(acac)CO(C6H
4OPPh
2)], 11 69
4.6.2.2 [(Rh(acac)CO(Ph2POC
6H
4-p-OPPh
2)], 12 69
4.6.2.3 [(Rh(acac)CO(Ph2POC
6H
4-m-OPPh
2)], 13 70
4.6.2.4 [Rh(acac)CO(C6H
4SPPh
2)], 14 70
4.6.2.5 [Rh(acac)CO(C6H
4NHPPh
2)], 15 71
4.7 References 71
5 Summary and Future Perspectives 72
A Appendix 1H and
31P NMR 75
1H NMR spectra 75
Spectrum A1: Phenyl diphenylphosphinite, C6H5OPPh2, 6 75
Spectrum A2: Bis(P,P-diphenyl)-P,P-1,4-phenylene ester. para-Ph2POC6H4OPPh2, 7 76
Spectrum A3: Bis(P,P-diphenyl)-P,P-1,3-phenylene ester, meta-Ph2POC6H4OPPh2, 8 76
Spectrum A4: Diphenylphosphinothious acid, C6H5SPPh2, 9 77
Spectrum A5: Diphenylphosphino amide C6H5NHPPh2, 10 77
Spectrum A6: [Rh(acac)CO(C6H
4OPPh
2)], 11 78
Spectrum A7: [(Rh(acac)CO(Ph2POC
6H
4p-OPPh
2)], 12 78
Spectrum A8: [(Rh(acac)CO(Ph2POC6H4-m-OPPh2)], 13 79
Spectrum A9: [Rh(acac)CO(C6H
4SPPh
2)], 14 79
Spectrum A10: [Rh(acac)CO(C6H
4NHPPh
2)], 15 80
31P NMR spectra 81
Spectrum A11: Phenyl diphenylphosphinite, C6H5OPPh2, 6 81
6
Spectrum A12: Bis(P,P-diphenyl)-P,P-1,4-phenylene ester. para-Ph2POC6H4OPPh2, 7 81
Spectrum A13: Bis(P,P-diphenyl)-P,P-1,3-phenylene ester, meta-Ph2POC6H4OPPh2, 8 82
Spectrum A14: Diphenylphosphinothious acid, C6H5SPPh2, 9 82
Spectrum A15: Diphenylphosphino amide C6H5NHPPh2, 10 83
Spectrum A16: [Rh(acac)CO(C6H4OPPh2)], 11 83
Spectrum A17: [(Rh(acac)CO(Ph2POC6H4-p-OPPh2)], 12 84
Spectrum A18: [(Rh(acac)CO(Ph2POC6H4-m-OPPh2)], 13 84
Spectrum A19: [Rh(acac)CO(C6H4SPPh2)], 14 85
Spectrum A20: [Rh(acac)CO(C6H4NHPPh2)], 15 85
Abstract 86
Opsomming 87
7
List of Abbreviations
A absorbance
pKa acid dissociation constant
CH3CN acetonitrile
kB Boltzmann‟s constant
CO carbon monoxide or carbonyl
M central metal atom
CV cyclic voltammetry
δ chemical shift
ClPPh2 Chlorodiphenylphosphine
Δ delta
ΔS* entropy of activation
ΔH* enthalpy of activation
E°' formal reduction potential
FcH ferrocene
Fc ferrocenyl
FTIR Fourier Transformer Infra-red
χR group electronegativity (Gordy scale)
LSV linear sweep voltammetry
ε molar extinction coefficient
Me methyl
MeI methyl Iodide
Kobs observed rate constant
l path length
Epa peak oxidation potential
Epc peak reduction potential
1H NMR Proton Nuclear Magnetic Resonance
31P NMR Phosphorus Nuclear Magnetic Resonance
h Planck‟s constant
Ph Phenyl
ppm parts per million
k rate

8
υ stretching frequency/ scan rate
SWV square wave voltammetry
ΔEp separation of anodic and cathodic peak potential
THF tetrahydrofuran
[NnBu4][PF6] tetrabutylammonium hexafluorophosphate
T temperature
t time
UV/vis ultraviolet-visible
λ wavelength
9
1 Introduction and Aim
1.1 Introduction
Phosphorus has the ability to bind to many other elements, with various coordination
numbers. Probably the most famous class of phosphorus compounds is the organophosphorus
compounds. These are compounds where the phosphorus atom is bound to carbon, including
compounds like phosphines (PR3), phosphinites (P(OR)R2), phosphonites (P(OR)2R),
phosphinates (P=O(OR)R2) and many more.1,2
Organophosphorus compounds are normally used as ligands in coordination chemistry or
homogeneous catalysis.3,4,5
The most commonly used metals in catalysis are the platinum
group metals. Organophosphorus-containing rhodium complexes in particular have been
studied as homogeneous catalysts for hydroformylation, hydrogenation and carbonylation of
methanol in the Monsanto process to liberate acetic acid.6,7
The reaction mechanism of many
catalytic processes including that of the well-known Monsanto process, this process involves
the oxidative addition of a suitable substrate to the central metal, migration and insertion of
the appropriate ligand (for instance CO in the Monsanto process) between metal and
coordinated product. This is subsequently followed by reductive elimination of the final
product, making the catalyst ready for the next catalytic cycle. The fundamental steps during
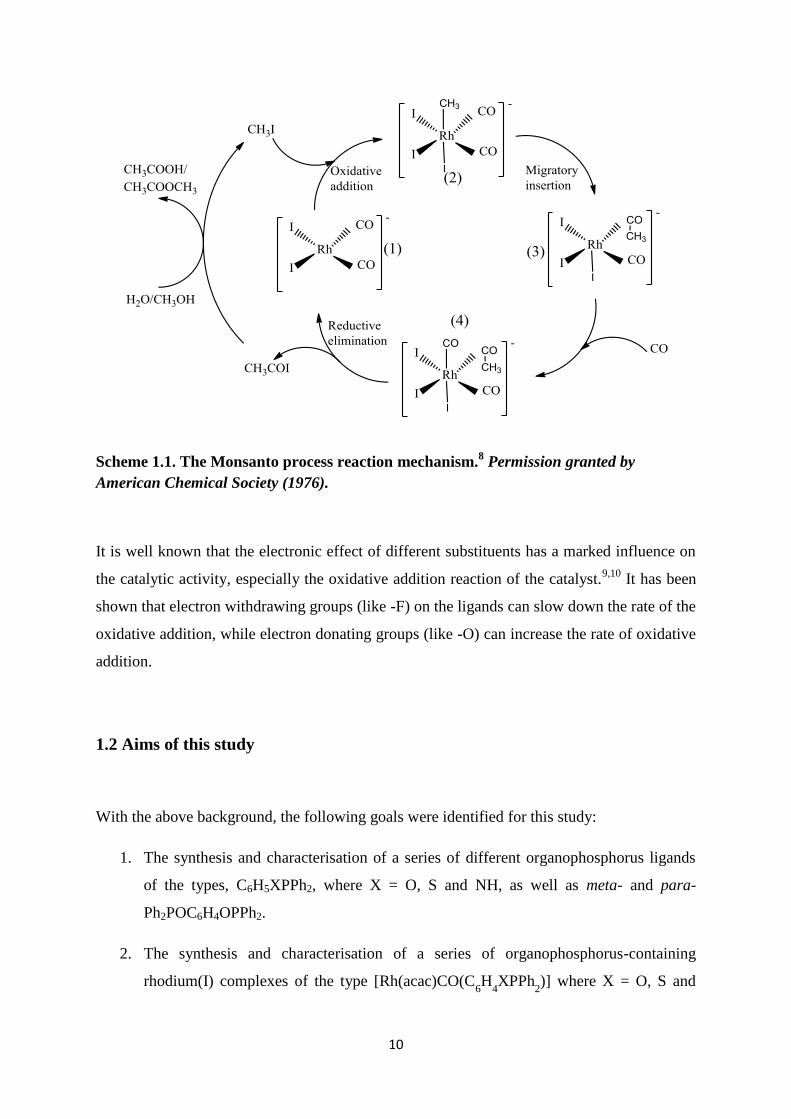
the catalytic cycle of the Monsanto process are shown in (Scheme 1.1.)
10
Scheme 1.1. The Monsanto process reaction mechanism.8 Permission granted by
American Chemical Society (1976).
It is well known that the electronic effect of different substituents has a marked influence on
the catalytic activity, especially the oxidative addition reaction of the catalyst.9,10
It has been
shown that electron withdrawing groups (like -F) on the ligands can slow down the rate of the
oxidative addition, while electron donating groups (like -O) can increase the rate of oxidative
addition.
1.2 Aims of this study
With the above background, the following goals were identified for this study:
1. The synthesis and characterisation of a series of different organophosphorus ligands
of the types, C6H5XPPh2, where X = O, S and NH, as well as meta- and para-
Ph2POC6H4OPPh2.
2. The synthesis and characterisation of a series of organophosphorus-containing
rhodium(I) complexes of the type [Rh(acac)CO(C6H
4XPPh
2)] where X = O, S and
11
NH, as well as [(Rh(acac)CO(Ph2POC
6H
4-m-OPPh
2)] and [(Rh(acac)CO(Ph
2POC
6H
4-
p-OPPh2)].
3. A kinetic study of the oxidative addition reaction between selected rhodium (I)
complexes and methyl iodide by means of UV/Vis and FTIR.
4. An electrochemical study of the organophosphorus ligands and their rhodium (I)
complexes.
1.3 Reference
1 M. M. Rahman, L. Hong-Ye, E. Klaas , P. Alfred, W.P. Giering, Organometallics., 1989, 8, 1.
2 C. A. Tolman, J. Amer. Chem. Soc., 1970, 92, 2953. 3 R. B. Bedford, S. M. Draper, P .N. Scully, S. L. Welch, New J. Chem., 2000, 24, 745. 4 P. A. Evans, J. D. Nelson, Tetrahedron Letters., 1998, 39, 1725. 5 J. Klosin, C. R. Landis, Acc. Chem. Res., 2007, 40, 1251. 6 J.J.C. Erasmus, J. Conradie, Inorganica Chimica Acta., 2011, 375, 128. 7 P. Jaunky, H. W. Schmalle, O. Blacque, T. Fox, H. Berke, J. Organo. Chem., 2005, 690, 1429. 8 D. Forster, J. Am. Chem. Soc., 1976, 98, 846. 9 J. Rankin, A. D. Poole, A. C. Benyei, D. J. Cole-Hamilton, Chem. Commun., 1997, 1835 10 C.M. Thomas, G. Süss-Fink , Coordination Chemistry Reviews., 2003, 243, 125.
12
2 Literature Survey
2.1 Introduction
This chapter covers the relevant literature concerning the synthesis of organophosphorus
(including phosphinite) ligands and their associated phosphorus-containing rhodium (I)
complexes. The chemical and electrochemical behaviour of phosphorus ligands and
phosphorus-containing rhodium (I) complexes as well as the kinetic aspects of some rhodium
complexes will be reviewed.
2.2 Phosphorus chemistry
2.2.1 Introduction
It is believed that during the seventeenth century Hennig Brandt, an alchemist, discovered
phosphorus while trying to make gold. Phosphorus is a Greek word meaning the light bearer.
This is due to the fact that in its pure form, phosphorus is a luminous solid that glows in the
dark.11
Since it ignites at 30ºC, it is normally stored under inert conditions or under water.
Phosphorus and its derivatives are used in fertilizers, flame retardants, electroplating and in
nature, the nucleoside triphosphate ATP,12
is the energy carrier for metabolic processes in
cells. These are but a few of its many uses or applications.
2.2.2 Chemical properties of phosphorus compounds
Phosphorus is an important chemical in both the biological field and in the chemical industry.
Our focus will be on its chemical properties which has attracted research in the field of
13
catalysis. Phosphorus atoms have three lone-pair electrons in the low-lying 3d orbitals,13
which causes it to behave in a similar manner as a CO ligand. Phosphorus compounds can be
present in the following forms: PR3, PR2XR, PR(XR)2, P(XR)3 where the R group is an acyl
or aryl group and X is a heteroatom such as N or O.14
These compounds demonstrate
different electronic properties (electron donating or electron withdrawing) and each will
therefore change the electron-density on the metal center to which it is bound.15
In terms of
the electronic structure, the π-accepting properties of the phosphorus group can be strongly
modified via replacement of the P-C bonds with P-O.
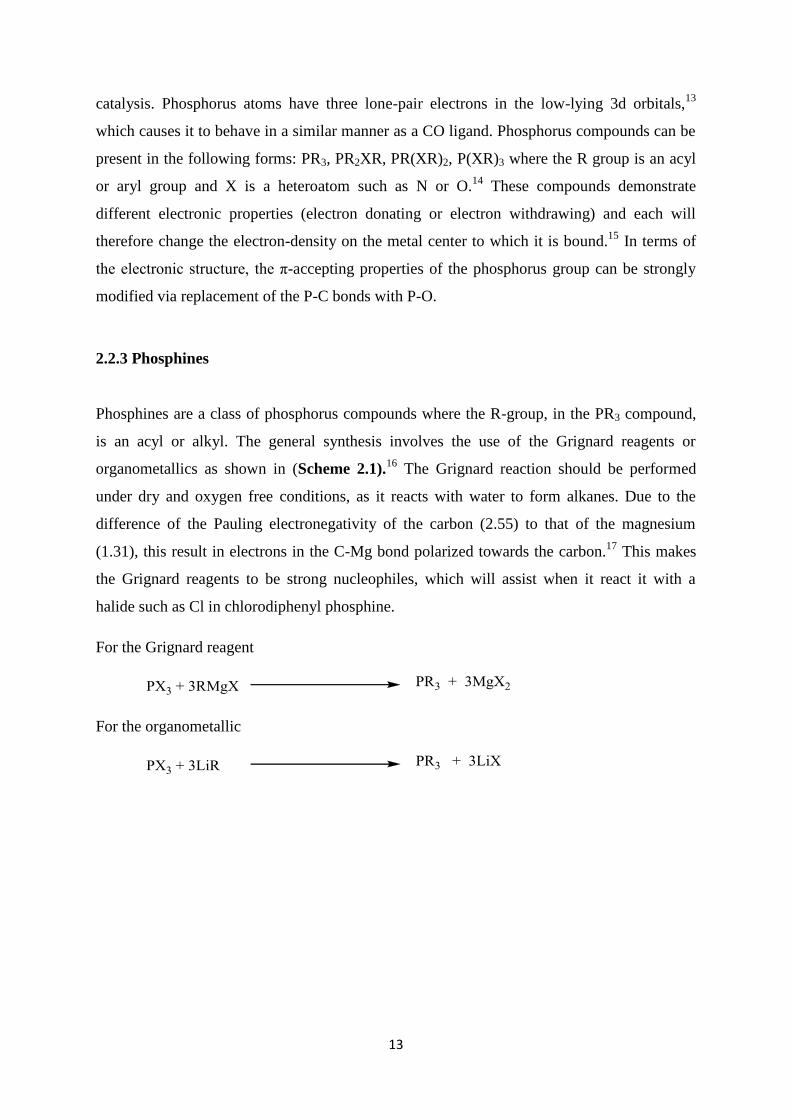
2.2.3 Phosphines
Phosphines are a class of phosphorus compounds where the R-group, in the PR3 compound,
is an acyl or alkyl. The general synthesis involves the use of the Grignard reagents or
organometallics as shown in (Scheme 2.1).16
The Grignard reaction should be performed
under dry and oxygen free conditions, as it reacts with water to form alkanes. Due to the
difference of the Pauling electronegativity of the carbon (2.55) to that of the magnesium
(1.31), this result in electrons in the C-Mg bond polarized towards the carbon.17
This makes
the Grignard reagents to be strong nucleophiles, which will assist when it react it with a
halide such as Cl in chlorodiphenyl phosphine.
For the Grignard reagent
For the organometallic
14
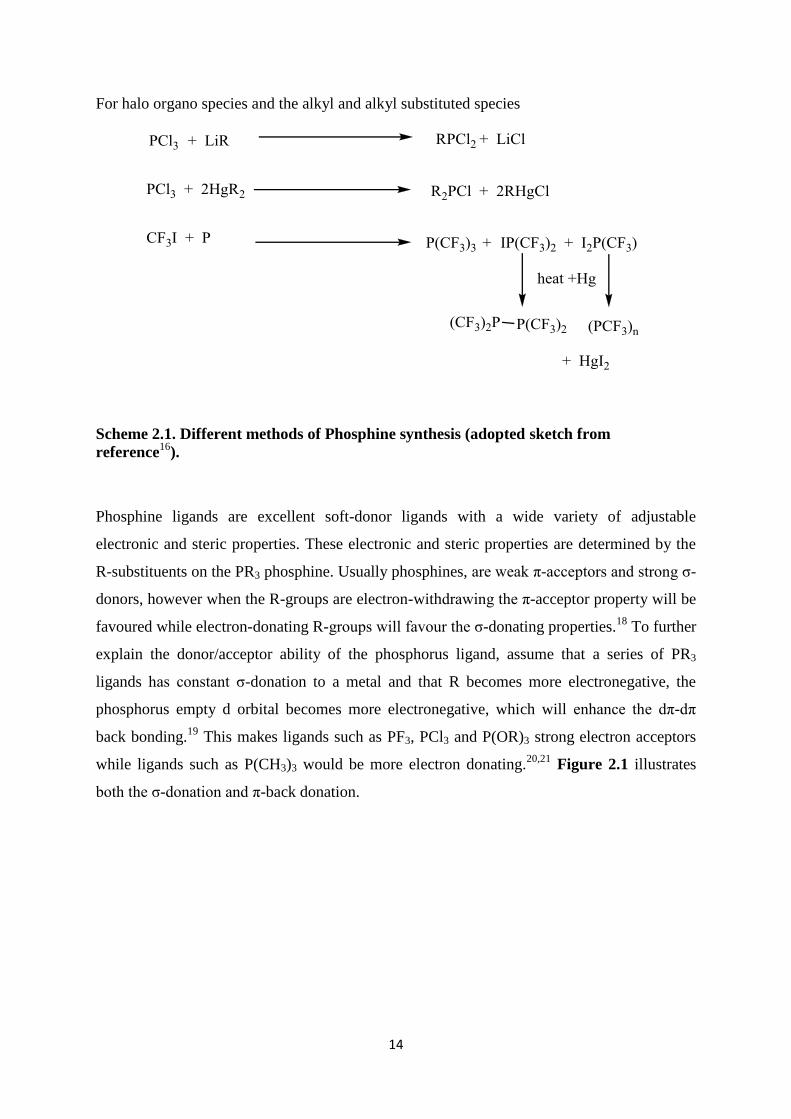
For halo organo species and the alkyl and alkyl substituted species
Scheme 2.1. Different methods of Phosphine synthesis (adopted sketch from
reference16
).
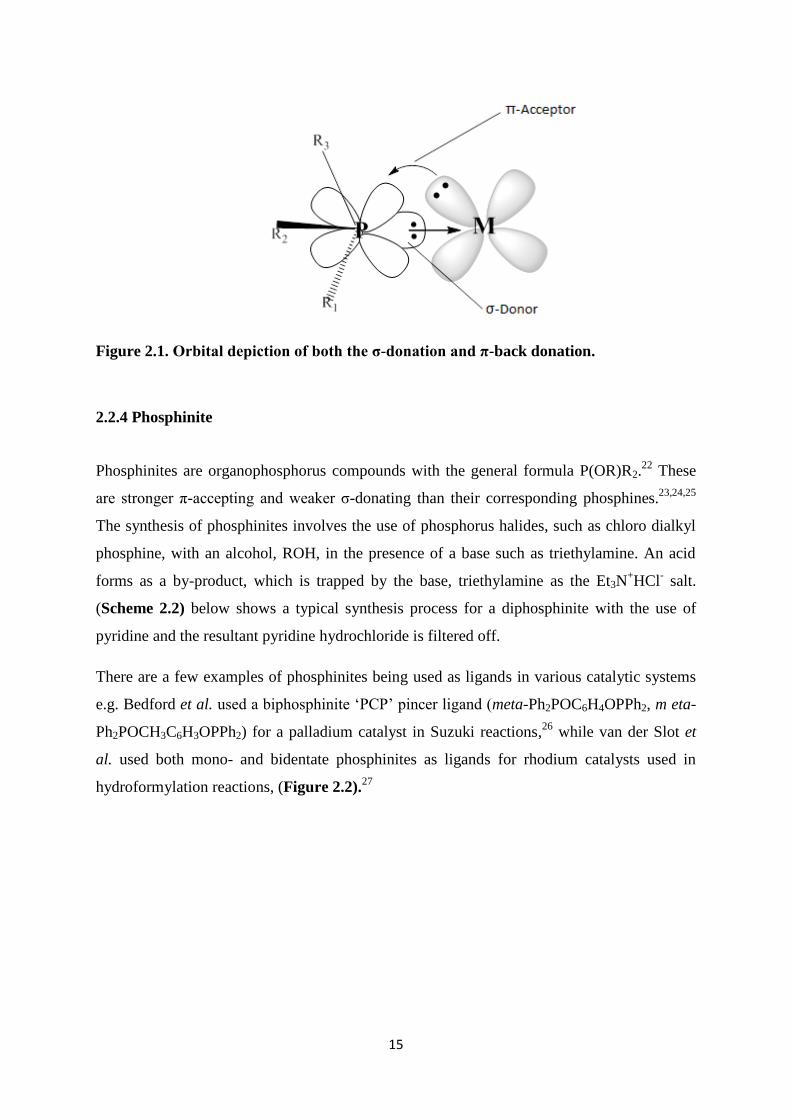
Phosphine ligands are excellent soft-donor ligands with a wide variety of adjustable
electronic and steric properties. These electronic and steric properties are determined by the
R-substituents on the PR3 phosphine. Usually phosphines, are weak π-acceptors and strong ζ-
donors, however when the R-groups are electron-withdrawing the π-acceptor property will be
favoured while electron-donating R-groups will favour the ζ-donating properties.18
To further
explain the donor/acceptor ability of the phosphorus ligand, assume that a series of PR3
ligands has constant ζ-donation to a metal and that R becomes more electronegative, the
phosphorus empty d orbital becomes more electronegative, which will enhance the dπ-dπ
back bonding.19
This makes ligands such as PF3, PCl3 and P(OR)3 strong electron acceptors
while ligands such as P(CH3)3 would be more electron donating.20,21
Figure 2.1 illustrates
both the ζ-donation and π-back donation.
15
Figure 2.1. Orbital depiction of both the σ-donation and π-back donation.
2.2.4 Phosphinite
Phosphinites are organophosphorus compounds with the general formula P(OR)R2.22
These
are stronger π-accepting and weaker ζ-donating than their corresponding phosphines.23,24,25
The synthesis of phosphinites involves the use of phosphorus halides, such as chloro dialkyl
phosphine, with an alcohol, ROH, in the presence of a base such as triethylamine. An acid
forms as a by-product, which is trapped by the base, triethylamine as the Et3N+HCl
- salt.
(Scheme 2.2) below shows a typical synthesis process for a diphosphinite with the use of
pyridine and the resultant pyridine hydrochloride is filtered off.
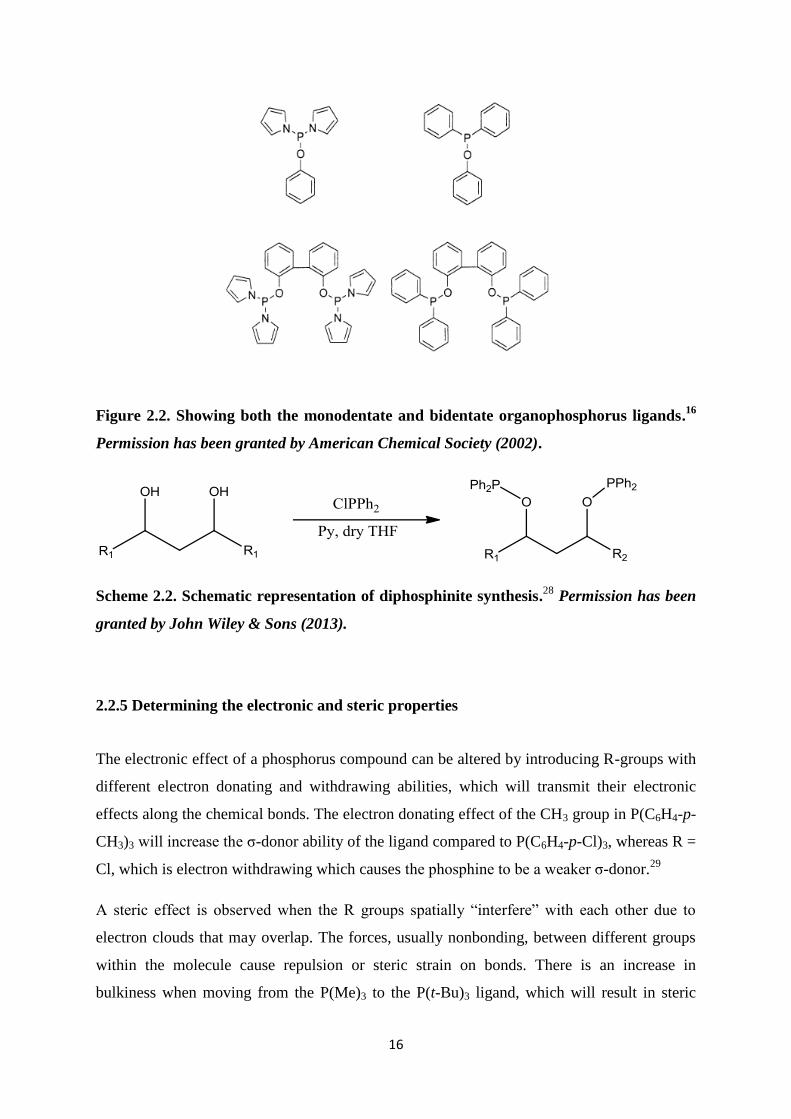
There are a few examples of phosphinites being used as ligands in various catalytic systems
e.g. Bedford et al. used a biphosphinite „PCP‟ pincer ligand (meta-Ph2POC6H4OPPh2, m eta-
Ph2POCH3C6H3OPPh2) for a palladium catalyst in Suzuki reactions,26
while van der Slot et
al. used both mono- and bidentate phosphinites as ligands for rhodium catalysts used in
hydroformylation reactions, (Figure 2.2).27
16
Figure 2.2. Showing both the monodentate and bidentate organophosphorus ligands.16
Permission has been granted by American Chemical Society (2002).
Scheme 2.2. Schematic representation of diphosphinite synthesis.28
Permission has been
granted by John Wiley & Sons (2013).
2.2.5 Determining the electronic and steric properties
The electronic effect of a phosphorus compound can be altered by introducing R-groups with
different electron donating and withdrawing abilities, which will transmit their electronic
effects along the chemical bonds. The electron donating effect of the CH3 group in P(C6H4-p-
CH3)3 will increase the ζ-donor ability of the ligand compared to P(C6H4-p-Cl)3, whereas R =
Cl, which is electron withdrawing which causes the phosphine to be a weaker ζ-donor.29
A steric effect is observed when the R groups spatially “interfere” with each other due to
electron clouds that may overlap. The forces, usually nonbonding, between different groups
within the molecule cause repulsion or steric strain on bonds. There is an increase in
bulkiness when moving from the P(Me)3 to the P(t-Bu)3 ligand, which will result in steric
17
strain, for which the binding ability decreases from the P(Me)3 to the P(t-Bu)3 ligand.30
It has
also been reported that the steric effect of the phosphorus ligand has an influence on the
regioselectivity of the product formed by the phosphorus-containing metal catalyst.31,32
By varying the R-groups within a phosphorus compound it is possible to tune the properties
of the ligand in terms of electronic and steric effect as desired. These two parameters have a
significant effect on the properties, reactivity and catalytic ability of the transition metal to
which they are bound. Due to this flexibility in properties, phosphorus systems are considered
as some of the most versatile ligands in organometallic and inorganic chemistry.
The electronic properties of the coordinated phosphorus ligand can be determined amongst
others using Fourier transformed Infrared (FTIR). The shift in carbonyl stretching frequency
of the phosphine- and carbonyl containing metal complex is an indication of the electronic
effect of the R groups on the phosphine. More electron withdrawing R-groups will cause the
CO stretching frequency to shift to more positive wavenumbers, whereas electron donating
R-groups will cause a negative shift of the CO stretching frequency.33,34,35
One of these FTIR
methods of determining the electronic effect is the Tolman‟s electronic parameter (TEP),
which is an observed quantity of a particular PR3 ligand, which is obtained by measuring the
FTIR spectrum of its [Ni(CO)3PR3] complex. Because the carbonyl stretching frequency
value of the metal-carbonyl can be used as the indicator of the metal center electron density,
the TEP can be used to determine the electron properties of the phosphine.36
The stretching
frequency of the coordinated CO is an indication of back donation, e.g. an increase in the
electron density on the metal center, due to an electron donating phosphorus ligand, will lead
to the increase in the back donation into the CO ligand π* orbital, which will lower the CO
stretching frequency, and with weak back donation the result leads to higher CO stretching
frequency.37
The steric property analysis was introduced by Tolman since it became clear that the ability
of the phosphorus ligands to compete for coordination positions on the zero valent nickel
could not be explained by their electronic characteristics.38
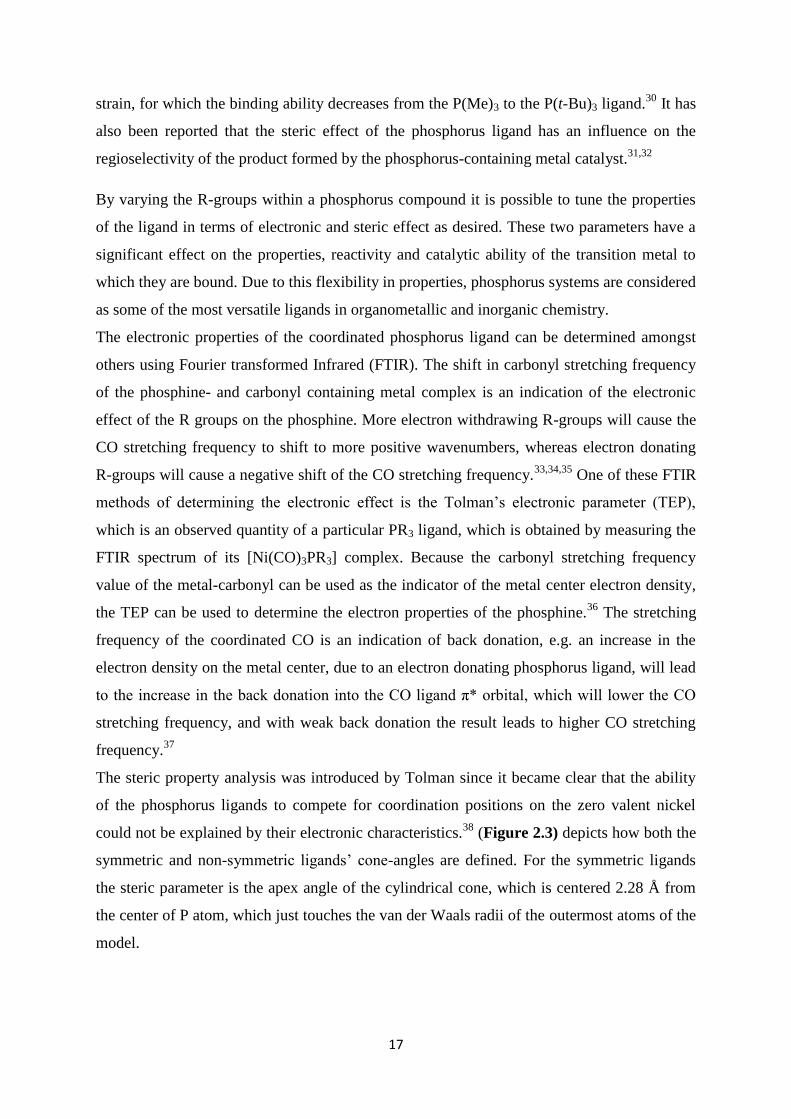
(Figure 2.3) depicts how both the
symmetric and non-symmetric ligands‟ cone-angles are defined. For the symmetric ligands
the steric parameter is the apex angle of the cylindrical cone, which is centered 2.28 Å from
the center of P atom, which just touches the van der Waals radii of the outermost atoms of the
model.
18
For the non-symmetric ligands (Figure 2.3) (b) PX1X2X3 the effective cone angle can be
defined by a model which minimizes the sum of the cone half angles using the following
Equation 2.1:
( | )∑ 2.1
With the work done by Van Rooy et al. on the rhodium-catalysed hydroformylation with the
use of bulky phosphite, it was concluded that the structure of the catalyst has a large
influence on both the activity and the selectivity of the rhodium carbonyl hydroformylation
catalyst. They observed that with the PPh3-modified catalyst, the rate decreases with
increasing steric hindrance by the substituents.39
Figure 2.3. (a) Symmetrical ligands cone-angle measurement, (b) non-symmetrical
ligands cone-angle measurements.26
Permission American Chemical Society (1970).
2.3 Rhodium
2.3.1 Introduction
Rhodium metal is part of the platinum group metals, which was discovered in 1803 by W.H.
Wollaston and he named it “Rhodes”, which is Greek for rose, owing to the rose red colour of
its salt solution.40
It is approximated that 70 % of the rhodium is used as catalysts in vehicle
exhausts, as well as in the chemical- and pharmaceutical industry. Some of its chemical
properties include resistance to halogen attack and it is more resistant to air oxidation.41
19
2.3.2 Catalytic properties
Organometallic compounds of rhodium have shown good catalytic results for
carbonylation,42,43
hydrogenation,44
and hydroformylation reactions,45,46
which will be
discussed below.
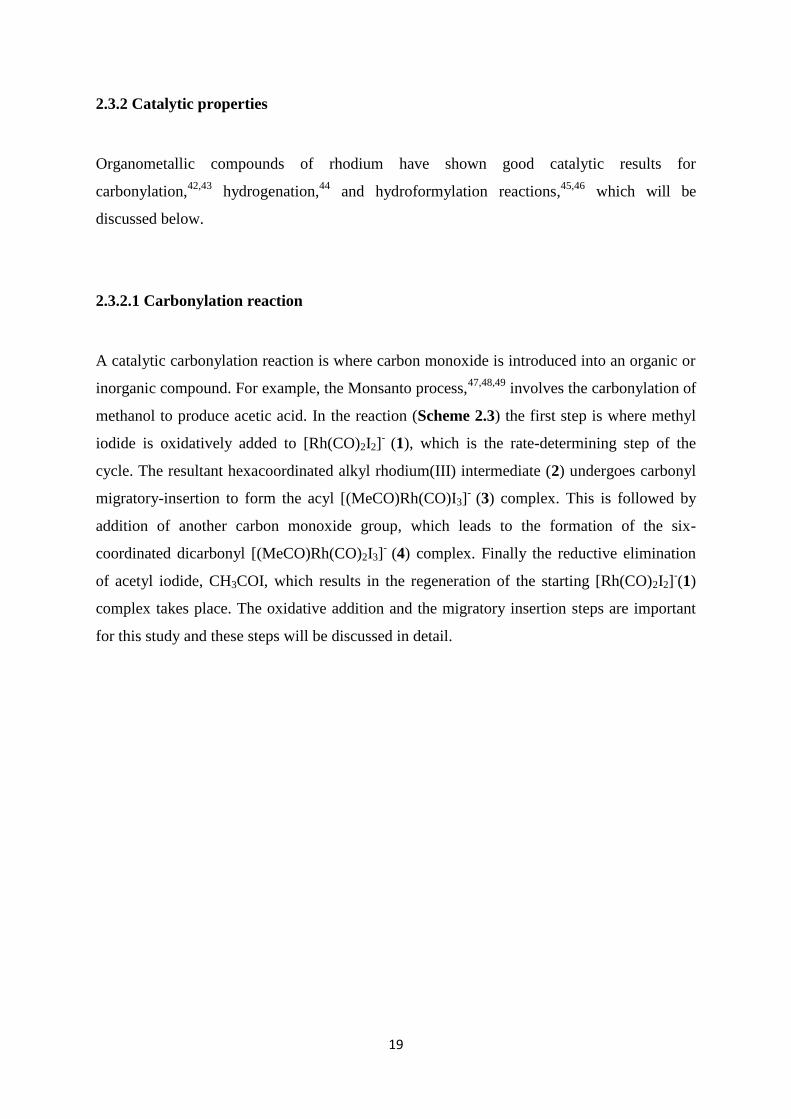
2.3.2.1 Carbonylation reaction
A catalytic carbonylation reaction is where carbon monoxide is introduced into an organic or
inorganic compound. For example, the Monsanto process,47,48,49
involves the carbonylation of
methanol to produce acetic acid. In the reaction (Scheme 2.3) the first step is where methyl
iodide is oxidatively added to [Rh(CO)2I2]-
(1), which is the rate-determining step of the
cycle. The resultant hexacoordinated alkyl rhodium(III) intermediate (2) undergoes carbonyl
migratory-insertion to form the acyl [(MeCO)Rh(CO)I3]-
(3) complex. This is followed by
addition of another carbon monoxide group, which leads to the formation of the six-
coordinated dicarbonyl [(MeCO)Rh(CO)2I3]-
(4) complex. Finally the reductive elimination
of acetyl iodide, CH3COI, which results in the regeneration of the starting [Rh(CO)2I2]-(1)
complex takes place. The oxidative addition and the migratory insertion steps are important
for this study and these steps will be discussed in detail.

20
Scheme 2.3. The Monsanto process reaction mechanism.50
Permission granted by
American Chemical Society (1976).
Oxidative addition
Oxidative addition reaction of an alkyl halide, such as methyl iodide onto a coordinatively
unsaturated transitional metal, results in the increase of both the oxidation and coordination
number of the metal complex.
The dominant metal between the reduced and oxidised side of the equilibrium is dependent
on three things, firstly the nature of the metal and its ligands, secondly on the incoming
compound XY and thirdly the solvent in which the reaction takes place.51
With the rhodium
based complexes the rate determining step for the catalytic cycle is oxidative addition of
iodomethane to [Rh(CO)2I2]-. It has been shown that the increase of the electron density on
the metal centre, by an electron donating ligand such as (PEt3), will result in the doubling of
the reaction rate compared to the reaction rate of the [Rh(CO)2Cl]2 complex under the same
reaction conditions.52,53,54
21
Migratory insertion
Migratory insertion involving CO is where the CO first migrates to the alkyl group bonded
onto the metal and secondly insert between the metal and the alkyl group.55
It has been
experimentally reported that π-acceptor ligands such as CO and isonitriles which are trans to
the migrating methyl ligand does indeed promote migratory insertion and that the ζ-donor
ligands trans to the migrating methyl ligand do not promote migration.56
Theoretical
calculations done by P. Margl et al. has suggested similar results, that the increase of the
number of π-acceptor ligands will promote methyl migration by reducing the activation
energy for the migration step.57
In other studies it was reported that the rate of migration may
be enhanced by the use of less polar solvents, as it was shown that the rate constant is four
times larger in mesitylene than in n-hexane, in mesitylene, 1.11 x10⁻⁴
M-1
sec-1
and in n-
hexane, 2.7 x10⁻⁵
M-1
sec-1
.58
Steric effect of the ligands has also been shown to have a
dramatic influence on the migratory insertion on rhodium, given the fact that
Ph2PCH2P(S)Ph2 (dppms) ligand is able to promote both oxidative addition and migratory
insertion. This strong electron donor ligand, which accelerates oxidative addition, would
normally be expected to inhibit CO insertion, but rather steric effect of the dppms ligand
seems to dominate.59
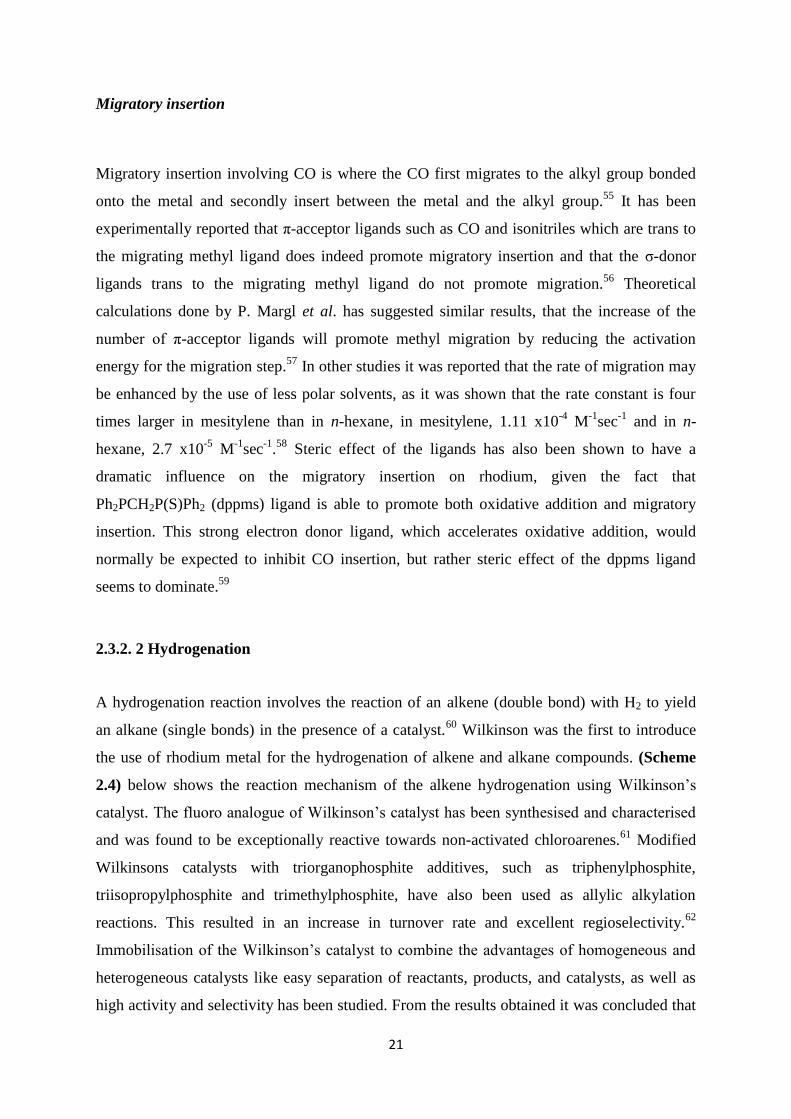
2.3.2. 2 Hydrogenation
A hydrogenation reaction involves the reaction of an alkene (double bond) with H2 to yield
an alkane (single bonds) in the presence of a catalyst.60
Wilkinson was the first to introduce
the use of rhodium metal for the hydrogenation of alkene and alkane compounds. (Scheme
2.4) below shows the reaction mechanism of the alkene hydrogenation using Wilkinson‟s
catalyst. The fluoro analogue of Wilkinson‟s catalyst has been synthesised and characterised
and was found to be exceptionally reactive towards non-activated chloroarenes.61
Modified
Wilkinsons catalysts with triorganophosphite additives, such as triphenylphosphite,
triisopropylphosphite and trimethylphosphite, have also been used as allylic alkylation
reactions. This resulted in an increase in turnover rate and excellent regioselectivity.62
Immobilisation of the Wilkinson‟s catalyst to combine the advantages of homogeneous and
heterogeneous catalysts like easy separation of reactants, products, and catalysts, as well as
high activity and selectivity has been studied. From the results obtained it was concluded that
22
the catalyst was still very active with respect to the hydrogenation of different substrates, and
the chemoselectivities were not changed by the immobilization.63
Scheme 2.4. Alkene hydrogenation mechanism using the Wilkinson’s catalyst.64
Permission granted by Royal Society of Chemistry (2013).
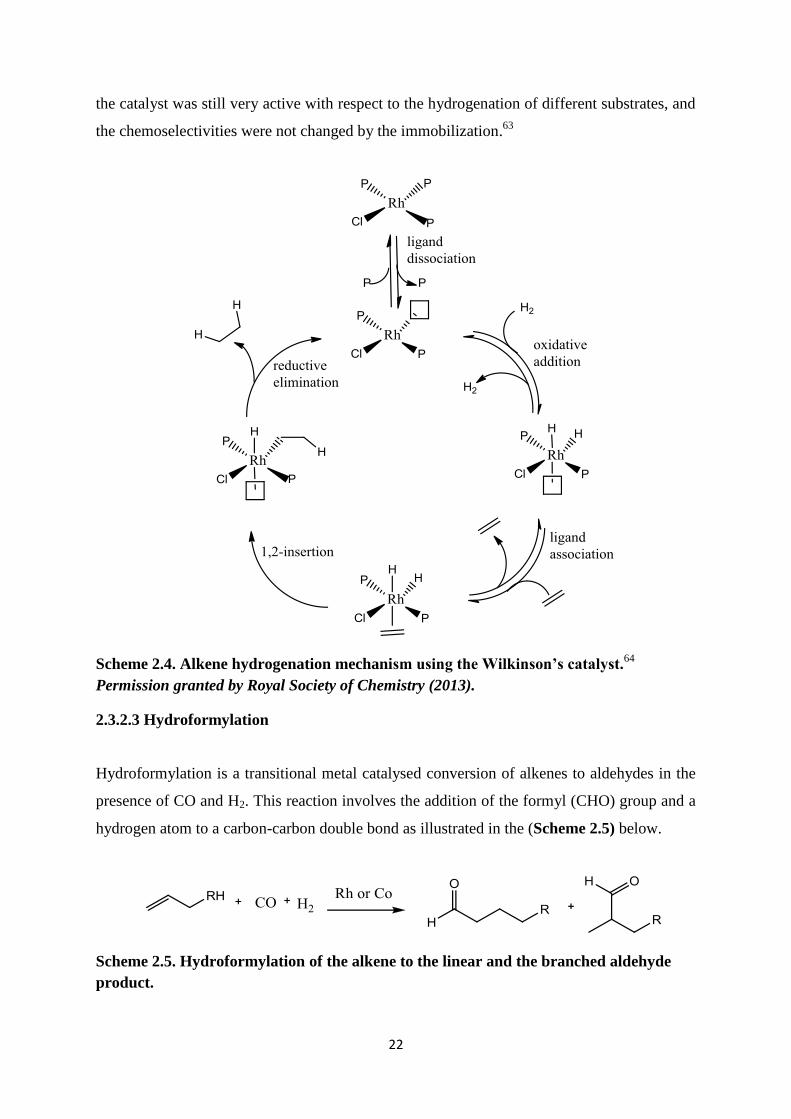
2.3.2.3 Hydroformylation
Hydroformylation is a transitional metal catalysed conversion of alkenes to aldehydes in the
presence of CO and H2. This reaction involves the addition of the formyl (CHO) group and a
hydrogen atom to a carbon-carbon double bond as illustrated in the (Scheme 2.5) below.
Scheme 2.5. Hydroformylation of the alkene to the linear and the branched aldehyde
product.
23
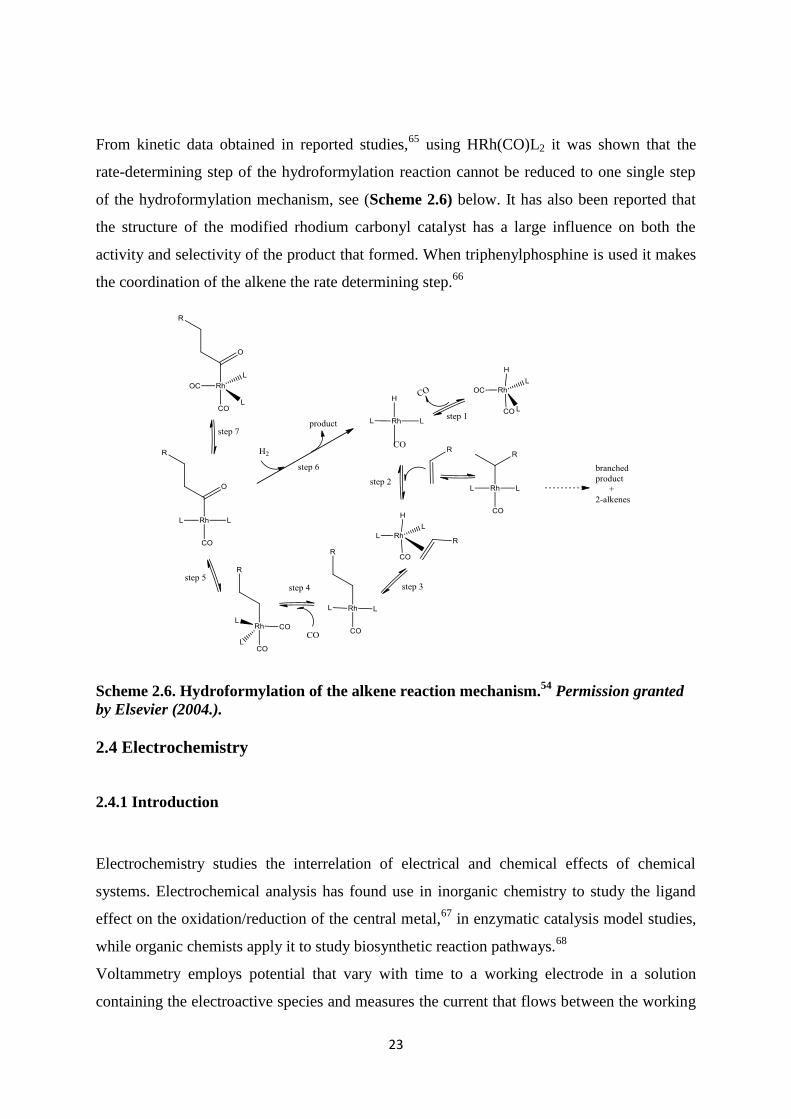
From kinetic data obtained in reported studies,65
using HRh(CO)L2 it was shown that the
rate-determining step of the hydroformylation reaction cannot be reduced to one single step
of the hydroformylation mechanism, see (Scheme 2.6) below. It has also been reported that
the structure of the modified rhodium carbonyl catalyst has a large influence on both the
activity and selectivity of the product that formed. When triphenylphosphine is used it makes
the coordination of the alkene the rate determining step.66
Scheme 2.6. Hydroformylation of the alkene reaction mechanism.54
Permission granted
by Elsevier (2004.).
2.4 Electrochemistry
2.4.1 Introduction
Electrochemistry studies the interrelation of electrical and chemical effects of chemical
systems. Electrochemical analysis has found use in inorganic chemistry to study the ligand
effect on the oxidation/reduction of the central metal,67
in enzymatic catalysis model studies,
while organic chemists apply it to study biosynthetic reaction pathways.68
Voltammetry employs potential that vary with time to a working electrode in a solution
containing the electroactive species and measures the current that flows between the working
24
and counter electrode.69
The working electrode potential is controlled versus a reference
electrode, while an auxiliary (or counter) electrode completes the electrical circuit. There are
several different excitation signals that can be applied to the working electrode; these are
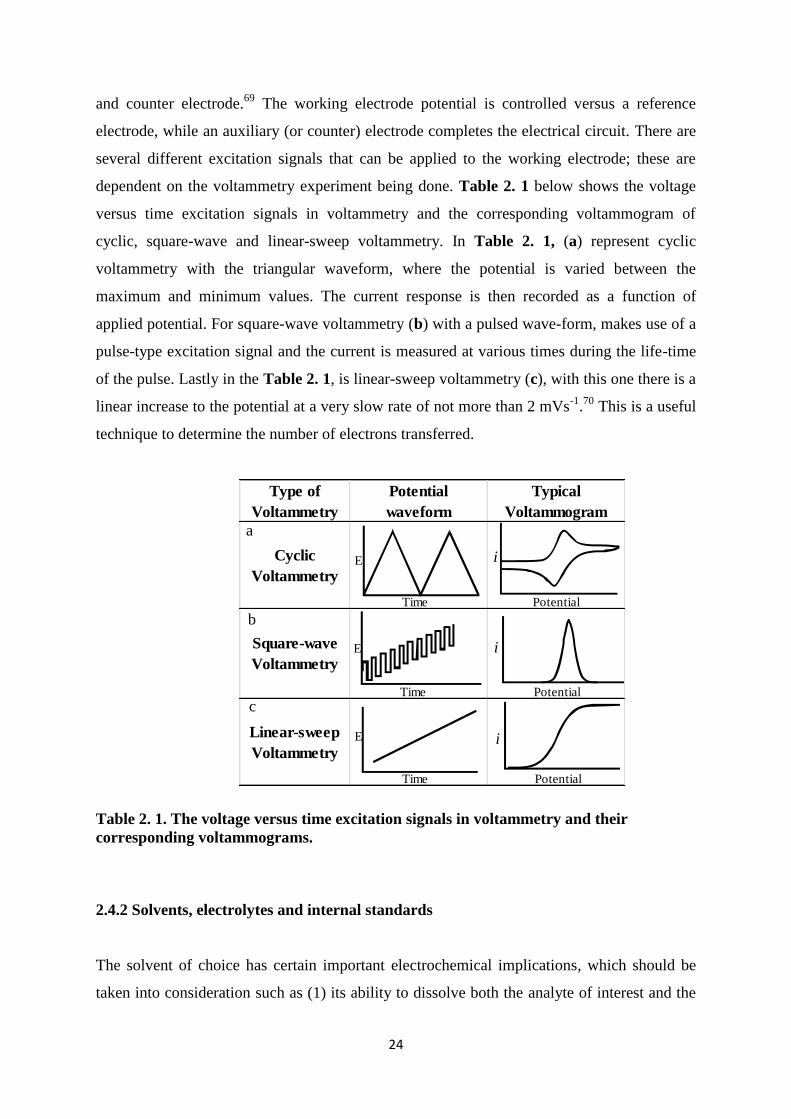
dependent on the voltammetry experiment being done. Table 2. 1 below shows the voltage
versus time excitation signals in voltammetry and the corresponding voltammogram of
cyclic, square-wave and linear-sweep voltammetry. In Table 2. 1, (a) represent cyclic
voltammetry with the triangular waveform, where the potential is varied between the
maximum and minimum values. The current response is then recorded as a function of
applied potential. For square-wave voltammetry (b) with a pulsed wave-form, makes use of a
pulse-type excitation signal and the current is measured at various times during the life-time
of the pulse. Lastly in the Table 2. 1, is linear-sweep voltammetry (c), with this one there is a
linear increase to the potential at a very slow rate of not more than 2 mVs-1
.70
This is a useful
technique to determine the number of electrons transferred.
Table 2. 1. The voltage versus time excitation signals in voltammetry and their
corresponding voltammograms.
2.4.2 Solvents, electrolytes and internal standards
The solvent of choice has certain important electrochemical implications, which should be
taken into consideration such as (1) its ability to dissolve both the analyte of interest and the
Type of
Voltammetry
Potential
waveform
Typical
Voltammogram
Cyclic
Voltammetry
Square-wave
Voltammetry
Linear-sweep
Voltammetryi
i
i
Potential
Potential
PotentialTime
Time
Time
E
E
E
a
b
c

25
supporting electrolyte; (2) its voltage limits should be compatible to the system and (3) its
viscosity as this will affect mass transport by diffusion. A study was conducted that showed
that there was an increase in viscosity or solution resistance of quaternary ammonium salt
electrolyte dissolved in hexamethylphosphoramide, which resulted in a resistance four times
than that of solution in acetonitrile or dimethylformamide at the same concentration.71
It is
important that the solvent must not coordinate to the electroactive species as well.
The supporting electrolyte is added so that it decreases the solution resistance, therefore the
supporting electrolyte acts as a conducting medium. The supporting electrolyte must be inert
and it must dissolve in the solvent of choice. Tetrabutylammonium hexafluorophosphate,
[NnBu4][PF6],
72,73 is one of the most commonly used electrolyte in comparison to the less
used tetrabutylammonium(tetrakispentafluorophenyl)borate, [NnBu4][B(C6F5)4],
74 which is
non-coordinating but it is very costly.
Due to the use of a variety of reference electrodes, the literature contains numerous reduction
potentials, which cannot be related to each other and which are also difficult to reproduce. To
combat this potential drifts the potential of the oxidation of ferrocene as an internal standard
is used according to IUPAC.75
The ferrocene is usually added to the solution once the
electrochemistry of the compound of interest is complete. Thereafter the electrochemistry
experiment is repeated, now in the presence of the internal standard. The position of the
redox waves can now be compared directly to the ferrocene/ferrocenium (FcH/FcH+) couple
potential, which is set to be at 0mV.75
In cases where the FcH/FcH+ couple potential
interferes with the analyte another internal standard in the form of
decamethylferrocene/decamethylferrocenium (Fc*/Fc*+) couple potential can be employed.
76
2.4.3 Cyclic Voltammetry
Cyclic voltammetry (CV) is a widely applied electroanalytical technique used to study redox
systems. This is often the first experiment performed in an electrochemical study. The
potential of the working electrode is swept back and forth by the triangular excitation signal;
this can lead to one or more cycles. The potential is ramped from an initial potential and at
the end of the linear sweep, the potential scan is reversed, it can be reversed back to the initial
potential and the cycle could be repeated. The potential at which the scan direction is changed
is called the switch potential. The voltammogram is obtained from the current of the working
26
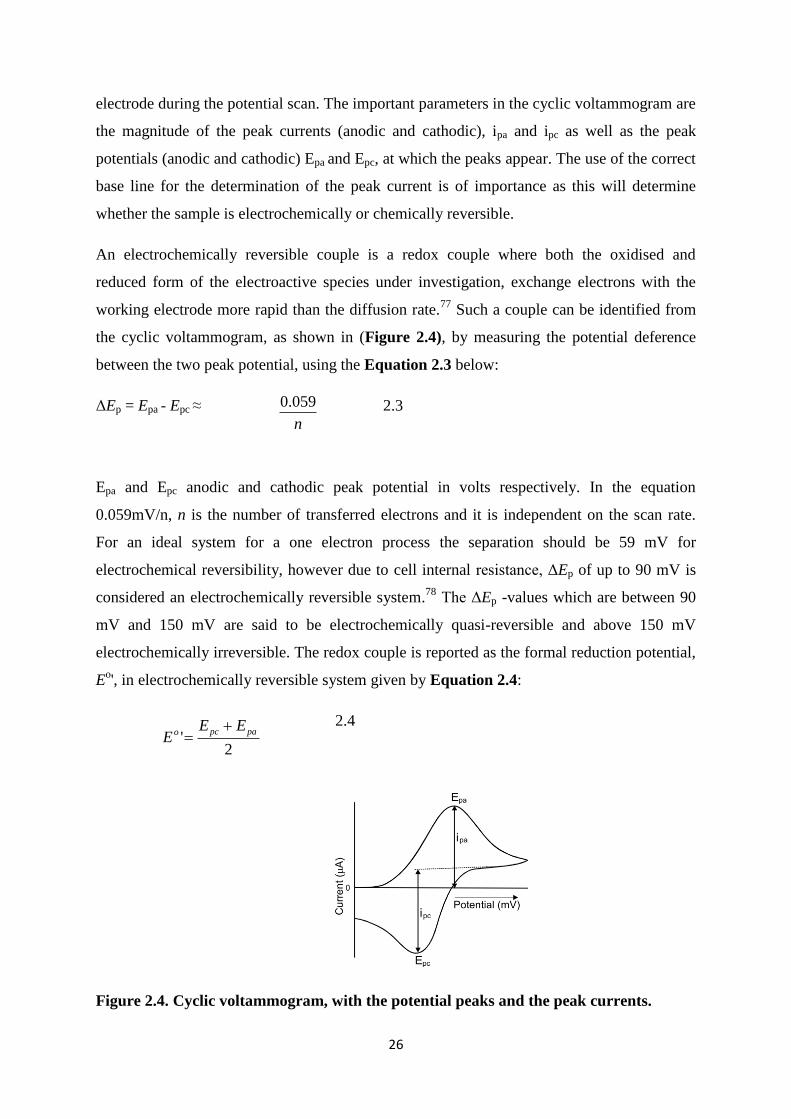
electrode during the potential scan. The important parameters in the cyclic voltammogram are
the magnitude of the peak currents (anodic and cathodic), ipa and ipc as well as the peak
potentials (anodic and cathodic) Epa and Epc, at which the peaks appear. The use of the correct
base line for the determination of the peak current is of importance as this will determine
whether the sample is electrochemically or chemically reversible.
An electrochemically reversible couple is a redox couple where both the oxidised and
reduced form of the electroactive species under investigation, exchange electrons with the
working electrode more rapid than the diffusion rate.77
Such a couple can be identified from
the cyclic voltammogram, as shown in (Figure 2.4), by measuring the potential deference
between the two peak potential, using the Equation 2.3 below:
ΔEp = Epa - Epc ≈ 2.3
Epa and Epc anodic and cathodic peak potential in volts respectively. In the equation
0.059mV/n, n is the number of transferred electrons and it is independent on the scan rate.
For an ideal system for a one electron process the separation should be 59 mV for
electrochemical reversibility, however due to cell internal resistance, ΔEp of up to 90 mV is
considered an electrochemically reversible system.78
The ΔEp -values which are between 90
mV and 150 mV are said to be electrochemically quasi-reversible and above 150 mV
electrochemically irreversible. The redox couple is reported as the formal reduction potential,
Eo', in electrochemically reversible system given by Equation 2.4:
2.4
Figure 2.4. Cyclic voltammogram, with the potential peaks and the peak currents.
n
059.0
2'
papcoEE
E
27
Chemical reversibility on the other hand is determined by the peak current ratio (ipa/ipc). A
system is said to be chemically reversible if the ratio approaches one, meaning that after
oxidation or reduction the species does not undergo further reaction before it is reduced or
oxidised in the reverse scan. Both the ipa and ipc values are influenced by the scan rate.
2.4.4 Electrochemistry of rhodium complexes
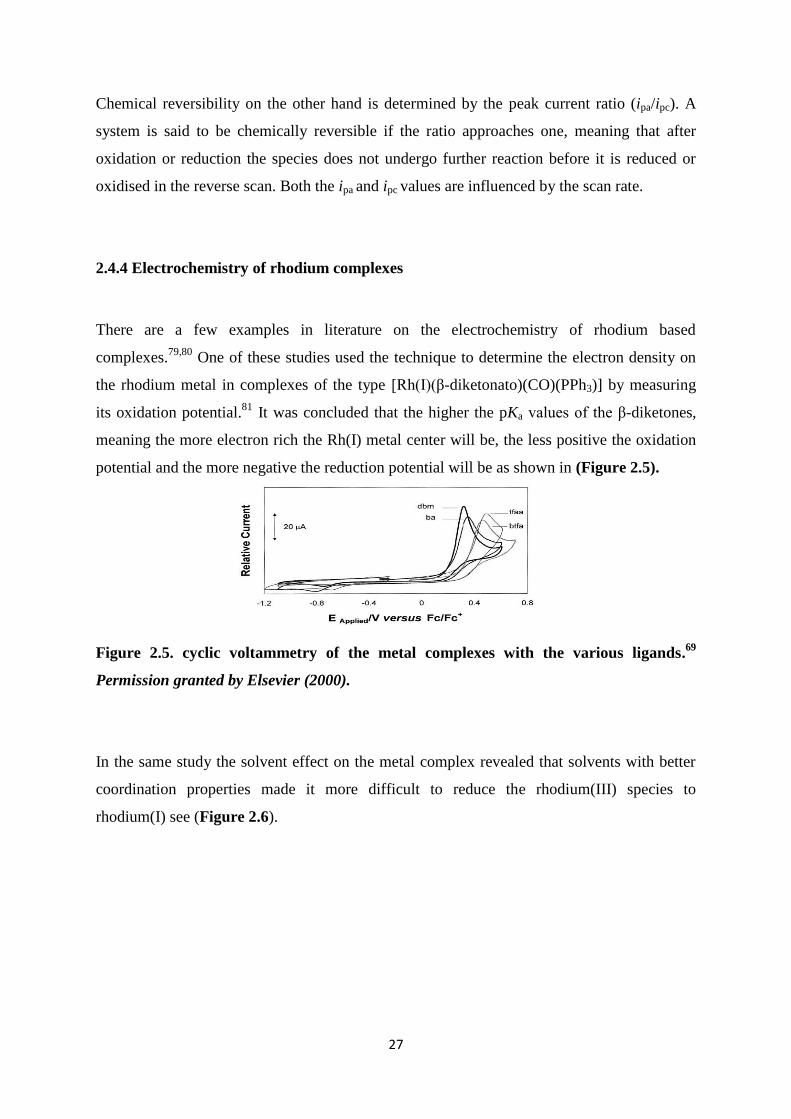
There are a few examples in literature on the electrochemistry of rhodium based
complexes.79,80
One of these studies used the technique to determine the electron density on
the rhodium metal in complexes of the type [Rh(I)(β-diketonato)(CO)(PPh3)] by measuring
its oxidation potential.81
It was concluded that the higher the pKa values of the β-diketones,
meaning the more electron rich the Rh(I) metal center will be, the less positive the oxidation
potential and the more negative the reduction potential will be as shown in (Figure 2.5).
Figure 2.5. cyclic voltammetry of the metal complexes with the various ligands.69
Permission granted by Elsevier (2000).
In the same study the solvent effect on the metal complex revealed that solvents with better
coordination properties made it more difficult to reduce the rhodium(III) species to
rhodium(I) see (Figure 2.6).
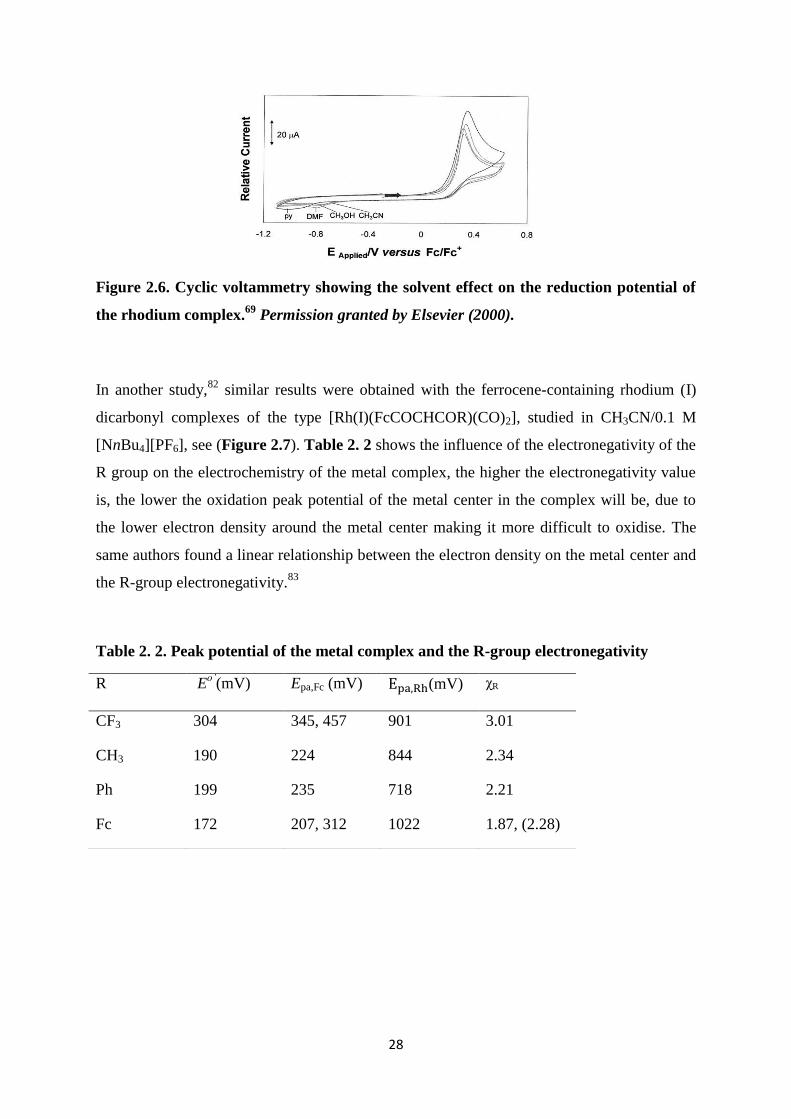
28
Figure 2.6. Cyclic voltammetry showing the solvent effect on the reduction potential of
the rhodium complex.69
Permission granted by Elsevier (2000).
In another study,82
similar results were obtained with the ferrocene-containing rhodium (I)
dicarbonyl complexes of the type [Rh(I)(FcCOCHCOR)(CO)2], studied in CH3CN/0.1 M
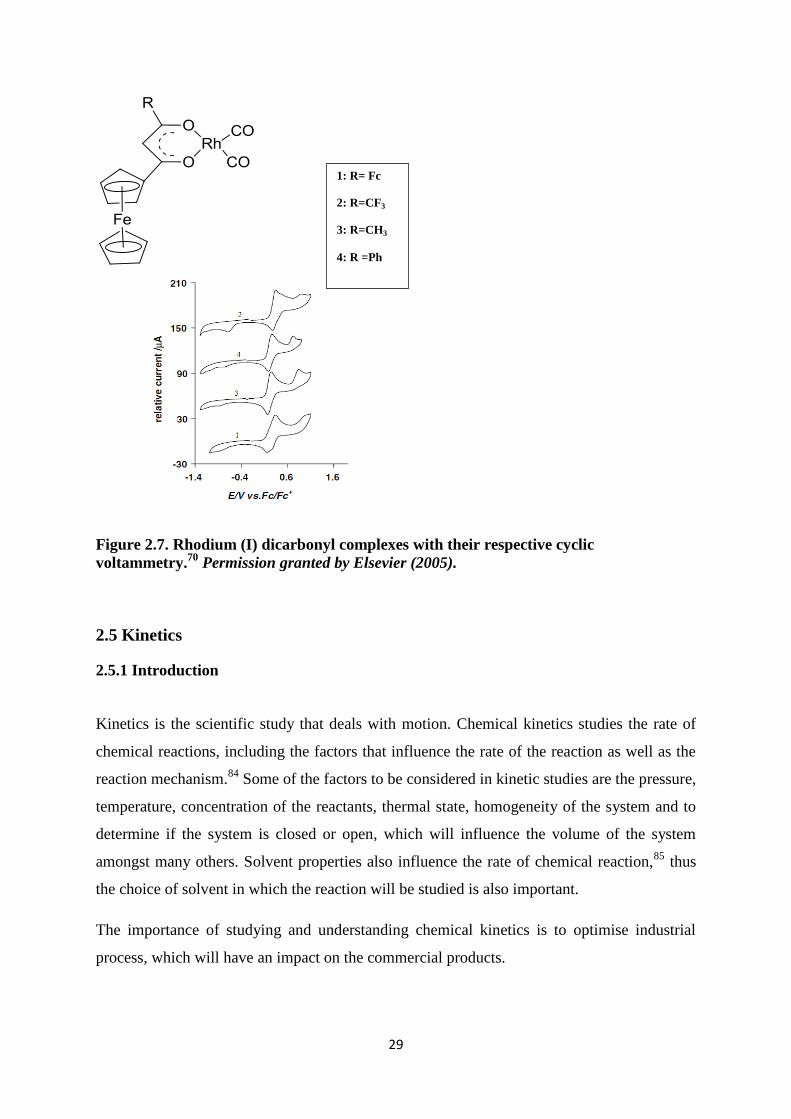
[NnBu4][PF6], see (Figure 2.7). Table 2. 2 shows the influence of the electronegativity of the
R group on the electrochemistry of the metal complex, the higher the electronegativity value
is, the lower the oxidation peak potential of the metal center in the complex will be, due to
the lower electron density around the metal center making it more difficult to oxidise. The
same authors found a linear relationship between the electron density on the metal center and
the R-group electronegativity.83
Table 2. 2. Peak potential of the metal complex and the R-group electronegativity
R Eo’
(mV) Epa,Fc (mV) (mV) χR
CF3 304 345, 457 901 3.01
CH3 190 224 844 2.34
Ph 199 235 718 2.21
Fc 172 207, 312 1022 1.87, (2.28)
29
Figure 2.7. Rhodium (I) dicarbonyl complexes with their respective cyclic
voltammetry.70
Permission granted by Elsevier (2005).
2.5 Kinetics
2.5.1 Introduction
Kinetics is the scientific study that deals with motion. Chemical kinetics studies the rate of
chemical reactions, including the factors that influence the rate of the reaction as well as the
reaction mechanism.84
Some of the factors to be considered in kinetic studies are the pressure,
temperature, concentration of the reactants, thermal state, homogeneity of the system and to
determine if the system is closed or open, which will influence the volume of the system
amongst many others. Solvent properties also influence the rate of chemical reaction,85
thus
the choice of solvent in which the reaction will be studied is also important.
The importance of studying and understanding chemical kinetics is to optimise industrial
process, which will have an impact on the commercial products.
1: R= Fc
2: R=CF3
3: R=CH3
4: R =Ph
30
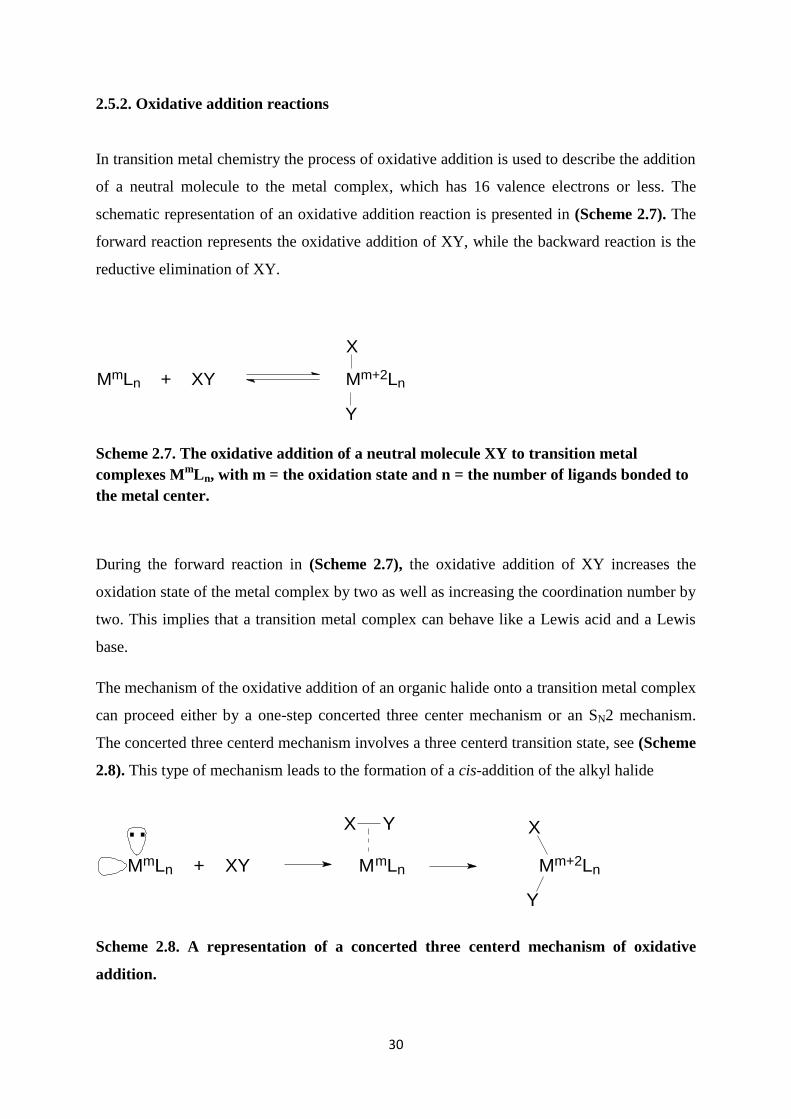
2.5.2. Oxidative addition reactions
In transition metal chemistry the process of oxidative addition is used to describe the addition
of a neutral molecule to the metal complex, which has 16 valence electrons or less. The
schematic representation of an oxidative addition reaction is presented in (Scheme 2.7). The
forward reaction represents the oxidative addition of XY, while the backward reaction is the
reductive elimination of XY.
MmLn + XY Mm+2Ln
X
Y
Scheme 2.7. The oxidative addition of a neutral molecule XY to transition metal
complexes Mm
Ln, with m = the oxidation state and n = the number of ligands bonded to
the metal center.
During the forward reaction in (Scheme 2.7), the oxidative addition of XY increases the
oxidation state of the metal complex by two as well as increasing the coordination number by
two. This implies that a transition metal complex can behave like a Lewis acid and a Lewis
base.
The mechanism of the oxidative addition of an organic halide onto a transition metal complex
can proceed either by a one-step concerted three center mechanism or an SN2 mechanism.
The concerted three centerd mechanism involves a three centerd transition state, see (Scheme
2.8). This type of mechanism leads to the formation of a cis-addition of the alkyl halide
MmLn + XY MmLn Mm+2Ln
X
Y
.. X Y
Scheme 2.8. A representation of a concerted three centerd mechanism of oxidative
addition.
31
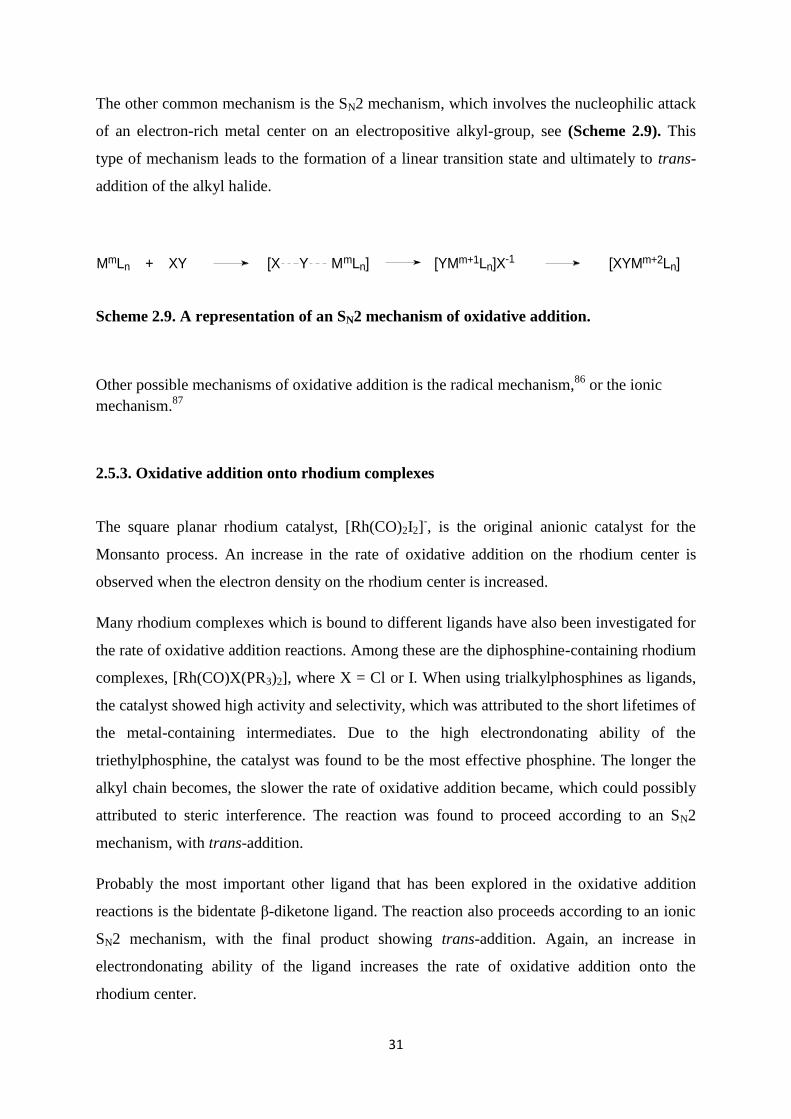
The other common mechanism is the SN2 mechanism, which involves the nucleophilic attack
of an electron-rich metal center on an electropositive alkyl-group, see (Scheme 2.9). This
type of mechanism leads to the formation of a linear transition state and ultimately to trans-
addition of the alkyl halide.
MmLn + XY [X Y MmLn] [YMm+1Ln]X-1 [XYMm+2Ln]
Scheme 2.9. A representation of an SN2 mechanism of oxidative addition.
Other possible mechanisms of oxidative addition is the radical mechanism,86
or the ionic
mechanism.87
2.5.3. Oxidative addition onto rhodium complexes
The square planar rhodium catalyst, [Rh(CO)2I2]-, is the original anionic catalyst for the
Monsanto process. An increase in the rate of oxidative addition on the rhodium center is
observed when the electron density on the rhodium center is increased.
Many rhodium complexes which is bound to different ligands have also been investigated for
the rate of oxidative addition reactions. Among these are the diphosphine-containing rhodium
complexes, [Rh(CO)X(PR3)2], where X = Cl or I. When using trialkylphosphines as ligands,
the catalyst showed high activity and selectivity, which was attributed to the short lifetimes of
the metal-containing intermediates. Due to the high electrondonating ability of the
triethylphosphine, the catalyst was found to be the most effective phosphine. The longer the
alkyl chain becomes, the slower the rate of oxidative addition became, which could possibly
attributed to steric interference. The reaction was found to proceed according to an SN2
mechanism, with trans-addition.
Probably the most important other ligand that has been explored in the oxidative addition
reactions is the bidentate β-diketone ligand. The reaction also proceeds according to an ionic
SN2 mechanism, with the final product showing trans-addition. Again, an increase in
electrondonating ability of the ligand increases the rate of oxidative addition onto the
rhodium center.
32
2.5.4. Activation parameters
The rate of chemical reactions increases with temperature. Generally, the dependence of the
rate constant k on temperature follows the Arrhenius equation Equation 2.5.88
k = Ae(-Ea/RT)
2.5
Here Ea is the activation energy and is useful in determining the mechanism of the reaction.
The higher the activation energy the slower the reaction at any given temperature.
Other activation parameters include ΔH*, ΔS
* and ΔG
*. The sign and magnitude of these
thermodynamic parameters also often indicate the mechanism of a reaction. The transition
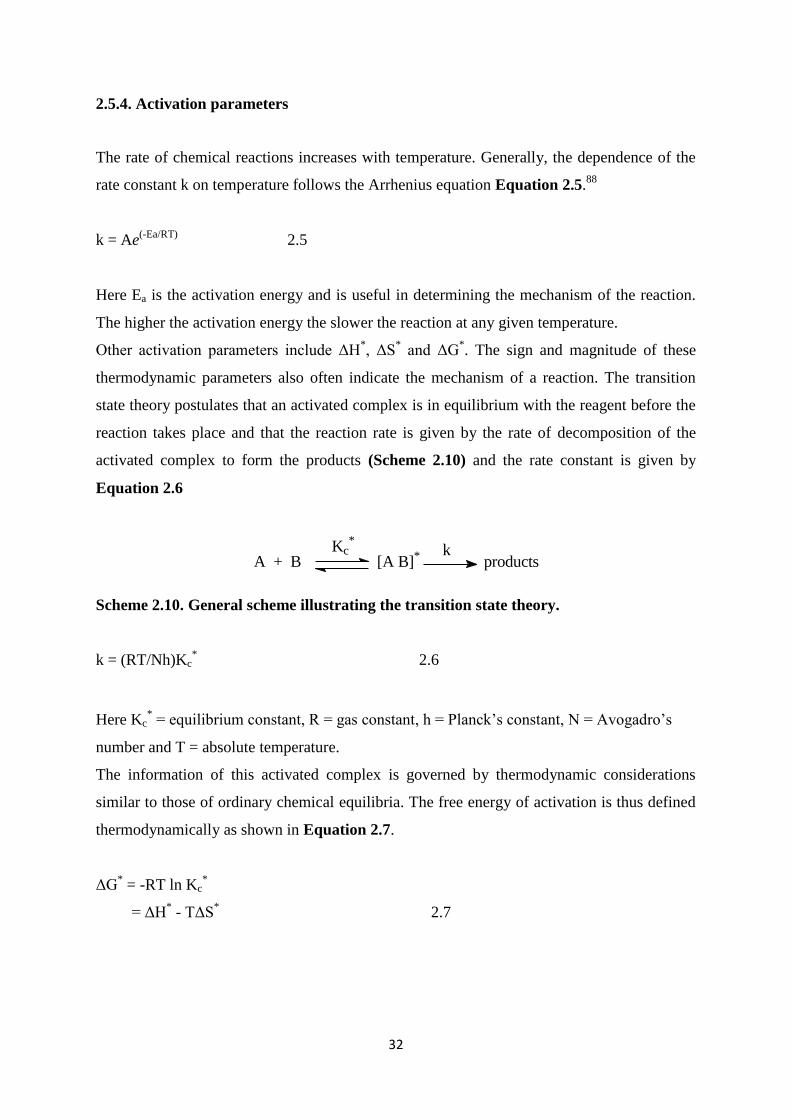
state theory postulates that an activated complex is in equilibrium with the reagent before the
reaction takes place and that the reaction rate is given by the rate of decomposition of the
activated complex to form the products (Scheme 2.10) and the rate constant is given by
Equation 2.6
A + B [A B]* productskKc
*
Scheme 2.10. General scheme illustrating the transition state theory.
k = (RT/Nh)Kc* 2.6
Here Kc* = equilibrium constant, R = gas constant, h = Planck‟s constant, N = Avogadro‟s
number and T = absolute temperature.
The information of this activated complex is governed by thermodynamic considerations
similar to those of ordinary chemical equilibria. The free energy of activation is thus defined
thermodynamically as shown in Equation 2.7.
ΔG* = -RT ln Kc
*
= ΔH* - TΔS
* 2.7
33
Combination of Equations 2.6 and 2.7 gives Equation 2.8.
ln k = ln [(RT)/(Nh)] + ΔS*/R - ΔH
*/ RT 2.8
The magnitude of ΔS*, can be used to determine whether the mechanism of substitution is
associative or dissociative of nature. A small negative or positive ΔS* value indicates a
dissociative mechanism and a large negative ΔS* value indicates an associative mechanism of
substitution.
This concludes the literature survey for this study.
2.6 References
11
M. E. Weeks, Discovery of the elements, Journal of chemical education Publ., Easton. PA. 1945.pg 34. 12
A.D. F. Toy, Phosphorus chemistry in everyday life, Washington D.C: American chemical society, 1976. 13
R. H. Crabtree, The organometallic chemistry of the transition metals, New York: John Wiley & Sons Inc,
1948.pg 71. 14
N. N. Greenwood, A. Earnshaw, Chemistry of the elements, 1st Ed., Oxford: Pergamon press Ltd, 1984.pg
566. 15
B. Nhat-Nguyen, H. Jong-Tai, H. Xuan-Huong, Mho. Sun-il, J. Hye-Young, Bull. Korean Chem. Soc., 2008,
29, 1624. 16
A.G. Sharpe, Inorganic Chemistry, Longman, 1981. 17
L. Pauling, The Chemical Bond, Cornell University Press, Ithaca, New York, 1967. 18
A. Richel, A. Demonceau, A.F. Noels, Tet. Let. 2006, 47, 2077-2078. 19
C.M. Lukehart, fundamental Transition Metal Organometallic Chemistry, Brooks/Cole Publishing Company,
1985. 20
C.H. Suresh, N. Koga, Inorg. Chem., 2002, 41, 1573. 21
I.S Butler, F. Basolo, R. . Pearson, Inorg. Chem., 1967, 6, 2074. 22
H. Fernández-Pérez, P. Etayo, A. Panossian, A. Vidal-Ferran., Chem. Rev. 2011, 111, 2119. 23
M. S. Davies, M. J. Aroney, I. E. Buys, T. W. Hambley, Inorg. Chem., 1995, 34, 330. 24
M.P. Mitoraj, A. Michalak, Inorg. Chem., 2010, 49, 578. 25
I. Odinets, T. Kégl, Elena. Sharova, O. Artyushin, E. Goryunov, G. Molchanova, K. Lyssenko, T.
Mastryukova, G. Röschenthaler, G. Keglevich, L. Kollár, J. Organomet. Chem., 2005, 690, 3456. 26
R. B. Bedford, S. M. Draper, P. N. Scully, S. L. Welch, New J. Chem., 2000, 24, 745. 27
S.C. van der Slot, J. Duran, J. Luten, P.C.J. Kamer, P.W.N.M. van Leeuwen, Organomet., 2002, 21, 3873. 28
S. R. Khan, B. M. Bhanage, Appl. Organometal. Chem., 2013, 27, 313. 29
C. A. Tolman, J. Am. Chem. Soc., 1970, 92, 2953. 30
C.A. Tolman, Chem. Rev., 1977, 77, 313. 31
B. Breit, R. Winde, K. Harms, J. Chem. Soc., Perkin Trans., 1997, 1, 2681. 32
A. van Rooy, P.C.J. Kamer, P.W.N.M. van Leeuwen, K. Goubitz, J. Fraanje, N. Veldman, A.L. Spek,
Organomet. 1996, 15, 835. 33
Y.S. Varshavskii, T.G. Cherkasova, I.S. Podkorytov, A.A. Korlyukov, V.N. Khrustalev, A.B. Nikol‟skii, Rus.
J. Coord. Chem.. 2005, 31, 124. 34
O. Kühl, Coord. Chem. Rev., 2005, 249, 693-695. 35
D.R. Anton, R.H. Crabtree, Organomet., 1983, 2, 621. 36
C.M. Thomas, G. Süss-Fink, Coord. Chem. Rev., 2003, 243, 131.
34
37
A.M. Trzeciak, T. Glowiak, R. Grzybek, J.J Ziólkowski, J. Chem, Soc., 1997, 1831. 38
C.A. Tolman, J. Amer. Chem. Soc., 1970, 92, 2956. 39
A. Van Rooy, J. N. H. de Bruijn, K. F. Roobeek, P. C. J. Kamer, P. W. N. M. Van Leeuwen, J. Organomet.
Chem., 1996, 507, 69. 40
W. H. Wollaston, Phil. Trans. R. Soc. Lond., 1804, 94, 419. 41
F.R. Hartly, Chemistry of the platinum group metals, New York: Elsevier 1991.chapter 1. 42
J. Zakzeski, S. Burton, A. Behn, M. Head-Gordon, A. T. Bell, Phys. Chem., 2009, 11, 9903. 43
N. Lassauque, T. Davin, D. Hanh, R. J. Adcock, Y. Coppel, C. Le Berre, P. Serp, L. Maron, P. Kalck, Inorg.
Chem., 2012, 51, 4. 44
J. Luo, A. G. Oliver, J. S. Mclndoe, Dalton Trans., 2013, 42, 11312. 45
A. Van Rooy, J. N. H. de Bruijn, K.F. Roobeek, P. C. J. Kamer, J. Organomet. Chem., 1996, 507, 69. 46
H. You, Y. Wang, X. Zhao, S. Chen, Y. Liu, Organomet., 2013, 32, 2698. 47
G. W. Parshall, Science., 1980, 208, 1223. 48
A. Haynes, P.M. Maitlis, G.E. Morris, G.J. Sunley, H. Adams, P.W. Badger, C.M. Bowers, D.B. Cook, P.I.P.
Elliot, T. Ghaffer, H. Green, T.R. Griffin, M. Payne, J.M. Pearson, M.J. Taylor, P.W. Vickers and R.J. Watt, J.
Am.
Chem. Soc., 2004, 126, 2847. 49
P.M. Maitlis, A. Haynes, G.J Sunley and M.J. Howard, J. Chem. Soc. Dalton Trans., 1996, 2187. 50
D. Forster, J. Am. Chem. Soc., 1976, 98, 846. 51
F.A. Cotton, G. Xilkinson, P.L. Gaus, Basic Inorganic Chemistry, 3rd
Ed., New York: John Wiley & Sons, Inc
1976 52
J. Rankin, A. D. Poole, A. C. Benyei, D. J. Cole-Hamilton, Chem. Commun., 1997, 1835, 1836. 53
K. G. Moloy, R.W. Wegman, Organometallics., 1989, 8, 2883. 54
C. M. Thomas, R. Mafua, B. Therrien, E. Rusanov, H. Stoeckli-Evans, G. Süss-Fink, Chem. Eur. J., 2002, 8,
3343-3352. 55
R. H. Crabtree, The organometallic chemistry of the transition metals, New York: John Wiley & Sons Inc,
1948. 56
M. Kubota, T. M. McClesky, R. K. Hayashi, C. G. Webb, J. Am. Chem. Soc., 1987, 109, 7569-7570 57
P. Margl, T. Ziegler, P. E. Blӧchl, J. Am. Chem. Soc., 1996, 118, 5412-5419. 58
R. J. Mawby, F. Basolo, R. G. Pearson, J. Am. Chem Soc., 1964, 86, 3996. 59
L. Gonsalvi, H. Adams, G. J. Sunley, E. Ditzel, A. Haynes, J. Am. Chem. Soc., 1999, 121, 11233-11234 60
J. F. Young, J. A. Osborn, F. H. Jardine, G. Wilkinson, Chem. Commun., 1965, 131. 61
V. V. Grushin, W. J. Marshall, J. Am. Chem. Soc., 2004, 126, 3069. 62
P.A. Evans. J. D. Nelson, Tet. Let., 1998, 39, 1725. 63
C. Merckle, S. Haubrich, J. Blümel, J. Organomet. Chem., 2001, 627, 44. 64
J. Luo, A. G. Oliver, J. S Mclndoe, Dalton Trans., 2013, 42, 11314. 65
P.C.J. Kamer, A. van Rooy, G.C. Schoemaker, P.W.N.M. van Leeuwen, Coordination Chemistry Reviews.,
2004, 248, 2412. 66
A. van Rooy, J.N.H. Bruijn, K.F. Roobeek, P.C.J. Kamer, P.W.N.M. van Leeuwen, J. Organomet. Chem.,
1996, 507, 69. 67
R.R. Gagnĕ; J.L. Allison; G.C. Lisensky, Inorg. Chem., 1978, 17, 3569. 68
G.A. Mabbott, J. Chem. Edu., 1983, 60, 697. 69
A.J. Bard, C.G. Zoski, Anal. Chem., 2000, 72, 346A. 70
D.A. Skoog, D.M. West, F.J. Holler, S.R. Crouch, Fundamentals of analytical chemistry, 8th
Ed, THOMSON
publishers, 2004. 71
H.O. House, E. Feng, N.P. Peet, J. Org. Chem., 1971, 36, 2371. 72
D. Lamprecht and G.J. Lamprecht, Inorg. Chim. Acta., 2000, 309, 72. 73
J. Conradie and J.C. Swarts, Dalton. Trans., 2011, 40, 5844. 74
C. Ohrenberg and W.E. Geiger, Inorg. Chem., 2000, 39, 2947. 75
R.R. Gagne, C.A. Koval and G.C. Lisensky, Inorg. Chem., 1980, 19, 2854. 76
I. Noviandri, K.N. Brown, D.S. Fleming, P.T. Gulyas, P.A. Lay, A.F. Masters and L. Phillips, J. Phys. Chem.,
1999, 103, 6713. 77
P.T. Kissinger, W.R. Heineman, Laboratory techniques in electrochemical chemistry, MARCEL DEKKER,
New York, 1984. 78
A. Auger, J.C. Swarts, Organomet., 2007, 26, 105. 79
M. Fátima, C.G. da Silva, A.M. Trzeciak, J.J. Ziόlkowski and A.J.L. Pombeiro, J. Organomet. Chem., 2001,
620,174. 80
J. Conradie and J.C. Swarts, Eur. J. Inorg. Chem., 2011, 2439. 81
D. Lamprecht and G.J. Lamprecht, Inorg. Chim. Acta., 2000, 309, 72.

35
82
J. Conradie, T.S. Cameron, M.A.S. Aquino, G.J. Lamprecht and J.C. Swarts, Inorg. Chim. Acta., 2005, 358,
2530. 83
J. Conradie and J.C. Swarts, Dalton Trans., 2011, 40, 5847. 84
J. W. Moore, R. G. Pearson, Kinetics and Mechanism, 3rd
Ed., Wiley-Interscience publishers, 1961. 85
K. A. Connors, Chemical Kinetics: the study of reaction rates in solution, VCH publishers, 1932. 86
R.S. Dickson, Organometallic chemistry of rhodium and iridium, Academic Press, London, 1983, p 70-79. 87
R.J. Cross, Chem. Soc. Rev., 1985, 14, 197. 88
S. Arrhenius, Z. Phys. Chem., 1889, 4, 226.
36
3 Results and Discussion
3.1 Introduction
This section deals with the synthesis and characterisation of new and known phosphorus-
containing ligands and their rhodium(I) complexes. The phosphorus based ligands are of the
type C6H5OPPh2 (6), para-Ph2POC6H4OPPh2 (7), meta-Ph2POC6H4OPPh2 (8), C6H5SPPh2
(9), C6H5NHPPh2 (10) while the rhodium complex are of the form
[Rh(acac)CO(C6H4OPPh2)] (11), [(Rh(acac)CO(Ph2POC6H4p-OPPh2)] (12),
[(Rh(acac)CO(Ph2POC6H4m-OPPh2)] (13), [Rh(acac)CO(C6H4SPPh2)] (14),
[Rh(acac)CO(C6H4NHPPh2)] (15).
Spectroscopic characterization of these complexes was performed by proton (1H NMR) and
phosphorus (31
P NMR) Nuclear Magnetic Resonance, Attenuated Total Reflectance Fourier
Transformed Infrared (ATR FTIR) and Ultra Violet (UV/Vis) spectroscopy.
Oxidative addition of methyl iodide onto the Rh(I) center, as well as the electrochemical
study with cyclic voltammetry (CV) of these complexes are described.
3.2 Synthesis
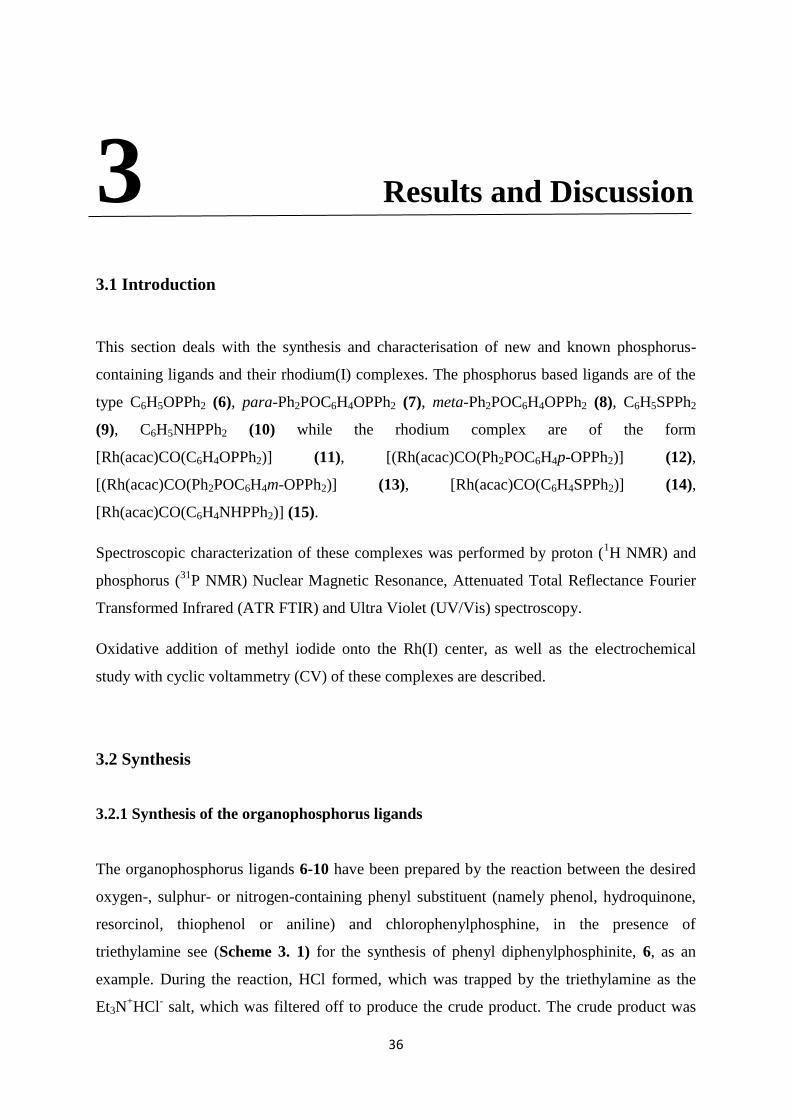
3.2.1 Synthesis of the organophosphorus ligands
The organophosphorus ligands 6-10 have been prepared by the reaction between the desired
oxygen-, sulphur- or nitrogen-containing phenyl substituent (namely phenol, hydroquinone,
resorcinol, thiophenol or aniline) and chlorophenylphosphine, in the presence of
triethylamine see (Scheme 3. 1) for the synthesis of phenyl diphenylphosphinite, 6, as an
example. During the reaction, HCl formed, which was trapped by the triethylamine as the
Et3N+HCl
- salt, which was filtered off to produce the crude product. The crude product was
37
purified by chromatography or recrystallisation. The organophosphorus ligands were
synthesised in 20-60% yields.
Care had to be taken to avoid oxidation since during the synthesis of the ligands 6-10, the
phosphrous atom can easily be oxidized, which will prevent the compound to act as a ligand.
This was achieved by using dry degased solvents under oxygen free atmosphere.
Scheme 3. 1. Schematic representation of the synthesis of phenyl diphenylphosphinite
(6).
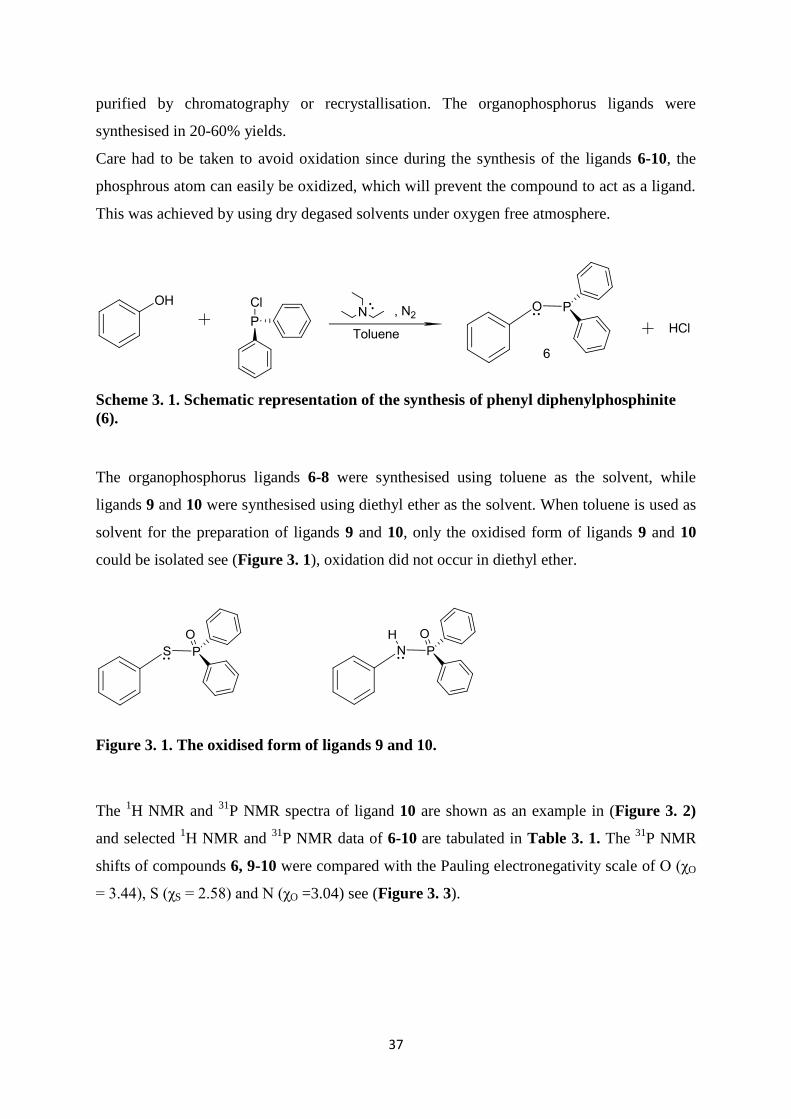
The organophosphorus ligands 6-8 were synthesised using toluene as the solvent, while
ligands 9 and 10 were synthesised using diethyl ether as the solvent. When toluene is used as
solvent for the preparation of ligands 9 and 10, only the oxidised form of ligands 9 and 10
could be isolated see (Figure 3. 1), oxidation did not occur in diethyl ether.
Figure 3. 1. The oxidised form of ligands 9 and 10.
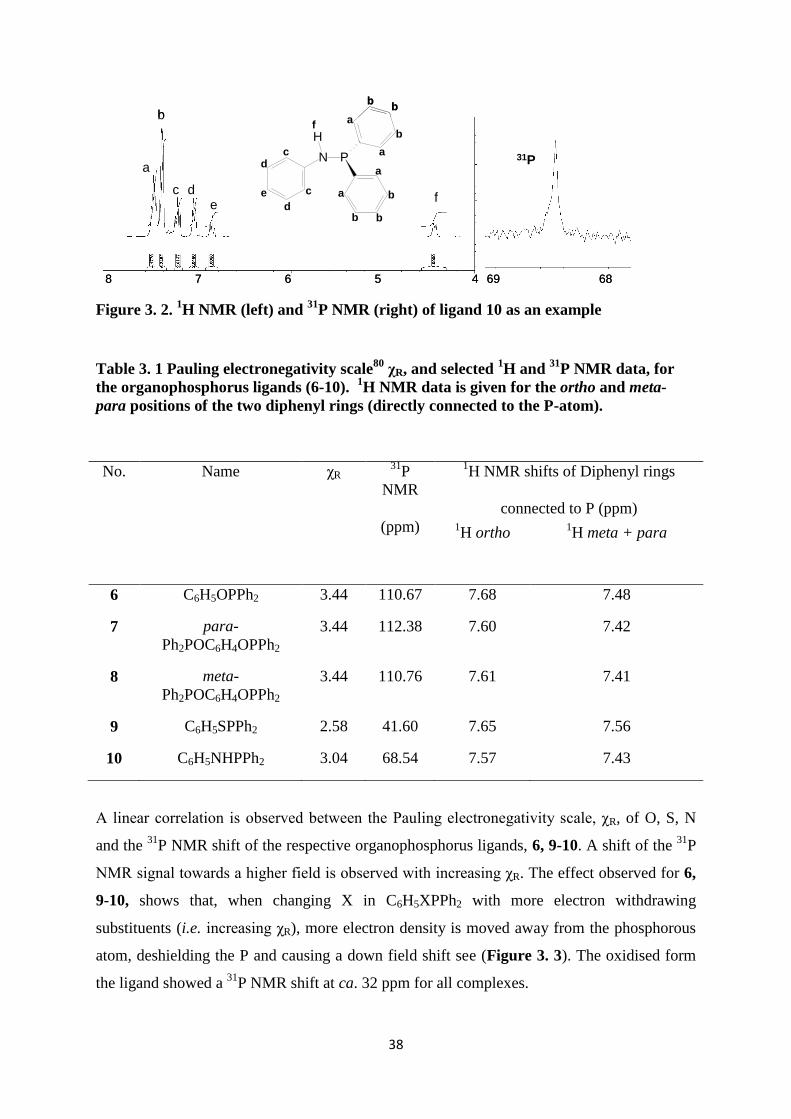
The 1H NMR and
31P NMR spectra of ligand 10 are shown as an example in (Figure 3. 2)
and selected 1H NMR and
31P NMR data of 6-10 are tabulated in Table 3. 1. The
31P NMR
shifts of compounds 6, 9-10 were compared with the Pauling electronegativity scale of O (χO
= 3.44), S (χS = 2.58) and N (χO =3.04) see (Figure 3. 3).
38
Figure 3. 2. 1H NMR (left) and
31P NMR (right) of ligand 10 as an example
Table 3. 1 Pauling electronegativity scale80
χR, and selected 1H and
31P NMR data, for
the organophosphorus ligands (6-10). 1H NMR data is given for the ortho and meta-
para positions of the two diphenyl rings (directly connected to the P-atom).
No. Name χR 31
P
NMR
(ppm)
1H NMR shifts of Diphenyl rings
connected to P (ppm) 1H ortho
1H meta + para
6 C6H5OPPh2 3.44 110.67 7.68 7.48
7 para-
Ph2POC6H4OPPh2
3.44 112.38 7.60 7.42
8 meta-
Ph2POC6H4OPPh2
3.44 110.76 7.61 7.41
9 C6H5SPPh2 2.58 41.60 7.65 7.56
10 C6H5NHPPh2 3.04 68.54 7.57 7.43
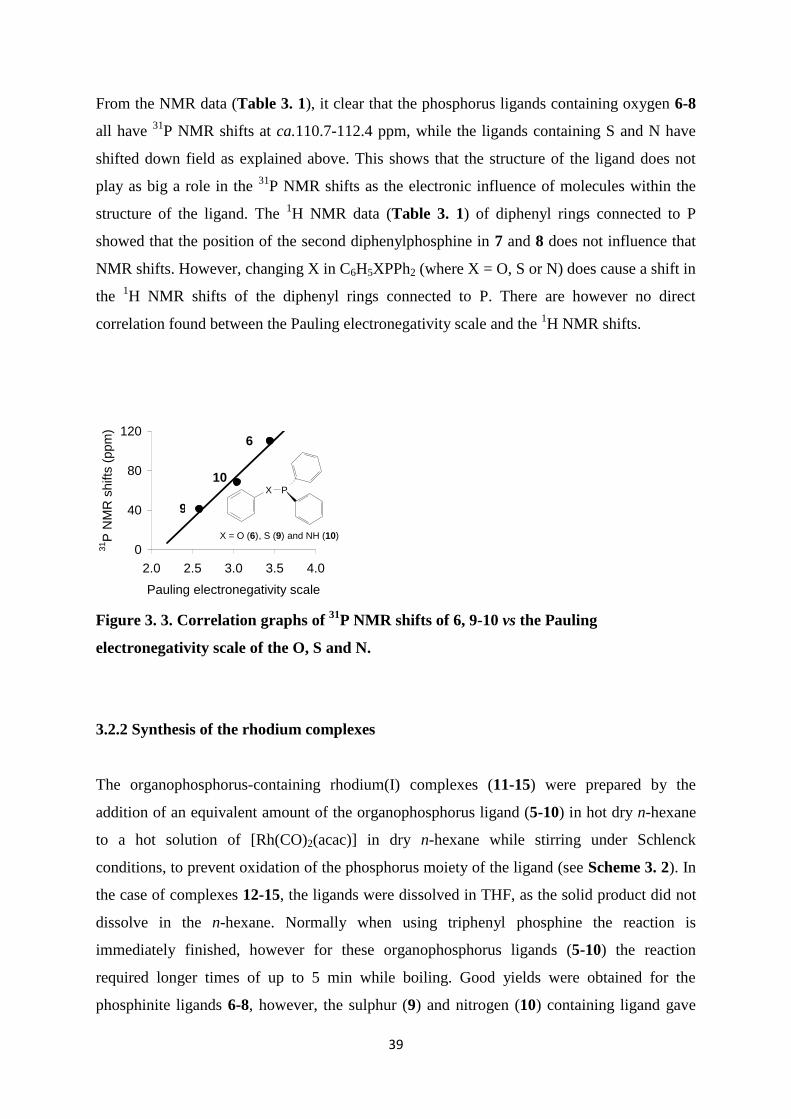
A linear correlation is observed between the Pauling electronegativity scale, χR, of O, S, N
and the 31
P NMR shift of the respective organophosphorus ligands, 6, 9-10. A shift of the 31
P
NMR signal towards a higher field is observed with increasing χR. The effect observed for 6,
9-10, shows that, when changing X in C6H5XPPh2 with more electron withdrawing
substituents (i.e. increasing χR), more electron density is moved away from the phosphorous
atom, deshielding the P and causing a down field shift see (Figure 3. 3). The oxidised form
the ligand showed a 31
P NMR shift at ca. 32 ppm for all complexes.
N P
H
a
b
c
d
e
f
a
a
a
b
b
b
bb
cda
b
c de
f
31P
8 7 6 5 4 69 68
N P
H
a
b
c
d
e
f
a
a
a
b
b
b
bb
cda
b
c de
f
31P
8 7 6 5 4 69 68
39
From the NMR data (Table 3. 1), it clear that the phosphorus ligands containing oxygen 6-8
all have 31
P NMR shifts at ca.110.7-112.4 ppm, while the ligands containing S and N have
shifted down field as explained above. This shows that the structure of the ligand does not
play as big a role in the 31
P NMR shifts as the electronic influence of molecules within the
structure of the ligand. The 1H NMR data (Table 3. 1) of diphenyl rings connected to P
showed that the position of the second diphenylphosphine in 7 and 8 does not influence that
NMR shifts. However, changing X in C6H5XPPh2 (where X = O, S or N) does cause a shift in
the 1H NMR shifts of the diphenyl rings connected to P. There are however no direct
correlation found between the Pauling electronegativity scale and the 1H NMR shifts.
Figure 3. 3. Correlation graphs of 31
P NMR shifts of 6, 9-10 vs the Pauling
electronegativity scale of the O, S and N.
3.2.2 Synthesis of the rhodium complexes
The organophosphorus-containing rhodium(I) complexes (11-15) were prepared by the
addition of an equivalent amount of the organophosphorus ligand (5-10) in hot dry n-hexane
to a hot solution of [Rh(CO)2(acac)] in dry n-hexane while stirring under Schlenck
conditions, to prevent oxidation of the phosphorus moiety of the ligand (see Scheme 3. 2). In
the case of complexes 12-15, the ligands were dissolved in THF, as the solid product did not
dissolve in the n-hexane. Normally when using triphenyl phosphine the reaction is
immediately finished, however for these organophosphorus ligands (5-10) the reaction
required longer times of up to 5 min while boiling. Good yields were obtained for the
phosphinite ligands 6-8, however, the sulphur (9) and nitrogen (10) containing ligand gave
0
40
80
120
2.0 2.5 3.0 3.5 4.0
Pauling electronegativity scale
31P
NM
R s
hifts
(ppm
)
Series1
Linear (Series1)
6
10
9
X P
X = O (6), S (9) and NH (10)
40
poor yields of 58 and 44% respectively. The poor yields obtained by 9 and 10 could be
explained by the different electronic properties of S and NH, longer reactions times might
have increased the yields.
Scheme 3. 2. Schematic representation of the synthesis [Rh(acac)CO(C6H
4OPPh
2)], 11
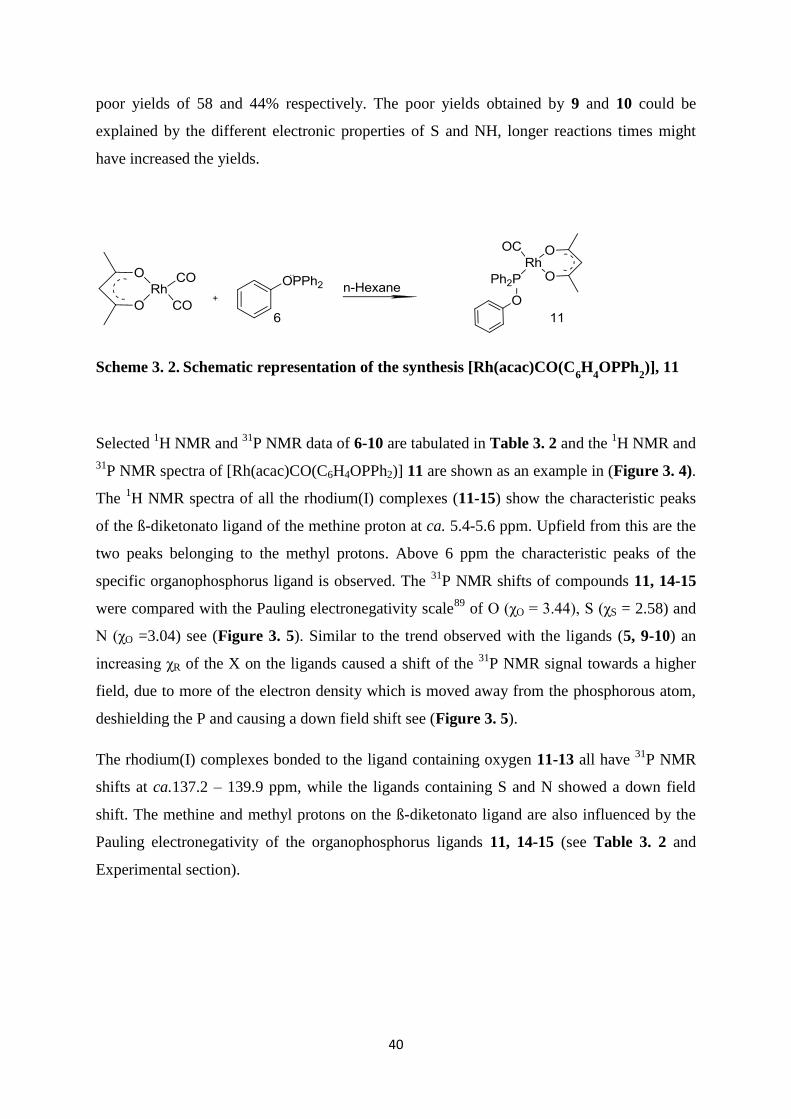
Selected 1H NMR and
31P NMR data of 6-10 are tabulated in Table 3. 2 and the
1H NMR and
31P NMR spectra of [Rh(acac)CO(C6H4OPPh2)] 11 are shown as an example in (Figure 3. 4).
The 1H NMR spectra of all the rhodium(I) complexes (11-15) show the characteristic peaks
of the ß-diketonato ligand of the methine proton at ca. 5.4-5.6 ppm. Upfield from this are the
two peaks belonging to the methyl protons. Above 6 ppm the characteristic peaks of the
specific organophosphorus ligand is observed. The 31
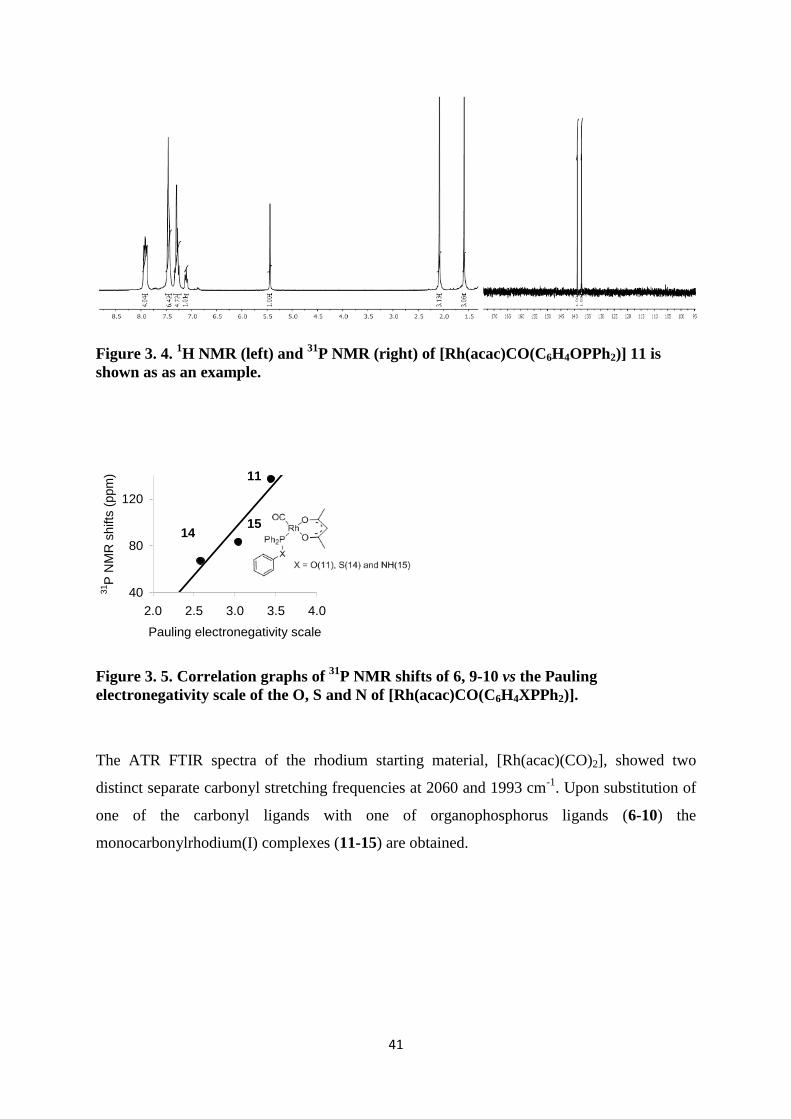
P NMR shifts of compounds 11, 14-15
were compared with the Pauling electronegativity scale89
of O (χO = 3.44), S (χS = 2.58) and
N (χO =3.04) see (Figure 3. 5). Similar to the trend observed with the ligands (5, 9-10) an
increasing χR of the X on the ligands caused a shift of the 31
P NMR signal towards a higher
field, due to more of the electron density which is moved away from the phosphorous atom,
deshielding the P and causing a down field shift see (Figure 3. 5).
The rhodium(I) complexes bonded to the ligand containing oxygen 11-13 all have 31
P NMR
shifts at ca.137.2 – 139.9 ppm, while the ligands containing S and N showed a down field
shift. The methine and methyl protons on the ß-diketonato ligand are also influenced by the
Pauling electronegativity of the organophosphorus ligands 11, 14-15 (see Table 3. 2 and
Experimental section).
41
Figure 3. 4. 1H NMR (left) and
31P NMR (right) of [Rh(acac)CO(C6H4OPPh2)] 11 is
shown as as an example.
Figure 3. 5. Correlation graphs of 31
P NMR shifts of 6, 9-10 vs the Pauling
electronegativity scale of the O, S and N of [Rh(acac)CO(C6H4XPPh2)].
The ATR FTIR spectra of the rhodium starting material, [Rh(acac)(CO)2], showed two
distinct separate carbonyl stretching frequencies at 2060 and 1993 cm-1
. Upon substitution of
one of the carbonyl ligands with one of organophosphorus ligands (6-10) the
monocarbonylrhodium(I) complexes (11-15) are obtained.
40
80
120
2.0 2.5 3.0 3.5 4.0
Pauling electronegativity scale
31P
NM
R s
hifts
(ppm
)
Series1
Linear (Series1)
11
15 14
42
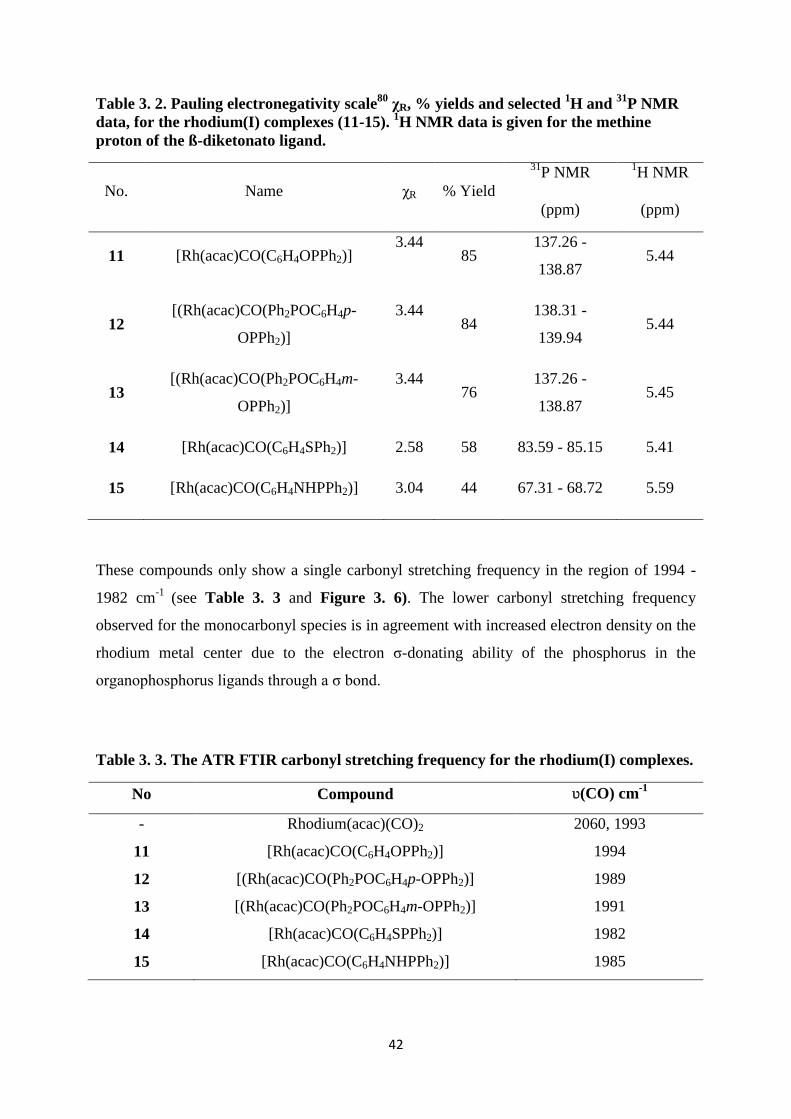
Table 3. 2. Pauling electronegativity scale80
χR, % yields and selected 1H and
31P NMR
data, for the rhodium(I) complexes (11-15). 1H NMR data is given for the methine
proton of the ß-diketonato ligand.
No. Name χR % Yield
31P NMR
(ppm)
1H NMR
(ppm)
11 [Rh(acac)CO(C6H4OPPh2)] 3.44
85 137.26 -
138.87 5.44
12 [(Rh(acac)CO(Ph2POC6H4p-
OPPh2)]
3.44 84
138.31 -
139.94 5.44
13 [(Rh(acac)CO(Ph2POC6H4m-
OPPh2)]
3.44 76
137.26 -
138.87 5.45
14 [Rh(acac)CO(C6H4SPh2)] 2.58 58 83.59 - 85.15 5.41
15 [Rh(acac)CO(C6H4NHPPh2)] 3.04 44 67.31 - 68.72 5.59
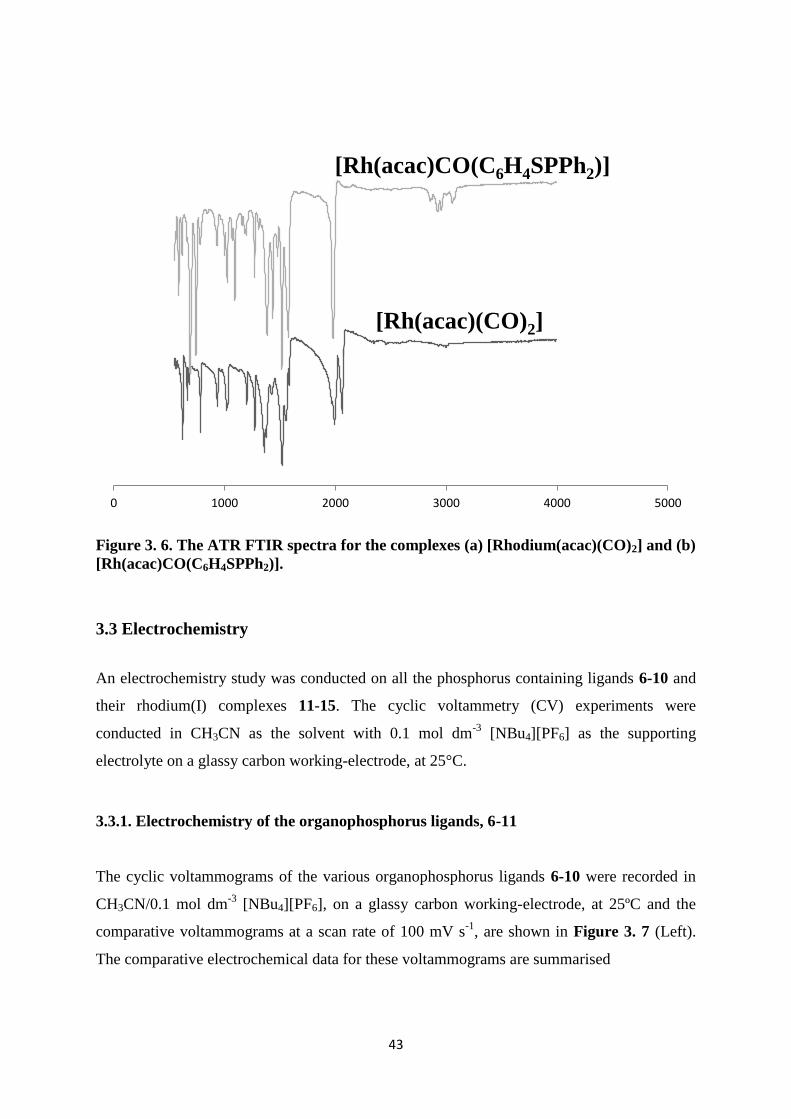
These compounds only show a single carbonyl stretching frequency in the region of 1994 -
1982 cm-1
(see Table 3. 3 and Figure 3. 6). The lower carbonyl stretching frequency
observed for the monocarbonyl species is in agreement with increased electron density on the
rhodium metal center due to the electron ζ-donating ability of the phosphorus in the
organophosphorus ligands through a ζ bond.
Table 3. 3. The ATR FTIR carbonyl stretching frequency for the rhodium(I) complexes.
No Compound ʋ(CO) cm-1
- Rhodium(acac)(CO)2 2060, 1993
11 [Rh(acac)CO(C6H4OPPh2)] 1994
12 [(Rh(acac)CO(Ph2POC6H4p-OPPh2)] 1989
13 [(Rh(acac)CO(Ph2POC6H4m-OPPh2)] 1991
14 [Rh(acac)CO(C6H4SPPh2)] 1982
15 [Rh(acac)CO(C6H4NHPPh2)] 1985
43
Figure 3. 6. The ATR FTIR spectra for the complexes (a) [Rhodium(acac)(CO)2] and (b)
[Rh(acac)CO(C6H4SPPh2)].
3.3 Electrochemistry
An electrochemistry study was conducted on all the phosphorus containing ligands 6-10 and
their rhodium(I) complexes 11-15. The cyclic voltammetry (CV) experiments were
conducted in CH3CN as the solvent with 0.1 mol dm-3
[NBu4][PF6] as the supporting
electrolyte on a glassy carbon working-electrode, at 25°C.
3.3.1. Electrochemistry of the organophosphorus ligands, 6-11
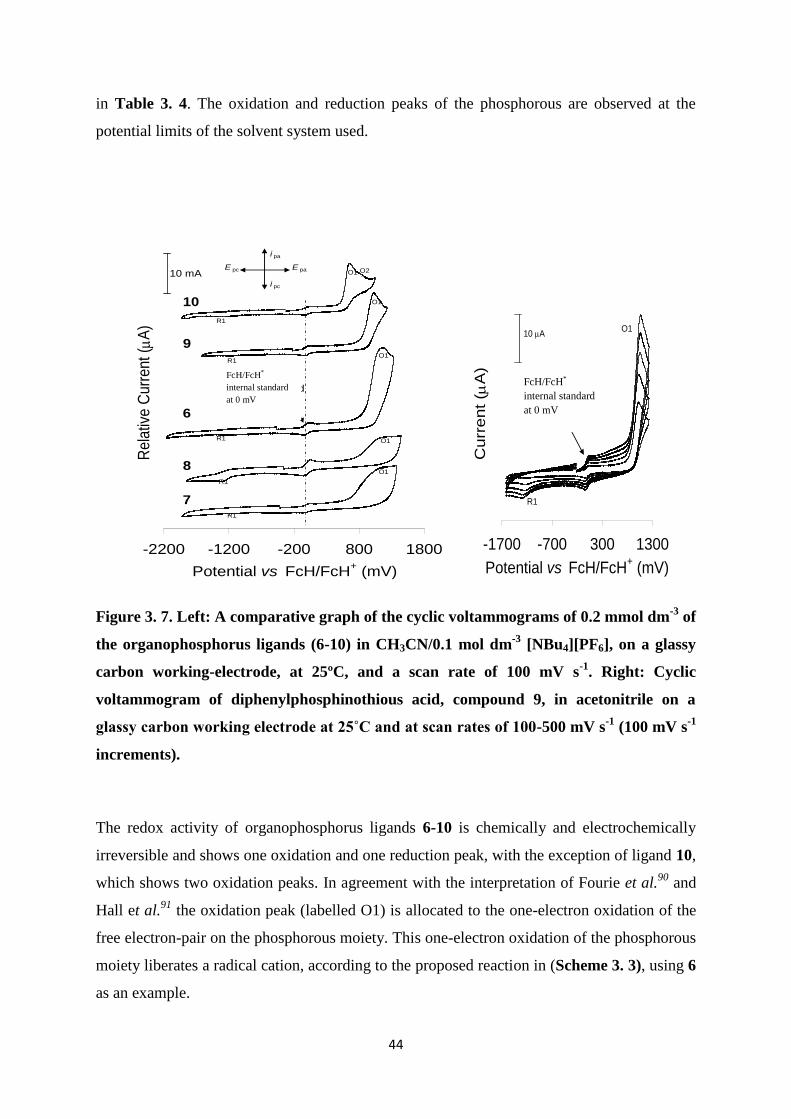
The cyclic voltammograms of the various organophosphorus ligands 6-10 were recorded in
CH3CN/0.1 mol dm-3
[NBu4][PF6], on a glassy carbon working-electrode, at 25ºC and the
comparative voltammograms at a scan rate of 100 mV s-1
, are shown in Figure 3. 7 (Left).
The comparative electrochemical data for these voltammograms are summarised
0 1000 2000 3000 4000 5000
[Rh(acac)CO(C6H4SPPh2)]
[Rh(acac)(CO)2]
44
in Table 3. 4. The oxidation and reduction peaks of the phosphorous are observed at the
potential limits of the solvent system used.
Figure 3. 7. Left: A comparative graph of the cyclic voltammograms of 0.2 mmol dm-3
of
the organophosphorus ligands (6-10) in CH3CN/0.1 mol dm-3
[NBu4][PF6], on a glassy
carbon working-electrode, at 25ºC, and a scan rate of 100 mV s-1
. Right: Cyclic
voltammogram of diphenylphosphinothious acid, compound 9, in acetonitrile on a
glassy carbon working electrode at 25˚C and at scan rates of 100-500 mV s-1
(100 mV s-1
increments).
The redox activity of organophosphorus ligands 6-10 is chemically and electrochemically
irreversible and shows one oxidation and one reduction peak, with the exception of ligand 10,
which shows two oxidation peaks. In agreement with the interpretation of Fourie et al.90
and
Hall et al.91
the oxidation peak (labelled O1) is allocated to the one-electron oxidation of the
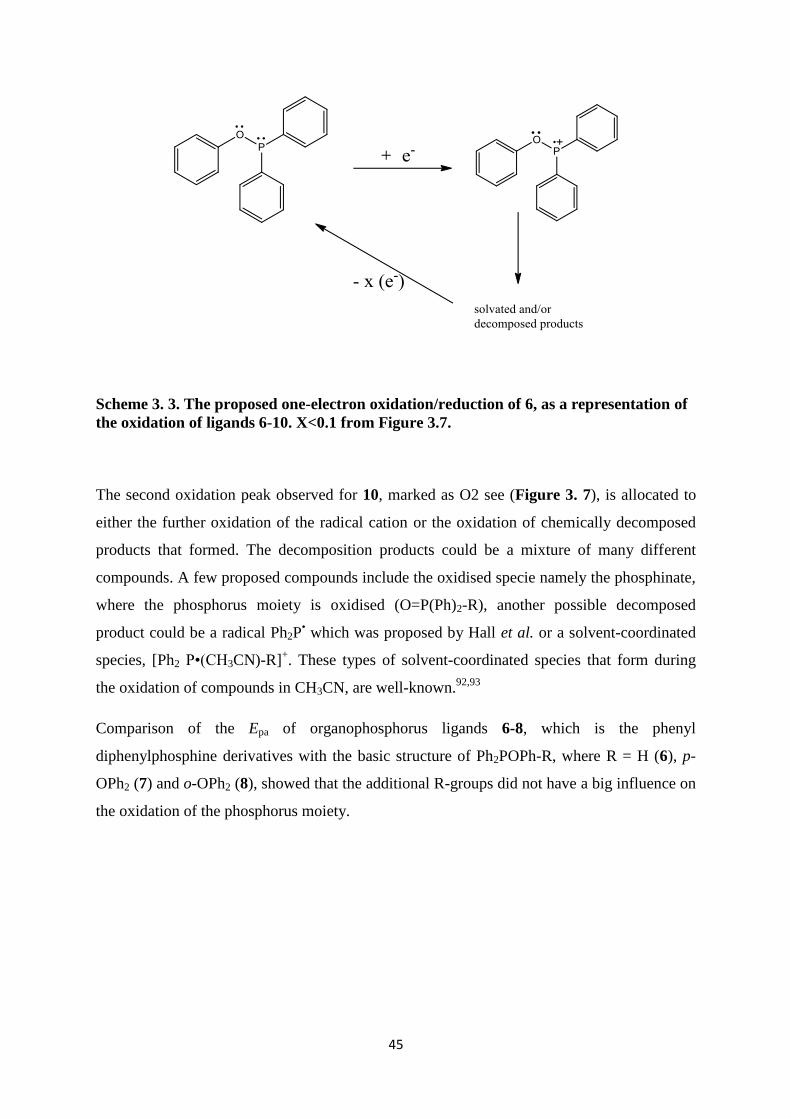
free electron-pair on the phosphorous moiety. This one-electron oxidation of the phosphorous
moiety liberates a radical cation, according to the proposed reaction in (Scheme 3. 3), using 6
as an example.
-2200 -1200 -200 800 1800
Potential vs FcH/FcH+ (mV)
Rela
tive
Curr
ent
( mA
)
7
8
6
9
10
FcH/FcH+
internal standard
at 0mV
7
8
6
9
10
O1
O1
O1
O1
O1
O2
1
O2R1
R1
R1
R1
R1
10 mA
i pa
i pc
E paE pc
-1700 -700 300 1300
Potential vs FcH/FcH+ (mV)
Curr
ent
( mA
)
500
400
300
200
100FcH/FcH+
internal standard
at 0mV
10 mAO1
O2
R1
FcH/FcH*
internal standard
at 0 mV
FcH/FcH*
internal standard
at 0 mV
45
Scheme 3. 3. The proposed one-electron oxidation/reduction of 6, as a representation of
the oxidation of ligands 6-10. X<0.1 from Figure 3.7.
The second oxidation peak observed for 10, marked as O2 see (Figure 3. 7), is allocated to
either the further oxidation of the radical cation or the oxidation of chemically decomposed
products that formed. The decomposition products could be a mixture of many different
compounds. A few proposed compounds include the oxidised specie namely the phosphinate,
where the phosphorus moiety is oxidised (O=P(Ph)2-R), another possible decomposed
product could be a radical Ph2P• which was proposed by Hall et al. or a solvent-coordinated
species, [Ph2 P•(CH3CN)-R]+. These types of solvent-coordinated species that form during
the oxidation of compounds in CH3CN, are well-known.92,93
Comparison of the Epa of organophosphorus ligands 6-8, which is the phenyl
diphenylphosphine derivatives with the basic structure of Ph2POPh-R, where R = H (6), p-
OPh2 (7) and o-OPh2 (8), showed that the additional R-groups did not have a big influence on
the oxidation of the phosphorus moiety.
46
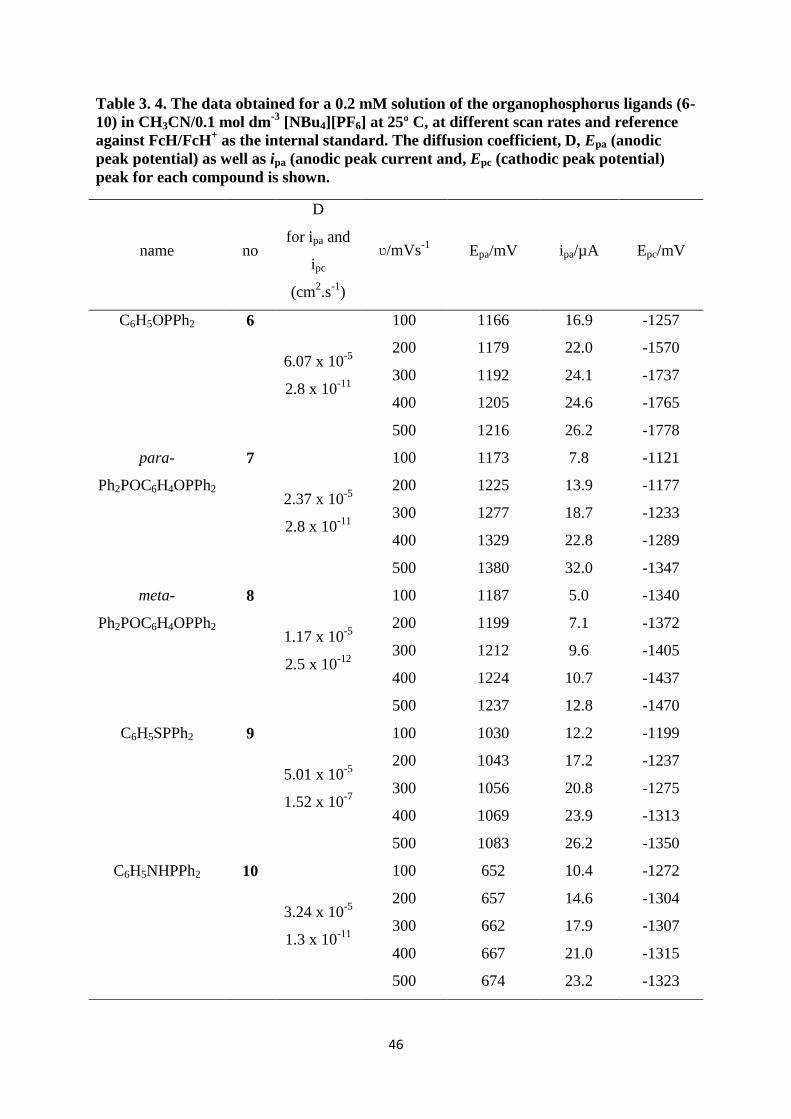
Table 3. 4. The data obtained for a 0.2 mM solution of the organophosphorus ligands (6-
10) in CH3CN/0.1 mol dm-3
[NBu4][PF6] at 25º C, at different scan rates and reference
against FcH/FcH+ as the internal standard. The diffusion coefficient, D, Epa (anodic
peak potential) as well as ipa (anodic peak current and, Epc (cathodic peak potential)
peak for each compound is shown.
name no
D
for ipa and
ipc
(cm2.s
-1)
ʋ/mVs-1
Epa/mV ipa/µA Epc/mV
C6H5OPPh2 6
6.07 x 10⁻⁵
2.8 x 10⁻¹¹
100 1166 16.9 -1257
200 1179 22.0 -1570
300 1192 24.1 -1737
400 1205 24.6 -1765
500 1216 26.2 -1778
para-
Ph2POC6H4OPPh2
7
2.37 x 10⁻⁵
2.8 x 10⁻¹¹
100 1173 7.8 -1121
200 1225 13.9 -1177
300 1277 18.7 -1233
400 1329 22.8 -1289
500 1380 32.0 -1347
meta-
Ph2POC6H4OPPh2
8
1.17 x 10⁻⁵
2.5 x 10⁻¹²
100 1187 5.0 -1340
200 1199 7.1 -1372
300 1212 9.6 -1405
400 1224 10.7 -1437
500 1237 12.8 -1470
C6H5SPPh2 9
5.01 x 10⁻⁵
1.52 x 10⁻⁷
100 1030 12.2 -1199
200 1043 17.2 -1237
300 1056 20.8 -1275
400 1069 23.9 -1313
500 1083 26.2 -1350
C6H5NHPPh2 10
3.24 x 10⁻⁵
1.3 x 10⁻¹¹
100 652 10.4 -1272
200 657 14.6 -1304
300 662 17.9 -1307
400 667 21.0 -1315
500 674 23.2 -1323
47
When X in C6H5XPPh2 is substituted with different atoms, X = O, S or NH, there is a drastic
change in the oxidation potential of the phosphorus moiety. Even though no correlation
between the Epa and the Pauling electronegativity scale could be obtained, the drastic change
in Epa still showed that there is electronic communication between the X and the P in the X-P
bond, which influences the potential at which the phosphorus moiety is being oxidised.
The reduction peak marked R1 see (Figure 3. 7), is observed at the negative limit of the
solvent window. This reduction peak is associated with the oxidation peak, O1, which is the
reduction of the decomposed oxidised species back to the neutral form (with the free
electron-pair on the phosphorous moiety), according to the schematic representation in
Scheme 3. 3.
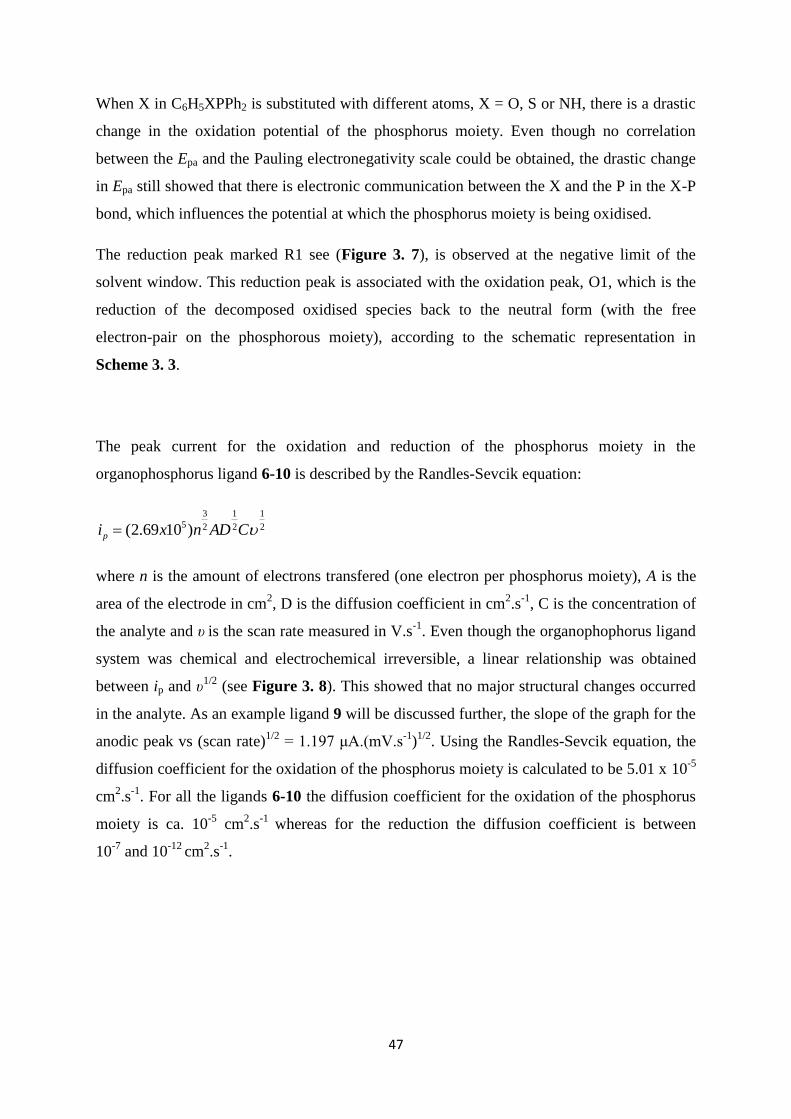
The peak current for the oxidation and reduction of the phosphorus moiety in the
organophosphorus ligand 6-10 is described by the Randles-Sevcik equation:
2
1
2
1
2
3
5)1069.2( CADnxip
where n is the amount of electrons transfered (one electron per phosphorus moiety), A is the
area of the electrode in cm2, D is the diffusion coefficient in cm
2.s
-1, C is the concentration of
the analyte and υ is the scan rate measured in V.s
-1. Even though the organophophorus ligand
system was chemical and electrochemical irreversible, a linear relationship was obtained
between ip and υ1/2
(see Figure 3. 8). This showed that no major structural changes occurred
in the analyte. As an example ligand 9 will be discussed further, the slope of the graph for the
anodic peak vs (scan rate)1/2
= 1.197 μA.(mV.s-1
)1/2
. Using the Randles-Sevcik equation, the
diffusion coefficient for the oxidation of the phosphorus moiety is calculated to be 5.01 x 10⁻⁵
cm2.s
-1. For all the ligands 6-10 the diffusion coefficient for the oxidation of the phosphorus
moiety is ca. 10-5
cm2.s
-1 whereas for the reduction the diffusion coefficient is between
10-7
and 10-12
cm2.s
-1.
48
Figure 3. 8. Graph illustrating the linear relationship between the anodic and cathodic
peak currents and (scan rate)1/2
for ligand 9 as an example.
3.3.2 Electrochemistry of the rhodium complexes
One of the main focus areas of this dissertation was to investigate the electrochemical
behaviour of the phosphorus ligand, the rhodium complex and to find the influence of the
ligand on the rhodium and a correlation of the influence of the ligand on the rhodium, if any.
The cyclic voltammograms of the various rhodium complexes (11-15) were measured in
CH3CN/0.1 mol dm-3
[NBu4][PF6], on a glassy carbon working-electrode, at 25ºC and the
comparative voltammograms at a scan rate of 100 mV s-1
, are shown in Figure 3. 9. The
electrochemical data for these voltammograms are summarised in Table 3. 5.
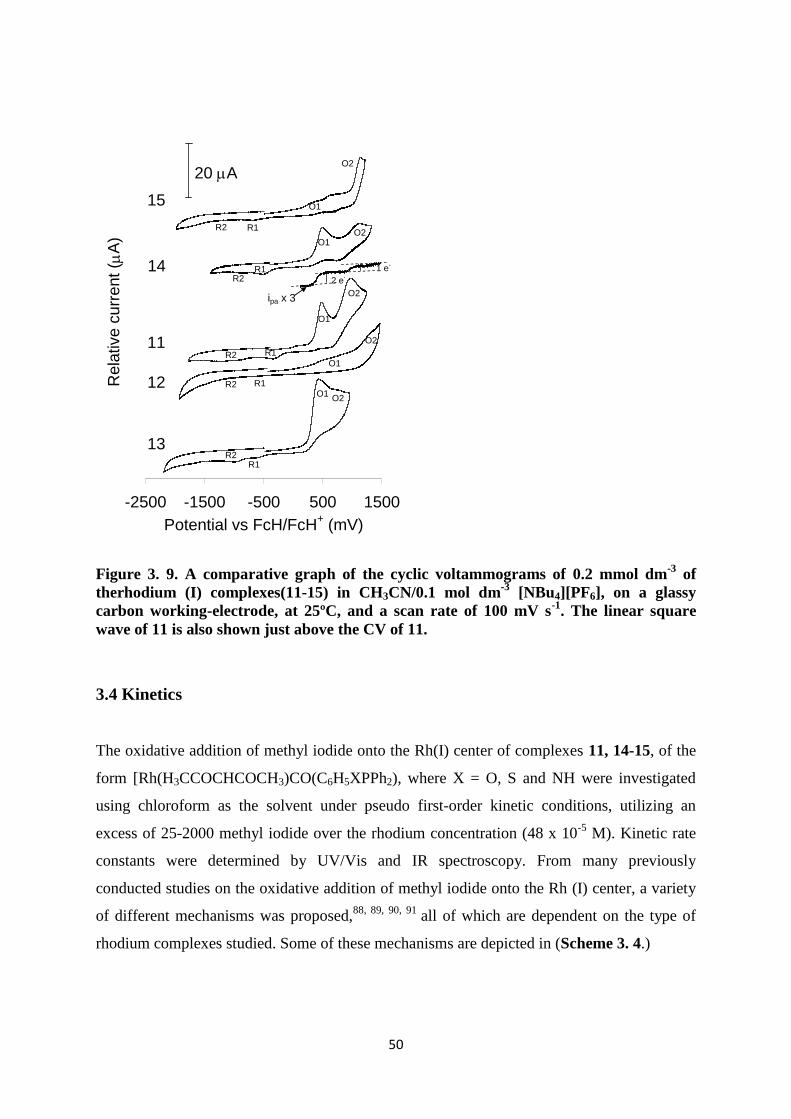
The cyclic voltammogram of the rhodium(I) complexes (11-15) show two oxidation and two
reduction peaks.
y = -0.0659x
y = 1.1969x
-5
0
5
10
15
20
25
30
35
5 10 15 20 25
Scan rate1/2
(mV.s-1)1/2
Peak c
urr
ent
( mA
)
ipa
ipc
Linear (ipc)
Linear (ipa)
49
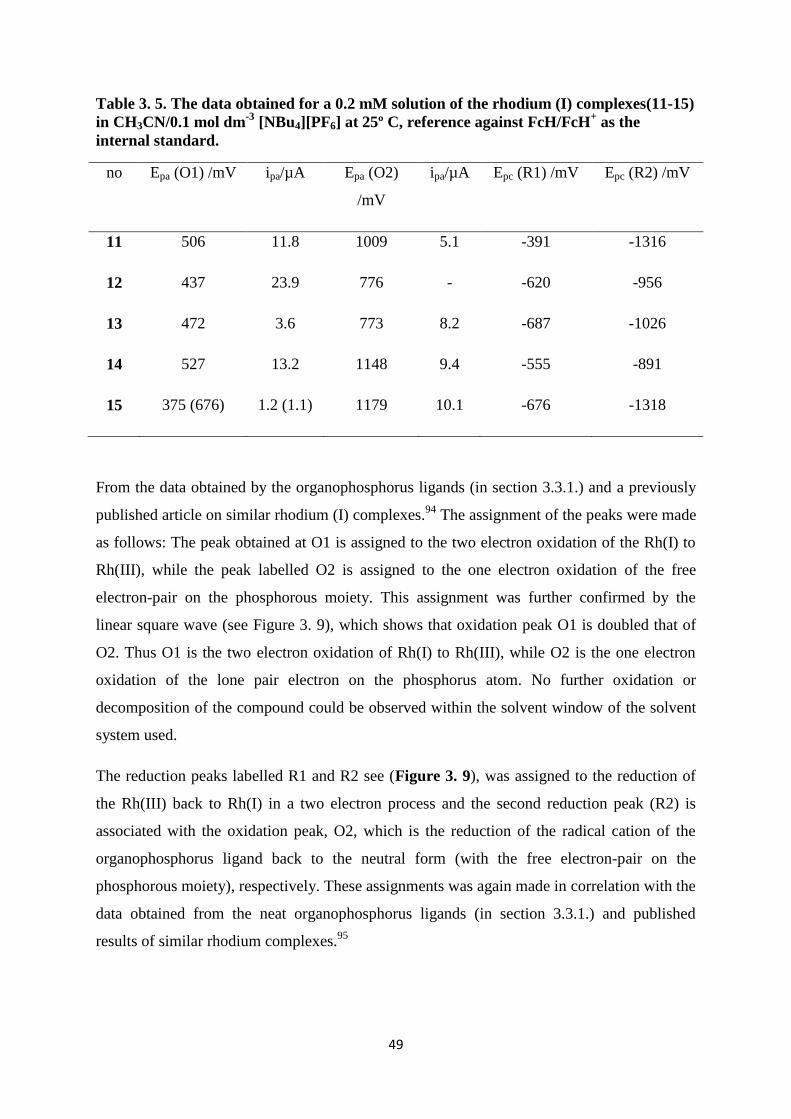
Table 3. 5. The data obtained for a 0.2 mM solution of the rhodium (I) complexes(11-15)
in CH3CN/0.1 mol dm-3
[NBu4][PF6] at 25º C, reference against FcH/FcH+ as the
internal standard.
no Epa (O1) /mV ipa/µA Epa (O2)
/mV
ipa/µA Epc (R1) /mV Epc (R2) /mV
11 506 11.8 1009 5.1 -391 -1316
12 437 23.9 776 - -620 -956
13 472 3.6 773 8.2 -687 -1026
14 527 13.2 1148 9.4 -555 -891
15 375 (676) 1.2 (1.1) 1179 10.1 -676 -1318
From the data obtained by the organophosphorus ligands (in section 3.3.1.) and a previously
published article on similar rhodium (I) complexes.94
The assignment of the peaks were made
as follows: The peak obtained at O1 is assigned to the two electron oxidation of the Rh(I) to
Rh(III), while the peak labelled O2 is assigned to the one electron oxidation of the free
electron-pair on the phosphorous moiety. This assignment was further confirmed by the
linear square wave (see Figure 3. 9), which shows that oxidation peak O1 is doubled that of
O2. Thus O1 is the two electron oxidation of Rh(I) to Rh(III), while O2 is the one electron
oxidation of the lone pair electron on the phosphorus atom. No further oxidation or
decomposition of the compound could be observed within the solvent window of the solvent
system used.
The reduction peaks labelled R1 and R2 see (Figure 3. 9), was assigned to the reduction of
the Rh(III) back to Rh(I) in a two electron process and the second reduction peak (R2) is
associated with the oxidation peak, O2, which is the reduction of the radical cation of the
organophosphorus ligand back to the neutral form (with the free electron-pair on the
phosphorous moiety), respectively. These assignments was again made in correlation with the
data obtained from the neat organophosphorus ligands (in section 3.3.1.) and published
results of similar rhodium complexes.95
50
Figure 3. 9. A comparative graph of the cyclic voltammograms of 0.2 mmol dm-3
of
therhodium (I) complexes(11-15) in CH3CN/0.1 mol dm-3
[NBu4][PF6], on a glassy
carbon working-electrode, at 25ºC, and a scan rate of 100 mV s-1
. The linear square
wave of 11 is also shown just above the CV of 11.
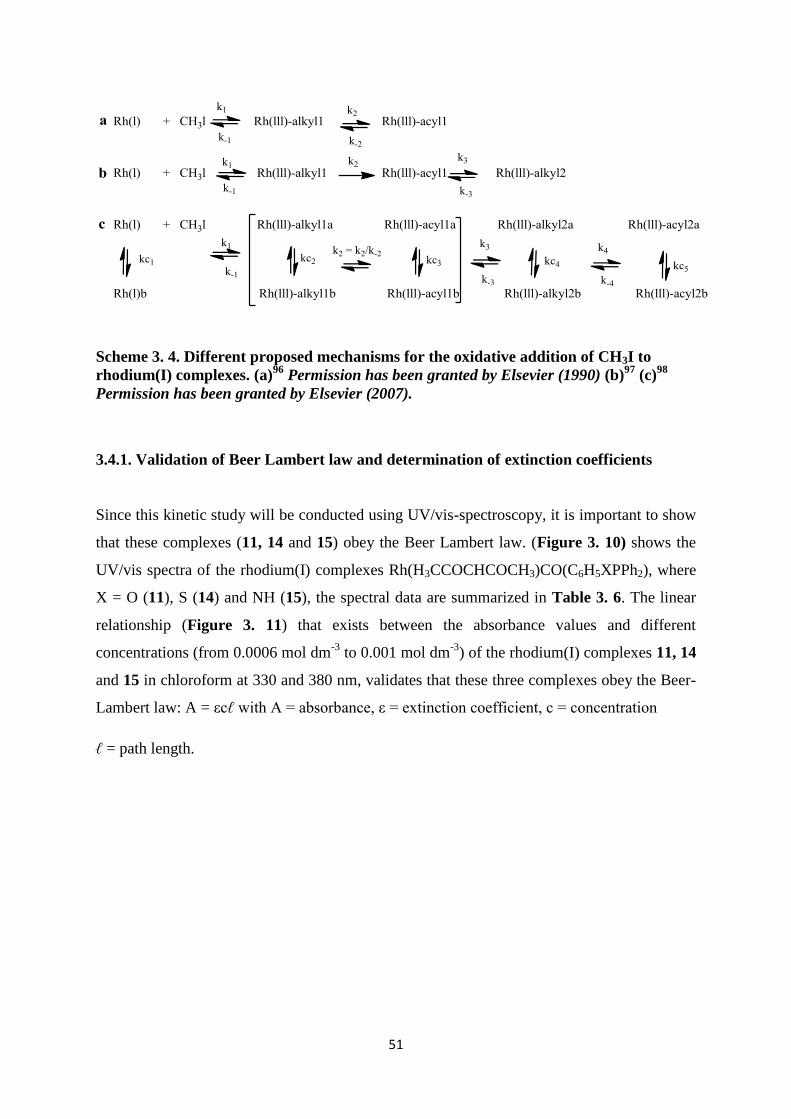
3.4 Kinetics
The oxidative addition of methyl iodide onto the Rh(I) center of complexes 11, 14-15, of the
form [Rh(H3CCOCHCOCH3)CO(C6H5XPPh2), where X = O, S and NH were investigated
using chloroform as the solvent under pseudo first-order kinetic conditions, utilizing an
excess of 25-2000 methyl iodide over the rhodium concentration (48 x 10-5
M). Kinetic rate
constants were determined by UV/Vis and IR spectroscopy. From many previously
conducted studies on the oxidative addition of methyl iodide onto the Rh (I) center, a variety
of different mechanisms was proposed,88, 89, 90, 91
all of which are dependent on the type of
rhodium complexes studied. Some of these mechanisms are depicted in (Scheme 3. 4.)
-2500 -1500 -500 500 1500
Potential vs FcH/FcH+ (mV)
Rela
tive c
urr
ent
( mA
)
para
meta
phenol
thio
ana
phenol lsv
ipa x 3
2 e-
1 e-
O1
O1
O1
O1
O1O2
O2
O2
O2
O2
R1
R1
R1
R1
R1
13
12
11
14
15
20 mA
R2
R2
R2
R2
R2
51
Scheme 3. 4. Different proposed mechanisms for the oxidative addition of CH3I to
rhodium(I) complexes. (a)96
Permission has been granted by Elsevier (1990) (b)97
(c)98
Permission has been granted by Elsevier (2007).
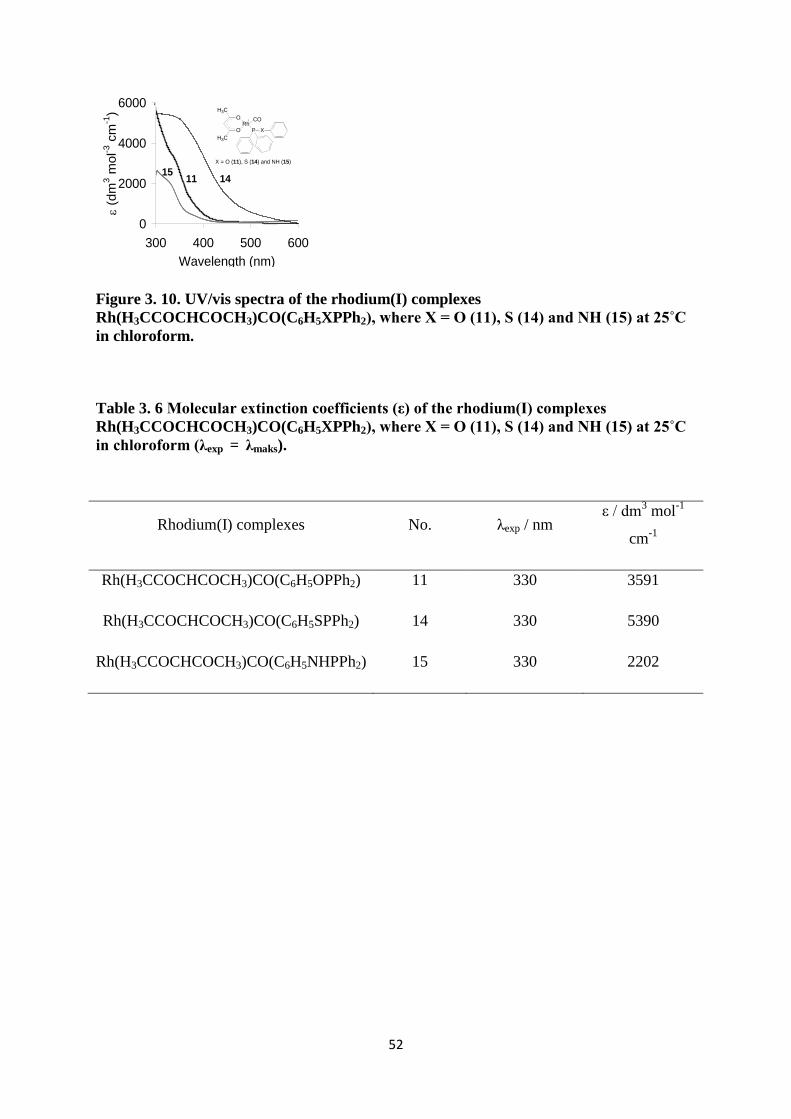
3.4.1. Validation of Beer Lambert law and determination of extinction coefficients
Since this kinetic study will be conducted using UV/vis-spectroscopy, it is important to show
that these complexes (11, 14 and 15) obey the Beer Lambert law. (Figure 3. 10) shows the
UV/vis spectra of the rhodium(I) complexes Rh(H3CCOCHCOCH3)CO(C6H5XPPh2), where
X = O (11), S (14) and NH (15), the spectral data are summarized in Table 3. 6. The linear
relationship (Figure 3. 11) that exists between the absorbance values and different
concentrations (from 0.0006 mol dm-3
to 0.001 mol dm-3
) of the rhodium(I) complexes 11, 14
and 15 in chloroform at 330 and 380 nm, validates that these three complexes obey the Beer-
Lambert law: A = εcℓ with A = absorbance, ε = extinction coefficient, c = concentration
ℓ = path length.
52
Figure 3. 10. UV/vis spectra of the rhodium(I) complexes
Rh(H3CCOCHCOCH3)CO(C6H5XPPh2), where X = O (11), S (14) and NH (15) at 25˚C
in chloroform.
Table 3. 6 Molecular extinction coefficients (ε) of the rhodium(I) complexes
Rh(H3CCOCHCOCH3)CO(C6H5XPPh2), where X = O (11), S (14) and NH (15) at 25˚C
in chloroform (λexp = λmaks).
Rhodium(I) complexes No. λexp / nm ε / dm
3 mol
-1
cm-1
Rh(H3CCOCHCOCH3)CO(C6H5OPPh2) 11 330 3591
Rh(H3CCOCHCOCH3)CO(C6H5SPPh2) 14 330 5390
Rh(H3CCOCHCOCH3)CO(C6H5NHPPh2) 15 330 2202
0
2000
4000
6000
300 400 500 600
Wavelength (nm)
e (
dm
3 m
ol-3
cm
-1)
phenol
aniline
thio
X = O (11), S (14) and NH (15)
RhCO
P
O
O
H3C
H3C
X
I
1115
14
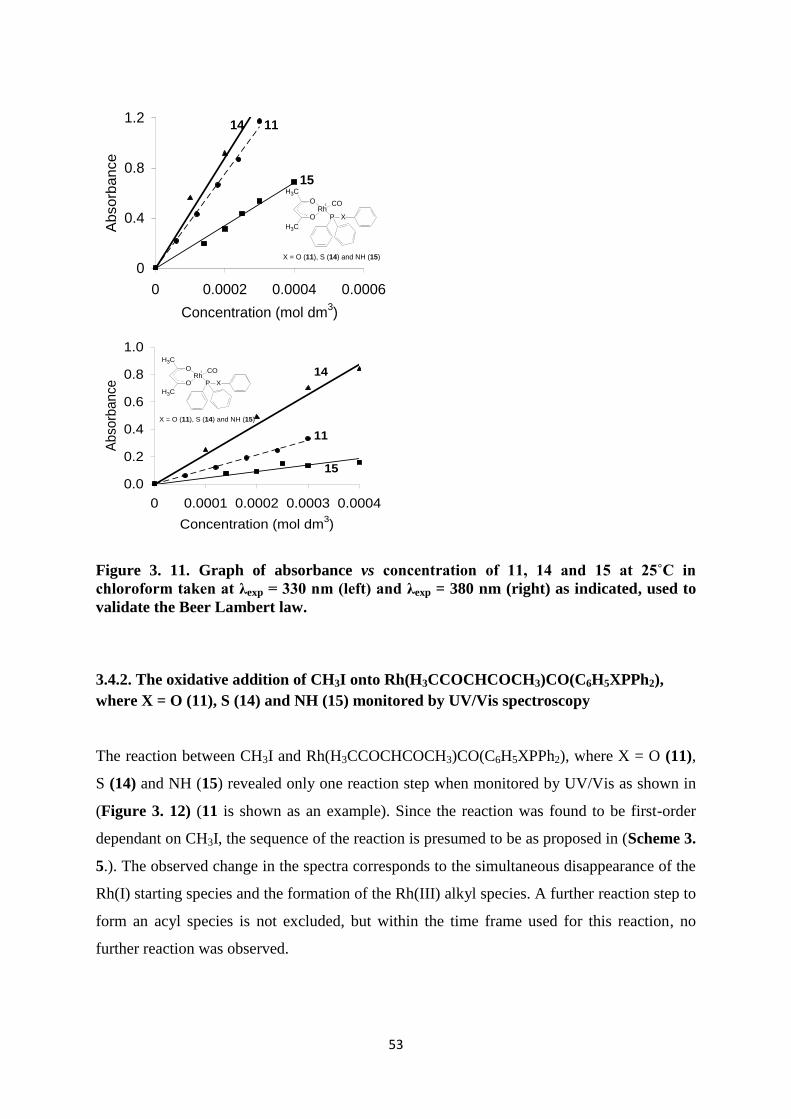
53
Figure 3. 11. Graph of absorbance vs concentration of 11, 14 and 15 at 25˚C in
chloroform taken at λexp = 330 nm (left) and λexp = 380 nm (right) as indicated, used to
validate the Beer Lambert law.
3.4.2. The oxidative addition of CH3I onto Rh(H3CCOCHCOCH3)CO(C6H5XPPh2),
where X = O (11), S (14) and NH (15) monitored by UV/Vis spectroscopy
The reaction between CH3I and Rh(H3CCOCHCOCH3)CO(C6H5XPPh2), where X = O (11),
S (14) and NH (15) revealed only one reaction step when monitored by UV/Vis as shown in
(Figure 3. 12) (11 is shown as an example). Since the reaction was found to be first-order
dependant on CH3I, the sequence of the reaction is presumed to be as proposed in (Scheme 3.
5.). The observed change in the spectra corresponds to the simultaneous disappearance of the
Rh(I) starting species and the formation of the Rh(III) alkyl species. A further reaction step to
form an acyl species is not excluded, but within the time frame used for this reaction, no
further reaction was observed.
0
0.4
0.8
1.2
0 0.0002 0.0004 0.0006
Concentration (mol dm3)
Absorb
ance
phenol
aniline
thio
Linear (phenol)
Linear (thio)
Linear (aniline)
X = O (11), S (14) and NH (15)
RhCO
P
O
O
H3C
H3C
X
I
14 11
15
0.0
0.2
0.4
0.6
0.8
1.0
0 0.0001 0.0002 0.0003 0.0004
Concentration (mol dm3)
Ab
so
rba
nce
phenol
aniline
thio
Linear (phenol)
Linear (thio)
Linear (aniline)
X = O (11), S (14) and NH (15)
RhCO
P
O
O
H3C
H3C
X
I 14
11
15
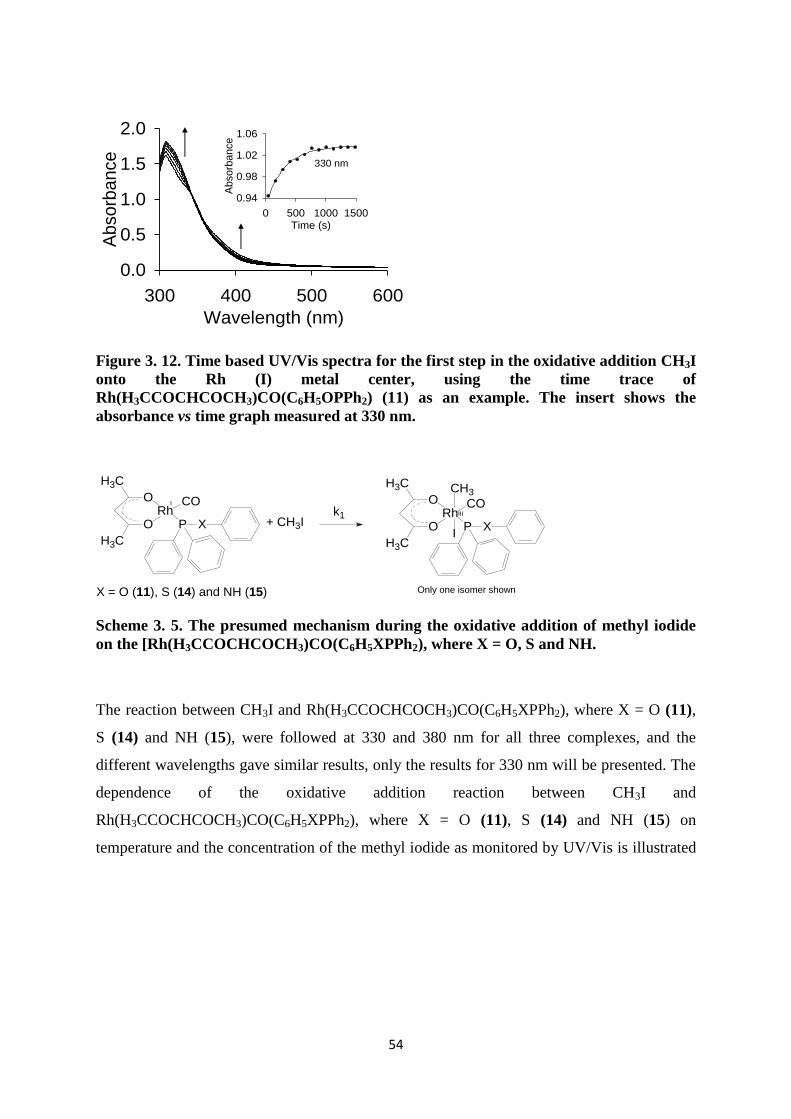
54
Figure 3. 12. Time based UV/Vis spectra for the first step in the oxidative addition CH3I
onto the Rh (I) metal center, using the time trace of
Rh(H3CCOCHCOCH3)CO(C6H5OPPh2) (11) as an example. The insert shows the
absorbance vs time graph measured at 330 nm.
X = O (11), S (14) and NH (15)
+ CH3IRh
CO
P
O
O
H3C
H3C
XRh
CO
P
O
O
H3C
H3C
X
CH3
I
k1
I
III
Only one isomer shown
Scheme 3. 5. The presumed mechanism during the oxidative addition of methyl iodide
on the [Rh(H3CCOCHCOCH3)CO(C6H5XPPh2), where X = O, S and NH.
The reaction between CH3I and Rh(H3CCOCHCOCH3)CO(C6H5XPPh2), where X = O (11),
S (14) and NH (15), were followed at 330 and 380 nm for all three complexes, and the
different wavelengths gave similar results, only the results for 330 nm will be presented. The
dependence of the oxidative addition reaction between CH3I and
Rh(H3CCOCHCOCH3)CO(C6H5XPPh2), where X = O (11), S (14) and NH (15) on
temperature and the concentration of the methyl iodide as monitored by UV/Vis is illustrated
0.0
0.5
1.0
1.5
2.0
300 400 500 600
Wavelength (nm)
Absorb
ance
A vs T 1000x 330nm
0.94
0.98
1.02
1.06
0 500 1000 1500Time (s)
Ab
so
rba
nce
Cal_AA
330 nm
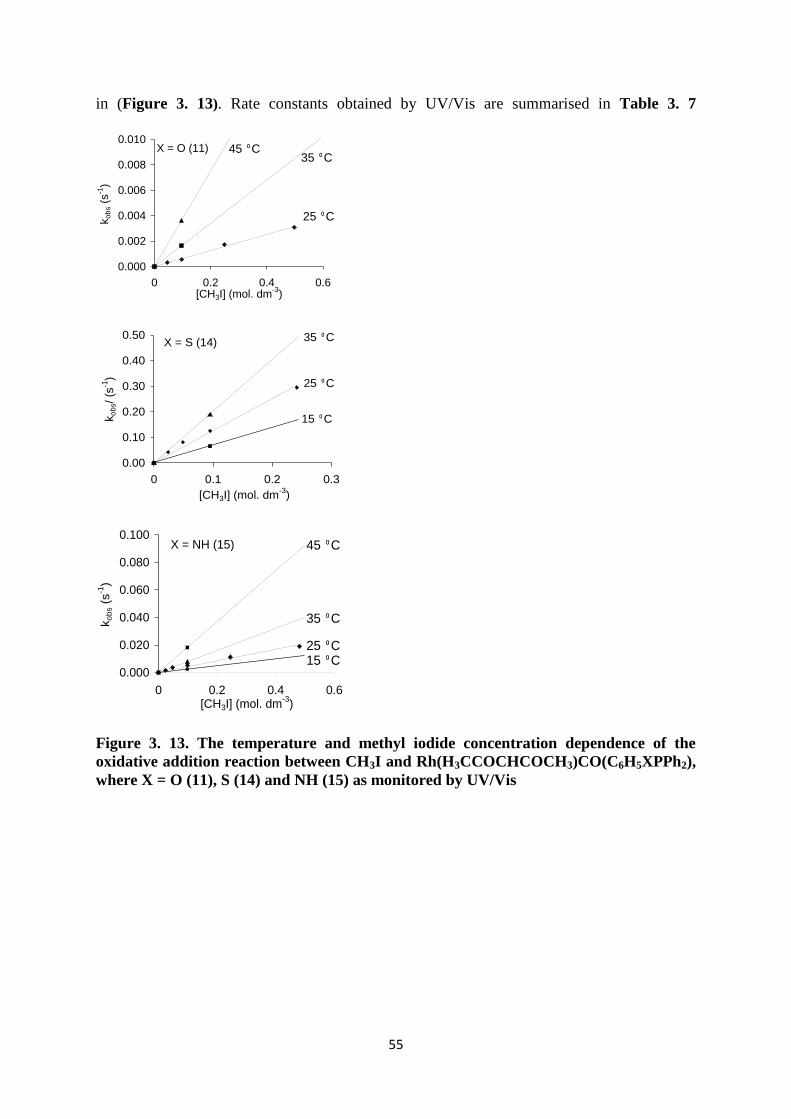
55
in (Figure 3. 13). Rate constants obtained by UV/Vis are summarised in Table 3. 7
Figure 3. 13. The temperature and methyl iodide concentration dependence of the
oxidative addition reaction between CH3I and Rh(H3CCOCHCOCH3)CO(C6H5XPPh2),
where X = O (11), S (14) and NH (15) as monitored by UV/Vis
kobs vs [MeI] at 25, 35 and 45 °C. Rh(acac) Phenol
y = 0.0064x
R2 = 0.9958
y = 0.0171x
R2 = 1
y = 0.0378x
R2 = 1
0.000
0.002
0.004
0.006
0.008
0.010
0 0.2 0.4 0.6[CH3I] (mol. dm
-3)
ko
bs (
s-1
)
Series1
35
45
Linear(Series1)Linear(35)
Linear(45)
45 ⁰C35 ⁰C
25 ⁰C
X = O (11)
kobs vs [MeI] at 15, 25 and 35 °C. Rh(acac) Thiophenol
y = 1.2517x
R2 = 0.9881
y = 2.018x
R2 = 1
y = 0.6892x
R2 = 1
0.00
0.10
0.20
0.30
0.40
0.50
0 0.1 0.2 0.3
[CH3I] (mol. dm-3
)
ko
bs/ (s
-1)
Series1
15
35
Linear(Series1)Linear(35)
Linear(15)
25 ⁰C
35 ⁰C
15 ⁰C
X = S (14)
kobs vs [MeI] at 15, 25, 35 and 45 °C. Rh(acac) Aniline
y = 0.0417x
R2
= 0.9759y = 0.0798x
R2
= 1
y = 0.185x
R2
= 1
0.000
0.020
0.040
0.060
0.080
0.100
0 0.2 0.4 0.6[CH3I] (mol. dm
-3)
ko
bs (
s-1
)
Series1
15
35
45
Linear(Series1)Linear(35)
Linear(45)
Linear(15)
45 ⁰C
35 ⁰C
25 ⁰C15 ⁰C
X = NH (15)
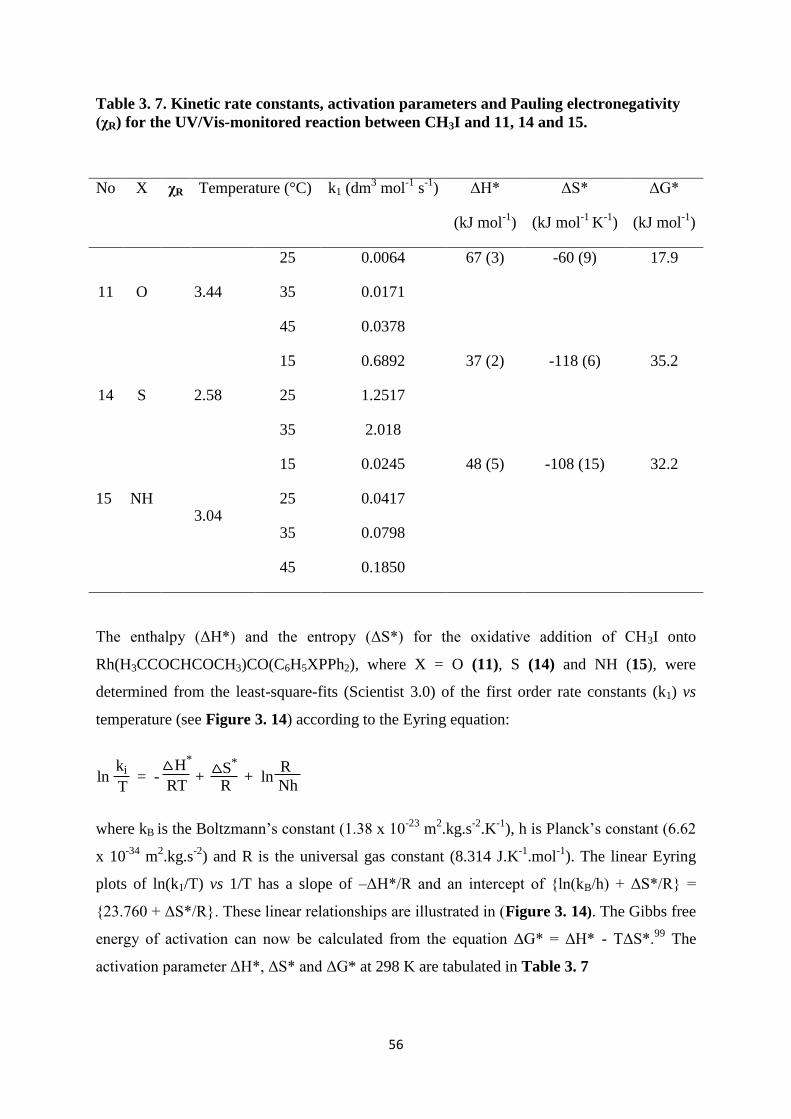
56
Table 3. 7. Kinetic rate constants, activation parameters and Pauling electronegativity
(χR) for the UV/Vis-monitored reaction between CH3I and 11, 14 and 15.
No X χR Temperature (°C) k1 (dm3 mol
-1 s
-1) ΔH*
(kJ mol-1
)
ΔS*
(kJ mol-1
K-1
)
ΔG*
(kJ mol-1
)
11
O 3.44
25 0.0064 67 (3) -60 (9) 17.9
35 0.0171
45 0.0378
14
S 2.58
15 0.6892 37 (2) -118 (6) 35.2
25 1.2517
35 2.018
15
NH 3.04
15 0.0245 48 (5) -108 (15) 32.2
25 0.0417
35 0.0798
45 0.1850
The enthalpy (ΔH*) and the entropy (ΔS*) for the oxidative addition of CH3I onto
Rh(H3CCOCHCOCH3)CO(C6H5XPPh2), where X = O (11), S (14) and NH (15), were
determined from the least-square-fits (Scientist 3.0) of the first order rate constants (k1) vs
temperature (see Figure 3. 14) according to the Eyring equation:
ln = - + + lnRT
H*ki
T
Nh
R
RS*
where kB is the Boltzmann‟s constant (1.38 x 10⁻²³
m2.kg.s
-2.K
-1), h is Planck‟s constant (6.62
x 10-34
m2.kg.s
-2) and R is the universal gas constant (8.314 J.K
-1.mol
-1). The linear Eyring
plots of ln(k1/T) vs 1/T has a slope of –ΔH*/R and an intercept of {ln(kB/h) + ΔS*/R} =
{23.760 + ΔS*/R}. These linear relationships are illustrated in (Figure 3. 14). The Gibbs free
energy of activation can now be calculated from the equation ΔG* = ΔH* - TΔS*.99
The
activation parameter ΔH*, ΔS* and ΔG* at 298 K are tabulated in Table 3. 7
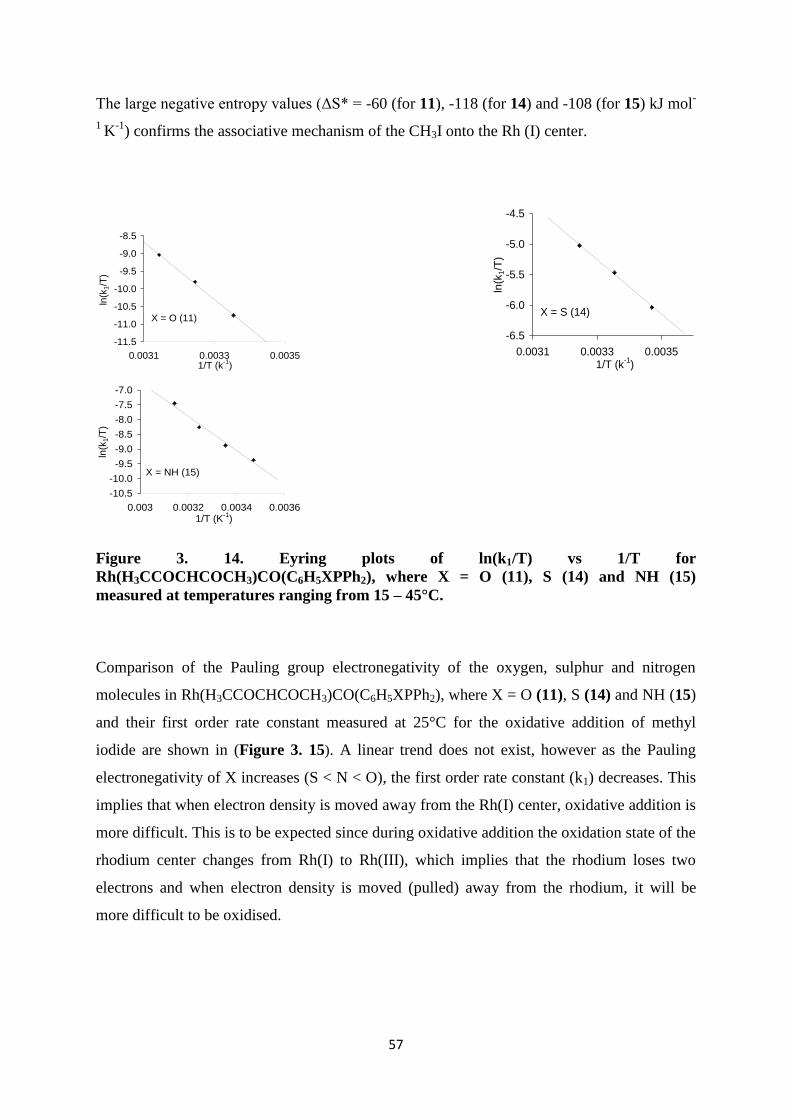
57
The large negative entropy values (ΔS* = -60 (for 11), -118 (for 14) and -108 (for 15) kJ mol-
1 K
-1) confirms the associative mechanism of the CH3I onto the Rh (I) center.
Figure 3. 14. Eyring plots of ln(k1/T) vs 1/T for
Rh(H3CCOCHCOCH3)CO(C6H5XPPh2), where X = O (11), S (14) and NH (15)
measured at temperatures ranging from 15 – 45°C.
Comparison of the Pauling group electronegativity of the oxygen, sulphur and nitrogen
molecules in Rh(H3CCOCHCOCH3)CO(C6H5XPPh2), where X = O (11), S (14) and NH (15)
and their first order rate constant measured at 25°C for the oxidative addition of methyl
iodide are shown in (Figure 3. 15). A linear trend does not exist, however as the Pauling
electronegativity of X increases (S < N < O), the first order rate constant (k1) decreases. This
implies that when electron density is moved away from the Rh(I) center, oxidative addition is
more difficult. This is to be expected since during oxidative addition the oxidation state of the
rhodium center changes from Rh(I) to Rh(III), which implies that the rhodium loses two
electrons and when electron density is moved (pulled) away from the rhodium, it will be
more difficult to be oxidised.
ln(k1/T) vs (1/T) for the formation of Rh(I)-alkyl specie, Rh(acac)
Phenol
y = -8119.6x + 16.505
R2
= 0.998
-11.5
-11.0
-10.5
-10.0
-9.5
-9.0
-8.5
0.0031 0.0033 0.00351/T (k
-1)
ln(k
1/T
)
Series1
Linear(Series1)
X = O (11)
ln(k1/T) vs (1/T) for the formation of Rh(I)-alkyl specie, Rh(acac)
Thiophenol
y = -4475.9x + 9.5112
R2
= 0.9977
-6.5
-6.0
-5.5
-5.0
-4.5
0.0031 0.0033 0.00351/T (k
-1)
ln(k
1/T
)
Series1
Linear(Series1)
X = S (14)
ln(k1/T) vs (1/T) for the formation of Rh(I)-alkyl specie, Rh(acac)
Aniline
y = -5829.9x + 10.768
R2
= 0.9809
-10.5
-10.0
-9.5
-9.0
-8.5
-8.0
-7.5
-7.0
0.003 0.0032 0.0034 0.00361/T (K
-1)
ln(k
1/T
)
Series1
Linear(Series1)
X = NH (15)
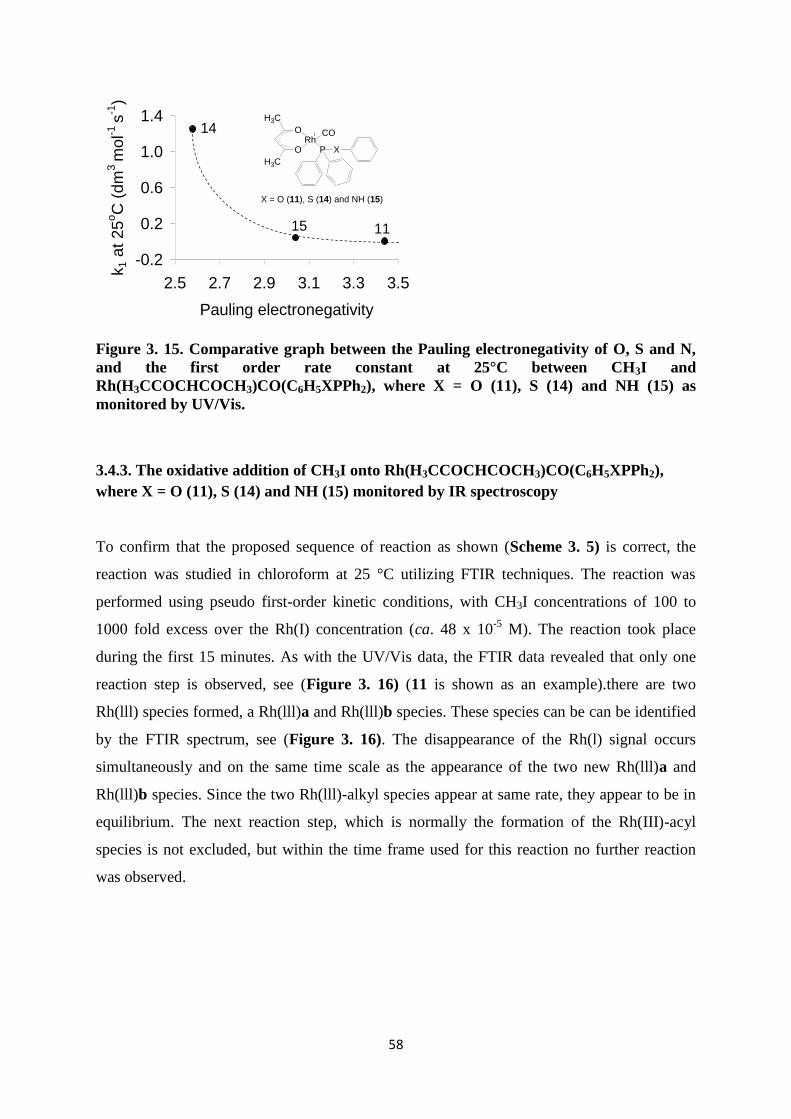
58
Figure 3. 15. Comparative graph between the Pauling electronegativity of O, S and N,
and the first order rate constant at 25°C between CH3I and
Rh(H3CCOCHCOCH3)CO(C6H5XPPh2), where X = O (11), S (14) and NH (15) as
monitored by UV/Vis.
3.4.3. The oxidative addition of CH3I onto Rh(H3CCOCHCOCH3)CO(C6H5XPPh2),
where X = O (11), S (14) and NH (15) monitored by IR spectroscopy
To confirm that the proposed sequence of reaction as shown (Scheme 3. 5) is correct, the
reaction was studied in chloroform at 25 °C utilizing FTIR techniques. The reaction was
performed using pseudo first-order kinetic conditions, with CH3I concentrations of 100 to
1000 fold excess over the Rh(I) concentration (ca. 48 x 10-5
M). The reaction took place
during the first 15 minutes. As with the UV/Vis data, the FTIR data revealed that only one
reaction step is observed, see (Figure 3. 16) (11 is shown as an example).there are two
Rh(lll) species formed, a Rh(lll)a and Rh(lll)b species. These species can be can be identified
by the FTIR spectrum, see (Figure 3. 16). The disappearance of the Rh(l) signal occurs
simultaneously and on the same time scale as the appearance of the two new Rh(lll)a and
Rh(lll)b species. Since the two Rh(lll)-alkyl species appear at same rate, they appear to be in
equilibrium. The next reaction step, which is normally the formation of the Rh(III)-acyl
species is not excluded, but within the time frame used for this reaction no further reaction
was observed.
-0.2
0.2
0.6
1.0
1.4
2.5 2.7 2.9 3.1 3.3 3.5
Pauling electronegativity
k1 a
t 2
5oC
(d
m3
mo
l-1 s
-1)
Series1
X = O (11), S (14) and NH (15)
RhCO
P
O
O
H3C
H3C
X
I
1115
14
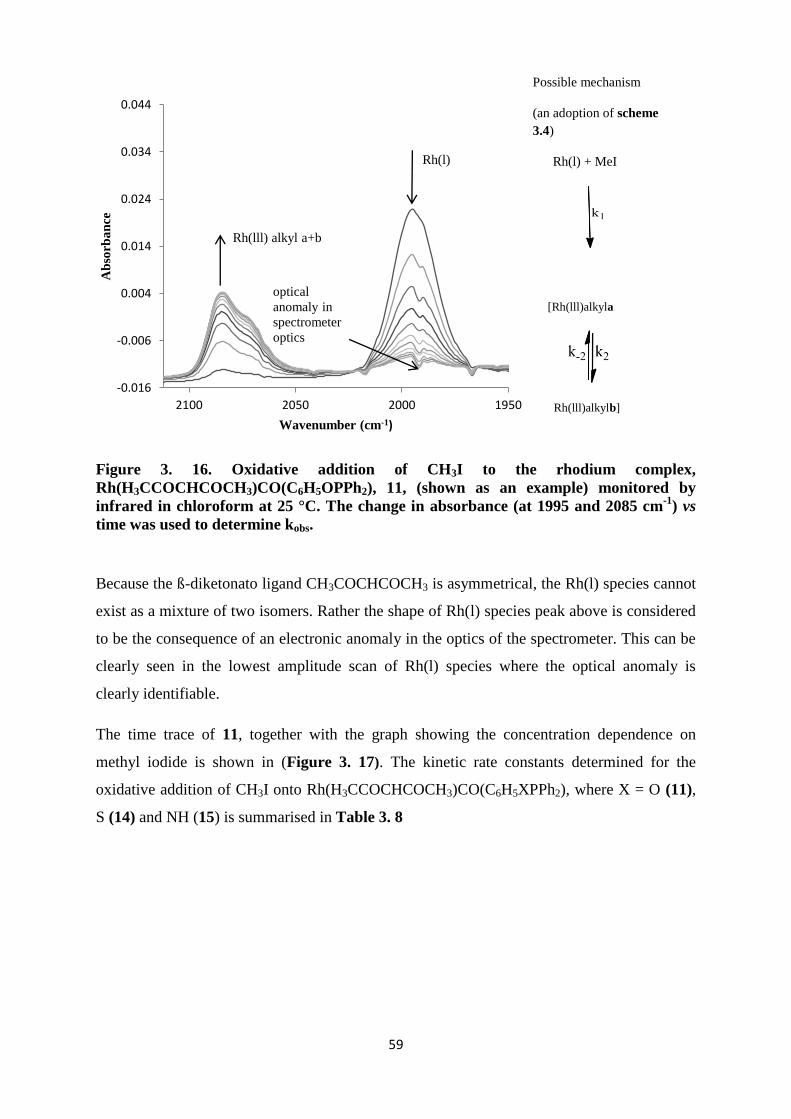
59
Figure 3. 16. Oxidative addition of CH3I to the rhodium complex,
Rh(H3CCOCHCOCH3)CO(C6H5OPPh2), 11, (shown as an example) monitored by
infrared in chloroform at 25 °C. The change in absorbance (at 1995 and 2085 cm-1
) vs
time was used to determine kobs.
Because the ß-diketonato ligand CH3COCHCOCH3 is asymmetrical, the Rh(l) species cannot
exist as a mixture of two isomers. Rather the shape of Rh(l) species peak above is considered
to be the consequence of an electronic anomaly in the optics of the spectrometer. This can be
clearly seen in the lowest amplitude scan of Rh(l) species where the optical anomaly is
clearly identifiable.
The time trace of 11, together with the graph showing the concentration dependence on
methyl iodide is shown in (Figure 3. 17). The kinetic rate constants determined for the
oxidative addition of CH3I onto Rh(H3CCOCHCOCH3)CO(C6H5XPPh2), where X = O (11),
S (14) and NH (15) is summarised in Table 3. 8
-0.016
-0.006
0.004
0.014
0.024
0.034
0.044
1950200020502100
Ab
sorb
an
ce
Wavenumber (cm-1)
Rh(lll) alkyl a+b
Rh(l)
optical
anomaly in
spectrometer
optics
Possible mechanism
(an adoption of scheme
3.4)
Rh(l) + MeI
[Rh(lll)alkyla
Rh(lll)alkylb]
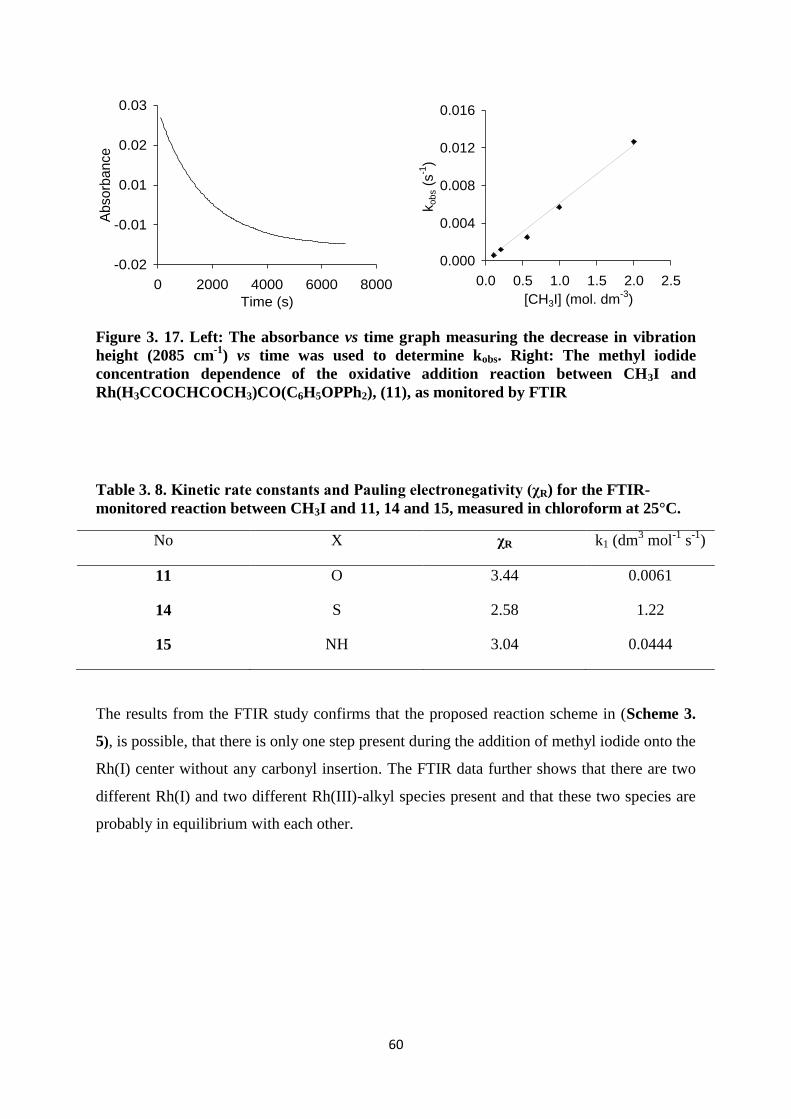
60
Figure 3. 17. Left: The absorbance vs time graph measuring the decrease in vibration
height (2085 cm-1
) vs time was used to determine kobs. Right: The methyl iodide
concentration dependence of the oxidative addition reaction between CH3I and
Rh(H3CCOCHCOCH3)CO(C6H5OPPh2), (11), as monitored by FTIR
Table 3. 8. Kinetic rate constants and Pauling electronegativity (χR) for the FTIR-
monitored reaction between CH3I and 11, 14 and 15, measured in chloroform at 25°C.
No X χR k1 (dm3 mol
-1 s
-1)
11 O 3.44 0.0061
14 S 2.58 1.22
15 NH 3.04 0.0444
The results from the FTIR study confirms that the proposed reaction scheme in (Scheme 3.
5), is possible, that there is only one step present during the addition of methyl iodide onto the
Rh(I) center without any carbonyl insertion. The FTIR data further shows that there are two
different Rh(I) and two different Rh(III)-alkyl species present and that these two species are
probably in equilibrium with each other.
-0.02
-0.01
0.01
0.02
0.03
0 2000 4000 6000 8000
Time (s)
Absorb
ance S
eries1
Kobs vs Con Rh(acac) Phenol : IR
y = 0.0061x
R2 = 0.9885
0.000
0.004
0.008
0.012
0.016
0.0 0.5 1.0 1.5 2.0 2.5
[CH3I] (mol. dm-3
)
ko
bs (
s-1
)
61
3.4.4. Correlation of the kinetic rate constants of the reaction between CH3I and
Rh(H3CCOCHCOCH3)CO(C6H5XPPh2), where X = O (11), S (14) and NH (15) as
obtained by various spectroscopic methods
A good correlation has been obtained for the kinetic rate constants of the oxidative addition
of methyl iodide onto the Rh(I) center of Rh(H3CCOCHCOCH3)CO(C6H5XPPh2), where X =
O (11), S (14) and NH (15) as determined from the data obtained by UV/Vis and FTIR
spectroscopy see Table 3. 9, using chloroform as solvent at 25°C.
Table 3. 9. The kinetic rate constants of the oxidative addition of methyl iodide onto
Rh(H3CCOCHCOCH3)CO(C6H5XPPh2), where X = O (11), S (14) and NH (15) as
obtained by UV/Vis and FTIR spectroscopy.
No Method k1 (dm3 mol
-1 s
-1)
11 UV/vis 0.0064
FTIR 0.0061
14 UV/vis 1.2517
FTIR - a
15 UV/vis 0.0417
FTIR 0.0444
a stability of complex 14 was too low for reliable FTIR measurements.
3.4.5 Conclusion
This concludes the results and discussion of the research performed by the author. All goals
as defined in Chapter 1 have been met. Chapter 4 gives all the experimental details that were
adhered to in obtaining all the research described in this chapter while Chapter 5 summarizes
compactly all the results of this study.

62
3.5 References
89
L. Pauling, J. Amer. Chem. Soc. , 1932, 54, 3570. 90
E. Fourie, J.C. Swarts, J. Organomet. Chem., 2014, 754, 80. 91
T.J. Hall, J.H. Hagis, J. Org. Chem., 1986, 51, 4185. 92
E. Erasmus, Inorg. Chim. Acta., 2011, 378, 95. 93
K.C. Kemp, E. Fourie, J. Conradie, J.C. Swarts, Organometallics., 2008, 27, 353. 94
J. Conradie, J. Swarts, Eur. J. Inorg. Chem.,. 2011, 2439. 95
J.J.C. Erasmus, J. Conradie, Electrochim. Acta., 2011,56, 9287. 96
J.G. Leipoldt, S.S. Basson, L.J. Botha, Inor. Chim. Acta., 1990, 168, 215. 97
S.S. Basson, J.G. Leipoldt, A. Roodt, J.A. Venter, T.J. van der Walt, Inorg Chim Acta, 1986, 35,119. 98
J. Conradie, G.J. Lamprecht, A. Roodt, J.C. Swarts, Polyhedron., 2007, 26, 5075. 99
P.W. Atkins, Physical Chemistry, 5th
edition, Oxford University Press, Oxford, 1994, 939.
63
4 Experimental
4.1 Introduction
This chapter provides a description of the materials, equipment, techniques and experimental
procedures giving the conditions for the synthesis of the ligands and complexes with certain
modification of known procedures. Characterisation by spectroscopic and experimental
procedures for electrochemical techniques and the kinetic study are also included.
4.2 Materials
Solid reagents (Merck, Aldrich and Fluka) employed for synthesis and liquid reagents (Merck
and Aldrich) were used without further purification unless stated otherwise. Organic solvents
were dried according to published procedures. For column chromatography silica gel 60
(Merck, grain size 0.040-0.063 mm) was used. Filtration and vacuum evaporation was
performed with the aid of a water aspirator. Melting points were determined with the aid of
an Olympus BX51 polarized microscope, fitted with a LINKAM THRM 600 heating stage
(temperatures are uncorrected).
4.3 Spectroscopic measurements
1H and
31P Nuclear magnetic resonance (NMR) spectra were measured at 298 K on a Bruker
Avance DPX 300 NMR spectrometer. All 1H (NMR) chemical shifts are reported relative to
64
TMS (Si(CH3)4) at 0.00 ppm, whereas the 31
P (NMR) relative to 85 % H3PO4 (0 ppm) as
external standards. Under these conditions, the CHCl3 1H NMR signal in CDCl3 was at 7.27
ppm, while traces of water in the CDCl3 was measured at 1.60 ppm. All spectra have been
provided in the appendix. The solid as well as the liquid phase FTIR adsorption spectra were
measured using a Bruker Tensor 27 infrared spectrophotometer fitted with a Pike MIRacle
single bounce diamond ATR crystal, running OPUS software (Version 1.1).
4.4 Electrochemistry
Cyclic voltammetry (CV) was carried out on a Princeton Applied Research PARSTAT 2273
advanced electrochemical workstation interfaced with a computer and recorded using
PowerSuite (Version 2.58). A three electrode configuration was used, which consisted of a
Pt auxiliary electrode, a glassy carbon working electrode and a platinum reference electrode.
The glassy carbon working electrode (surface area 3.14 mm2 ) was utilized after polishing on
a Buhler polishing mat first with 1 micron and then with ¼ micron diamond paste.
Measurements were conducted on ca. 0.2 mmol dm-3
solutions of the both the ligands and
complexes in acetonitrile containing 0.2 mol dm-3
[NnBu4][B(C6F5)4] as supporting
electrolyte at 25°C. Experimental potentials were measured against a platinum reference
electrode, but the results presented are referenced versus the ferrocene couple, FcH/FcH+, as
an internal standard as suggested by IUPAC.100
To achieve this, each experiment was
performed first in the absence of the ferrocene and then repeated in the presence of the
ferrocene. Data were then manipulated on a Microsoft excel worksheet to set the formal
reduction potentials of the FcH/FcH+ couple at 0V. Ferrocene exhibited a formal reduction
potential E°' = 70 mV vs platinum with a peak separation ∆E = ∆Epa - ∆Epc = 80 mV and ipc/ipa
=1.00, under these experimental conditions.
4.5 Kinetic studies
The methyl iodide oxidative addition onto the various Rhodium complexes was studied by
means of FTIR, at 25 °C in a KCl liquid cell connected to a water bath for temperature
control, while monitoring the disappearance of the Rh(I) and formation of the Rh(III)
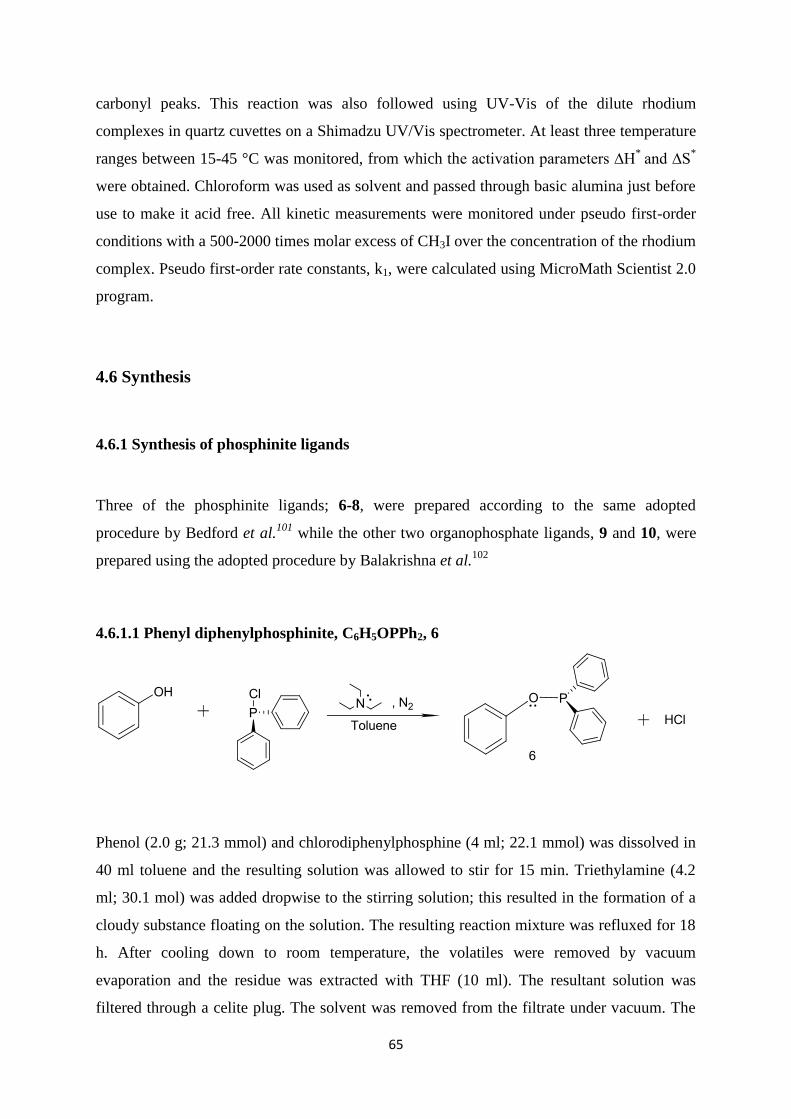
65
carbonyl peaks. This reaction was also followed using UV-Vis of the dilute rhodium
complexes in quartz cuvettes on a Shimadzu UV/Vis spectrometer. At least three temperature
ranges between 15-45 °C was monitored, from which the activation parameters ∆H*
and ∆S*
were obtained. Chloroform was used as solvent and passed through basic alumina just before
use to make it acid free. All kinetic measurements were monitored under pseudo first-order
conditions with a 500-2000 times molar excess of CH3I over the concentration of the rhodium
complex. Pseudo first-order rate constants, k1, were calculated using MicroMath Scientist 2.0
program.
4.6 Synthesis
4.6.1 Synthesis of phosphinite ligands
Three of the phosphinite ligands; 6-8, were prepared according to the same adopted
procedure by Bedford et al.101
while the other two organophosphate ligands, 9 and 10, were
prepared using the adopted procedure by Balakrishna et al.102
4.6.1.1 Phenyl diphenylphosphinite, C6H5OPPh2, 6
Phenol (2.0 g; 21.3 mmol) and chlorodiphenylphosphine (4 ml; 22.1 mmol) was dissolved in
40 ml toluene and the resulting solution was allowed to stir for 15 min. Triethylamine (4.2
ml; 30.1 mol) was added dropwise to the stirring solution; this resulted in the formation of a
cloudy substance floating on the solution. The resulting reaction mixture was refluxed for 18
h. After cooling down to room temperature, the volatiles were removed by vacuum
evaporation and the residue was extracted with THF (10 ml). The resultant solution was
filtered through a celite plug. The solvent was removed from the filtrate under vacuum. The
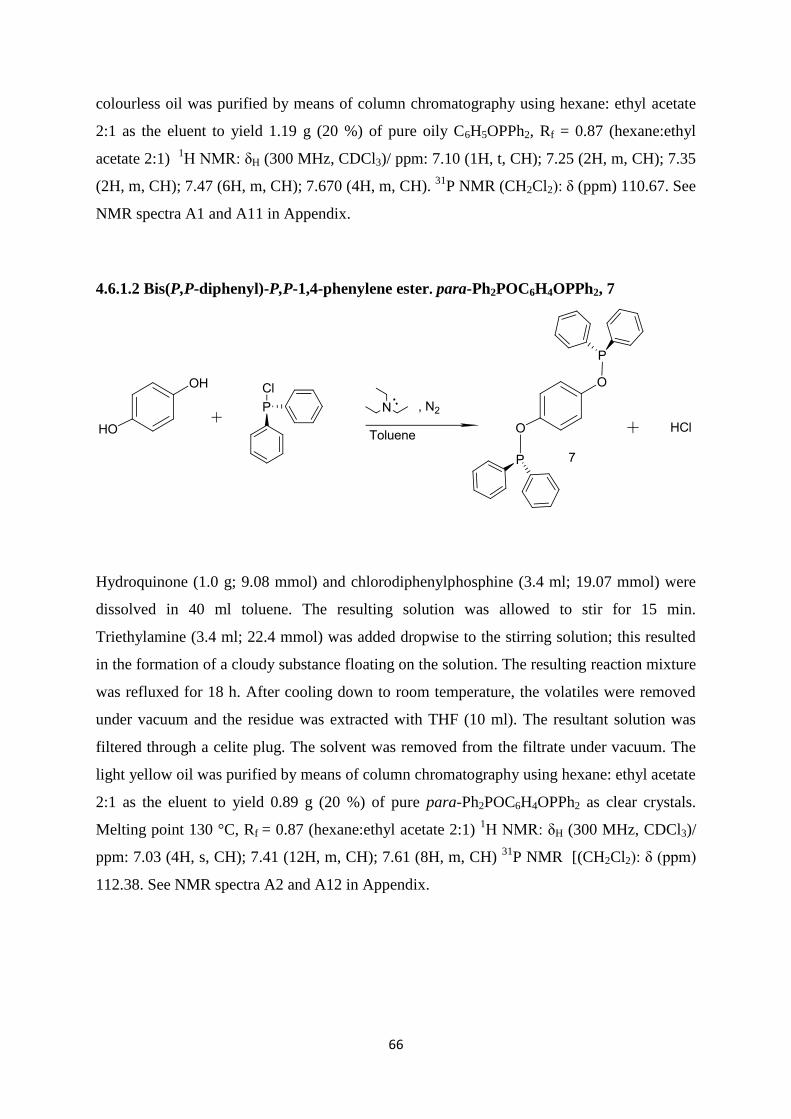
66
colourless oil was purified by means of column chromatography using hexane: ethyl acetate
2:1 as the eluent to yield 1.19 g (20 %) of pure oily C6H5OPPh2, Rf = 0.87 (hexane:ethyl
acetate 2:1) 1H NMR: δH (300 MHz, CDCl3)/ ppm: 7.10 (1H, t, CH); 7.25 (2H, m, CH); 7.35
(2H, m, CH); 7.47 (6H, m, CH); 7.670 (4H, m, CH). 31
P NMR (CH2Cl2): δ (ppm) 110.67. See
NMR spectra A1 and A11 in Appendix.
4.6.1.2 Bis(P,P-diphenyl)-P,P-1,4-phenylene ester. para-Ph2POC6H4OPPh2, 7
Hydroquinone (1.0 g; 9.08 mmol) and chlorodiphenylphosphine (3.4 ml; 19.07 mmol) were
dissolved in 40 ml toluene. The resulting solution was allowed to stir for 15 min.
Triethylamine (3.4 ml; 22.4 mmol) was added dropwise to the stirring solution; this resulted
in the formation of a cloudy substance floating on the solution. The resulting reaction mixture
was refluxed for 18 h. After cooling down to room temperature, the volatiles were removed
under vacuum and the residue was extracted with THF (10 ml). The resultant solution was
filtered through a celite plug. The solvent was removed from the filtrate under vacuum. The
light yellow oil was purified by means of column chromatography using hexane: ethyl acetate
2:1 as the eluent to yield 0.89 g (20 %) of pure para-Ph2POC6H4OPPh2 as clear crystals.
Melting point 130 °C, Rf = 0.87 (hexane:ethyl acetate 2:1) 1H NMR: δH (300 MHz, CDCl3)/
ppm: 7.03 (4H, s, CH); 7.41 (12H, m, CH); 7.61 (8H, m, CH) 31
P NMR [(CH2Cl2): δ (ppm)
112.38. See NMR spectra A2 and A12 in Appendix.
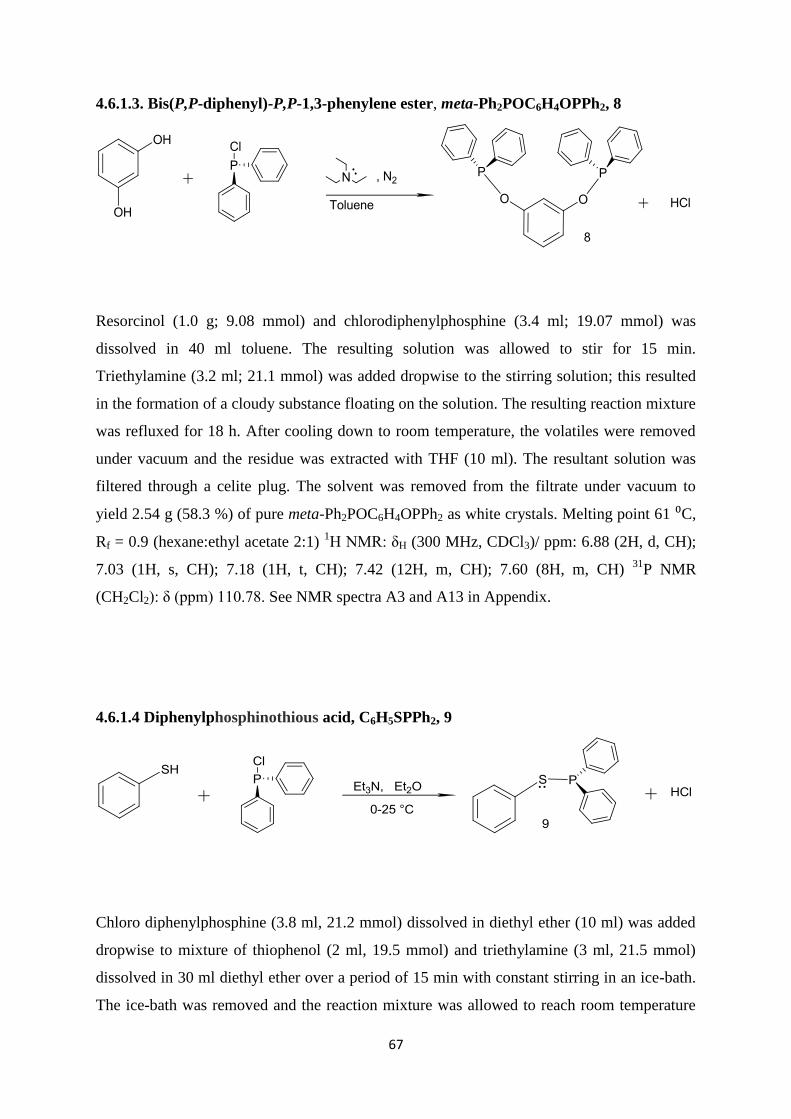
67
4.6.1.3. Bis(P,P-diphenyl)-P,P-1,3-phenylene ester, meta-Ph2POC6H4OPPh2, 8
Resorcinol (1.0 g; 9.08 mmol) and chlorodiphenylphosphine (3.4 ml; 19.07 mmol) was
dissolved in 40 ml toluene. The resulting solution was allowed to stir for 15 min.
Triethylamine (3.2 ml; 21.1 mmol) was added dropwise to the stirring solution; this resulted
in the formation of a cloudy substance floating on the solution. The resulting reaction mixture
was refluxed for 18 h. After cooling down to room temperature, the volatiles were removed
under vacuum and the residue was extracted with THF (10 ml). The resultant solution was
filtered through a celite plug. The solvent was removed from the filtrate under vacuum to
yield 2.54 g (58.3 %) of pure meta-Ph2POC6H4OPPh2 as white crystals. Melting point 61 ⁰C,
Rf = 0.9 (hexane:ethyl acetate 2:1) 1H NMR: δH (300 MHz, CDCl3)/ ppm: 6.88 (2H, d, CH);
7.03 (1H, s, CH); 7.18 (1H, t, CH); 7.42 (12H, m, CH); 7.60 (8H, m, CH) 31
P NMR
(CH2Cl2): δ (ppm) 110.78. See NMR spectra A3 and A13 in Appendix.
4.6.1.4 Diphenylphosphinothious acid, C6H5SPPh2, 9
Chloro diphenylphosphine (3.8 ml, 21.2 mmol) dissolved in diethyl ether (10 ml) was added
dropwise to mixture of thiophenol (2 ml, 19.5 mmol) and triethylamine (3 ml, 21.5 mmol)
dissolved in 30 ml diethyl ether over a period of 15 min with constant stirring in an ice-bath.
The ice-bath was removed and the reaction mixture was allowed to reach room temperature
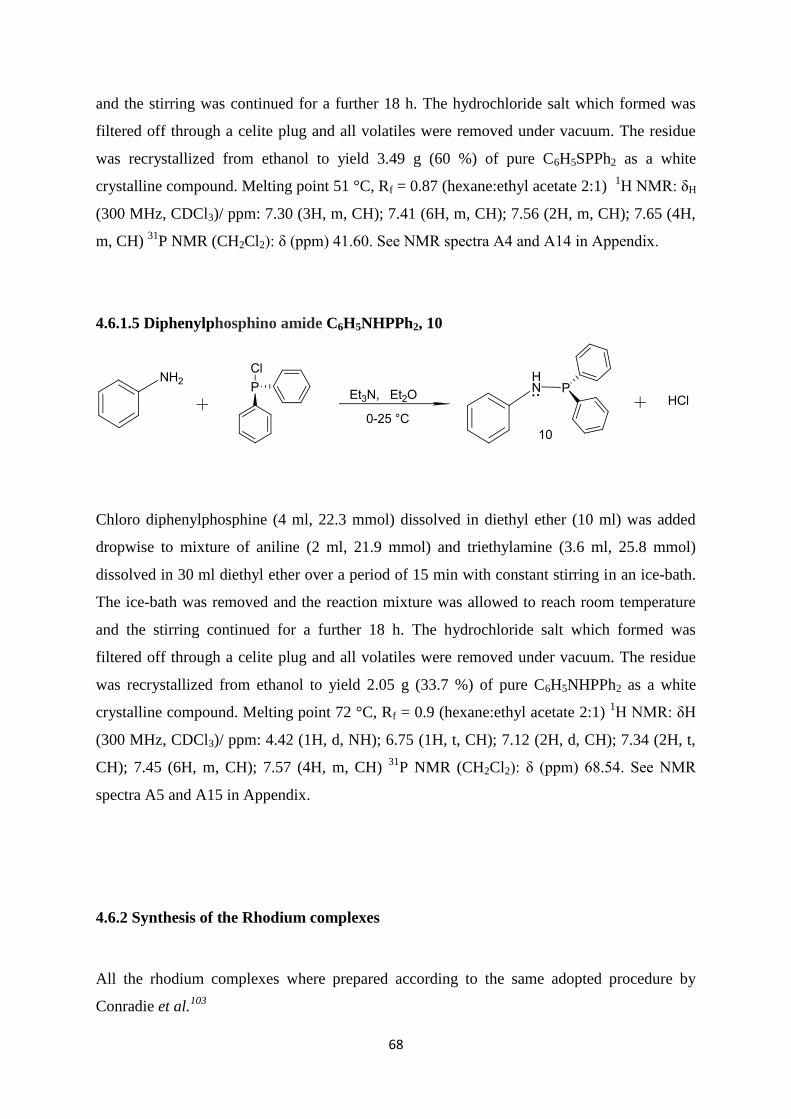
68
and the stirring was continued for a further 18 h. The hydrochloride salt which formed was
filtered off through a celite plug and all volatiles were removed under vacuum. The residue
was recrystallized from ethanol to yield 3.49 g (60 %) of pure C6H5SPPh2 as a white
crystalline compound. Melting point 51 °C, Rf = 0.87 (hexane:ethyl acetate 2:1) 1H NMR: δH
(300 MHz, CDCl3)/ ppm: 7.30 (3H, m, CH); 7.41 (6H, m, CH); 7.56 (2H, m, CH); 7.65 (4H,
m, CH) 31
P NMR (CH2Cl2): δ (ppm) 41.60. See NMR spectra A4 and A14 in Appendix.
4.6.1.5 Diphenylphosphino amide C6H5NHPPh2, 10
Chloro diphenylphosphine (4 ml, 22.3 mmol) dissolved in diethyl ether (10 ml) was added
dropwise to mixture of aniline (2 ml, 21.9 mmol) and triethylamine (3.6 ml, 25.8 mmol)
dissolved in 30 ml diethyl ether over a period of 15 min with constant stirring in an ice-bath.
The ice-bath was removed and the reaction mixture was allowed to reach room temperature
and the stirring continued for a further 18 h. The hydrochloride salt which formed was
filtered off through a celite plug and all volatiles were removed under vacuum. The residue
was recrystallized from ethanol to yield 2.05 g (33.7 %) of pure C6H5NHPPh2 as a white
crystalline compound. Melting point 72 °C, Rf = 0.9 (hexane:ethyl acetate 2:1) 1H NMR: δH
(300 MHz, CDCl3)/ ppm: 4.42 (1H, d, NH); 6.75 (1H, t, CH); 7.12 (2H, d, CH); 7.34 (2H, t,
CH); 7.45 (6H, m, CH); 7.57 (4H, m, CH) 31
P NMR (CH2Cl2): δ (ppm) 68.54. See NMR
spectra A5 and A15 in Appendix.
4.6.2 Synthesis of the Rhodium complexes
All the rhodium complexes where prepared according to the same adopted procedure by
Conradie et al.103
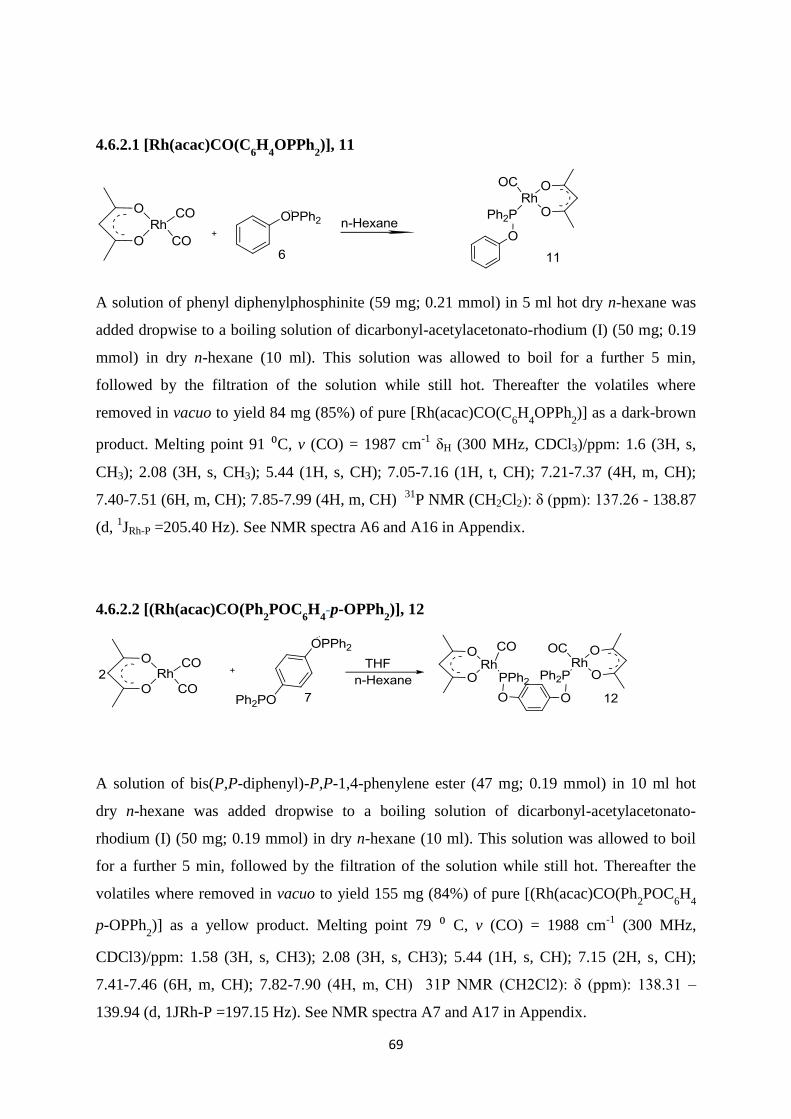
69
4.6.2.1 [Rh(acac)CO(C6H
4OPPh
2)], 11
A solution of phenyl diphenylphosphinite (59 mg; 0.21 mmol) in 5 ml hot dry n-hexane was
added dropwise to a boiling solution of dicarbonyl-acetylacetonato-rhodium (I) (50 mg; 0.19
mmol) in dry n-hexane (10 ml). This solution was allowed to boil for a further 5 min,
followed by the filtration of the solution while still hot. Thereafter the volatiles where
removed in vacuo to yield 84 mg (85%) of pure [Rh(acac)CO(C6H
4OPPh
2)] as a dark-brown
product. Melting point 91 ⁰C, v (CO) = 1987 cm-1
δH (300 MHz, CDCl3)/ppm: 1.6 (3H, s,
CH3); 2.08 (3H, s, CH3); 5.44 (1H, s, CH); 7.05-7.16 (1H, t, CH); 7.21-7.37 (4H, m, CH);
7.40-7.51 (6H, m, CH); 7.85-7.99 (4H, m, CH) 31
P NMR (CH2Cl2): δ (ppm): 137.26 - 138.87
(d, 1JRh-P =205.40 Hz). See NMR spectra A6 and A16 in Appendix.
4.6.2.2 [(Rh(acac)CO(Ph2POC
6H
4-p-OPPh
2)], 12
A solution of bis(P,P-diphenyl)-P,P-1,4-phenylene ester (47 mg; 0.19 mmol) in 10 ml hot
dry n-hexane was added dropwise to a boiling solution of dicarbonyl-acetylacetonato-
rhodium (I) (50 mg; 0.19 mmol) in dry n-hexane (10 ml). This solution was allowed to boil
for a further 5 min, followed by the filtration of the solution while still hot. Thereafter the
volatiles where removed in vacuo to yield 155 mg (84%) of pure [(Rh(acac)CO(Ph2POC
6H
4
p-OPPh2)] as a yellow product. Melting point 79 ⁰ C, v (CO) = 1988 cm
-1 (300 MHz,
CDCl3)/ppm: 1.58 (3H, s, CH3); 2.08 (3H, s, CH3); 5.44 (1H, s, CH); 7.15 (2H, s, CH);
7.41-7.46 (6H, m, CH); 7.82-7.90 (4H, m, CH) 31P NMR (CH2Cl2): δ (ppm): 138.31 –
139.94 (d, 1JRh-P =197.15 Hz). See NMR spectra A7 and A17 in Appendix.
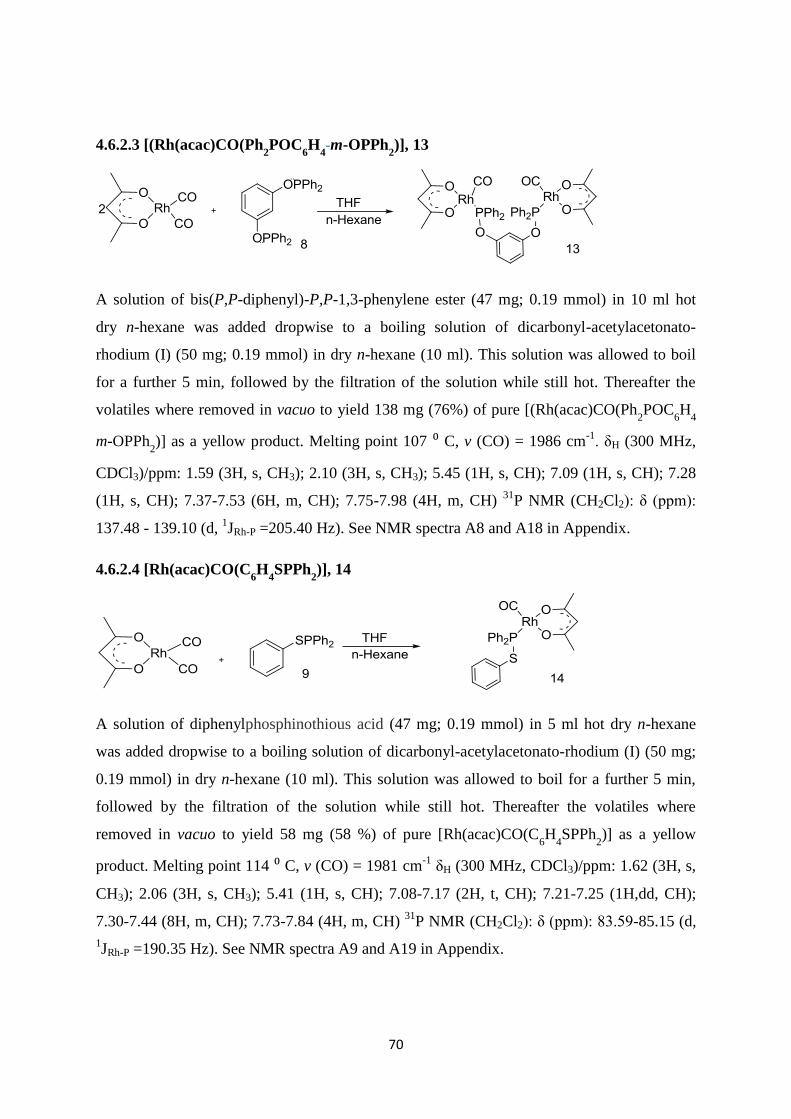
70
4.6.2.3 [(Rh(acac)CO(Ph2POC
6H
4-m-OPPh
2)], 13
A solution of bis(P,P-diphenyl)-P,P-1,3-phenylene ester (47 mg; 0.19 mmol) in 10 ml hot
dry n-hexane was added dropwise to a boiling solution of dicarbonyl-acetylacetonato-
rhodium (I) (50 mg; 0.19 mmol) in dry n-hexane (10 ml). This solution was allowed to boil
for a further 5 min, followed by the filtration of the solution while still hot. Thereafter the
volatiles where removed in vacuo to yield 138 mg (76%) of pure [(Rh(acac)CO(Ph2POC
6H
4
m-OPPh2)] as a yellow product. Melting point 107 ⁰ C, v (CO) = 1986 cm
-1. δH (300 MHz,
CDCl3)/ppm: 1.59 (3H, s, CH3); 2.10 (3H, s, CH3); 5.45 (1H, s, CH); 7.09 (1H, s, CH); 7.28
(1H, s, CH); 7.37-7.53 (6H, m, CH); 7.75-7.98 (4H, m, CH) 31
P NMR (CH2Cl2): δ (ppm):
137.48 - 139.10 (d, 1JRh-P =205.40 Hz). See NMR spectra A8 and A18 in Appendix.
4.6.2.4 [Rh(acac)CO(C6H
4SPPh
2)], 14
A solution of diphenylphosphinothious acid (47 mg; 0.19 mmol) in 5 ml hot dry n-hexane
was added dropwise to a boiling solution of dicarbonyl-acetylacetonato-rhodium (I) (50 mg;
0.19 mmol) in dry n-hexane (10 ml). This solution was allowed to boil for a further 5 min,
followed by the filtration of the solution while still hot. Thereafter the volatiles where
removed in vacuo to yield 58 mg (58 %) of pure [Rh(acac)CO(C6H
4SPPh
2)] as a yellow
product. Melting point 114 ⁰ C, v (CO) = 1981 cm-1
δH (300 MHz, CDCl3)/ppm: 1.62 (3H, s,
CH3); 2.06 (3H, s, CH3); 5.41 (1H, s, CH); 7.08-7.17 (2H, t, CH); 7.21-7.25 (1H,dd, CH);
7.30-7.44 (8H, m, CH); 7.73-7.84 (4H, m, CH) 31
P NMR (CH2Cl2): δ (ppm): 83.59-85.15 (d,
1JRh-P =190.35 Hz). See NMR spectra A9 and A19 in Appendix.
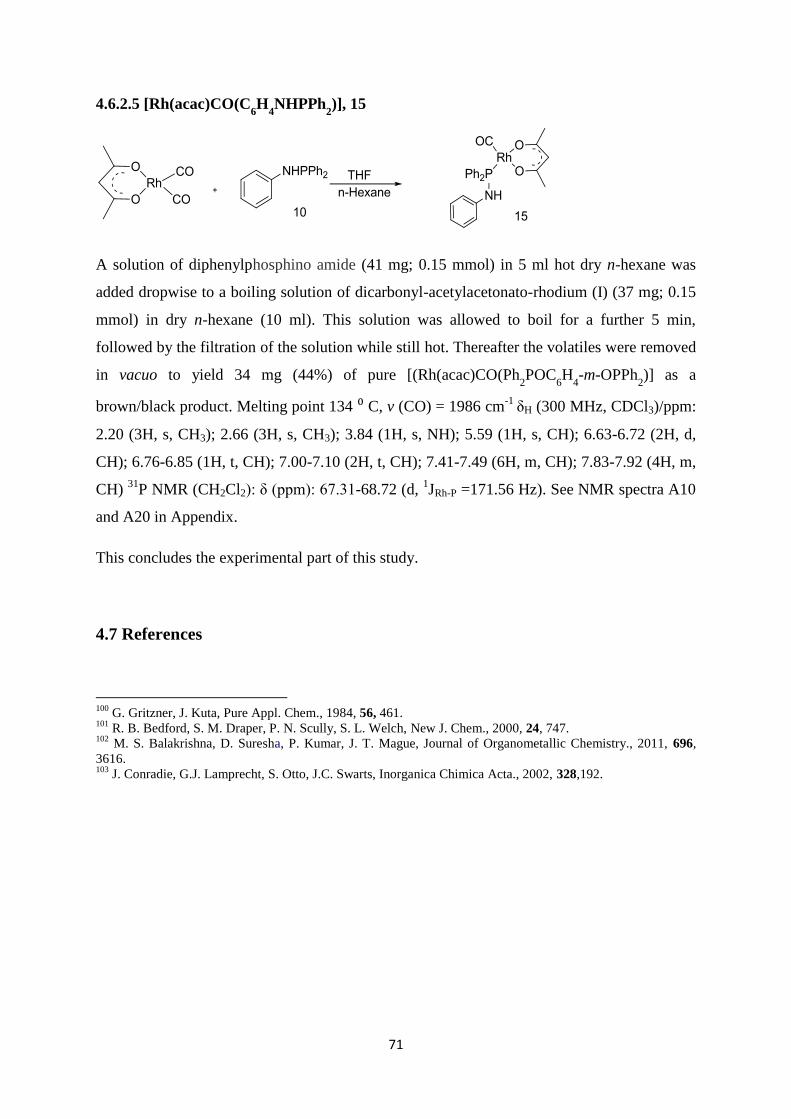
71
4.6.2.5 [Rh(acac)CO(C6H
4NHPPh
2)], 15
A solution of diphenylphosphino amide (41 mg; 0.15 mmol) in 5 ml hot dry n-hexane was
added dropwise to a boiling solution of dicarbonyl-acetylacetonato-rhodium (I) (37 mg; 0.15
mmol) in dry n-hexane (10 ml). This solution was allowed to boil for a further 5 min,
followed by the filtration of the solution while still hot. Thereafter the volatiles were removed
in vacuo to yield 34 mg (44%) of pure [(Rh(acac)CO(Ph2POC
6H
4-m-OPPh
2)] as a
brown/black product. Melting point 134 ⁰ C, v (CO) = 1986 cm-1
δH (300 MHz, CDCl3)/ppm:
2.20 (3H, s, CH3); 2.66 (3H, s, CH3); 3.84 (1H, s, NH); 5.59 (1H, s, CH); 6.63-6.72 (2H, d,
CH); 6.76-6.85 (1H, t, CH); 7.00-7.10 (2H, t, CH); 7.41-7.49 (6H, m, CH); 7.83-7.92 (4H, m,
CH) 31
P NMR (CH2Cl2): δ (ppm): 67.31-68.72 (d, 1JRh-P =171.56 Hz). See NMR spectra A10
and A20 in Appendix.
This concludes the experimental part of this study.
4.7 References
100
G. Gritzner, J. Kuta, Pure Appl. Chem., 1984, 56, 461. 101
R. B. Bedford, S. M. Draper, P. N. Scully, S. L. Welch, New J. Chem., 2000, 24, 747. 102
M. S. Balakrishna, D. Suresha, P. Kumar, J. T. Mague, Journal of Organometallic Chemistry., 2011, 696,
3616. 103
J. Conradie, G.J. Lamprecht, S. Otto, J.C. Swarts, Inorganica Chimica Acta., 2002, 328,192.
72
5 Summary and Future Perspectives
5.1. Summary
In this study, different organophosphorus ligands were synthesised, which included the
phosphinites of the type, C6H5OPPh2, meta- and para-Ph2POC6H4OPPh2, as well as other
heteroatomic organophosphorus ligands of the type C6H5XPPh2, where X = S and NH by
means of a base catalysed reaction between chlorophenylphosphine and the desired
phenyl substituent. An attempt was made to prepare ortho-Ph2POC6H4OPPh2, however
this was unsuccessful. The carbonyl(acetyl acetonato)organophopshorus rhodium(I)
compounds, [Rh(acac)CO(C6H
4XPPh
2)] where X = O, S and NH, as well as
[(Rh(acac)CO(Ph2POC
6H
4-m-OPPh
2)] and [(Rh(acac)CO(Ph
2POC
6H
4-p-OPPh
2)], were
prepared by the reaction between [Rh(acac)(CO)2] and the prepared phosphorus ligands.
The kinetics of the oxidative addition of methyl iodide to the rhodium(I) complexes of the
type, [Rh(acac)CO(C6H
4XPPh
2)] where X = O, S and NH, were explored by means of
UV/Vis and FTIR studies. The reaction scheme was found to exhibit only one stage,
which is the oxidative addition, within the time frame of the reactions measured in this
study. No carbonyl insertion to form the acyl species was observed and no other alkyl
species was observed either. The reaction followed the first order rate law:
R = k1[CH3I]
73
with a first order dependence on the concentration of the methyl iodide. The activation
parameters ΔH* and ΔS* were determined. The entropy of the reaction for the rhodium
complexes, Rh(acac)CO(C6H
4XPPh
2)] where X = O, S and NH were ΔS* = -60, -118 and
-108 kJ mol-1
K-1
respectively. This is a strong indication that the reaction takes place
according to an associative mechanism. Comparison of the first order rate constants of the
different rhodium complexes with the Pauling electronegativity of O, S and N, showed
that there is an exponential increase in rate constant as the Pauling group electronegativity
decreases.
A good correlation has been obtained for the kinetic rate constants of the oxidative
addition of methyl iodide onto the Rh(I) center of
Rh(H3CCOCHCOCH3)CO(C6H5XPPh2), where X = O, S and NH as determined from the
data obtained by UV/Vis and FTIR spectroscopy.
An electrochemical study in the form of cyclic voltammetry was conducted on all the
synthesised organophosphorus ligands, C6H5XPPh2 where X = O and NH, meta- and
para-Ph2POC6H4OPPh2, as well as their associated rhodium complexes,
[Rh(acac)CO(C6H
4XPPh
2)] where X = O, S and NH, [(Rh(acac)CO(Ph
2POC
6H
4-m-
OPPh2)] and [(Rh(acac)CO(Ph
2POC
6H
4-p-OPPh
2)]. The redox activity of
organophosphorus ligands was found to be chemically and electrochemically irreversible
and showed one oxidation and one reduction peak. The oxidation peak was allocated to
the one-electron oxidation of the free electron-pair on the phosphorous moiety, while the
reduction peak is assigned to the reduction of the radical cation back to the neutral form.
There are two oxidation peaks, one for the rhodium metal center the other for the
phosphorus moiety. The first peak is for the rhodium and the second belongs to the
phosphorus. The rhodium peak O1 for all the complexes is in the region of 400-530 mV
and for the phosphorus, O2, in the region of the 700-1200 mV. Both these peaks are
electrochemically and chemically irreversible.
74
5.2. Future perspectives
Future studies in the field could concern synthesising other related organophosphorus
ligands of the types PPh(XPh)2, P(XPh)3, where X = O, S or NH as well as their
associated Rhodium complexes, [Rh(acac)CO(PPh(XPh)2)] and [Rh(acac)CO(P(XPh)3)]
where X = O, S or NH. Additional synthetic studies could even include substituting the
phenyl ring with other cyclic groups like cyclohexene (ch), biphenyl (bipy), naphthalene
(nap) to produce PR2(XR), PR(XR)2 or P(XR)3, where X = O, S or NH and R = ch, bipy
or nap.
Since it is known that phosphite ligands has the ability to coordinate two ligands to the
rhodium center, it would be interesting to find the binding modes of rhodium complexes
prepared from the above mentioned organophosporus ligands.
The testing of these compounds for oxidative addition of methyl iodide should also be
investigated to find whether they can undergo the next step of the Monsanto process, the
carbonyl insertion to produce the rhodium(III)-acyl species.
Many Rh-β-diketonato complexes exhibit anti-neoplastic properties; the next step would
be to study their anti-tumor activity.
--oo--oOo--oo--
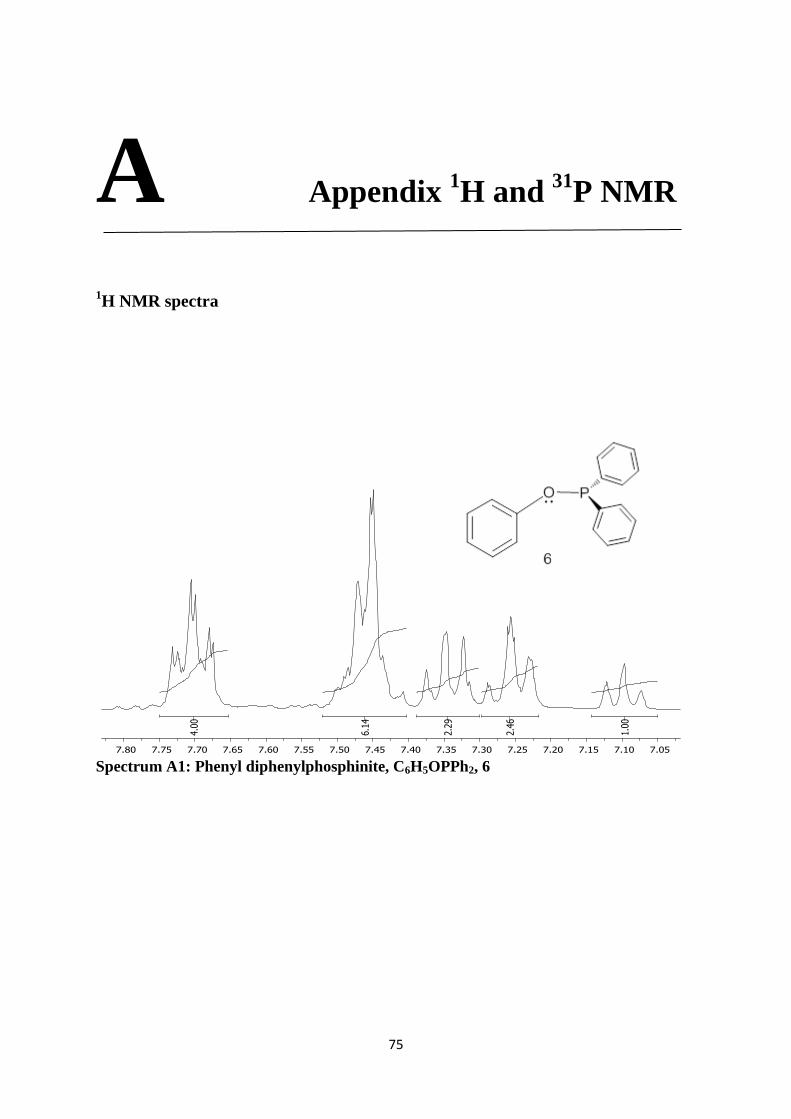
75
A Appendix 1H and
31P NMR
1H NMR spectra
Spectrum A1: Phenyl diphenylphosphinite, C6H5OPPh2, 6
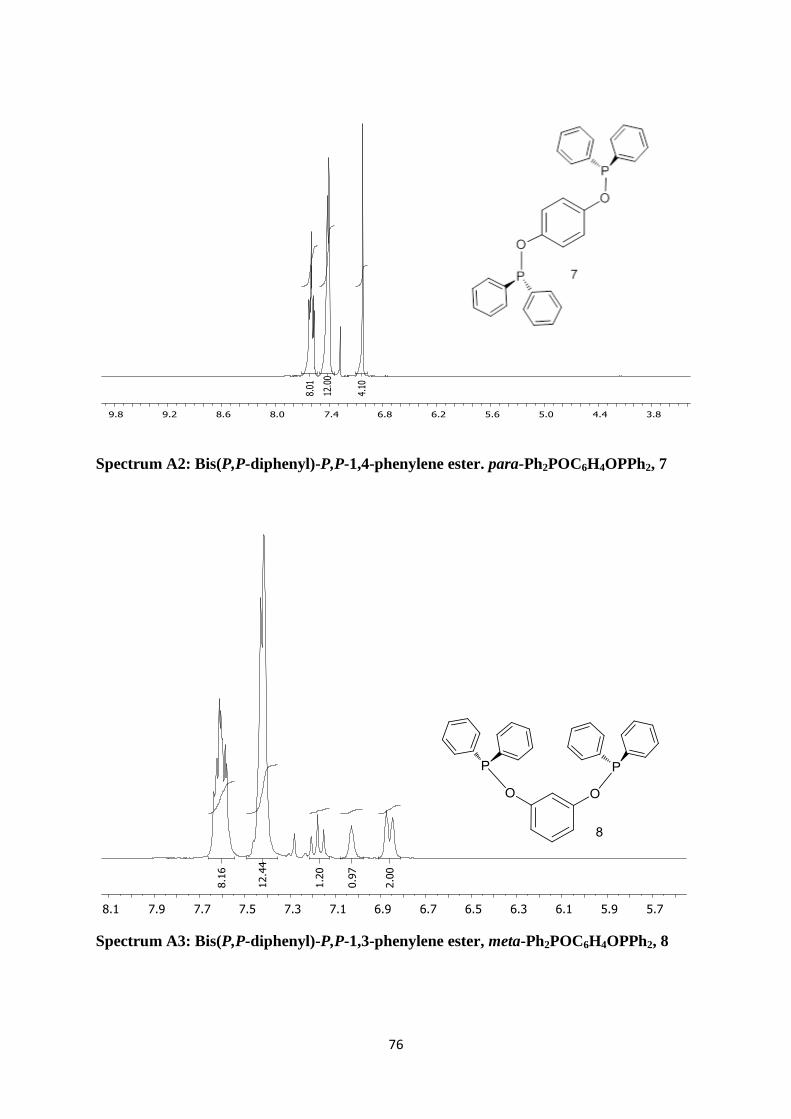
76
Spectrum A2: Bis(P,P-diphenyl)-P,P-1,4-phenylene ester. para-Ph2POC6H4OPPh2, 7
Spectrum A3: Bis(P,P-diphenyl)-P,P-1,3-phenylene ester, meta-Ph2POC6H4OPPh2, 8
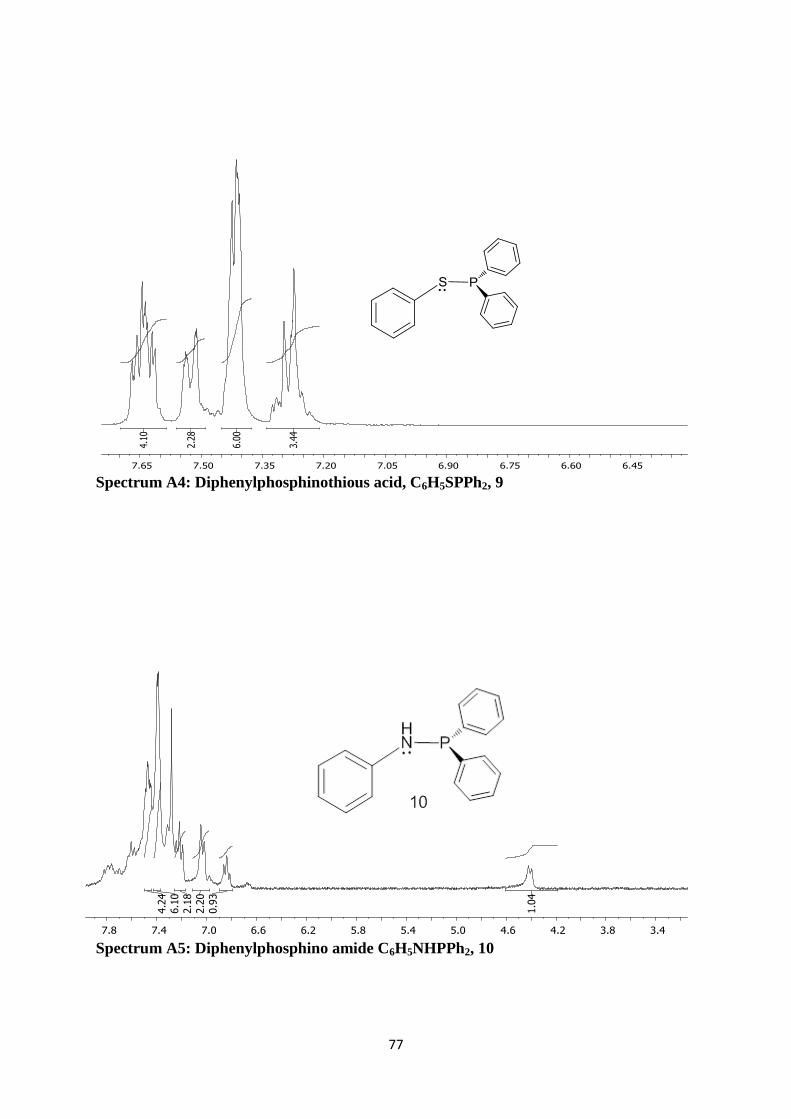
77
Spectrum A4: Diphenylphosphinothious acid, C6H5SPPh2, 9
Spectrum A5: Diphenylphosphino amide C6H5NHPPh2, 10
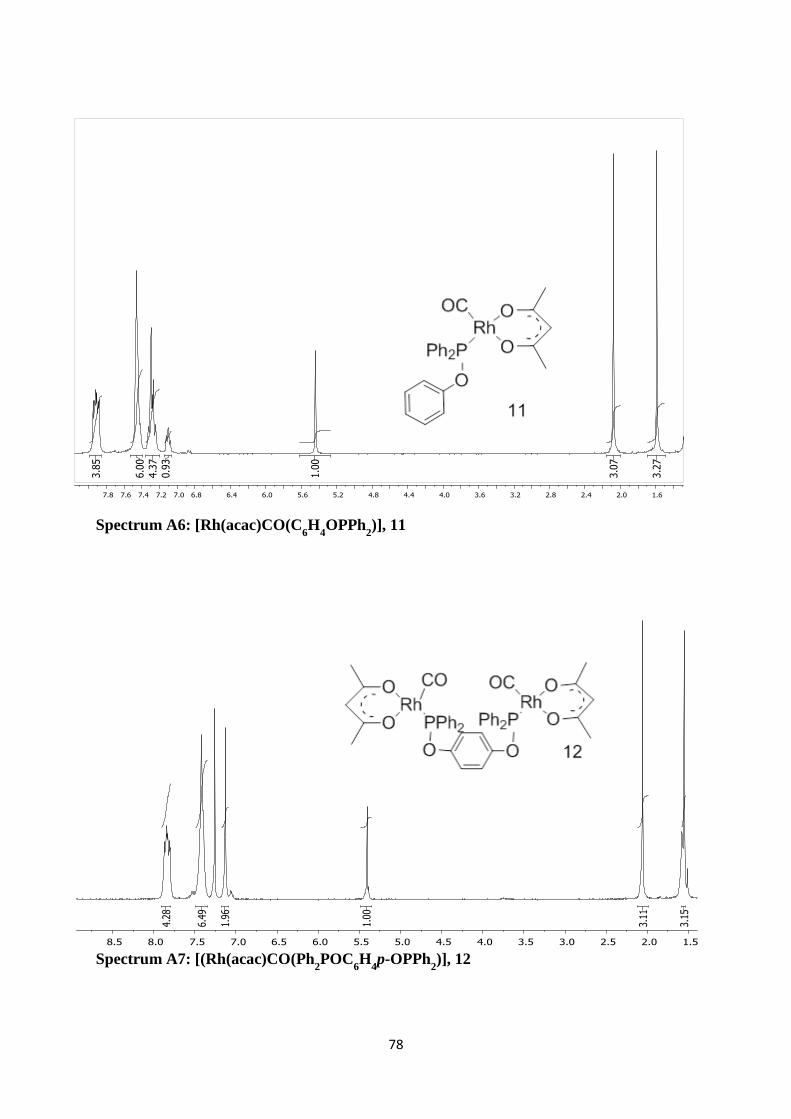
78
Spectrum A6: [Rh(acac)CO(C6H
4OPPh
2)], 11
Spectrum A7: [(Rh(acac)CO(Ph2POC
6H
4p-OPPh
2)], 12
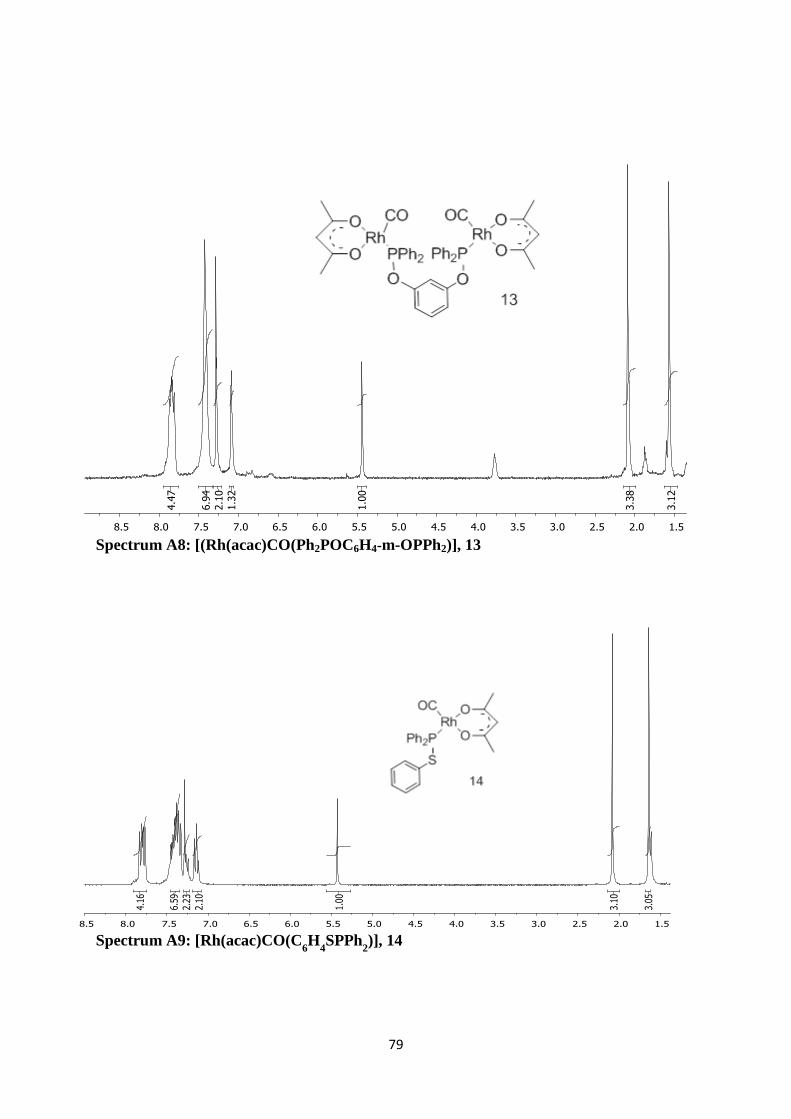
79
Spectrum A8: [(Rh(acac)CO(Ph2POC6H4-m-OPPh2)], 13
Spectrum A9: [Rh(acac)CO(C6H
4SPPh
2)], 14
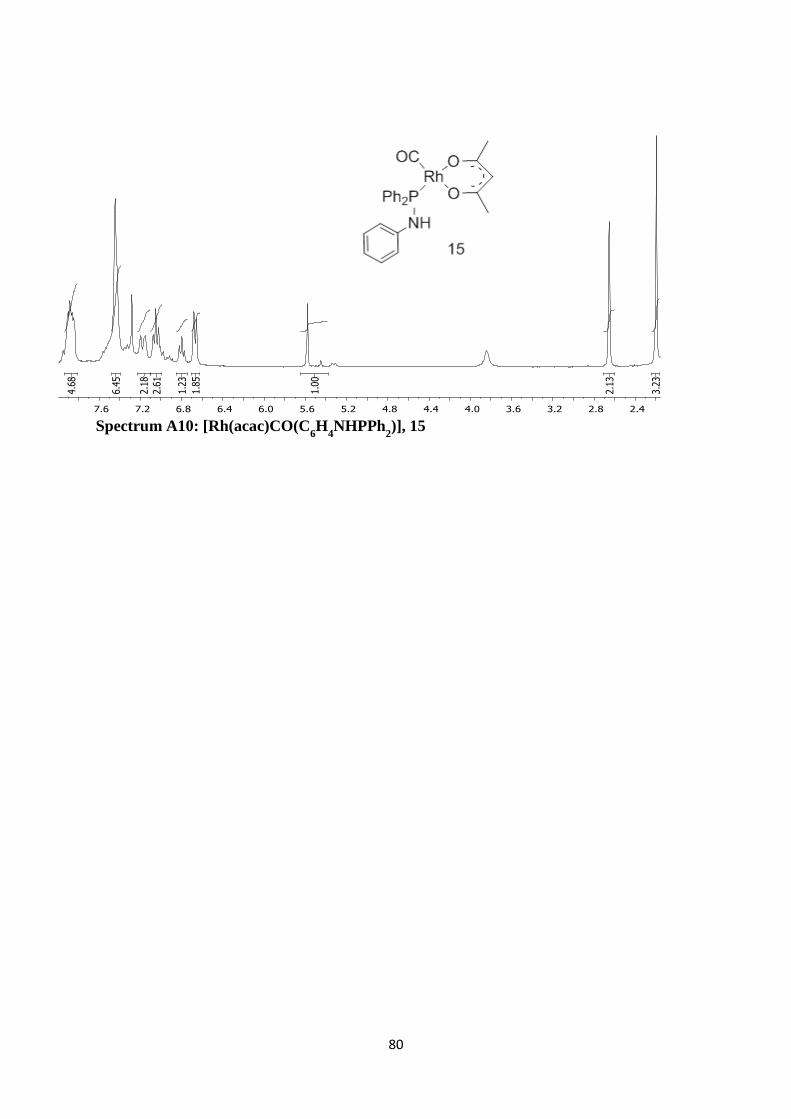
80
Spectrum A10: [Rh(acac)CO(C6H
4NHPPh
2)], 15
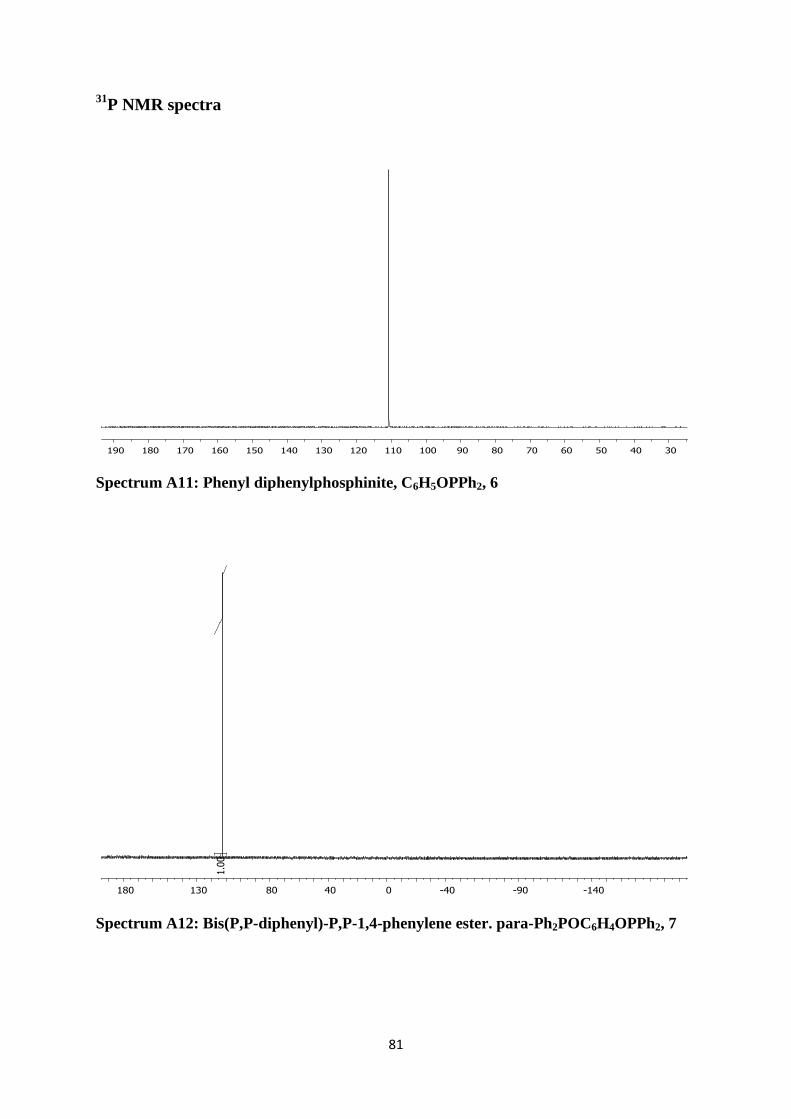
81
31P NMR spectra
Spectrum A11: Phenyl diphenylphosphinite, C6H5OPPh2, 6
Spectrum A12: Bis(P,P-diphenyl)-P,P-1,4-phenylene ester. para-Ph2POC6H4OPPh2, 7
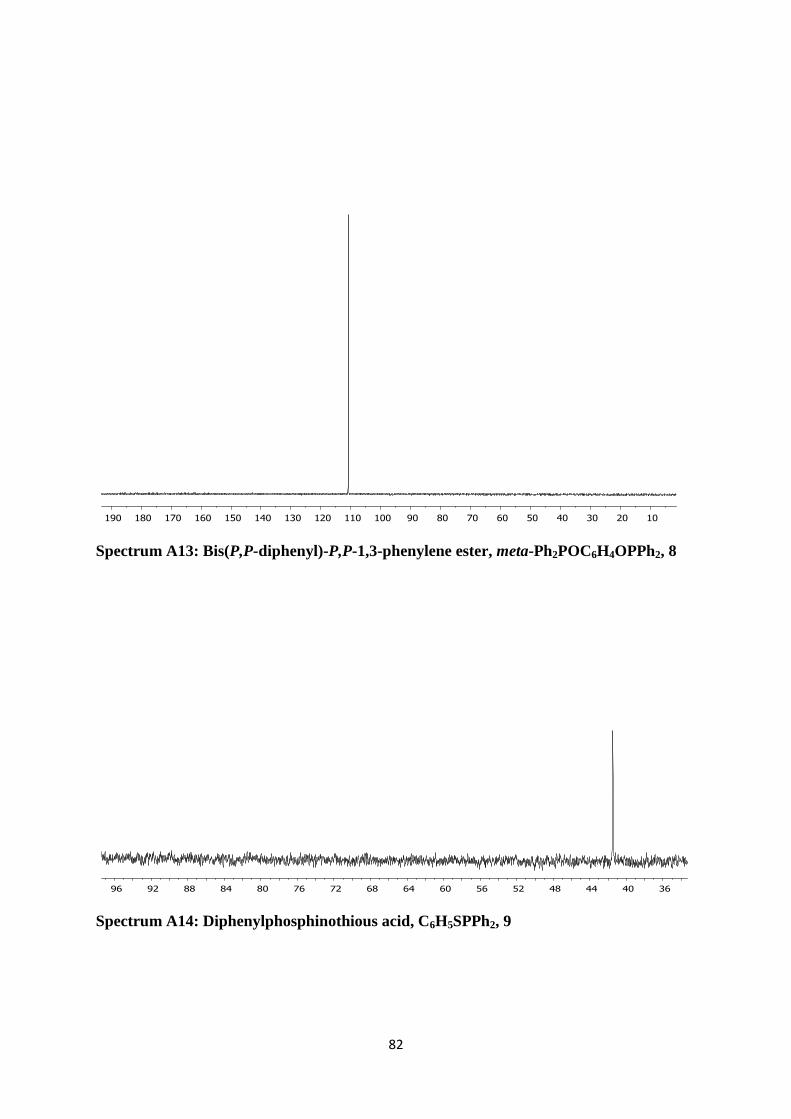
82
Spectrum A13: Bis(P,P-diphenyl)-P,P-1,3-phenylene ester, meta-Ph2POC6H4OPPh2, 8
Spectrum A14: Diphenylphosphinothious acid, C6H5SPPh2, 9
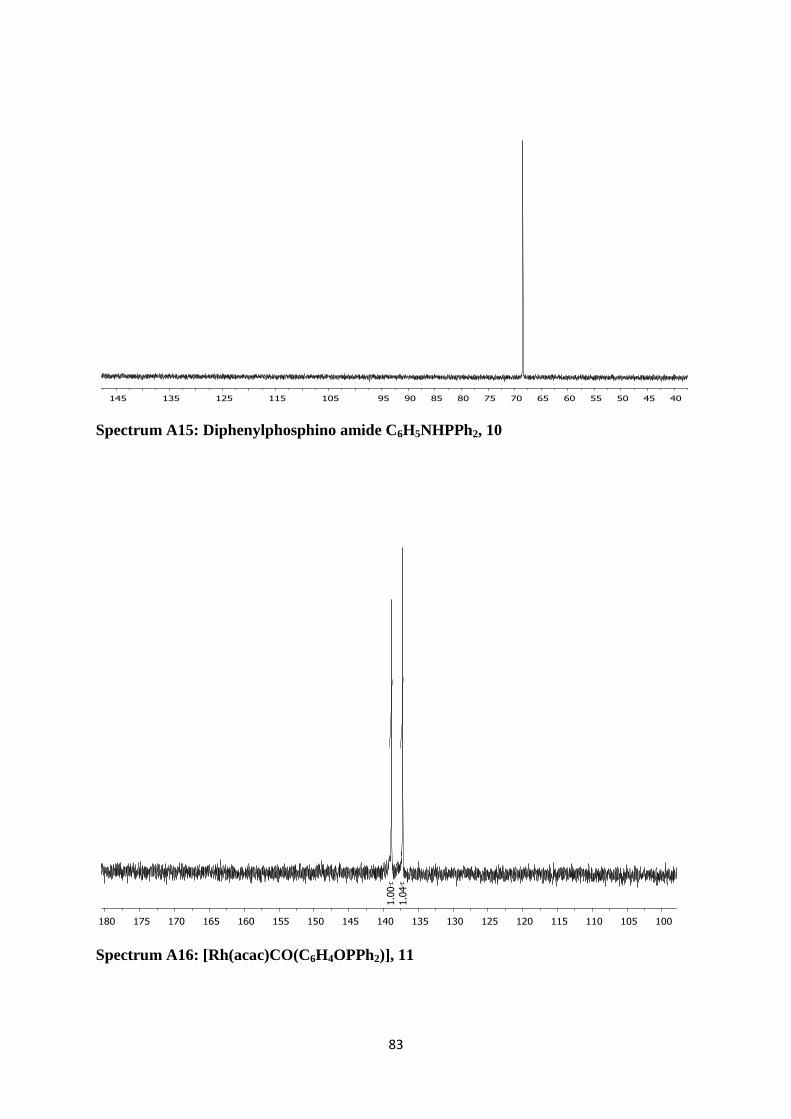
83
Spectrum A15: Diphenylphosphino amide C6H5NHPPh2, 10
Spectrum A16: [Rh(acac)CO(C6H4OPPh2)], 11
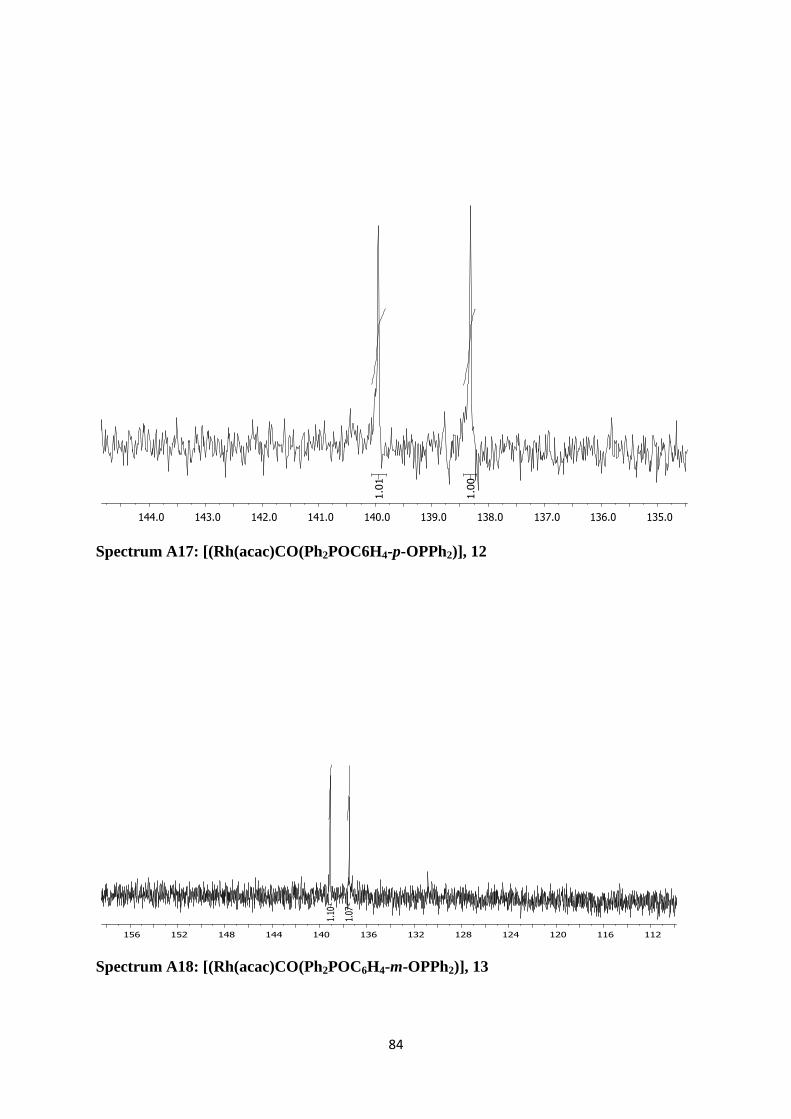
84
Spectrum A17: [(Rh(acac)CO(Ph2POC6H4-p-OPPh2)], 12
Spectrum A18: [(Rh(acac)CO(Ph2POC6H4-m-OPPh2)], 13
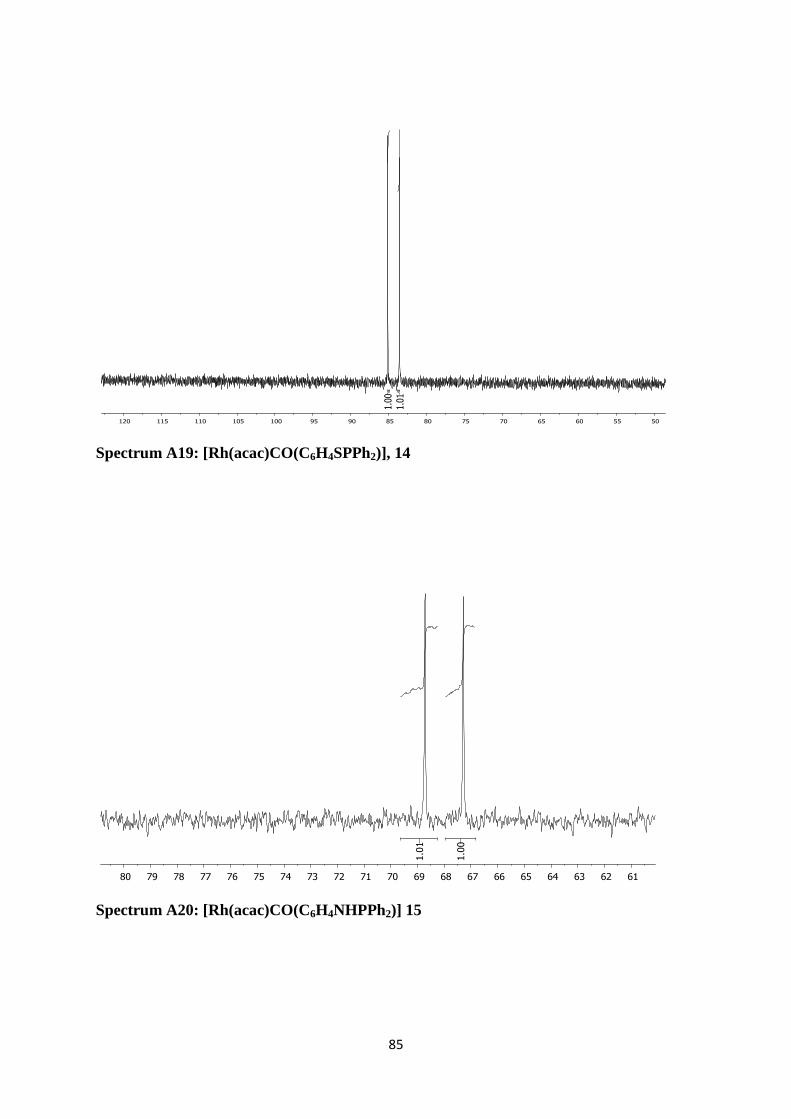
85
Spectrum A19: [Rh(acac)CO(C6H4SPPh2)], 14
Spectrum A20: [Rh(acac)CO(C6H4NHPPh2)] 15
86
Abstract
Organophosphorus ligands of the type, C6H5XPPh2, where X = O, S and NH, meta- and para-
Ph2POC6H4OPPh2, were synthesised by the reaction between chlorophenylphosphine and the desired
phenyl substituent in the presence of a base. The rhodium(I) complexess, [Rh(acac)CO(C6H
4XPPh
2)]
where X = O, S and NH, as well as [(Rh(acac)CO(Ph2POC
6H
4-m-OPPh
2)] and
[(Rh(acac)CO(Ph2POC
6H
4-p-OPPh
2)], were obtained by treating [Rh(acac)(CO)
2] with the
appropriate organophosphorus ligands.
Kinetic results for the oxidative addition of methyl iodide to the rhodium(I) complexes of the type,
[Rh(acac)CO(C6H
4XPPh
2)] where X = O, S and NH, revealed that the reaction exhibited only the
oxidative addition. The reaction was found to be first order dependent on the concentration of the
methyl iodide. The large negative activation entropy vales that were obtained, suggested an
associative mechanism and no observable solvent pathway was found. It was found that as the Pauling
electronegativity of O, S and N, increased, the first order rate constant of the oxidative addition
decreased.
The cyclic voltammetry of the organophosphorus ligands, C6H5XPPh2 where X = S and NH, meta-
and para-Ph2POC6H4OPPh2, was found to be chemically and electrochemically irreversible. Only one
oxidation and one reduction peak was observed and the oxidation peak was assigned to the one-
electron oxidation of the free electron-pair on the phosphorous moiety, while the reduction peak was
assigned to the reduction of the radical cation back to the neutral form.
The rhodium complexes to which the phosphorus ligand was bound, showed two oxidation peaks of
which the first one, O1, was assigned to the rhodium metal center and the second, O2, to the
phosphorus moiety. Similar to the ligands system, the rhodium complex system is both chemically
and electrochemically irreversible. The reduction peaks (R1) and (R2) assigned reduction of the
Rh(III) back to Rh(I) in a two electron process and the second reduction peak (R2), which is the
reduction of the radical cation of the organophosphorus ligand back to the neutral form (with the free
electron-pair on the phosphorous moiety), respectively.
Keywords: Rhodium(I), phosphinites, oxidative addition, electrochemistry, organophosphorus
ligands.
87
Opsomming
Organofosfaat ligande van die vorm, C6H5XPPh2, waar X = O, S en NH, meta- en para-
Ph2POC6H4OPPh2 is gesintetiseer deur die reaksie tussen chlorofenielfosfien en die gewenste feniel
substituent in die teenwoordigheid van 'n basis. Die rodium (I) komplekse,
[Rh(acac)CO(C6H4XPPh2)] waar X = O, S en NH, sowel as [(Rh(acac)CO(Ph2POC6H4-m-OPPh2)] en
[(Rh(acac)CO(Ph2POC6H4-p-OPPh2)], is verkry deur die behandeling van [Rh(acac)(CO)2] met die
toepaslike organofosfaat ligande.
Kinetika resultate vir die oksidatiewe addisie van metiel jodied aan die rodium (I) komplekse van die
formaat, [Rh(acac)CO(C6H4XPPh2)] waar X = O, S en NH, het aan die lig gebring dat die reaksie
slegs oksidatiewe addisie ondergaan het. Daar is gevind dat die reaksie eerste orde afhanklikheid toon
van die konsentrasie van die metiel jodied. Die groot negatiewe aktiverings entropie wat verkry is, stel
'n assosiatiewe meganisme voor en geen waarneembare oplosmiddel pad is gevind nie. Daar is gevind
dat soos die Pauling elektronegatiwiteit van O, S en N, toegeneem het, die eerste orde tempo
konstante van die oksidatiewe addisie afneem.
Die sikliese voltammetrie van die organofosfaat ligande, C6H5XPPh2 waar X = S en NH, meta- en
para-Ph2POC6H4OPPh2, toon aan dat hulle chemiese en elektrochemiese onomkeerbare
redolsprosesse ondergaan. Slegs een oksidasie en een reduksie piek is waargeneem. Die oksidasie
piek is aan die een-elektron oksidasie van die vrye elektron-paar op die fosfor groep toegeken, terwyl
die reduksie piek aan die reduksie van die gesolveerde ontbinde radikaalkatioon toegeken kan word.
In die geval van die rodium komplekse is twee oksidasie pieke waargeneem waarvan die eerste een,
O1, toegeskryf word aan die rodium metaal sentrum en die tweede, O2, aan die fosfor eenheid.
Soortgelyk aan die ligande, was redolsprosesse van die rodium komplekse beide chemies en
elektrochemies onomkeerbaar. Die reduksie piek R1 is toegeken aan die reduksie van „n Rh(III)
spesie terug na Rh (I) in 'n twee-elektron oordrag proses en die tweede reduksie piek (R2) is die
reduksie van die metal-gestabiliseerde radikaalkatioon van die organofosfaat ligand terug na die
neutrale vorm (met die vrye elektron - paar op die fosfor eenheid), onderskeidelik.
Sleutelwoorde: Rodium (I), phosfinite, oksidatiewe addisie, elektrochemie, organofosfaat

88
I, Pholani Sakhile Manana, declare that the dissertation hereby submitted by me for the
Magister Scientiae degree at the University of the Free State is my own independent work
and has not previously been submitted by me at another university/facility. I therefore cede
copyright of the dissertation in favour of the University of the Free State.
Signed Date