Active transport in membrane vesicles from Escherichia coli: the electrochemical proton gradient...
11
5692 Biochemistry 1980, 19, 5692-5702 Rosen, D., Okamura, M. Y., & Feher, G. (1979) Biophys. J. 25, 204a. Steinemann, A., & Lauger, P. (1971) J. Membr. Biol. 4, 74-86. Steiner, L. A., Okamura, 34. Y., Lopes, A. D., Moskowitz, E., & Feher, G. (1974) Biochemistry 13, 1403-1410. Straley, S. C., Parson, W. W., Mauzerall, D. C., & Clayton, Tanford, C. (1961) Physical Chemistry of MacromolecuIes, Van Holde, K. E. (1971) Physical Biochemistry, Chapter 3, R. K. (1973) Biochim. Biophys. Acta 305, 597. Chapter 14, Wiley, New York. Prentice-Hall, New York. Active Transport in Membrane Vesicles from Escherichia coli: The Electrochemical Proton Gradient Alters the Distribution of the lac Carrier between Two Different Kinetic States? Dan E. Robertson,' Gregory J. Kaczorowski,§ Maria-Luisa Garcia,li and H. Ronald Kaback* ABSTRACT: These studies document the effects of the proton electrochemical gradient (ApH+, interior negative and alkaline) on the kinetics of various transport systems in right-side-out membrane vesicles from Escherichia coli, with particular emphasis on the @-galactoside transport system. Under com- pletely deenergized conditions (Le., facilitated diffusion), the @-galactosidetransport system exhibits a high apparent K, for either lactose or @-D-galactopyranosyl I-thio-@-D- galactopyranoside, and generation of ApH+ via the respiratory chain results in at least a 100-fold decrease in the apparent K,. Furthermore, a low apparent K, is observed when the membrane potential (A*) or the pH gradient (SpH) is dis- sipated selectively with an appropriate ionophore and when either A* or ApH is imposed artifically across the membrane. Thus, either component of ApH+ is able to elicit the low ap- parent K, characteristic of the energized system. A detailed series of kinetic experiments is presented in which initial rates of lactose transport were studied as a function of lactose concentration under conditions where ApH and/or A* were varied systematically at pH 5.5 and 7.5. Surprisingly, the results demonstrate that the apparent K, remains constant from about -180 to -30 mV, while the maximum velocity of transport varies to the second power with either component of SpH+ at both pHs, even though the maximum velocity is about IO-fold higher at pH 7.5 over a comparable range of ApH+ values. Since a high apparent K, is observed under completely deenergized conditions, the findings appear to be paradoxical; however, studies carried out over an extended range of lactose concentrations demonstrate that when ApH+ is dissipated partially the system exhibits biphasic kinetics. M e m b r a n e vesicles prepared from Escherichia coli are essentially devoid of cytoplasmic constituents and retain the same polarity and configuration as the membrane in the intact cell (Kaback, 1971, 1974a; Owen & Kaback, 1978, 1979a,b). Furthermore, in addition to catalyzing the vectorial phos- phorylation of certain sugars via the phosphoenolpyruvate- t From the Laboratory of Membrane Biochemistry, Roche Institute of Molecular Biology, Nutley, New Jersey 07110. Receiced June 2, 1980. 'Present address: Department of Pathology and Laboratory Medicine. Hahnemann Medical College and Hospital, Philadelphia, PA 19104. Department of Biochemistry, Merck Sharp & Dohme, Rahway, NJ 07065. Fellow of the Helen Hay Whitney Foun- dat,ion. Present address: 1 Fellow of the Spanish Research Council. 0006-2960/80/0419-5692$0 1 .OO/O One component of the overall process exhibits the kinetic parameters typical of ApH+-driven active transport, and the other has the characteristics of facilitated diffusion. It is apparent, therefore, that in addition to acting thermodynam- ically as the driving force for active transport, ApH+ alters the distribution of the lac carrier between two different kinetic states. The implications of this phenomenon and possible explanations are discussed. Although studied in less detail, six different amino acid transport systems respond kinetically to ApH+ and its components in a manner similar to that de- scribed for the P-galactoside transport system. Selective dissipation of either A\k or ApH at pH 5.5 causes a decrease in maximum velocity with little or no change in apparent K,, and the apparent K, values are not altered significantly when the ambient pH is increased to 7.5. Finally, the effects of ApH+ and its components on the kinetics of the lactate and succinate transport systems were studied. At pH 5.5, nigericin abolishes D-lactate transport, and valinomycin causes a 2-fold increase in maximum velocity, demonstrating complete reliance of this system on ApH. In contrast, valinomycin causes a 30% in- crease in the maximum velocity of succinate transport at pH 5.5, but nigericin inhibits by only ~WO, indicating that although this transport system is biased kinetically toward ApH, A* plays a significant energetic role. There is no significant change in apparent K, with either transport system under the conditions described at pH 5.5, but each system exhibits sig- nificant increases in both apparent K, and maximum velocity at pH 7.5, suggesting that there may be a change in the overall transport mechanisms at higher pH (Le., an increase in pro- ton/substrate stoichiometry). phosphotransferase system (Kaback, 1970), these vesicles catalyze the active transport of many solutes by a respira- tion-dependent mechanism in which chemiosmotic forces play a central, obligatory role (Kaback, 1976; Harold, 1976; Ramos et al., 1976; Ramos & Kaback, 1977a-c; Tokuda & Kaback, 1977; Boonstra & Konings, 1977; Reenstra et al., 1980). Thus, as postulated by Mitchell (1961, 1966, 1968, 1973, 1979), energy released by oxidation of certain electron donors in this experimental system leads to the generation of a proton electrochemical gradient (ApH+)' that is composed of two ' Abbreviations used: ApH+, the electrochemical gradient of protons; A*, the membrane potential; ApH, the chemical gradient of hydrogen ion; CCCP, carbonyl cyanide m-chlorophenylhydrazone; TDG, P-D- galactopyranosyl 1-thio-(3-D-galactopyranoside; TPP', tetraphenyl- phosphonium. 0 1980 American Chemical Society
-
Upload
independent -
Category
Documents
-
view
3 -
download
0
Transcript of Active transport in membrane vesicles from Escherichia coli: the electrochemical proton gradient...
5692 Biochemistry 1980, 19, 5692-5702
Rosen, D., Okamura, M. Y . , & Feher, G. (1979) Biophys. J. 25, 204a.
Steinemann, A., & Lauger, P. (1971) J . Membr. Biol. 4 , 74-86.
Steiner, L. A., Okamura, 34. Y., Lopes, A. D., Moskowitz, E., & Feher, G. (1974) Biochemistry 13, 1403-1410.
Straley, S. C., Parson, W. W., Mauzerall, D. C., & Clayton,
Tanford, C. (1961) Physical Chemistry of MacromolecuIes,
Van Holde, K. E. (1971) Physical Biochemistry, Chapter 3,
R . K. (1973) Biochim. Biophys. Acta 305, 597.
Chapter 14, Wiley, New York.
Prentice-Hall, New York.
Active Transport in Membrane Vesicles from Escherichia coli: The Electrochemical Proton Gradient Alters the Distribution of the lac Carrier between Two Different Kinetic States? Dan E. Robertson,' Gregory J. Kaczorowski,§ Maria-Luisa Garcia,li and H . Ronald Kaback*
ABSTRACT: These studies document the effects of the proton electrochemical gradient (ApH+, interior negative and alkaline) on the kinetics of various transport systems in right-side-out membrane vesicles from Escherichia coli, with particular emphasis on the @-galactoside transport system. Under com- pletely deenergized conditions (Le., facilitated diffusion), the @-galactoside transport system exhibits a high apparent K, for either lactose or @-D-galactopyranosyl I-thio-@-D- galactopyranoside, and generation of ApH+ via the respiratory chain results in at least a 100-fold decrease in the apparent K,. Furthermore, a low apparent K, is observed when the membrane potential (A*) or the pH gradient (SpH) is dis- sipated selectively with an appropriate ionophore and when either A* or ApH is imposed artifically across the membrane. Thus, either component of ApH+ is able to elicit the low ap- parent K, characteristic of the energized system. A detailed series of kinetic experiments is presented in which initial rates of lactose transport were studied as a function of lactose concentration under conditions where ApH and/or A* were varied systematically at pH 5.5 and 7.5. Surprisingly, the results demonstrate that the apparent K, remains constant from about -180 to -30 mV, while the maximum velocity of transport varies to the second power with either component of SpH+ at both pHs, even though the maximum velocity is about IO-fold higher at pH 7.5 over a comparable range of ApH+ values. Since a high apparent K , is observed under completely deenergized conditions, the findings appear to be paradoxical; however, studies carried out over an extended range of lactose concentrations demonstrate that when ApH+ is dissipated partially the system exhibits biphasic kinetics.
M e m b r a n e vesicles prepared from Escherichia coli are essentially devoid of cytoplasmic constituents and retain the same polarity and configuration as the membrane in the intact cell (Kaback, 1971, 1974a; Owen & Kaback, 1978, 1979a,b). Furthermore, in addition to catalyzing the vectorial phos- phorylation of certain sugars via the phosphoenolpyruvate-
t From the Laboratory of Membrane Biochemistry, Roche Institute of Molecular Biology, Nutley, New Jersey 07110. Receiced June 2, 1980.
'Present address: Department of Pathology and Laboratory Medicine. Hahnemann Medical College and Hospital, Philadelphia, PA 19104.
Department of Biochemistry, Merck Sharp & Dohme, Rahway, NJ 07065. Fellow of the Helen Hay Whitney Foun- dat,ion.
Present address:
1 Fellow of the Spanish Research Council.
0006-2960/80/0419-5692$0 1 .OO/O
One component of the overall process exhibits the kinetic parameters typical of ApH+-driven active transport, and the other has the characteristics of facilitated diffusion. It is apparent, therefore, that in addition to acting thermodynam- ically as the driving force for active transport, ApH+ alters the distribution of the lac carrier between two different kinetic states. The implications of this phenomenon and possible explanations are discussed. Although studied in less detail, six different amino acid transport systems respond kinetically to ApH+ and its components in a manner similar to that de- scribed for the P-galactoside transport system. Selective dissipation of either A\k or ApH at pH 5.5 causes a decrease in maximum velocity with little or no change in apparent K,, and the apparent K, values are not altered significantly when the ambient pH is increased to 7.5. Finally, the effects of ApH+ and its components on the kinetics of the lactate and succinate transport systems were studied. At pH 5.5, nigericin abolishes D-lactate transport, and valinomycin causes a 2-fold increase in maximum velocity, demonstrating complete reliance of this system on ApH. In contrast, valinomycin causes a 30% in- crease in the maximum velocity of succinate transport at pH 5.5, but nigericin inhibits by only ~WO, indicating that although this transport system is biased kinetically toward ApH, A* plays a significant energetic role. There is no significant change in apparent K, with either transport system under the conditions described at pH 5.5, but each system exhibits sig- nificant increases in both apparent K, and maximum velocity at pH 7.5, suggesting that there may be a change in the overall transport mechanisms at higher pH (Le., an increase in pro- ton/substrate stoichiometry).
phosphotransferase system (Kaback, 1970), these vesicles catalyze the active transport of many solutes by a respira- tion-dependent mechanism in which chemiosmotic forces play a central, obligatory role (Kaback, 1976; Harold, 1976; Ramos et al., 1976; Ramos & Kaback, 1977a-c; Tokuda & Kaback, 1977; Boonstra & Konings, 1977; Reenstra et al., 1980). Thus, as postulated by Mitchell (1961, 1966, 1968, 1973, 1979), energy released by oxidation of certain electron donors in this experimental system leads to the generation of a proton electrochemical gradient (ApH+)' that is composed of two
' Abbreviations used: ApH+, the electrochemical gradient of protons; A*, the membrane potential; ApH, the chemical gradient of hydrogen ion; CCCP, carbonyl cyanide m-chlorophenylhydrazone; TDG, P-D- galactopyranosyl 1-thio-(3-D-galactopyranoside; TPP', tetraphenyl- phosphonium.
0 1980 American Chemical Society
A C T I V E T R A N S P O R T I N M E M B R A N E V E S I C L E S V O L . 1 9 , N O . 2 5 , 1 9 8 0 5693
centrations, the samples were incubated for 30 s to 1 min at 25 "C. Potassium ascorbate and PMS were then added to final concentrations of 20 and 0.1 mM, respectively, and incubations were continued at 25 OC for 30 s, at which time an appropriate radioactive transport substrate was added to an indicated concentration. Uptake was allowed to proceed at 25 OC for a given period of time, when the reactions were terminated by addition of 2.0 mL of 0.1 M potassium phosphate (pH 5.5) containing 0.1 M lithium chloride. The samples were rapidly filtered through Amicon microporous filters (0.45-pm pore size), and the filters were washed with an additional 2.0 mL of quench buffer and immediately removed from the filtration apparatus. Filters were dried, placed in 10 mL of scintillation fluid (Aqueous Counting Solution, Amersham/Searle, Inc.), and assayed for radioactivity in a Beckman LS-250 Scintil- lation Counter. Raw data were corrected for background adsorption of radioactive solute (Kaback, 197 1, 1974b) and for counting efficiency (80-90% for I4C and 30-40% for 3H).
Unless noted otherwise, initial rates of facilitated diffusion were determined as described by Kaczorowski et al. (1979). Vesicles were concentrated to approximately 15 mg of pro- tein/mL in 0.1 M potassium phosphate at a given pH, and carbonyl cyanide m-chlorophenylhydrazone (CCCP) was added to a final concentration of 10 pM. Aliquots (100 pL) were then incubated at 25 OC, and [l-'4C]lactose (60 mCi/ mmol) or @-D-galactopyranosyl l-thio-@-~-[6-~H]galacto- pyranoside (TDG, 95 mCi/mmol) was added at concentrations ranging from 0.5 to 30 mM. Initial rates of transport were determined from time points taken during the first 15 s of the reaction, and the data were corrected for passive permeability by performing identical experiments with ML 308-225 vesicles that were pretreated with 0.1 mM N-naphthylmaleimide for 30 min at 25 OC (Le., under conditions that completely in- activate carrier-mediated @-galactoside transport; D. E. Cohn, G. J. Kaczorowski, and H. R. Kaback, unpublished experi- ments). Because of the high protein concentration, 47-mm diameter filters were used for the assay.
Kinetic Analyses. Kinetic parameters were determined by plotting initial velocity, V, as a function of V / S , where S represents solute concentration. Values for maximum velocity (Vmax) were derived from the y intercept of the plots, and the apparent K , was estimated from the slope of the function.
Determination of ApH, A*, and A p p . ApH (interior al- kaline) and A@ (interior negative) were determined by flow dialysis from the equilibrium distribution of [3H]acetic acid and [3H] tetraphenylphosphonium (TPP'), respectively, with reduced PMS as electron donor (Ramos et al., 1976, 1979; Ramos & Kaback, 1977a-c; Tokuda & Kaback, 1977). Concentration gradients were calculated with a value of 2.2 pL of intravesicular fluid per mg of membrane protein (Ka- back & Barnes, 1971). Internal pH was calculated as de- scribed (Ramos et al., 1979), and ApH was determined by difference. The electrical potential (A@) was calculated from the Nernst equation (A* = 58.8 log [TPP+]i,/[TPP+],,t) by using steady-state distribution values obtained for [3H]TPP+. The proton electrochemical gradient (ApH+) was calculated by substituting values for ApH and A@ into eq 1.
Protein Determinations. Protein was measured as described by Lowry et al. (1951) with bovine serum albumin as standard.
Materials [3H]TPP+ (2.5 Ci/mmol; bromide salt) was synthesized by
the Isotope Synthesis Group of Hoffmann-La Roche, Inc., under the direction of Dr. Arnold Liebman. P-D-Galacto- pyranosyl 1-thio-P-D- [6-3H]galactopyranoside (TDG) was prepared by the method of Kennedy et al. (1974) with ga-
distinct interconvertible parameters, an electrical potential (A*) and a chemical gradient of hydrogen ions (ApH), that are related by
ApH+ = A* - (2.3RT/F)ApH (1)
where 2.3RT/F is equal to 58.8 mV at room temperature. Although these studies, which focus on the thermodynamic
equilibrium between ApH+ and steady-state levels of solute accumulation, provide strong confirmation of the chemiosmotic hypothesis and extend the concept in certain aspects, further progress requires a more mechanistic approach. In this respect, recent experiments (Kaczorowski & Kaback, 1979; Kaczo- rowski et al., 1979) indicate that carrier-mediated lactose efflux down a concentration gradient is an ordered mechanism in which lactose is released first from the carrier, followed by loss of a proton(s), and that the unloaded carrier may be negatively charged. Other evidence (Padan et al., 1979) suggests that a histidyl residue(s) in the @-galactoside transport system, as well as other transport systems, may be involved in the response of the systems to ApH+.
Since the energetics of active transport in the vesicle system are relatively clearly defined, it seemed appropriate to examine the relationship between ApH+ and the kinetic parameters of various transport systems in order to define these systems more rigorously. Although we have concentrated on the @-galac- toside transport system, less detailed studies on a number of other systems highlight certain similarities and differences that may have important implications.
Experimental Section
Methods Growth of Cells and Preparation of Membrane Vesicles.
E . coli ML 308-225 (i-z-y+a+) was grown in minimal medium A (David & Mingioli, 1959) containing 1.0% disodium suc- cinate (hexahydrate), and membrane vesicles were prepared as described (Kaback, 1971; Short et al., 1975). Vesicles were suspended in 0.1 M potassium phosphate (pH 6.6) to a con- centration of about 4 mg of protein/mL, frozen, and stored in liquid nitrogen.
For studies at pH 5.5 and 7.5, membrane suspensions were thawed rapidly at 46 OC, diluted 50-fold with 0.1 M potassium phosphate at the desired pH, and incubated at room tem- perature for 20 min. The suspensions were centrifuged at 40000g for 30 min, and the pellets were resuspended and washed once in a similar volume of the same buffer. The final pellets were then resuspended to given concentrations in 0.1 M potassium phosphate at the same pH.
Immediately prior to studies of lactate transport, the mem- braneous D- and L-lactate dehydrogenases were inactivated by treatment with hydroxybutynoate (Walsh et al., 1972). The vesicles were then centrifuged, washed once, and resuspended in 0.1 M potassium phosphate at a given pH as described above.
Transport Assays. Initial rates of ApH+-driven transport were measured with reduced phenazine methosulfate (PMS) as electron donor by filtration as outlined (Kaback, 1971, 1974b) with one important exception. Ascorbate and PMS were added to the vesicles for 30 s prior to addition of ra- dioactive transport substrates in order to allow the vesicles to generate ApH+ before the inception of transport. Thus, unless noted otherwise, aliquots (20 pL) of membrane vesicles con- taining about 80 hg of membrane protein were diluted to a final volume of 50 pL containing, in final concentrations, 50 mM potassium phosphate at a given pH and 10 mM mag- nesium sulfate. After addition of ionophores to given con-
5694 B I O C H E M I S T R Y R O B E R T S O N E T A L .
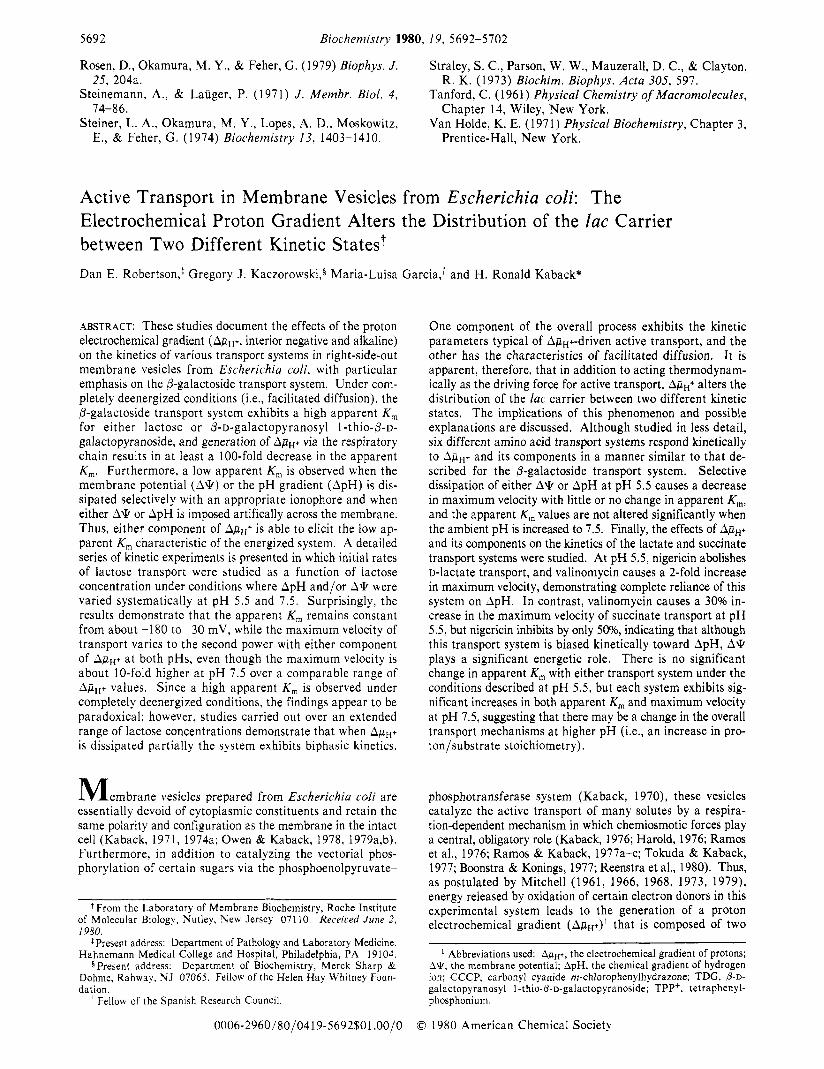
I i Table I: A ~ H + (Interior Negative and Alkaline) inE. coli ML 308-225 Vesiclesa
AQ (Interior Negative), ApH (Interior Alkaline), and
APH amblent pH ionophore AW (mV) (mV) A ~ H + (mV)
5.5 none -78 -58 -136 5.5 valinomycin O b -67 -67
7.5 none - 84 0 - 84 5.5 nigericin -97 0 - 97
7.5 nigericin - 84 0 - e4
Values for A Q and ApH were determined by f low dialysis with ['H]TPPt and ['Hlacetate distribution, respectively, as des- cribed previously (Ramos et al., 1976, 1979; Ramos & Kaback, 1977a; Tokuda & Kaback, 1977) and under Methods. ALH+ was calculated by substitution of values for AQ and ApH in eq 1. Where indicated, Valinomycin or nigericin was added to final con- centrations of 2 or 0.2 pM, respectively. The measurements pre- sented here are particularly relevant to the studies presented in l'igures 1 and 6-9 and Table 11. Although no significant uptake of [3H]TPP+ was observed, it is unlikely that AQ is absolutely ze- ro under the conditions described [see Ramos et al. (1976); Ramos & Kaback (1977a); Tokuda & Kaback (1977)l .
lactose oxidase (Worthington), followed by reductive tritiation with sodium [3H] borohydride (New England Nuclear). The final product had a specific activity of 95 mCi/mmol and was over 95% pure as judged by thin-layer chromatography (Kennedy et al., 1974). Other radioactive compounds were purchased from New England Nuclear and Amersham/Searle, Inc. Nigericin was generously provided by Dr. John Wesley, Hoffmann-La Roche, Inc., and valinomycin was obtained from Calbiochem. All other materials were reagent grade and purchased from commercial sources.
Results
A p p and the Effects of Valinomycin and Nigericin. Since many of the kinetic studies presented below (Figures 1, 6-9; Table 11) were carried out under conditions where ApHt and its components were varied systematically in a single prepa- ration of membrane vesicles, a few points regarding these parameters are noteworthy (Table I) . Although the value obtained for ApH (interior alkaline) at pH 5.5 is significantly lower than previously reported (Ramos et al., 1976; Ramos & Kaback, 1977a,b), the results are very similar qualitatively to those found in other vesicles, and the following specific points are important: (1) ApH is present at pH 5.5 and absent at pH 7.5 while A\k (interior negative) is essentially the same at both pHs; (2) ApHt is diminshed by about 40% at pH 7.5 relative to pH 5.5; (3) at pH 5.5, valinomycin causes a marked decrease in A* with a 16% increase in ApH and a 50% de- crease in ApH+ while nigericin abolishes ApH with a 24% increase in A\k and a 30% decrease in ApHt; and (4) at pH 7.5, nigericin has no effect whatsoever on ApH+ (Le., A*) while valinomycin causes marked inhibition [not shown; see Ramos et al. (1976), Ramos & Kaback (1977a,b), and Tokuda & Kaback (1977)l.
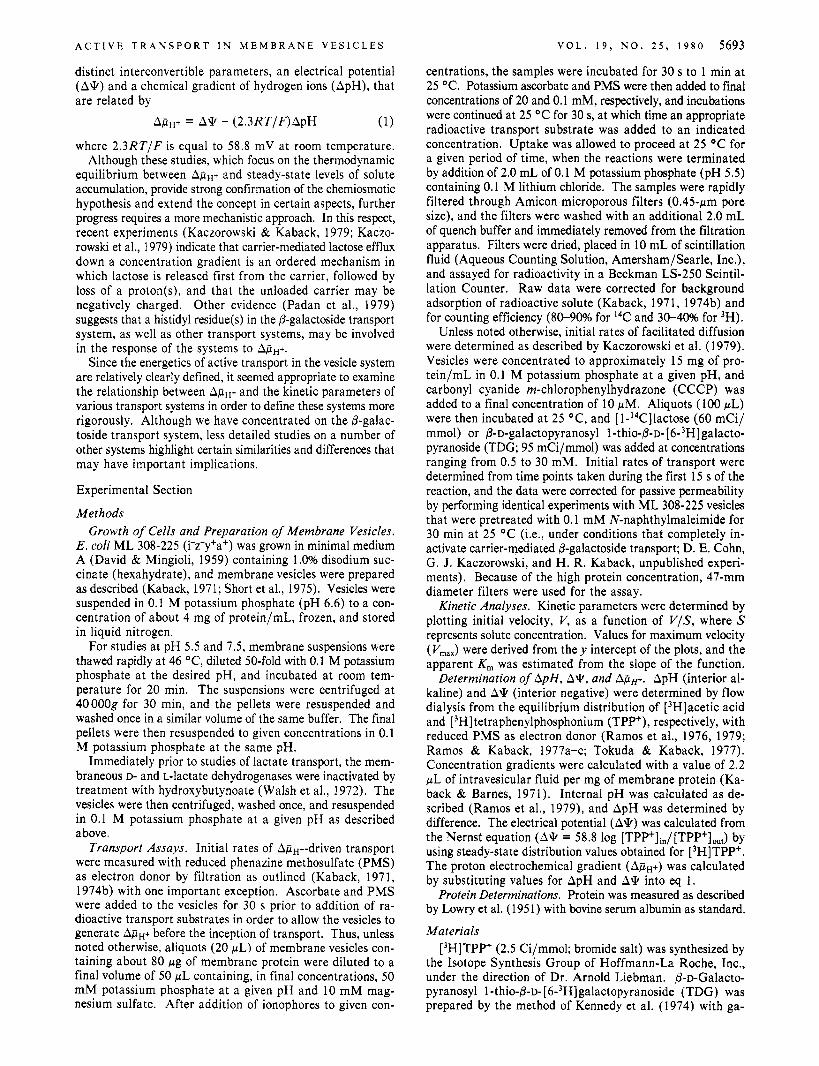
Kinetics of TDG Transport. The data presented in Figure 1 are representative kinetics for the transport of TDG, an uncharged, high-affinity substrate of the lac transport system in E. coli. At pH 5.5, with both electrical (A*) and chemical (ApH) components of ApH+ available (open circles), the initial rate of transport increases as a saturable function of TDG concentration, and a straight line is observed in the Vvs. V/S plot. The apparent K , derived from the slope of the function is 16 pM, and the V,,, estimated from the y intercept at infinite TDG concentration is 10.3 nmol/(min mg of protein). When valinomycin is added under conditions that dissipate
.h\'.t;\ I 0 01 0 2 0 3 04 0 5 06 07
( m o l x mi<' x mg protei<l/pM) V/S
FIGURE 1: Effect of A&,+, A@, and ApH on the kinetics of TDG transport. Vesicles prepared from E. coli ML 308-225 were assayed for TDG uptake as described previously (Kaback, 1974; Kaczorowski et al., 1979) and under Methods. The reaction mixtures (50-pL final volume) contained 50 mM potassium phosphate (pH 5.5 or 7.5, as indicated below), 10 mM magnesium sulfate, 80 pg of membrane protein, 20 mM potassium ascorbate (pH 7.0), 0.1 m M PMS, and concentrations of [6-3H]TDG (95 mCi/mmol) ranging from 2.0 to 98 pM. The vesicles were preincubated at 25 OC with ascorbate and PMS for 30 s before addition of [6-3H]TDG, and uptake was ter- minated 10 s later. Experiments were performed at pH 5 .5 in the absence of ionophores (O), at pH 5.5 in the presence of 0.2 pM nigericin (A) or 2.0 pM valinomycin (O), and at pH 7.5 in the presence of 0.2 pM nigericin (A). Inset: Kinetic analysis of facilitated diffusion. Vesicles were concentrated to about 15 mg of protein/mL in 0.1 M potassium phosphate at pH 5 . 5 (0 ) or pH 7.5 (A), and CCCP was added to a final concentration of 10 pM. Aliquots (100 pL) were then incubated at 25 OC, and [6-'H]TDG (95 mCi/mmol) was added at concentrations ranging from 0.5 to 30 mM. Initial rates of transport were determined from time points taken during the first 10 s of the reaction, and the data were corrected for passive permeability by performing identical experiments with the same vesicles that were pretreated with 0.1 mM N-naphthylmaleimide for 30 min at 25 OC. Because of the high protein concentration, 47-mm diameter filters were used for the assay.
A@ with a small increase in ApH and a 500h decrease in AL~H+ (Table I), the apparent K, remains unchanged, while V,,, decreases to about 6.6 nmol/(min mg of protein) (closed circles). Similarly, in the presence of nigericin which abolishes ApH, increases A\k, and leaves ApH+ at 70% of maximum (Table I), V,,, is diminished to about 5 nmol/(min mg of protein), and the apparent K , remains constant (open trian- gles).
When vesicles are equilibrated at pH 7.5 and treated with nigericin to ensure the absence of any residual ApH, the sole driving force for transport is a A* of about -84 mV (Table I). Under these conditions (Figure 1, closed triangles), the kinetics of TDG transport exhibit an apparent K, of 43 pM, a value 2-3 times higher than that observed at pH 5.5. Furthermore, the V , is 20.8 nmol/(min mg of protein), which represents a 2-fold increase over the V,,, observed at pH 5.5 under fully energized conditions and a 4-fold increase over the Vmx observed at pH 5.5 in the presence of nigericin (i.e., under conditions where transport is driven by a A\k of similar magnitude).
Kinetics of TDG influx were measured in the complete absence of ApH+ to complete the study (Figure 1, inset). For these facilitated diffusion measurements, vesicles were con- centrated to ca. 15 mg of protein/mL and treated with CCCP in order to inhibit generation of A\k or ApH induced by
A C T I V E T R A N S P O R T I N M E M B R A N E V E S I C L E S V O L . 1 9 , N O . 2 5 , 1 9 8 0 5695
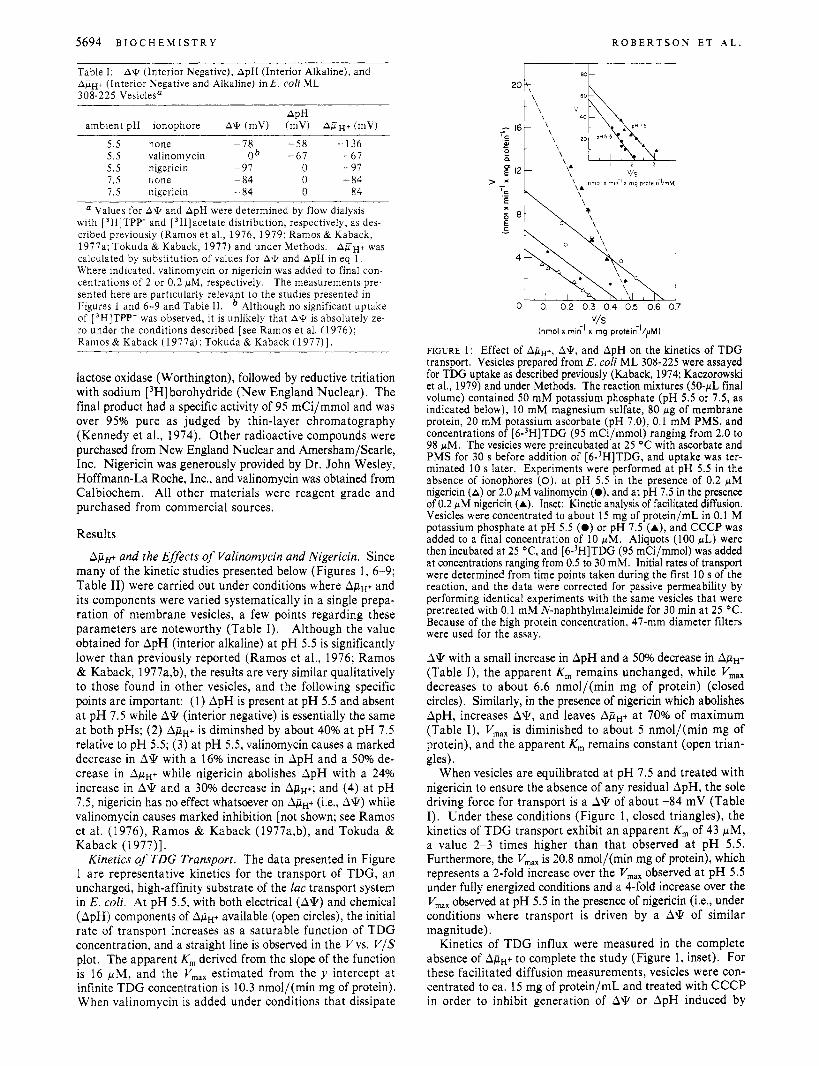
1 min. Subsequently, lactose is lost from the vesicles, and over the ensuing 6-7 min, the level returns to that of the control samples; moreover, at each lactose concentration, the effect is abolished when the vesicles are diluted into potassium phosphate (i.e., when there is no potassium diffusion gradient), when valinomycin is omitted, or when the experiments are carried out in the presence of 10 pM CCCP (not shown). Data obtained from the initial phase of the response (Le., over the first 10 s) exhibit a linear function when plotted as Vvs. V / S , and the apparent K, is about 0.2 mM, a value that is the same as that observed when AjiH+ is generated via substrate oxidation [see Figure 3 and Barnes & Kaback (1970), Kaback & Barnes (1971) and Kaczorowski et al. (1979)l.
Because acetate is permeant in its protonated form only (Lancaster & Hinkle, 1977a,b; Ramos & Kaback, 1977a), a transient ApH (interior alkaline) is created across the vesicle membrane by diluting acetate-loaded vesicles into media containing a less permeant anion such as gluconate. Moreover, ApH generated in this fashion causes an increase in the fluorescence of 6'-(dansylamino)hexyl 1-thio-6-D-galacto- pyranoside in vesicles containing the lac carrier (Kaczorowski et al., 1979) and drives the transport of glucose-6-P and glu- curonate at pH 5.5 (LeBlanc et al., 1980). When ML 308-225 vesicles are subjected to this manipulation in the presence of given concentrations of [ l-'4C]lactose, initial rates of uptake are linear for about 7 s, maximum levels of accumulation are achieved at about 10 s, and over the next 30 s to 1 min the levels return to those of the control samples. Transient ac- cumulation is not observed when acetate-loaded vesicles are diluted into equimolar acetate (i.e., in the absence of an acetate diffusion gradient) or when the experiments are carried out in the presence of 10 pM CCCP (not shown). Data obtained from the initial phase of the response (Le., over the first 5-7 s) yield a linear Vvs. V/S plot (Figure 2B), and again the apparent K , (0.4 mM) approximates that observed when AjiH+ is generated by respiration.*
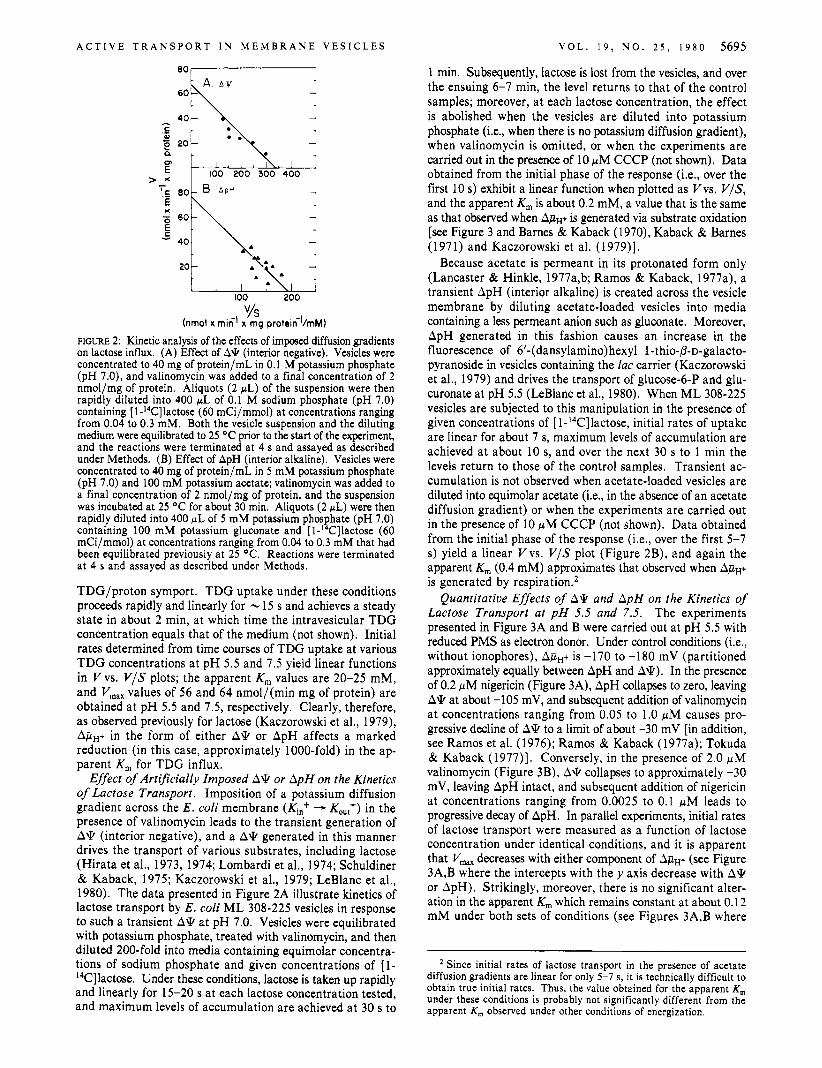
Quantitative Effects of A\k and ApH on the Kinetics of Lactose Transport at pH 5.5 and 7.5. The experiments presented in Figure 3A and B were carried out at pH 5.5 with reduced PMS as electron donor. Under control conditions (i.e., without ionophores), ApH+ is -170 to -180 mV (partitioned approximately equally between ApH and A*). In the presence of 0.2 pM nigericin (Figure 3A), ApH collapses to zero, leaving A\k at about -105 mV, and subsequent addition of valinomycin at concentrations ranging from 0.05 to 1.0 pM causes pro- gressive decline of A\k to a limit of about -30 mV [in addition, see Ramos et al. (1976); Ramos & Kaback (1977a); Tokuda & Kaback (1 977)]. Conversely, in the presence of 2.0 pM valinomycin (Figure 3B), A\k collapses to approximately -30 mV, leaving ApH intact, and subsequent addition of nigericin at concentrations ranging from 0.0025 to 0.1 pM leads to progressive decay of ApH. In parallel experiments, initial rates of lactose transport were measured as a function of lactose concentration under identical conditions, and it is apparent that V,, decreases with either component of ApH+ (see Figure 3A,B where the intercepts with they axis decrease with A\k or ApH). Strikingly, moreover, there is no significant alter- ation in the apparent K, which remains constant at about 0.12 mM under both sets of conditions (see Figures 3A,B where
CT E ' Tx C .- E
i l , i , h , l
100 200 300 400
YS (nrnol x mi t i x rng protein?mM)
FIGURE 2: Kinetic analysis of the effects of imposed diffusion gradients on lactose influx. (A) Effect of A\k (interior negative). Vesicles were concentrated to 40 mg of protein/mL in 0.1 M potassium phosphate (pH 7.0), and valinomycin was added to a final concentration of 2 nmol/mg of protein. Aliquots ( 2 pL) of the suspension were then rapidly diluted into 400 p L of 0.1 M sodium phosphate (pH 7.0) containing [ l-14C]lactose (60 mCi/mmol) a t concentrations ranging from 0.04 to 0.3 mM. Both the vesicle suspension and the diluting medium were equilibrated to 25 OC prior to the start of the experiment, and the reactions were terminated at 4 s and assayed as described under Methods. (B) Effect of ApH (interior alkaline). Vesicles were concentrated to 40 mg of protein/mL in 5 mM potassium phosphate (pH 7.0) and 100 mM potassium acetate; valinomycin was added to a final concentration of 2 nmol/mg of protein, and the suspension was incubated at 25 OC for about 30 min. Aliquots (2 r L ) were then rapidly diluted into 400 pL of 5 mM potassium phosphate (pH 7.0) containing 100 mM potassium gluconate and [ l-'4C]lactose (60 mCi/mmol) a t concentrations ranging from 0.04 to 0.3 mM that had been equilibrated previously a t 25 OC. Reactions were terminated a t 4 s and assayed as described under Methods.
TDG/proton symport. TDG uptake under these conditions proceeds rapidly and linearly for - 15 s and achieves a steady state in about 2 min, at which time the intravesicular TDG concentration equals that of the medium (not shown). Initial rates determined from time courses of TDG uptake at various TDG concentrations at pH 5.5 and 7.5 yield linear functions in V vs. V/S plots; the apparent K , values are 20-25 mM, and V,,, values of 56 and 64 nmol/(min mg of protein) are obtained at pH 5.5 and 7.5, respectively. Clearly, therefore, as observed previously for lactose (Kaczorowski et al., 1979), AjiH+ in the form of either A\k or ApH affects a marked reduction (in this case, approximately 1000-fold) in the ap- parent K , for TDG influx.
Effect of Artificially Imposed A\k or ApH on the Kinetics of Lactose Transport. Imposition of a potassium diffusion gradient across the E . coli membrane (Kin+ - KO,,+) in the presence of valinomycin leads to the transient generation of A* (interior negative), and a A 9 generated in this manner drives the transport of various substrates, including lactose (Hirata et al., 1973, 1974; Lombardi et al., 1974; Schuldiner & Kaback, 1975; Kaczorowski et al., 1979; LeBlanc et al., 1980). The data presented in Figure 2A illustrate kinetics of lactose transport by E. coli ML 308-225 vesicles in response to such a transient A\k at pH 7.0. Vesicles were equilibrated with potassium phosphate, treated with valinomycin, and then diluted 200-fold into media containing equimolar concentra- tions of sodium phosphate and given concentrations of [ l - ''C]lactose. Under these conditions, lactose is taken up rapidly and linearly for 15-20 s at each lactose concentration tested, and maximum levels of accumulation are achieved at 30 s to
Since initial rates of lactose transport in the presence of acetate diffusion gradients are linear for only 5-7 s, it is technically difficult to obtain true initial rates. Thus, the value obtained for the apparent K,,, under these conditions is probably not significantly different from the apparent K,,, observed under other conditions of energization.
5696 B I O C H E M I S T R Y R O B E R T S O N E T A L .
8 - /~ 20 -
20 40 60 00 100 20 40 60 80 100 100 200 300 400 v/S (nrnol x mi{' x mg protein-l/rnM)
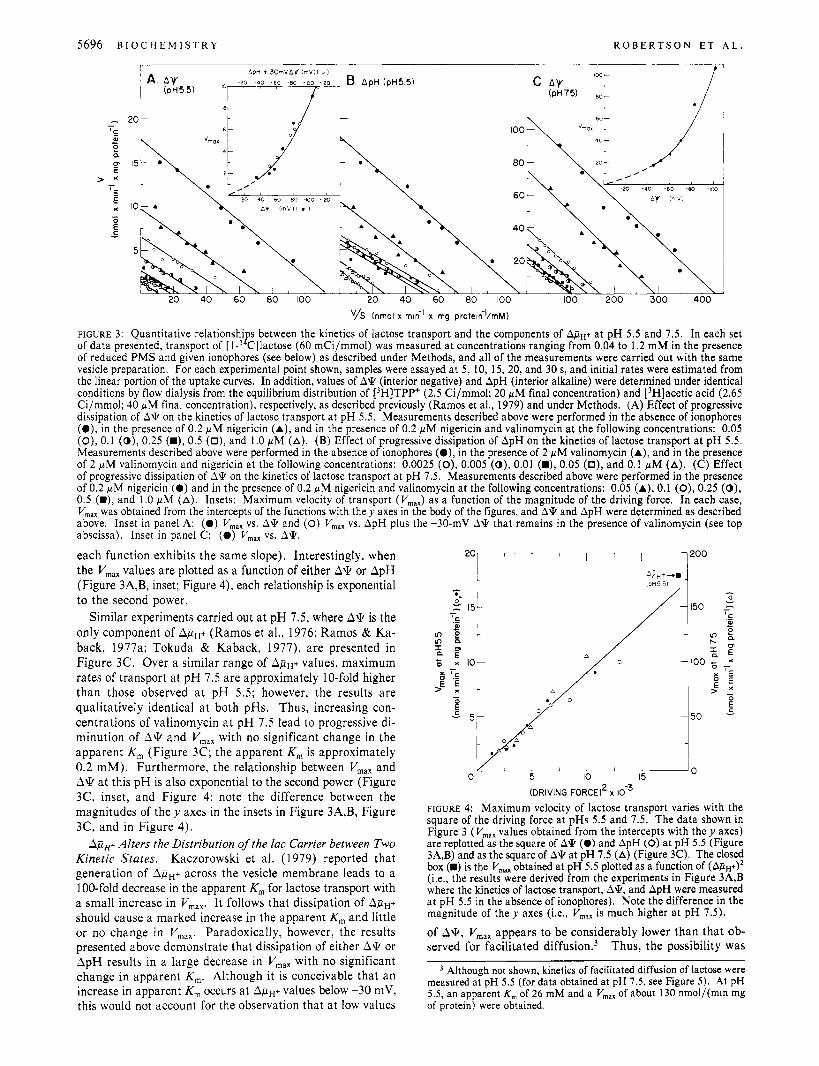
FIGURE 3: Quantitative relationshi s between the kinetics of lactose transport and the components of ApH+ at pH 5.5 and 7.5. In each set
of reduced PMS and given ionophores (see below) as described under Methods, and all of the measurements were carried out with the same vesicle preparation. For each experimental point shown, samples were assayed at 5, 10, 15, 20, and 30 s, and initial rates were estimated from the linear portion of the uptake curves. In addition, values of A'k (interior negative) and ApH (interior alkaline) were determined under identical conditions by flow dialysis from the equilibrium distribution of [3H]TPP+ (2.5 Ci/mmol; 20 yM final concentration) and [3H]acetic acid (2.65 Ci/mmol; 40 yM final concentration), respectively, as described previously (Ramos et al., 1979) and under Methods. (A) Effect of progressive dissipation of A'k on the kinetics of lactose transport a t pH 5.5. Measurements described above were performed in the absence of ionophores ( O ) , in the presence of 0.2 yM nigericin (A), and in the presence of 0.2 yM nigericin and valinomycin at the following concentrations: 0.05 (O), 0.1 (0 ) , 0.25 (W), 0.5 (O), and 1.0 yM (A). (B) Effect of progressive dissipation of ApH on the kinetics of lactose transport a t pH 5.5. Measurements described above were performed in the absence of ionophores (a), in the presence of 2 WM valinomycin (A), and in the presence of 2 yM valinomycin and nigericin a t the following concentrations: 0.0025 (0), 0.005 (0) , 0.01 (W), 0.05 (O), and 0.1 yM (A). (C) Effect of progressive dissipation of A'k on the kinetics of lactose transport a t pH 7.5. Measurements described above were performed in the presence of 0.2 yM nigericin (0 ) and in the presence of 0.2 yM nigericin and valinomycin at the following concentrations: 0.05 (A), 0.1 (0), 0.25 (0), 0.5 (W), and 1.0 pM (A). Insets: Maximum velocity of transport (V,,,) as a function of the magnitude of the driving force. In each case, V,, was obtained from the intercepts of the functions with they axes in the body of the figures, and A* and ApH were determined as described above. Inset in panel A: (0 ) V,,, vs. A'k and (0) V,,, vs. ApH plus the -30-mV A'k that remains in the presence of valinomycin (see top abscissa). Inset in panel C: (0) V,,, vs. A'k,
of data presented, transport of [ 1-' B Cllactose (60 mCi/mmol) was measured at concentrations ranging from 0.04 to 1.2 mM in the presence
each function exhibits the same slope). Interestingly, when the V,,, values are plotted as a function of either A\k or ApH (Figure 3A,B, inset; Figure 4), each relationship is exponential to the second power.
Similar experiments carried out a t pH 7.5, where A\k is the only component of ApH+ (Ramos et al., 1976; Ramos & Ka- back, 1977a; Tokuda & Kaback, 1977), are presented in Figure 3C. Over a similar range of ApH+ values, maximum rates of transport at pH 7.5 are approximately 10-fold higher than those observed a t pH 5.5; however, the results are qualitatively identical a t both pHs. Thus, increasing con- centrations of valinomycin a t p H 7.5 lead to progressive di- minution of A 9 and V,,, with no significant change in the apparent K, (Figure 3C; the apparent K, is approximately 0.2 mM). Furthermore, the relationship between V,,, and A 9 a t this pH is also exponential to the second power (Figure 3C, inset, and Figure 4; note the difference between the magnitudes of they axes in the insets in Figure 3A,B, Figure 3C, and in Figure 4).
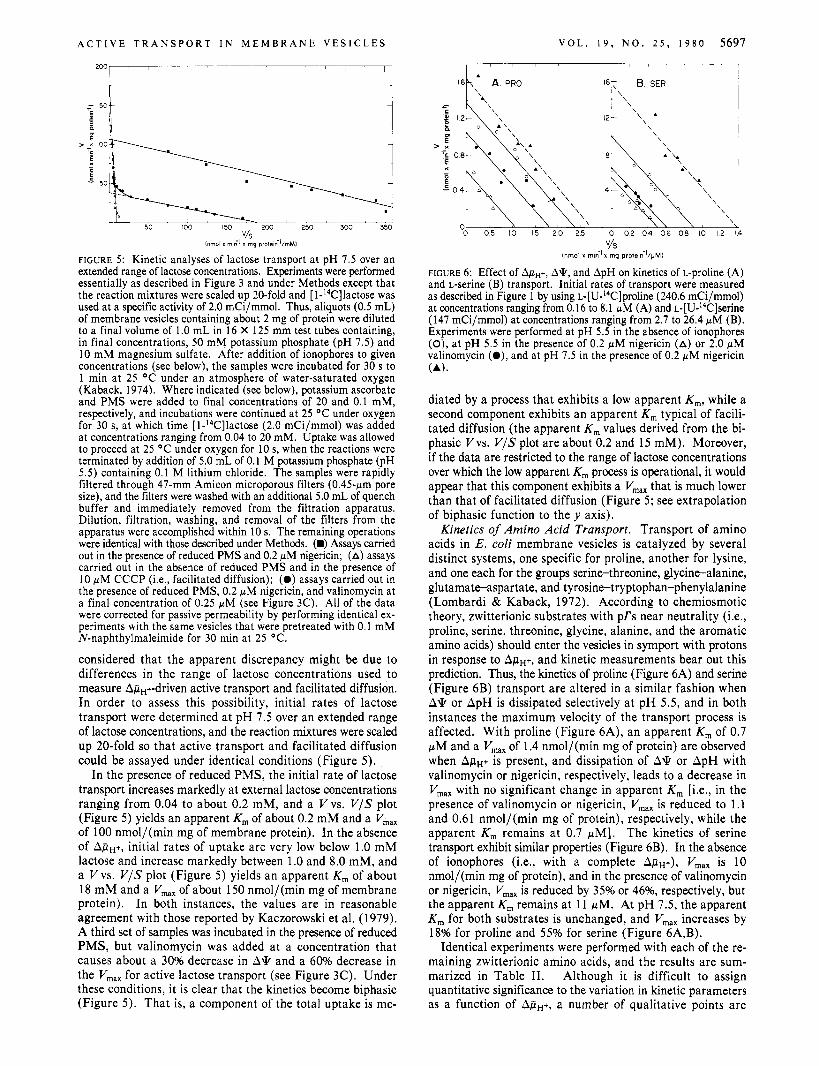
A p p Alters the Distribution of the lac Carrier between Two Kinetic States. Kaczorowski et al. (1979) reported that generation of ApH+ across the vesicle membrane leads to a 100-fold decrease in the apparent K , for lactose transport with a small increase in V,,,. It follows that dissipation of ApH+ should cause a marked increase in the apparent K, and little or no change in V,,,. Paradoxically, however, the results presented above demonstrate that dissipation of either A\k or ApH results in a large decrease in V,,, with no significant change in apparent K,. Although it is conceivable that an increase in apparent K, occurs a t ApH+ values below -30 mV, this would not account for the observation that a t low values
I I I 10
(DRIVING FORCE?
0 5 IO 15
FIGURE 4: Maximum velocity of lactose transport varies with the square of the driving force at pHs 5.5 and 7.5. The data shown in Figure 3 (V,,, values obtained from the intercepts with t h e y axes) are replotted as the square of A* (0) and ApH (0) at pH 5.5 (Figure 3A,B) and as the square of A* at pH 7.5 (A) (Figure 3C). The closed box (W) is the V,, obtained at pH 5.5 plotted as a function of (ApH+)* (Le., the results were derived from the experiments in Figure 3A,B where the kinetics of lactose transport, A*, and ApH were measured at pH 5.5 in the absence of ionophores). Note the difference in the magnitude of the y axes (Le., V,,, is much higher a t pH 7.5).
of A*, V.,, appears to be considerably lower than that ob- served for facilitated diffusions3 Thus, the possibility was ~~ ~~
Although not shown, kinetics of facilitated diffusion of lactose were measured at pH 5.5 (for data obtained at pH 7.5, see Figure 5 ) . At pH 5.5, an apparent K,,, of 26 m M and a V,,, of about 130 nmol/(min mg of protein) were obtained.
A C T I V E T R A N S P O R T I N M E M B R A N E V E S I C L E S
I-
V O L . 1 9 , N O . 2 5 , 1 9 8 0 5697
F I 50 100 150 ZOO 250 300 350
V/S lnmol x mi<' x mp protem'/mMl
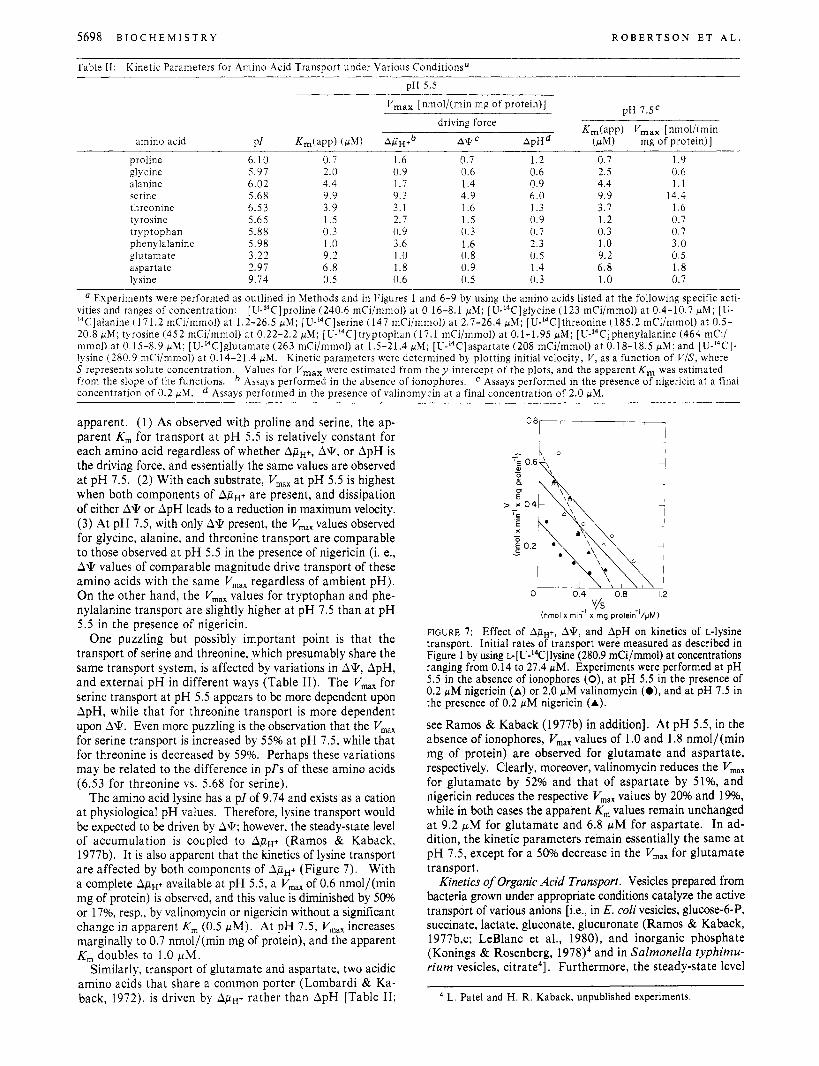
FIGURE 5: Kinetic analyses of lactose transport a t pH 7.5 over an extended range of lactose concentrations. Experiments were performed essentially as described in Figure 3 and under Methods except that the reaction mixtures were scaled up 20-fold and [ I-14C]lactose was used at a specific activity of 2.0 mCi/mmol. Thus, aliquots (0.5 mL) of membrane vesicles containing about 2 mg of protein were diluted to a final volume of 1.0 mL in 16 X 125 mm test tubes containing, in final concentrations, 50 mM potassium phosphate (pH 7.5) and 10 mM magnesium sulfate. After addition of ionophores to given concentrations (see below), the samples were incubated for 30 s to 1 min at 25 OC under an atmosphere of water-saturated oxygen (Kaback, 1974). Where indicated (see below), potassium ascorbate and PMS were added to final concentrations of 20 and 0.1 mM, respectively, and incubations were continued at 25 OC under oxygen for 30 s, a t which time [l-14C]lactose (2.0 mCi/mmol) was added at concentrations ranging from 0.04 to 20 mM. Uptake was allowed to proceed at 25 OC under oxygen for 10 s, when the reactions were terminated by addition of 5.0 mL of 0.1 M potassium phosphate (pH 5.5) containing 0.1 M lithium chloride. The samples were rapidly filtered through 47-mm Amicon microporous filters (0.45-pm pore size), and the filters were washed with an additional 5.0 mL of quench buffer and immediately removed from the filtration apparatus. Dilution, filtration, washing, and removal of the filters from the apparatus were accomplished within 10 s. The remaining operations were identical with those described under Methods. (w) Assays carried out in the presence of reduced PMS and 0.2 pM nigericin; (A) assays carried out in the absence of reduced PMS and in the presence of 10 p M CCCP (Le., facilitated diffusion); (0 ) assays carried out in the presence of reduced PMS, 0.2 pM nigericin, and valinomycin at a final concentration of 0.25 pM (see Figure 3C). All of the data were corrected for passive permeability by performing identical ex- periments with the same vesicles that were pretreated with 0.1 mM N-naphthylmaleimide for 30 min at 25 OC.
considered that the apparent discrepancy might be due to differences in the range of lactose concentrations used to measure ApH+-driven active transport and facilitated diffusion. In order to assess this possibility, initial rates of lactose transport were determined at pH 7.5 over an extended range of lactose concentrations, and the reaction mixtures were scaled up 20-fold so that active transport and facilitated diffusion could be assayed under identical conditions (Figure 5).
In the presence of reduced PMS, the initial rate of lactose transport increases markedly at external lactose concentrations ranging from 0.04 to about 0.2 mM, and a Vvs. V/S plot (Figure 5) yields an apparent K , of about 0.2 mM and a V,,, of 100 nmol/(min mg of membrane protein). In the absence of ApH+, initial rates of uptake are very low below 1.0 mM lactose and increase markedly between 1 .O and 8.0 mM, and a Vvs. V / S plot (Figure 5) yields an apparent K , of about 18 mM and a V,, of about 150 nmol/(min mg of membrane protein). In both instances, the values are in reasonable agreement with those reported by Kaczorowski et al. (1979). A third set of samples was incubated in the presence of reduced PMS, but valinomycin was added at a concentration that causes about a 30% decrease in A q and a 60% decrease in the V,,, for active lactose transport (see Figure 3C). Under these conditions, it is clear that the kinetics become biphasic (Figure 5). That is, a component of the total uptake is me-
V/S (nrnol x minlx mg proteihl/pMI
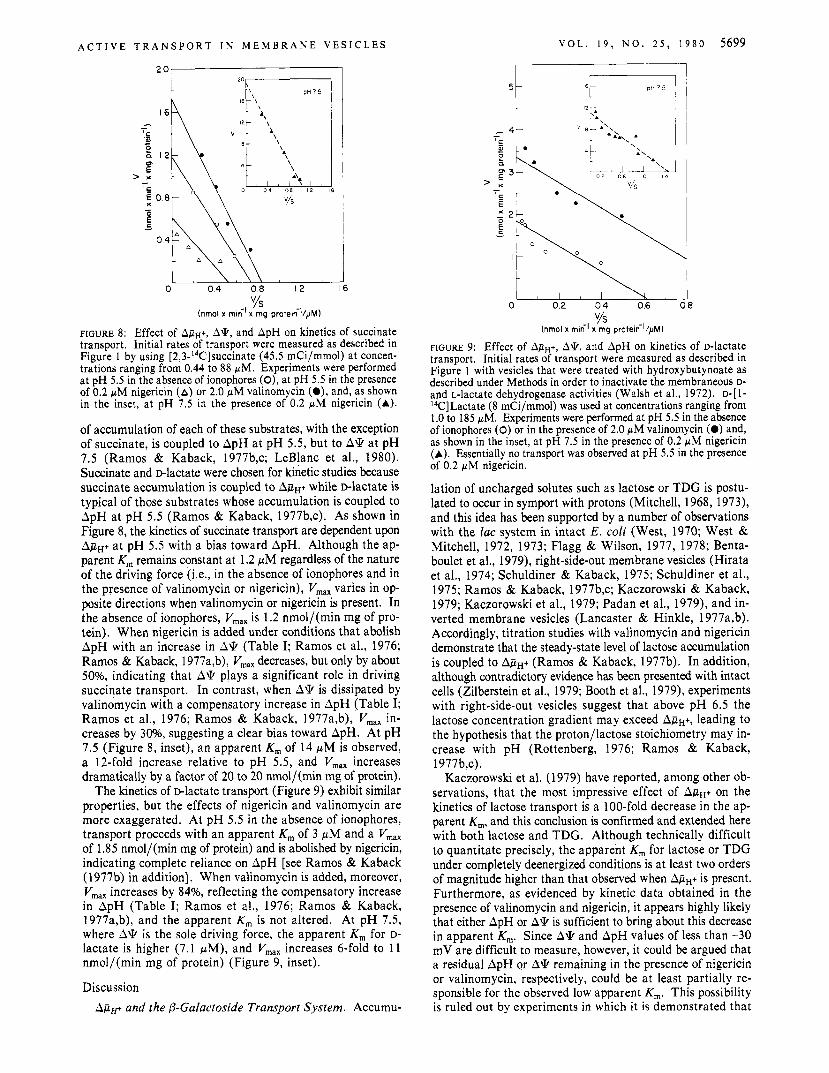
FIGURE 6: Effect of A&+, A*, and ApH on kinetics of L-proline (A) and L-serine (B) transport. Initial rates of transport were measured as described in Figure 1 by using ~- [U-~~C]pro l ine (240.6 mCi/mmol) at concentrations ranging from 0.16 to 8.1 WM (A) and ~-[U-'~C]serine (147 mCi/mmol) at concentrations ranging from 2.7 to 26.4 pM (B). Experiments were performed at pH 5.5 in the absence of ionophores (0), at pH 5.5 in the presence of 0.2 p M nigericin (A) or 2.0 pM valinomycin (O) , and at pH 7.5 in the presence of 0.2 WM nigericin (A).
diated by a process that exhibits a low apparent K,, while a second component exhibits an apparent K , typical of facili- tated diffusion (the apparent K , values derived from the bi- phasic Vvs. V/S plot are about 0.2 and 15 mM). Moreover, if the data are restricted to the range of lactose concentrations over which the low apparent K, process is operational, it would appear that this component exhibits a V,,, that is much lower than that of facilitated diffusion (Figure 5; see extrapolation of biphasic function to the y axis).
Kinetics of Amino Acid Transport. Transport of amino acids in E . coli membrane vesicles is catalyzed by several distinct systems, one specific for proline, another for lysine, and one each for the groups serine-threonine, glycine-alanine, glutamate-aspartate, and tyrosine-tryptophan-phenylalanine (Lombardi & Kaback, 1972). According to chemiosmotic theory, zwitterionic substrates with p f s near neutrality (Le., proline, serine, threonine, glycine, alanine, and the aromatic amino acids) should enter the vesicles in symport with protons in response to A,iiH+, and kinetic measurements bear out this prediction. Thus, the kinetics of proline (Figure 6A) and serine (Figure 6B) transport are altered in a similar fashion when A* or ApH is dissipated selectively at pH 5.5, and in both instances the maximum velocity of the transport process is affected. With proline (Figure 6A), an apparent K , of 0.7 pM and a V,, of 1.4 nmol/(min mg of protein) are observed when ApH+ is present, and dissipation of A* or ApH with valinomycin or nigericin, respectively, leads to a decrease in V,,, with no significant change in apparent K , [i.e., in the presence of valinomycin or nigericin, V,,, is reduced to 1.1 and 0.61 nmol/(min mg of protein), respectively, while the apparent K , remains at 0.7 pM]. The kinetics of serine transport exhibit similar properties (Figure 6B). In the absence of ionophores (Le., with a complete A,iiH+), V,,, is 10 nmol/(min mg of protein), and in the presence of valinomycin or nigericin, Vmx is reduced by 35% or 46%, respectively, but the apparent K , remains at 11 pM. At pH 7.5, the apparent K , for both substrates is unchanged, and V,,, increases by 18% for proline and 55% for serine (Figure 6A,B).
Identical experiments were performed with each of the re- maining zwitterionic amino acids, and the results are sum- marized in Table 11. Although it is difficult to assign quantitative significance to the variation in kinetic parameters as a function of A&,+, a number of qualitative points are
5698 B I O C H E M I S T R Y R O B E R T S O N E T A L .
Table 11: Kinetic Parameters for Amino Acid Transport under Various Conditionsa pH 5.5
pH 7.5c Vma, [nmol/(min mg of protein)]
proline glycine alanine serine threonine tyrosine tryptophan phenylalanine glutamate aspartate lysine
6.10 5.97 6.02 5.68 6.53 5.65 5.88 5.98 3.22 2.97 9.74
0.7 2.0 4.4 9.9 3.9 1.5 0.3 1 .o 9.2 6.8 0.5
1.6 0.9 1.7 9.3 3.1 2.7 0.9 3.6 1.0 1.8 0.6
0.7 0.6 1.4 4.9 1.6 1.5 0.3 1.6 0.8 0.9 0.5
1.2 0.6 0.9 6.0 1.3 0.9 0.7 2.3 0.5 1.4 0.3
0.7 2.5 4.4 9.9 3.7 1.2 0.3 1 .O 9.2 6.8 1.0
1.9 0.6 1 . 1
14.4 1.6 0.7 0.7 3.0 0.5 1.8 0.7
a Experiments were performed as outlined in Methods and in Figures 1 and 6-9 by using the amino acids listed at the following specific acti- vities and ranges of concentration: [U-'4C]proline (240.6 mCi/mmol) at 0.16-8.1 pM; [U-'4C]g1ycine (123 mCi/mmol) at 0.4-10.7 p M ; [U- 14C]alanine (171.2 mCi/mmol) at 1.2-26.5 p M ; [U-'4C]serine (147 mCi/mmol) at 2.7-26.4 p M ; (U-'"Clthreonine (185.2 mCi/mmol) at 0.5- 20.8 pM; tyrosine (452 mCi/mmol) at 0.22-2.2 pM; [U-"C] tryptophan (17.1 mCi/mmol) at 0.1-1.95 p M ; [U-'"Clphenylalanine (464 mCi/ mmol) at 0.15-8.9 pM; [U-'4C]gl~taniate (263 mCi/mmol) at 1.5-21.4 p M ; [U-'4C]a~partate (208 mCi/mmol) at 0.18-18.5 pM; and (U-''C]- lysine (280.9 mCi/mmol) at 0.14-21.4 pM. Kinetic parameters were determined by plotting initial velocity, V , as a function of V i s , where S represents solute concentration. Values for Vmax were estimated from they intercept of the plots, and the apparent Km was estimated from the slope of the functions. Assays performed in the absence of ionophores. concentration of 0.2 pM.
Assays performed in the presence of nigericin at a final Assays performed in the presence of valinomycin at a final concentration of 2.0 pM.
apparent. (1) As observed with proline and serine, the ap- parent K , for transport a t pH 5.5 is relatively constant for each amino acid regardless of whether APH+, A*, or ApH is the driving force, and essentially the same values are observed a t pH 7.5. (2) With each substrate, V,,, at pH 5.5 is highest when both components of ApH+ are present, and dissipation of either A* or ApH leads to a reduction in maximum velocity. (3) At pH 7.5, with only A* present, the Vmx values observed for glycine, alanine, and threonine transport are comparable to those observed at pH 5.5 in the presence of nigericin (i. e., A* values of comparable magnitude drive transport of these amino acids with the same V,,, regardless of ambient pH). On the other hand, the V,,, values for tryptophan and phe- nylalanine transport are slightly higher at pH 7.5 than at pH 5.5 in the presence of nigericin.
One puzzling but possibly important point is that the transport of serine and threonine, which presumably share the same transport system, is affected by variations in A*, ApH, and external pH in different ways (Table 11). The V,,, for serine transport at pH 5.5 appears to be more dependent upon ApH, while that for threonine transport is more dependent upon A*. Even more puzzling is the observation that the Vmx for serine transport is increased by 55% at pH 7.5, while that for threonine is decreased by 59%. Perhaps these variations may be related to the difference in PI'S of these amino acids (6.53 for threonine vs. 5.68 for serine).
The amino acid lysine has a p l of 9.74 and exists as a cation a t physiological pH values. Therefore, lysine transport would be expected to be driven by A*; however, the steady-state level of accumulation is coupled to AFH+ (Ramos & Kaback, 1977b). It is also apparent that the kinetics of lysine transport are affected by both components of ApH+ (Figure 7). With a complete ApH+ available at pH 5.5, a Vmn of 0.6 nmol/(min mg of protein) is observed, and this value is diminished by 50% or 17%, resp., by valinomycin or nigericin without a significant change in apparent K , (0.5 pM). At pH 7.5, V,,, increases marginally to 0.7 nmol/(min mg of protein), and the apparent K,,, doubles to 1.0 pM.
Similarly, transport of glutamate and aspartate, two acidic amino acids that share a common porter (Lombardi & Ka- back, 1972), is driven by ApH+ rather than ApH [Table 11;
0 8 , , , , I I
V/S (nrnol x mi<' x mg profeih' /pM)
FIGURE 7: Effect of ApH+, A*, and ApH on kinetics of L-lysine transport. Initial rates of transport were measured as described in Figure 1 by using ~-[U-'~C]lysine (280.9 mCi/mmol) at concentrations ranging from 0.14 to 27.4 pM. Experiments were performed at pH 5.5 in the absence of ionophores (O) , at p H 5 .5 in the presence of 0.2 pM nigericin (A) or 2.0 pM valinomycin (O) , and at pH 7.5 in the presence of 0.2 pM nigericin (A).
see Ramos & Kaback (1977b) in addition]. At pH 5.5, in the absence of ionophores, V,,, values of 1 .O and 1.8 nmol/(min mg of protein) are observed for glutamate and aspartate, respectively. Clearly, moreover, valinomycin reduces the V,, for glutamate by 52% and that of aspartate by 51%, and nigericin reduces the respective V,,, values by 20% and 19%, while in both cases the apparent K , values remain unchanged at 9.2 yM for glutamate and 6.8 yM for aspartate. In ad- dition, the kinetic parameters remain essentially the same at pH 7.5, except for a 50% decrease in the V,,, for glutamate transport.
Kinetics of Organic Acid Transport. Vesicles prepared from bacteria grown under appropriate conditions catalyze the active transport of various anions [Le., in E. coli vesicles, glucose-6-P, succinate, lactate, gluconate, glucuronate (Ramos & Kaback, 1977b,c; LeBlanc et al., 1980), and inorganic phosphate (Konings & Rosenberg, 1978)4 and in Salmonella typhimu- rium vesicles, citrate4], Furthermore, the steady-state level ~~
L. Patel and H. R. Kaback, unpublished experiments.
A C T I V E T R A N S P O R T I N M E M B R A N E V E S I C L E S
0 0 4 00 12
YS (nmol x rnih' x rng protein-'/pM)
FIGURE 8: Effect of ApH+, A*, and ApH on kinetics of succinate transport. Initial rates of transport were measured as described in Figure 1 by using [2,3-''C]succinate (45.5 mCi/mmol) a t concen- trations ranging from 0.44 to 88 pM. Experiments were performed a t pH 5.5 in the absence of ionophores (O), at pH 5.5 in the presence of 0.2 pM nigericin (A) or 2.0 pM valinomycin (a), and, as shown in the inset, a t pH 7 .5 in the presence of 0.2 pM nigericin (A).
of accumulation of each of these substrates, with the exception of succinate, is coupled to ApH at pH 5.5, but to A* at pH 7.5 (Ramos & Kaback, 1977b,c; LeBlanc et al., 1980). Succinate and Dlactate were chosen for kinetic studies because succinate accumulation is coupled to ApH+ while D-lactate is typical of those substrates whose accumulation is coupled to ApH at pH 5.5 (Ramos & Kaback, 1977b,c). As shown in Figure 8, the kinetics of succinate transport are dependent upon ApH+ at pH 5.5 with a bias toward ApH. Although the ap- parent K, remains constant at 1.2 pM regardless of the nature of the driving force (Le., in the absence of ionophores and in the presence of valinomycin or nigericin), V,,, varies in op- posite directions when valinomycin or nigericin is present. In the absence of ionophores, V,,, is 1.2 nmol/(min mg of pro- tein). When nigericin is added under conditions that abolish ApH with an increase in A\k (Table I; Ramos et al., 1976; Ramos & Kaback, 1977a,b), Vmx decreases, but only by about 50%, indicating that A* plays a significant role in driving succinate transport. In contrast, when A* is dissipated by valinomycin with a compensatory increase in ApH (Table I; Ramos et al., 1976; Ramos & Kaback, 1977a,b), V,,, in- creases by 3096, suggesting a clear bias toward ApH. At pH 7.5 (Figure 8, inset), an apparent K, of 14 fiM is observed, a 12-fold increase relative to pH 5.5, and V,,, increases dramatically by a factor of 20 to 20 nmol/(min mg of protein).
The kinetics of D-lactate transport (Figure 9) exhibit similar properties, but the effects of nigericin and valinomycin are more exaggerated. At pH 5.5 in the absence of ionophores, transport proceeds with an apparent K, of 3 pM and a V,,, of 1.85 nmol/(min mg of protein) and is abolished by nigericin, indicating complete reliance on ApH [see Ramos & Kaback (1977b) in addition]. When valinomycin is added, moreover, V,,, increases by 84%, reflecting the compensatory increase in ApH (Table I; Ramos et al., 1976; Ramos & Kaback, 1977a,b), and the apparent Km is not altered. At pH 7.5, where A* is the sole driving force, the apparent K, for D- lactate is higher (7.1 p M ) , and V,,, increases 6-fold to 11 nmol/(min mg of protein) (Figure 9, inset).
Discussion A p p and the @-Galactoside Transport System. Accumu-
V O L . 1 9 , N O . 2 5 , 1
u . a +
0 0 2 0 4 06 (
s o 5699
FIGURE 9: Effect of Ap,+, A*, and ApH on kinetics of D-lactate transport. Initial rates of transport were measured as described in Figure 1 with vesicles that were treated with hydroxybutynoate as described under Methods in order to inactivate the membraneous D- and L-lactate dehydrogenase activities (Walsh et al., 1972). D-[ 1- I4C]Lactate (8 mCi/mmol) was used at concentrations ranging from 1.0 to 185 pM. Experiments were performed at pH 5.5 in the absence of ionophores (0) or in the presence of 2.0 pM valinomycin (0) and, as shown in the inset, a t pH 7 . 5 in the presence of 0.2 pM nigericin (A). Essentially no transport was observed at pH 5.5 in the presence of 0.2 pM nigericin.
lation of uncharged solutes such as lactose or TDG is postu- lated to occur in symport with protons (Mitchell, 1968, 1973), and this idea has been supported by a number of observations with the lac system in intact E. coli (West, 1970; West & Mitchell, 1972, 1973; Flagg & Wilson, 1977, 1978; Benta- boulet et al., 1979), right-side-out membrane vesicles (Hirata et al., 1974; Schuldiner & Kaback, 1975; Schuldiner et al., 1975; Ramos & Kaback, 1977b,c; Kaczorowski & Kaback, 1979; Kaczorowski et al., 1979; Padan et al., 1979), and in- verted membrane vesicles (Lancaster & Hinkle, 1977a,b). Accordingly, titration studies with valinomycin and nigericin demonstrate that the steady-state level of lactose accumulation is coupled to ApH+ (Ramos & Kaback, 1977b). In addition, although contradictory evidence has been presented with intact cells (Zilberstein et al., 1979; Booth et al., 1979), experiments with right-side-out vesicles suggest that above pH 6.5 the lactose concentration gradient may exceed ApH+, leading to the hypothesis that the proton/lactose stoichiometry may in- crease with pH (Rottenberg, 1976; Ramos & Kaback, 1977b,c).
Kaczorowski et al. (1979) have reported, among other ob- servations, that the most impressive effect of ApH+ on the kinetics of lactose transport is a 100-fold decrease in the ap- parent K,, and this conclusion is confirmed and extended here with both lactose and TDG. Although technically difficult to quantitate precisely, the apparent Km for lactose or TDG under completely deenergized conditions is at least two orders of magnitude higher than that observed when ApH+ is present. Furthermore, as evidenced by kinetic data obtained in the presence of valinomycin and nigericin, it appears highly likely that either ApH or A* is sufficient to bring about this decrease in apparent K,. Since A* and ApH values of less than -30 mV are difficult to measure, however, it could be argued that a residual ApH or A* remaining in the presence of nigericin or valinomycin, respectively, could be at least partially re- sponsible for the observed low apparent K,. This possibility is ruled out by experiments in which it is demonstrated that
5700 B I O C H E M I S T R Y R O B E R T S O N E T A L .
is the basis for the kinetic alteration. Finally, and paren- thetically, it is noteworthy that the kinetic observations presented here are consistent with conclusions drawn from studies with a number of (dansy1amino)alkyl @-D-galacto- pyranosides, 2-nitro-4-azidophenyl @-~-galactopyranosides, and p-nitrophenyl a-D-galactopyranoside [see Schuldiner et al. (1976) J , despite the present controversy regarding whether or not these probes are translocated across the membrane [see Overath et al. (1979)J.
In view of the paucity of knowledge regarding the molecular basis of @,+-driven active transport, it is impossible to provide a complete explanation for these phenomena in a truly sat- isfactory manner. However, the uniqueness of some of the observations, in particular the second-power relationship be- tween ApH+ and V,,,, calls for some attempt a t conceptual- ization. Thus, we suggest very tentatively and with no firm support that the lac carrier may exist in two forms, monomer and dimer, that the monomer catalyzes facilitated diffusion and the dimer active transport, and, finally, that APH+ promotes aggregation of monomers to dimers. Although much of the present data can be explained by this simplistic notion, it is readily apparent that other possibilities exist. For instance, ApH+ might cause a change in the rate-limiting step for transport without a change in the structural state of the carrier. Under conditions of facilitated diffusion, transport might be limited by deprotonation of the carrier on the inner surface of the membrane [see Kaczorowski & Kaback (1979) and Kaczorowski et al. (1 979)] while in the presence of APH+ the rate-limiting step might involve a reaction corresponding ki- netically to the return of the unloaded, negatively charged carrier to the external surface of the membrane (Schuldiner et al., 1975; Rottenberg, 1976; Ramos & Kaback, 1 9 7 7 ~ ) . Since Teather et al. (1978) have succeeded in cloning the lac y gene and amplifying its product, the lac carrier protein is readily visualized by sodium dodecyl sulfate polyacrylamide gel electrophoresis, and cross-linking experiments carried out under energized and deenergized conditions might allow a test of the former suggestion. On the other hand, it would be difficult to test the latter suggestion even if the carrier were reconstituted in a purified form. In other words, the mono- mer-dimer idea is not intended as a formal hypothesis, but merely as a suggestion that is potentially testable.
Amino Acid Transport. Although studied in considerably less detail, superficially, the amino acid transport systems in E. coli ML 308-225 vesicles respond kinetically to ApH+ and its components much like the @-galactoside transport system. As shown by Ramos & Kaback (1977b), steady-state levels of accumulation of many amino acids are coupled to ApH+, and this conclusion is extended here to include initial-rate kinetics. Thus, with each amino acid tested, regardless of valence, selective dissipation of either A\k or ApH by valino- mycin or nigericin, respectively, at pH 5.5 consistently results in diminution of V,,, in a manner that is qualitatively related to the effects of the ionophores on ApH+. In further analogy to the lac system, the apparent K , of each amino acid transport system remains essentially constant when A* or ApH is selectively dissipated by the appropriate ionophore or when the ambient pH is increased to 7.5. It should be emphasized, however, that it has not been possible thus far to document an overall effect of ApH+ on the kinetics of any of the amino acid transport systems. Nonetheless, it is particularly inter- esting that Kaczorowski et al. (1977) found that the initial rate of proline transport in E. coli M L 308-225 membrane vesicles responds exponentially to
imposition of either A* or ApH by artificial means under conditions where it is improbable that the other parameter is present (Kaczorowski et al., 1979; LeBlanc et al., 1980) causes the system to manifest a low apparent K , for lactose.
Given the observations that A\k (interior negative) or ApH (interior alkaline) independently causes a dramatic decrease in the apparent K, of the lac transport system with relatively small effects on V,,,, a detailed series of experiments were carried out in which kinetics of lactose transport were studied under conditions where A\k or ApH was dissipated selectively, and the remaining component was titrated with valinomycin or nigericin (Figure 3). The studies were performed with lactose rather than with TDG, since the former is used more commonly as a transport substrate, and values for A\k and ApH were determined independently under each set of con- ditions. It is very important, moreover, that the initial rates of transport were linear for at least 20 s a t all lactose con- centrations assayed over the entire range of A\k and ApH values tested (not shown). In other words, initial rate con- ditions were maintained as rigorously as possible. Moreover, all of the data yield linear Vvs. V / S plots (Figure 3). Sur- prisingly, the results demonstrate clearly that a t pH 5.5 and 7.5 the apparent K, remains constant, within experimental error, from -180 mV to -30 to -40 mV, while V,,, exhibits a second-power relationship with either component of ApH+ a t both ambient pH values. Furthermore, over a comparable range of ApH+ values, V,,, a t pH 7.5 is 10-fold higher than that observed at pH 5.5, an observation that is not at odds with the increase in proton/substrate stoichiometry suggested for this system (Rottenberg, 1976; Ramos & Kaback, 1977b,c).
At face value, these results appear to be contradictory, since dissipation of ApH+ would be expected to cause an increase in apparent K, with a relatively small decrease or no change in V,,, (Le., dissipation of ApH+ should yield kinetics typical of facilitated diffusion). The apparent contradiction is resolved, phenomenologically a t least, by the observations presented in Figure 5 , where initial rates of lactose transport were assayed over an extended range of lactose concentrations at pH 7.5 under three conditions. Under fully energized and deenergized conditions, as expected, the system exhibits monophasic ki- netics with apparent K, values of 0.2 and 18 mM, respectively, and V,,, values of 100 and 150-180 nmol/(min mg of pro- tein), respectively. When ApH+ is partially dissipated, however, the system exhibits biphasic kinetics, with one component manifesting the kinetic parameters of active transport and the other exhibiting the characteristics of facilitated diffusion. Thus, in addition to acting as the driving force for active transport, ApH+ appears to alter the distribution of the lac carrier between two different kinetic states. In this context, it is both interesting and important to note that Lanyi (1978) has made similar observations with the sodium-dependent serine and aspartate transport systems in Halobacterium ha- lobium envelope vesicles and suggested that these carriers may be oligomeric and possess allosteric properties. In any event, it is clear that the V,,, observed for active transport at a given value of ApH+ does not represent the turnover of the entire carrier population, but only that fraction of the population that is kinetically competent at the relatively low lactose concen- trations used to assay Ap,+-driven transport. Furthermore, the rates of covalent inactivation of the lac transport system by both diethyl pyrocarbonate (Padan et al., 1979) and a variety of maleimides (D. E. Cohn, G. J. Kaczorowski, and H. R. Kaback, unpublished experiments) are enhanced ap- proximately 3-fold in the presence of ApH+, which implies that there may be a chemical modification in the lac carrier that
A C T I V E T R A N S P O R T I N M E M B R A N E V E S I C L E S V O L . 1 9 , N O . 2 5 , 1 9 8 0 5701
D-lactate and certain other anions, accumulation of succinate at pH 5 .5 is coupled to ApH+ and not to ApH, as predicted by formal chemiosmotic considerations (Ramos & Kaback, 1977b). This conclusion is based on the demonstration that succinate accumulation is diminished by valinomycin or ni- gericin in parallel with their effects on ApH+ and that neither ionophore, particularly valinomycin, stimulates accumulation. The studies presented here support this general conclusion and reveal a subtlety of the system, that it is biased kinetically toward ApH. Thus, although valinomycin causes a 30% in- crease in V,,,, demonstrating preferential coupling to ApH, nigericin inhibits by only 50%, indicating that A 9 also plays a significant energetic role in the transport mechanism. The findings are consistent, to some extent at least, with a symport reaction in which succinic acid is translocated in coupled movement with a proton. By this means, turnover of the porter would be driven by either ApH or A*, and ApH, in addition to driving turnover of the porter, would cause dissociation of the dicarboxylic acid in the intravesicular space. A less at- tractive possibility is that the succinate porter catalyzes a heterogeneous reaction at pH 5.5. A fraction of the porters (or the same porter during different turnovers) might catalyze proton/succinic acid symport while another fraction might catalyze an electrically neutral reaction in which succinic acid is translocated and dissociates in the intravesicular space due to ApH. Although such a possibility might be expected to result in uncoupling, this is unlikely because the rate of res- piration-driven proton efflux is considerably higher than the rate of &,+-driven succinate influx. In any event, there is an impressive increase in both the apparent K, (12-fold) and the V,, (20-fold) of the succinate transport system at pH 7.5 relative to pH 5.5 which, as suggested for the lactate transport system, may reflect a change in the reaction mechanism at higher pH [i.e., an increase in proton/succinate stoichiometry (Rottenberg, 1976; Ramos & Kaback, 1977b,c; LeBlanc et al., 1980)l.
Acknowledgments
synthesizing [ 6-3H] TDG.
References Barnes, E. M., Jr., & Kaback, H. R. (1970) Proc. Natl. Acad.
Bentaboulet, M., Robin, A., & Kepes, A. (1979) Biochem.
Boonstra, J., & Konings, W. N. (1977) Eur. J. Biochem. 78,
Booth, I. R., Mitchell, W. J., & Hamilton, W. A. (1979)
Cohn, D. E., & Kaback, H. R. (1980) Biochemistry 19, 4237. Davis, B. D., & Mingioli, E. S . (1959) J. Bacteriol. 60, 17. Felle, H., Porter, J. S., Slayman, C. L., & Kaback, H. R.
Flagg, J. L., & Wilson, T. H. (1977) J . Membr. Biol. 31, 233. Flagg, J. L., & Wilson, T. H. (1978) Membr. Biochem. 1,61. Harold, F. M. (1976) Curr. Top. Bioenerg. 6, 83. Hirata, H., Altendorf, K., & Harold, F. M. (1973) Proc. Natl.
Hirata, H., Altendorf, K., & Harold, F. M. (1974) J. Biol.
Kaback, H. R. (1970) Annu. Rea. Biochem. 39, 561. Kaback, H. R. (1971) Methods Enzymol. 22, 99. Kaback, H. R. (1974a) Science (Washington, D.C.) 186, 882. Kaback, H. R. (1974b) Methods Enzymol. 31, 698. Kaback, H. R. (1976) J . Cell. Physiol. 89, 575 .
We express our appreciation to Dr. J. Steven Porter for
Sci. U.S.A. 66, 1190.
J . 178, 103.
361.
Biochem. J. 182, 687.
(1980) Biochemistry 19, 3585.
Acad. Sci. U.S.A. 70, 1804.
Chem. 249, 2939.
The glutamate-aspartate and lysine transport systems de- serve additional comment, since these systems catalyze the transport of anions and a cation, respectively, a t physiological pH. According to formal chemiosmotic theory, therefore, glutamate and aspartate transport should be coupled to ApH, while lysine transport should be driven by A*. As demon- strated by Ramos & Kaback (1977b), however, the steady- state levels of accumulation of both glutamate and lysine are coupled to ApH+, and this conclusion is supported by the kinetic studies presented here. The V,, for transport of each of these solutes is diminished when either A* or ApH is dissipated, indicating that both components of ApH+ drive turnover of the porters. With the glutamateaspartate system, the results may be rationalized by suggesting that the porter catalyzes the symport of a proton with either solute in its protonated form. The lysine system, on the other hand, presents an interesting problem in this context. In order to achieve coupling to ApH+, rather than to A\E alone, a proton(s) must be translocated in symport with lysine. However, if the ternary complex is un- charged (Rottenberg, 1976; Ramos & Kaback, 1977c), the unloaded porter would carry two negative charges, one neu- tralized by the proton and one by lysine. If this were the case, though, two positive charges would be translocated per lysine, and the steady-state level of lysine accumulation might be expected to exceed ApH+ at pH 5 . 5 , a suggestion that is in- consistent with experimental observation (Ramos & Kaback, 1977b). Alternatively, if the unloaded porter carried a single negative charge, the ternary complex would be positively charged, a possibility that can be tested experimentally [see Cohn & Kaback (1980)l. In any event, further studies on the lysine transport system should prove interesting.
&Lactate and Succinate Transport. Numerous studies with both intact E. coli (Padan et al., 1976; Ogawa et al., 1978; Navon et al., 1977; Zilberstein et al., 1979; Felle et al., 1980) and right-side-out membrane vesicles (Ramos et al., 1976; Ramos & Kaback, 1977a-c) demonstate that ApH is absent a t pH 7.5 and above. Therefore, it is difficult to explain how transport of certain organic acids and inorganic phosphate can be driven by ApH at acid pH and by A\E at alkaline pH within the framework of the chemiosmotic hypothesis unless there is an increase in proton/substrate stoichiometry with pH (Rottenberg, 1976; Ramos & Kaback, 1977b,c). In addition to more direct, recent experiments with intact cells (Taylor & Essenberg, 1979) and isolated membrane vesicles (LeBlanc et al., 1980) supporting this conclusion, the results of the kinetic studies on D-lactate and succinate transport may be interpreted in this light.
The steady-state level of D-lactate accumulation is in thermodynamic equilibrium with ApH at pH 5.5 and with A* at pH 7.5 (Ramos & Kaback, 1977b,c). Consistently, at pH 5.5, nigericin abolishes lactate transport while valinomycin causes V,,, to increase almost 2-fold with no change in ap- parent K,, alterations that reflect the changes in ApH and A* induced by the ionophores. Interestingly, at pH 7.5, in the absence of ApH, the apparent K, increases 3-4-fold and the V,,, 6-fold. Although a precise explanation cannot be given at the present time, it is apparent that these differences in kinetic parameters with pH may be related to a change in the overall mechanism of the catalytic process (Le., an increase in proton/D-lactate stoichiometry).
As opposed to the steady-state levels of accumulation of
Furthermore, when the data presented in Figure 3B of Kaczorowski et al. (1977) are replotted as in Figure 4 here, it is apparent that the relationship between the initial rate of proline uptake and A* is expo- nential to the second power.
5702 B I O C H E M I S T R Y
Kaback, H . R., & Barnes, E. M. (1971) J . Biol. Chem. 246,
Kaczorowski, G. J., & Kaback, H. R. (1979) Biochemistry
Kaczorowski, G. J., Cheung, Y.-F., & Walsh, C . (1977)
Kaczorowski, G. J., Robertson, D. E., & Kaback, H. R. (1979)
Kennedy, E. P., Rumley, M. K., & Armstrong, J. B. (1974)
Konings, W. N., & Rosenberg, H. (1978) Biochim. Biophys.
Lancaster, J. R., & Hinkle, P. (1977a) J . Bioi. Chem. 252,
Lancaster, J. R., & Hinkle, P. (1977b) J . Biol. Chem. 252,
Lanyi, J. K. (1978) Biochemistry 17, 3011. LeBlanc, G., Rimon, G., & Kaback, H. R. (1980) Biochem-
Lombardi, F. J., & Kaback, H. R. (1972) J . Biol. Chem. 247,
Lombardi, F. J., Reeves, J. P., Short, S. A., & Kaback, H.
Lowry, 0. H., Rosebrough, N. J., Farr, A. J., & Randall, R.
Mitchell, P. (1961) Nature (London) 191, 144. Mitchell, P. (1966) Biol. Reu. Cambridge Philos. SOC. 41,445. Mitchell, P. (1 968) Chemiosmotic Coupling in Oxidative and
Photosynthetic Phosphorylation, Glynn Research Ltd., Bodmin, England.
5523.
18, 3691.
Biochemistry 16, 26 19.
Biochemistry 18, 3697.
J . Biol. Chem. 249, 33.
Acta 508, 370.
7657.
7662.
istry 19, 2522.
7844.
R. (1974) Ann. N.Y . Acad. Sci. 227, 312.
J. (1951) J . Bioi. Chem. 193, 265.
Mitchell, P. (1973) J . Bioenerg. 4, 63. Mitchell, P. (1979) Eur. J . Biochem. 95, 1. Navon, G., Ogawa, S., Shulman, R. B., & Yamane, T. (1977)
Proc. Natl. Acad. Sci. U.S.A. 74, 888. Ogawa, S., Shulman, R. B., Glynn, P., Yamane, T., & Navon,
G. (1978) Biochim. Biophys. Acta 502, 45. Overath, P., Teather, R. M., Simoni, R. D., Aichele, G., &
Wilhelm, U. (1979) Biochemistry 18, 1.
R O B E R T S O N E T A L .
1978) Proc. Natl. Acad. Sci. Owen, P., & Kaback, H. R.
Owen, P., & Kaback, H. R. ( Owen, P., & Kaback, H. R. (
U.S.A. 75, 3148. 979a) Biochemistry 18, 1413. 979b) Biochemistry 18, 1422.
Padan, E., Zilberstein, D., & Rottenberg, H. (1976) Eur. J .
Padan, E., Patel, L. & Kaback, H. R. (1 979) Proc. Natl. Acad.
Ramos, S., & Kaback, H. R. (1977a) Biochemistry 16, 848. Ramos, S., & Kaback, H. R. (1977b) Biochemistry 16, 854. Ramos, S., & Kaback, H. R. (1977~) Biochemistry 16, 4271. Ramos, S., Schuldiner, S., & Kaback, H. R. (1976) Proc.
Ramos, S., Schuldiner, S., & Kaback, H R. (1979) Methods
Reenstra, W. W., Patel, L., Rottenberg, H., & Kaback, H.
Rottenberg, H. (1976) FEES Lett. 66, 159. Schuldiner, S., & Kaback, H. R. (1975) Biochemistry 14,
Schuldiner, S., Kerwar, G. K., Weil, R., & Kaback, H. R.
Schuldiner, S., Rudnick, G., Weil, R., & Kaback, H. R. (1976)
Short, S. A., Kaback, H. R., & Kohn, L. D. (1975) J . Biol.
Taylor, D. J., & Essenberg, R. C. (1979) Proc. Znt. Cong.
Teather, R. M., Muller-Hill, B., Abrutsch, U., Aichele, G.,
Tokuda, H., & Kaback, H. R. (1977) Biochemistry 16,2130. Walsh, C. T., Abeles, R. H., & Kaback, H. R. (1972) J . Bioi.
West, I. C. (1970) Biochem. Biophys. Res. Commun. 41,655. West, I. C., & Mitchell, P. (1972) J . Bioenerg. 3, 445. West, I. C., & Mitchell, P. (1973) Biochem. J . 132, 587. Zilberstein, D., Schuldiner, S., & Padan, E. (1979) Bio-
Biochem. 63, 533.
Sci. U.S.A. 76, 6221.
Natl. Acad. Sci. U.S.A. 73, 1892.
Enzymol. 55, 680.
R. (1980) Biochemistry 19, 1.
545 1.
(1975) J . Biol. Chem. 250, 1361.
Trends Biochem. Sci. (Pers. Ed.) 1, 41.
Chem. 250, 4291.
Biochem., 11 th, 460.
& Overath, P. (1978) Mol. Gen. Genet. 159, 239.
Chem. 247, 7858.
chemistry 18, 669.