
Effect of annealing on the growth dynamics of ZnPc LB thin film and its surface morphology
Upload
khangminh22Category
view
3download
0
A Surface Science and Thin Film
Approach to the Development of
Functional Materials
James Naughton
Submitted for the degree of Doctor of Philosophy
The University of York
Departments of Chemistry and Physics
September 2011
Abstract
Nanoscale properties are becoming increasingly important for the successful
utilisation of modern materials and devices, where surfaces or interfaces often
largely define functionality. It is critical to understand surface behaviour and its
impact on properties for the development of new and existing materials. Current
surface science and thin-film techniques have been utilised and developed to
investigate promising functional materials.
The surface chemistry of Au/Pd surface alloys was examined for the selective
oxidation (selox) of crotyl alcohol to crotonaldehyde. X-ray Photoelectron
Spectroscopy (XPS) and Thermal Desorption Spectroscopy (TDS) have been used
to elucidate the reaction pathway for the alcohol and the main products. Au
moderates the surface reaction by ‘turning off’ the main decomposition pathway of
the aldehyde. The amount of surface Au has a critical role in determining the
selectivity. To mimic ‘true’ selox, the influence of co-adsorbed O over the Au/Pd
alloys was also investigated. O plays an important role in aiding desorption of the
aldehyde. The exact nature and role of Au and O in moderating the reaction over
Pd(111) requires further investigation.
A key area of technological interest is field of spintronics, whereby the spin and
charge of electrons are exploited for electronics. Thin-films of Fe3O4, a promising
spin injector, were grown on a variety of substrates to characterise the
magnetic/magnetoresistive (MR) properties. The Magnetorefractive Effect (MRE),
an optical technique, was used for non-contact measurements of the MR. Despite
no difference in the MR, the MRE shows a thickness dependence, which is partly
due to the large skin-depth associated with Fe3O4. Modelling the complex dielectric
function for Fe3O4/MgO allowed simulations to be carried out of the IR and MRE
spectra. With further work, the model may be used to determine film thickness,
examine the conductivity mechanisms and their influence on the MR/MRE.
Contents
Chapter 1 – Introduction 1 1.1 – Motivation 1
1.1.1 – Advanced Functional Materials 1 1.1.2 – Surfaces and Thin-Films 1 1.1.3 – Surface Science Techniques 2 1.1.4 – Thin-Film Growth 2
1.2 – Heterogeneous catalysis 3
1.3 – Selective oxidation of alcohols by heterogeneous catalysts 6
1.3.1 – Allylic alcohols over single crystal surfaces 8 1.3.2 – Aldehyde over single crystal surfaces 9 1.3.3 – Au/Pd systems for selox 10 1.3.4 – Formation of Au/Pd(111) surface alloys 11
1.4 – Magnetic Thin-Films for Spintronics 12
1.4.1 – Giant Magnetoresistance 13 1.4.2 – Spintronics 17 1.4.3 – Half metals 20 1.4.4 – Oxide Materials for Spintronics 21 1.4.5 – Magnetite (Fe3O4) 21
1.5 – Combinatorial Methods 28
1.6 – Thesis Aims 28
1.7 – References 30
Chapter 2 – Experimental 39 2.1 – Ultra High Vacuum (UHV) Equipment 39
2.1.1 – UHV Single Crystal Chamber 39 2.1.1.1 – Manifold and adsorbates 42 2.1.1.2 – Pd crystal mounting 43
2.1.2 – Molecular Beam Epitaxy (MBE) 44 2.1.3 – Metastable De-excitation Spectroscopy (MDS) 49 2.1.4 – Combinatorial sputtering rig 50
2.2 – Composition Analysis 51
2.2.1 – X-ray Photoelectron Spectroscopy (XPS) 51 2.2.2 – Auger Electron Spectroscopy (AES) 54 2.2.3 – Ultraviolet Photoelectron Spectroscopy (UPS) 55
2.3 – Thermal Desorption Spectroscopy (TDS) 56 2.4 – Temperature Programmed XP studies 57
2.5 – Structural Analysis 58
2.5.1 – Low Energy Electron Diffraction (LEED) 58 2.5.2 – Reflection Energy Electron Diffraction (RHEED) 59 2.5.3 – Transmission Electron Microscopy (TEM) 60
2.6 – Magnetic Analysis 60
2.6.1 – Vibrating Sample Magnetometry (VSM) 60 2.6.2 – Magnetoresistive (MR) measurements 61 2.6.3 – Magnetorefractive Effect (MRE) measurements 62
2.7 – References 65 Chapter 3 – Reactivity of crotyl alcohol over Au/Pd(111) surface alloys 68 3.1 – Introduction 68 3.1.1 – Pd selox deactivation 68 3.1.2 – Au/Pd systems 70
3.2 – Results and Discussion 71 3.2.1 – Growth of Au on Pd(111) 71 3.2.1.1 – Au/Pd surface preparation 71
3.2.2 – Surface Ensembles in Au/Pd(111) surface alloys 75 3.2.2.1 – CO adsorption over Pd(111) 75 3.2.2.2 – CO adsorption over Au/Pd(111) alloys 77
3.2.3 – Crotyl alcohol reactivity over Au/Pd(111) surface alloys 81 3.2.3.1 – Temperature Programmed XPS (TP XPS) studies 81 3.2.3.2 – Temperature Programmed Desorption (TP XPS) studies 85 3.2.3.3 – Optimum Au/Pd alloy composition for crotyl alcohol selox 88
3.2.4 – Errors 90
3.3 – Conclusions 90
3.4 – References 93
Chapter 4 – Reactivity of crotonaldehyde and propene over Au/Pd(111) surface alloys 96 4.1 – Introduction 96
4.2 – Results and Discussion 97 4.2.1 – Formation of Au/Pd(111) surface alloys 97 4.2.2 – Crotonaldehyde adsorption studies 98
4.2.2.1 – Adsorption of crotonaldehyde Pd(111) 98 4.2.2.2 – Adsorption of crotonaldehyde over an unannealed 4 ML Au film on Pd(111) 99 4.2.2.3 – Adsorption of crotonaldehyde on Au/Pd(111) surface alloys 101 4.2.2.4 – Decomposition of crotonaldehyde to propene on Au/Pd(111) surfaces 103
4.2.3 – Propene adsorption 104 4.2.3.1 – Adsorption of propene on Pd(111) 104 4.2.3.2 – Adsorption of propene on 4 ML Au on Pd(111) 107 4.2.3.3 – Adsorption of propene on Au/Pd(111) surface alloys 109
4.2.4 – The effect of co-adsorbed O 112 4.2.4.1 – Adsorption of crotonaldehyde on O pre-covered Au/Pd(111) surfaces 112 4.2.4.2 – Adsorption of propene on O pre-covered Au/Pd(111) surface alloys 116
4.2.5 – The effect of Au and O2 on crotyl alcohol selox 120
4.2.6 – Errors 123
4.3 – Conclusions 123
4.4 – References 124
Chapter 5 – Meta-stable De-excitation Spectroscopy of crotyl alcohol over Pd(111) 126 5.1 – Introduction 126
5.2 – Results and Discussion 127 5.2.1 – MDS of crotyl alcohol on Pd(111) 127 5.2.2 – Density Functional Theory 131 5.2.3 – Temperature programmed MDS 137 5.2.3.1 – I. < 200 K: Low-temperature crotyl alcohol adsorption 138 5.2.3.2 – II. 200-250 K: Selox of crotyl alcohol to crotonaldehyde 142 5.2.3.3 – III. > 250 K: Decarbonylation 144
5.3 – Conclusions 145
5.4 – References 146
Chapter 6 – Magnetorefractive Effect in Fe3O4 thin-films 148 6.1 – Introduction 148
6.2 – Results and Discussion 149 6.2.1 – Preparation of Fe3O4 thin-films 149 6.2.2 – Reflectance High Energy Electron Diffraction (RHEED) 151 6.2.3 – X-ray Photoelectron Spectroscopy (XPS) 154 6.2.4 – Transmission Electron Microscopy (TEM) 156 6.2.5 – Vibrating Sample Magnetometry (VSM) 160 6.2.6 – Magnetoresistance (MR) measurements 165 6.2.7 – Skin depth measurements 166 6.2.8 – Infrared Spectroscopy 168 6.2.9 – Magnetorefractive Effect (MRE) measurements 170 6.2.10 – MRE modelling 172 6.2.10.1 – The complex dielectric function 172 6.2.10.2 – The Drude model 173
6.2.10.3 – Plasma frequency 173 6.2.10.4 – Phonon resonances 174 6.2.10.5 – Fresnel equations 174 6.2.10.6 – Modelling parameters 176 6.2.10.7 – Multiple reflections 178 6.2.10.8 – Linear approximation for thin-films 181 6.2.10.9 – Magnetic field dependence 183 6.2.10.10 – Modelling the MRE 184
6.3 – Conclusions 185
6.4 – References 186
Chapter 7 – Conclusions 191 7.1 – Conclusions 191
7.2 – References 193
Appendices: Appendix 1 A1.1 – List of Publications 194 A1.2 – Conferences/workshops attended 195 A1.3 – Awards received 195
Appendix 2 – Development of a combinatorial sputtering rig 196 A2.1 – Introduction 196 A2.2 – Results and Discussion 199
A2.2.1 – Calibration matrix 199 A2.2.1.1 – Sputter Gun Power 201 A2.2.1.2 – Sputtering time 201 A2.2.1.3 – Ar pressure 202 A2.2.1.4 – Gun angle variation 203 A2.2.1.5 – Relative deposition rates 207 A2.2.1.6 – XRF results 208
A2.2.2 – CoAg combinatorial sample 210 A2.2.3 – AuPd combinatorial sample 214 A2.3 – Future Work 215 A2.4 – Conclusions 220 A2.5 – Flux Calculations/ Scale drawings of gun angles 221 A2.6 – AuPd XRF results 223 A2.7 – References 225 Appendix 3 227 Chapters 3 and 4 - Mass Spectrometer Fragments 227 Chapter 6 227 6.1 – Cross-section TEM sample preparation 227 6.2 – Crystal lattice spacing calculation based on diffraction pattern 229 6.3 – Derivation of linear approximation (Equations 6.21 to 6.22) 233
List of Acronyms 237
List of Figures
Page
Figure 1.1 – A schematic diagram of the three growth models usually
observed for metal overlayers.
2
Figure 1.2 – Diagram of a typical supported nanoparticulate catalyst 4
Figure 1.3 – (a) A cartoon of a simple nanoparticle (truncated octahedron),
showing the different crystal faces exposed. (b) The chemistry of single
crystal surfaces can be used as experimental ‘models’ for the various surface
facets within nanoparticles.
5
Figure 1.4 - The oxidative dehydrogenation of crotyl alcohol to
crotonaldehyde.
6
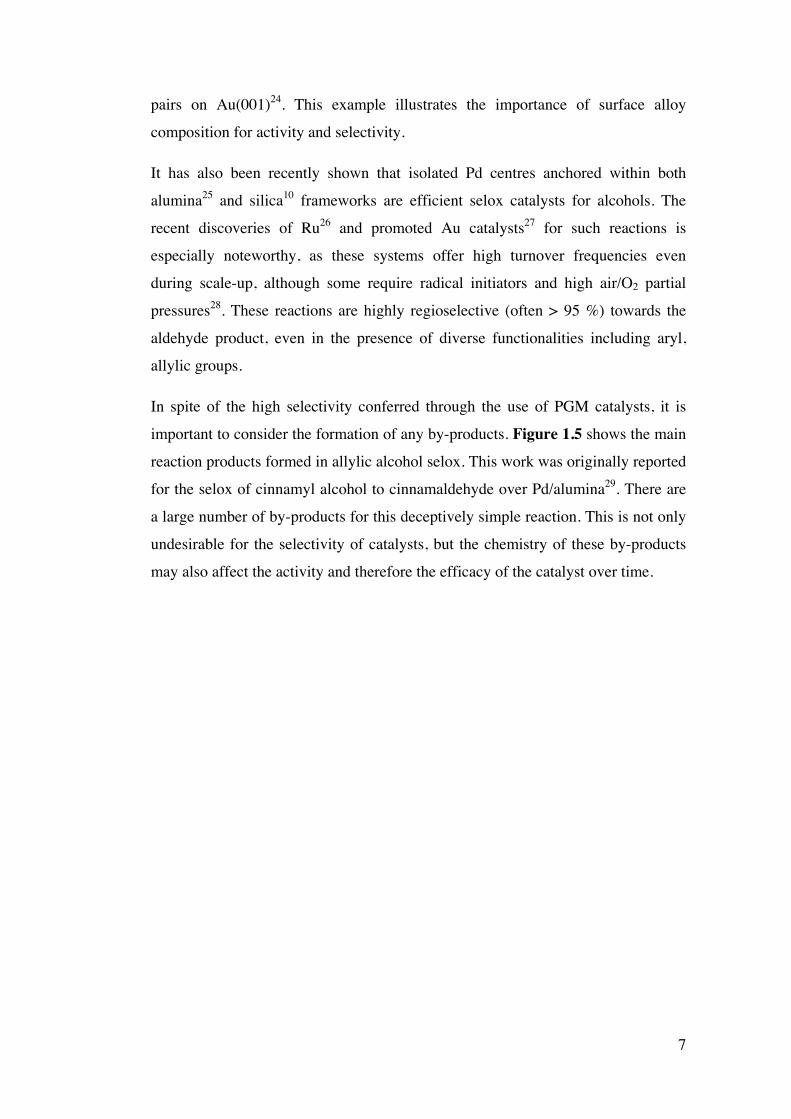
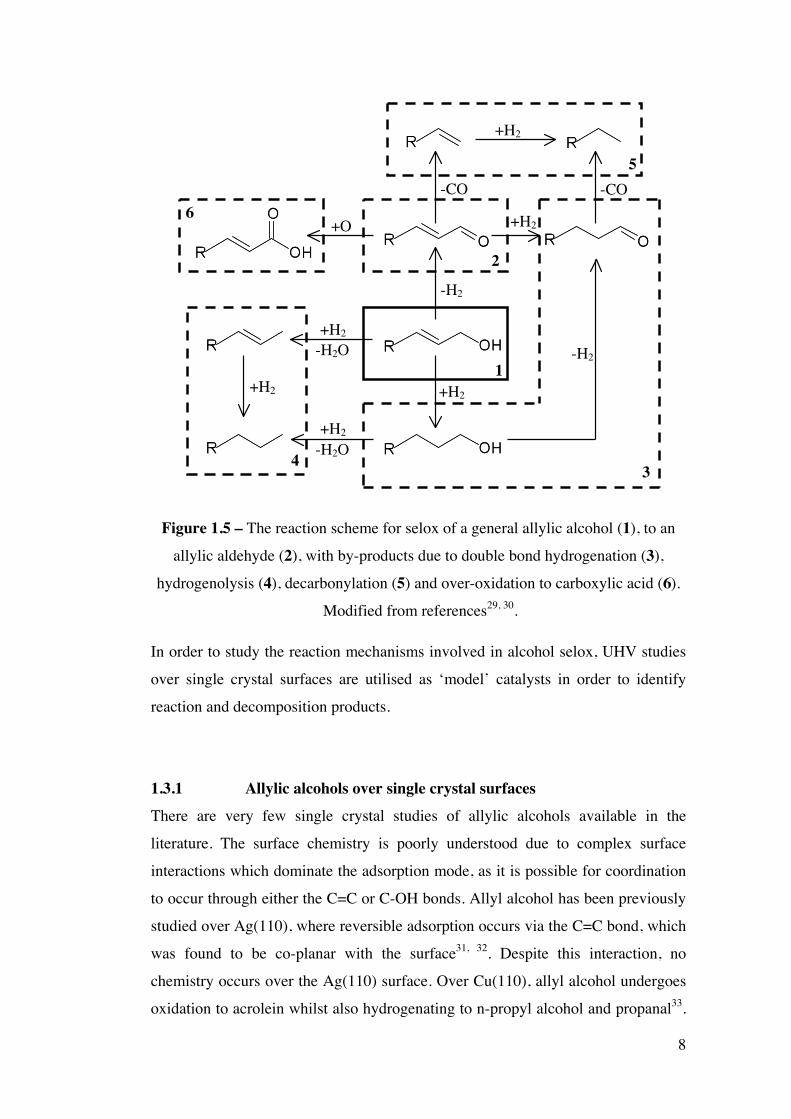
Figure 1.5 – The reaction scheme for selox of a general allylic alcohol (1),
to an allylic aldehyde (2), with by-products due to double bond
hydrogenation (3), hydrogenolysis (4), decarbonylation (5) and over-
oxidation to carboxylic acid (6). Modified from references23, 24.
8
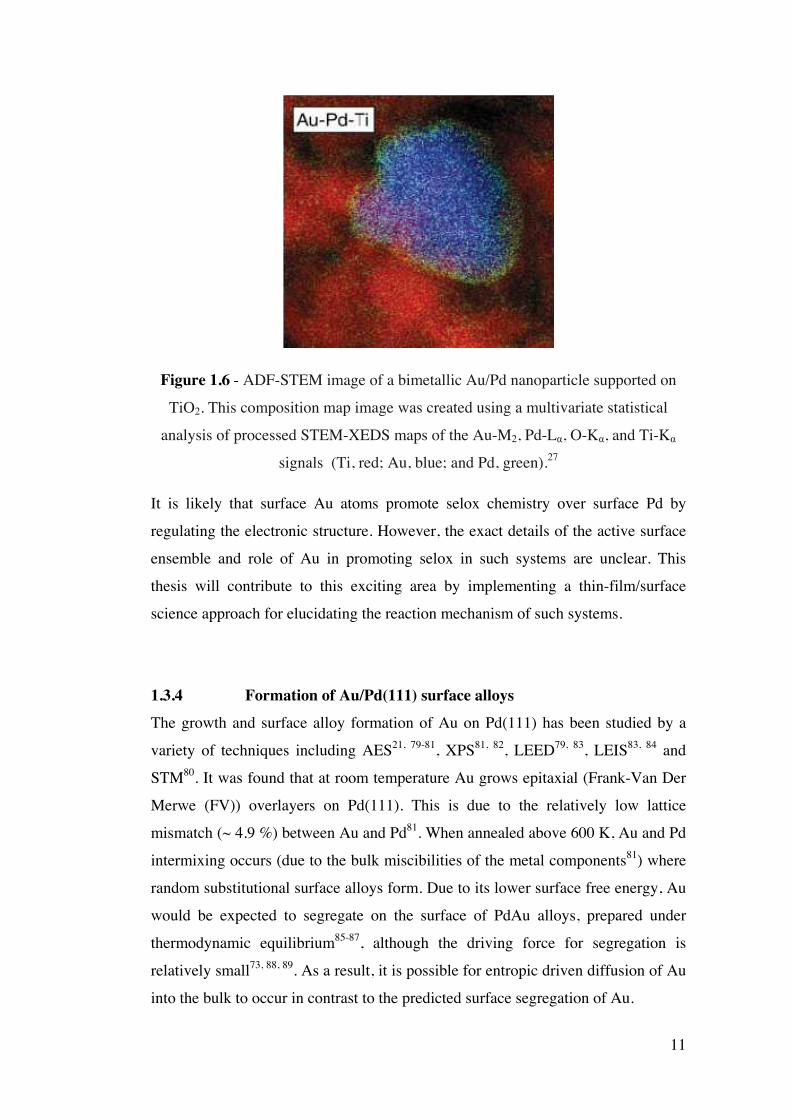
Figure 1.6 - ADF-STEM image of a bimetallic Au/Pd nanoparticle
supported on TiO2. This composition map image was created using a
multivariate statistical analysis of processed STEM-XEDS maps of the Au-
M2, Pd-Lα, O-Kα, and Ti-Kα signals (Ti, red; Au, blue; and Pd, green).21
11
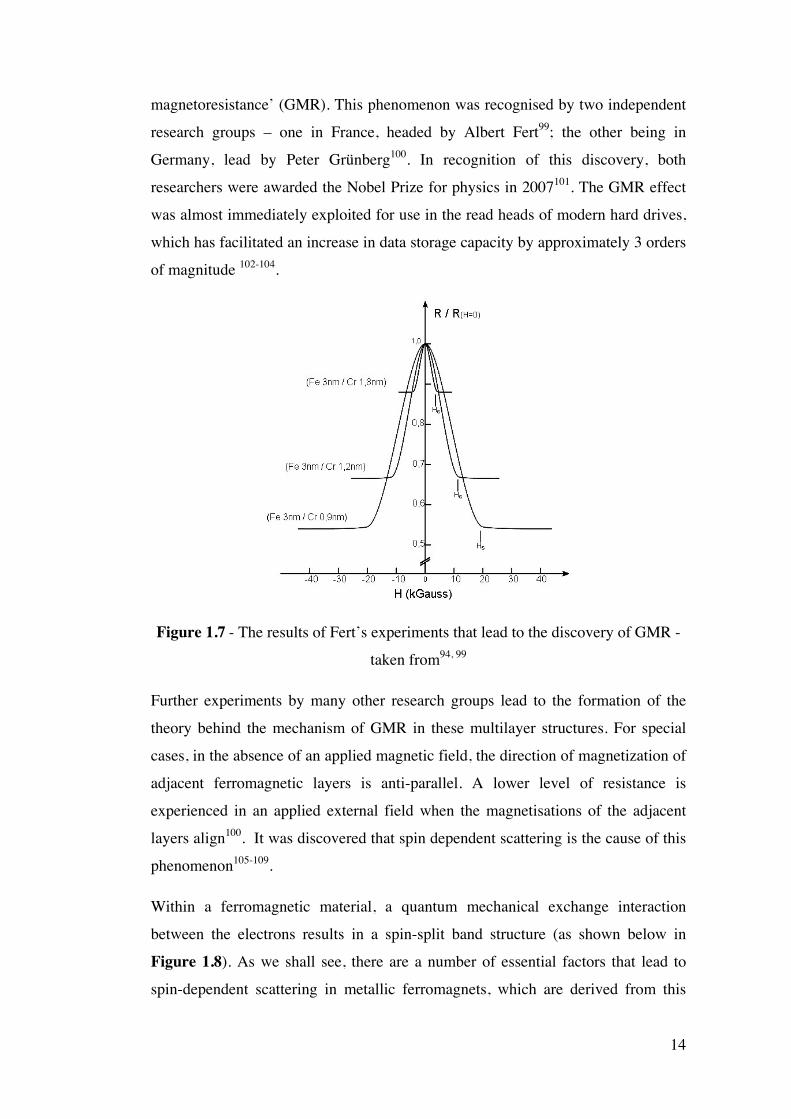
Figure 1.7 - The results of Fert’s experiments that lead to the discovery of
GMR - taken from82, 87
14
Figure 1.8 – The spin split band structure present within ferromagnetic
materials
15
Figure 1.9 - A diagram illustrating the basic theory behind giant
magnetoresistance for a simple magnetic trilayer system – adapted from93.
16
Figure 1.10 – An example of a spin valve, used as a read head in hard disks. 17
Figure 1.11 - A simple diagram representing a proposed racetrack memory 19
concept. The racetrack consists of ferromagnetic nanowire with data
encoded as a pattern of magnetic domains along a portion of the wire –
obtained from107.
Figure 1.12 - A simple diagram showing the density of states of a half-
metallic system.
20
Figure 1.13 (a) – The inverse spinel crystal structure of Fe3O4, showing the
tetrahedrally coordinated Fe3+ A site and mixed-valent (Fe2+, 3d6 / Fe3+, 3d5)
octahedrally coordinated B site (adapted from 113, 125). (b) – A simple
diagram showing the A and B sublattice configuration125. (c) – A crystal
field splitting diagram of the Fe2+ and Fe3+ 3d states, along with the itinerant
(“hopping”) electron125.
23
Figure 1.14 – The phase diagram for the iron oxygen system (modified
from Darken126 and Voogt127). α, γ, δ indicate the various phases of
metallic iron (b.c.c., f.c.c and high temperature b.c.c. respectively). W, M
and H stand for wüstite (FeO), magnetite (Fe3O4) and haematite (Fe2O3)
respectively. L stands for liquid. Dashed lines show oxygen equilibrium
pressures.
24
Figure 1.15 – (a) The APB shifts formed according to the different
translational and rotational symmetry of the initial Fe3O4 monolayer and the
MgO(100) surface (modified from Eerenstein113). Fe3O4 monolayers are
shifted relative to reference (i), forming in-plane shifts of (ii) ½[100] (iii)
¼[110]. A rotated monolayer, (iv), forms an out-of plane shift. (b) Side
profile of an Fe3O4 APB in the 110 direction on MgO(100) modified from
Arras et al.118
26
Figure 1.16 – Dark field transmission electron micrographs of APBs from
within (a) 6 nm, (b) 12 nm, (c) 25 nm and (d) 50 nm thick films of
Fe3O4/MgO(100) – taken from122
27
Figure 2.1 – Diagram of the Ultra High Vacuum Chamber 40
Figure 2.2 – A photograph of the UHV chamber used for mechanistic 41
studies of crotyl alcohol selox over model Au/Pd(111) surfaces
Figure 2.3 – Single crystal sample mounting for TDS experiments 43
Figure 2.4 - A photograph of the Northeastern MBE system used for the
preparation of thin films of Fe3O4 on MgO
45
Figure 2.5 – A diagram of the York MBE system 47
Figure 2.6 - A photograph of the York MBE system used for the
preparation of thin films of Fe3O4 on MgO
48
Figure 2.7 – A simple diagram of the combinatorial sputtering rig 50
Figure 2.8 – Schematic representation of photoionisation 52
Figure 2.9 – A simple diagram of a typical XPS experiment of a Pd(111)
surface
53
Figure 2.10 – Auger emission due to ionisation by an incident electron or
photon
55
Figure 2.11 – A schematic of a simple VSM set-up 61
Figure 2.12 – A diagram of the apparatus used to measure the
magnetoresistance of samples
62
Figure 2.13 – Colour photographs of the MRE acquisition setup: (a) A view
from above the entire setup, (b) A close-up shot of the set-up showing the
IR beam (red line)
64
Figure 2.14 - Diagram of a simple MRE setup, showing the reflection (R)
and transmission (T) of the IR beam off and through the sample
65
Figure 3.1 - Temperature Programmed X-ray Photoelectron spectra,
acquired at the ELETTRA synchrotron of the C 1s binding energy region
for a saturated crotyl alcohol adlayer (adsorbed at 100 K) over Pd(111) –
modified from source2
69
Figure 3.2 – The variation in intensity of Au 4f7/2 and Pd 3d5/2 XPS signals 72
with increasing Au deposition time
Figure 3.3 – Variation in Au/Pd surface composition as a function of
annealing temperature for a 3.9 ML Au film deposited on Pd(111) at room
temperature.
73
Figure 3.4 – A flow chart diagram illustrating the experimental procedure
devised for monitoring both the formation of surface Au/Pd alloys by XPS
and also the temperature dependent reactivity of each alloy by temperature
programmed XPS.
74
Figure 3.5 – A diagram showing atop, bridge and hollow adsorption sites
on Pd(111).
75
Figure 3.6 – In situ C 1s XP spectra during adsorption of a CO adlayer over
Pd(111) at 100 K. Inset shows fitted intensities of CO components as a
function of coverage.
76
Figure 3.7 – C 1s XP spectra of saturated CO adlayers over Au/Pd surfaces
alloys at 100 K as a function of annealing temperature. These surfaces were
prepared by the successive annealing a 3.9 ML Au/Pd(111). The bold lines
show the acquired data; whereas the thin/dashed lines show the fitted states
determined using CasaXPS software. Inset shows saturation CO coverage as
a function of annealing temperature. Pd states are highlighted by blue lines,
whereas Au states are highlighted in red.
78
Figure 3.8 - (a) Integrated C 1s XP intensities of fitted CO components for
experiments involving saturated CO adlayers adsorbed at 100 K over Au/Pd
alloys prepared by annealing a 3.9 ML Au/Pd(111) surfaces. (b) The Monte
Carlo simulation data of Pd ensembles available for CO adsorption as a
function of Au/Pd surface composition. Surface Au rapidly suppresses CO
adsorption over larger Pd ensembles.
80
Figure 3.9 - Temperature-programmed C 1s XP spectra of a saturated crotyl
alcohol adlayer prepared over an unannealed 3.9 ML Au/Pd(111) film at
82
100 K. Inset shows fitted crotyl alcohol coverage as a function of
temperature.
Figure 3.10 - Temperature-programmed C 1s XP spectra of a saturated
crotyl alcohol adlayer over an ultrathin 3.9 ML Au/Pd(111) film annealed to
973 K (XAu = 0.15)
83
Figure 3.11 - C 1s snapshot spectra during the temperature programmed
reaction of a saturated crotyl alcohol adlayer over a 3.9 ML Au/Pd(111) film
annealed to 973 K (XAu = 0.15)
84
Figure 3.12 - Integrated C 1s XP intensities of fitted crotyl alcohol,
crotonaldehyde and carbonaceous components for a saturated crotyl alcohol
adlayer adsorbed at 100 K over a 973 K (XAu = 0.15) pre-annealed 3.9 ML
Au/Pd(111) surface
85
Figure 3.13 - Thermal desorption mass spectra of a saturated crotyl alcohol
adlayer adsorbed at 100 K over 3.9 ML Au/Pd(111) films. A comparative
spectrum is shown for Pd(111).
86
Figure 3.14 - Thermal desorption mass spectra of reactively-formed
crotonaldehyde from a saturated crotyl alcohol adlayer adsorbed at 100 K
over 3.9 ML Au/Pd(111) films. A comparative spectrum is shown for
Pd(111).
87
Figure 3.15 – In situ XPS derived crotyl alcohol conversion to surface-
bound crotonaldehyde, and net decomposition to residual surface carbon as
a function of Au alloy composition. The normalised desorption yields
(determined by TDS) of reactively-formed crotonaldehyde are also shown.
89
Figure 4.1 - Thermal desorption mass spectra for the adsorption of
crotonaldehyde at 120 K over a clean Pd(111) surface. Inset shows the fitted
intensities of crotonaldehyde monolayer, multilayer and reactively formed
propene as a function of exposure.
99
Figure 4.2 - Thermal desorption mass spectra for the adsorption of
crotonaldehyde at 120 K over a thick (~ 4 ML) Au adlayer on Pd(111). Inset
100
shows the fitted intensities of the crotonaldehyde monolayer and multilayer
states as a function of exposure.
Figure 4.3 - Thermal desorption mass spectra of 3 L crotonaldehyde
adsorbed on Pd(111) and an Au/Pd(111) surface alloy (4 ML Au film
annealed to 773 K, AES Au mole fraction of 0.56) at 120 K.
102
Figure 4.4 - Thermal desorption mass spectra for the formation of propene
from the adsorption of crotonaldehyde (3 L) at 120 K over Au/Pd(111)
surface alloys. Inset shows the fitted intensities of propene as a function of
surface Au mole fraction (XAu).
104
Figure 4.5 - Thermal desorption spectra for propene over a clean Pd(111)
surface. Inset shows the fitted intensities for the propene monolayer,
multilayer and reactively formed hydrogen as a function of exposure.
Saturation coverage, θ, (0.25 ML) is assumed to be identical to that of
ethylene over both Pt(111)13 and Pd(110)14.
106
Figure 4.6 - Thermal desorption mass spectra for the adsorption propene at
over a 4 ML Au adlayer on Pd(111). Inset shows the fitted intensities for the
propene monolayer and multilayer as a function of exposure. Saturation
coverage (0.25 ML) is assumed to be identical to that of ethylene over both
Pt(111)13 and Pd(110)14.
108
Figure 4.7 - Thermal desorption mass spectra of a 3 L exposure of propene
adsorbed on Pd(111) and an Au/Pd(111) surface alloy (AES Au mole
fraction of 0.56) at 120 K.
110
Figure 4.8 - TPD series of evolved hydrogen from the adsorption of
propene over Au/Pd(111) surface alloys. Inset shows the integrated
hydrogen area resulting from methyl fragments (485 K peak). Also plotted
is the propene peak area for comparison.
111
Figure 4.9 - Thermal desorption mass spectrum of 3 L crotonaldehyde
adsorbed on an O pre-covered (60 L O2) Pd(111) and Au/Pd(111) surface
alloy (AES Au mole fraction of 0.56) at 120 K.
114
Figure 4.10 – Series of thermal desorption mass spectra for the formation of
propene from the adsorption of crotonaldehyde (3 L) at 120 K over oxygen
pre-covered (60 L O2) Au/Pd(111) surface alloys. Inset shows the fitted
intensities of propene as a function of surface Au mole fraction.
115
Figure 4.11 – Thermal desorption mass spectrum of 3 L propene adsorbed
on an oxygen pre-covered (60 L O2) Pd(111) surface, and an oxygen pre-
covered Au/Pd(111) surface alloy (AES Au mole fraction of 0.56) at 120 K.
117
Figure 4.12 – TPD series of evolved hydrogen from the adsorption of
propene over O pre-covered (60 L O2) Au/Pd(111) surface alloys. Inset
shows the integrated hydrogen area resulting from methyl fragments (485 K
peak). Also plotted is the propene peak area for comparison.
119
Figure 4.13 – The variation in the amount of reacted adsorbate for
crotonaldehyde and propene adsorption with and without co-adsorbed
oxygen as a function of the surface Au mole fraction.
122
Figure 5.1 (a) – MDS spectra from a clean Pd(111) surface where the
dominant de-excitation mechanism is resonance ionization followed by
Auger neutralization, and from a saturation coverage of crotyl alcohol where
significant Auger de-excitation takes place. (b) - DFT calculation for clean
Pd(111) showing metallic d-band states close to EF. (c) - UPS spectra for
clean Pd(111) and for a surface exposed to a saturation coverage of crotyl
alcohol at 150 K and 245 K.
130
Figure 5.2 – DFT calculated spectra for isolated crotyl alcohol and
crotonaldehyde molecules and, for comparison, the experimentally obtained
MDS spectrum of a crotyl alcohol saturated Pd surface at 150 K.
133
Figure 5.3 – The five different molecular orientations of crotyl alcohol
adsorbed on the Pd(111) surface used in DFT calculations.
134
Figure 5.4 – Density of states spectra of crotyl alcohol calculated by DFT
for the molecular adsorption states shown in Figure 5.3. The top spectrum
is that of the MDS of the alcohol on Pd shown for comparison.
136
Figure 5.5 – Temperature evolution of MDS spectra for crotyl alcohol
adsorption on clean Pd(111) at 150 K. Temperature regimes where
noticeable changes in the spectra occur are highlighted with different
colours and grouped together into three distinct adsorption regimes. Note
the non-linear temperature scale above room temperature.
137
Figure 5.6 – MDS spectra obtained at critical temperatures from a Pd(111)
substrate exposed to 3 L of crotyl alcohol at 150 K, warmed to room
temperature and then heated. Key features in the spectra are also labelled A,
B and C, the assignment of which is detailed in section 5.2.3.1.
138
Figure 5.7 – Molecular orbitals and peak analysis of the MDS data shown
in Figure 5.6 at three distinct temperature regimes. The dotted red lines
show the fitted individual components.
139
Figure 5.8 (a) – Peak positions of the first three molecular orbitals
(assigned in Figure 6) as a function of temperature. (b) – The resulting
schematic of the energy level correlation of the O n and C=C π MOs
142
Figure 6.1 – RHEED patterns recorded for MgO(111) substrates (a) as
received (1 × 1) (b) after annealing at 973 K in a furnace for 4 hours (c)
after exposure to a 100 W O plasma for 1 hour. Samples were run by Dr.
Zhuhua Cai.
152
Figure 6.2 – RHEED patterns recorded for MgO(111) substrates (a) as
received (1 × 1) (b) after annealing at 1073 K in a furnace for 6 hours (c) √3
× √3 surface reconstruction after exposure to a 100 W O plasma for 1 hour.
Samples were run by Dr. Zhuhua Cai.
153
Figure 6.3 – RHEED patterns recorded for thin-films of Fe3O4 on
reconstructed MgO(111) √3 × √3 substrates (a) ~ 10 nm Fe3O4 (b) ~ 30 nm
Fe3O4 (c) ~ 60 nm Fe3O4
154
Figure 6.4 – (a) A representative Fe 2p XP spectrum from a Fe3O4 thin-film
sample grown in the York MBE (b) A Fe 2p XP spectrum recorded from a
Fe2O3 thin-film sample grown in the York MBE, showing the characteristic
Fe3+ satellite (c) Background subtracted and fitted intensities from the York
155
Fe3O4 sample (d) Background subtracted and fitted intensities from the
York Fe2O3 sample, again showing the characteristic Fe3+ satellite.
Figure 6.5 – Cross sectional TEM of Fe3O4/MgO(111) 1 × 1 nominal
thickness of 15 nm. Inset shows the electron diffraction obtained from the
sample.
157
Figure 6.6 – High resolution cross sectional TEM of an Fe3O4 thin-film on
MgO(100), with corresponding FFT images from both the Fe3O4 and MgO
layers. This sample was prepared and imaged by Mr. James Sizeland.
158
Figure 6.7 – A representative dark field TEM plan view image of an Fe3O4
thin film. The film was lifted off the MgO(100) substrate using a
concentrated solution of (NH4)2SO4. The jagged lines in the figure
correspond to the interfaces between the APBs in the thin-film. This sample
was prepared and imaged by Mr. James Sizeland.
159
Figure 6.8 – Representative VSM hysteresis loops for Fe3O4 thin-film
samples. The series shown is for various thicknesses of Fe3O4 on
MgAl2O4(111). The inset shows the same hysteresis loops over a larger field
range.
161
Figure 6.9 – The coercivity values obtained from VSM data obtained for all
thin-film Fe3O4 samples prepared in the Northeastern and York MBEs.
162
Figure 6.10 – Remanence values obtained from VSM data obtained for all
thin-film Fe3O4 samples prepared in the Northeastern and York MBEs.
164
Figure 6.11 – A representative MR curve from a thin-film of Fe3O4 on
MgO. The MR shown in the figure is from a 100 nm Fe3O4 thin-film on
MgO(111) substrate.
165
Figure 6.12 – The skin depth calculated for thin-film Fe3O4 samples on
MgO(111).
168
Figure 6.13 – Infrared spectra recorded for the thin-film Fe3O4/MgO(111)
samples
170
Figure 6.14 – Stacked MRE spectra recorded for the Fe3O4/MgO(111)
samples.
172
Figure 6.15 – A diagram showing the electric field polarisation of light at
the Fe3O4 surface. The two polarisations result from the electric field being
perpendicular (s) and parallel (p) to the plane of incidence.
175
Figure 6.16 – A modelled infrared reflectivity spectrum for the bare MgO
substrate using the parameters from Table 7.6. For comparison, an
experimentally determined spectrum is also shown in the figure.
177
Figure 6.17 – The modelled reflectivity spectrum for a bulk Fe3O4 sample,
along with experimentally determined spectra from Gasparov70.
178
Figure 6.18 – A diagram representing a multiple reflection model for
infrared reflectivity of thin-films of Fe3O4 on MgO.
179
Figure 6.19 – Modelled infrared reflectivity spectra of various film
thicknesses of Fe3O4 for MgO (analogous to Figure 7.14).
183
Figure 6.20 – Stacked modelled MRE spectra of various film thicknesses of
Fe3O4 for MgO (analogous to Figure 7.15).
184
List of Tables
Page
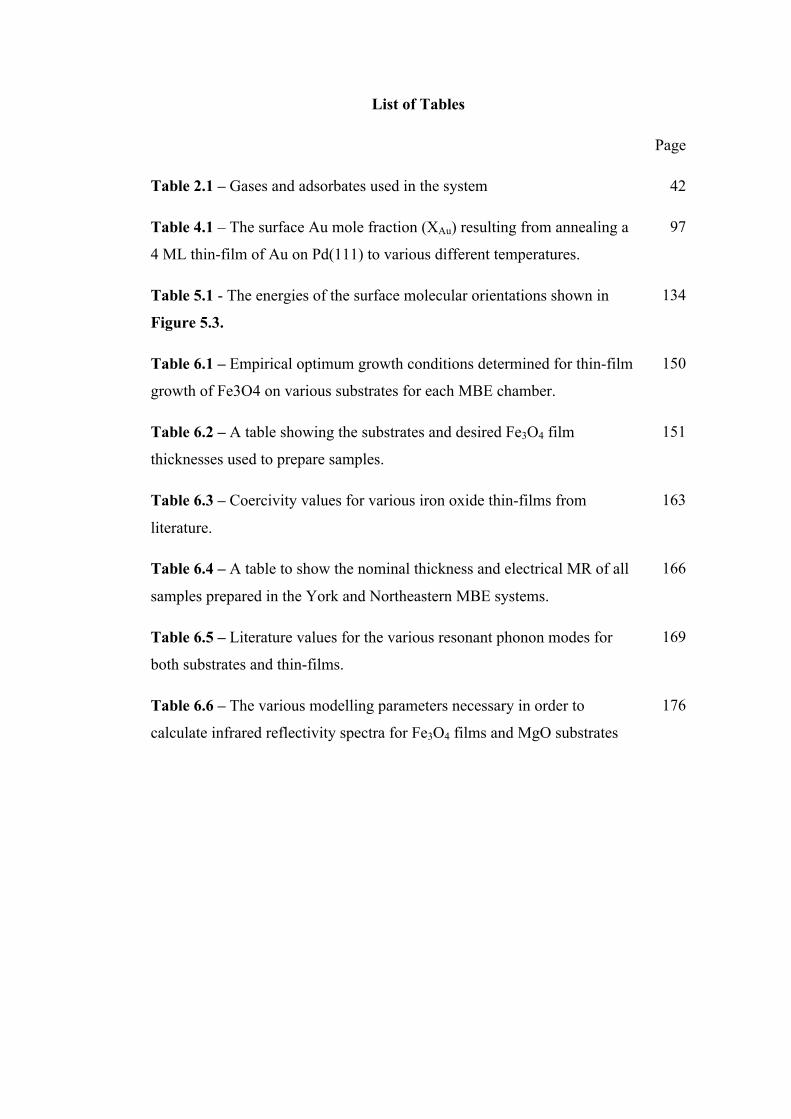
Table 2.1 – Gases and adsorbates used in the system 42
Table 4.1 – The surface Au mole fraction (XAu) resulting from annealing a
4 ML thin-film of Au on Pd(111) to various different temperatures.
97
Table 5.1 - The energies of the surface molecular orientations shown in
Figure 5.3.
134
Table 6.1 – Empirical optimum growth conditions determined for thin-film
growth of Fe3O4 on various substrates for each MBE chamber.
150
Table 6.2 – A table showing the substrates and desired Fe3O4 film
thicknesses used to prepare samples.
151
Table 6.3 – Coercivity values for various iron oxide thin-films from
literature.
163
Table 6.4 – A table to show the nominal thickness and electrical MR of all
samples prepared in the York and Northeastern MBE systems.
166
Table 6.5 – Literature values for the various resonant phonon modes for
both substrates and thin-films.
169
Table 6.6 – The various modelling parameters necessary in order to
calculate infrared reflectivity spectra for Fe3O4 films and MgO substrates
176
!
!
!
!
Acknowledgments
First and foremost, thanks should go my supervisors, Prof. Adam F. Lee, Dr. Karen
Wilson and Dr. Sarah Thompson for giving me the opportunity to carry out my
research and aiding me with every aspect of my work. Their patience, dedication
and guidance were utterly invaluable.
I would also like to thank Dr. Vlado Lazarov for his enthusiasm, good nature and
help over the past few years. Thanks also should go to Prof. Jim Matthew, whose
mathematical discussions were most stimulating and useful.
I would like to thank Dr. Kate Ziemer of Northeastern University, for the use of the
Department of Chemical Engineering MBE growth chamber, and Dr. Zhuhua Cai
(now at MIT) for help in Fe3O4 sample growth.
Thank you to all of the various members of the Cardiff Surfaces and Materials, and
York Nanophysics groups, both past and present for their friendship and help with
my work.
I would also like to thank and recognise the efforts of all of my supervisee students,
some of who helped with some of the measurements taken for this thesis.
I’d like to thank especially Mr. Andrew Vick and Dr. Simon Hackett, who helped
me out enormously during the start of my PhD.
Many thanks also to all of the workshop technicians in chemistry and physics at
York, and the station-masters at the various synchrotrons where I have carried out
experiments.
My parents have helped and supported me enormously over the past eight years at
the University of York. Love you Mum and Dad!
I’d also like to thank Coleen and Dave for their crucial help and support.
Finally, I would like to thank my darling wife Lydia, whose patience and
understanding know no bounds.
For George

Author’s Declaration
I hereby declare that the work presented in this thesis is based on my own research,
unless otherwise stated. It has neither been submitted nor accepted for any degree
at this or any other university before. Some of the results in this thesis were obtained either by colleagues or by students
under the supervision of the author and are fully acknowledged in the text.
The results within this text have also been published in journal articles and
presented at conferences; citation details can be found in the appendix.
James Naughton
September 2011
1
Chapter 1 Introduction
1.1 Motivation
1.1.1 Advanced Functional Materials The development and improvement of materials brings about huge social change
and benefits to human society. The 20th century saw rapid technological advances,
particularly due to the preparation of novel materials with specific functional
properties. Today, advanced functional materials have numerous applications in a
wide variety of fields, including the catalytic cracking of crude oil, automotive
emission treatment, fine chemical synthesis and information storage; to give but a
few examples. In order to meet the demands and challenges of the future there is an
ever-expanding need for advanced materials.
1.1.2 Surfaces and Thin-Films The surface layer plays a very important role in defining the properties of a
material. In terms of chemistry, catalysis occurs at the interface between of the
solid surface of the catalyst and the liquid or gaseous reactants. This surface
reactivity arises because of the lower surface coordination number relative to the
bulk. As we shall see, due to the complexity of dispersed solid catalysts, single
crystals and thin-films are useful ‘model’ systems for the study of heterogeneous
catalysts.
Thin-films also display novel behaviour, in that they often have properties that
greatly differ from those of their bulk counterparts, as a result of their reduced size
and dimensionality1. This divergence from bulk properties in magnetic materials
means that thin-film magnetic materials are of great technological importance1-3,
and as a result many modern electronic devices exploit thin-film architecture.
Research into thin-film magnetism is therefore critical to meet consumer demands
in terms of faster devices with increased data storage capacity.
2
1.1.3 Surfaces Science Techniques Surface science techniques that operate in ultra-high vacuum (UHV) and/or high
vacuum (HV) regimes allow us to understand the fundamental properties of
surfaces and thin-films. This often involves the preparation and characterisation of
many samples in-situ and can afford unique advantages over classical wet chemical
methods. As advanced functional materials are complex, the rate-limiting factor in
their development is often the empirical trial-and-error method of synthesis and ex-
situ characterisation4.
The preparation and in-situ characterisation of experimental models of different
compositions within a single set of experiments would therefore help to accelerate
the development of functional materials. This involves the deposition of material
by evaporation, or co-sputter deposition of different metals in UHV or HV to form
thin films on substrates. Surface analytic techniques then allow molecular level
insight into important surface processes.
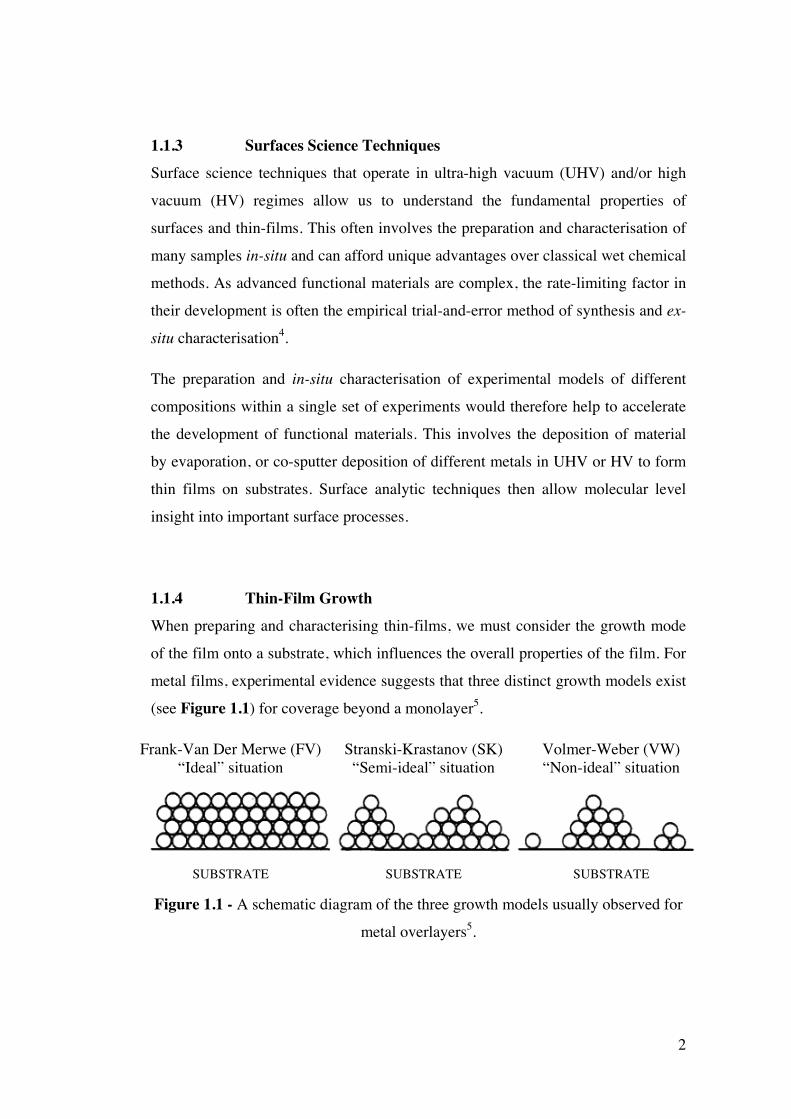
1.1.4 Thin-Film Growth When preparing and characterising thin-films, we must consider the growth mode
of the film onto a substrate, which influences the overall properties of the film. For
metal films, experimental evidence suggests that three distinct growth models exist
(see Figure 1.1) for coverage beyond a monolayer5.
Frank-Van Der Merwe (FV) “Ideal” situation
Stranski-Krastanov (SK) “Semi-ideal” situation
Volmer-Weber (VW) “Non-ideal” situation
SUBSTRATE SUBSTRATE SUBSTRATE
Figure 1.1 - A schematic diagram of the three growth models usually observed for
metal overlayers5.
3
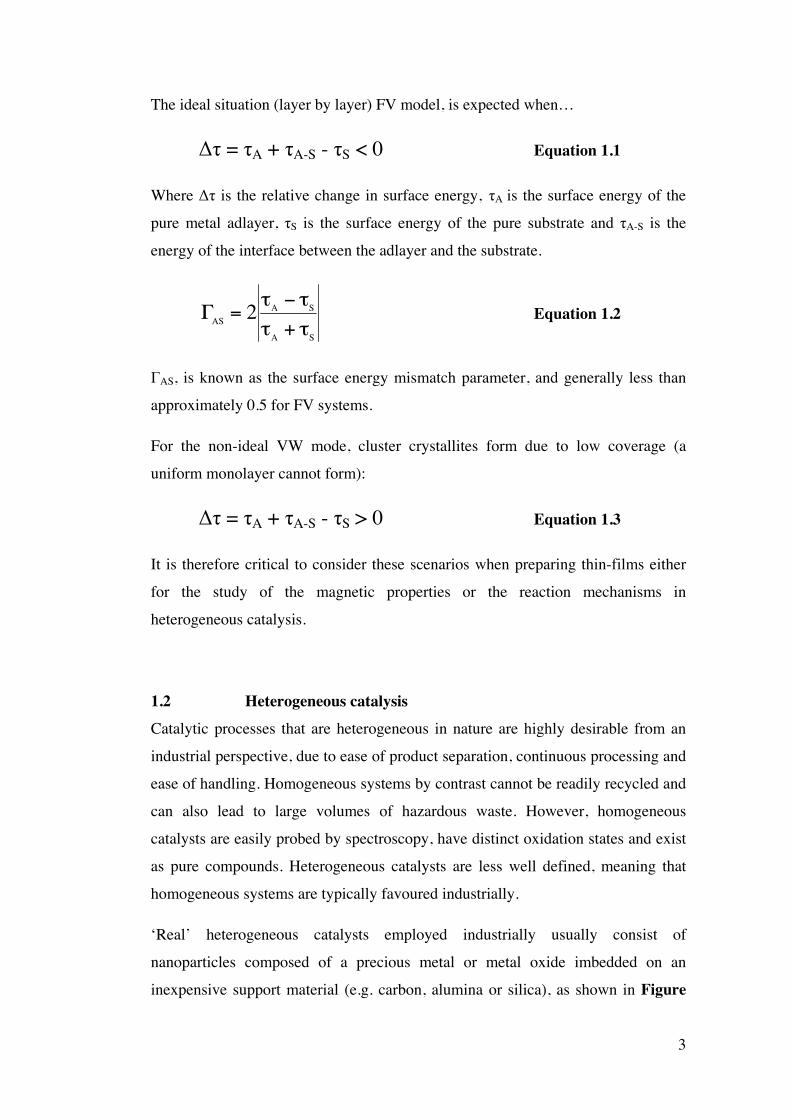
The ideal situation (layer by layer) FV model, is expected when…
∆τ = τA + τA-S - τS < 0 Equation 1.1
Where ∆τ is the relative change in surface energy, τA is the surface energy of the
pure metal adlayer, τS is the surface energy of the pure substrate and τA-S is the
energy of the interface between the adlayer and the substrate.
SA
SAAS 2
τ+ττ−τ
=Γ Equation 1.2
ΓAS, is known as the surface energy mismatch parameter, and generally less than
approximately 0.5 for FV systems.
For the non-ideal VW mode, cluster crystallites form due to low coverage (a
uniform monolayer cannot form):
∆τ = τA + τA-S - τS > 0 Equation 1.3
It is therefore critical to consider these scenarios when preparing thin-films either
for the study of the magnetic properties or the reaction mechanisms in
heterogeneous catalysis.
1.2 Heterogeneous catalysis Catalytic processes that are heterogeneous in nature are highly desirable from an
industrial perspective, due to ease of product separation, continuous processing and
ease of handling. Homogeneous systems by contrast cannot be readily recycled and
can also lead to large volumes of hazardous waste. However, homogeneous
catalysts are easily probed by spectroscopy, have distinct oxidation states and exist
as pure compounds. Heterogeneous catalysts are less well defined, meaning that
homogeneous systems are typically favoured industrially.
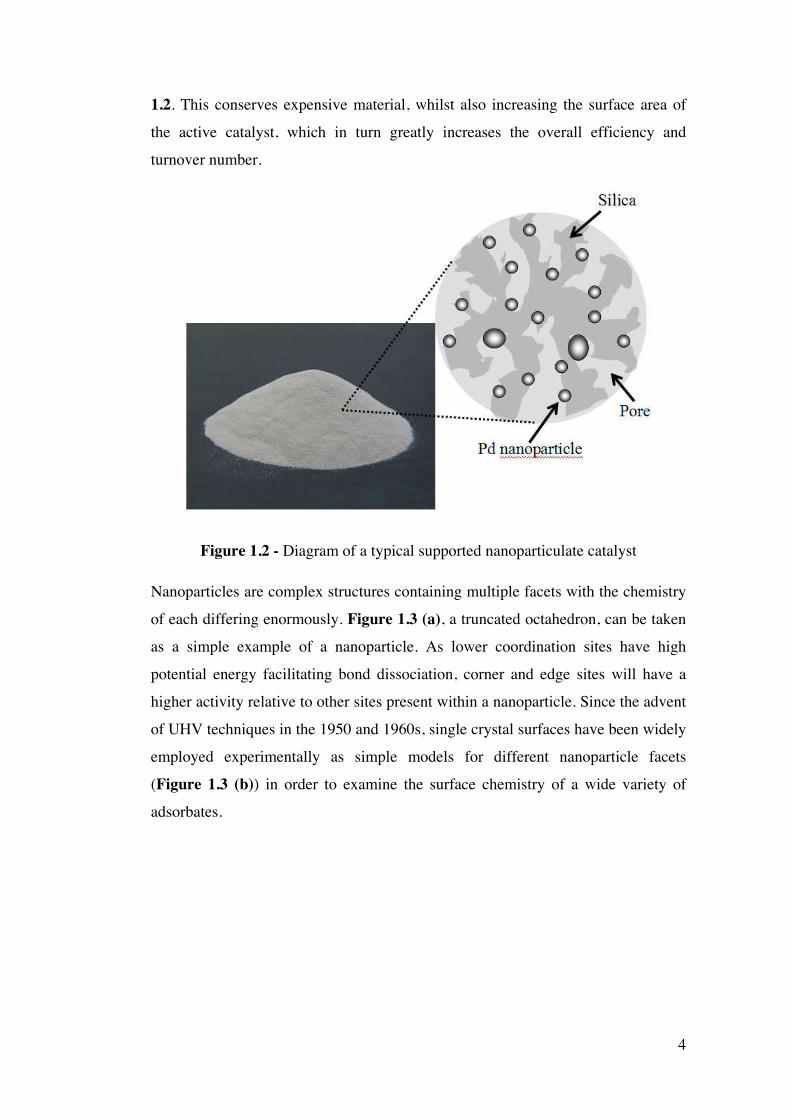
‘Real’ heterogeneous catalysts employed industrially usually consist of
nanoparticles composed of a precious metal or metal oxide imbedded on an
inexpensive support material (e.g. carbon, alumina or silica), as shown in Figure
4
1.2. This conserves expensive material, whilst also increasing the surface area of
the active catalyst, which in turn greatly increases the overall efficiency and
turnover number.
Figure 1.2 - Diagram of a typical supported nanoparticulate catalyst
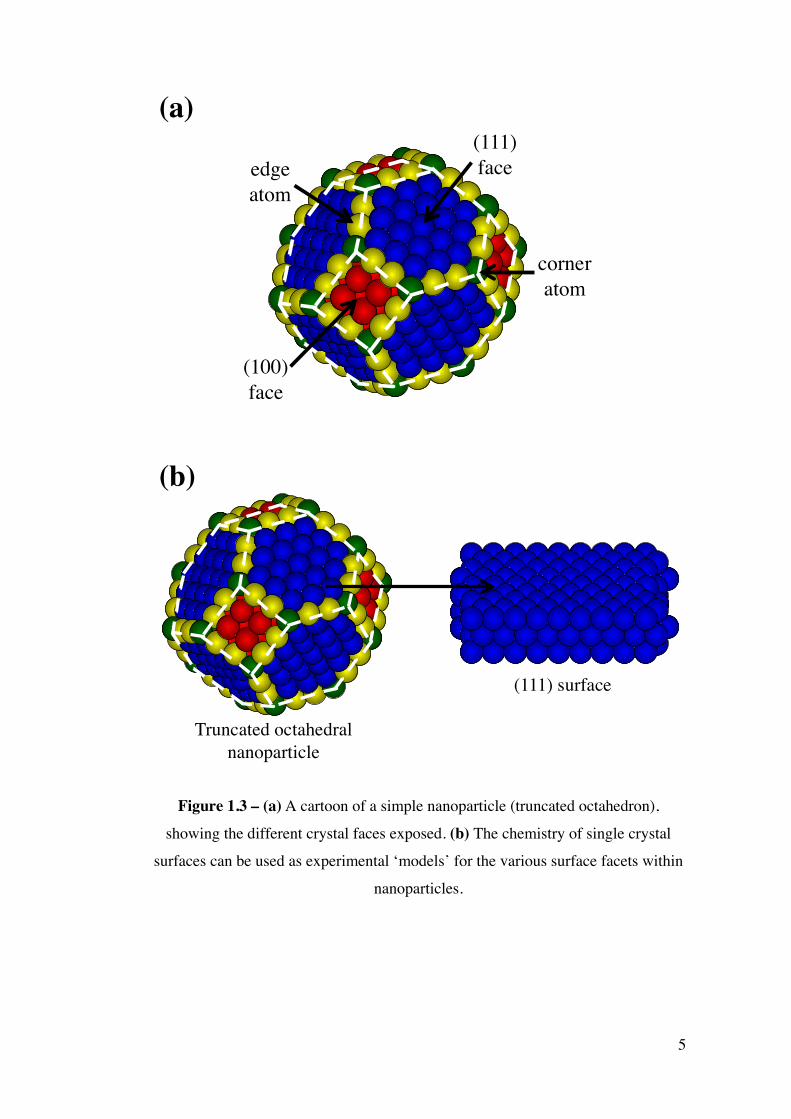
Nanoparticles are complex structures containing multiple facets with the chemistry
of each differing enormously. Figure 1.3 (a), a truncated octahedron, can be taken
as a simple example of a nanoparticle. As lower coordination sites have high
potential energy facilitating bond dissociation, corner and edge sites will have a
higher activity relative to other sites present within a nanoparticle. Since the advent
of UHV techniques in the 1950 and 1960s, single crystal surfaces have been widely
employed experimentally as simple models for different nanoparticle facets
(Figure 1.3 (b)) in order to examine the surface chemistry of a wide variety of
adsorbates.
5
(a)
(b)
(111) face
(100) face
corner atom
edge atom
(111) surface
Truncated octahedral nanoparticle
Figure 1.3 – (a) A cartoon of a simple nanoparticle (truncated octahedron),
showing the different crystal faces exposed. (b) The chemistry of single crystal
surfaces can be used as experimental ‘models’ for the various surface facets within
nanoparticles.
6
1.3 Selective oxidation of alcohols by heterogeneous catalysts The aerobic selective oxidation (selox) of alcohols by heterogeneous catalysts is a
novel way to synthesise a wide range of important fine chemical and
pharmaceutical intermediates6, 7. These powerful catalytic technologies have the
potential to replace stoichiometric inorganic oxidants such as CrVI salts or
expensive homogeneous complexes (e.g. Mn salens), and their associated process
disadvantages and safety issues8.
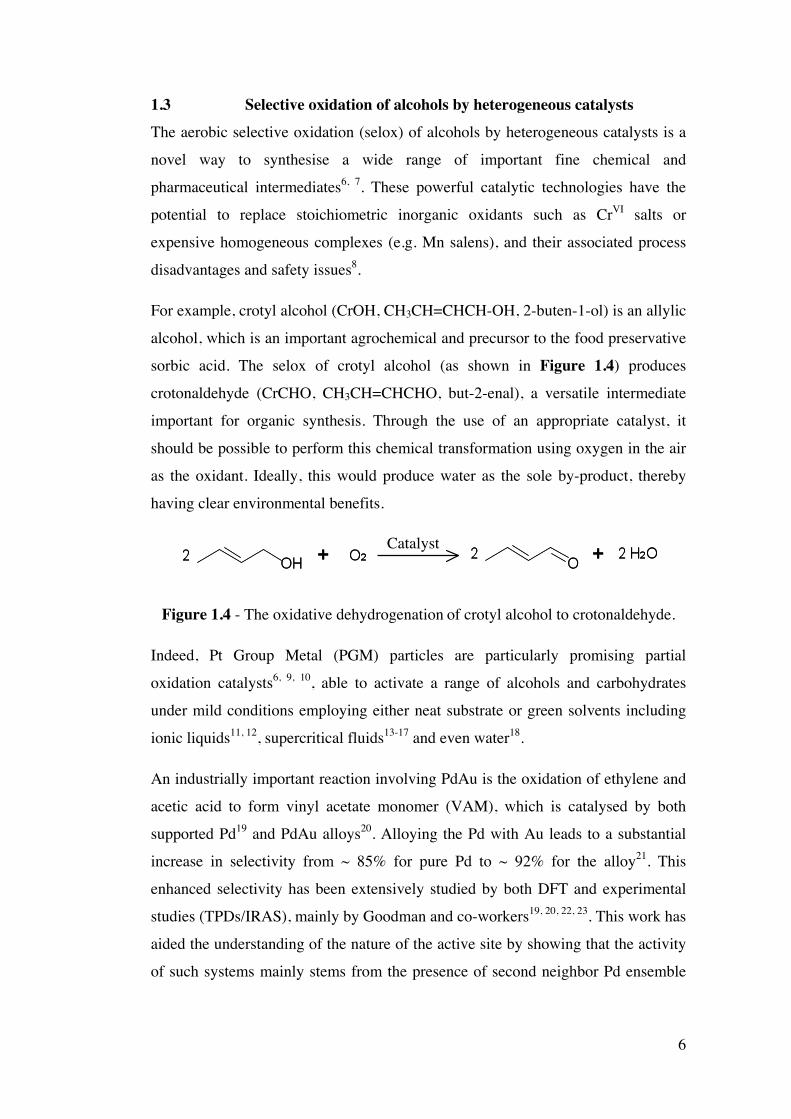
For example, crotyl alcohol (CrOH, CH3CH=CHCH-OH, 2-buten-1-ol) is an allylic
alcohol, which is an important agrochemical and precursor to the food preservative
sorbic acid. The selox of crotyl alcohol (as shown in Figure 1.4) produces
crotonaldehyde (CrCHO, CH3CH=CHCHO, but-2-enal), a versatile intermediate
important for organic synthesis. Through the use of an appropriate catalyst, it
should be possible to perform this chemical transformation using oxygen in the air
as the oxidant. Ideally, this would produce water as the sole by-product, thereby
having clear environmental benefits.
Figure 1.4 - The oxidative dehydrogenation of crotyl alcohol to crotonaldehyde.
Indeed, Pt Group Metal (PGM) particles are particularly promising partial
oxidation catalysts6, 9, 10, able to activate a range of alcohols and carbohydrates
under mild conditions employing either neat substrate or green solvents including
ionic liquids11, 12, supercritical fluids13-17 and even water18.
An industrially important reaction involving PdAu is the oxidation of ethylene and
acetic acid to form vinyl acetate monomer (VAM), which is catalysed by both
supported Pd19 and PdAu alloys20. Alloying the Pd with Au leads to a substantial
increase in selectivity from ~ 85% for pure Pd to ~ 92% for the alloy21. This
enhanced selectivity has been extensively studied by both DFT and experimental
studies (TPDs/IRAS), mainly by Goodman and co-workers19, 20, 22, 23. This work has
aided the understanding of the nature of the active site by showing that the activity
of such systems mainly stems from the presence of second neighbor Pd ensemble
Catalyst
7
pairs on Au(001)24. This example illustrates the importance of surface alloy
composition for activity and selectivity.
It has also been recently shown that isolated Pd centres anchored within both
alumina25 and silica10 frameworks are efficient selox catalysts for alcohols. The
recent discoveries of Ru26 and promoted Au catalysts27 for such reactions is
especially noteworthy, as these systems offer high turnover frequencies even
during scale-up, although some require radical initiators and high air/O2 partial
pressures28. These reactions are highly regioselective (often > 95 %) towards the
aldehyde product, even in the presence of diverse functionalities including aryl,
allylic groups.
In spite of the high selectivity conferred through the use of PGM catalysts, it is
important to consider the formation of any by-products. Figure 1.5 shows the main
reaction products formed in allylic alcohol selox. This work was originally reported
for the selox of cinnamyl alcohol to cinnamaldehyde over Pd/alumina29. There are
a large number of by-products for this deceptively simple reaction. This is not only
undesirable for the selectivity of catalysts, but the chemistry of these by-products
may also affect the activity and therefore the efficacy of the catalyst over time.
8
-CO -CO
-H2
+H2
+H2 -H2O
+H2 -H2O
+O +H2
-H2 1
2
5
6
4 3
+H2
Figure 1.5 – The reaction scheme for selox of a general allylic alcohol (1), to an
allylic aldehyde (2), with by-products due to double bond hydrogenation (3),
hydrogenolysis (4), decarbonylation (5) and over-oxidation to carboxylic acid (6).
Modified from references29, 30.
In order to study the reaction mechanisms involved in alcohol selox, UHV studies
over single crystal surfaces are utilised as ‘model’ catalysts in order to identify
reaction and decomposition products.
1.3.1 Allylic alcohols over single crystal surfaces There are very few single crystal studies of allylic alcohols available in the
literature. The surface chemistry is poorly understood due to complex surface
interactions which dominate the adsorption mode, as it is possible for coordination
to occur through either the C=C or C-OH bonds. Allyl alcohol has been previously
studied over Ag(110), where reversible adsorption occurs via the C=C bond, which
was found to be co-planar with the surface31, 32. Despite this interaction, no
chemistry occurs over the Ag(110) surface. Over Cu(110), allyl alcohol undergoes
oxidation to acrolein whilst also hydrogenating to n-propyl alcohol and propanal33.
+H2
9
For Rh(111), vibrational and desorption work showed that at low temperature an
allyl alkoxide intermediate was formed34. It is thought that this intermediates binds
strongly through both the oxygen and alkene functionalities. It is this interaction
which leads to strong C=C binding, responsible for decarbonylation.
DFT calculations show that allyl alcohol adsorbs with a di-σ coordination over both
Pt(111) and Pd(111), an interaction which is also augmented by a much weaker
interaction through the C-OH functionality35. Binding to the surface through
multiple functionalities may explain the different reaction mechanisms observed
experimentally.
Previous work by the York Surface Chemistry and Catalysis group at the
ELETTRA synchrotron on the selox of crotyl alcohol to crotonaldehyde over
Pd(111), identified secondary decarbonylation reactions as the major factor in the
deactivation of practical monometallic Pd selox catalysts36. This work will be
discussed in more detail in chapter 3. This thesis will augment this research area
through the further investigation of the mechanism of alcohol selox over Pd using
surface science techniques.
1.3.2 Aldehydes over single crystal surfaces As with alcohols, there is a general dearth of knowledge regarding the surface
chemistry of aldehydes over metallic single crystal surfaces. The thermal chemistry
of formaldehyde has been previously studied over Cu(100)9, Cu(110)37, 38,
Fe(100)39, Pt(110)40, Pt(111)41, Rh(111)42 and V(100)43. It was discovered that
formaldehyde spontaneously polymerises to disordered poly(oxymethylene)
species over Cu and Rh, which either desorb or decompose upon heating.
Acetaldehyde also polymerises over Pt(111)41, 44, Pd (110) and (111)45, 46, in
competition with decarbonylation to methane and CO. Propionaldehyde has also
been studied over Pd(110)/(111)45 and Ni/Pt(111)47 surfaces, which favour
decarbonylation to ethene.
Even less is known regarding unsaturated aldehydes, although acrolein has been
investigated on Au(111)48, Pt(111)49-52, and Ni/Pt(111)53 with decarbonylation or
reduction to propene, ketene or alcohols prevalent over group 10 surfaces.
10
Crotonaldehyde has been studied over Cu(111)54, Pt(111)49, 50 and Sn/Pt(111)55, 56
single crystal surfaces, with decarbonylation to CO and propene the dominant
reaction pathway 55, 57-59.
1.3.3 Au/Pd systems for selox Bimetallic systems frequently display properties which are significantly different
from their component metals 5, 60. As a result, many of these bimetallic alloys show
an enhanced catalytic activity, selectivity or stability when compared to their
monometallic counterparts. In particular, Pd/Au systems have displayed improved
or even ‘tunable’ properties when compared to pure Pd or Au catalysts61-63.
Numerous investigations have focussed on the catalysis of many different reactions
by Pd-Au systems including the oxidation of glycerol64, 65, hydrogen peroxide
synthesis63, 66, 67, the cyclisation of acetylene to benzene68-70, and the
hydrodechlorinaion of dichlorofluoromethane71 to name but a few. Recently,
various computational studies have also been conducted in order to understand the
composition and reactivity of such systems72, 73.
In particular, there has been significant interest in Au-Pd systems as catalysts for
selective oxidation reactions74-76. A major breakthrough occurred when Hutchings
et al61, discovered that by combining Pd and Au over a titania support 25-fold rate
enhancements for alcohol oxidation under mild solvent-free conditions were
possible. The introduction of Au also improves selectivities to aldehydes and
ketones compared to pure Pd.
High-resolution STEM chemical mapping of these nanoparticles27 indicates that the
active nanoparticles possess a Pd-rich shell encapsulating a Au-rich core62, 63, 77, 78
(as shown in Figure 1.6), and it is likely that surface Au atoms are crucial in
regulating the electronic structure and thereby promoting selox chemistry over
surface Pd. The details of the active surface ensemble and role of Au in promoting
selox were unknown however, making such systems ideal for investigation by
utilising ‘model’ single crystal studies by in situ XPS using synchrotron radiation.
11
Figure 1.6 - ADF-STEM image of a bimetallic Au/Pd nanoparticle supported on
TiO2. This composition map image was created using a multivariate statistical
analysis of processed STEM-XEDS maps of the Au-M2, Pd-Lα, O-Kα, and Ti-Kα
signals (Ti, red; Au, blue; and Pd, green).27
It is likely that surface Au atoms promote selox chemistry over surface Pd by
regulating the electronic structure. However, the exact details of the active surface
ensemble and role of Au in promoting selox in such systems are unclear. This
thesis will contribute to this exciting area by implementing a thin-film/surface
science approach for elucidating the reaction mechanism of such systems.
1.3.4 Formation of Au/Pd(111) surface alloys The growth and surface alloy formation of Au on Pd(111) has been studied by a
variety of techniques including AES21, 79-81, XPS81, 82, LEED79, 83, LEIS83, 84 and
STM80. It was found that at room temperature Au grows epitaxial (Frank-Van Der
Merwe (FV)) overlayers on Pd(111). This is due to the relatively low lattice
mismatch (~ 4.9 %) between Au and Pd81. When annealed above 600 K, Au and Pd
intermixing occurs (due to the bulk miscibilities of the metal components81) where
random substitutional surface alloys form. Due to its lower surface free energy, Au
would be expected to segregate on the surface of PdAu alloys, prepared under
thermodynamic equilibrium85-87, although the driving force for segregation is
relatively small73, 88, 89. As a result, it is possible for entropic driven diffusion of Au
into the bulk to occur in contrast to the predicted surface segregation of Au.
12
Recent theoretical analyses for Au/Pd(111) alloy surfaces suggests weak repulsion
between Au and Pd atoms may drive local ordering90. The higher the annealing
temperature, the more Pd rich the surface alloys become. In this way, in a single set
of experiments an Au overlayer can be deposited and then annealed to various
different temperatures in order to produce a range of Au/Pd(111) surface alloys in
order to study the chemistry of such surfaces. The formation and reactivity of
Au/Pd(111) surface alloys will be discussed in more detail in chapters 3 and 4.
1.4 Magnetic Thin-Films for Spintronics Depending upon how a given material responds to an external magnetic field, it can
be classified as diamagnetic, paramagnetic, antiferromagnetic or
ferromagnetic/ferrimagnetic. Most elements in the periodic table are diamagnetic,
meaning they have a weak, negative susceptibility to magnetic fields. This means
that such materials are slightly repelled by the external field and magnetic
properties are not retained when the external field is removed1. Diamagnetic
properties arise from the realignment of the electron pairs.
Paramagnetic materials have a very small, positive susceptibility to magnetic
fields. These materials are slightly attracted by a magnetic field and the material
does not retain the magnetic properties when the external field is removed.
Paramagnetic properties are due to the presence of some unpaired electrons, and
from the realignment of the electron paths caused by the external magnetic field1.
Paramagnetic materials include magnesium, molybdenum, lithium, and tantalum.
Ferromagnetic materials have a large, positive susceptibility to an external
magnetic field. They exhibit a strong attraction to magnetic fields and are able to
retain their magnetic properties after the external field has been removed.
Ferromagnetic materials have some unpaired electrons so their atoms have a net
magnetic moment. They get their strong magnetic properties due to the presence of
magnetic domains. In these domains, large numbers of atom's moments are aligned
parallel so that the magnetic force within the domain is strong91. When a
ferromagnetic material is in the un-magnetised state, the domains are nearly
randomly organised and the net magnetic field for the part as a whole is zero.
13
When a magnetizing force is applied, the domains become aligned to produce a
strong magnetic field within the part. Iron, nickel, and cobalt are examples of
ferromagnetic materials. Components with these materials are commonly inspected
using the magnetic particle method.
Antiferromagnetic materials are those in which the neighbouring spins are aligned
antiparallel to one another, so that their magnetic moments cancel. Therefore an
antiferromagnet produces no spontaneous magnetisation and shows only feeble
magnetism. The magnetic susceptibility of such materials is of the same order as
that of paramagnetic materials91. Antiferromagnets can be therefore thought of as
being paramagnetic substances with a characteristic temperature at which the
magnetic susceptibility shows a pronounced maximum92.
Ferrimagnets behave similarly to ferromagnets, in that they exhibit a spontaneous
magnetisation below some critical temperature Tc, even in the absence of an
applied field. In fact, ferrimagnets are also related to antiferromagnets, in that the
exchange coupling between adjacent magnetic ions leads to antiparallel alignment
of the localised moments. The overall magnetisation occurs because the
magnetisation of one sublattice is greater that that of the oppositely orientated
sublattice1. The fact that ferrimagnets are ionic solids means that they are
electrically insulating, whereas most ferromagnets are metals.
Magnetic materials can be found almost everywhere in our every-day modern lives
and thin-films are of particular technological interest. Research into this field began
in the 1970’s with the advent of UHV technologies (particularly that of molecular
beam epitaxy93), which allowed precise crystallographic control over the growth of
thin-films. The study of thin-film magnetism itself has aided the understanding of
the fundamental physics of magnetism1-3, 94-98, which, in turn, has had important
ramifications for magnetic data storage, exemplified by the discovery of Giant
Magnetoresistance.
1.4.1 Giant Magnetoresistance In the late 1980’s it was discovered that when materials composed of multilayers of
Fe and a non-magnetic spacing layer (e.g. Cr) were placed in a magnetic field, the
overall electrical resistance for the material would decrease by as much as 80%
(see Figure 1.7). Due to the nature of this effect, it was given the name ‘giant
14
magnetoresistance’ (GMR). This phenomenon was recognised by two independent
research groups – one in France, headed by Albert Fert99; the other being in
Germany, lead by Peter Grünberg100. In recognition of this discovery, both
researchers were awarded the Nobel Prize for physics in 2007101. The GMR effect
was almost immediately exploited for use in the read heads of modern hard drives,
which has facilitated an increase in data storage capacity by approximately 3 orders
of magnitude 102-104.
Figure 1.7 - The results of Fert’s experiments that lead to the discovery of GMR -
taken from94, 99
Further experiments by many other research groups lead to the formation of the
theory behind the mechanism of GMR in these multilayer structures. For special
cases, in the absence of an applied magnetic field, the direction of magnetization of
adjacent ferromagnetic layers is anti-parallel. A lower level of resistance is
experienced in an applied external field when the magnetisations of the adjacent
layers align100. It was discovered that spin dependent scattering is the cause of this
phenomenon105-109.
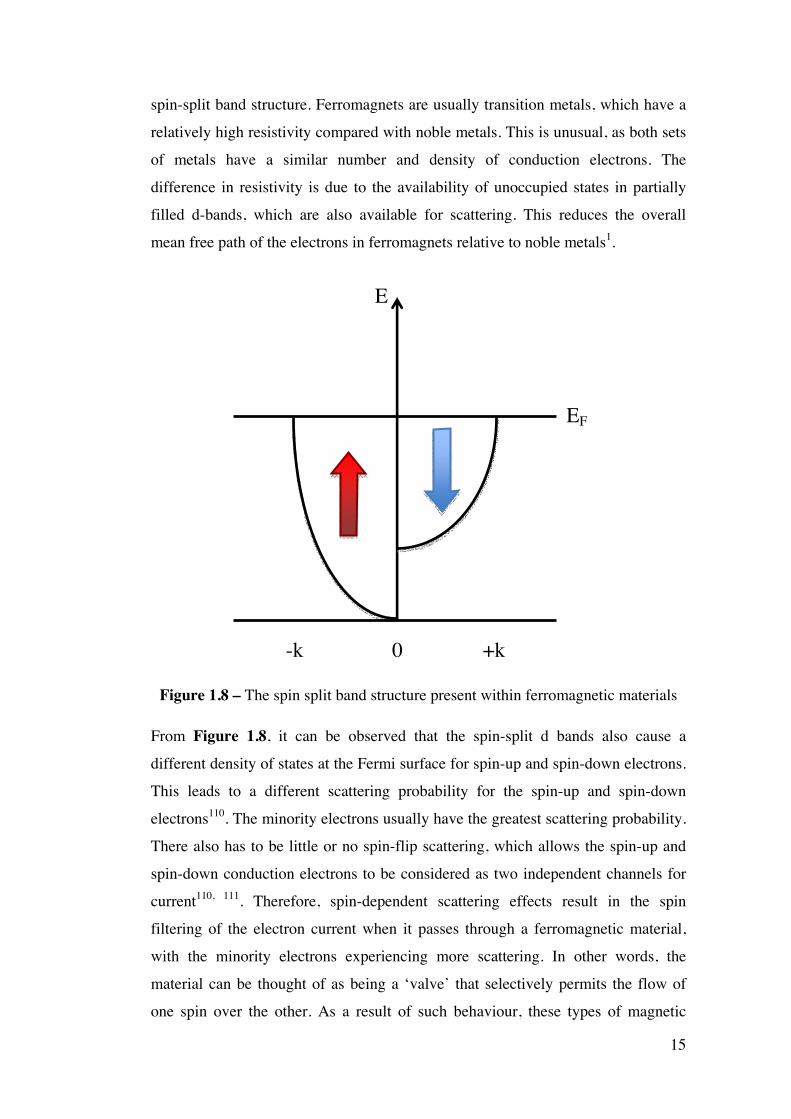
Within a ferromagnetic material, a quantum mechanical exchange interaction
between the electrons results in a spin-split band structure (as shown below in
Figure 1.8). As we shall see, there are a number of essential factors that lead to
spin-dependent scattering in metallic ferromagnets, which are derived from this
15
spin-split band structure. Ferromagnets are usually transition metals, which have a
relatively high resistivity compared with noble metals. This is unusual, as both sets
of metals have a similar number and density of conduction electrons. The
difference in resistivity is due to the availability of unoccupied states in partially
filled d-bands, which are also available for scattering. This reduces the overall
mean free path of the electrons in ferromagnets relative to noble metals1.
Figure 1.8 – The spin split band structure present within ferromagnetic materials
From Figure 1.8, it can be observed that the spin-split d bands also cause a
different density of states at the Fermi surface for spin-up and spin-down electrons.
This leads to a different scattering probability for the spin-up and spin-down
electrons110. The minority electrons usually have the greatest scattering probability.
There also has to be little or no spin-flip scattering, which allows the spin-up and
spin-down conduction electrons to be considered as two independent channels for
current110, 111. Therefore, spin-dependent scattering effects result in the spin
filtering of the electron current when it passes through a ferromagnetic material,
with the minority electrons experiencing more scattering. In other words, the
material can be thought of as being a ‘valve’ that selectively permits the flow of
one spin over the other. As a result of such behaviour, these types of magnetic
E
EF
-k 0 +k
16
multilayer are known as ‘spin valves’. GMR materials in the read-heads of hard-
drives are spin valves that have been specifically designed to exploit spin-
dependent scattering105.
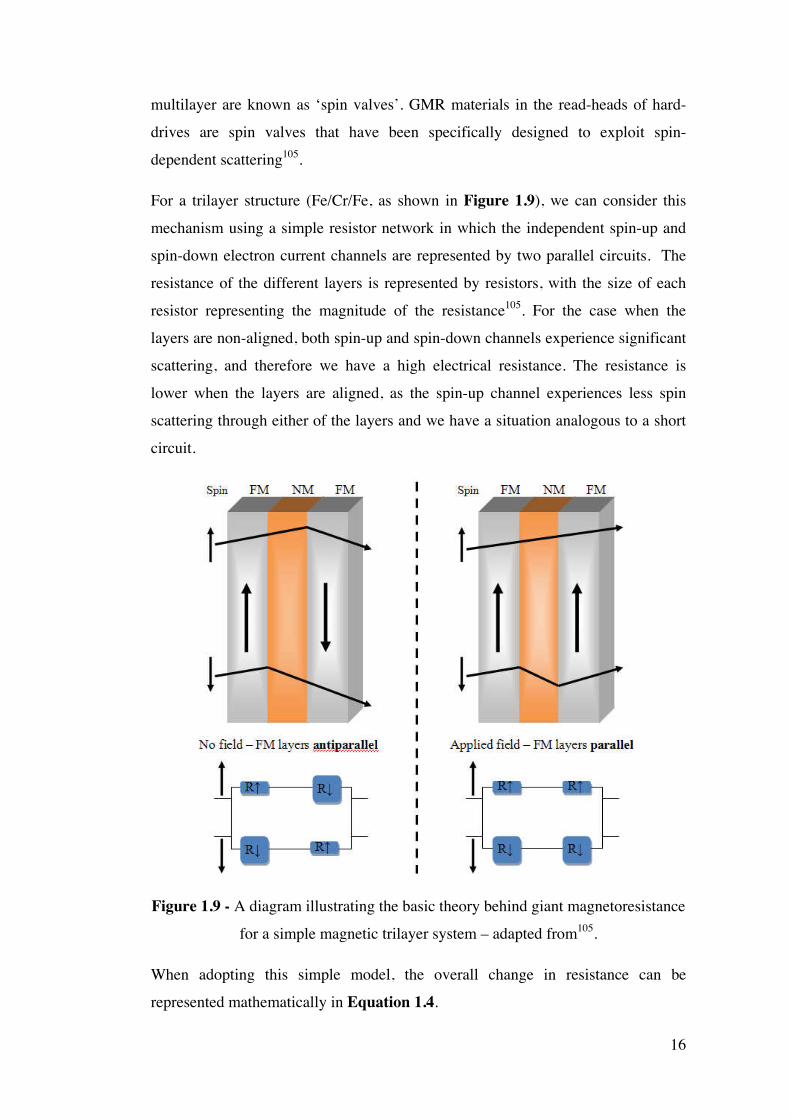
For a trilayer structure (Fe/Cr/Fe, as shown in Figure 1.9), we can consider this
mechanism using a simple resistor network in which the independent spin-up and
spin-down electron current channels are represented by two parallel circuits. The
resistance of the different layers is represented by resistors, with the size of each
resistor representing the magnitude of the resistance105. For the case when the
layers are non-aligned, both spin-up and spin-down channels experience significant
scattering, and therefore we have a high electrical resistance. The resistance is
lower when the layers are aligned, as the spin-up channel experiences less spin
scattering through either of the layers and we have a situation analogous to a short
circuit.
Figure 1.9 - A diagram illustrating the basic theory behind giant magnetoresistance
for a simple magnetic trilayer system – adapted from105.
When adopting this simple model, the overall change in resistance can be
represented mathematically in Equation 1.4.
17
Equation 1.4
where RAP is the overall resistance for the anti-parallel case and RP is the overall
resistance for the parallel case. R ↑ and R ↓ represent the resistances of the
individual resistors shown in Figure 1.9.
The discovery of the GMR effect and its associated mechanism represented a new
area of physics; a field now known as ‘spintronics’, which will be described in the
following section.
1.4.2 Spintronics Spin transport electronics (spintronics), is an emerging research field in solid-state
electronics112, 113. As the name suggests, it concerns not only the fundamental
electronic charge, but also the intrinsic spin of the electron in order to create new
devices. It emerged from spin dependent electron transfer experiments, including
the discovery of GMR and the observation of spin-polarized electron injection from
a ferromagnetic metal to a normal metal114.
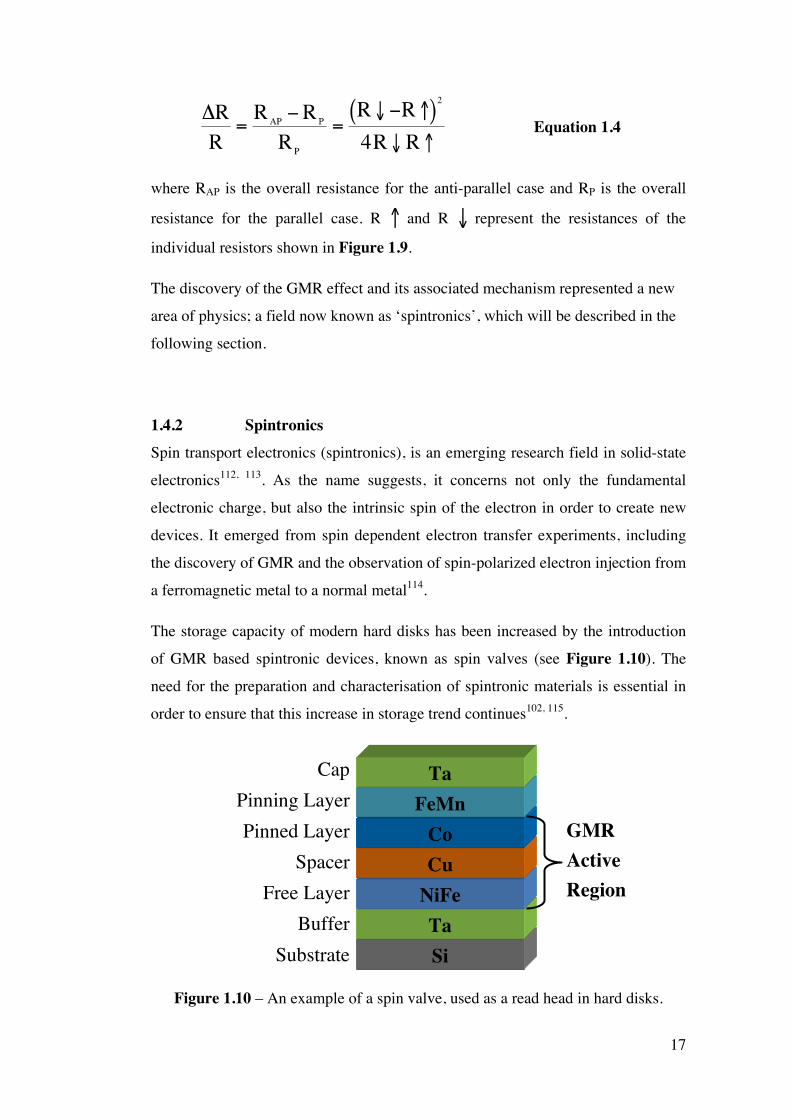
The storage capacity of modern hard disks has been increased by the introduction
of GMR based spintronic devices, known as spin valves (see Figure 1.10). The
need for the preparation and characterisation of spintronic materials is essential in
order to ensure that this increase in storage trend continues102, 115.
Si Ta
NiFe Cu Co
FeMn Ta Cap
Pinning Layer Pinned Layer
Spacer Free Layer
Buffer Substrate
GMR Active Region
Figure 1.10 – An example of a spin valve, used as a read head in hard disks.
18
Magnetic Random Access Memory (MRAM) is a technology, which is also reliant
on developments in materials for spintronics. In MRAM grids of magnetic
tunnelling junctions (MTJ’s) are used as magnetic storage elements, permitting the
storage of information even when no electrical power is supplied115-117. Due to
greater capacity Dynamic RAM (DRAM) is the current standard used in personal
computers, however MRAM offers greater speed and lower operating voltage118.
As a result, research into novel spintronic materials is necessary in order to
increase the storage capacity of MRAM.
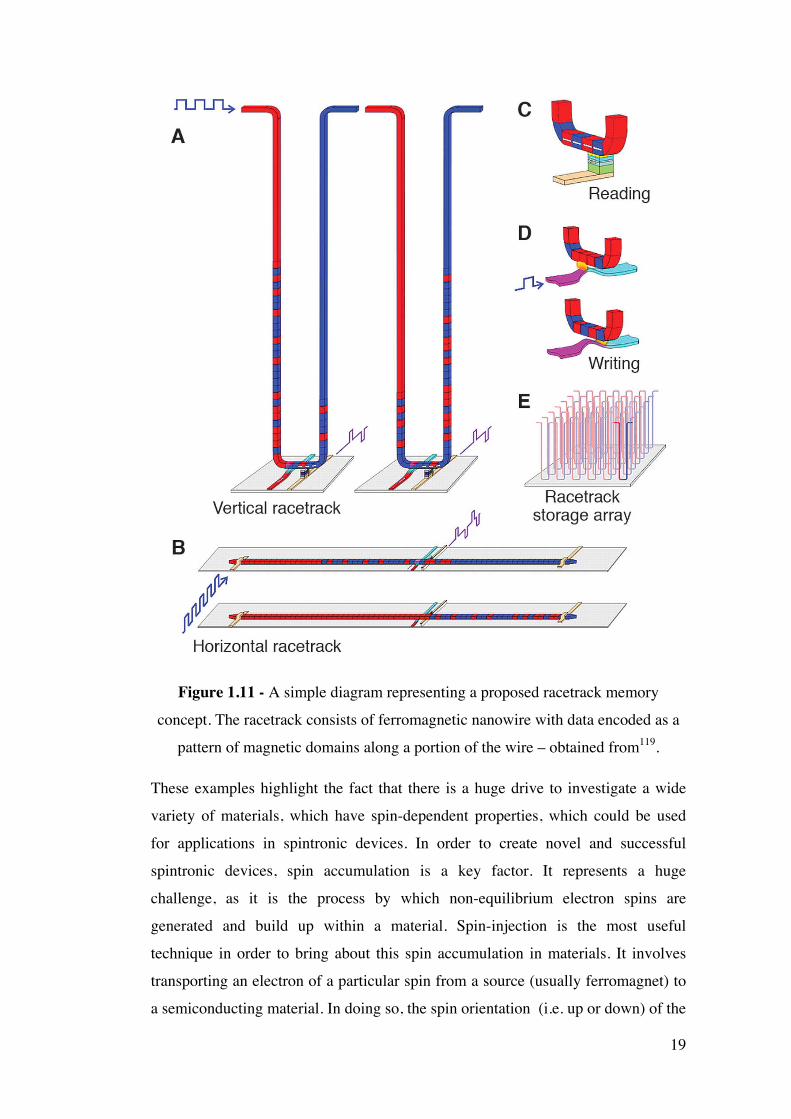
‘Racetrack’ memory is another emerging technology based on spintronics, which
has been developed by Stuart Parkin and co-workers at IBM115, 119, 120. The
‘racetrack’ consists of a ferromagnetic nanowire, with data encoded as a pattern of
magnetic domains along a portion of the wire (see Figure 1.11). A spin-polarized
current moves the entire pattern of domain wall (DWs) coherently in either
direction along the length of the wire past read and write elements. Reading of
stored data is achieved by measuring the tunnel magnetoresistance of a magnetic
tunnel junction element connected to the racetrack (as shown in Figure 1.11 C).
Writing data can be accomplished through utilising the fringing fields of a DW
moved in a second ferromagnetic nanowire, which is oriented at right angles to the
storage nanowire. High storage density can be achieved by creating a series of U
shaped arrays relative to the substrate (Figure 1.11 A and E). Spin injection in
order to apply a spin- polarised current is essential for the operation of such
devices.
19
Figure 1.11 - A simple diagram representing a proposed racetrack memory
concept. The racetrack consists of ferromagnetic nanowire with data encoded as a
pattern of magnetic domains along a portion of the wire – obtained from119.
These examples highlight the fact that there is a huge drive to investigate a wide
variety of materials, which have spin-dependent properties, which could be used
for applications in spintronic devices. In order to create novel and successful
spintronic devices, spin accumulation is a key factor. It represents a huge
challenge, as it is the process by which non-equilibrium electron spins are
generated and build up within a material. Spin-injection is the most useful
technique in order to bring about this spin accumulation in materials. It involves
transporting an electron of a particular spin from a source (usually ferromagnet) to
a semiconducting material. In doing so, the spin orientation (i.e. up or down) of the
20
electron must be conserved121. Therefore, materials that exhibit a high level of spin
polarisation are essential for this process.
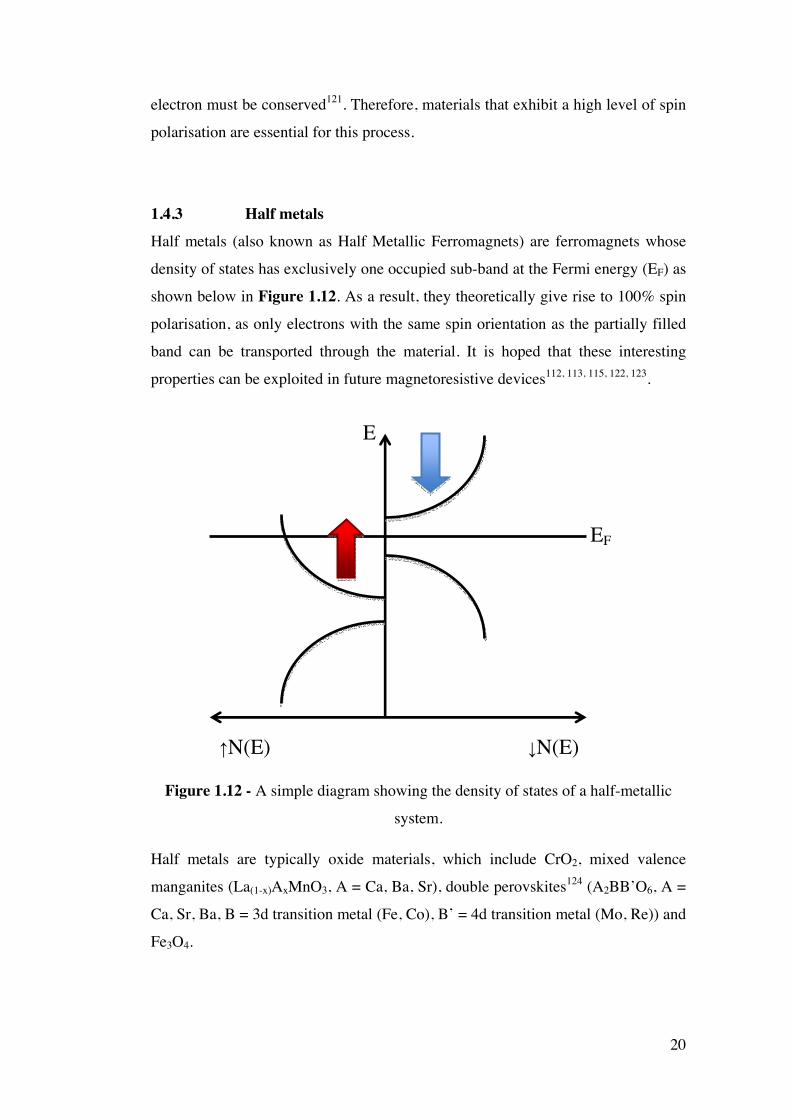
1.4.3 Half metals Half metals (also known as Half Metallic Ferromagnets) are ferromagnets whose
density of states has exclusively one occupied sub-band at the Fermi energy (EF) as
shown below in Figure 1.12. As a result, they theoretically give rise to 100% spin
polarisation, as only electrons with the same spin orientation as the partially filled
band can be transported through the material. It is hoped that these interesting
properties can be exploited in future magnetoresistive devices112, 113, 115, 122, 123.
Figure 1.12 - A simple diagram showing the density of states of a half-metallic
system.
Half metals are typically oxide materials, which include CrO2, mixed valence
manganites (La(1-x)AxMnO3, A = Ca, Ba, Sr), double perovskites124 (A2BB’O6, A =
Ca, Sr, Ba, B = 3d transition metal (Fe, Co), B’ = 4d transition metal (Mo, Re)) and
Fe3O4.
EF
E
↑N(E) ↓N(E)
21
1.4.4 Oxide Materials for Spintronics Transition metal oxides are receiving a great deal of attention, as they display a
wide range of fascinating physical properties such as high temperature
superconductivity, ferro- and antiferromagnetism, ferroelectricity and even
multiferroicity122. The enormous progress in oxide thin-film technology allows us
to integrate these materials with semiconducting, normal conducting, dielectric, or
non-linear optical oxides in complex oxide heterostructures, providing the basis for
novel multi-functional materials and potentially making them suitable for various
spintronic applications.
1.4.5 Magnetite (Fe3O4) Magnetite (Fe3O4), was discovered in Greece around 2000 BC making it the oldest
magnetic material known to man125. Magnetite is a half-metallic conducting
ferrimagnetic oxide material, which is magnetic at room temperature, having a very
high Curie temperature of approximately 858 K126. Band calculations predict that
conduction electrons are fully spin polarised127-130, which makes it a very suitable
candidate for use as a spin injector for magnetic recording/spintronic applications.
Whilst naturally occurring magnetite has been used for thousands of years, its
properties, particularly those of thin-films are not fully understood125, 127. Thin
films of magnetite have properties which deviate from the bulk131, including the
fact that the magnetisation does not saturate in high fields132, and ultra-thin films (<
5 nm) are superparamagnetic133, the resistivity is increased relative to the bulk134
and epitaxial films show magnetoresistance135.
Fe3O4 is an example of a spinel ferrite, all of which have the general formula of
MFe2O4. M represents a divalent ion, which in the case of Fe3O4 M is a Fe2+ ion.
Spinel ferrites have two distinct crystallographic variants, one known as ‘normal’
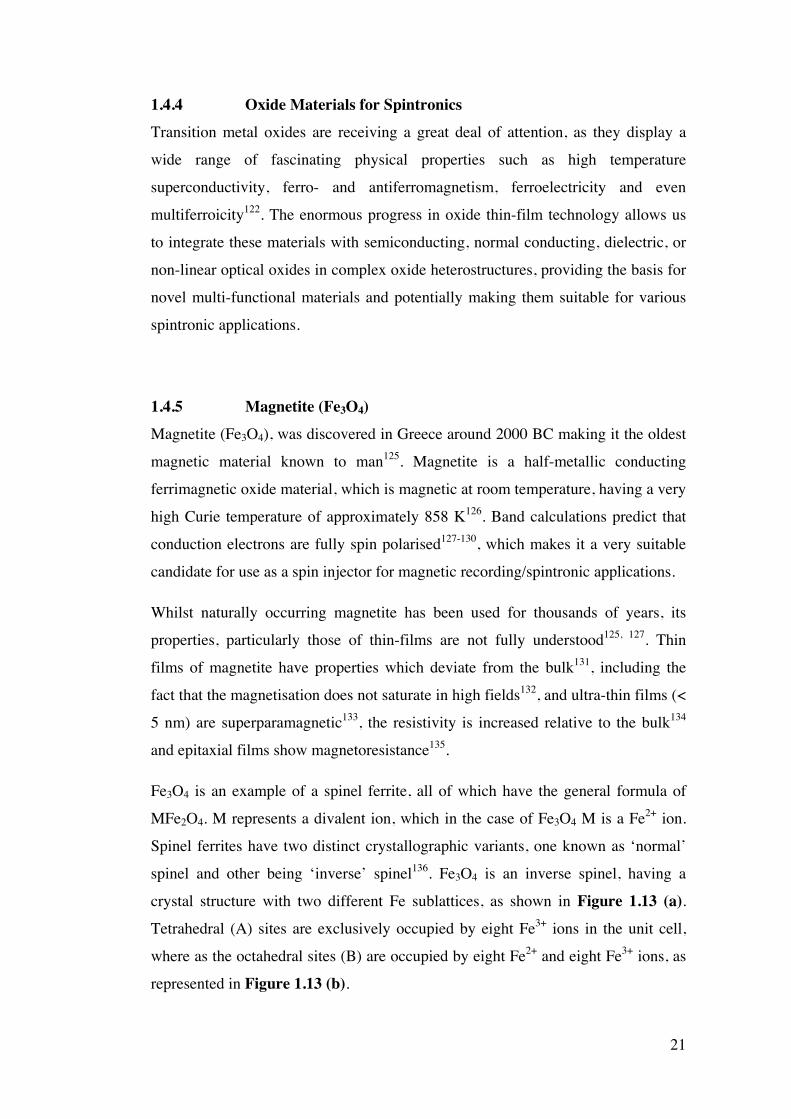
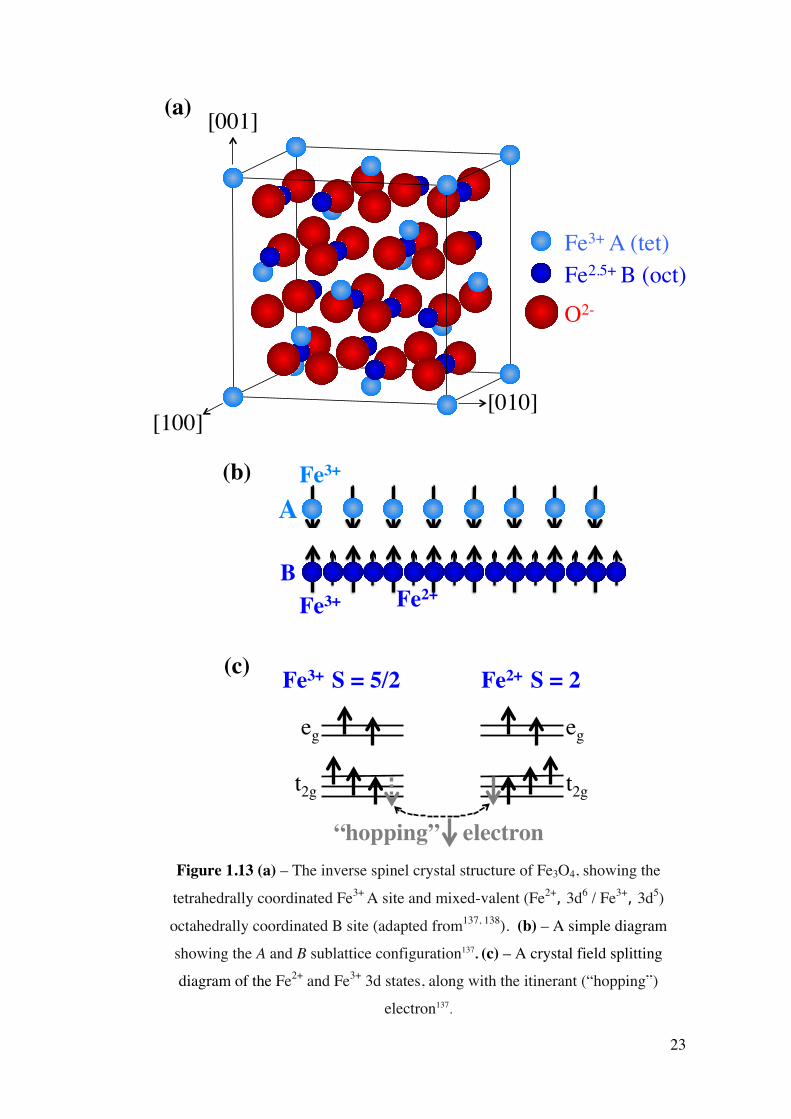
spinel and other being ‘inverse’ spinel136. Fe3O4 is an inverse spinel, having a
crystal structure with two different Fe sublattices, as shown in Figure 1.13 (a). Tetrahedral (A) sites are exclusively occupied by eight Fe3+ ions in the unit cell,
where as the octahedral sites (B) are occupied by eight Fe2+ and eight Fe3+ ions, as
represented in Figure 1.13 (b).

22
Due to the close proximity and orbital overlap of surrounding O2- ions, a crystal
field is established which splits the 3d states of the Fe2+ and Fe3+ ions in the B site
into two states with eg and t2g symmetry (see Figure 1.13 (c)). The t2g spin-down
electron can “hop” between the Fe2+ and Fe3+ ions137 (also shown in Figure 1.13 (c)), which gives rise to the electrical conductivity within Fe3O4. It should be noted
that, in accordance with Hund’s rule, this 2g B spin is coupled antiparallel to the
local moment formed by the spin-up electrons.
23
[001]
[100] [010]
Fe3+ A (tet) Fe2.5+ B (oct) O2-
(a)
Fe3+
Fe3+ Fe2+
A
B
(b)
eg
t2g
eg
t2g
Fe3+ S = 5/2 Fe2+ S = 2
“hopping” electron
(c)
Figure 1.13 (a) – The inverse spinel crystal structure of Fe3O4, showing the
tetrahedrally coordinated Fe3+ A site and mixed-valent (Fe2+, 3d6 / Fe3+, 3d5)
octahedrally coordinated B site (adapted from137, 138). (b) – A simple diagram
showing the A and B sublattice configuration137. (c) – A crystal field splitting
diagram of the Fe2+ and Fe3+ 3d states, along with the itinerant (“hopping”)
electron137.
24
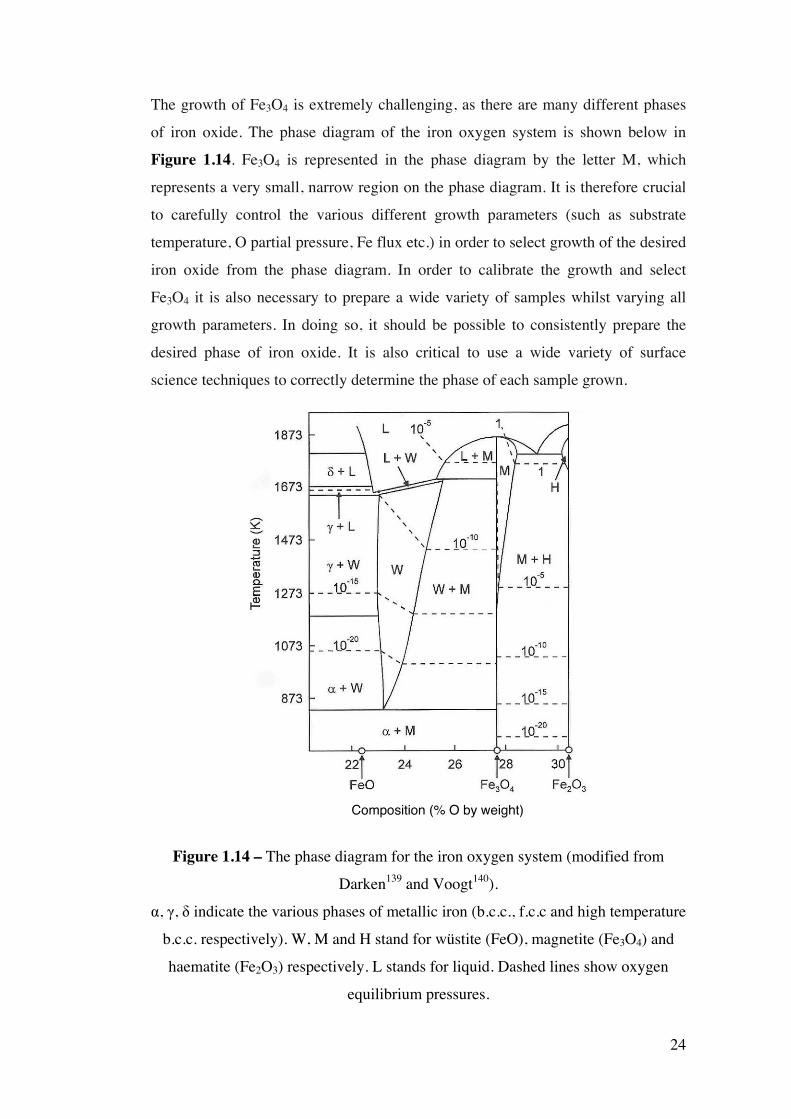
The growth of Fe3O4 is extremely challenging, as there are many different phases
of iron oxide. The phase diagram of the iron oxygen system is shown below in
Figure 1.14. Fe3O4 is represented in the phase diagram by the letter M, which
represents a very small, narrow region on the phase diagram. It is therefore crucial
to carefully control the various different growth parameters (such as substrate
temperature, O partial pressure, Fe flux etc.) in order to select growth of the desired
iron oxide from the phase diagram. In order to calibrate the growth and select
Fe3O4 it is also necessary to prepare a wide variety of samples whilst varying all
growth parameters. In doing so, it should be possible to consistently prepare the
desired phase of iron oxide. It is also critical to use a wide variety of surface
science techniques to correctly determine the phase of each sample grown.
Figure 1.14 – The phase diagram for the iron oxygen system (modified from
Darken139 and Voogt140).
α, γ, δ indicate the various phases of metallic iron (b.c.c., f.c.c and high temperature
b.c.c. respectively). W, M and H stand for wüstite (FeO), magnetite (Fe3O4) and
haematite (Fe2O3) respectively. L stands for liquid. Dashed lines show oxygen
equilibrium pressures.
Composition (% O by weight)
25
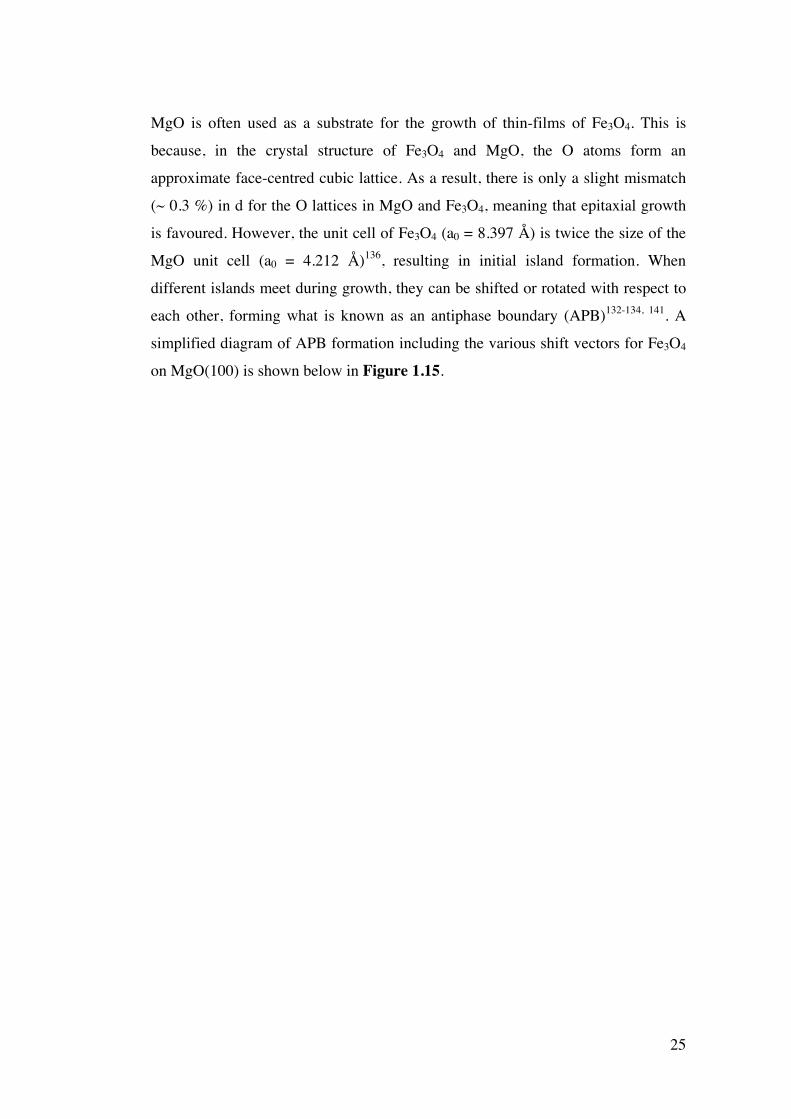
MgO is often used as a substrate for the growth of thin-films of Fe3O4. This is
because, in the crystal structure of Fe3O4 and MgO, the O atoms form an
approximate face-centred cubic lattice. As a result, there is only a slight mismatch
(~ 0.3 %) in d for the O lattices in MgO and Fe3O4, meaning that epitaxial growth
is favoured. However, the unit cell of Fe3O4 (a0 = 8.397 Å) is twice the size of the
MgO unit cell (a0 = 4.212 Å)136, resulting in initial island formation. When
different islands meet during growth, they can be shifted or rotated with respect to
each other, forming what is known as an antiphase boundary (APB)132-134, 141. A
simplified diagram of APB formation including the various shift vectors for Fe3O4
on MgO(100) is shown below in Figure 1.15.
26
(a) Plan view:
¼[110]
½[100]
(iv) (iii)
(ii) (i)
a0 MgO
a0 Fe3O4
[001]
[110] APB
Bulk stacking Bulk stacking (b) Profile view:
Fe3+ A (tet) Fe2.5+ B (oct) O2- Mg2+
Figure 1.15 – (a) The APB shifts formed according to the different translational
and rotational symmetry of the initial Fe3O4 monolayer and the MgO(100) surface
(modified from Eerenstein138). Fe3O4 monolayers are shifted relative to reference
(i), forming in-plane shifts of (ii) ½[100] (iii) ¼[110]. A rotated monolayer, (iv), forms an out-of plane shift. (b) Side profile of an Fe3O4 APB in the 110 direction
on MgO(100) modified from Arras et al.130
The magnetic coupling over a large fraction of these boundaries is anti-
ferromagnetic (AF). These AF interfaces hinder spin-polarised electron transport
27
between neighbouring APBs, which is the cause of the increased resistance relative
to the bulk. However, when a magnetic field is applied, the AF spins align and the
electron transport across the boundaries increases, resulting in a decrease in
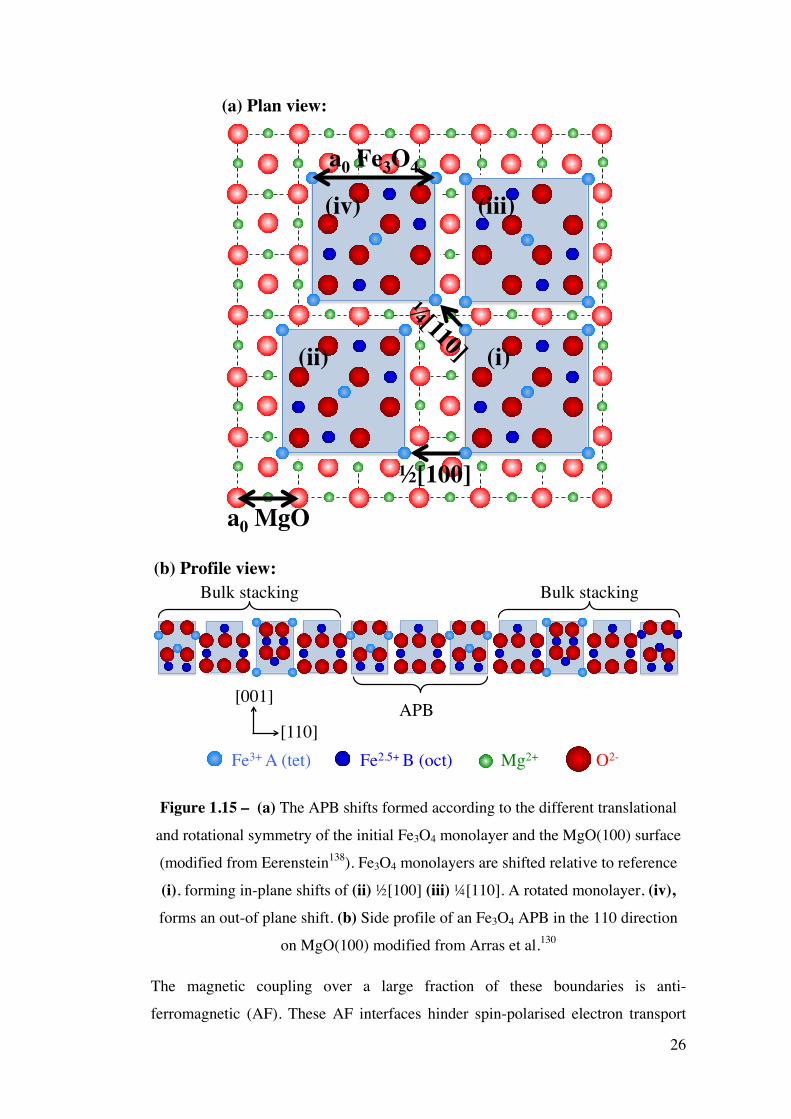
resistance142. As crystallographic defects, APBs can be imaged by dark field and
high-resolution transmission electron microscopy. It has been demonstrated that the
density of APBs is dependent upon the film thickness, as shown the dark field
electron micrographs in Figure 1.16 (a)-(d)134. The dark lines in these figures show
the APBs, the density of which is largest for thin-films.
Figure 1.16 – Dark field transmission electron micrographs of APBs from within
(a) 6 nm, (b) 12 nm, (c) 25 nm and (d) 50 nm thick films of Fe3O4/MgO(100) –
taken from134
Experiments have also been carried out to modify the density of the APBs by
annealing samples143, 144. The density of the APBs decreased dramatically with
increasing temperature, having a great impact upon the magnetoresistance. The
density of the APBs determines the magnitude of the magnetoresistance, and
therefore the greater the number (and density) of APBs, the higher the
magnetoresistance145, 146.
28
These results all show that the magnetoresistance of magnetite strongly correlates
to the thickness and structure of the material128, 147, with APB density heavily
dominating properties131, 132, 145, 148. Despite this relationship, most studies have
focussed on the MgO(100) surface, with very little work being conducted on the
MgO(110) and MgO(111) surfaces. This thesis will therefore examine these
materials using thin-film and surface science methods in order to determine the
effect of the substrate upon the magnetoresistance. Crucially, magneto-optical non-
contact methods will be employed and developed in order to examine these effects.
Simulations will also be performed to aid in the interpretation of results.
1.5 Combinatorial methods The development of materials typically proceeds via trial and error methodologies,
where many similar compounds are both prepared and also characterised
individually. An alternative procedure for the simultaneous preparation and
characterisation of large numbers of inorganic compounds was first proposed by
Hanak in 19704.
An analogous approach has long been adopted for drug discovery in
pharmaceutical research. This method is known as ‘Combinatorial Chemistry’149,
150 and is frequently being adapted for the rapid synthesis and in-situ
characterisation of materials150, 151. This approach is often also referred to as
parallel synthesis or high-throughput synthesis152, 153. Materials which have been
investigated using this combinatorial approach154, include, but are not limited to,
catalysts153, 155-157, optical158, 159, magnetic152, 160, and dielectric160, 161 materials,
hydrogen storage materials162, 163 and structural polymers154. This thesis will add to
this research area through the development of a combinatorial sputtering rig for the
rapid preparation of vast arrays of materials for heterogeneous catalysis and
magnetic materials for spintronics.
1.6 Thesis Aims As this introduction has highlighted, the preparation and optimisation of advanced
functional materials presents a huge challenge for chemists, physicists and
29
materials scientists. Such systems are often very complex and therefore require
empirical trial-and-error methods involving the synthesis and characterisation of a
large number of materials with varying compositions. It has also been shown that
surface science techniques involving model single crystals and/or thin-films allow
the mechanisms of a wide variety of chemical and physical phenomena to be
probed with a great deal of precision and accuracy, giving molecular or even
atomic level insight.
The aim of this thesis is utilise such surface science techniques in order to prepare
and characterise model thin-film materials for the mechanistic study of
heterogeneous catalysis and spintronics. To this end, the reaction pathway for the
selective oxidation of crotyl alcohol, an important fine chemical, over Au/Pd thin-
films will be determined. This will involve the preparation and catalytic
characterisation of a large number of Au/Pd alloy compositions. Powerful surface
science techniques will be employed to elucidate the reaction pathway and examine
the adsorption and chemistry of all by-products. Once the chemistry of such films
is known, it would then be possible, through the development of a combinatorial
sputtering rig, to prepare vast libraries of catalysts through co-sputtering Au and Pd
onto Si (100) substrates. The catalytic activities of such catalysts could then be
rapidly screened by means of infrared thermography, enabling the alloy
composition with optimum activity to be determined. Similarly, magnetic materials
could also be investigated in the same manner, using well characterised exemplar
materials to highlight the potential and wide range of applications for combinatorial
methods.
Thin-films of magnetite (Fe3O4) will be prepared on various substrates and their
magnetoresistive properties characterised. Magneto-optical methods will be
developed, which will allow the non-contact study of both the composition and the
magnetoresistive properties. By modelling the complex index of refraction, it will
also be possible to probe the thickness dependent magnetoresistance and eventually
probe different conductivity mechanisms exhibiting characteristic spectral
dependences. As a result, this model could also be used determine sample
thickness. Further work could be carried out in the future in order to adapt such
simple systems for use for other oxide materials, such as those for spin injection in
thin-film spintronic devices.
30
1.7 References 1. N. A. Spaldin, Magnetic Materials: Fundamentals and Applications, 2 edn.,
Cambridge University Press, 2011.
2. J. Shen and J. Kirschner, Surface Science, 2002, 500, 300-322.
3. C. A. F. Vaz, J. Bland and G. Lauhoff, Reports on Progress in Physics,
2008, 71, 1-78.
4. J. Hanak, Journal of materials science, 1970, 5, 964-971.
5. J. A. Rodriguez and D. W. Goodman, J. Phys. Chem., 1991, 95, 4196-4206.
6. T. Mallat and A. Baiker, Chem. Rev., 2004, 104, 3037-3058.
7. A. Corma, H. Garcia and A. Leyva, Journal of Molecular Catalysis A,
2005, 230, 97–105.
8. R. Sheldon, Pure and applied chemistry, 2000, 72, 1233-1246.
9. T. Mallat and A. Baiker, Catalysis Today, 1994, 19, 247-283.
10. A. Lee, C. Ellis, J. Naughton, M. A. Newton, C. M. A. Parlett and K.
Wilson, Journal of the American Chemical Society, 2011, 133, 5724-5727.
11. P. Dash, N. Dehm and R. Scott, Journal of Molecular Catalysis A:
Chemical, 2008, 286, 114-119.
12. C. Hardacre, E. A. Mullan, D. W. Rooney and J. M. Thompson, Journal of
Catalysis, 2005, 232, 355-365.
13. M. Caravati and A. Baiker, Catalysis Today, 2004, 92-92, 1-5.
14. J.-D. Grunwaldt, M. Caravati and A. Baiker, The Journal of Physical
Chemistry B, 2006, 110, 9916-9922.
15. J.-D. Grunwaldt, M. Caravati, M. Ramin and A. Baiker, Catalysis Letters,
2003, 90, 221-229.
16. B. Kimmerle, J.-D. Grunwaldt and A. Baiker, Topics in Catalysis, 2007, 44,
285-291.
17. X. Wang, N. Venkataramanan, H. Kawanami and Y. Ikushima, Green
Chem., 2007, 9, 1352-1355.
18. T. Mallat, Z. Bodnar, P. Hug and A. Baiker, Journal of Catalysis, 1995,
153, 131-143.
19. D. Kumar, M. Chen and D. Goodman, Catalysis Today, 2007, 123, 77-85.
31
20. M. Chen, D. Kumar, C.-W. Yi and D. Goodman, Science, 2005, 310, 291-
293.
21. F. Calaza, F. Gao, Z. Li and W. Tysoe, Surf. Sci., 2007, 601, 714-722.
22. C. Mingshu and D. Goodman, Chinese Journal of Catalysis, 2008, 29,
1178-1186.
23. M. Chen, K. Luo, T. Wei, Z. Yan, D. Kumar, C.-W. Yi and D. Goodman,
Catalysis Today, 2006, 117, 37-45.
24. M. Chen, D. Kumar, C.-W. Yi and D. W. Goodman, Science, 2005, 310,
291-293.
25. S. Hackett, Rik M. Brydson, M. Gass, I. Harvey, A. Newman, K. Wilson
and A. Lee, Angewandte Chemie International Edition, 2007, 46, 8593 –
8596.
26. K. Yamaguchi and N. Mizuno, Angewandte Chemie, 2002, 114, 4720-4724.
27. D. I. Enache, J. K. Edwards, P. Landon, B. Solsona-Espriu, A. F. Carley, A.
A. Herzing, M. Watanabe, C. J. Kiely, D. W. Knight and G. J. Hutchings,
Science, 2006, 311, 362.
28. M. Hughes, Y. Xu, P. Jenkins, P. McMorn, P. Landon, D. Enache, A.
Carley, G. Attard, G. Hutchings and F. King, Nature, 2005, 437, 1132-
1135.
29. C. Keresszegi, T. Bürgi, T. Mallat and A. Baiker, Journal of Catalysis,
2002, 211, 244-251.
30. S. Hackett, University of York, 2008.
31. J. L. Solomon and R. J. Madix, Journal of Physical Chemistry, 1987, 91,
6241-6244.
32. J. L. Solomon, R. J. Madix and J. Stöhr, The Journal of Chemical Physics,
1988, 89, 5316.
33. R. L. Brainard, C. G. Peterson and R. J. Madix, J. Am. Chem. Soc., 1989,
111, 4553-4561.
34. N. F. Brown and M. A. Barteau, J. Am. Chem. SOC, 1992, 114, 4258-4265.
35. F. Delbecq and P. Sautet, Journal of Catalysis, 1995, 152, 217-236.
36. A. Lee, Z. Chang, P. Ellis, S. Hackett and K. Wilson, J. Phys. Chem. C,
2007, 111, 18844-18847.
37. T. R. Bryden and S. J. Garrett, The Journal of Physical Chemistry B, 1999,
103, 10481-10488.
32
38. B. A. Sexton, A. E. Hughes and N. R. Avery, Surface Science, 1985, 155,
366-386.
39. W.-H. Hung and S. L. Bernasek, Surface Science, 1996, 346, 165-188.
40. G. A. Attard, H. D. Ebert and R. Parsons, Surface Science, 1990, 240, 125-
135.
41. H. B. Zhao, J. Kim and B. E. Koel, Surface Science, 2003, 538, 147-159.
42. C. Houtman and M. A. Barteau, Surface Science, 1991, 248, 57-76.
43. M. Shen and F. Zaera, Journal of the American Chemical Society, 2009,
131, 8708-8713.
44. R. W. McCabe, C. L. DiMaggio and R. J. Madix, The Journal of Physical
Chemistry, 2002, 89, 854-861.
45. R. Shekhar, M. A. Barteau, R. V. Plank and J. M. Vohs, The Journal of
Physical Chemistry B, 1997, 101, 7939-7951.
46. M. Bowker, R. Holroyd, N. Perkins, J. Bhantoo, J. Counsell, A. Carley and
C. Morgan, Surface Science, 2007, 601, 3651-3660.
47. L. E. Murillo and J. G. Chen, Surface Science, 2008, 602, 2412-2420.
48. M. Akita, N. Osaka and K. Itoh, Surface Science, 1998, 405, 172-181.
49. C. J. Kliewer, M. Bieri and G. A. Somorjai, Journal of the American
Chemical Society, 2009, 131, 9958-9966.
50. J. C. de Jesús and F. Zaera, Surface Science, 1999, 430, 99-115.
51. J. C. de Jesús and F. Zaera, Journal of Molecular Catalysis A: Chemical,
1999, 138, 237-240.
52. J. C. d. Jesús and F. Zaera, Surface Science, 1999, 430, 99–115.
53. L. E. Murillo and J. G. Chen, Surface Science, 2008, 602, 919-931.
54. M. E. Chiu, D. J. Watson, G. Kyriakou, M. S. Tikhov and R. M. Lambert,
Angew. Chem.-Int. Edit., 2006, 45, 7530-7534.
55. D. I. Jerdev, A. Olivas and B. E. Koel, Journal of Catalysis, 2002, 205,
278-288.
56. E. Janin, H. von Schenck, S. Ringler, J. Weissenrieder, T. Åkermark and M.
Göthelid, Journal of Catalysis, 2003, 215, 245-253.
57. J. Haubrich, D. Loffreda, F. Delbecq, Y. Jugnet, P. Sautet, A. Krupski, C.
Becker and K. Wandelt, Chemical Physics Letters, 2006, 433, 188-192.
33
58. J. Haubrich, D. Loffreda, F. Delbecq, P. Sautet, A. Krupski, C. Becker and
K. Wandelt, The Journal of Physical Chemistry C, 2009, 113, 13947-
13967.
59. E. Janin, H. von Schenck, S. Ringler, J. Weissenrieder, T. Åkermark and M.
Göthelid, Journal of Catalysis, 2003, 215, 245-253.
60. M. Ruff, N. Takehiro, P. Liu, J. K. Nørskov and R. J. Behm,
ChemPhysChem, 2007, 8, 2068 – 2071.
61. M. D. Hughes, Y. J. Xu, P. Jenkins, P. McMorn, P. Landon, D. I. Enache,
A. F. Carley, G. A. Attard, G. J. Hutchings, F. King, E. H. Stitt, P.
Johnston, K. Griffin and C. J. Kiely, Nature, 2005, 437, 1132-1135.
62. G. J. Hutchings, Catalysis Today, 2007, 122, 196–200.
63. G. J. Hutchings, Chem. Commun., 2007, 2008, 1148–1164.
64. N. Dimitratos, F. Porta and L. Prati, Applied Catalysis A: General, 2005,
291, 210-214.
65. W. C. Ketchie, M. Murayama and R. J. Davis, Journal of Catalysis, 2007,
250, 264-273.
66. F. Menegazzo, P. Burti, M. Signoretto, M. Manzoli, S. Vankova, F.
Boccuzzi, F. Pinna and G. Strukul, Journal of Catalysis, 2008, 257, 369-
381.
67. J. K. Edwards, A. Thomas, A. F. Carley, A. A. Herzing, C. J. Kiely and G.
J. Hutchings, Green Chem., 2008, 10, 388–394.
68. A. F. Lee, C. J. Baddeley, C. Hardacre, R. M. Ormerod, R. M. Lambert, G.
Schmid and H. West, J. Phys. Chem., 1995, 99, 6096-6102.
69. C. J. Baddeley, J. R. M. Ormerod, A. W. Stephenson and R. M. Lambert, J.
Phys. Chem., 1995, 99, 5146-5151.
70. C. J. Baddeley, M. Tikhov, C. Hardacre, J. R. Lomas and R. M. Lambert, J.
Phys. Chem., 1996, 100, 2189-2194.
71. M. Bonarowska, J. Pielaszek, V. A. Semikolenov and Z. Karpinski, Journal
of Catalysis, 2002, 209, 528–538.
72. A. B. Jorge, P. Craig, N. Matthew and T. T. Wilfred, Physical Review B
(Condensed Matter and Materials Physics), 2008, 77, 045422.
73. D. Yuan, X. Gong and R. Wu, Phys. Rev. B, 2007, 75, 085428.
74. A. Abad, P. Concepción, A. Corma and H. García, Angew. Chem. Int. Ed.,
2005, 44, 4066 –4069.
34
75. N. Dimitratos, A. Villa, D. Wangb, F. Porta, D. Su and L. Prati, J. Cat.,
2006, 244, 113-121.
76. X. Wang, N. S. Venkataramanan, H. Kawanami and Y. Ikushima, Green
Chem., 2007, 9, 1352-1355.
77. D. I. Enache, J. K. Edwards, P. Landon, B. Solsona-Espriu, A. F. Carley, A.
A. Herzing, M. Watanabe, C. J. Kiely, D. W. Knight and G. J. Hutchings,
Science, 2006, 311, 362-365.
78. G. J. Hutchings, Catalysis Today, 2008, 138, 9-14.
79. C. Baddeley, M. Tikhov, C. Hardacre, J. Lomas and R. Lambert, J. Phys.
Chem., 1996, 100, 2189-2194.
80. B. Gleich, M. Ruff and R. Behm, Surf. Sci., 1997, 386, 48-55.
81. Z. Li, F. Gao, Y. Wang, F. Calaza, L. Burkholder and W. Tysoe, Surf. Sci.,
2007, 601, 1898-1908.
82. R. Ormerod, C. Baddeley and R. M. Lambert, Surface Science, 1991, 259,
L709-L713.
83. Z. Li, O. Furlong, F. Calaza, L. Burkholder, H. Poon, D. Saldin and W.
Tysoe, Surf. Sci., 2008, 602, 1084-1091.
84. C.-W. Yi, K. Luo, T. Wei and D. W. Goodman, J. Phys. Chem. B, 2005,
109, 18535-18540.
85. T. Wei, J. Wang and D. Goodman, 2007.
86. A. V. Ruban, H. L. Skriver and J. K. Norskov, Physical Review B, 2012, 59,
15990-16000.
87. A. Ruban, B. Hammer, P. Stoltze, H. L. Skriver and J. K. Norskov, Journal
of Molecular Catalysis A, 1997, 115, 421-429.
88. L. Kibler, Electrochimica Acta, 2008, 53, 6824-6828.
89. S. Guerin, B. E. Hayden, D. Pletcher, M. E. Rendall and J.-P. Suchsland, J.
Comb. Chem., 2006, 8, 679-686.
90. J. A. Boscoboinik, C. Plaisance, M. Neurock and W. T. Tysoe, Phys. Rev.
B, 2008, 77, 045422.
91. S. Chikazumi, Physics of Ferromagnetism, Oxford University Press, 1997.
92. L. Pauling, The Nature of the Chemical Bond, 3 edn., Cornell University
Press., 1960.
93. J. Arthur, Surface Science, 2002, 500, 189-217.
94. S. Bader, Proceedings of the IEEE, 1990, 78, 909-922.
35
95. P. Grundy, Journal of Physics D: Applied Physics, 1998, 31, 2975-2990.
96. J. Bland and B. Heinrich, Ultrathin Magnetic Structures I, Springer, 2005.
97. B. Heinrich and J. A. C. Bland, Ultrathin Magnetic Structures II, Springer,
2005.
98. J. Bland and B. Heinrich, Ultrathin Magnetic Structures III, Springer, 2005.
99. M. N. Baibich, J. M. Broto, A. Fert, F. N. V. Dau, F. Petroff, P. Eitenne, G.
Creuzet, A. Friederich and J. Chazelas, Physical Review Letters, 1988, 61,
2472-2475.
100. G. Binasch, P. Grünberg, F. Saurenbach and W. Zinn, Phys. Rev. B., 1989,
39.
101. http://www.kva.se/Documents/Priser/Nobel/2007/pop_fy_en_07.pdf,
Information for the Public, The Royal Swedish Academy of Sciences, 2007,
1-7.
102. E. Grochowski and D. A. Thompson, IEEE Transactions on Magnetics,
1994, 30, 3797-3800.
103. A. Moser, K. Takano, D. Margulies, M. Albrecht, Y. Sonobe, Y. Ikeda, S.
Sun and E. E. Fullerton, Journal of Physics D, 2002, 35, R157-R167.
104. R. Wood, Journal of Magnetism and Magnetic Materials, 2009, 321, 555-
561.
105. S. Thompson, Journal of Physics D: Applied Physics, 2008, 41, 093001.
106. S. S. P. Parkin, 1993, 71, 1641-1644.
107. A. Fert, P. A. Grünberg, A. Barthélémy, F. Petroff and W. Zinn, Journal of
Magnetism and Magnetic Materials, 1995, 140-144, 1-8.
108. P. A. Grünberg, Journal of Magnetism and Magnetic Materials, 2001, 226-230, 1688-1693.
109. P. A. Grünberg, Acta mater., 2000, 48, 239-251.
110. A. Fert and I. Campbell, Physical Review Letters, 1968, 21, 1190-1192.
111. A. Fert, Journal of Physics C: Solid State Physics, 1969, 2, 1784.
112. V. A. Ivanov, T. G. Aminov, V. M. Novotortsev and V. T. Kalinnikov,
Russ. Chem. Bull., 2004, 53, 2357-2405.
113. I. Zutic, J. Fabian and S. D. Sarma, Review of Modern Physics, 2004, 76,
323-410.
114. M. Johnson and R. H. Silsbee, Physical Review Letters, 1985, 55, 1790.
115. S. Parkin, International Electron Devices Meeting, 2004, 4, 903-906.
36
116. T. M. Maffitt, J. K. DeBrosse, J. A. Gabric, E. T. Gow, M. C. Lamorey, J.
S. Parenteau, D. R. Willmott, M. A. Wood and W. J. Gallagher, IBM J. Res.
Dev., 2006, 50, 25-39.
117. S. Tehrani, B. Engel, J. M. Slaughter, E. Chen, M. DeHerrera, M. Durlam,
P. Naji, R. Whig, J. Janesky and J. Calder, IEEE Transactions on
Magnetics, 2000, 36.
118. S. Tehrani, J. M. Slaughter, E. Chen, M. Durlam, J. Shi and M. DeHerrera,
IEEE Transactions on Magnetics, 1999, 35.
119. S. Parkin, M. Hayashi and L. Thomas, Science, 2008, 320, 190-194.
120. D. Clark and R. Earles, in Ninth Annual Freshman Conference, University
of Pittsburgh, Editon edn., 2009, pp. 1-6.
121. J. Fabian and I. Zutic, Arxiv preprint arXiv:0903.2500, 2009.
122. M. Bibes and A. Barthelemy, IEEE Transactions on Electron Devices,
2007, 54, 1003-1023.
123. M. Calderón and S. D. Sarma, Annals of Physics, 2007, 322, 2618-2634.
124. R. Borges, R. Thomas, C. Cullinan, J. M. D. Coey, R. Suryanarayanan, L.
Ben-Dor, L. Pinsard-Gaudart and A. Revcolevschi, Journal of Physics:
Condensed Matter, 1999, 11, L445 - L450.
125. W. Eerenstein, PhD Thesis, Groningen, 2003.
126. N. T. H. Kim-Ngan, A. G. Balogh, J. D. Meyer, J. Brotz, S. Hummelt, M.
Zajac, T. Slezak and J. Korecki, Surface Science, 2008, 602, 2358-2362.
127. L. A. Kalev and L. Niesen, Physical Review B, 2003, 67, 224403.
128. S. K. Arora, H. C. Wu, H. Z. Yao, W. Y. Ching, R. J. Choudhary, I. V.
Shvets and O. N. Mryasov, International Magnetics Conference (Intermag),
Madrid, SPAIN, 2008.
129. S. Jain, A. O. Adeyeye and C. B. Boothroyd, Journal of Applied Physics,
2005, 97, 093713.
130. R. Arras, L. Calmels and B. Warot-Fonrose, Physical Review B, 2010, 81,
104422.
131. J. B. Moussy, S. Gota, A. Bataille, M. J. Guittet, M. Gautier-Soyer, F.
Delille, B. Dieny, F. Ott, T. D. Doan, P. Warin, P. Bayle-Guillemaud, C.
Gatel and E. Snoeck, Physical Review B, 2004, 70, 9.
132. D. T. Margulies, F. T. Parker, M. L. Rudee, F. E. Spada, J. N. Chapman, P.
R. Aitchinson and A. E. Berkowitz, Physical Review Letters, 1997, 79, 4.
37
133. F. C. Voogt, T. T. M. Palstra, L. Niesen, O. C. Rogojanu, M. A. James and
T. Hibma, Physical Review B, 1998, 57, R8107-R8110.
134. W. Eerenstein, T. T. M. Palstra, T. Hibma and S. Celotto, Physical Review
B, 2002, 66, 4.
135. M. Ziese and H. J. Blythe, J. Phys.: Condens. Matter, 2000, 12, 13-28.
136. R. Waldron, Physical Review, 1955, 99, 1727-1735.
137. D. Venkateshvaran, M. Althammer, A. Nielsen, S. Geprags, M. S. R. Rao,
S. T. B. Goennenwein, M. Opel and R. Gross, Physical Review B, 2009, 79,
134405.
138. W. Eerenstein, University of Groningen, 2003.
139. L. S. Darken and R. W. Gurry, J. Am. Chem. Soc, 1946, 67, 1398.
140. F. C. Voogt, PhD Thesis, Rijksuniversiteit Groningen, 1998.
141. F. Voogt, T. Palstra, L. Niesen, O. Rogojanu, M. James and T. Hibma,
Physical Review B, 1998, 57, R8107-R8110.
142. W. Eerenstein, T. Palstra and T. Hibma, Thin solid films, 2001, 400, 90-94.
143. W. Eerenstein, T. Palstra, T. Hibma and S. Celotto, Physical Review B,
2003, 68, 014428.
144. Y. Zhou, C. McEvoy and I. Shvets, Journal of magnetism and magnetic
materials, 2005, 290-291, 1033-1036.
145. A. V. Ramos, J. B. Moussy, M. J. Guittet, A. M. Bataille, M. Gautier-Soyer,
M. Viret, C. Gatel, P. Bayle-Guillemaud and E. Snoeck, Journal of Applied
Physics, 2006, 100, 8.
146. J. Moussy, S. Gota, A. Bataille, M. Guittet, M. Gautier-Soyer, F. Delille, B.
Dieny, F. Ott, T. Doan, P. Warin, P. Bayle-Guillemaud, C. Gatel and E.
Snoeck, Physical Review B, 2004, 70, 174448(174449).
147. A. V. Ramos, S. Matzen, J. B. Moussy, F. Ott and M. Viret, Physical
Review B, 2009, 79, 8.
148. W. Eerenstein, T. T. M. Palstra, S. S. Saxena and T. Hibma, Phys Rev Lett,
2002, 88, 247204.
149. M. B. Brennan, Chemical and Engineering News, 2000, 78, 63-73.
150. H. Koinuma, Applied surface science, 2002, 189, 179-187.
151. J. Cooper, G. Zhang and P. J. McGinn, Review of Scientific Instruments,
2005, 76, 062221.
38
152. W. Maier, K. Stöwe and S. Sieg, Angewandte Chemie International
Edition, 2007, 46, 6016-6067.
153. D. Farrusseng, Surface Science Reports, 2008, 63, 487-513.
154. E. McFarland and W. H. Weinberg, Trends in biotechnology, 1999, 17,
107-115.
155. J. Engstrom and W. HenryWeinberg, AIChE journal, 2000, 46, 2-5.
156. R. Hendershot, C. Snively and J. Lauterbach, Chemistry – A European
Journal, 2005, 11, 806-814.
157. F. Moates, M. Somani, J. Annamalai, J. T. Richardson, D. Luss and R. C.
Willson, Ind. Eng. Chem. Res., 1996, 35, 4801-4803.
158. S. Henderson, J. Armstrong, A. Hector and M. T. Weller, J. Mater. Chem.,
2005, 15, 1528-1536.
159. J. Perkins, C. Teplin, M. v. Hest, J. Alleman, X. Li, M. Dabney, B. Keyes,
L. Gedvilas, D. Ginley, Y. Lin and Y. Lu, Applied surface science, 2004,
223, 124-132.
160. X. Xiang, Materials Science and Engineering B, 1998, 56, 246-250.
161. R. Van Dover, L. Schneemeyer and R. M. Fleming, Nature, 1998, 392, 162-
164.
162. C. Olk, Measurement Science and Technology, 2005, 16, 14-20.
163. C. Olk, G. Tibbetts, D. Simon and J. J. Moleski, Journal of applied physics,
2003, 94, 720-725.
39
Chapter 2
Experimental
A short introduction to the in-situ and ex-situ techniques used to obtain data for this
thesis is provided in this chapter.
2.1 Ultra High Vacuum (UHV) Equipment
Ultra High Vacuum (UHV) equipment is crucial not only to preparing thin film
materials, but also for studying their surface properties. An outline of the UHV
equipment and techniques used will be detailed in the following section.
2.1.1 UHV Single Crystal Chamber
A UHV chamber was employed for mechanistic studies of crotyl alcohol selox
over ultra-thin Au on Pd(111) model surfaces. The design of the chamber was
based upon a 300 mm (12") spherical stainless steel chamber available
commercially from Vacuum Generators (VG). A simplified diagram of this
chamber is shown in Figure 2.1, and a colour photograph in Figure 2.2. The
chamber typically operated at a base pressure of < 1 × 10⁻¹⁰ Torr. This pressure was
achieved through the use of a Pfeiffer Turbomolecular pump, backed by an
Edwards 8 rotary pump. In addition, a three filament titanium sublimation pump (2
mm titanium filaments at ~ 50 A) was used for short periods overnight to remove
hydrogen from the chamber and was placed on a side arm to negate the possibly of
Ti sublimation onto the crystal itself.
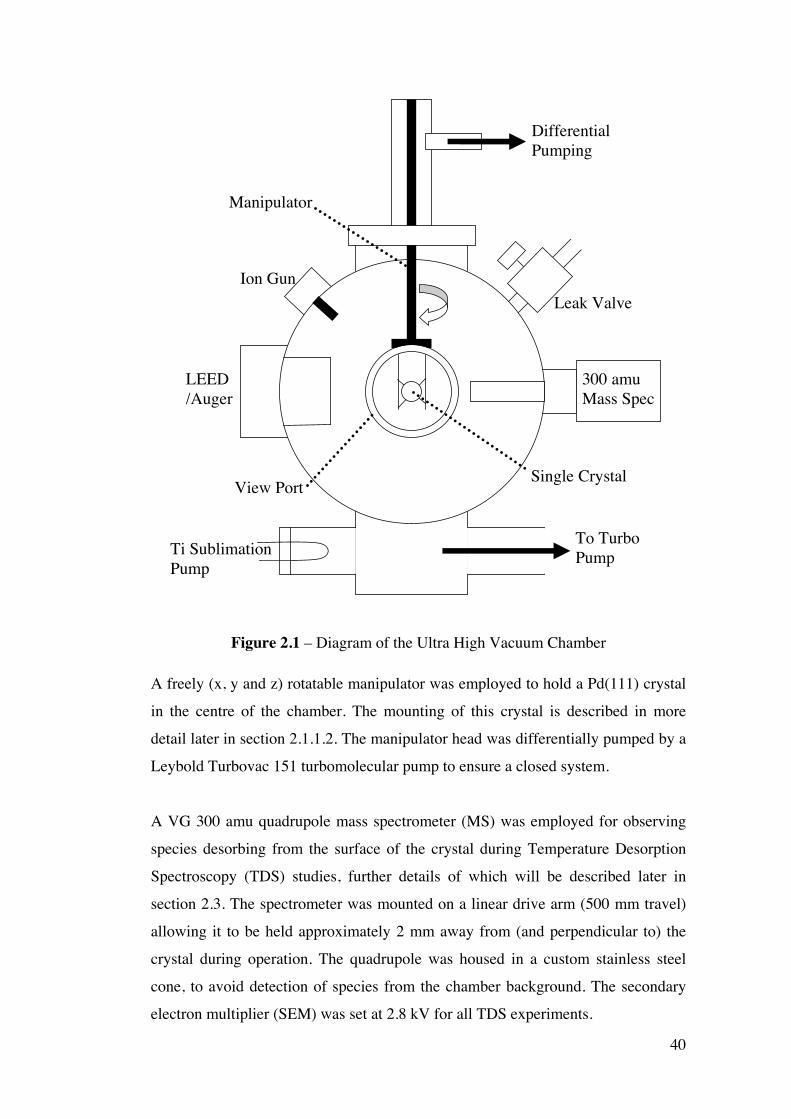
40
Ti Sublimation Pump
To Turbo Pump
300 amu Mass Spec
Leak Valve
Differential Pumping
Manipulator
LEED /Auger
Ion Gun
View Port Single Crystal
Figure 2.1 – Diagram of the Ultra High Vacuum Chamber
A freely (x, y and z) rotatable manipulator was employed to hold a Pd(111) crystal
in the centre of the chamber. The mounting of this crystal is described in more
detail later in section 2.1.1.2. The manipulator head was differentially pumped by a
Leybold Turbovac 151 turbomolecular pump to ensure a closed system.
A VG 300 amu quadrupole mass spectrometer (MS) was employed for observing
species desorbing from the surface of the crystal during Temperature Desorption
Spectroscopy (TDS) studies, further details of which will be described later in
section 2.3. The spectrometer was mounted on a linear drive arm (500 mm travel)
allowing it to be held approximately 2 mm away from (and perpendicular to) the
crystal during operation. The quadrupole was housed in a custom stainless steel
cone, to avoid detection of species from the chamber background. The secondary
electron multiplier (SEM) was set at 2.8 kV for all TDS experiments.
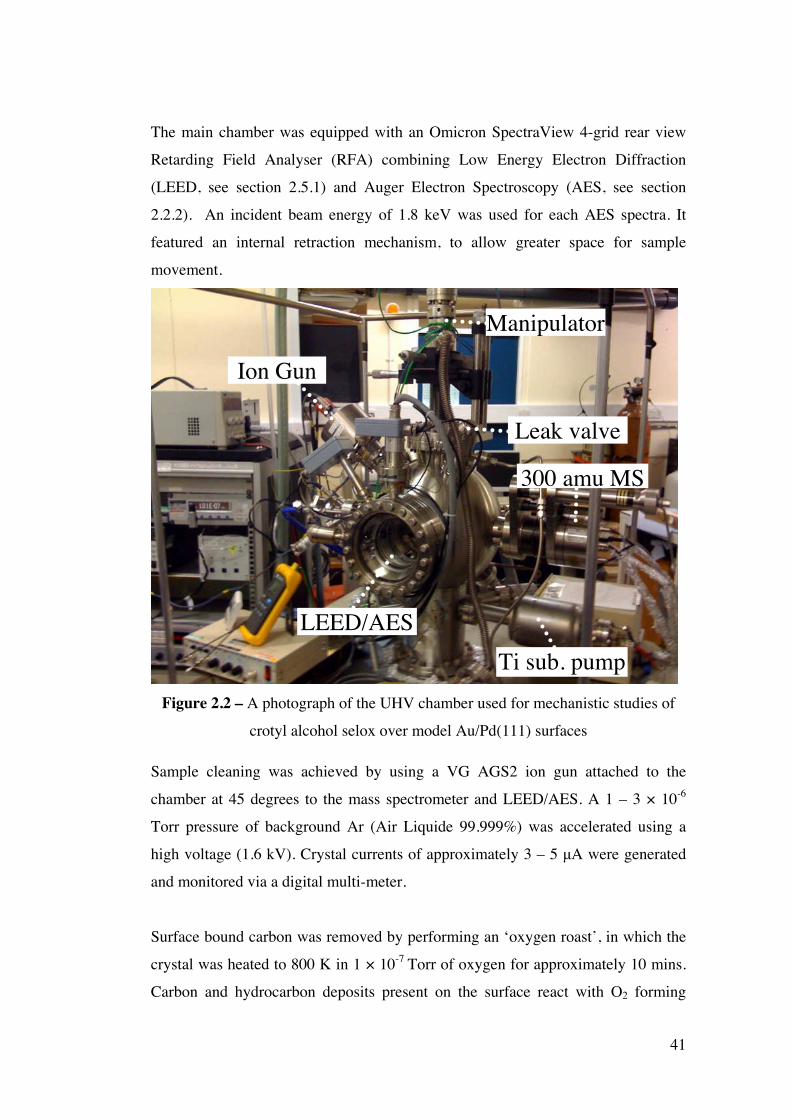
41
The main chamber was equipped with an Omicron SpectraView 4-grid rear view
Retarding Field Analyser (RFA) combining Low Energy Electron Diffraction
(LEED, see section 2.5.1) and Auger Electron Spectroscopy (AES, see section
2.2.2). An incident beam energy of 1.8 keV was used for each AES spectra. It
featured an internal retraction mechanism, to allow greater space for sample
movement.
Figure 2.2 – A photograph of the UHV chamber used for mechanistic studies of
crotyl alcohol selox over model Au/Pd(111) surfaces
Sample cleaning was achieved by using a VG AGS2 ion gun attached to the
chamber at 45 degrees to the mass spectrometer and LEED/AES. A 1 – 3 × 10⁻⁶
Torr pressure of background Ar (Air Liquide 99.999%) was accelerated using a
high voltage (1.6 kV). Crystal currents of approximately 3 – 5 µA were generated
and monitored via a digital multi-meter.
Surface bound carbon was removed by performing an ‘oxygen roast’, in which the
crystal was heated to 800 K in 1 × 10⁻⁷ Torr of oxygen for approximately 10 mins.
Carbon and hydrocarbon deposits present on the surface react with O2 forming
Manipulator
LEED/AES
300 amu MS
Ion Gun
Ti sub. pump
Leak valve
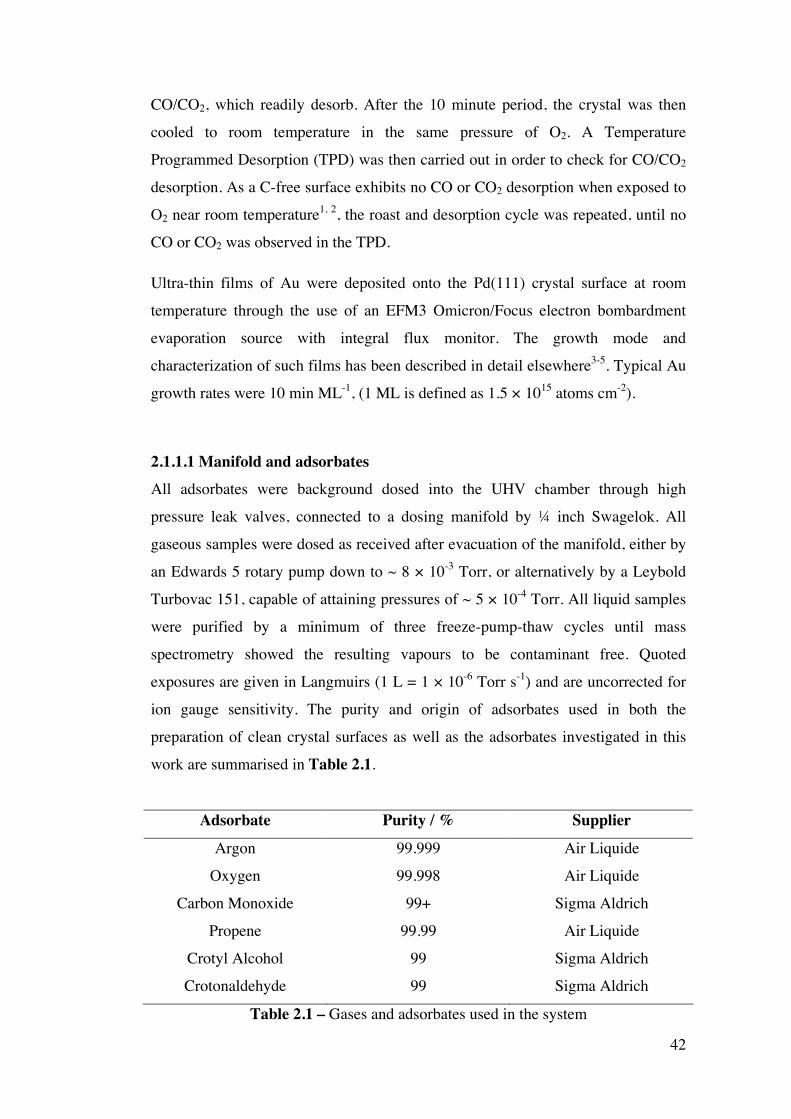
42
CO/CO2, which readily desorb. After the 10 minute period, the crystal was then
cooled to room temperature in the same pressure of O2. A Temperature
Programmed Desorption (TPD) was then carried out in order to check for CO/CO2
desorption. As a C-free surface exhibits no CO or CO2 desorption when exposed to
O2 near room temperature1, 2, the roast and desorption cycle was repeated, until no
CO or CO2 was observed in the TPD.
Ultra-thin films of Au were deposited onto the Pd(111) crystal surface at room
temperature through the use of an EFM3 Omicron/Focus electron bombardment
evaporation source with integral flux monitor. The growth mode and
characterization of such films has been described in detail elsewhere3-5. Typical Au
growth rates were 10 min ML-1, (1 ML is defined as 1.5 × 10¹⁵ atoms cm-2).
2.1.1.1 Manifold and adsorbates
All adsorbates were background dosed into the UHV chamber through high
pressure leak valves, connected to a dosing manifold by ¼ inch Swagelok. All
gaseous samples were dosed as received after evacuation of the manifold, either by
an Edwards 5 rotary pump down to ~ 8 × 10⁻³ Torr, or alternatively by a Leybold
Turbovac 151, capable of attaining pressures of ~ 5 × 10⁻⁴ Torr. All liquid samples
were purified by a minimum of three freeze-pump-thaw cycles until mass
spectrometry showed the resulting vapours to be contaminant free. Quoted
exposures are given in Langmuirs (1 L = 1 × 10⁻⁶ Torr s-1) and are uncorrected for
ion gauge sensitivity. The purity and origin of adsorbates used in both the
preparation of clean crystal surfaces as well as the adsorbates investigated in this
work are summarised in Table 2.1.
Adsorbate Purity / % Supplier
Argon 99.999 Air Liquide
Oxygen 99.998 Air Liquide
Carbon Monoxide 99+ Sigma Aldrich
Propene 99.99 Air Liquide
Crotyl Alcohol 99 Sigma Aldrich
Crotonaldehyde 99 Sigma Aldrich
Table 2.1 – Gases and adsorbates used in the system
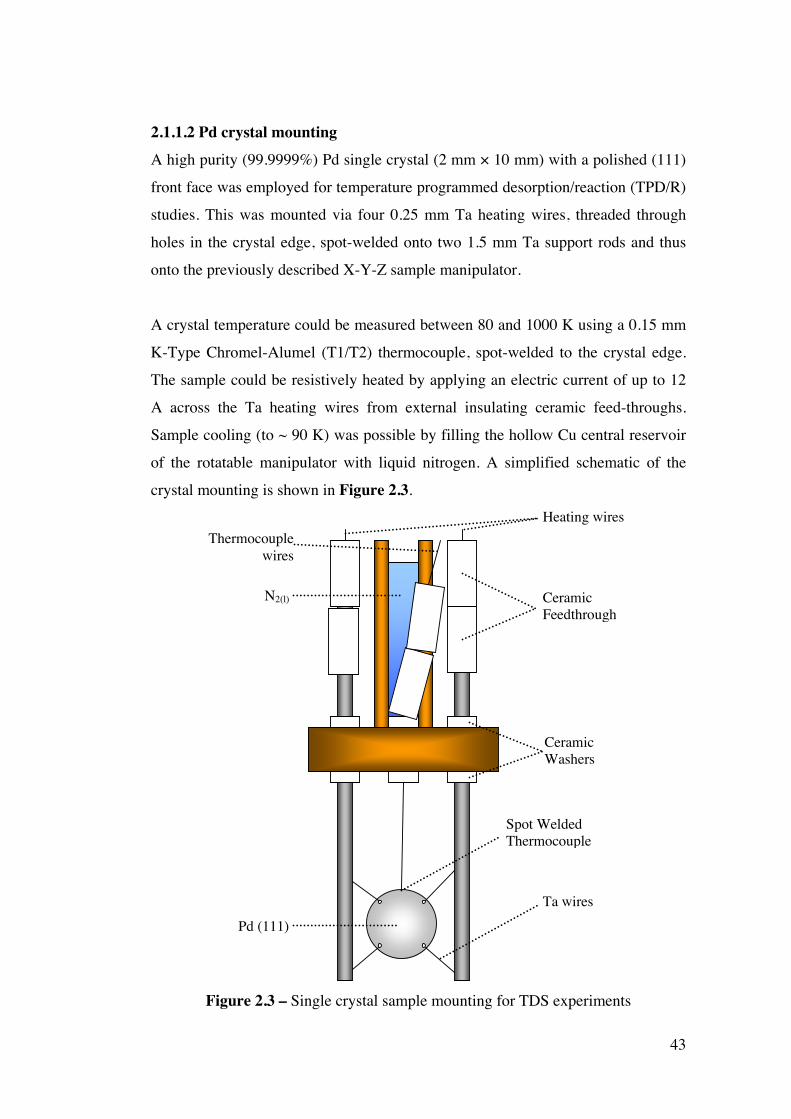
43
2.1.1.2 Pd crystal mounting
A high purity (99.9999%) Pd single crystal (2 mm × 10 mm) with a polished (111)
front face was employed for temperature programmed desorption/reaction (TPD/R)
studies. This was mounted via four 0.25 mm Ta heating wires, threaded through
holes in the crystal edge, spot-welded onto two 1.5 mm Ta support rods and thus
onto the previously described X-Y-Z sample manipulator.
A crystal temperature could be measured between 80 and 1000 K using a 0.15 mm
K-Type Chromel-Alumel (T1/T2) thermocouple, spot-welded to the crystal edge.
The sample could be resistively heated by applying an electric current of up to 12
A across the Ta heating wires from external insulating ceramic feed-throughs.
Sample cooling (to ~ 90 K) was possible by filling the hollow Cu central reservoir
of the rotatable manipulator with liquid nitrogen. A simplified schematic of the
crystal mounting is shown in Figure 2.3. Heating wires
Spot Welded Thermocouple
Ta wires Pd (111)
Ceramic Washers
Ceramic Feedthrough
N2(l)
Thermocouplewires
Figure 2.3 – Single crystal sample mounting for TDS experiments
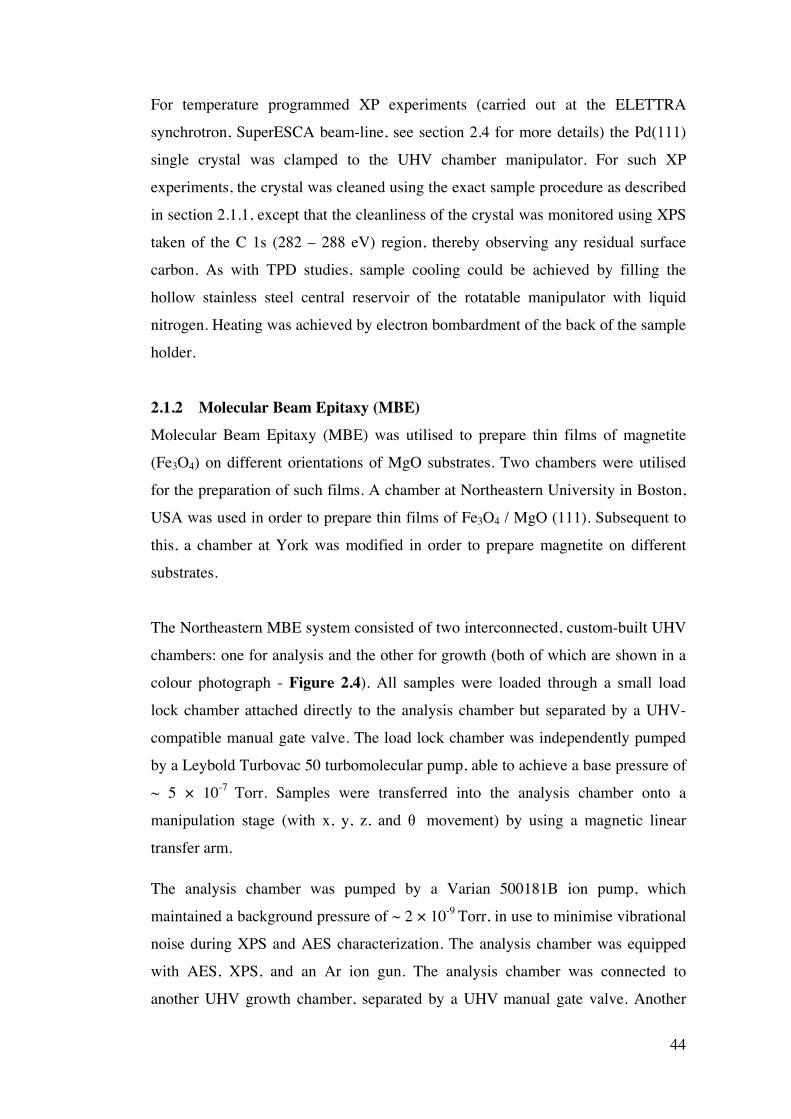
44
For temperature programmed XP experiments (carried out at the ELETTRA
synchrotron, SuperESCA beam-line, see section 2.4 for more details) the Pd(111)
single crystal was clamped to the UHV chamber manipulator. For such XP
experiments, the crystal was cleaned using the exact sample procedure as described
in section 2.1.1, except that the cleanliness of the crystal was monitored using XPS
taken of the C 1s (282 – 288 eV) region, thereby observing any residual surface
carbon. As with TPD studies, sample cooling could be achieved by filling the
hollow stainless steel central reservoir of the rotatable manipulator with liquid
nitrogen. Heating was achieved by electron bombardment of the back of the sample
holder.
2.1.2 Molecular Beam Epitaxy (MBE)
Molecular Beam Epitaxy (MBE) was utilised to prepare thin films of magnetite
(Fe3O4) on different orientations of MgO substrates. Two chambers were utilised
for the preparation of such films. A chamber at Northeastern University in Boston,
USA was used in order to prepare thin films of Fe3O4 / MgO (111). Subsequent to
this, a chamber at York was modified in order to prepare magnetite on different
substrates.
The Northeastern MBE system consisted of two interconnected, custom-built UHV
chambers: one for analysis and the other for growth (both of which are shown in a
colour photograph - Figure 2.4). All samples were loaded through a small load
lock chamber attached directly to the analysis chamber but separated by a UHV-
compatible manual gate valve. The load lock chamber was independently pumped
by a Leybold Turbovac 50 turbomolecular pump, able to achieve a base pressure of
~ 5 × 10⁻⁷ Torr. Samples were transferred into the analysis chamber onto a
manipulation stage (with x, y, z, and θmovement) by using a magnetic linear
transfer arm.
The analysis chamber was pumped by a Varian 500181B ion pump, which
maintained a background pressure of ~ 2 × 10⁻⁹ Torr, in use to minimise vibrational
noise during XPS and AES characterization. The analysis chamber was equipped
with AES, XPS, and an Ar ion gun. The analysis chamber was connected to
another UHV growth chamber, separated by a UHV manual gate valve. Another
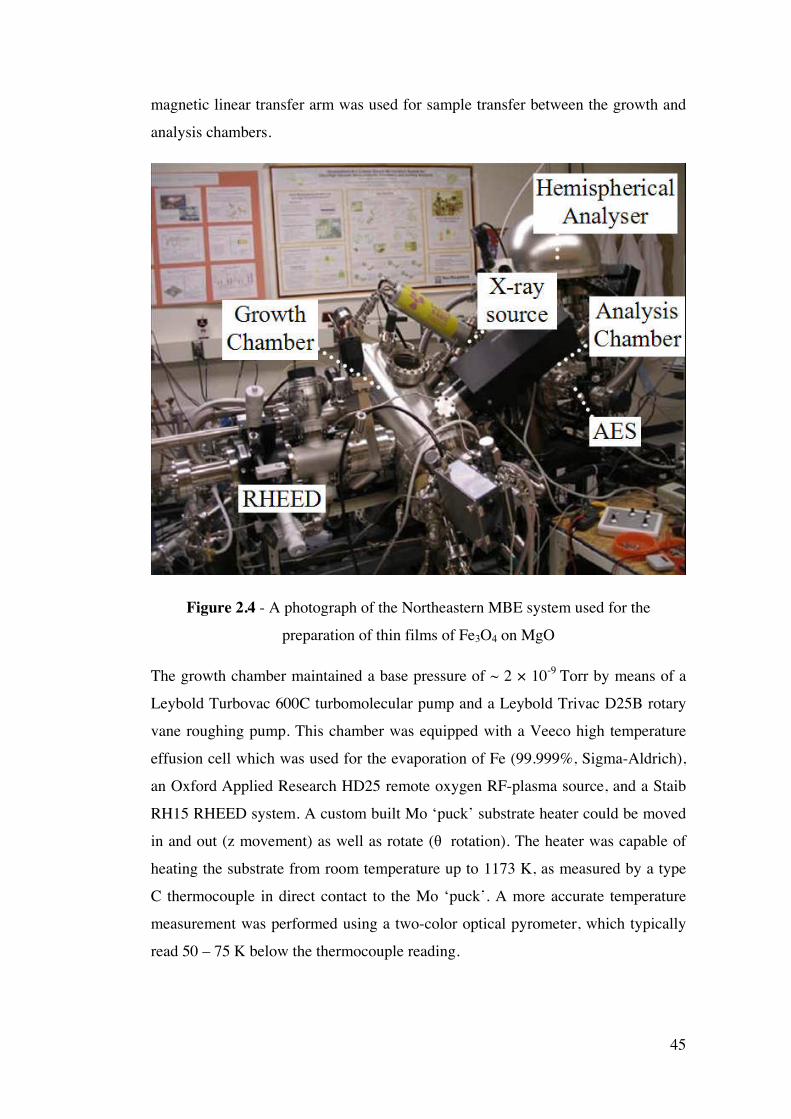
45
magnetic linear transfer arm was used for sample transfer between the growth and
analysis chambers.
Figure 2.4 - A photograph of the Northeastern MBE system used for the
preparation of thin films of Fe3O4 on MgO
The growth chamber maintained a base pressure of ~ 2 × 10⁻⁹ Torr by means of a
Leybold Turbovac 600C turbomolecular pump and a Leybold Trivac D25B rotary
vane roughing pump. This chamber was equipped with a Veeco high temperature
effusion cell which was used for the evaporation of Fe (99.999%, Sigma-Aldrich),
an Oxford Applied Research HD25 remote oxygen RF-plasma source, and a Staib
RH15 RHEED system. A custom built Mo ‘puck’ substrate heater could be moved
in and out (z movement) as well as rotate (θrotation). The heater was capable of
heating the substrate from room temperature up to 1173 K, as measured by a type
C thermocouple in direct contact to the Mo ‘puck’. A more accurate temperature
measurement was performed using a two-color optical pyrometer, which typically
read 50 – 75 K below the thermocouple reading.
46
Thin films of magnetite were prepared on MgO (111), by the following procedure.
Atomic oxygen was first introduced into the chamber through the use of the RF
plasma source. A pressure of oxygen was introduced into the chamber (~1 × 10⁻⁶
Torr) and ionised using an RF power of ~ 100 W. An Fe growth rate of 0.07 – 0.08
Å min-1 was achieved by heating Fe in the effusion cell to 1553 K.
The York MBE system was designed by Balzers. A schematic representation of the
York MBE chamber is displayed in Figure 2.5, and a colour photograph of the
system is also shown in Figure 2.6. The chamber base pressure of ~ 8 × 10⁻¹⁰ Torr
was achieved through the use of a Varian turbomolecular pump, backed by an
Edwards 8 rotary pump. A cryogenic pump in the form of a nitrogen cold trap was
also used during experiments to aid in obtaining the optimum base pressure.
Gases and/or vapours condense on the surface of the cold trap thereby decreasing
the overall chamber pressure. This trap was constructed out of copper tubing and
liquid nitrogen forced through the trap by a compressed air line. In addition, a three
filament titanium sublimation pump (2 mm titanium filaments at ~ 50 A) was used
for short periods overnight to remove hydrogen and other contaminants from the
chamber. To avoid deposition on the unwanted surfaces, the Ti filaments were
placed at the bottom of the chamber.
47
N2(l) cold trap
To Turbo Pump
Shutter
Shutter
Sample
Manipulator
RHEED e- gun
RHEED screen
Plasma Source
Hearth Sources
e- gun
Ti Sublimation Pump
e- beam Sample Heater
Figure 2.5 – A diagram of the York MBE system
A modified VSW freely (x, y and z) rotatable manipulator was employed to hold a
single crystal substrate contained in a modified Omicron sample plate in the centre
of the chamber. The manipulator head was differentially pumped by an Edwards 8
rotary pump to ensure a closed system. The loading of sample plates into the main
chamber was achieved by a sample exchange arm, housed in a separate chamber
and isolated from the main chamber by a gate valve. The pumping of this exchange
arm section was carried out by a small Pfeiffer turbomolecular pump and Edwards
5 rotary pump, achieving a base pressure of ~ 1 × 10⁻⁷ Torr.
The York MBE chamber also housed two 0.25 cm (1") water cooled hearth
evaporation sources at the base of the chamber with an independent shutter.
Evaporation of source material(s) placed in the hearths was possible by means of
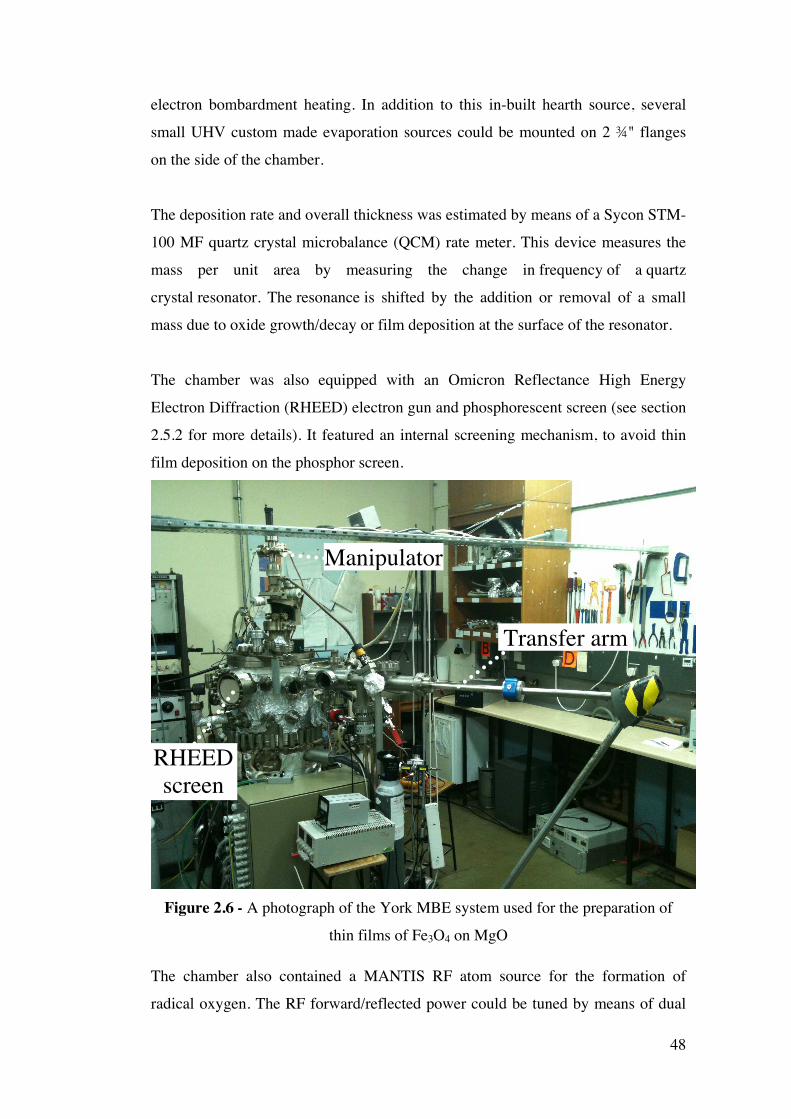
48
electron bombardment heating. In addition to this in-built hearth source, several
small UHV custom made evaporation sources could be mounted on 2 ¾" flanges
on the side of the chamber.
The deposition rate and overall thickness was estimated by means of a Sycon STM-
100 MF quartz crystal microbalance (QCM) rate meter. This device measures the
mass per unit area by measuring the change in frequency of a quartz
crystal resonator. The resonance is shifted by the addition or removal of a small
mass due to oxide growth/decay or film deposition at the surface of the resonator.
The chamber was also equipped with an Omicron Reflectance High Energy
Electron Diffraction (RHEED) electron gun and phosphorescent screen (see section
2.5.2 for more details). It featured an internal screening mechanism, to avoid thin
film deposition on the phosphor screen.
Figure 2.6 - A photograph of the York MBE system used for the preparation of
thin films of Fe3O4 on MgO
The chamber also contained a MANTIS RF atom source for the formation of
radical oxygen. The RF forward/reflected power could be tuned by means of dual
Manipulator
RHEEDscreen
Transfer arm
49
capacitors in order to maintain a stable plasma. As with the source on the
Northeastern MBE, the plasma was generated within an Al2O3 discharge tube and
exited the source through an Al2O3 aperture plate. This aperture initially contained
5 × 0.2 mm diameter holes in order to restrict the flow of oxygen into the chamber.
The size, quantity, and dispersion of the holes therefore determine the pressure at
which a stable plasma can be obtained. Initially the source had a plate which had
37 holes, which resulted in a pressure range too high for magnetite growth. As a
result, a new aperture plate was made in order to obtain a plasma at a lower oxygen
pressure. The source was also equipped with ion filter bias plates that were located
at the top of the discharge tube. These parallel plates were aligned parallel to the
flow of oxygen. By supplying a high voltage bias between the two plates, any
charged oxygen species could be deflected, meaning that only neutral species with
lower kinetic energy were involved in film growth.
A great deal of work was carried out in order to calibrate the source and obtain the
correct phase of iron oxide during growth. To this end, a calibration matrix was
prepared by growing numerous samples at various different growth rates, plasma
powers and oxygen partial pressures. Samples were analysed using vibrating
sample magnetometry (see section 2.6.1) four-point probe magnetoresistance (see
section 2.6.2), infra-red techniques (see section 2.6.3), and transmission electron
microscopy (see section 2.5.3). In this way, the stoichiometry, structure and
thickness of the films could be obtained, by which the conditions required to grow
magnetite could be determined.
The plasma source was typically operated at a pressure of 2 × 10⁻⁵ mbar and with a
plasma power of 200 W. Substrates were first prepared and cleaned by in-situ
annealing to ~ 1073 K in the presence of atomic oxygen and then held at a
temperature of ~ 523 K during deposition in order to promote epitaxial growth of
Fe3O4. Whilst maintaining the same flux of atomic oxygen, Fe was then evaporated
at a rate of ~ 0.1 Å s-1 allowing thin films of magnetite to be prepared.
2.1.3 Metastable De-excitation Spectroscopy (MDS)
Metastable De-excitation Spectroscopy (MDS) is a technique that probes the
surface electronic structure of a material using metastable atoms6 (in the case of
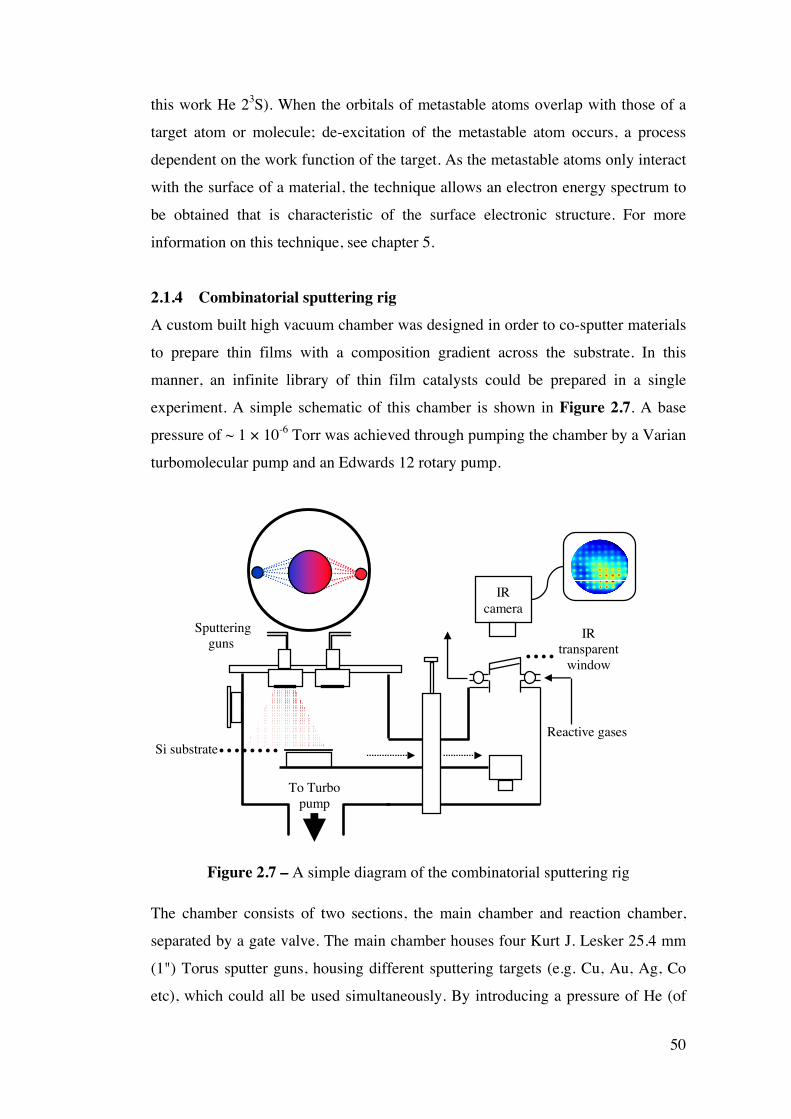
50
this work He 23S). When the orbitals of metastable atoms overlap with those of a
target atom or molecule; de-excitation of the metastable atom occurs, a process
dependent on the work function of the target. As the metastable atoms only interact
with the surface of a material, the technique allows an electron energy spectrum to
be obtained that is characteristic of the surface electronic structure. For more
information on this technique, see chapter 5.
2.1.4 Combinatorial sputtering rig
A custom built high vacuum chamber was designed in order to co-sputter materials
to prepare thin films with a composition gradient across the substrate. In this
manner, an infinite library of thin film catalysts could be prepared in a single
experiment. A simple schematic of this chamber is shown in Figure 2.7. A base
pressure of ~ 1 × 10⁻⁶ Torr was achieved through pumping the chamber by a Varian
turbomolecular pump and an Edwards 12 rotary pump.
Sputtering guns
Reactive gases
To Turbo pump
Si substrate
IR transparent
window
IR camera
Figure 2.7 – A simple diagram of the combinatorial sputtering rig
The chamber consists of two sections, the main chamber and reaction chamber,
separated by a gate valve. The main chamber houses four Kurt J. Lesker 25.4 mm
(1") Torus sputter guns, housing different sputtering targets (e.g. Cu, Au, Ag, Co
etc), which could all be used simultaneously. By introducing a pressure of He (of
51
the order of tens of mTorr), and applying a high voltage across each gun, a
magnetically confined plasma could be created in order to sputter the target
material. The gun angle, gun power and chamber pressure were all altered
independently, and for each case, several thick (~ 100 nm) films of Cu grown onto
Si (100). The thickness across the substrate for each of the corresponding films
could be measured using a Rank Taylor Hobson Talystep 1, and the varying
chemical composition determined by Horiba Jobin Yvon XGT-7000 micro X-ray
Fluorescence measurements. In this way, a calibration matrix could be prepared,
which provided that the relative sputtering rate for each target was known, a
sample with a desired thickness and composition could be grown.
Bi-metallic thin-film model catalyst libraries could then be prepared with a desired
composition and thickness by co-sputtering. These libraries could then be
introduced into the attached reaction chamber via a transfer mechanism. In this
chamber, reactive gases could be introduced and the catalytic activity of the library
rapidly screened by means of infrared thermography. An infrared camera could be
placed directly above the substrate, and the temperature accurately measured across
the sample during the course of a reaction via an infrared transparent window at the
top of the chamber. For exothermic reactions, the most active catalyst composition
could be determined by means of the ‘hottest spot’ on the surface. Conversely for
endothermic reactions, this would correspond to a ‘cold spot’ on the film surface.
2.2 Composition Analysis
The chemical composition and reactivity of thin-film surfaces were determined
using a variety of techniques, which are briefly outlined in the following section.
2.2.1 X-ray Photoelectron Spectroscopy (XPS)
X-ray Photoelectron Spectroscopy (XPS) also referred to as Electron Spectroscopy
for Chemical Analysis (ESCA), is a technique which allows surface elemental
analysis and characterisation of differing chemical environments. This technique
affords the measurement of chemical composition and characterisation of active
and decomposed species on the surface of a sample. Monochromatic X-rays are
fired at the sample; these photons excite and emit core level electrons from atoms
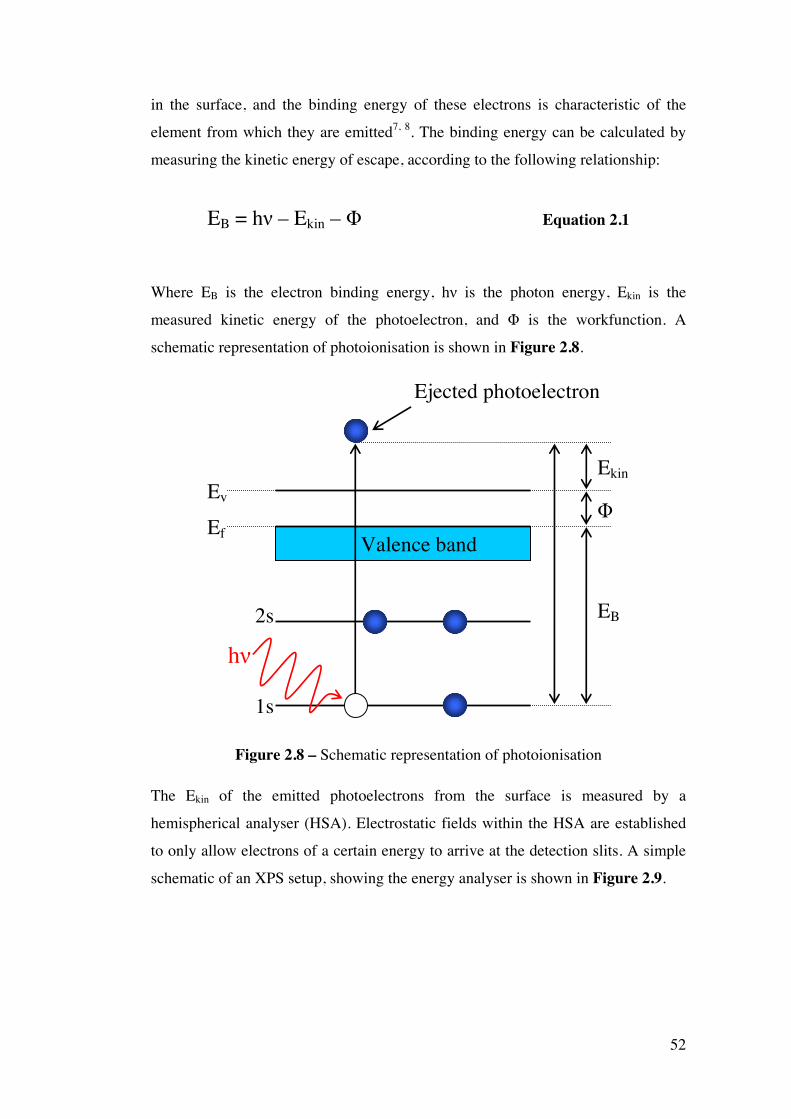
52
in the surface, and the binding energy of these electrons is characteristic of the
element from which they are emitted7, 8. The binding energy can be calculated by
measuring the kinetic energy of escape, according to the following relationship:
EB = hν – Ekin – Φ Equation 2.1
Where EB is the electron binding energy, hν is the photon energy, Ekin is the
measured kinetic energy of the photoelectron, and Φ is the workfunction. A
schematic representation of photoionisation is shown in Figure 2.8.
Valence band Ef
2s
1s
hν
EB
Φ
Ekin Ev
Ejected photoelectron
Figure 2.8 – Schematic representation of photoionisation
The Ekin of the emitted photoelectrons from the surface is measured by a
hemispherical analyser (HSA). Electrostatic fields within the HSA are established
to only allow electrons of a certain energy to arrive at the detection slits. A simple
schematic of an XPS setup, showing the energy analyser is shown in Figure 2.9.
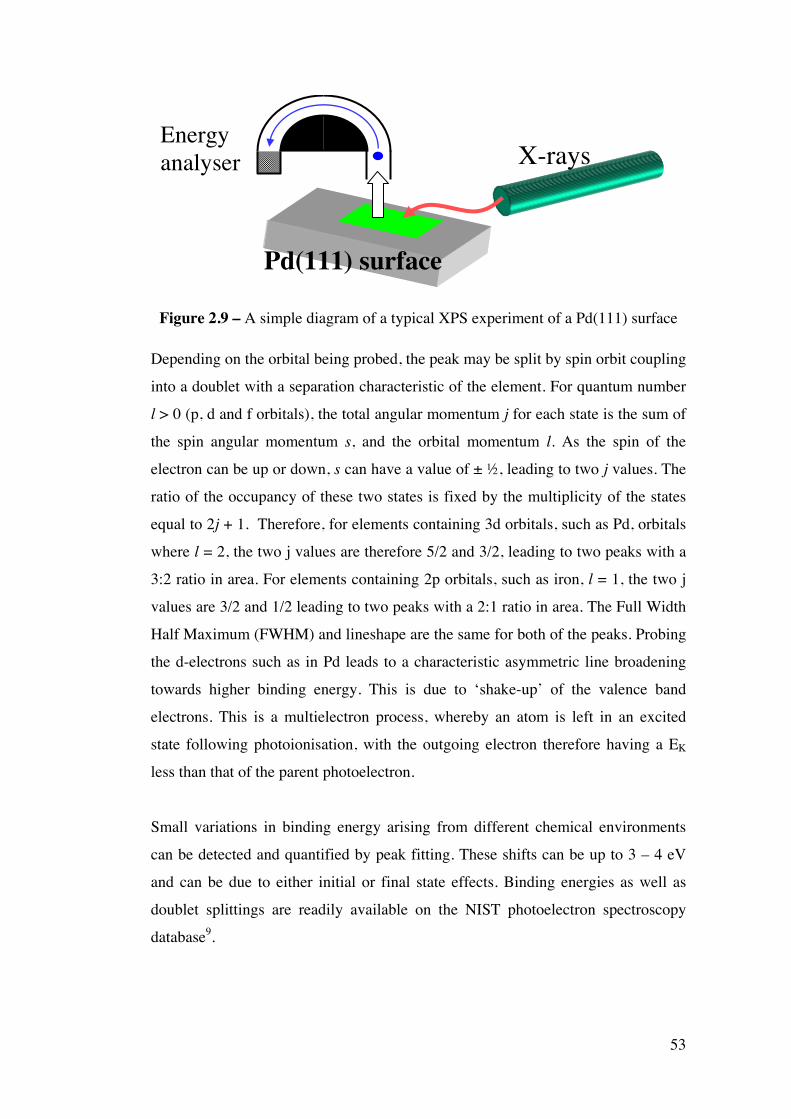
53
X-rays
Energy analyser
Pd(111) surface
Figure 2.9 – A simple diagram of a typical XPS experiment of a Pd(111) surface
Depending on the orbital being probed, the peak may be split by spin orbit coupling
into a doublet with a separation characteristic of the element. For quantum number
l > 0 (p, d and f orbitals), the total angular momentum j for each state is the sum of
the spin angular momentum s, and the orbital momentum l. As the spin of the
electron can be up or down, s can have a value of ± ½, leading to two j values. The
ratio of the occupancy of these two states is fixed by the multiplicity of the states
equal to 2j + 1. Therefore, for elements containing 3d orbitals, such as Pd, orbitals
where l = 2, the two j values are therefore 5/2 and 3/2, leading to two peaks with a
3:2 ratio in area. For elements containing 2p orbitals, such as iron, l = 1, the two j
values are 3/2 and 1/2 leading to two peaks with a 2:1 ratio in area. The Full Width
Half Maximum (FWHM) and lineshape are the same for both of the peaks. Probing
the d-electrons such as in Pd leads to a characteristic asymmetric line broadening
towards higher binding energy. This is due to ‘shake-up’ of the valence band
electrons. This is a multielectron process, whereby an atom is left in an excited
state following photoionisation, with the outgoing electron therefore having a EK
less than that of the parent photoelectron.
Small variations in binding energy arising from different chemical environments
can be detected and quantified by peak fitting. These shifts can be up to 3 – 4 eV
and can be due to either initial or final state effects. Binding energies as well as
doublet splittings are readily available on the NIST photoelectron spectroscopy
database9.
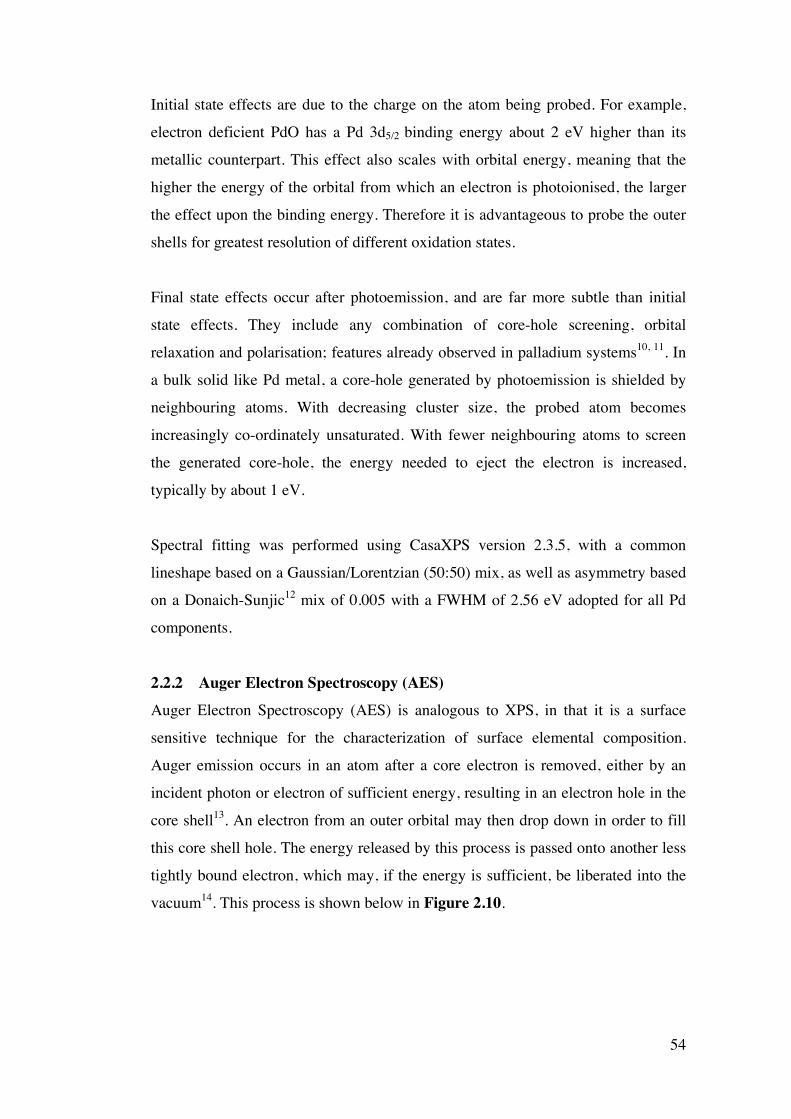
54
Initial state effects are due to the charge on the atom being probed. For example,
electron deficient PdO has a Pd 3d5/2 binding energy about 2 eV higher than its
metallic counterpart. This effect also scales with orbital energy, meaning that the
higher the energy of the orbital from which an electron is photoionised, the larger
the effect upon the binding energy. Therefore it is advantageous to probe the outer
shells for greatest resolution of different oxidation states.
Final state effects occur after photoemission, and are far more subtle than initial
state effects. They include any combination of core-hole screening, orbital
relaxation and polarisation; features already observed in palladium systems10, 11. In
a bulk solid like Pd metal, a core-hole generated by photoemission is shielded by
neighbouring atoms. With decreasing cluster size, the probed atom becomes
increasingly co-ordinately unsaturated. With fewer neighbouring atoms to screen
the generated core-hole, the energy needed to eject the electron is increased,
typically by about 1 eV.
Spectral fitting was performed using CasaXPS version 2.3.5, with a common
lineshape based on a Gaussian/Lorentzian (50:50) mix, as well as asymmetry based
on a Donaich-Sunjic12 mix of 0.005 with a FWHM of 2.56 eV adopted for all Pd
components.
2.2.2 Auger Electron Spectroscopy (AES)
Auger Electron Spectroscopy (AES) is analogous to XPS, in that it is a surface
sensitive technique for the characterization of surface elemental composition.
Auger emission occurs in an atom after a core electron is removed, either by an
incident photon or electron of sufficient energy, resulting in an electron hole in the
core shell13. An electron from an outer orbital may then drop down in order to fill
this core shell hole. The energy released by this process is passed onto another less
tightly bound electron, which may, if the energy is sufficient, be liberated into the
vacuum14. This process is shown below in Figure 2.10.
55
Ef Ev
Valence band
EK
Φ Ekin
e- or hν
L2,3
L1
K
EL 2,3
EL 1
Auger electron
Figure 2.10 – Auger emission due to ionisation by an incident electron or photon
These electrons may originate from depths of typically a few angstroms, giving
great surface sensitivity15. The energy of the ejected Auger electron may therefore
be obtained by the following expression:
Ekin ~ EK – EL1 – EL2,3 Equation 2.2
This phenomenon can be exploited to obtain the elemental composition of a
sample, as the energies of the ejected Auger electrons are characteristic13, 16.
2.2.3 Ultraviolet Photoemission Spectroscopy (UPS)
Ultraviolet Photoemission Spectroscopy (UPS) is a method of probing the occupied
density of states (DOS) of the near surface of a material7. UV photons are created
in a continuous discharge source through the application of a high voltage through
a portion of helium gas. These UV photons are then targeted onto the sample under
investigation.
As with XPS (see section 2.2.1), the UV photons liberate electrons into the
vacuum, due to the photoelectric effect (as depicted in Figure 2.8). The kinetic
energy of the emitted electrons is detected using a hemispherical analyser (HSA).
Such photons may penetrate several nanometers into the surface, and as such some
56
bulk states as well as the surface electronic states will be probed. As a result, the
escape depth of the electron involved is of importance.
For the York UPS system, photons are generated by the He I α transition which
have an energy of 21.22 eV (λ = 58.43 nm). This is at an energy close to that of the
23S metastable He state used in MDS (see section 2.1.3), and as a result it is a very
useful complementary technique to MDS.
2.3 Thermal Desorption Spectroscopy (TDS)
Thermal Desorption Spectroscopy (TDS) is used to monitor reversibly bound
reactants as well as reactively formed products desorbing from a crystal surface. By
monitoring these desorbing species, important information on the strength of lateral
adatom interactions, the activation enthalpy for desorption and the relative surface
coverage of an adsorbate can be obtained17. A quadrupole mass spectrometer is
positioned to within 2 mm of the sample surface under UHV conditions. The
sample is then rapidly heated from a low temperature (~120 K) and a quadrupole
mass spectrometer combined with electron multiplier filter detects species which
desorb from the surface. A heated filament causes ionisation of the desorbed
molecules, which are then accelerated into the quadrupole detector with a potential
difference. Through a combined series of variable A.C. and D.C. voltages applied
to the quadrupole detector, only ions with a specific mass reach the electron
multiplier, where they are subsequently identified.
A thermocouple attached to the single crystal records accurate temperatures. A plot
of the temperature versus the various mass fragments is known as a TPD/R
spectrum. This provides information about the type of species formed at a surface,
the nature of the surface intermediates produced from chemical reactions and,
importantly, fundamental kinetic data regarding their formation and desorption. A
typical quadrupole mass spectrometer is capable of simultaneously sampling up to
16 different mass fragments in the range of 0 – 300 atomic mass units at
sufficiently fast scan rates (< 0.2 s scan-1). TPD/TPR spectra were acquired using
the system described in section 2.1.1, using a VG 300 amu quadrupole mass
spectrometer, with a heating rate of ~ 10 K s-1.
57
2.4 Temperature Programmed XP studies
Temperature programmed XPS involves the sample principles as standard XPS, as
discussed in section 2.2.1. Ordinarily, synchrotron radiation is not required in order
to perform XPS14, but it is essential for temperature programmed studies18-21, which
require fast spectral acquisition (seconds as opposed to minutes). Third-generation
synchrotrons afford a very high photon flux, along with the use of advanced
double-pass hemispherical analysers, both of which allow XPS spectra to be
acquired rapidly. A smaller x-ray line width also affords superior signal to noise as
well as high spectral resolution.
Adsorbates are typically dosed onto the crystal surface at low temperature (~ 100
K) and then monitored by XPS. This gives information regarding the nature of the
adsorbate binding, and also allows measurement of the adsorbate surface coverage.
The thermal chemistry of the adsorbates is then monitored by increasing the
temperature of the metal surface whilst also acquiring ‘fast’ XP spectra. This
technique therefore allows qualitative identification of the surface intermediates in
real time, which therefore greatly aids elucidation of the reaction pathway of the
adsorbate over catalytically relevant metal surfaces22.
XPS measurements were carried out at the SuperESCA beamline of the ELETTRA
synchrotron in Trieste, Italy. The Pd(111) crystal was mounted, prepared and
cleaned by standard procedure (as described in sections 2.1.1 and 2.1.1.2) and
maintained in UHV (~ 1 × 10⁻¹⁰ Torr). Quoted exposures are given in Langmuirs
and are uncorrected for ion gauge sensitivity. The crystal was held at ~ 90 K whilst
dosing.
C 1s XP spectra were acquired at a photon energy of 400 eV and energy referenced
to the Fermi level. The limiting spectral resolution was ~ 150 meV. Individual
spectra were acquired approximately every 30 seconds during Fast XP
measurements and Shirley background subtracted over the entire elemental region.
Temperature programmed XP spectra were acquired by application of a linear
heating rate (~ 0.4 K s-1) to the exposed sample. Spectra were fitted using CasaXPS
version 2.3.5 using the minimum number of peaks required in order to minimise
the R factor. A common lineshape derived from graphitic carbon was employed for
all C 1s components, based on a Gaussia/Lorentzian (70:30) mix, with a common
58
FWHM of 0.58 eV. Coverages are defined in terms of monolayers
(adsorbates/surface Pd atom) with 1 ML = 1.5 x 10¹⁵ atoms. Absolute carbon
coverages were determined by calibration with CO which has a saturation value of
0.75 ML on Pd(111) at 100 K23, 24. Temperature programmed reaction spectra were
also acquired in a separate system (described in section 2.1.1), to examine
desorbing species, using a VG 300 amu quadrupole mass spectrometer, with a
heating rate of ~ 10 K s-1, to complement the XP studies and complete the
elucidation of the reaction pathway.
2.5 Structural Analysis
The structure of thin-films was characterised using the following techniques, either
in-situ (in UHV) for Low Energy Electron Diffraction and Reflectance High
Energy Electron Diffraction, or ex-situ using Transmission Electron Microscopy.
2.5.1 Low Energy Electron Diffraction (LEED)
LEED is a technique which is used to obtain detailed information of the crystal
structure of a surface. It was first employed by researchers in 1927, who were
demonstrating the wave-like nature of electrons25. Low energy electrons do not
penetrate far into the surface of a material, meaning that they are an ideal surface
structural probe16. Indeed, it is possible to examine the atomic arrangement of
atoms making up the first 5 to 20 Å of a metal surface26. Due to the high surface
sensitivity of the technique, a well-ordered, clean surface is necessary.
UHV pressures are needed due to the extreme surface sensitivity of LEED to
changes in the surface structure or long-range order. The low energy electrons (20
– 500 eV) employed have a short elastic mean free path of approximately 2 mm at
atmospheric pressure. These electrons are fired at the crystal surface, where they
will be diffracted by the crystal structure and a small proportion will be
backscattered. Such electrons then pass through a series of retarding grids at
varying potentials which are employed to selectively allow only elastically
backscattered electrons through and are detected on a phosphor detection screen.
In terms of the interference pattern obtained, the arrangement of maxima
corresponds to the reciprocal lattice of the surface. Regularly ordered surfaces or
59
adsorbates produce regular diffraction spots which can be used to deduce the 2D
structure of the surface, although the interpretation can be very difficult. Due to the
high surface sensitivity of the technique, slight surface disorder causes diffuse
patterns, but due to the large analysis area (mm scale) information on the partial
ordering of surface atoms can still be obtained.
2.5.2 Reflection High Energy Electron Diffraction (RHEED)
As detailed above, LEED utilises the inherent surface sensitivity associated with
low energy electrons in order to sample the surface structure of a material. As the
primary electron energy is increased the surface sensitivity decreases, and the
forward scattering also becomes much more important. Therefore, in order to
extract surface structural information from the diffraction of high energy electrons,
a reflection geometry can be utilised, in which the electron beam is incident at a
grazing angle; a technique referred to as Reflection High Energy Electron
Diffraction (RHEED).
This technique is commonly used to measure the surface crystallography in an
MBE experiment, as glancing angle geometry has several practical advantages over
LEED, namely being the ease of access around a sample16. As RHEED does not
rely on back-scattered electrons it also has the added advantage that it can be
conducted through a wide variety of angles, allowing the beam to be aligned along
specific crystallographic directions on the surface. However, the angle at which the
electrons intersect the crystal lattice (the azimuthal angle) affects both the geometry
and intensity of patterns obtained13.
In terms of the operation of the technique, a high energy electron beam (3 - 100
keV) is directed at the sample surface at a grazing angle. The electrons are
diffracted by the crystal structure of the sample and then impinge on a phosphor
screen mounted opposite to the electron gun. The resulting diffraction pattern
formed is a series of streaks. The distance between the streaks is an indication of
the unit cell size of the surface lattice. If a surface is atomically flat, sharp RHEED
streaks are observed, whereas a rough surface produces diffuse streaks. Using this
technique, it is possible to monitor the atomic layer-by-atomic layer growth of
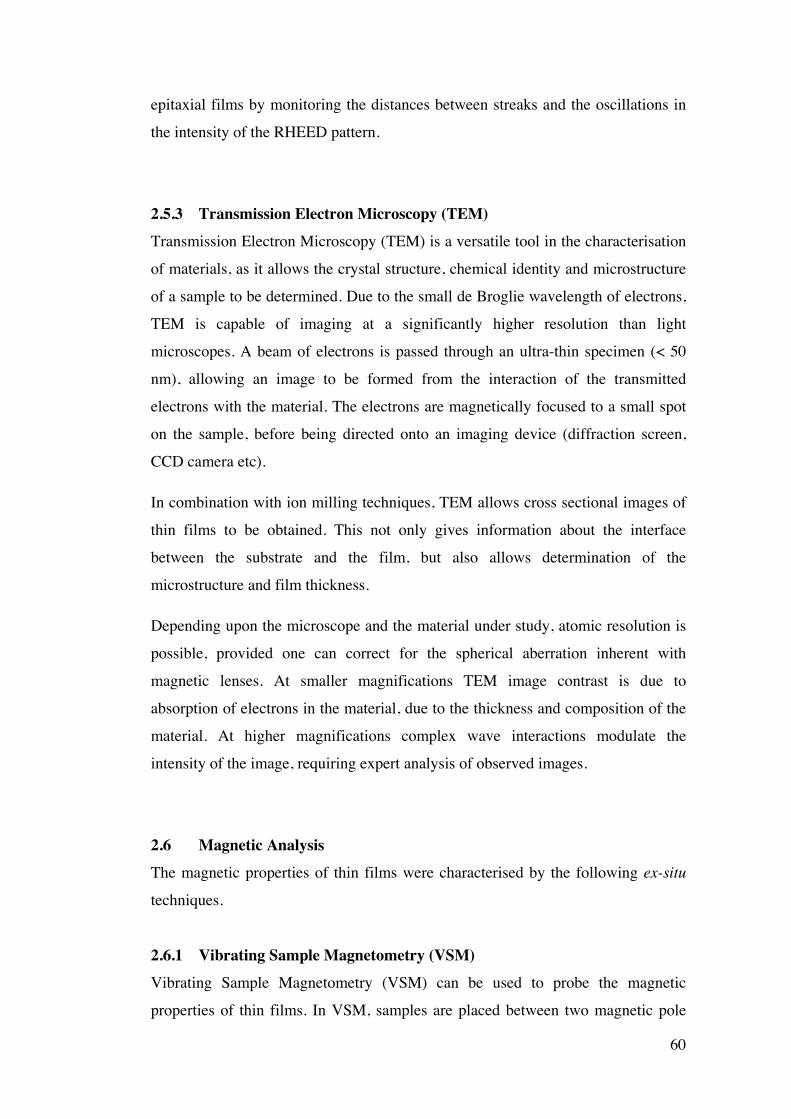
60
epitaxial films by monitoring the distances between streaks and the oscillations in
the intensity of the RHEED pattern.
2.5.3 Transmission Electron Microscopy (TEM)
Transmission Electron Microscopy (TEM) is a versatile tool in the characterisation
of materials, as it allows the crystal structure, chemical identity and microstructure
of a sample to be determined. Due to the small de Broglie wavelength of electrons,
TEM is capable of imaging at a significantly higher resolution than light
microscopes. A beam of electrons is passed through an ultra-thin specimen (< 50
nm), allowing an image to be formed from the interaction of the transmitted
electrons with the material. The electrons are magnetically focused to a small spot
on the sample, before being directed onto an imaging device (diffraction screen,
CCD camera etc).
In combination with ion milling techniques, TEM allows cross sectional images of
thin films to be obtained. This not only gives information about the interface
between the substrate and the film, but also allows determination of the
microstructure and film thickness.
Depending upon the microscope and the material under study, atomic resolution is
possible, provided one can correct for the spherical aberration inherent with
magnetic lenses. At smaller magnifications TEM image contrast is due to
absorption of electrons in the material, due to the thickness and composition of the
material. At higher magnifications complex wave interactions modulate the
intensity of the image, requiring expert analysis of observed images.
2.6 Magnetic Analysis
The magnetic properties of thin films were characterised by the following ex-situ
techniques.
2.6.1 Vibrating Sample Magnetometry (VSM)
Vibrating Sample Magnetometry (VSM) can be used to probe the magnetic
properties of thin films. In VSM, samples are placed between two magnetic pole
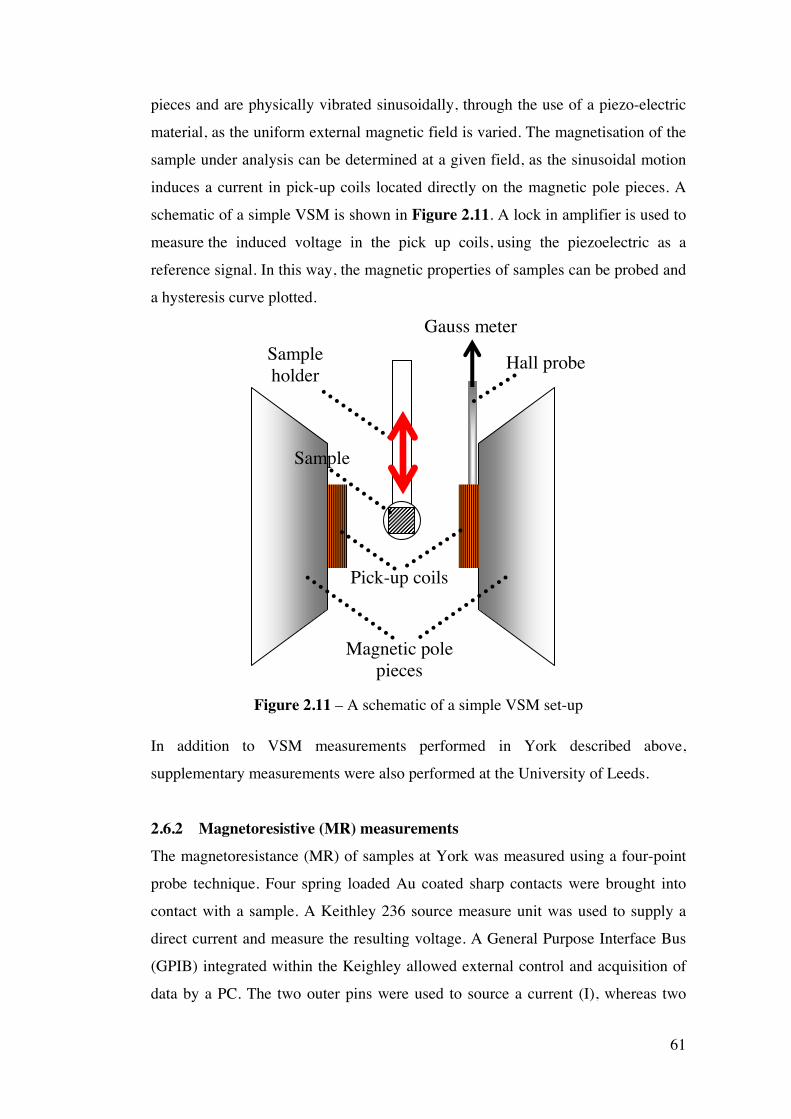
61
pieces and are physically vibrated sinusoidally, through the use of a piezo-electric
material, as the uniform external magnetic field is varied. The magnetisation of the
sample under analysis can be determined at a given field, as the sinusoidal motion
induces a current in pick-up coils located directly on the magnetic pole pieces. A
schematic of a simple VSM is shown in Figure 2.11. A lock in amplifier is used to
measure the induced voltage in the pick up coils, using the piezoelectric as a
reference signal. In this way, the magnetic properties of samples can be probed and
a hysteresis curve plotted.
Hall probe
Sample
Magnetic pole pieces
Gauss meter Sample holder
Pick-up coils
Figure 2.11 – A schematic of a simple VSM set-up
In addition to VSM measurements performed in York described above,
supplementary measurements were also performed at the University of Leeds.
2.6.2 Magnetoresistive (MR) measurements
The magnetoresistance (MR) of samples at York was measured using a four-point
probe technique. Four spring loaded Au coated sharp contacts were brought into
contact with a sample. A Keithley 236 source measure unit was used to supply a
direct current and measure the resulting voltage. A General Purpose Interface Bus
(GPIB) integrated within the Keighley allowed external control and acquisition of
data by a PC. The two outer pins were used to source a current (I), whereas two
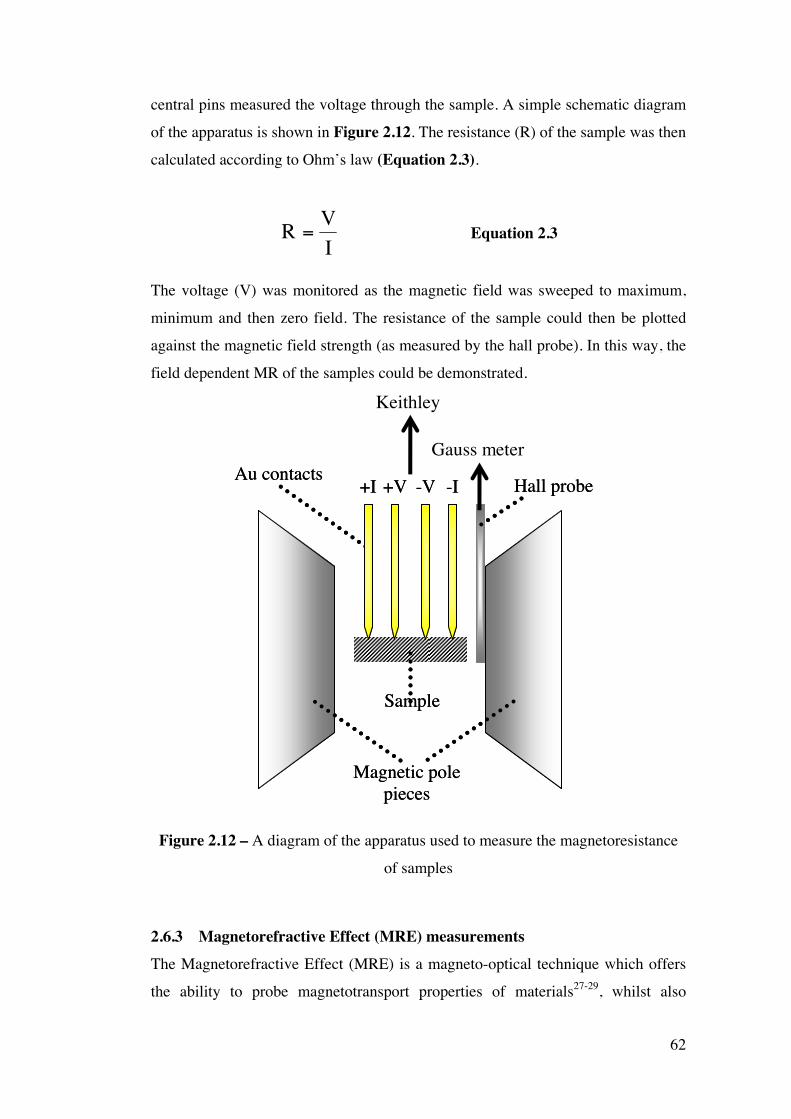
62
central pins measured the voltage through the sample. A simple schematic diagram
of the apparatus is shown in Figure 2.12. The resistance (R) of the sample was then
calculated according to Ohm’s law (Equation 2.3).
IVR = Equation 2.3
The voltage (V) was monitored as the magnetic field was sweeped to maximum,
minimum and then zero field. The resistance of the sample could then be plotted
against the magnetic field strength (as measured by the hall probe). In this way, the
field dependent MR of the samples could be demonstrated.
Sample
Magnetic pole pieces
Hall probe Au contacts +I -I +V -V Hall probe
Sample
Magnetic pole pieces
Au contacts +I -I +V -V
Keithley
Gauss meter
Figure 2.12 – A diagram of the apparatus used to measure the magnetoresistance
of samples
2.6.3 Magnetorefractive Effect (MRE) measurements
The Magnetorefractive Effect (MRE) is a magneto-optical technique which offers
the ability to probe magnetotransport properties of materials27-29, whilst also
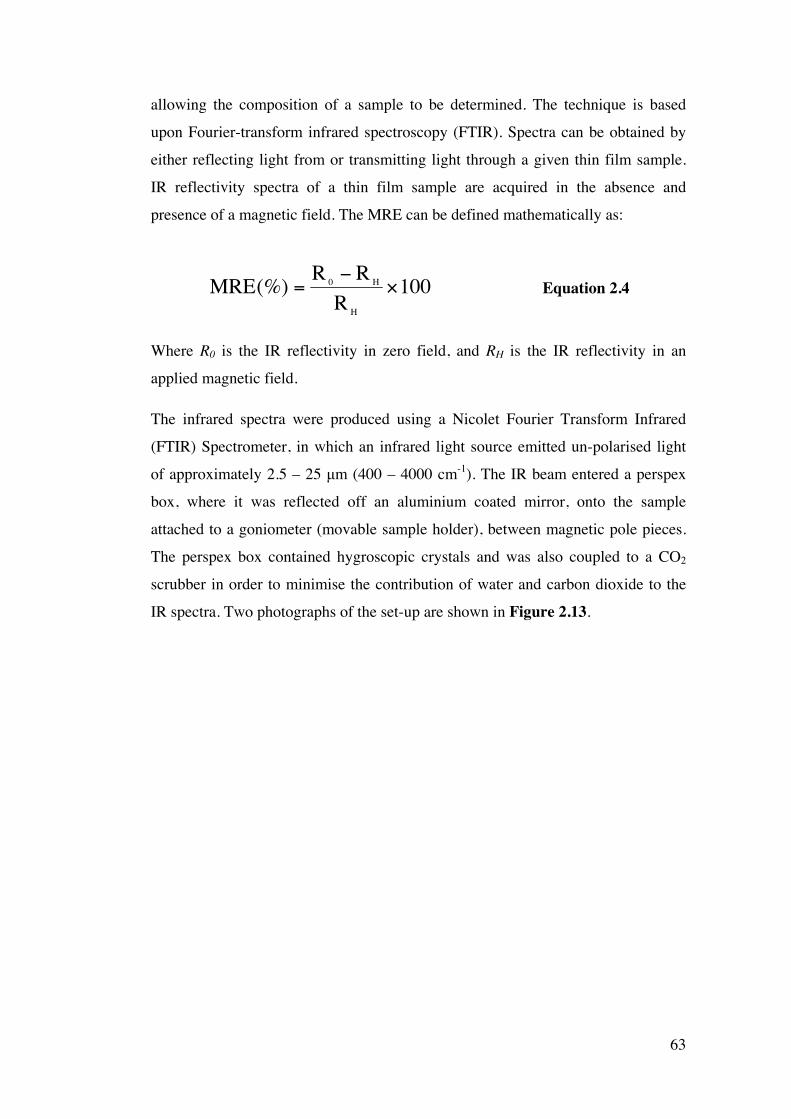
63
allowing the composition of a sample to be determined. The technique is based
upon Fourier-transform infrared spectroscopy (FTIR). Spectra can be obtained by
either reflecting light from or transmitting light through a given thin film sample.
IR reflectivity spectra of a thin film sample are acquired in the absence and
presence of a magnetic field. The MRE can be defined mathematically as:
100R
RR(%)MREH
H0 ×−
= Equation 2.4
Where R0 is the IR reflectivity in zero field, and RH is the IR reflectivity in an
applied magnetic field.
The infrared spectra were produced using a Nicolet Fourier Transform Infrared
(FTIR) Spectrometer, in which an infrared light source emitted un-polarised light
of approximately 2.5 – 25 µm (400 – 4000 cm-1). The IR beam entered a perspex
box, where it was reflected off an aluminium coated mirror, onto the sample
attached to a goniometer (movable sample holder), between magnetic pole pieces.
The perspex box contained hygroscopic crystals and was also coupled to a CO2
scrubber in order to minimise the contribution of water and carbon dioxide to the
IR spectra. Two photographs of the set-up are shown in Figure 2.13.
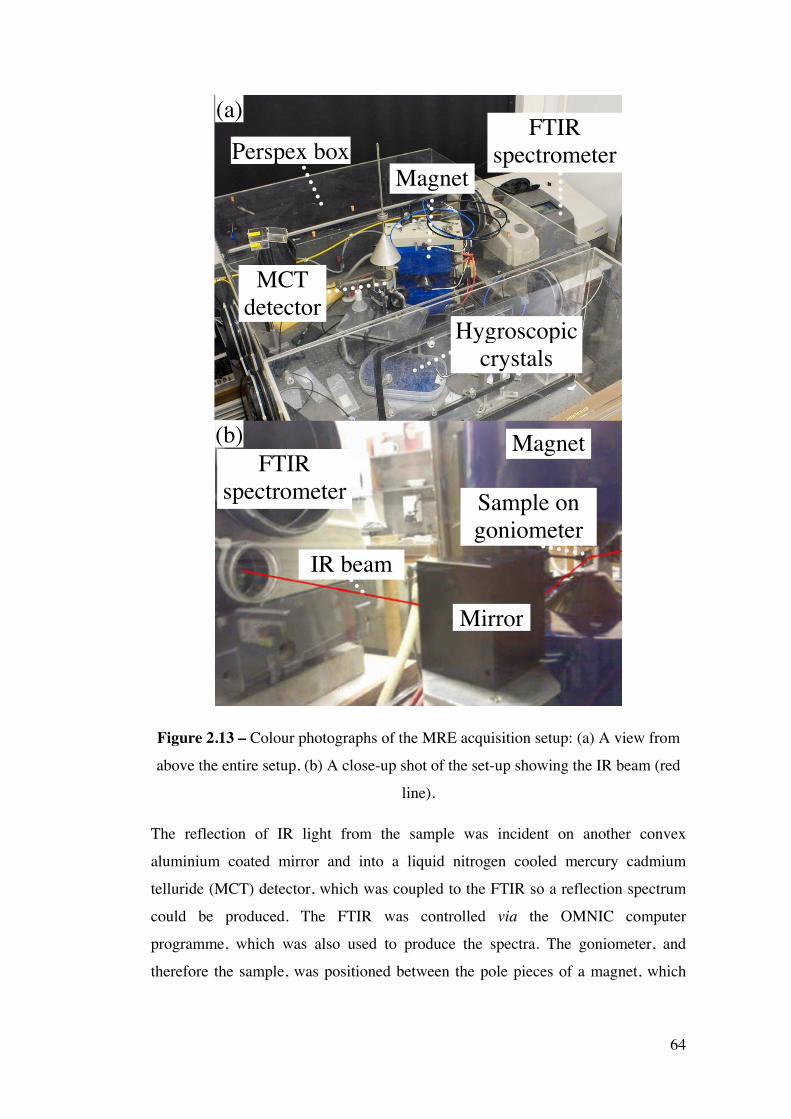
64
Figure 2.13 – Colour photographs of the MRE acquisition setup: (a) A view from
above the entire setup, (b) A close-up shot of the set-up showing the IR beam (red
line).
The reflection of IR light from the sample was incident on another convex
aluminium coated mirror and into a liquid nitrogen cooled mercury cadmium
telluride (MCT) detector, which was coupled to the FTIR so a reflection spectrum
could be produced. The FTIR was controlled via the OMNIC computer
programme, which was also used to produce the spectra. The goniometer, and
therefore the sample, was positioned between the pole pieces of a magnet, which
Perspex box Magnet
FTIR spectrometer
MCT detector
Hygroscopic crystals
(a)
Magnet FTIR
spectrometer
Mirror
Sample on goniometer
IR beam
(b)
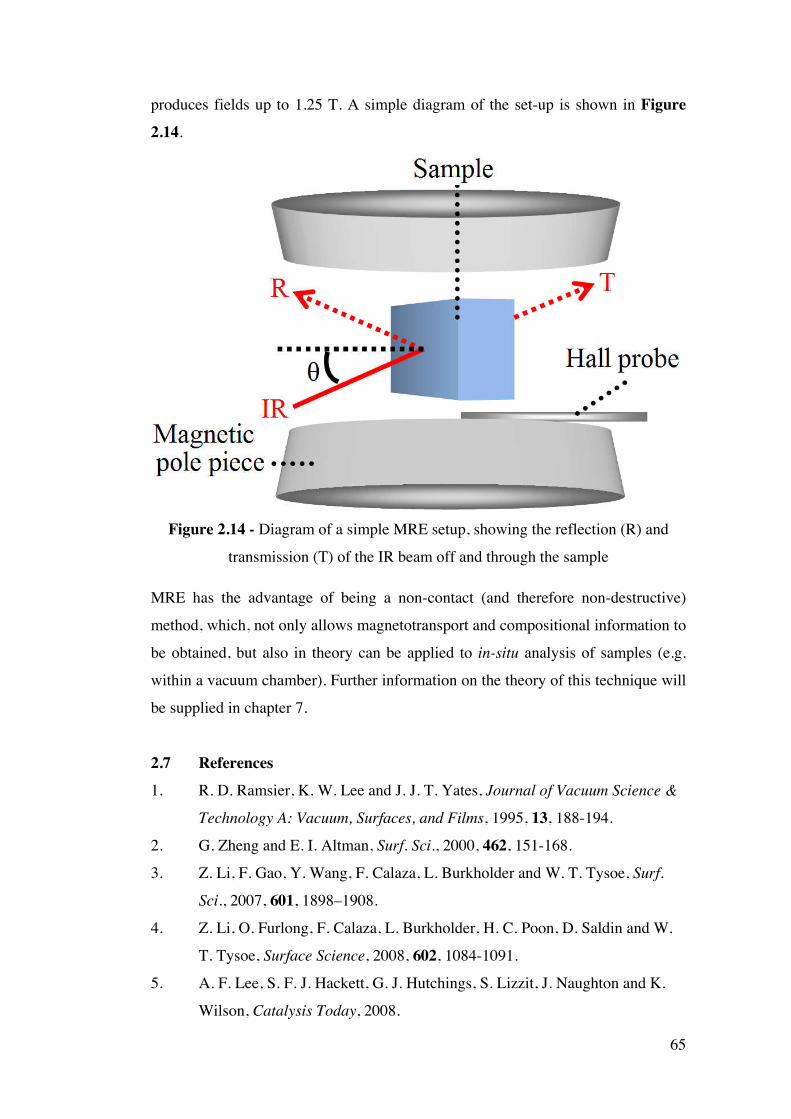
65
produces fields up to 1.25 T. A simple diagram of the set-up is shown in Figure
2.14.
Figure 2.14 - Diagram of a simple MRE setup, showing the reflection (R) and
transmission (T) of the IR beam off and through the sample
MRE has the advantage of being a non-contact (and therefore non-destructive)
method, which, not only allows magnetotransport and compositional information to
be obtained, but also in theory can be applied to in-situ analysis of samples (e.g.
within a vacuum chamber). Further information on the theory of this technique will
be supplied in chapter 7.
2.7 References
1. R. D. Ramsier, K. W. Lee and J. J. T. Yates, Journal of Vacuum Science &
Technology A: Vacuum, Surfaces, and Films, 1995, 13, 188-194.
2. G. Zheng and E. I. Altman, Surf. Sci., 2000, 462, 151-168.
3. Z. Li, F. Gao, Y. Wang, F. Calaza, L. Burkholder and W. T. Tysoe, Surf.
Sci., 2007, 601, 1898–1908.
4. Z. Li, O. Furlong, F. Calaza, L. Burkholder, H. C. Poon, D. Saldin and W.
T. Tysoe, Surface Science, 2008, 602, 1084-1091.
5. A. F. Lee, S. F. J. Hackett, G. J. Hutchings, S. Lizzit, J. Naughton and K.
Wilson, Catalysis Today, 2008.
66
6. Y. Harada, S. Masuda and H. Ozaki, Chem. Rev., 1997, 97, 1897-1952.
7. J. Naughton, A. Lee, S. Thompson, C. P. Vinod and K. Wilson, Phys.
Chem. Chem. Phys., 2010, 12, 2670-2678.
8. J. Szanyi, W. K. Kuhn and D. W. Goodman, J. Phys. Chem., 1994, 98,
2978-2981.
9. NIST, X-ray Photoelectron Database, http://srdata.nist.gov/xps/.
10. T. Cheung, Surface Science, 1984, 140, 151-164.
11. G. K. Wertheim and S. DiCenzo, Physical Review B, 1988, 32, 844-847.
12. S. Doniach and M. Sunijic, Journal of Physics C: Solid State Physics, 1970,
3, 285.
13. Z. Mitura and P. A. Maksym, Physical Review Letters, 1993, 70, 2904.
14. D. Briggs and M. P. Seah, Practical Surface Analysis, Second Edition edn.,
Wiley, 1990.
15. M. Prutton, Introduction to Surface Physics, Oxford University Press, 1994.
16. J. A. Venables, Introduction to Surface and Thin Film Processes,
Cambridge University Press, 2000.
17. S. L. M. Schroeder and M. Gottfried, Temperature Programmed
Desorption (TPD) Thermal Desorption Spectroscopy (TDS),
http://pcprakt.userpage.fu-berlin.de/tds.pdf.
18. A. Lee, K. Wilson, R. Middleton, A. Baraldi, A. Goldoni, G. Paolucci and
R. M. Lambert, J. Am. Chem. Soc, 1999, 121, 7969-7970.
19. A. Baraldi, G. Comelli, S. Lizzit, M. Kiskinova and G. Paolucci, Surface
Science Reports, 2003, 49, 169-224.
20. A. Baraldi, G. Comelli, S. Lizzit, D. Cocco, G. Paolucci and R. Rosei,
Surface Science, 1996, 367, L67-L72.
21. A. Baraldi, M. Barnaba, B. Brena, D. Cocco, G. Comelli, S. Lizzit, G.
Paolucci and R. Rosei, Journal of Electron Spectroscopy and Related
Phenomena, 1995, 76, L45-L49.
22. C. P. Norris, Trends in Surface Science Research, Nova Science, New
York, 2006.
23. M. Tüshaus, W. Berndt, H. C. l, A. M. Bradshaw and B. Persson, Applied
Physics A, 1990, 51, 91-98.
24. V. V. Kaichev, I. P. Prosvirin, V. I. Bukhtiyarov, H. Unterhalt, G.
Rupprechter and H.-J. Freund, J. Phys. Chem. B, 2003, 107, 3522-3527.

67
25. C. Davisson and L. H. Germer, Physical Review, 1927, 30, 705.
26. C. N. Banwell, Fundamentals of Molecular Spectroscopy, Third Edition
edn., McGraw Hill, 1983.
27. J. C. Jaquet and T. Valet, Magnetic Ultrathin Films, Multilayers and
Surfaces, MRS Symposia Proceedings, 1995, 348, 477.
28. D. Bozec, V. G. Kravets, J. A. D. Matthew, S. M. Thompson and A. F.
Kravets, J. App. Phys., 2002, 91.
29. M. Vopsaroiu, D. Bozec, J. A. D. Matthew, S. M. Thompson, C. H.
Marrows and M. Perez, Physical Review B, 2004, 70, 214423.
68
Chapter 3
Reactivity of crotyl alcohol over Au/Pd(111)
surface alloys
3.1 Introduction
In this chapter, new light will be shed into the selective oxidation of crotyl alcohol
over Au/Pd catalysts; a particularly promising heterogeneous alternative.
3.1.1 Pd selox deactivation
Previous work by the York Surface Chemistry and Catalysis group at the ELETTRA
synchrotron on the oxidative dehydrogenation of crotyl alcohol (CrOH,
CH3CH=CHCH-OH, 2-buten-1-ol) to crotonaldehyde (CrCHO, CH3CH=CHCHO,
but-2-enal) over Pd(111), identified secondary decarbonylation reactions as the major
factor in the deactivation of practical monometallic Pd selox catalysts1. These results
are exemplified by Figure 3.1, a C 1s temperature programmed XP spectra of a
saturated crotyl alcohol adlayer over Pd(111). A contour plot of peak intensity is also
displayed as an inset to the figure.
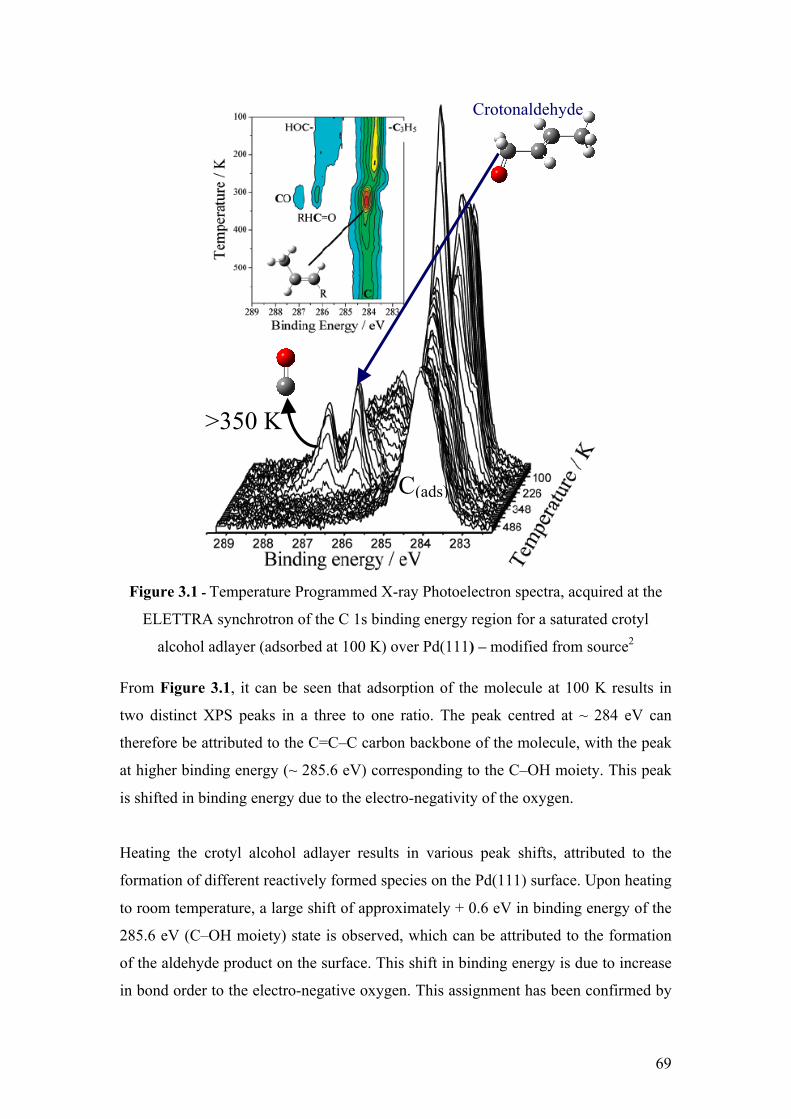
69
Figure 3.1 - Temperature Programmed X-ray Photoelectron spectra, acquired at the
ELETTRA synchrotron of the C 1s binding energy region for a saturated crotyl
alcohol adlayer (adsorbed at 100 K) over Pd(111) – modified from source2
From Figure 3.1, it can be seen that adsorption of the molecule at 100 K results in
two distinct XPS peaks in a three to one ratio. The peak centred at ~ 284 eV can
therefore be attributed to the C=C–C carbon backbone of the molecule, with the peak
at higher binding energy (~ 285.6 eV) corresponding to the C–OH moiety. This peak
is shifted in binding energy due to the electro-negativity of the oxygen.
Heating the crotyl alcohol adlayer results in various peak shifts, attributed to the
formation of different reactively formed species on the Pd(111) surface. Upon heating
to room temperature, a large shift of approximately + 0.6 eV in binding energy of the
285.6 eV (C–OH moiety) state is observed, which can be attributed to the formation
of the aldehyde product on the surface. This shift in binding energy is due to increase
in bond order to the electro-negative oxygen. This assignment has been confirmed by
>350 K
Crotonaldehyde
C(ads)
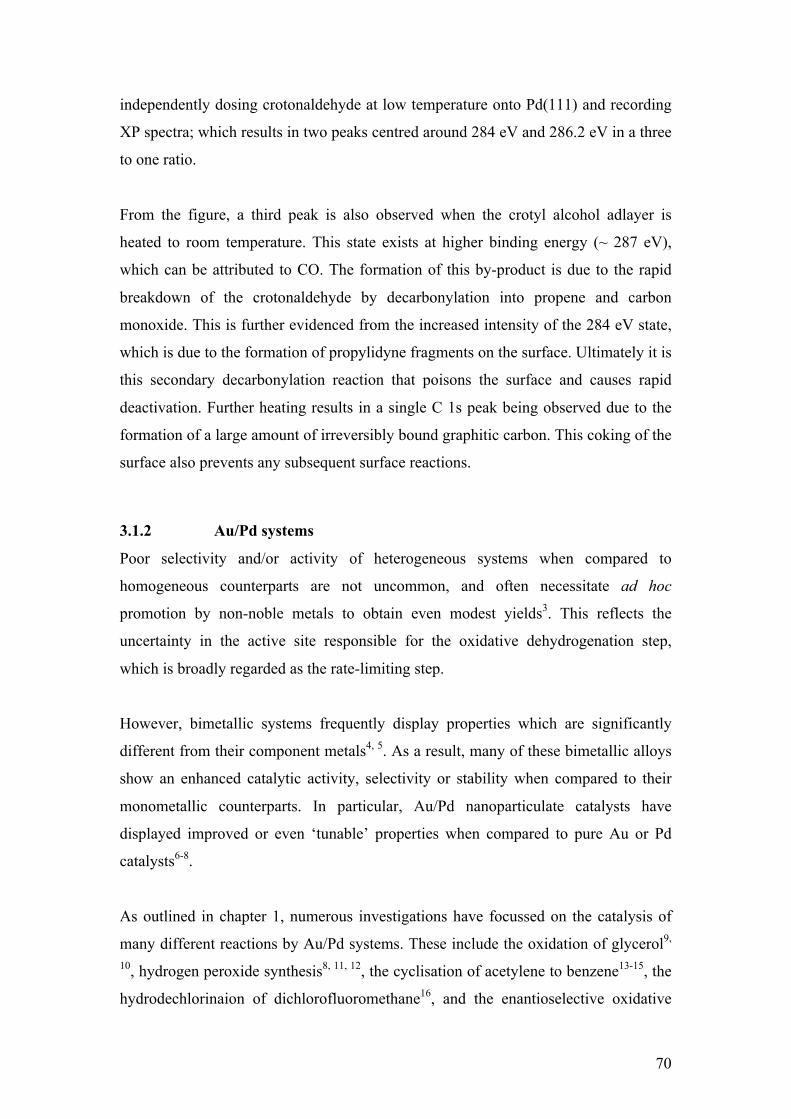
70
independently dosing crotonaldehyde at low temperature onto Pd(111) and recording
XP spectra; which results in two peaks centred around 284 eV and 286.2 eV in a three
to one ratio.
From the figure, a third peak is also observed when the crotyl alcohol adlayer is
heated to room temperature. This state exists at higher binding energy (~ 287 eV),
which can be attributed to CO. The formation of this by-product is due to the rapid
breakdown of the crotonaldehyde by decarbonylation into propene and carbon
monoxide. This is further evidenced from the increased intensity of the 284 eV state,
which is due to the formation of propylidyne fragments on the surface. Ultimately it is
this secondary decarbonylation reaction that poisons the surface and causes rapid
deactivation. Further heating results in a single C 1s peak being observed due to the
formation of a large amount of irreversibly bound graphitic carbon. This coking of the
surface also prevents any subsequent surface reactions.
3.1.2 Au/Pd systems
Poor selectivity and/or activity of heterogeneous systems when compared to
homogeneous counterparts are not uncommon, and often necessitate ad hoc
promotion by non-noble metals to obtain even modest yields3. This reflects the
uncertainty in the active site responsible for the oxidative dehydrogenation step,
which is broadly regarded as the rate-limiting step.
However, bimetallic systems frequently display properties which are significantly
different from their component metals4, 5. As a result, many of these bimetallic alloys
show an enhanced catalytic activity, selectivity or stability when compared to their
monometallic counterparts. In particular, Au/Pd nanoparticulate catalysts have
displayed improved or even ‘tunable’ properties when compared to pure Au or Pd
catalysts6-8.
As outlined in chapter 1, numerous investigations have focussed on the catalysis of
many different reactions by Au/Pd systems. These include the oxidation of glycerol9,
10, hydrogen peroxide synthesis8, 11, 12, the cyclisation of acetylene to benzene13-15, the
hydrodechlorinaion of dichlorofluoromethane16, and the enantioselective oxidative
71
dehydrogenation of aliphatic alcohols to ketones17, to name but a few. In the case of
the work on acetylene cyclisation, the genesis of Pd6Au ensembles reduced
hydrocarbon decomposition and promoted benzene desorption, in agreement with
analogous studies on ‘real’ dispersed AuPd colloids18. Recently, various
computational studies have also been conducted in order to understand the
composition and reactivity of such systems19, 20.
In particular, there has been significant interest in Pd/Au nanoparticle systems as
catalysts for selective oxidation reactions21-23. A major breakthrough occurred when
Hutchings et al24, discovered that by combining Pd and Au over a titania support 25-
fold rate enhancements for alcohol oxidation under mild, solvent-free conditions were
possible. The introduction of Au also improves selectivities to aldehydes and ketones
compared to pure Pd.
3.2 Results and Discussion
3.2.1 Growth of Au on Pd(111)
Au/Pd(111) surface alloys have been previously characterised in vacuo by AES25-28,
XPS28, 29, LEED25, 30, LEIS30, 31 and STM26. Epitaxially deposited Au overlayers form
apparently random substitutional surface alloys upon annealing above 600 K,
reflecting the small lattice mismatch (~ 4.9 %) and bulk miscibilities of the metal
components28. It should be noted that recent theoretical analyses for Au/Pd(111) alloy
surfaces suggest weak repulsion between Au and Pd atoms may drive local ordering19.
3.2.1.1 Au/Pd surface preparation
As described in chapter 2, Au films were grown on Pd(111) at room temperature
using a water cooled OMICRON/Focus UHV evaporator, with integral flux monitor.
Whilst the growth mode of Au on Pd(111) and thermal alloying is well described in
literature17, 25, 27, 28, 30, it was necessary to briefly replicate the results of Tysoe’s
group28 in order to ensure correct operation of the evaporator and uniform coverage of
the Pd substrate. The growth of Au on Pd(111) was examined by monitoring the Au
4f7/2 and Pd 3d5/2 XPS signals. The change in the intensity of these signals during Au
growth is shown below in Figure 3.2.
72
0.00.20.4
0.60.81.01.2
1.41.6
0 2 4 6 8 10 12Au deposition time / mins
0.00.10.20.30.40.50.60.70.80.9
AuPd
Figure 3.2 – The variation in intensity of Au 4f7/2 and Pd 3d5/2 XPS signals with
increasing Au deposition time
Assuming uniform epitaxial growth of a Au overlayer deposited on Pd(111), the
thickness of such thin-films can be determined by examining the attenuation of the
intensity of the Pd 3d peak. The relationship between the Pd 3d attenuation and the Au
film thickness can be expressed as:
!!"
#$$%
&
ϕ
λ−=!!
"
#$$%
&
costtPd
expII
Au0
Equation 3.1
where I is Pd AES or XPS peak intensity, I0 is initial Pd AES or XPS intensity, λPd
is the inelastic mean free path of an electron from Au within a Pd matrix32, 33 (in
Angstroms), t is the thickness of the resulting Au film (in monolayers), tAu is the
thickness of one monolayer of Au (in Angstroms) and φ is the angle of the incident
electrons/X-rays into the detector.
The impact of annealing a 3.9 ML Au film on Pd(111) was measured by examining
the ratio of the Au 4f7/2 and Pd 3d5/2 peak intensity ratios. A plot of this data is shown
in Figure 3.3. It should be noted that these are the raw data for the outermost several
Pd 3
d 5/2
inte
nsity
/ ar
b. u
nits
A
u 4f7/2 intensity / arb. units
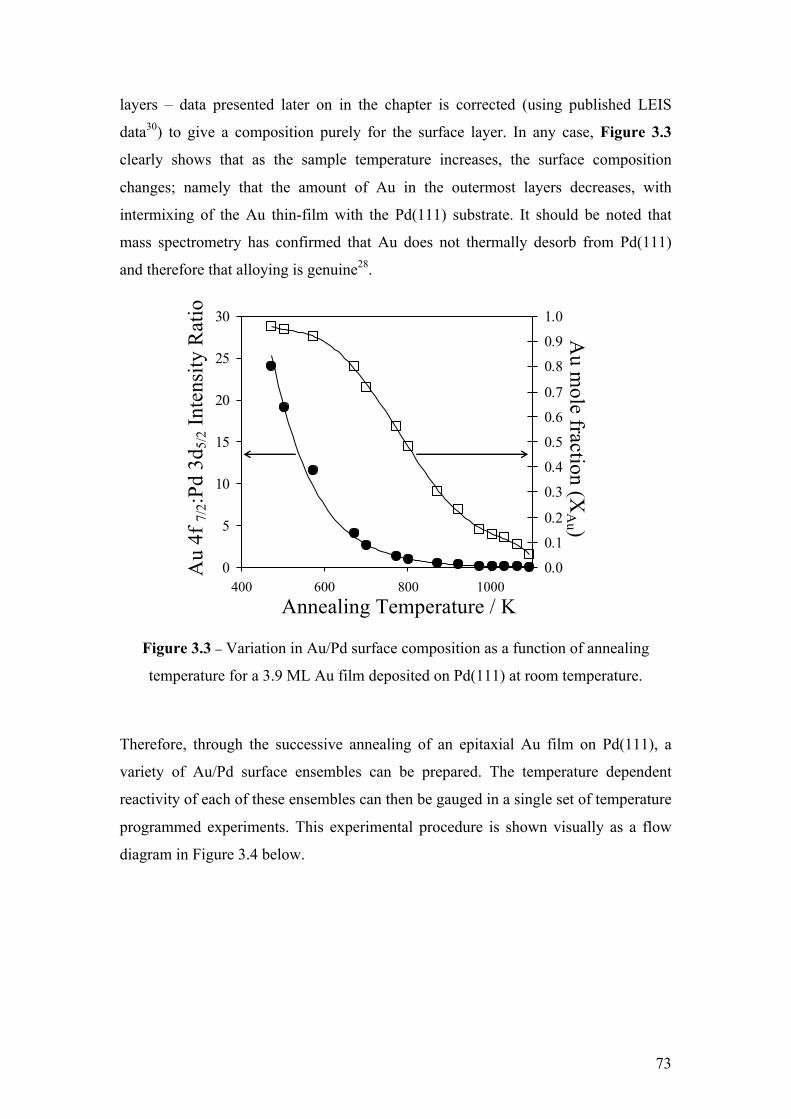
73
layers – data presented later on in the chapter is corrected (using published LEIS
data30) to give a composition purely for the surface layer. In any case, Figure 3.3
clearly shows that as the sample temperature increases, the surface composition
changes; namely that the amount of Au in the outermost layers decreases, with
intermixing of the Au thin-film with the Pd(111) substrate. It should be noted that
mass spectrometry has confirmed that Au does not thermally desorb from Pd(111)
and therefore that alloying is genuine28.
0
5
10
15
20
25
30
400 600 800 10000.0
0.1
0.2
0.3
0.4
0.5
0.6
0.7
0.8
0.9
1.0
Figure 3.3 – Variation in Au/Pd surface composition as a function of annealing
temperature for a 3.9 ML Au film deposited on Pd(111) at room temperature.
Therefore, through the successive annealing of an epitaxial Au film on Pd(111), a
variety of Au/Pd surface ensembles can be prepared. The temperature dependent
reactivity of each of these ensembles can then be gauged in a single set of temperature
programmed experiments. This experimental procedure is shown visually as a flow
diagram in Figure 3.4 below.
Annealing Temperature / K
Au
4f 7/
2:Pd
3d5/
2 Int
ensi
ty R
atio
A
u mole fraction (X
Au )
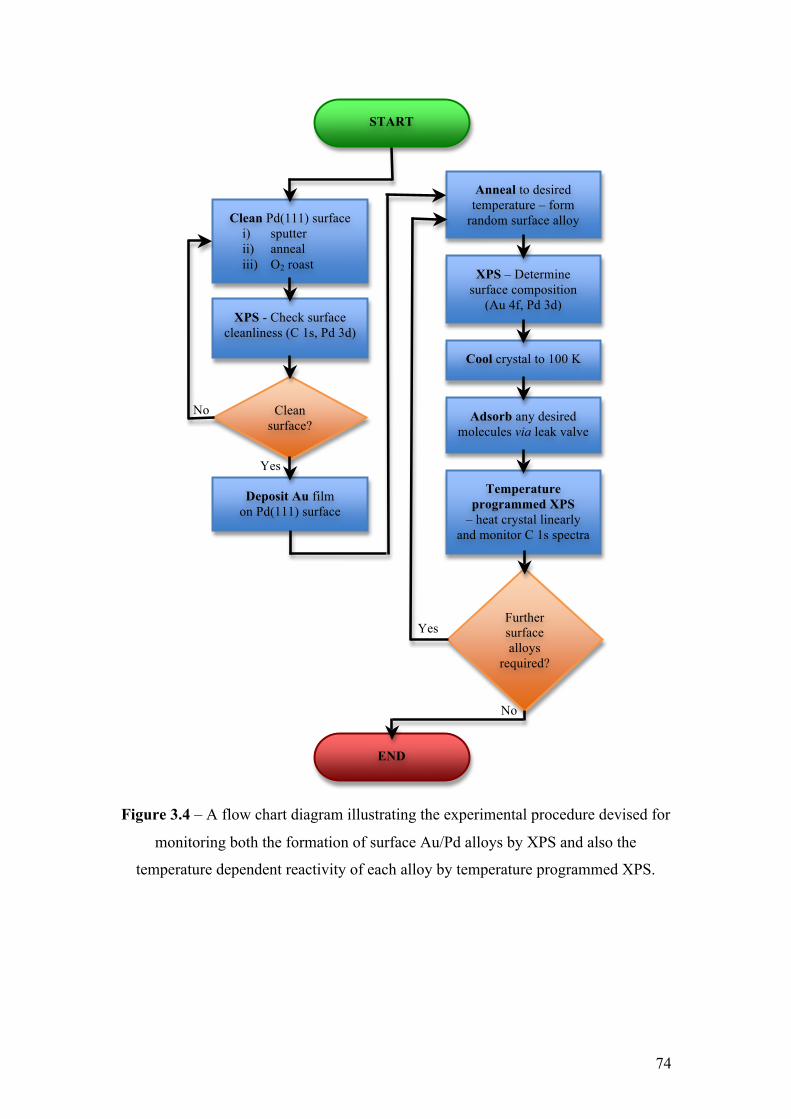
74
Deposit Au film on Pd(111) surface
START
Clean Pd(111) surface i) sputter ii) anneal iii) O2 roast
Clean surface?
XPS - Check surface cleanliness (C 1s, Pd 3d)
END
Anneal to desired temperature – form
random surface alloy
XPS – Determine surface composition
(Au 4f, Pd 3d)
Cool crystal to 100 K
Adsorb any desired molecules via leak valve
Temperature programmed XPS
– heat crystal linearly and monitor C 1s spectra
Further surface alloys
required?
Yes
No
Yes
No
Figure 3.4 – A flow chart diagram illustrating the experimental procedure devised for
monitoring both the formation of surface Au/Pd alloys by XPS and also the
temperature dependent reactivity of each alloy by temperature programmed XPS.
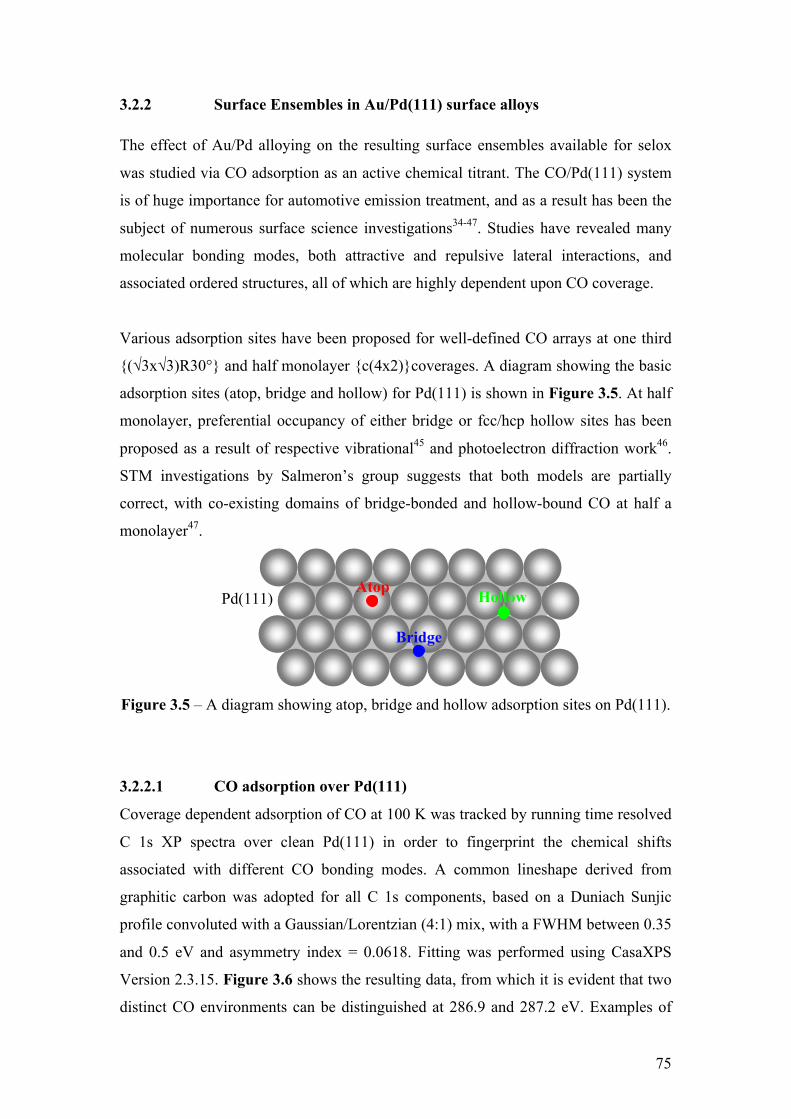
75
3.2.2 Surface Ensembles in Au/Pd(111) surface alloys
The effect of Au/Pd alloying on the resulting surface ensembles available for selox
was studied via CO adsorption as an active chemical titrant. The CO/Pd(111) system
is of huge importance for automotive emission treatment, and as a result has been the
subject of numerous surface science investigations34-47. Studies have revealed many
molecular bonding modes, both attractive and repulsive lateral interactions, and
associated ordered structures, all of which are highly dependent upon CO coverage.
Various adsorption sites have been proposed for well-defined CO arrays at one third
(√3x√3)R30° and half monolayer c(4x2)coverages. A diagram showing the basic
adsorption sites (atop, bridge and hollow) for Pd(111) is shown in Figure 3.5. At half
monolayer, preferential occupancy of either bridge or fcc/hcp hollow sites has been
proposed as a result of respective vibrational45 and photoelectron diffraction work46.
STM investigations by Salmeron’s group suggests that both models are partially
correct, with co-existing domains of bridge-bonded and hollow-bound CO at half a
monolayer47.
Figure 3.5 – A diagram showing atop, bridge and hollow adsorption sites on Pd(111).
3.2.2.1 CO adsorption over Pd(111)
Coverage dependent adsorption of CO at 100 K was tracked by running time resolved
C 1s XP spectra over clean Pd(111) in order to fingerprint the chemical shifts
associated with different CO bonding modes. A common lineshape derived from
graphitic carbon was adopted for all C 1s components, based on a Duniach Sunjic
profile convoluted with a Gaussian/Lorentzian (4:1) mix, with a FWHM between 0.35
and 0.5 eV and asymmetry index = 0.0618. Fitting was performed using CasaXPS
Version 2.3.15. Figure 3.6 shows the resulting data, from which it is evident that two
distinct CO environments can be distinguished at 286.9 and 287.2 eV. Examples of
Atop
Bridge
Hollow Pd(111)
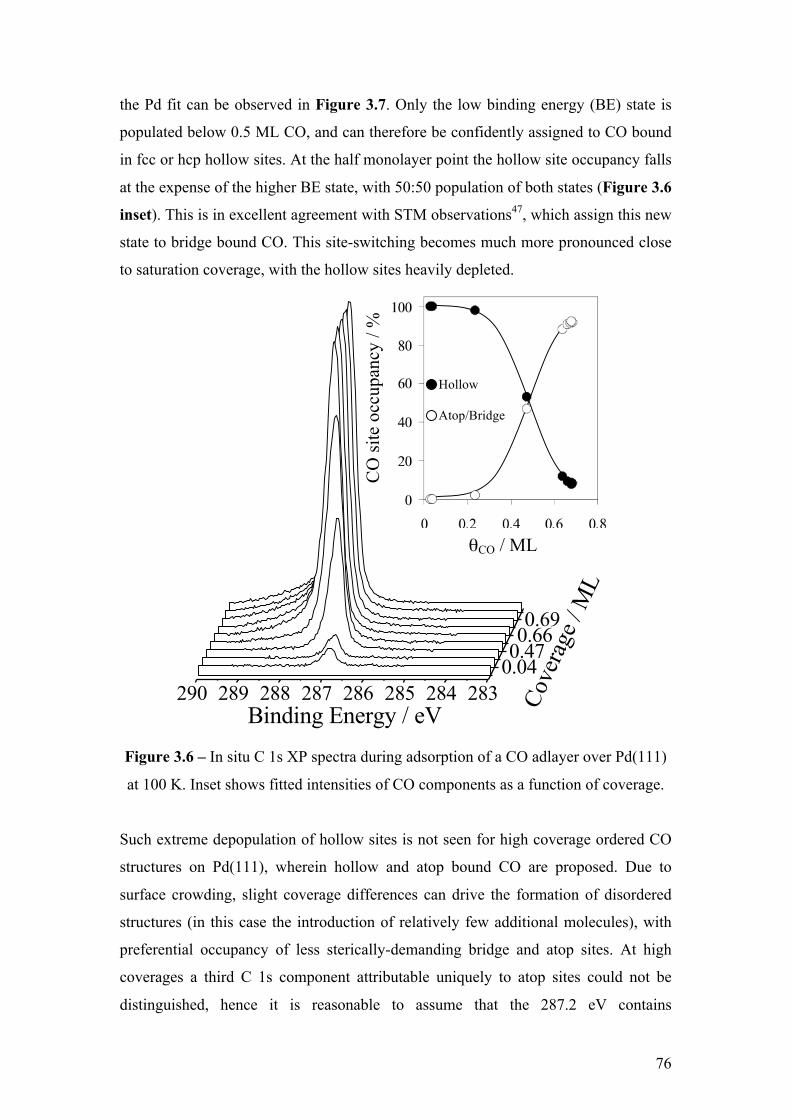
76
the Pd fit can be observed in Figure 3.7. Only the low binding energy (BE) state is
populated below 0.5 ML CO, and can therefore be confidently assigned to CO bound
in fcc or hcp hollow sites. At the half monolayer point the hollow site occupancy falls
at the expense of the higher BE state, with 50:50 population of both states (Figure 3.6
inset). This is in excellent agreement with STM observations47, which assign this new
state to bridge bound CO. This site-switching becomes much more pronounced close
to saturation coverage, with the hollow sites heavily depleted.
290 289 288 287 286 285 284 283
0.690.66
0.470.04
Cov
erag
e / M
L
Binding Energy / eV
Figure 3.6 – In situ C 1s XP spectra during adsorption of a CO adlayer over Pd(111)
at 100 K. Inset shows fitted intensities of CO components as a function of coverage.
Such extreme depopulation of hollow sites is not seen for high coverage ordered CO
structures on Pd(111), wherein hollow and atop bound CO are proposed. Due to
surface crowding, slight coverage differences can drive the formation of disordered
structures (in this case the introduction of relatively few additional molecules), with
preferential occupancy of less sterically-demanding bridge and atop sites. At high
coverages a third C 1s component attributable uniquely to atop sites could not be
distinguished, hence it is reasonable to assume that the 287.2 eV contains
CO
site
occ
upan
cy /
%
θCO / ML
Hollow Atop/Bridge
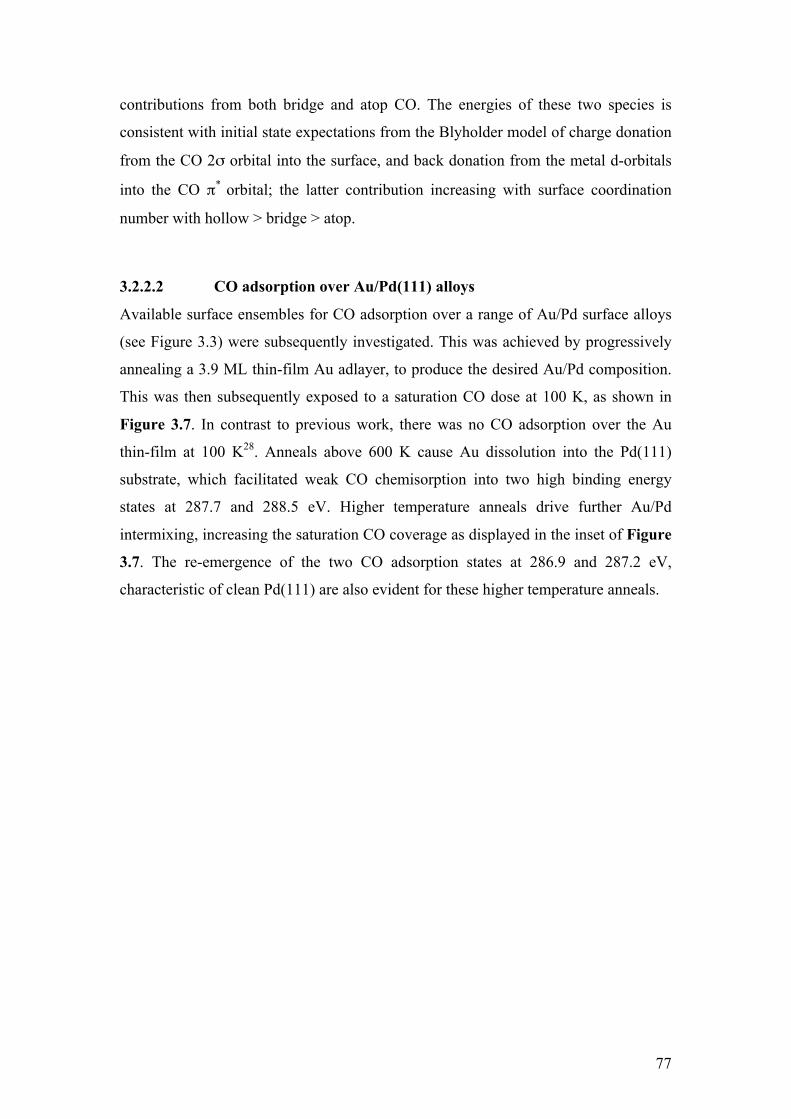
77
contributions from both bridge and atop CO. The energies of these two species is
consistent with initial state expectations from the Blyholder model of charge donation
from the CO 2σ orbital into the surface, and back donation from the metal d-orbitals
into the CO π* orbital; the latter contribution increasing with surface coordination
number with hollow > bridge > atop.
3.2.2.2 CO adsorption over Au/Pd(111) alloys
Available surface ensembles for CO adsorption over a range of Au/Pd surface alloys
(see Figure 3.3) were subsequently investigated. This was achieved by progressively
annealing a 3.9 ML thin-film Au adlayer, to produce the desired Au/Pd composition.
This was then subsequently exposed to a saturation CO dose at 100 K, as shown in
Figure 3.7. In contrast to previous work, there was no CO adsorption over the Au
thin-film at 100 K28. Anneals above 600 K cause Au dissolution into the Pd(111)
substrate, which facilitated weak CO chemisorption into two high binding energy
states at 287.7 and 288.5 eV. Higher temperature anneals drive further Au/Pd
intermixing, increasing the saturation CO coverage as displayed in the inset of Figure
3.7. The re-emergence of the two CO adsorption states at 286.9 and 287.2 eV,
characteristic of clean Pd(111) are also evident for these higher temperature anneals.
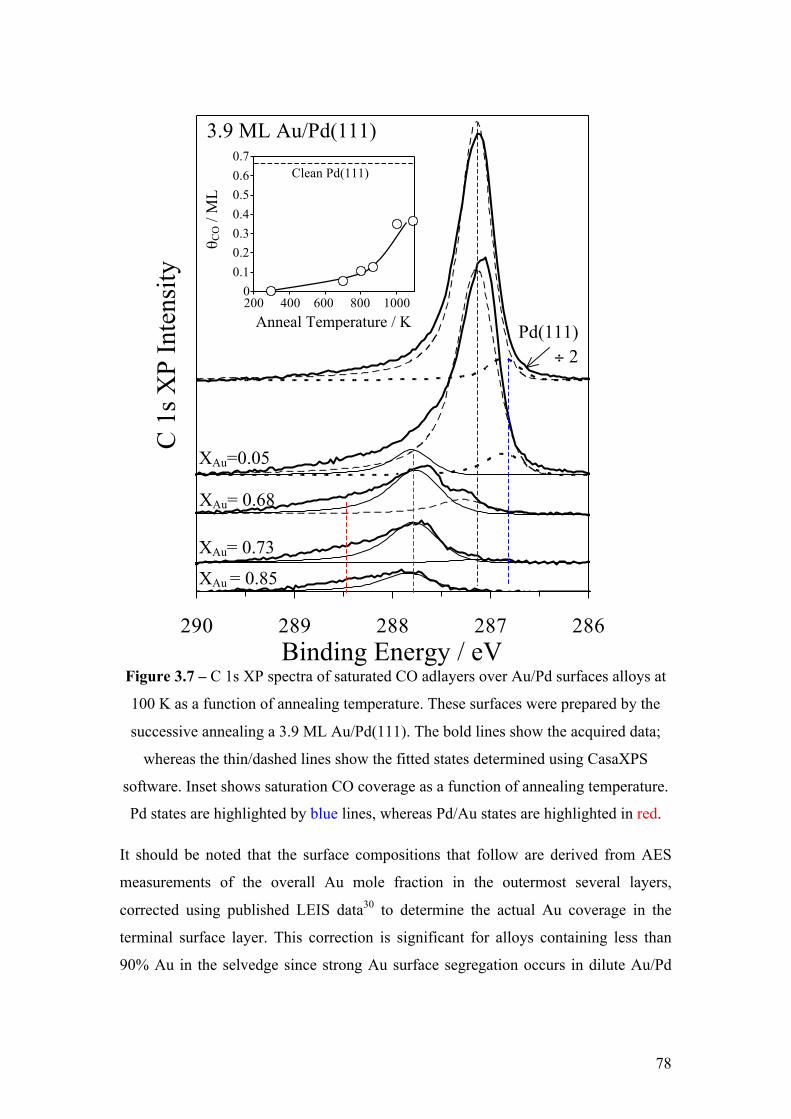
78
286287288289290
Figure 3.7 – C 1s XP spectra of saturated CO adlayers over Au/Pd surfaces alloys at
100 K as a function of annealing temperature. These surfaces were prepared by the
successive annealing a 3.9 ML Au/Pd(111). The bold lines show the acquired data;
whereas the thin/dashed lines show the fitted states determined using CasaXPS
software. Inset shows saturation CO coverage as a function of annealing temperature.
Pd states are highlighted by blue lines, whereas Pd/Au states are highlighted in red.
It should be noted that the surface compositions that follow are derived from AES
measurements of the overall Au mole fraction in the outermost several layers,
corrected using published LEIS data30 to determine the actual Au coverage in the
terminal surface layer. This correction is significant for alloys containing less than
90% Au in the selvedge since strong Au surface segregation occurs in dilute Au/Pd
Clean Pd(111)
Binding Energy / eV
XAu = 0.85
XAu= 0.73
XAu= 0.68
XAu=0.05
Pd(111) ÷ 2
3.9 ML Au/Pd(111)
C 1
s XP
Inte
nsity
Anneal Temperature / K
θ CO /
ML
0
0.1
0.2
0.3
0.4
0.5
0.6
0.7
200 400 600 800 1000200 400 600 800 1000
0.7 0.6 0.5
0.3 0.4
0.2 0.1
0
79
alloys30. It is interesting to note that significant (~ 16 %) surface Au was retained
even following the highest annealing temperature in this work.
The coverage-dependent integrated intensities (determined using CasaXPS) of the
four experimentally observed CO surface species from Figure 3.7 are shown in
Figure 3.8 (a). It should be noted that within this figure the observed trends are
emphasised using guidelines. Simple Monte–Carlo simulations (performed by Prof.
A. F. Lee) of Au/Pd alloys were also conducted on a 144 atom 2D lattice assuming
random substitution of non-interacting atoms at 300 K. These simulations were
carried out to model the distribution of surface ensembles available as a function of
Au/Pd composition, and thereby help assign the new high binding energy CO states
observed on Au-rich surface alloys. In each simulation a random Au/Pd lattice was
generated, where the different types of environment were identified according to the
number and type of neighbours surrounding each Pd or Au atom. How the modelled
site distribution changed as a function of Au content was plotted in order to mimic the
variation in CO sites. The same procedure was also carried out for pure Pd hollow and
bridge/atop sites. Both sets of simulations can be found in Figure 3.8 (b). These
theoretical results are in good agreement with the experimental trends, confirming
that even small amounts of Au (~ 10 %) inhibits CO binding at three-fold hollow
sites.
As expected, the occupancy of Pd2(Pd) bridge and Pd(Pd2) atop sites decay more
slowly, with significant populations present up to ~ 50 % Au. The corresponding
growth of Pd2(Au) bridge and Pd(Au2) sites quantitatively tracks that of the
respective 288.5 and 287.7 eV CO states, enabling assignment to Au perturbed bridge
and isolated Pd ensembles. Cartoons of these ensembles, along with the CO XP
spectra are displayed above the figure. The chemical shift of both CO alloy adsorption
states is consistent with charge donation from Pd to Au, as previously reported within
the Au/Pd(111) system28, 48, and associated reduced metal back donation into the CO
π* orbital.
80
M
onte
Car
lo m
odel
led
site
di
strib
utio
n / %
Fi
tted
XPS
CO
site
oc
cupa
ncy
/ %
Figure 3.8 - (a) Integrated C 1s XP intensities of fitted CO components for
experiments involving saturated CO adlayers adsorbed at 100 K over Au/Pd alloys
prepared by annealing a 3.9 ML Au/Pd(111) surfaces. (b) The Monte Carlo
simulation data of Pd ensembles available for CO adsorption as a function of Au/Pd
surface composition. Surface Au rapidly suppresses CO adsorption over larger Pd
ensembles.
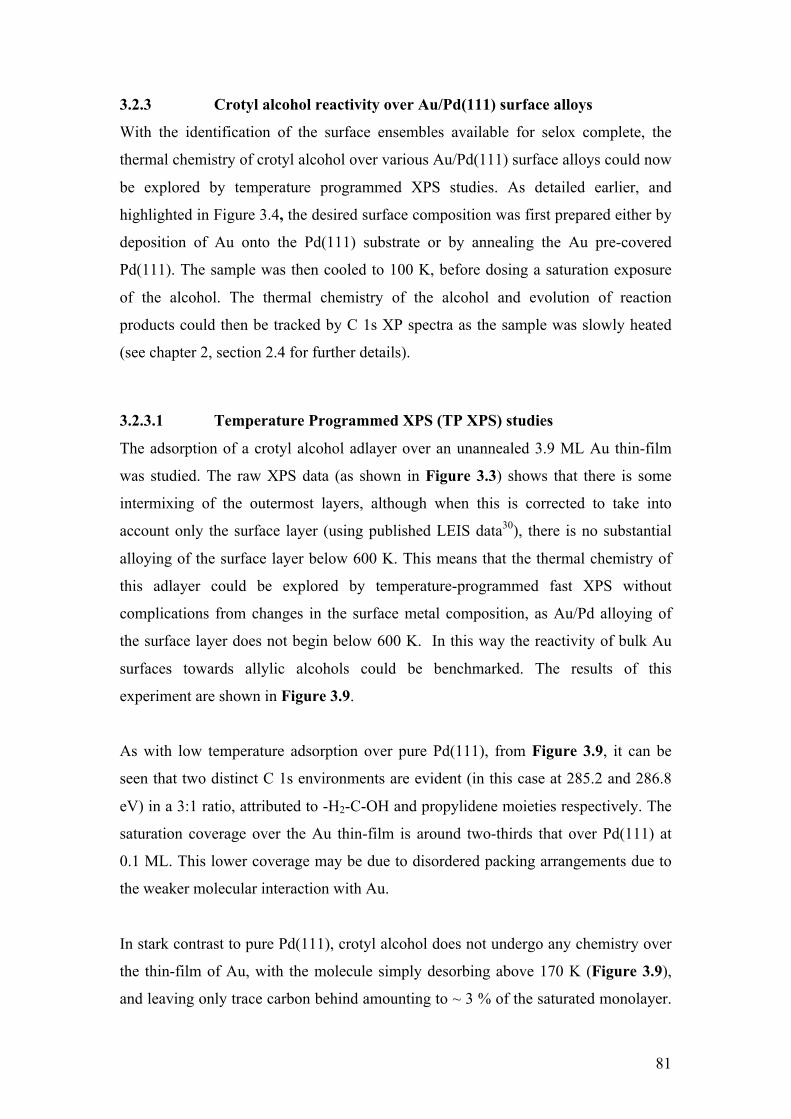
81
3.2.3 Crotyl alcohol reactivity over Au/Pd(111) surface alloys
With the identification of the surface ensembles available for selox complete, the
thermal chemistry of crotyl alcohol over various Au/Pd(111) surface alloys could now
be explored by temperature programmed XPS studies. As detailed earlier, and
highlighted in Figure 3.4, the desired surface composition was first prepared either by
deposition of Au onto the Pd(111) substrate or by annealing the Au pre-covered
Pd(111). The sample was then cooled to 100 K, before dosing a saturation exposure
of the alcohol. The thermal chemistry of the alcohol and evolution of reaction
products could then be tracked by C 1s XP spectra as the sample was slowly heated
(see chapter 2, section 2.4 for further details).
3.2.3.1 Temperature Programmed XPS (TP XPS) studies
The adsorption of a crotyl alcohol adlayer over an unannealed 3.9 ML Au thin-film
was studied. The raw XPS data (as shown in Figure 3.3) shows that there is some
intermixing of the outermost layers, although when this is corrected to take into
account only the surface layer (using published LEIS data30), there is no substantial
alloying of the surface layer below 600 K. This means that the thermal chemistry of
this adlayer could be explored by temperature-programmed fast XPS without
complications from changes in the surface metal composition, as Au/Pd alloying of
the surface layer does not begin below 600 K. In this way the reactivity of bulk Au
surfaces towards allylic alcohols could be benchmarked. The results of this
experiment are shown in Figure 3.9.
As with low temperature adsorption over pure Pd(111), from Figure 3.9, it can be
seen that two distinct C 1s environments are evident (in this case at 285.2 and 286.8
eV) in a 3:1 ratio, attributed to -H2-C-OH and propylidene moieties respectively. The
saturation coverage over the Au thin-film is around two-thirds that over Pd(111) at
0.1 ML. This lower coverage may be due to disordered packing arrangements due to
the weaker molecular interaction with Au.
In stark contrast to pure Pd(111), crotyl alcohol does not undergo any chemistry over
the thin-film of Au, with the molecule simply desorbing above 170 K (Figure 3.9),
and leaving only trace carbon behind amounting to ~ 3 % of the saturated monolayer.
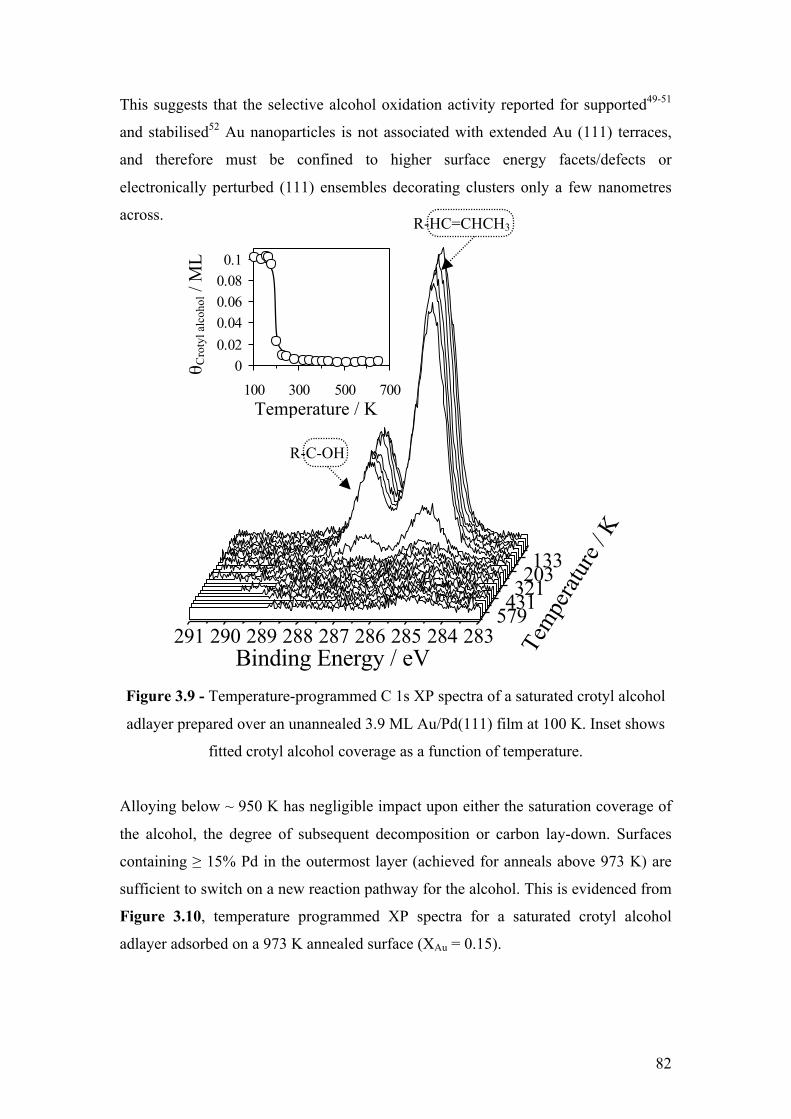
82
This suggests that the selective alcohol oxidation activity reported for supported49-51
and stabilised52 Au nanoparticles is not associated with extended Au (111) terraces,
and therefore must be confined to higher surface energy facets/defects or
electronically perturbed (111) ensembles decorating clusters only a few nanometres
across.
291 290 289 288 287 286 285 284 283
133203
321431
579
Tem
perat
ure /
K
Binding Energy / eV
Figure 3.9 - Temperature-programmed C 1s XP spectra of a saturated crotyl alcohol
adlayer prepared over an unannealed 3.9 ML Au/Pd(111) film at 100 K. Inset shows
fitted crotyl alcohol coverage as a function of temperature.
Alloying below ~ 950 K has negligible impact upon either the saturation coverage of
the alcohol, the degree of subsequent decomposition or carbon lay-down. Surfaces
containing ≥ 15% Pd in the outermost layer (achieved for anneals above 973 K) are
sufficient to switch on a new reaction pathway for the alcohol. This is evidenced from
Figure 3.10, temperature programmed XP spectra for a saturated crotyl alcohol
adlayer adsorbed on a 973 K annealed surface (XAu = 0.15).
Temperature / K
θ Cro
tyl a
lcoh
ol /
ML
00.020.040.060.080.1
100 300 500 700
R-HC=CHCH3
R-C-OH
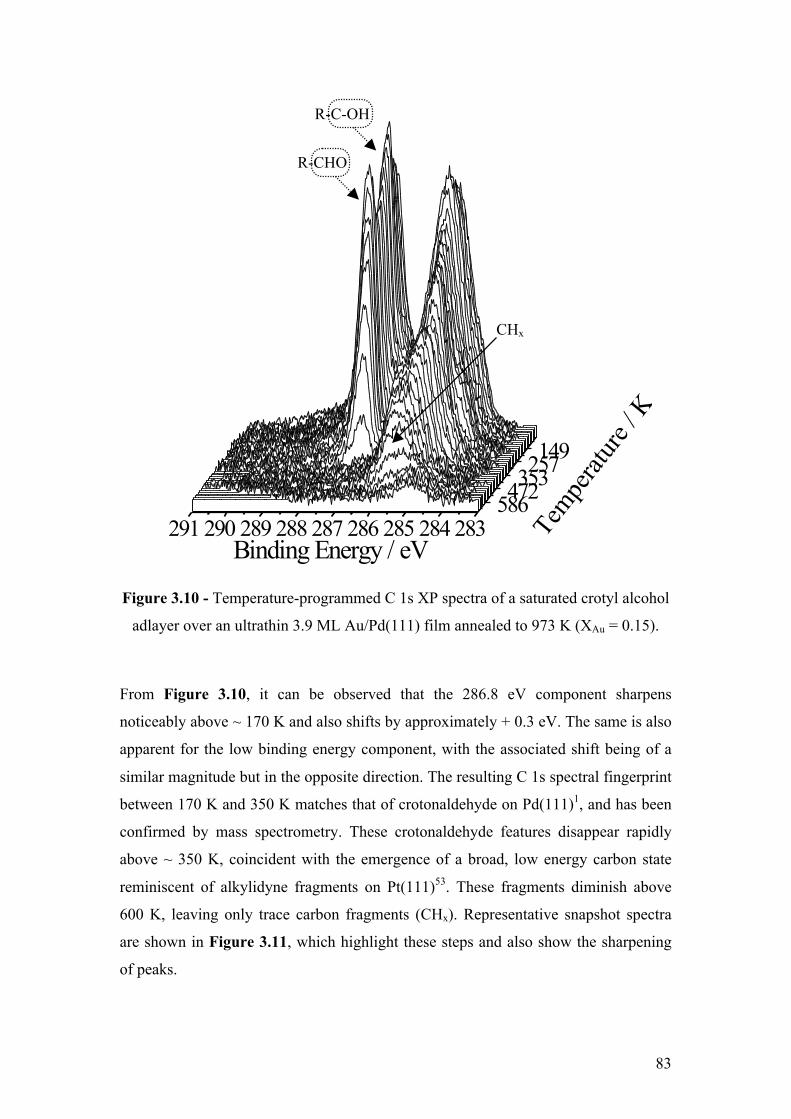
83
291 290 289 288 287 286 285 284 283
149257353472586 T
empe
rature
/ K
Binding Energy / eV
Figure 3.10 - Temperature-programmed C 1s XP spectra of a saturated crotyl alcohol
adlayer over an ultrathin 3.9 ML Au/Pd(111) film annealed to 973 K (XAu = 0.15).
From Figure 3.10, it can be observed that the 286.8 eV component sharpens
noticeably above ~ 170 K and also shifts by approximately + 0.3 eV. The same is also
apparent for the low binding energy component, with the associated shift being of a
similar magnitude but in the opposite direction. The resulting C 1s spectral fingerprint
between 170 K and 350 K matches that of crotonaldehyde on Pd(111)1, and has been
confirmed by mass spectrometry. These crotonaldehyde features disappear rapidly
above ~ 350 K, coincident with the emergence of a broad, low energy carbon state
reminiscent of alkylidyne fragments on Pt(111)53. These fragments diminish above
600 K, leaving only trace carbon fragments (CHx). Representative snapshot spectra
are shown in Figure 3.11, which highlight these steps and also show the sharpening
of peaks.
R-CHO
R-C-OH
CHx
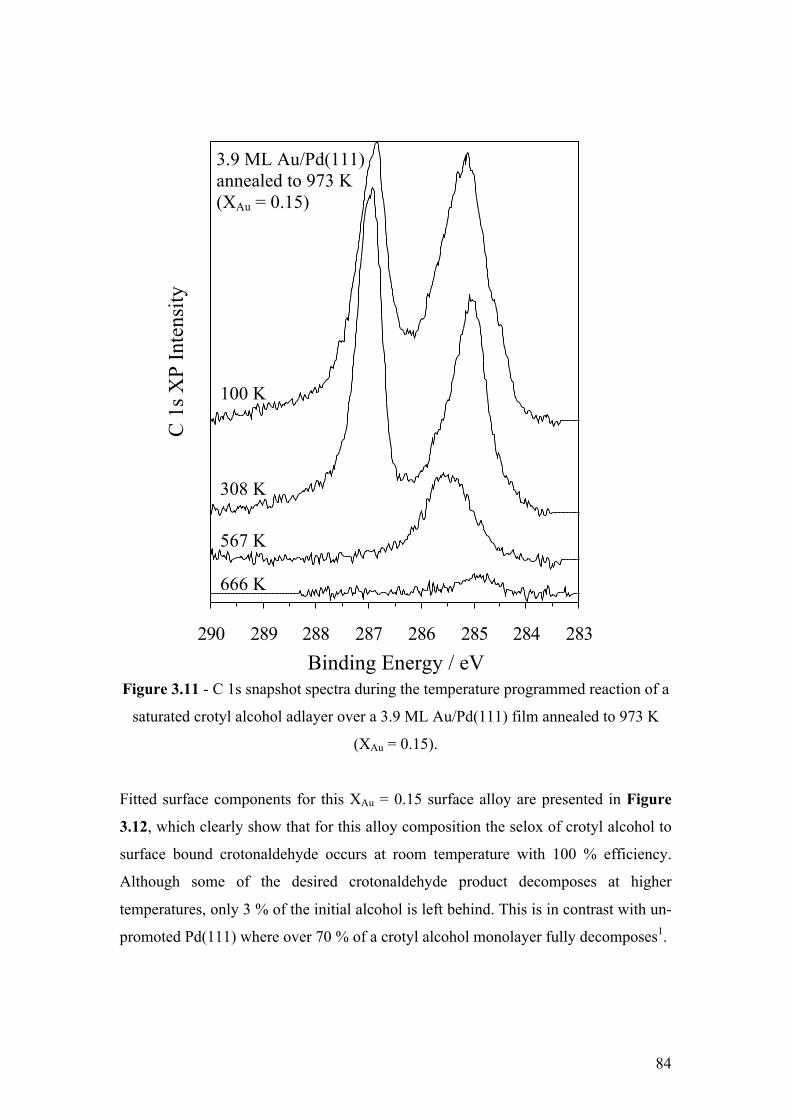
84
283284285286287288289290
Figure 3.11 - C 1s snapshot spectra during the temperature programmed reaction of a
saturated crotyl alcohol adlayer over a 3.9 ML Au/Pd(111) film annealed to 973 K
(XAu = 0.15).
Fitted surface components for this XAu = 0.15 surface alloy are presented in Figure
3.12, which clearly show that for this alloy composition the selox of crotyl alcohol to
surface bound crotonaldehyde occurs at room temperature with 100 % efficiency.
Although some of the desired crotonaldehyde product decomposes at higher
temperatures, only 3 % of the initial alcohol is left behind. This is in contrast with un-
promoted Pd(111) where over 70 % of a crotyl alcohol monolayer fully decomposes1.
Binding Energy / eV
C 1
s XP
Inte
nsity
100 K
3.9 ML Au/Pd(111) annealed to 973 K (XAu = 0.15)
308 K
567 K
666 K
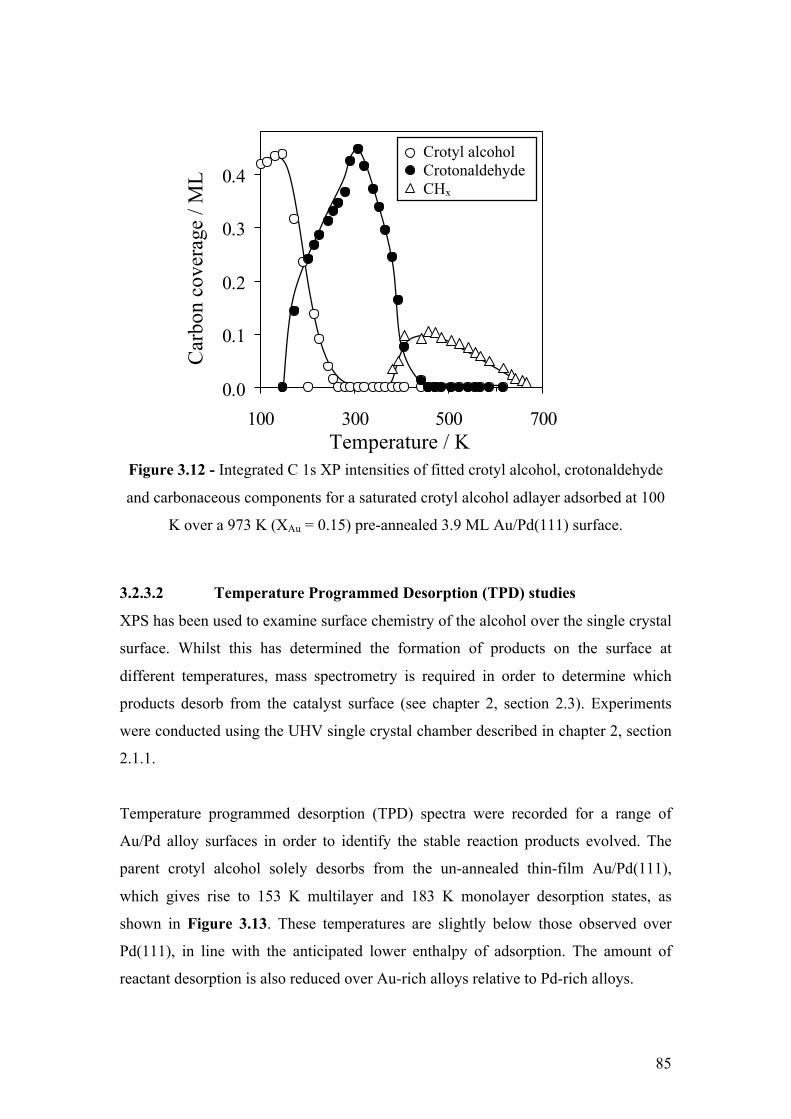
85
Temperature / K
Car
bon
cove
rage
/ M
L
Crotyl alcohol Crotonaldehyde CHx
0.0
0.1
0.2
0.3
0.4
100 300 500 700
Figure 3.12 - Integrated C 1s XP intensities of fitted crotyl alcohol, crotonaldehyde
and carbonaceous components for a saturated crotyl alcohol adlayer adsorbed at 100
K over a 973 K (XAu = 0.15) pre-annealed 3.9 ML Au/Pd(111) surface.
3.2.3.2 Temperature Programmed Desorption (TPD) studies
XPS has been used to examine surface chemistry of the alcohol over the single crystal
surface. Whilst this has determined the formation of products on the surface at
different temperatures, mass spectrometry is required in order to determine which
products desorb from the catalyst surface (see chapter 2, section 2.3). Experiments
were conducted using the UHV single crystal chamber described in chapter 2, section
2.1.1.
Temperature programmed desorption (TPD) spectra were recorded for a range of
Au/Pd alloy surfaces in order to identify the stable reaction products evolved. The
parent crotyl alcohol solely desorbs from the un-annealed thin-film Au/Pd(111),
which gives rise to 153 K multilayer and 183 K monolayer desorption states, as
shown in Figure 3.13. These temperatures are slightly below those observed over
Pd(111), in line with the anticipated lower enthalpy of adsorption. The amount of
reactant desorption is also reduced over Au-rich alloys relative to Pd-rich alloys.
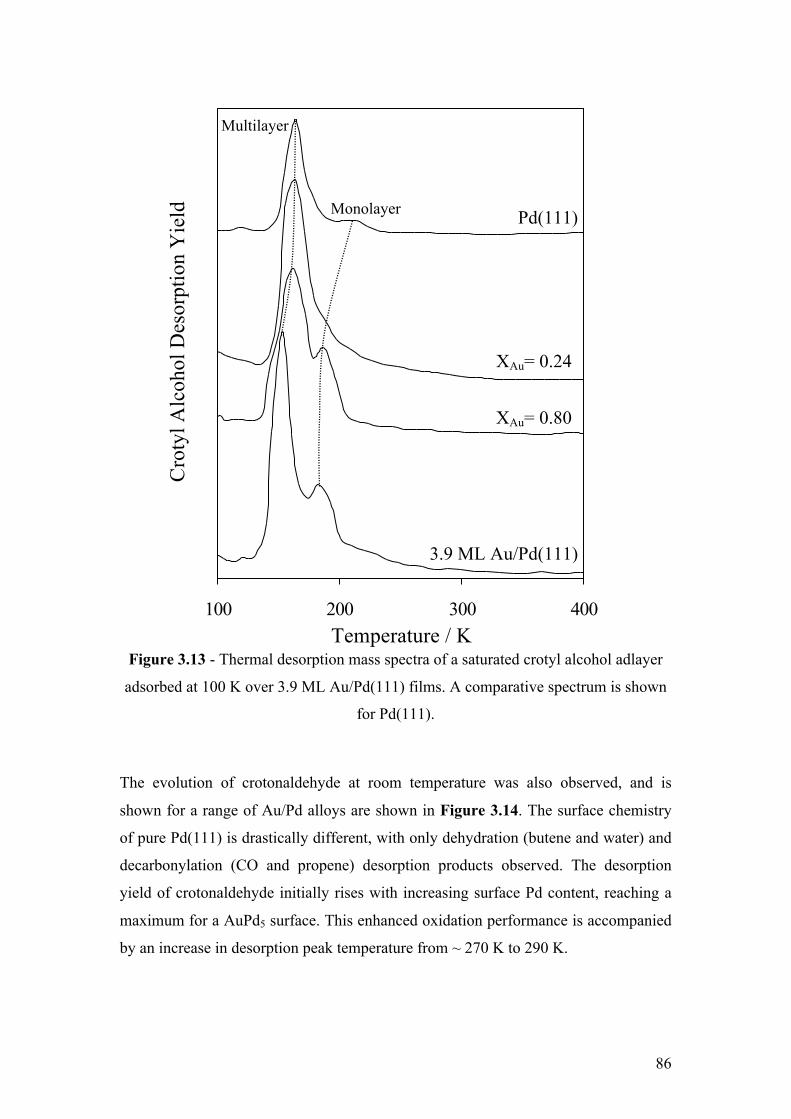
86
100 200 300 400
Figure 3.13 - Thermal desorption mass spectra of a saturated crotyl alcohol adlayer
adsorbed at 100 K over 3.9 ML Au/Pd(111) films. A comparative spectrum is shown
for Pd(111).
The evolution of crotonaldehyde at room temperature was also observed, and is
shown for a range of Au/Pd alloys are shown in Figure 3.14. The surface chemistry
of pure Pd(111) is drastically different, with only dehydration (butene and water) and
decarbonylation (CO and propene) desorption products observed. The desorption
yield of crotonaldehyde initially rises with increasing surface Pd content, reaching a
maximum for a AuPd5 surface. This enhanced oxidation performance is accompanied
by an increase in desorption peak temperature from ~ 270 K to 290 K.
Pd(111)
3.9 ML Au/Pd(111)
XAu= 0.80
XAu= 0.24
Monolayer
Multilayer
Temperature / K
Cro
tyl A
lcoh
ol D
esor
ptio
n Y
ield
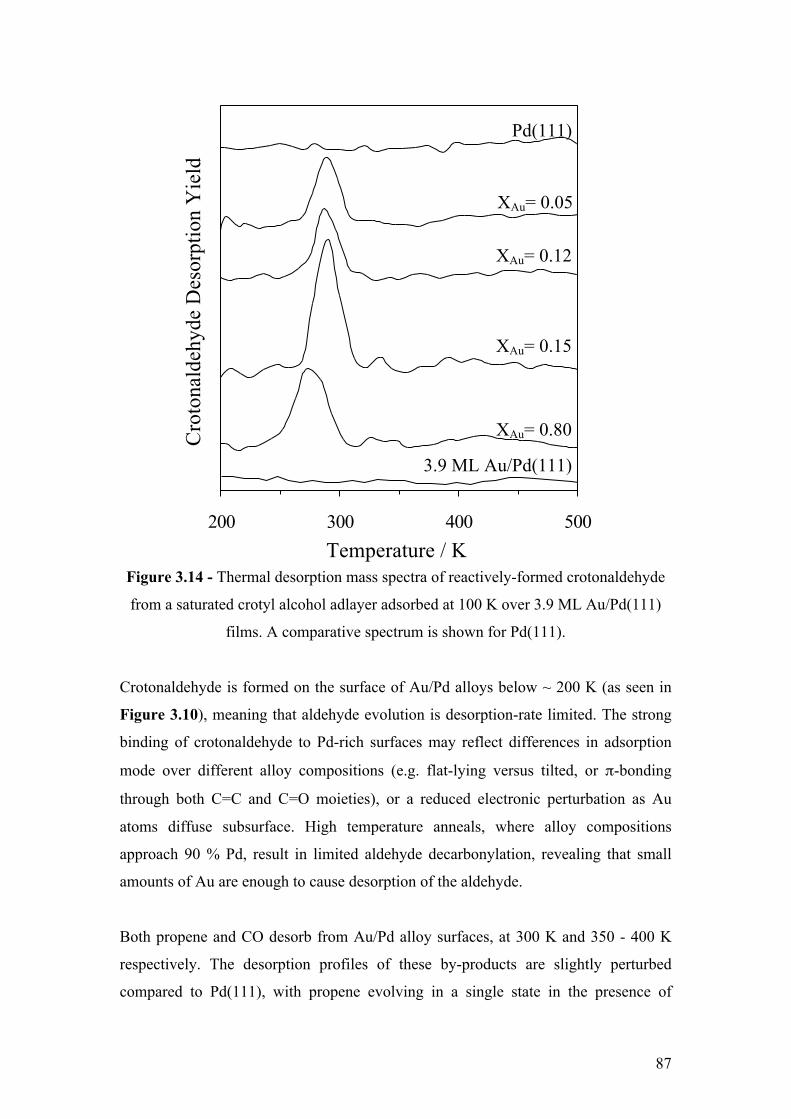
87
200 300 400 500
Figure 3.14 - Thermal desorption mass spectra of reactively-formed crotonaldehyde
from a saturated crotyl alcohol adlayer adsorbed at 100 K over 3.9 ML Au/Pd(111)
films. A comparative spectrum is shown for Pd(111).
Crotonaldehyde is formed on the surface of Au/Pd alloys below ~ 200 K (as seen in
Figure 3.10), meaning that aldehyde evolution is desorption-rate limited. The strong
binding of crotonaldehyde to Pd-rich surfaces may reflect differences in adsorption
mode over different alloy compositions (e.g. flat-lying versus tilted, or π-bonding
through both C=C and C=O moieties), or a reduced electronic perturbation as Au
atoms diffuse subsurface. High temperature anneals, where alloy compositions
approach 90 % Pd, result in limited aldehyde decarbonylation, revealing that small
amounts of Au are enough to cause desorption of the aldehyde.
Both propene and CO desorb from Au/Pd alloy surfaces, at 300 K and 350 - 400 K
respectively. The desorption profiles of these by-products are slightly perturbed
compared to Pd(111), with propene evolving in a single state in the presence of
Temperature / K
Cro
tona
ldeh
yde
Des
orpt
ion
Yie
ld
Pd(111)
3.9 ML Au/Pd(111)
XAu= 0.80
XAu= 0.15
XAu= 0.12
XAu= 0.05
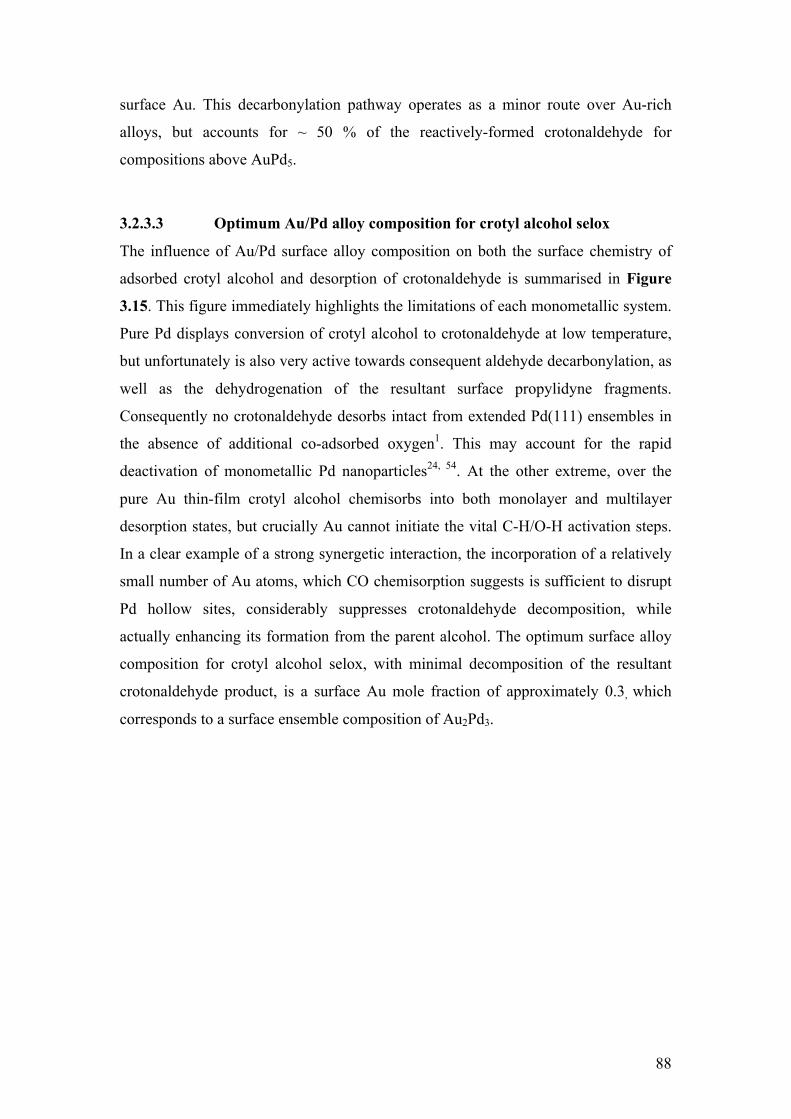
88
surface Au. This decarbonylation pathway operates as a minor route over Au-rich
alloys, but accounts for ~ 50 % of the reactively-formed crotonaldehyde for
compositions above AuPd5.
3.2.3.3 Optimum Au/Pd alloy composition for crotyl alcohol selox
The influence of Au/Pd surface alloy composition on both the surface chemistry of
adsorbed crotyl alcohol and desorption of crotonaldehyde is summarised in Figure
3.15. This figure immediately highlights the limitations of each monometallic system.
Pure Pd displays conversion of crotyl alcohol to crotonaldehyde at low temperature,
but unfortunately is also very active towards consequent aldehyde decarbonylation, as
well as the dehydrogenation of the resultant surface propylidyne fragments.
Consequently no crotonaldehyde desorbs intact from extended Pd(111) ensembles in
the absence of additional co-adsorbed oxygen1. This may account for the rapid
deactivation of monometallic Pd nanoparticles24, 54. At the other extreme, over the
pure Au thin-film crotyl alcohol chemisorbs into both monolayer and multilayer
desorption states, but crucially Au cannot initiate the vital C-H/O-H activation steps.
In a clear example of a strong synergetic interaction, the incorporation of a relatively
small number of Au atoms, which CO chemisorption suggests is sufficient to disrupt
Pd hollow sites, considerably suppresses crotonaldehyde decomposition, while
actually enhancing its formation from the parent alcohol. The optimum surface alloy
composition for crotyl alcohol selox, with minimal decomposition of the resultant
crotonaldehyde product, is a surface Au mole fraction of approximately 0.3, which
corresponds to a surface ensemble composition of Au2Pd3.
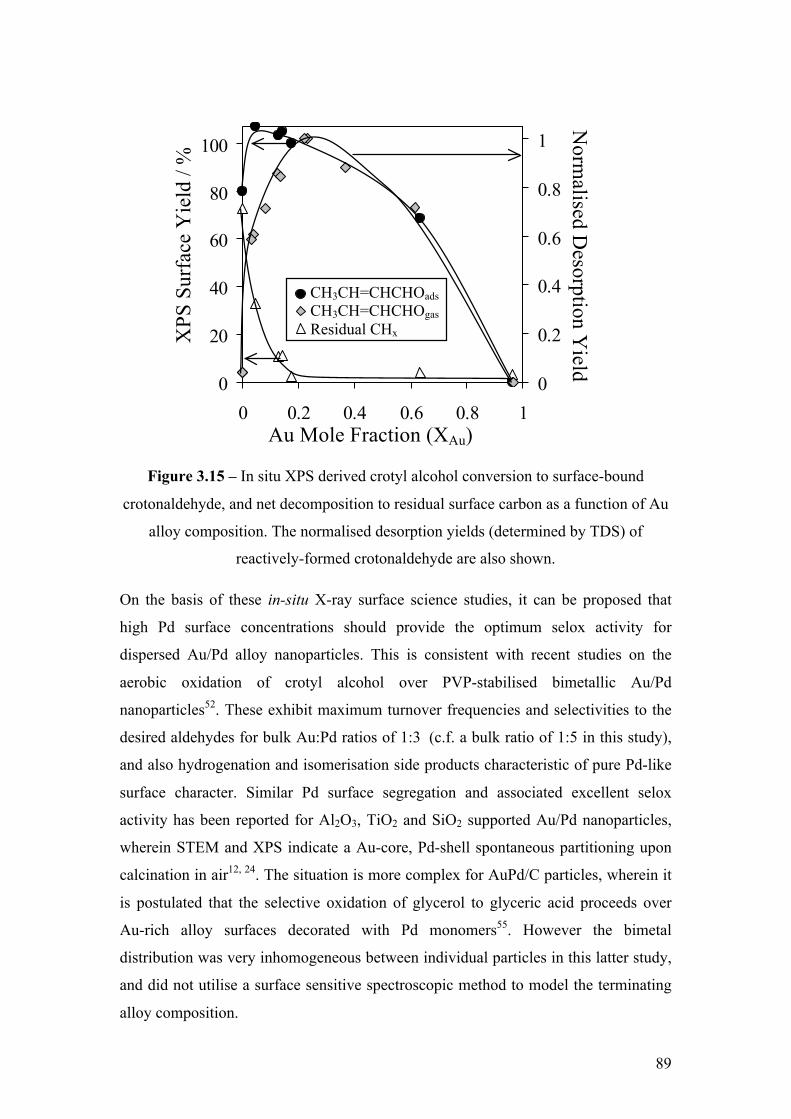
89
0
20
40
60
80
100
0 0.2 0.4 0.6 0.8 10
0.2
0.4
0.6
0.8
1
Figure 3.15 – In situ XPS derived crotyl alcohol conversion to surface-bound
crotonaldehyde, and net decomposition to residual surface carbon as a function of Au
alloy composition. The normalised desorption yields (determined by TDS) of
reactively-formed crotonaldehyde are also shown.
On the basis of these in-situ X-ray surface science studies, it can be proposed that
high Pd surface concentrations should provide the optimum selox activity for
dispersed Au/Pd alloy nanoparticles. This is consistent with recent studies on the
aerobic oxidation of crotyl alcohol over PVP-stabilised bimetallic Au/Pd
nanoparticles52. These exhibit maximum turnover frequencies and selectivities to the
desired aldehydes for bulk Au:Pd ratios of 1:3 (c.f. a bulk ratio of 1:5 in this study),
and also hydrogenation and isomerisation side products characteristic of pure Pd-like
surface character. Similar Pd surface segregation and associated excellent selox
activity has been reported for Al2O3, TiO2 and SiO2 supported Au/Pd nanoparticles,
wherein STEM and XPS indicate a Au-core, Pd-shell spontaneous partitioning upon
calcination in air12, 24. The situation is more complex for AuPd/C particles, wherein it
is postulated that the selective oxidation of glycerol to glyceric acid proceeds over
Au-rich alloy surfaces decorated with Pd monomers55. However the bimetal
distribution was very inhomogeneous between individual particles in this latter study,
and did not utilise a surface sensitive spectroscopic method to model the terminating
alloy composition.
Au Mole Fraction (XAu)
XPS
Sur
face
Yie
ld /
%
Norm
alised Desorption Y
ield
CH3CH=CHCHOads CH3CH=CHCHOgas Residual CHx
90
Earlier work on allylic alcohol selox has shown that strong adsorption of a proximate
C=C bond is essential for subsequent activation of primary alcohols56. This
observation is supported by NEXAFS measurements on crotyl alcohol over Pd(111)1
which reveal the C=C bond is bound parallel to the surface in both parent alcohol and
aldehyde product. For AuPd systems, it seems likely that extended Au ensembles
within Au-rich surfaces are themselves inactive towards crotyl alcohol, whilst the
probability of finding two Pd monomers in close proximity, able to tether the allyl
function while activating the alcohol, is too small for significant oxidation.
In addition, Au chemistry on the nano-scale generally exhibits pronounced particle
size dependency; hence Au-rich alloy nanoparticles may be more active than would
be predicted from this model investigation.
3.2.4 Errors
It is estimated that the error associated in the surface content from the XPS data will
be approximately 0.2 - 0.5 atomic%. This is an estimated error value, which will vary
depending upon the element under study, as each element has an associated response
factor to the XP spectrometer. Therefore, the XPS errors will be depend on the type of
measurement performed (i.e. determination of alloy compositions, calculation of
organic adsorbates etc). According to CasaXPS, the processing software used to
analyse the data presented in this chapter, the response factors for Pd 3d5/2 and Au
4f7/2 are 9.54 and 9.79 respectively. This means that the associated error in the
measurement of the alloy ratios / mole fractions will be approximately 3 %.
3.3 Conclusions
The coverage dependent adsorption of CO was used to examine the surface ensembles
available for selox by Au/Pd(111) surface alloys. The chemical shifts corresponding
to different CO bonding modes were tracked by time resolved C 1s XPS. In the case
of clean Pd(111), below 0.5 ML CO, a single binding energy state at 286.9 eV was
observed, which can be assigned to CO binding in hollow sites. With increasing CO
coverage, the hollow site occupancy decays with the population of an additional state
at 287.2 eV, attributed to bridge and atop bound CO. At saturation coverage, these
91
bridge and atop sites are almost exclusively populated. For the 3.9 ML thin-film of
Au on Pd(111), no CO adsorption was observed. However, when this film was
annealed to 600 K (driving Au/Pd intermixing and surface alloy formation), weak
chemisorption was observed for two high binding energy states at 287.7 and 288.5
eV. High temperature anneals drive further Au/Pd intermixing and the re-emergence
of the two Pd(111) CO binding energy states. The integrated intensities of these
experimentally determined states were compared to Monte Carlo simulations and
were found to be in good agreement, allowing the surface ensembles to be identified.
The key finding of this work is that surface Au rapidly suppresses CO adsorption over
larger Pd ensembles.
Following on from this, it has been shown that thin-films of epitaxial Au prepared
over a Pd(111) substrate reversibly chemisorb crotyl alcohol, but are unable to drive
selective oxidation or decomposition. Au-rich surface Au/Pd alloys show moderate
activity for the oxidative dehydrogenation of crotyl alcohol to crotonaldehyde, which
in turn desorbs intact at room temperature with minimal side-reactions. The optimum
surface alloy composition for crotyl alcohol selox, with minimal decomposition of the
resultant crotonaldehyde product, is Au2Pd3, associated with a bulk alloy composition
of AuPd5. Pd-rich alloy surfaces convert 100 % of a crotyl alcohol adlayer to
crotonaldehyde, although as much as half of this aldehyde subsequently
decarbonylates to produce gas phase CO and propene, and leave small amounts of
residual carbon (≤ 30 % of a monolayer). In summary, in-situ ‘fast’ XPS has been
used to show that small amounts of Au can promote the selective oxidation of crotyl
alcohol while suppressing crotonaldehyde decarbonylation, and that isolated Pd sites
are not the active site for such catalysis in extended alloys.
In this chapter, the influence of Au upon the formation of reactively formed
crotonaldehyde by the selox of crotyl alcohol over Pd(111) has been examined.
However, the chemistry of the aldehyde itself and any reactively formed by-products
has yet to be explored. As a result, the role of Au on the thermal chemistry of
crotonaldehyde over Pd(111) surfaces will be examined by temperature programmed
reaction spectroscopy in the next chapter. In addition, to imitate ‘real’ selox

92
conditions, the role of pre-adsorbed oxygen on clean and Au-promoted Pd(111)
surfaces will also be determined.
93
3.4 References
1. A. Lee, Z. Chang, P. Ellis, S. Hackett and K. Wilson, J. Phys. Chem. C, 2007, 111, 18844-18847.
2. S. Hackett, University of York, 2008.
3. F. Alardin, B. Delmon, P. Ruiz and M. Devillers, Catalysis Today, 2000, 61, 255-262.
4. M. Ruff, N. Takehiro, P. Liu, J. Nørskov and R. Behm, ChemPhysChem, 2007, 8, 2068-2071.
5. J. Rodriguez and D. Goodman, J. Phys. Chem., 1991, 95, 4196-4206.
6. M. D. Hughes, Y. J. Xu, P. Jenkins, P. McMorn, P. Landon, D. I. Enache, A. F. Carley, G. A. Attard, G. J. Hutchings, F. King, E. H. Stitt, P. Johnston, K. Griffin and C. J. Kiely, Nature, 2005, 437, 1132-1135.
7. G. J. Hutchings, Catalysis Today, 2007, 122, 196–200.
8. G. J. Hutchings, Chem. Commun., 2007, 2008, 1148–1164.
9. N. Dimitratos, F. Porta and L. Prati, Applied Catalysis A: General, 2005, 291, 210-214.
10. W. C. Ketchie, M. Murayama and R. J. Davis, Journal of Catalysis, 2007, 250, 264-273.
11. F. Menegazzo, P. Burti, M. Signoretto, M. Manzoli, S. Vankova, F. Boccuzzi, F. Pinna and G. Strukul, Journal of Catalysis, 2008, 257, 369-381.
12. J. K. Edwards, A. Thomas, A. F. Carley, A. A. Herzing, C. J. Kiely and G. J. Hutchings, Green Chem., 2008, 10, 388–394.
13. A. F. Lee, C. J. Baddeley, C. Hardacre, R. M. Ormerod, R. M. Lambert, G. Schmid and H. West, J. Phys. Chem., 1995, 99, 6096-6102.
14. C. J. Baddeley, J. R. M. Ormerod, A. W. Stephenson and R. M. Lambert, J. Phys. Chem., 1995, 99, 5146-5151.
15. C. J. Baddeley, M. Tikhov, C. Hardacre, J. R. Lomas and R. M. Lambert, J. Phys. Chem., 1996, 100, 2189-2194.
16. M. Bonarowska, J. Pielaszek, V. A. Semikolenov and Z. Karpinski, Journal of Catalysis, 2002, 209, 528–538.
17. F. Gao, Y. Wang, Z. Li, O. Furlong and W. Tysoe, J. Phys. Chem. C, 2008, 112, 3362-3372.
18. A. Lee, C. Baddeley, C. Hardacre, R. Ormerod, R. Lambert, G. Schmid and H. West, J. Phys. Chem., 1995, 99, 6096-6102.
19. J. A. Boscoboinik, C. Plaisance, M. Neurock and W. T. Tysoe, Phys. Rev. B, 2008, 77, 045422.
94
20. D. Yuan, X. Gong and R. Wu, Phys. Rev. B, 2007, 75, 085428.
21. A. Abad, P. Concepción, A. Corma and H. García, Angew. Chem. Int. Ed., 2005, 44, 4066 –4069.
22. N. Dimitratos, A. Villa, D. Wangb, F. Porta, D. Su and L. Prati, J. Cat., 2006, 244, 113-121.
23. X. Wang, N. S. Venkataramanan, H. Kawanami and Y. Ikushima, Green Chem., 2007, 9, 1352-1355.
24. D. I. Enache, J. K. Edwards, P. Landon, B. Solsona-Espriu, A. F. Carley, A. A. Herzing, M. Watanabe, C. J. Kiely, D. W. Knight and G. J. Hutchings, Science, 2006, 311, 362.
25. C. Baddeley, M. Tikhov, C. Hardacre, J. Lomas and R. Lambert, J. Phys. Chem., 1996, 100, 2189-2194.
26. B. Gleich, M. Ruff and R. Behm, Surf. Sci., 1997, 386, 48-55.
27. F. Calaza, F. Gao, Z. Li and W. Tysoe, Surf. Sci., 2007, 601, 714-722.
28. Z. Li, F. Gao, Y. Wang, F. Calaza, L. Burkholder and W. Tysoe, Surf. Sci., 2007, 601, 1898-1908.
29. R. Ormerod, C. Baddeley and R. M. Lambert, Surface Science, 1991, 259, L709-L713.
30. Z. Li, O. Furlong, F. Calaza, L. Burkholder, H. Poon, D. Saldin and W. Tysoe, Surf. Sci., 2008, 602, 1084-1091.
31. C.-W. Yi, K. Luo, T. Wei and D. W. Goodman, J. Phys. Chem. B, 2005, 109, 18535-18540.
32. La Surface, http://lasurface.com/xps/imfpgrapher.php.
33. P. J. Cumpson and M. P. Seah, Surface and Interface Analysis, 1997, 25.
34. H. Conrad, G. Ertl and J. Küppers, Surf. Sci., 1978, 76, 323-342.
35. T. Engel and G. Ertl, J. Chem. Phys., 1978, 69, 1267-1281.
36. H. Conrad, G. Ertl, J. Koch and E. E. Latta, Surf. Sci., 1974, 43.
37. P. Sautet, M. Rose, J. Dunphy, S. Behler and M. Salmeron, Surface Science, 2000, 453, 25-31.
38. J. Szanyi, W. K. Kuhn and D. W. Goodman, J. Phys. Chem., 1994, 98, 2978-2981.
39. S. Surnev, M. Sock, M. Ramsey, F. Netzer, M. Wiklund, M. Borg and J. Andersen, Surface Science, 2000, 470, 171-185.
40. C. Zhang and P. Hu, J. Am. Chem. Soc., 2001, 123, 1166-1172.
41. A. Santra and D. Goodman, Electrochimica Acta, 2002, 47, 3595-3609.
95
42. T. Matsushima and H. Asada, J. Chem. Phys., 1986, 85, 1658-1668.
43. B. Bourguignon, S. Carrez, B. Dragnea and H. Dubost, Surf. Sci., 1998, 418, 171-180.
44. V. V. Kaichev, I. P. Prosvirin, V. I. Bukhtiyarov, H. Unterhalt, G. Rupprechter and H.-J. Freund, J. Phys. Chem. B, 2003, 107, 3522-3527.
45. A. M. Bradshaw and F. H. Bradshaw, Surf. Sci., 1978, 72, 513-535.
46. R. L. Toomes, J. Robinson, S. M. Driver, D. P. Woodruff, P. Baumgärtel, T. Geißel, R. Lindsay, O. Schaff and A. M. Bradshaw, J. Phys: Condens. Matter 2000, 12, 3981–3991.
47. M. Rose, T. Mitsui, J. Dunphy, A. Borg, D. Ogletree, M. Salmeron and P. Sautet, Surf. Sci., 2002, 512, 48-60.
48. S. Hufner, G. Wertheim and J. Wemick, Solid State Comm., 1975, 17, 1585-1590.
49. M. Hughes, Y. Xu, P. Jenkins, P. McMorn, P. Landon, D. Enache, A. Carley, G. Attard, G. Hutchings and F. King, Nature, 2005, 437, 1132-1135.
50. X. Wang, N. Venkataramanan, H. Kawanami and Y. Ikushima, Green Chem., 2007, 9, 1352-1355.
51. A. Abad, P. Concepcion, A. Corma and H. Garcia, Angew. Chem. Int. Ed., 2005, 44, 4066-4069.
52. W. Hou, N. Dehm and R. Scott, J. Catalysis, 2008, 253, 22-27.
53. A. Lee, K. Wilson, A. Goldoni, R. Larciprete and S. Lizzit, Surf. Sci., 2002, 513, 140-148.
54. A. F. Lee and K. Wilson, Green Chem., 2004, 6, 37-42.
55. D. Wang, A. Villa, F. Porta, L. Prati and D. Su, J. Phys. Chem. C, 2008, 112, 8617-8622.
56. A. F. Lee, J. J. Gee and H. J. Theyers, Green Chem., 2000, 2, 279-282.
96
Chapter 4 Reactivity of crotonaldehyde and propene over Au/Pd(111) surface alloys
4.1 Introduction
Previous work using temperature programmed XPS experiments has shown that in
crotyl alcohol selox, crotonaldehyde decomposition and associated self-poisoning
prevails over model Pd(111) surfaces1. In the previous chapter, identical
experiments performed over Au/Pd(111) surface alloys, have shown that the
formation of reactively formed by-products can be inhibited, depending upon the
surface alloy composition. By introducing small amounts of Au into the Pd(111)
surface and performing TPD experiments, it was shown that the desorption of the
reactively formed aldehyde is promoted.
Despite this, questions remain regarding the role of alloyed Au, and its possible
influence upon reactively formed crotonaldehyde. For instance, does it disrupt the
undesired decarbonylation and/or dehydrogenation pathways operating over pure
Pd, and if so, how? In chapter 1 (section 1.5.2), it was also shown that there is also
a general dearth of knowledge regarding the surface chemistry of aldehydes over
metal surfaces.
In this chapter, the influence of Au upon the chemistry of crotonaldehyde over
Pd(111) surfaces will be examined. The chemistry of propene, the principal by-
product expected from crotonaldehyde decomposition, will also be investigated
over the same Au/Pd(111) surfaces. In addition, in order to better mimic true selox
conditions, the role of pre-adsorbed oxygen on clean and Au-promoted Pd surfaces
will also be explored.
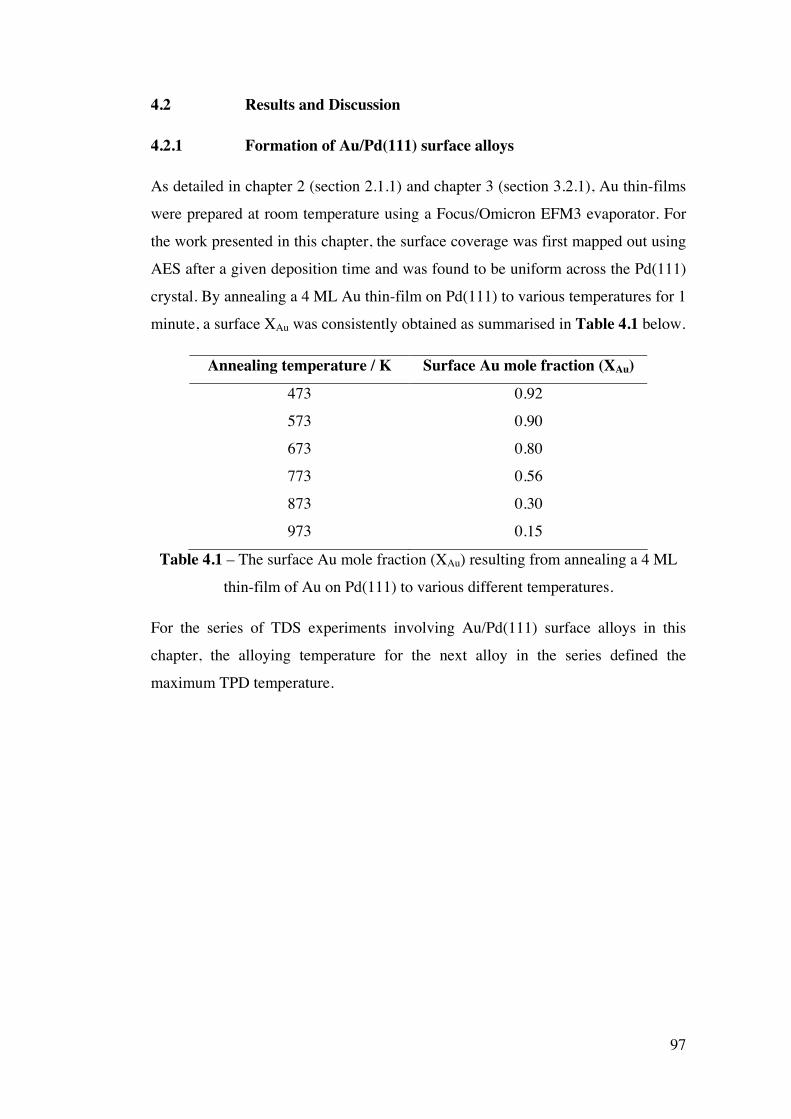
97
4.2 Results and Discussion
4.2.1 Formation of Au/Pd(111) surface alloys
As detailed in chapter 2 (section 2.1.1) and chapter 3 (section 3.2.1), Au thin-films
were prepared at room temperature using a Focus/Omicron EFM3 evaporator. For
the work presented in this chapter, the surface coverage was first mapped out using
AES after a given deposition time and was found to be uniform across the Pd(111)
crystal. By annealing a 4 ML Au thin-film on Pd(111) to various temperatures for 1
minute, a surface XAu was consistently obtained as summarised in Table 4.1 below.
Annealing temperature / K Surface Au mole fraction (XAu)
473 0.92
573 0.90
673 0.80
773 0.56
873 0.30
973 0.15
Table 4.1 – The surface Au mole fraction (XAu) resulting from annealing a 4 ML
thin-film of Au on Pd(111) to various different temperatures.
For the series of TDS experiments involving Au/Pd(111) surface alloys in this
chapter, the alloying temperature for the next alloy in the series defined the
maximum TPD temperature.
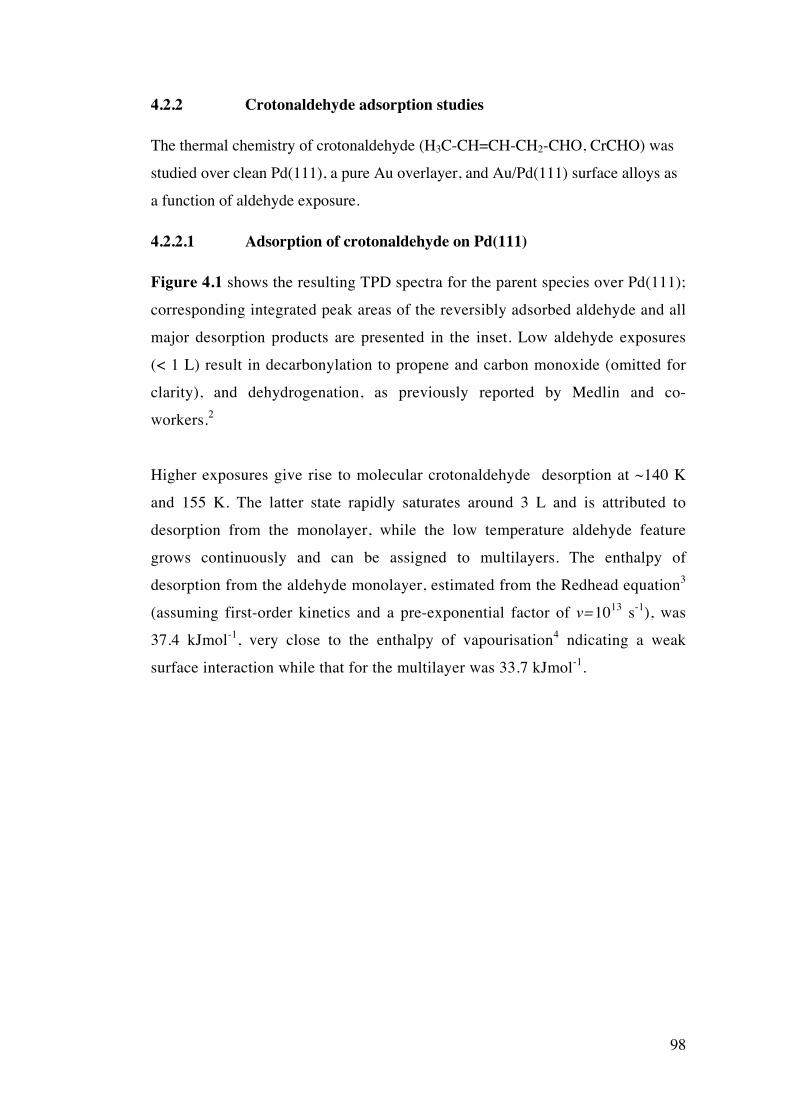
98
4.2.2 Crotonaldehyde adsorption studies
The thermal chemistry of crotonaldehyde (H3C-CH=CH-CH2-CHO, CrCHO) was
studied over clean Pd(111), a pure Au overlayer, and Au/Pd(111) surface alloys as
a function of aldehyde exposure.
4.2.2.1 Adsorption of crotonaldehyde on Pd(111)
Figure 4.1 shows the resulting TPD spectra for the parent species over Pd(111);
corresponding integrated peak areas of the reversibly adsorbed aldehyde and all
major desorption products are presented in the inset. Low aldehyde exposures
(< 1 L) result in decarbonylation to propene and carbon monoxide (omitted for
clarity), and dehydrogenation, as previously reported by Medlin and co-
workers.2
Higher exposures give rise to molecular crotonaldehyde desorption at ~140 K
and 155 K. The latter state rapidly saturates around 3 L and is attributed to
desorption from the monolayer, while the low temperature aldehyde feature
grows continuously and can be assigned to multilayers. The enthalpy of
desorption from the aldehyde monolayer, estimated from the Redhead equation3
(assuming first-order kinetics and a pre-exponential factor of ν=1013 s-1), was
37.4 kJmol-1, very close to the enthalpy of vapourisation4 ndicating a weak
surface interaction while that for the multilayer was 33.7 kJmol-1.
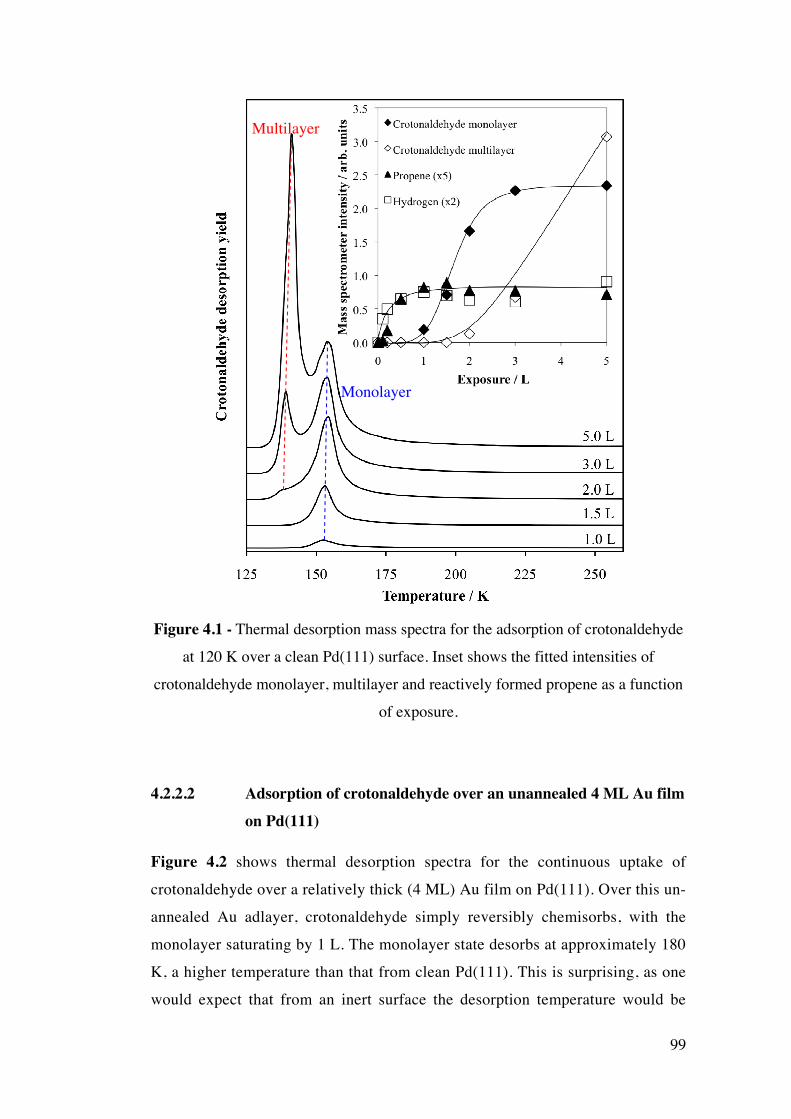
99
Figure 4.1 - Thermal desorption mass spectra for the adsorption of crotonaldehyde
at 120 K over a clean Pd(111) surface. Inset shows the fitted intensities of
crotonaldehyde monolayer, multilayer and reactively formed propene as a function
of exposure.
4.2.2.2 Adsorption of crotonaldehyde over an unannealed 4 ML Au film on Pd(111)
Figure 4.2 shows thermal desorption spectra for the continuous uptake of
crotonaldehyde over a relatively thick (4 ML) Au film on Pd(111). Over this un-
annealed Au adlayer, crotonaldehyde simply reversibly chemisorbs, with the
monolayer saturating by 1 L. The monolayer state desorbs at approximately 180
K, a higher temperature than that from clean Pd(111). This is surprising, as one
would expect that from an inert surface the desorption temperature would be
Monolayer
Multilayer
100
lower than that of a more reactive surface. The origin of this stronger adsorption
is unclear, however similar stabilisation is observed for prenal (3-methyl-2-
butenal), a related unsaturated aldehyde, over analogous surfaces of ‘inert’ Sn
alloyed with noble Pt(111) relative to clean Pt.5
Figure 4.2 - Thermal desorption mass spectra for the adsorption of crotonaldehyde
at 120 K over a thick (~ 4 ML) Au adlayer on Pd(111). Inset shows the fitted
intensities of the crotonaldehyde monolayer and multilayer states as a function of
exposure.
One possible explaination for this higher temperature could be that the aldehyde
forms a polymer over the Au surface resulting in a higher desorption
temperature relative to Pd. Despite no prior studies of crotonaldehyde
adsorption over pure Au(111), other aldehydes undergo similar polymerisation
processes on surfaces, such as formaldehyde on Cu(100)6 and (110)7, as well as
acetaldehyde on Rh(111)8 and Pt(111)9. The enthalpy of desorption was also
Monolayer
Multilayer
101
calculated by the Redhead equation3 and was determined to be 43.7 kJmol-1.
Once the monolayer saturates, physisorption occurs with multilayer desorption
occurs at 142 K; essentially the same temperature as that for clean Pd(111). No
reaction products are observed over the un-annealed Au surface.
4.2.2.3 Adsorption of crotonaldehyde on Au/Pd(111) surface alloys
The thermal chemistry of crotonaldehyde over several Au/Pd(111) surface alloys
was investigated. Figure 4.3 shows over-layed TPD spectra for a surface alloy with
a Au mole fraction of 0.56 (determined by AES) and also for a clean Pd(111)
surface. The same species desorb from both surfaces; propene and CO at similar
temperatures (~320 K and 455 K respectively). For clean Pd(111), three hydrogen
states are observed, the first is at 320 K, which is attributed to background
hydrogen. A second and third peak desorb at ~ 400 K and 465 K. In the case of
Pd(111), the same desorption temperatures have been observed in a previous
study2. Over the un-annealed Au film the hydrogen desorbs at the higher
temperatures of ~ 415 and 515 K.
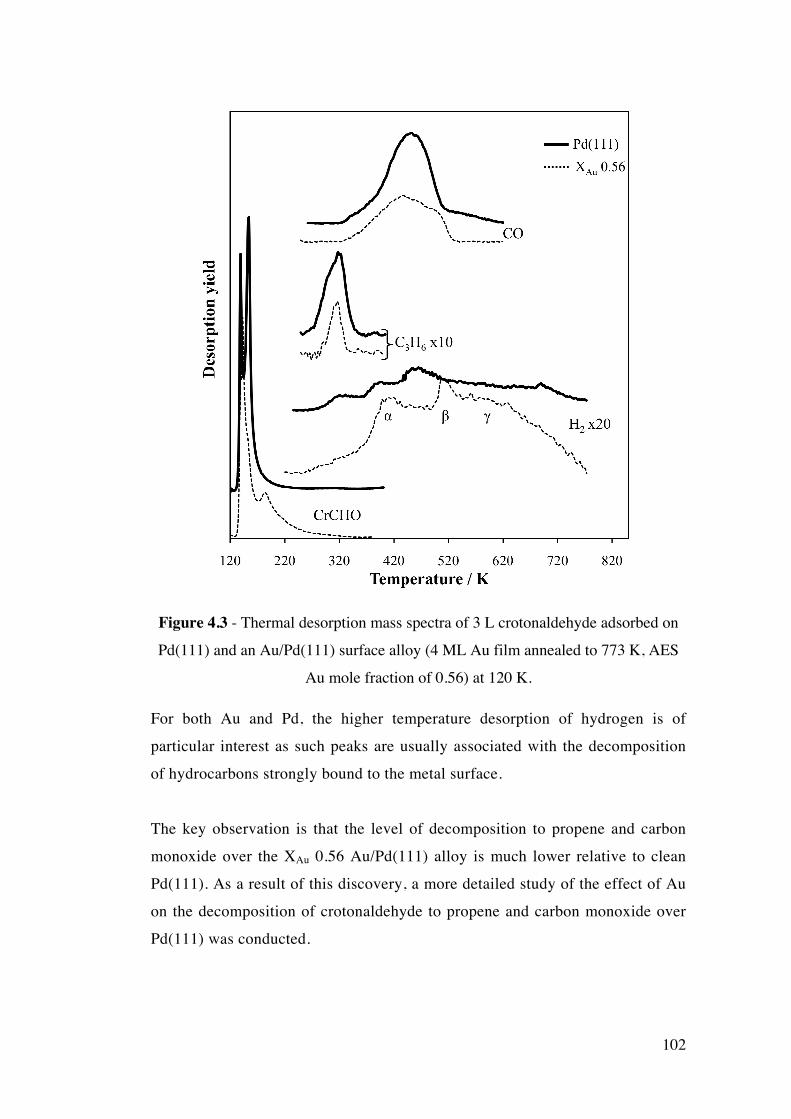
102
Figure 4.3 - Thermal desorption mass spectra of 3 L crotonaldehyde adsorbed on
Pd(111) and an Au/Pd(111) surface alloy (4 ML Au film annealed to 773 K, AES
Au mole fraction of 0.56) at 120 K.
For both Au and Pd, the higher temperature desorption of hydrogen is of
particular interest as such peaks are usually associated with the decomposition
of hydrocarbons strongly bound to the metal surface.
The key observation is that the level of decomposition to propene and carbon
monoxide over the XAu 0.56 Au/Pd(111) alloy is much lower relative to clean
Pd(111). As a result of this discovery, a more detailed study of the effect of Au
on the decomposition of crotonaldehyde to propene and carbon monoxide over
Pd(111) was conducted.
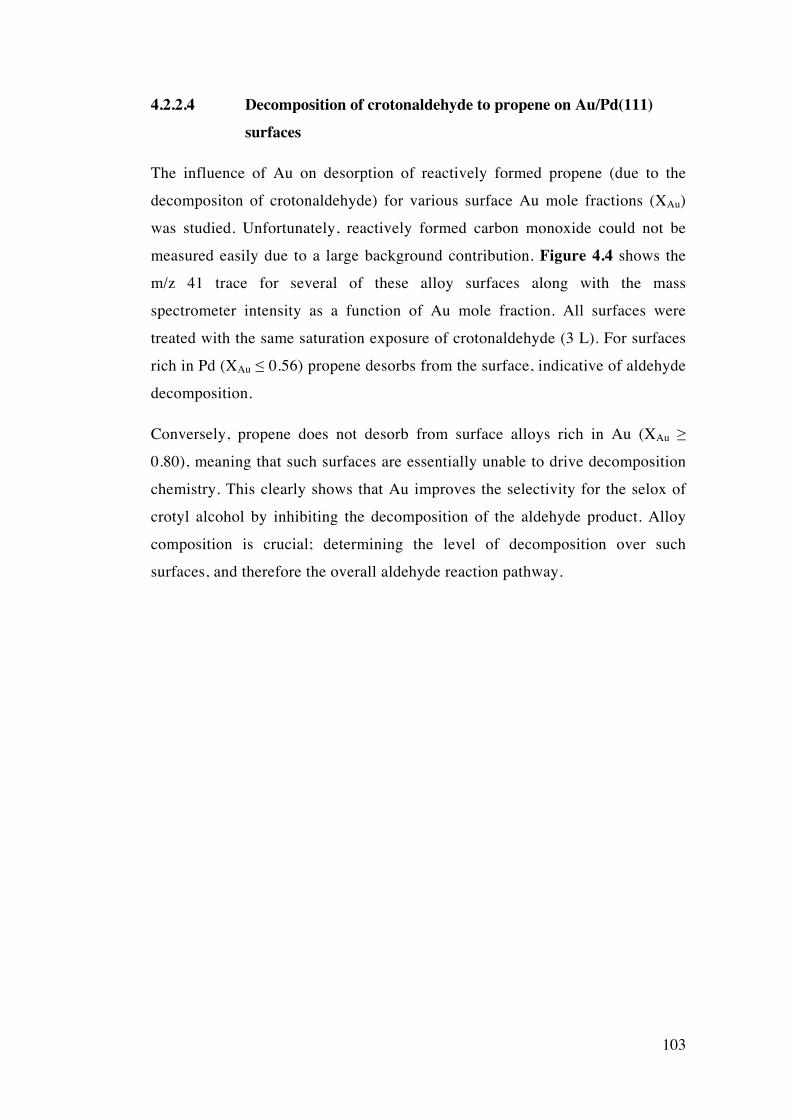
103
4.2.2.4 Decomposition of crotonaldehyde to propene on Au/Pd(111) surfaces
The influence of Au on desorption of reactively formed propene (due to the
decompositon of crotonaldehyde) for various surface Au mole fractions (XAu)
was studied. Unfortunately, reactively formed carbon monoxide could not be
measured easily due to a large background contribution. Figure 4.4 shows the
m/z 41 trace for several of these alloy surfaces along with the mass
spectrometer intensity as a function of Au mole fraction. All surfaces were
treated with the same saturation exposure of crotonaldehyde (3 L). For surfaces
rich in Pd (XAu ≤ 0.56) propene desorbs from the surface, indicative of aldehyde
decomposition.
Conversely, propene does not desorb from surface alloys rich in Au (XAu ≥
0.80), meaning that such surfaces are essentially unable to drive decomposition
chemistry. This clearly shows that Au improves the selectivity for the selox of
crotyl alcohol by inhibiting the decomposition of the aldehyde product. Alloy
composition is crucial; determining the level of decomposition over such
surfaces, and therefore the overall aldehyde reaction pathway.
104
Figure 4.4 - Thermal desorption mass spectra for the formation of propene from
the adsorption of crotonaldehyde (3 L) at 120 K over Au/Pd(111) surface alloys.
Inset shows the fitted intensities of propene as a function of surface Au mole
fraction (XAu).
4.2.3 Propene adsorption
4.2.3.1 Adsorption of propene on Pd(111)
The thermal chemistry of propene; a product of crotonaldehyde decomposition,
was studied over Pd(111) in order to benchmark the reactivity. Figure 4.5 shows
the uptake of propene on the clean Pd(111) surface. From the inset graph we see
that for low exposures propene dehydrogenates to form hydrogen and surface
carbon. As stated previously (when describing Figure 4.3), the hydrogen of interest
105
is that formed at high temperature, which results from hydrocarbon decomposition.
This higher temperature hydrogen state saturates around 1.5 L.
The amount of hydrogen that desorbs relative to propene is low, and has therefore
been scaled by a factor of 40. This small hydrogen yield is consistent with Land’s
work, which showed that propene desorption is favoured over decomposition, as no
more than 10% of the chemisorbed propene dehydrogenates to produce surface
bound carbon10. The monolayer state desorbs at ~ 280 K, which shifts to a lower
temperature of ~ 260 K with increasing exposure, saturating at 2 L. The multilayer
state desorbs between 180 and 170 K, again depending upon exposure. Both the
monolayer and multilayer desorption temperatures are consistent with literature10.
Tysoe’s group carried out a TPD and RAIRS study on the low temperature
adsorption of propene on Pd(111)11. At low coverages they observed a state centred
at ~ 210 K, which shifts to 195 K with increasing exposure. They determined that
this was a result of a ‘V-shaped’ adsorption state that is not favoured at high
coverage where the methyl group aligns perpendicular to the surface. This
conclusion was made as a result of a similar trend observed for propene adsorption
on Pt(111)12. As we are concerned with the chemistry at saturation coverages, we
do not need to take this state into account.
For higher coverages, TPD spectra are similar to those reported in this work
(propene desorbing molecularly at ~ 200 and 280 K). However, they determine that
propene adsorbs onto several adsorption sites, which contribute to the monolayer
state. They show that at low temperature, propene binds in a di-σ coordination on
the clean Pd(111) surface. Upon heating, a small portion of this desorbs at ~ 200 K
and the remainder is converted to a stronger bound di-σ state with the methyl group
bound parallel to the surface, which eventually desorbs at ~ 280K.
Further heating forms an allylic species, of which a small proportion
rehydrogenates at ~ 340 K, but the majority dehydrogenates at ~ 360 K. A second
layer is found to desorb at about 190 K, which we will not discuss in this work, as
we are only concerned with the chemistry of propene on Au/Pd(111) surfaces and
surface alloys.
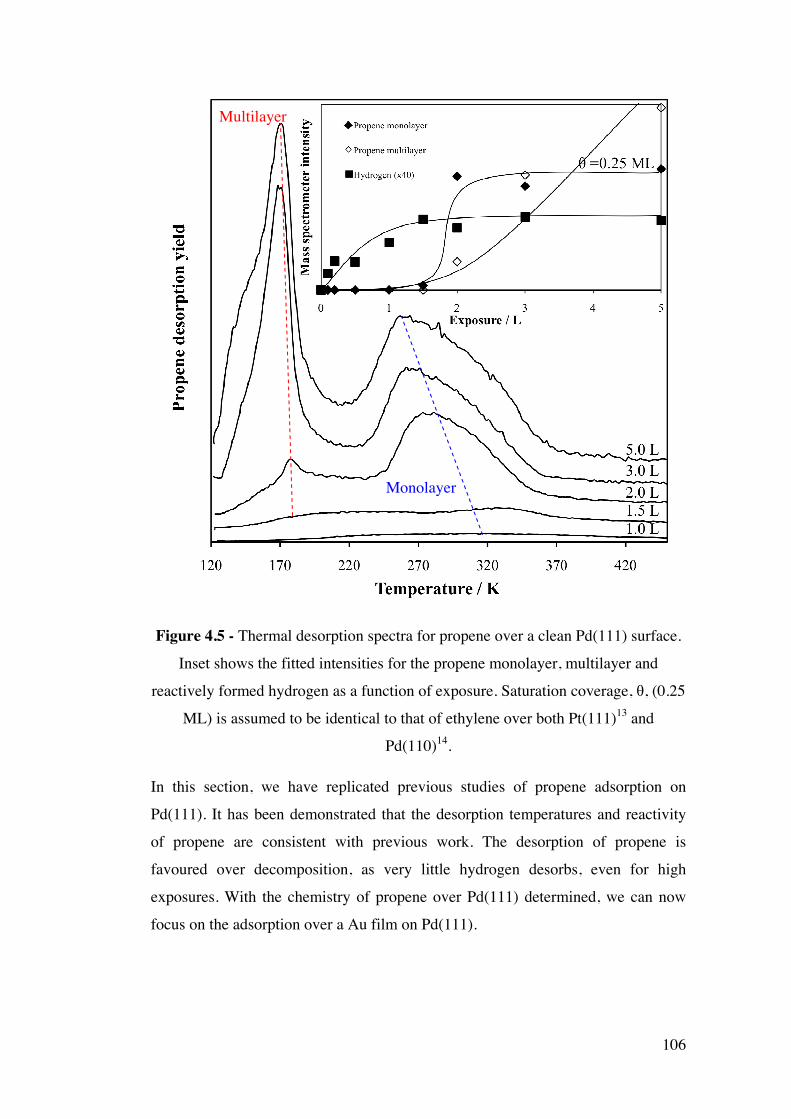
106
Figure 4.5 - Thermal desorption spectra for propene over a clean Pd(111) surface.
Inset shows the fitted intensities for the propene monolayer, multilayer and
reactively formed hydrogen as a function of exposure. Saturation coverage, θ, (0.25
ML) is assumed to be identical to that of ethylene over both Pt(111)13 and
Pd(110)14.
In this section, we have replicated previous studies of propene adsorption on
Pd(111). It has been demonstrated that the desorption temperatures and reactivity
of propene are consistent with previous work. The desorption of propene is
favoured over decomposition, as very little hydrogen desorbs, even for high
exposures. With the chemistry of propene over Pd(111) determined, we can now
focus on the adsorption over a Au film on Pd(111).
Monolayer
Multilayer
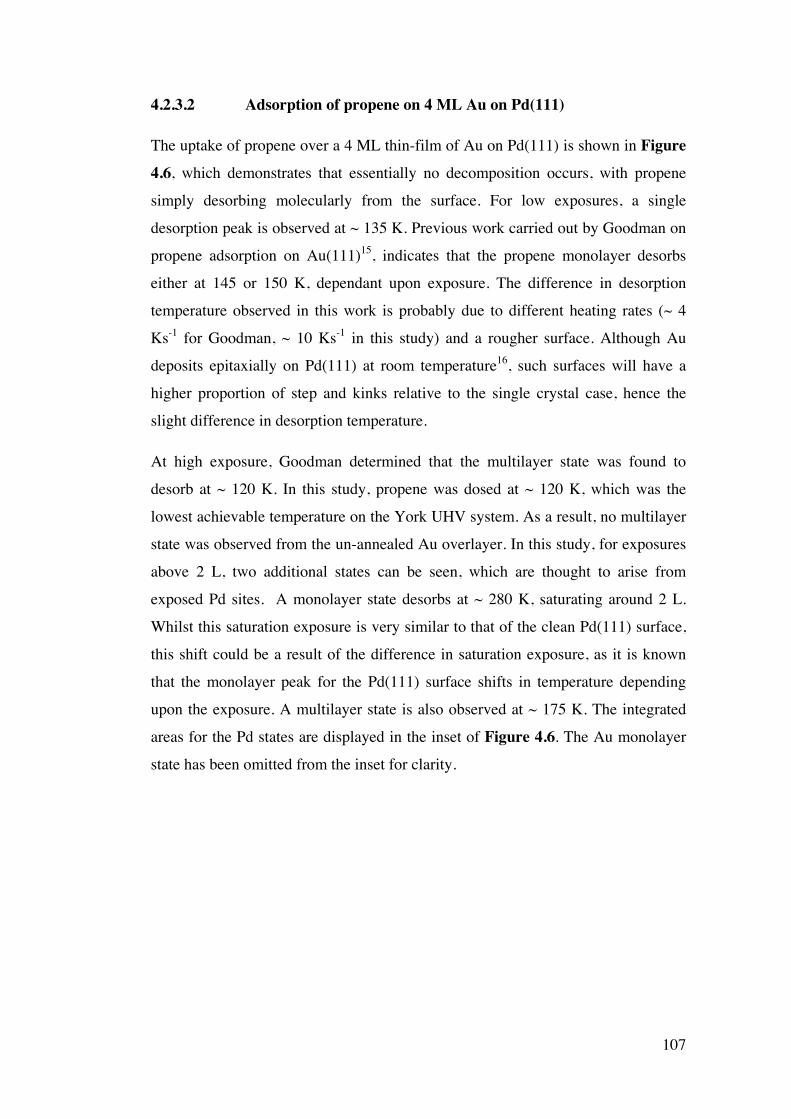
107
4.2.3.2 Adsorption of propene on 4 ML Au on Pd(111)
The uptake of propene over a 4 ML thin-film of Au on Pd(111) is shown in Figure 4.6, which demonstrates that essentially no decomposition occurs, with propene
simply desorbing molecularly from the surface. For low exposures, a single
desorption peak is observed at ~ 135 K. Previous work carried out by Goodman on
propene adsorption on Au(111)15, indicates that the propene monolayer desorbs
either at 145 or 150 K, dependant upon exposure. The difference in desorption
temperature observed in this work is probably due to different heating rates (~ 4
Ks-1 for Goodman, ~ 10 Ks-1 in this study) and a rougher surface. Although Au
deposits epitaxially on Pd(111) at room temperature16, such surfaces will have a
higher proportion of step and kinks relative to the single crystal case, hence the
slight difference in desorption temperature.
At high exposure, Goodman determined that the multilayer state was found to
desorb at ~ 120 K. In this study, propene was dosed at ~ 120 K, which was the
lowest achievable temperature on the York UHV system. As a result, no multilayer
state was observed from the un-annealed Au overlayer. In this study, for exposures
above 2 L, two additional states can be seen, which are thought to arise from
exposed Pd sites. A monolayer state desorbs at ~ 280 K, saturating around 2 L.
Whilst this saturation exposure is very similar to that of the clean Pd(111) surface,
this shift could be a result of the difference in saturation exposure, as it is known
that the monolayer peak for the Pd(111) surface shifts in temperature depending
upon the exposure. A multilayer state is also observed at ~ 175 K. The integrated
areas for the Pd states are displayed in the inset of Figure 4.6. The Au monolayer
state has been omitted from the inset for clarity.
108
Figure 4.6 - Thermal desorption mass spectra for the adsorption propene at over a
4 ML Au adlayer on Pd(111). Inset shows the fitted intensities for the propene
monolayer and multilayer as a function of exposure. Saturation coverage (0.25 ML)
is assumed to be identical to that of ethylene over both Pt(111)13 and Pd(110)14.
We have shown over this Au film that propene simply desorbs molecularly with no
chemistry occuring. There are a variety of different desorption temperatures to
consider, which can be attributed to perturbed Au and Pd. With the uptake over the
Au film complete, we can therefore move onto the chemistry of propene over
Au/Pd(111) surface alloys.
Pd monolayer
Pd multilayer
Au monolayer
109
4.2.3.3 Adsorption of propene on Au/Pd(111) surface alloys
The adsorption of ethene has been studied on various Au/Pd(111) alloy surfaces by
TPD and RAIRS recently by Tysoe17. For alloys with Au coverages greater than
0.7, they found that ethene adsorbs mostly on Au sites desorbing with an activation
energy of less than 55 kJ mol-1. For coverages between 0.5 - 0.7 Au they detected
π-bonded ethene on Pd sites, which desorbs with an activation energy between 57
and 62 kJ mol-1. Reducing the Au coverage further results in a linear increase in
activation energy until it reaches 76 kJ mol-1, the value for pure Pd(111). Whilst
this is a slightly different molecule, it highlights the fact that alkenes bind more
weakly to Au rich surfaces.
When the 4 ML Au film (section 4.1.3.2) was annealed to 773 K, a surface alloy
with a Au mole fraction of 0.56 was created (identical to the surface formed in
Figure 4.3). 3 L propene was dosed into the chamber, and the desorption products
were stacked with those observed for clean Pd(111) and are presented in Figure 4.7. In both cases propene and hydrogen desorb from both surfaces at similar
temperatures. As previously stated, for Pd the propene monolayer desorbs at a
temperature of ~ 270 K and the multilayer at ~ 170 K. In the case of the Au/Pd
alloy there is also an additional propene state at ~ 135 K, which is atttributed to
propene monolayer desorption from Au sites.
There is a small apparent shift of these values for the Au alloy, where the
monolayer desorbs at both ~ 270 and 320 K, however, it is thought these peaks are
as a result of the desorption of a di-σ bonded state and then a π-bonded state as
revealed by Tysoe11. It is possible that this apparent shift is due to the greater
population of π-bonded states as ethene adsorbs onto Au sites exclusively in a π-
bonded state17. There does appear to be a small genuine shift of the monolayer state
by approximately 10 K. The hydrogen which desorbs from the Pd(111) desorbs in
two states at ~ 350 and 485 K which as explained earlier has been recorded
elsewhere10, 11. For the Au alloy, this desorption is shifted by approximately 10 K,
but are thought to be essentially analogous.
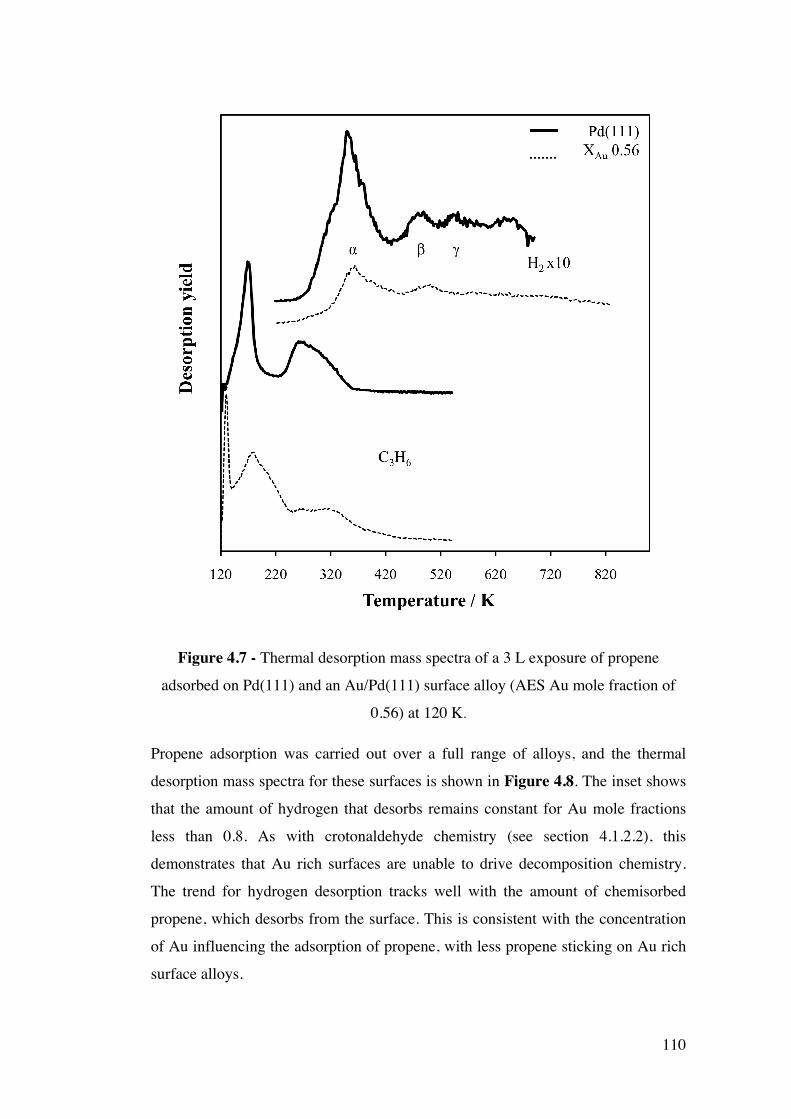
110
Figure 4.7 - Thermal desorption mass spectra of a 3 L exposure of propene
adsorbed on Pd(111) and an Au/Pd(111) surface alloy (AES Au mole fraction of
0.56) at 120 K.
Propene adsorption was carried out over a full range of alloys, and the thermal
desorption mass spectra for these surfaces is shown in Figure 4.8. The inset shows
that the amount of hydrogen that desorbs remains constant for Au mole fractions
less than 0.8. As with crotonaldehyde chemistry (see section 4.1.2.2), this
demonstrates that Au rich surfaces are unable to drive decomposition chemistry.
The trend for hydrogen desorption tracks well with the amount of chemisorbed
propene, which desorbs from the surface. This is consistent with the concentration
of Au influencing the adsorption of propene, with less propene sticking on Au rich
surface alloys.
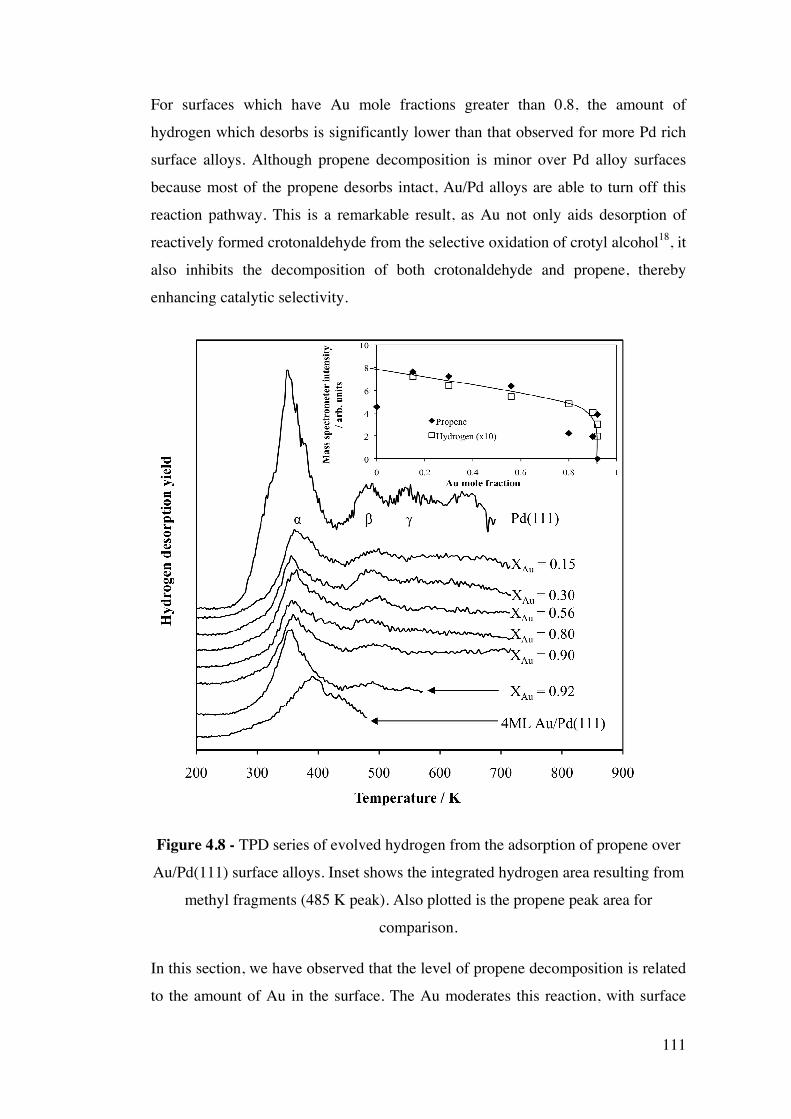
111
For surfaces which have Au mole fractions greater than 0.8, the amount of
hydrogen which desorbs is significantly lower than that observed for more Pd rich
surface alloys. Although propene decomposition is minor over Pd alloy surfaces
because most of the propene desorbs intact, Au/Pd alloys are able to turn off this
reaction pathway. This is a remarkable result, as Au not only aids desorption of
reactively formed crotonaldehyde from the selective oxidation of crotyl alcohol18, it
also inhibits the decomposition of both crotonaldehyde and propene, thereby
enhancing catalytic selectivity.
Figure 4.8 - TPD series of evolved hydrogen from the adsorption of propene over
Au/Pd(111) surface alloys. Inset shows the integrated hydrogen area resulting from
methyl fragments (485 K peak). Also plotted is the propene peak area for
comparison.
In this section, we have observed that the level of propene decomposition is related
to the amount of Au in the surface. The Au moderates this reaction, with surface
112
Au mole fractions greater than 0.8 being sufficient to suppress the reaction
completely.
4.2.4 The effect of co-adsorbed O
In an attempt to replicate aerobic selective oxidation over model surfaces in more
‘realistic’ conditions, adsorbates were dosed after such surfaces were pre-covered
with O. This was achieved by exposing surfaces to ~ 60 L of O2 whilst cooling to
120 K. Once this temperature was achieved, the oxygen leak valve was closed off
and the desired adsorbate dosed the UHV chamber in the normal way. In surface
alloys, the metal that forms the stronger bonds with a given adsorbate often will
segregate to the surface. It should be noted that at high temperatures, it is known
that adsorbing O onto Au/Pd surface alloys can artificially enrich the top layers
with Pd19, 20. In order to avoid driving Pd into the surface and changing the surface
alloy composition, O was only released into the UHV chamber when the substrate
was at room temperature or lower. In order to confirm that the alloy composition
remained constant, AES measurements were carried out both before and after
oxygen adsorption.
4.2.4.1 Adsorption of crotonaldehyde on O pre-covered Au/Pd(111) surfaces
Thermal desorption spectra were recorded over a Pd(111) surface and a
Au/Pd(111) surface alloy (XAu = 0.56), which are both shown in Figure 4.9. The
spectrum for Pd(111) shows that both CO2 and CO desorb at ~ 390 and 450 K
respectively, a trend which is not observed on the clean surface and is obviously
indicative of combustion. In addition, water also desorbs from the surface with a
peak maxima at ~ 280 K.
Decomposition still occurs, as a small amount of propene desorbs from the surface
at the characteristic temperature of ~ 320 K. Over the surface containing Au, no
decomposition occurs, in direct contrast to the same oxygen free surface. From the
TPR data, it is possible that a small amount of combustion occurs over the alloy
113
surface, but if so, it can be regarded as minor reaction pathway, as the amount that
desorbs is close to the limit of detection for the mass spectrometer. Clearly, O co-
adsorption over Au/Pd alloy surfaces inhibits decomposition of the aldehyde to a
higher degree when compared to O free alloys.
In order to examine the relationship between the alloy composition and
decomposition, the level of decomposition was investigated over several O covered
alloy surfaces, the results of which are shown in Figure 4.10. Propene desorbs
exclusively from highly Pd rich alloy surfaces (between XAu of 0 and 0.15), for
surfaces equal to or less than Au mole fractions of 0.3 no propene desorbs. The
trend for carbon dioxide mirrors that for propene as evidenced from the inset graph.
Without O(ads), propene desorbs from surfaces with a Au mole fraction greater than
0.8. In addition to this, the amount of propene that desorbs over O covered alloy
surfaces is much less when compared to O free alloys.
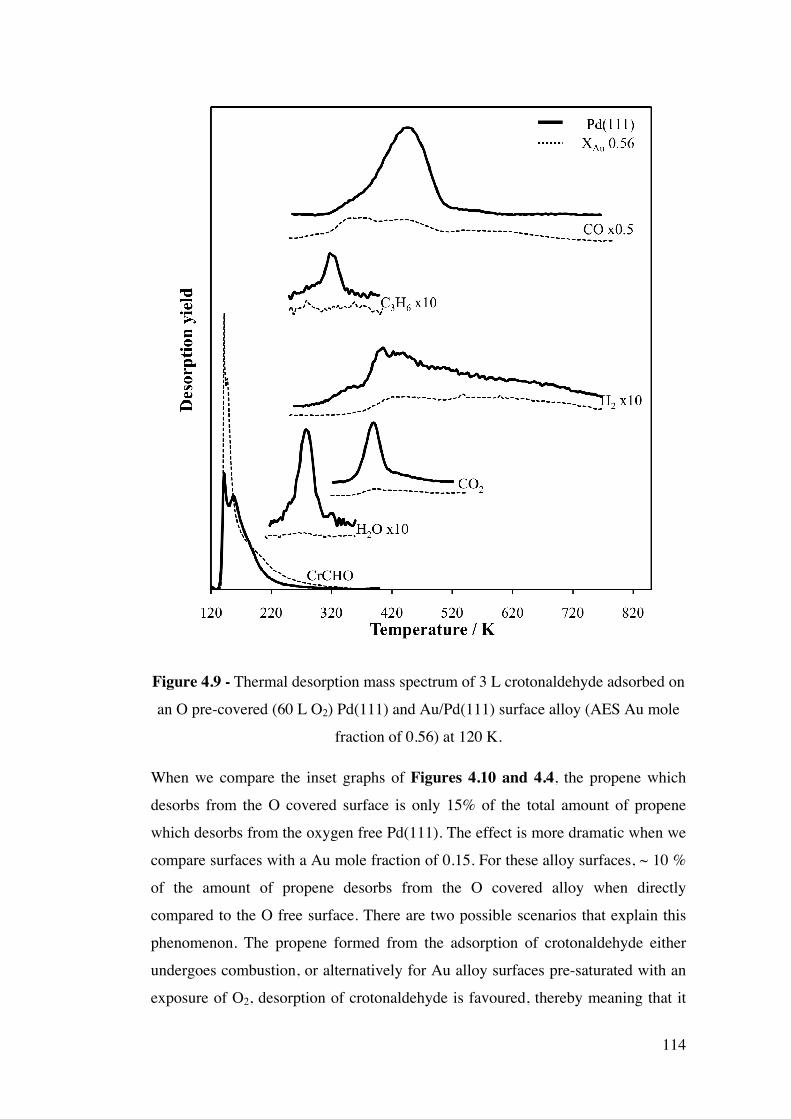
114
Figure 4.9 - Thermal desorption mass spectrum of 3 L crotonaldehyde adsorbed on
an O pre-covered (60 L O2) Pd(111) and Au/Pd(111) surface alloy (AES Au mole
fraction of 0.56) at 120 K.
When we compare the inset graphs of Figures 4.10 and 4.4, the propene which
desorbs from the O covered surface is only 15% of the total amount of propene
which desorbs from the oxygen free Pd(111). The effect is more dramatic when we
compare surfaces with a Au mole fraction of 0.15. For these alloy surfaces, ~ 10 %
of the amount of propene desorbs from the O covered alloy when directly
compared to the O free surface. There are two possible scenarios that explain this
phenomenon. The propene formed from the adsorption of crotonaldehyde either
undergoes combustion, or alternatively for Au alloy surfaces pre-saturated with an
exposure of O2, desorption of crotonaldehyde is favoured, thereby meaning that it
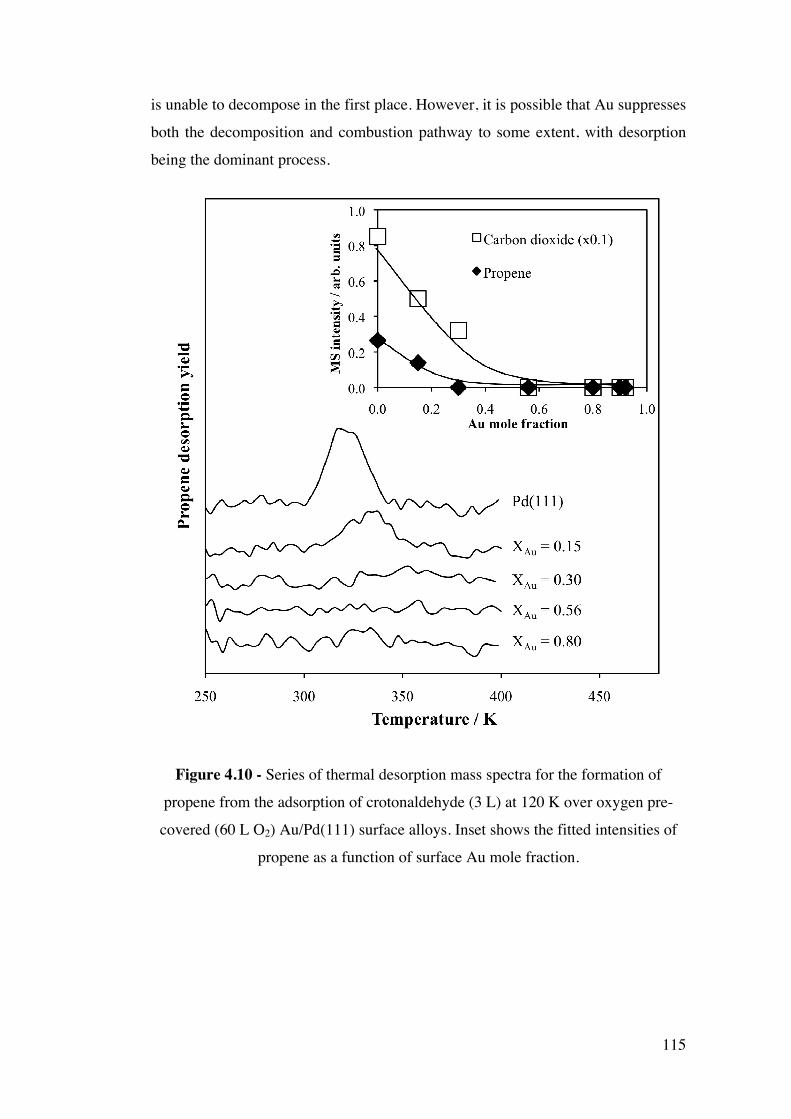
115
is unable to decompose in the first place. However, it is possible that Au suppresses
both the decomposition and combustion pathway to some extent, with desorption
being the dominant process.
Figure 4.10 - Series of thermal desorption mass spectra for the formation of
propene from the adsorption of crotonaldehyde (3 L) at 120 K over oxygen pre-
covered (60 L O2) Au/Pd(111) surface alloys. Inset shows the fitted intensities of
propene as a function of surface Au mole fraction.
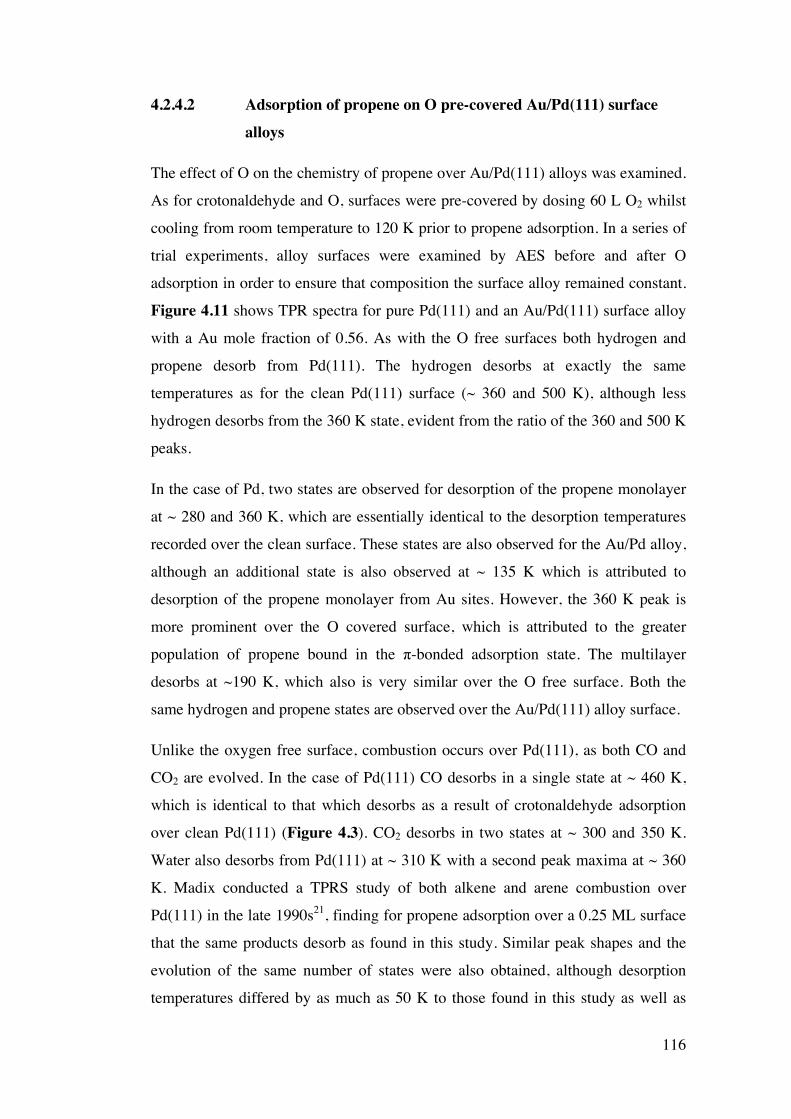
116
4.2.4.2 Adsorption of propene on O pre-covered Au/Pd(111) surface alloys
The effect of O on the chemistry of propene over Au/Pd(111) alloys was examined.
As for crotonaldehyde and O, surfaces were pre-covered by dosing 60 L O2 whilst
cooling from room temperature to 120 K prior to propene adsorption. In a series of
trial experiments, alloy surfaces were examined by AES before and after O
adsorption in order to ensure that composition the surface alloy remained constant.
Figure 4.11 shows TPR spectra for pure Pd(111) and an Au/Pd(111) surface alloy
with a Au mole fraction of 0.56. As with the O free surfaces both hydrogen and
propene desorb from Pd(111). The hydrogen desorbs at exactly the same
temperatures as for the clean Pd(111) surface (~ 360 and 500 K), although less
hydrogen desorbs from the 360 K state, evident from the ratio of the 360 and 500 K
peaks.
In the case of Pd, two states are observed for desorption of the propene monolayer
at ~ 280 and 360 K, which are essentially identical to the desorption temperatures
recorded over the clean surface. These states are also observed for the Au/Pd alloy,
although an additional state is also observed at ~ 135 K which is attributed to
desorption of the propene monolayer from Au sites. However, the 360 K peak is
more prominent over the O covered surface, which is attributed to the greater
population of propene bound in the π-bonded adsorption state. The multilayer
desorbs at ~190 K, which also is very similar over the O free surface. Both the
same hydrogen and propene states are observed over the Au/Pd(111) alloy surface.
Unlike the oxygen free surface, combustion occurs over Pd(111), as both CO and
CO2 are evolved. In the case of Pd(111) CO desorbs in a single state at ~ 460 K,
which is identical to that which desorbs as a result of crotonaldehyde adsorption
over clean Pd(111) (Figure 4.3). CO2 desorbs in two states at ~ 300 and 350 K.
Water also desorbs from Pd(111) at ~ 310 K with a second peak maxima at ~ 360
K. Madix conducted a TPRS study of both alkene and arene combustion over
Pd(111) in the late 1990s21, finding for propene adsorption over a 0.25 ML surface
that the same products desorb as found in this study. Similar peak shapes and the
evolution of the same number of states were also obtained, although desorption
temperatures differed by as much as 50 K to those found in this study as well as
117
those for propene adsorption on clean Pd(111) mentioned earlier by Land10 and
Tysoe11. However, Goodman shows that the desorption temperature of propene can
vary greatly depending upon the oxygen coverage15.
Figure 4.11 - Thermal desorption mass spectrum of 3 L propene adsorbed on an
oxygen pre-covered (60 L O2) Pd(111) surface, and an oxygen pre-covered
Au/Pd(111) surface alloy (AES Au mole fraction of 0.56) at 120 K.
The same desorption states obtained for Pd(111) are mirrored for the species which
desorb from the 0.56 XAu alloy surface. However the amount of each product
which desorbs is significant lower when compared to Pd(111). This indicates that
both decomposition and combustion processes are hindered by surfaces containing
Au. It is thought that perhaps a small amount of combustion occurs, due to very
small CO and CO2 desorption peaks, but it is tenuous as to whether this is genuine,
118
as the amounts are close to the limit of detection for the mass spectrometer. Clearly
desorption is favoured over decomposition and combustion processes over this
particular alloy surface.
The adsorption of propene over a full range of oxygen pre-covered Au/Pd(111)
alloys was then investigated by TPRS. The spectra for hydrogen evolved over these
alloys, along with an inset displaying the mass spectrometer intensity for both
hydrogen and propene, which are shown in Figure 4.12. A major difference is
observed in terms of the ratio of hydrogen desorption states. For the clean surfaces
(Figure 4.8), the intensity of the hydrogen desorption at ~360 K is much larger
than that observed for surfaces pre-covered with O. The state at ~ 485 K remains
unaffected, as from the inset figure it is clear to see that the same arbitary intensity
is observed (~4 x 10⁻⁶ to 2 x 10⁻⁶) in both cases. Au turns off this decomposition
pathway for Au mole fractions greater than 0.8. This means that the decomposition
of the propene to hydrogen is unaffected by the pre-adsorption of O, as the same
general trend is observed. As with the oxygen free alloy surfaces, the hydrogen
trend tracks well with that for the desorption of the propene monolayer, possibly
indicating that the concentration of Au influences the adsorption of propene, with
less propene sticking on Au rich surface alloys.
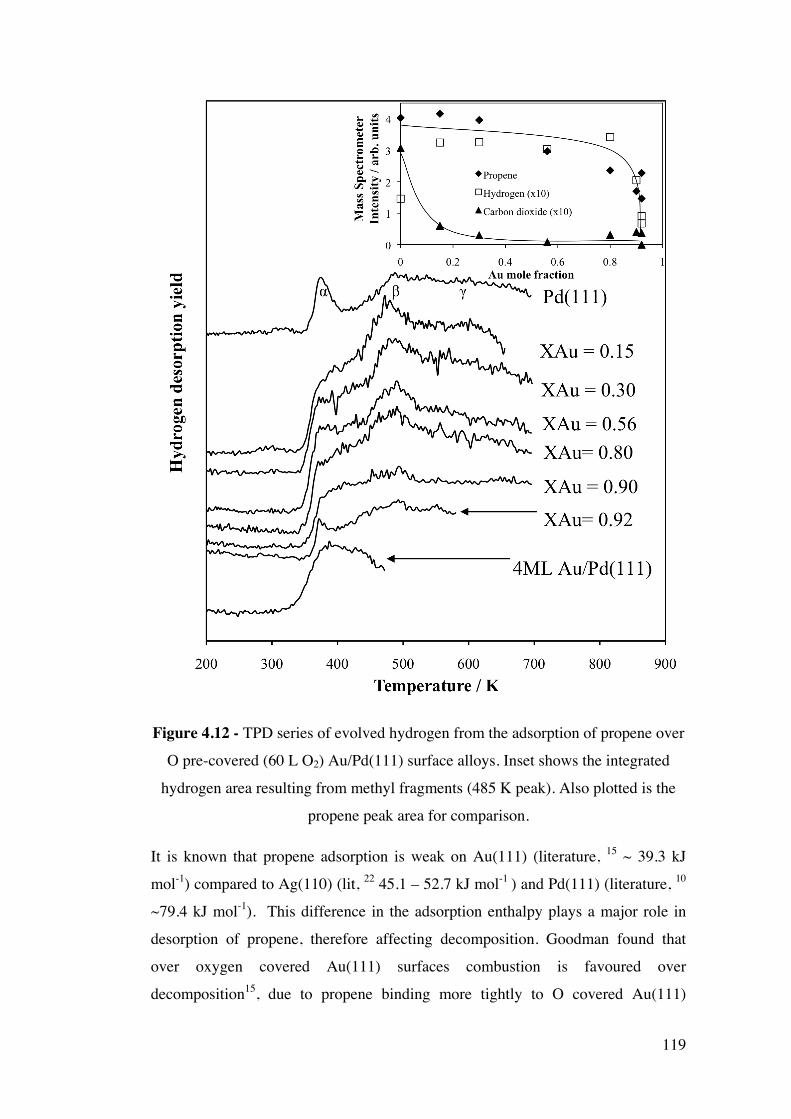
119
Figure 4.12 - TPD series of evolved hydrogen from the adsorption of propene over
O pre-covered (60 L O2) Au/Pd(111) surface alloys. Inset shows the integrated
hydrogen area resulting from methyl fragments (485 K peak). Also plotted is the
propene peak area for comparison.
It is known that propene adsorption is weak on Au(111) (literature, 15 ~ 39.3 kJ
mol-1) compared to Ag(110) (lit, 22 45.1 – 52.7 kJ mol-1 ) and Pd(111) (literature, 10
~79.4 kJ mol-1). This difference in the adsorption enthalpy plays a major role in
desorption of propene, therefore affecting decomposition. Goodman found that
over oxygen covered Au(111) surfaces combustion is favoured over
decomposition15, due to propene binding more tightly to O covered Au(111)
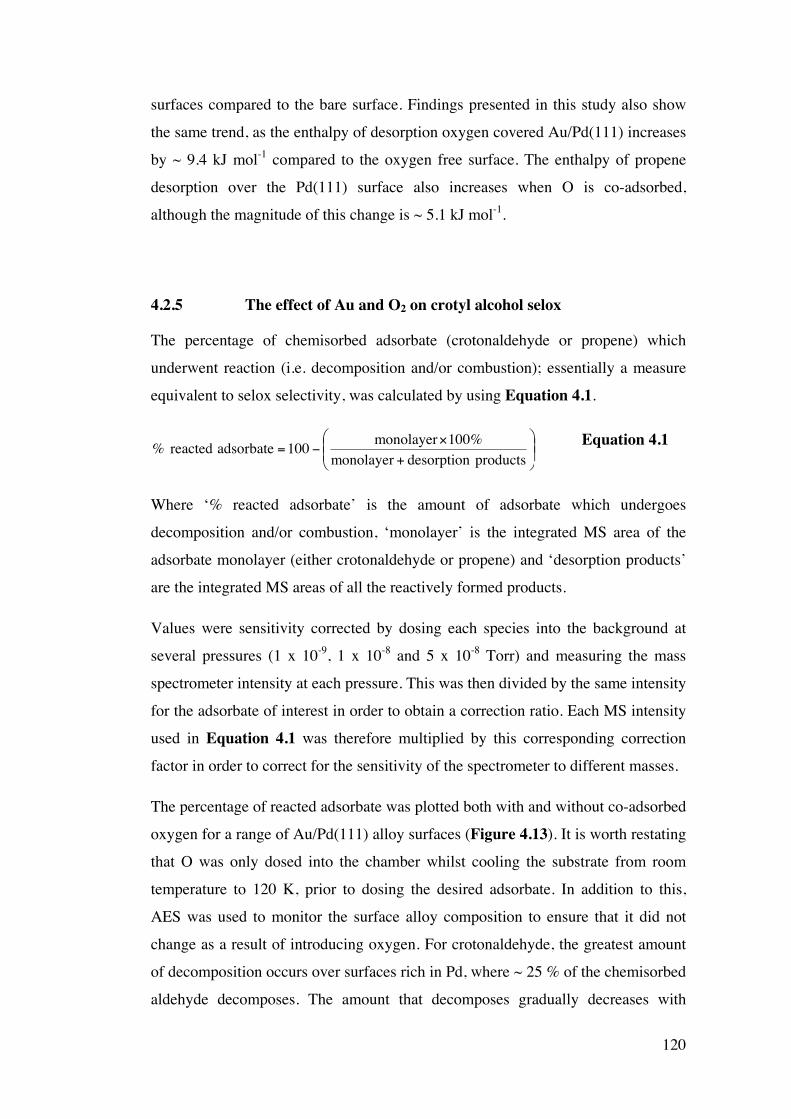
120
surfaces compared to the bare surface. Findings presented in this study also show
the same trend, as the enthalpy of desorption oxygen covered Au/Pd(111) increases
by ~ 9.4 kJ mol-1 compared to the oxygen free surface. The enthalpy of propene
desorption over the Pd(111) surface also increases when O is co-adsorbed,
although the magnitude of this change is ~ 5.1 kJ mol-1.
4.2.5 The effect of Au and O2 on crotyl alcohol selox
The percentage of chemisorbed adsorbate (crotonaldehyde or propene) which
underwent reaction (i.e. decomposition and/or combustion); essentially a measure
equivalent to selox selectivity, was calculated by using Equation 4.1.
+×
−=productsdesorptionmonolayer
%100monolayer100adsorbatereacted% Equation 4.1
Where ‘% reacted adsorbate’ is the amount of adsorbate which undergoes
decomposition and/or combustion, ‘monolayer’ is the integrated MS area of the
adsorbate monolayer (either crotonaldehyde or propene) and ‘desorption products’
are the integrated MS areas of all the reactively formed products.
Values were sensitivity corrected by dosing each species into the background at
several pressures (1 x 10⁻⁹, 1 x 10⁻⁸ and 5 x 10⁻⁸ Torr) and measuring the mass
spectrometer intensity at each pressure. This was then divided by the same intensity
for the adsorbate of interest in order to obtain a correction ratio. Each MS intensity
used in Equation 4.1 was therefore multiplied by this corresponding correction
factor in order to correct for the sensitivity of the spectrometer to different masses.
The percentage of reacted adsorbate was plotted both with and without co-adsorbed
oxygen for a range of Au/Pd(111) alloy surfaces (Figure 4.13). It is worth restating
that O was only dosed into the chamber whilst cooling the substrate from room
temperature to 120 K, prior to dosing the desired adsorbate. In addition to this,
AES was used to monitor the surface alloy composition to ensure that it did not
change as a result of introducing oxygen. For crotonaldehyde, the greatest amount
of decomposition occurs over surfaces rich in Pd, where ~ 25 % of the chemisorbed
aldehyde decomposes. The amount that decomposes gradually decreases with
121
increasing Au content, sharply dropping off to 0 % for a pure Au surface. The same
general trend is also observed for crotonaldehyde and co-adsorbed O, except the
amount of reacted crotonaldehyde decreases by around a third. This indicates that
Au with O further improves the selectivity for the selox of crotyl alcohol, as both
aid desorption of the aldehyde.
For propene on Au/Pd(111) alloys, as the surface Au concentration increases, the
level of dehydrogenation remains relatively constant, at around 15 - 12 %. A large
concentration of Au is needed to affect the dehydrogenation pathway (XAu ≥ 0.8).
In the case of propene and oxygen adsorption, pure Pd is by far the most active
surface, where ~ 30 % of the adsorbed propene undergoes reaction. A small
amount of Au has a dramtic effect upon the combustion pathway. For example,
with the addition of 0.15 Au, the amount of reaction on the surface decreases to ~
18 %. As the amount of surface Au increases, the level of reaction remains
relatively constant until high surface Au concentrations (XAu ≥ 0.92). Therefore, it
can be concluded that Au has a larger effect upon the combustion rather than the
dehydrogenation pathway.
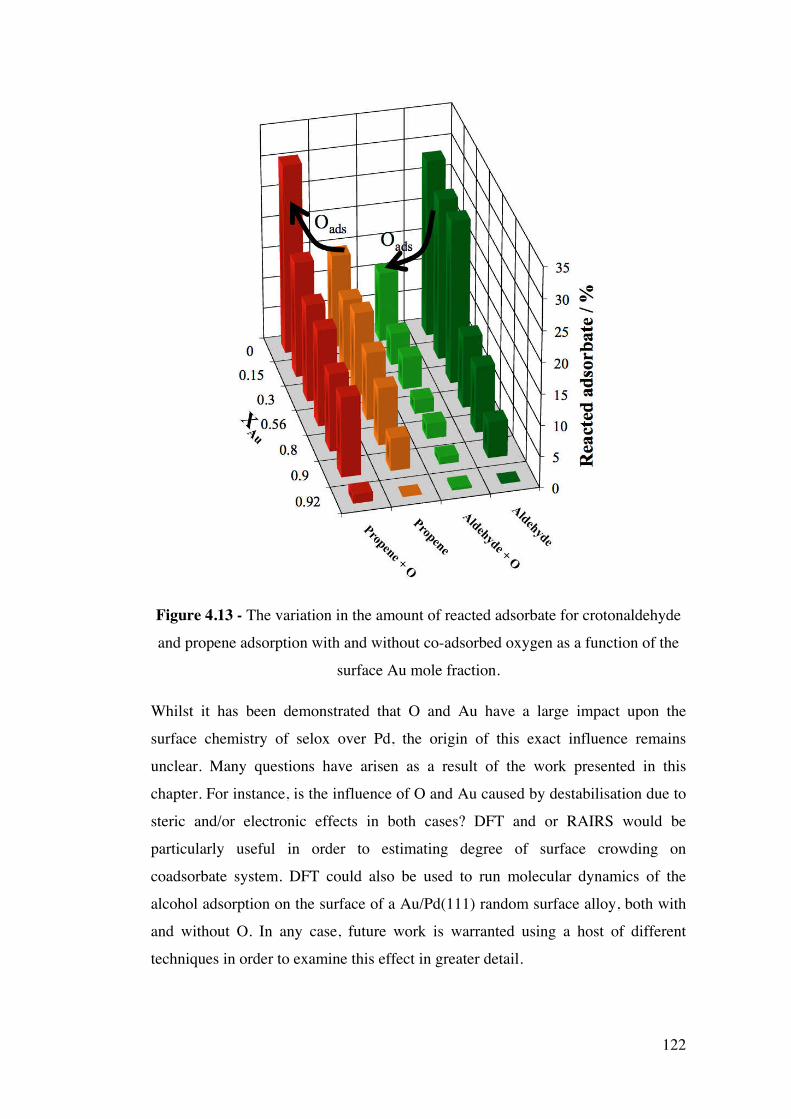
122
Figure 4.13 - The variation in the amount of reacted adsorbate for crotonaldehyde
and propene adsorption with and without co-adsorbed oxygen as a function of the
surface Au mole fraction.
Whilst it has been demonstrated that O and Au have a large impact upon the
surface chemistry of selox over Pd, the origin of this exact influence remains
unclear. Many questions have arisen as a result of the work presented in this
chapter. For instance, is the influence of O and Au caused by destabilisation due to
steric and/or electronic effects in both cases? DFT and or RAIRS would be
particularly useful in order to estimating degree of surface crowding on
coadsorbate system. DFT could also be used to run molecular dynamics of the
alcohol adsorption on the surface of a Au/Pd(111) random surface alloy, both with
and without O. In any case, future work is warranted using a host of different
techniques in order to examine this effect in greater detail.
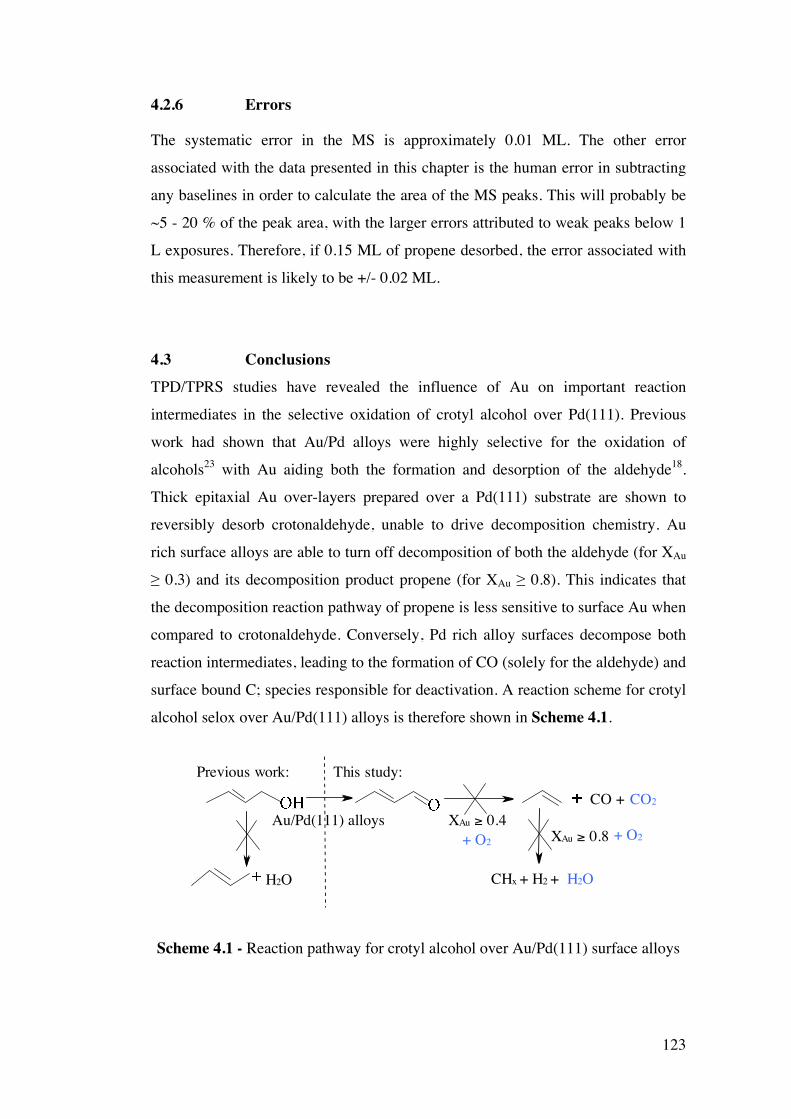
123
4.2.6 Errors
The systematic error in the MS is approximately 0.01 ML. The other error
associated with the data presented in this chapter is the human error in subtracting
any baselines in order to calculate the area of the MS peaks. This will probably be
~5 - 20 % of the peak area, with the larger errors attributed to weak peaks below 1
L exposures. Therefore, if 0.15 ML of propene desorbed, the error associated with
this measurement is likely to be +/- 0.02 ML.
4.3 Conclusions TPD/TPRS studies have revealed the influence of Au on important reaction
intermediates in the selective oxidation of crotyl alcohol over Pd(111). Previous
work had shown that Au/Pd alloys were highly selective for the oxidation of
alcohols23 with Au aiding both the formation and desorption of the aldehyde18.
Thick epitaxial Au over-layers prepared over a Pd(111) substrate are shown to
reversibly desorb crotonaldehyde, unable to drive decomposition chemistry. Au
rich surface alloys are able to turn off decomposition of both the aldehyde (for XAu
≥ 0.3) and its decomposition product propene (for XAu ≥ 0.8). This indicates that
the decomposition reaction pathway of propene is less sensitive to surface Au when
compared to crotonaldehyde. Conversely, Pd rich alloy surfaces decompose both
reaction intermediates, leading to the formation of CO (solely for the aldehyde) and
surface bound C; species responsible for deactivation. A reaction scheme for crotyl
alcohol selox over Au/Pd(111) alloys is therefore shown in Scheme 4.1.
+ O2
CO2
H2O
+ O2
This study:Previous work:
XAu ≥ 0.8
CO +Au/Pd(111) alloys XAu ≥ 0.4
H2O CHx + H2 +
+ O2
CO2
H2O
+ O2
This study:Previous work:
XAu ≥ 0.8
CO +Au/Pd(111) alloys XAu ≥ 0.4
H2O CHx + H2 +
Scheme 4.1 - Reaction pathway for crotyl alcohol over Au/Pd(111) surface alloys
124
In the case of the aldehyde, pre-adsorption of oxygen on Au surfaces hinders the
decomposition chemistry further, with a small amount of decomposition also
occurring. Propene binds more strongly to O pre-covered surfaces, which results in
a small increase in the amount of propene that reacts. As a result, a larger
proportion of the propene undergoes combustion when compared to the aldehyde
over the same surface alloys.
4.4 References
1. A. Lee, Z. Chang, P. Ellis, S. Hackett and K. Wilson, J. Phys. Chem. C, 2007, 111, 18844-18847.
2. S. T. Marshall, C. M. Horiuchi, W. Zhang and J. W. Medlin, The Journal of Physical Chemistry C, 2008, 112, 20406-20412.
3. P. Redhead, Vacuum, 1962, 12, 203-211. 4. J. Chickos and J. William E. Acree, J. Phys. Chem. Ref. Data, 2003, 32, 519-
878. 5. J. Haubrich, D. Loffreda, F. Delbecq, P. Sautet, Y. Jugnet, A. Krupski, C.
Becker and K. Wandelt, Journal of Physical Chemistry C, 2008, 112, 3701-3718.
6. T. R. Bryden and S. J. Garrett, The Journal of Physical Chemistry B, 1999, 103, 10481-10488.
7. B. A. Sexton, A. E. Hughes and N. R. Avery, Surface Science, 1985, 155, 366-386.
8. C. Houtman and M. A. Barteau, Surface Science, 1991, 248, 57-76. 9. H. B. Zhao, J. Kim and B. E. Koel, Surface Science, 2003, 538, 147-159. 10. N. A. Thornburg, I. M. Abdelrehim and D. P. Land, The Journal of
Physical Chemistry B, 1999, 103, 8894-8898. 11. D. Stacchiola, L. Burkholder and W. T. Tysoe, Surface Science, 2003, 542,
129-141. 12. F. Zaera and D. Chrysostomou, Surface Science, 2000, 457, 71-88. 13. J. Kubota, S. Ichihara, J. N. Kondo, K. Domen and C. Hirose, Langmuir,
1996, 12, 1926-1927. 14. M. Bowker, C. Morgan, N. Perkins, R. Holroyd, E. Fourre, F. Grillo and A.
MacDowall, The Journal of Physical Chemistry B, 2004, 109, 2377-2386. 15. K. A. Davis and D. W. Goodman, J. Phys. Chem. B., 2000, 104, 8557-8562. 16. Z. Li, F. Gao, Y. Wang, F. Calaza, L. Burkholder and W. T. Tysoe, Surf.
Sci., 2007, 601, 1898–1908.
125
17. F. Calaza, F. Gao, Z. Li and W. T. Tysoe, Surface Science, 2007, 601, 714-722.
18. A. F. Lee, S. F. J. Hackett, G. J. Hutchings, S. Lizzit, J. Naughton and K. Wilson, Catalysis Today, 2009, 145, 251-257.
19. L. Hilaire, P. Légaré, Y. Holl and G. Maire, Surf. Sci., 1980, 103, 125-140. 20. G. Maire, L. Hilaire, P. Legare, F. G. Gault and A. O'Cinneide, Journal of
Catalysis, 1976, 44, 293-299. 21. T. D. Harris and R. J. Madix, Journal of Catalysis, 1998, 178, 520-532. 22. J. Pawela-Crew and R. J. Madix, The Journal of Chemical Physics, 1996,
104, 1699-1708. 23. M. D. Hughes, Y. J. Xu, P. Jenkins, P. McMorn, P. Landon, D. I. Enache,
A. F. Carley, G. A. Attard, G. J. Hutchings, F. King, E. H. Stitt, P. Johnston, K. Griffin and C. J. Kiely, Nature, 2005, 437, 1132-1135.
126
Chapter 5 Metastable De-excitation Spectroscopy of crotyl alcohol over Pd(111)
5.1 Introduction As has been demonstrated in chapters 1, 3 and 4, our understanding of the selox of
crotyl alcohol over Pd(111) and the associated deactivation1 has been greatly
enhanced through the utilisation of temperature programmed X-ray photoelectron
spectroscopy (TP XPS) combined with near edge X-ray absorption fine structure
(NEXAFS)2 and Temperature Programmed Reaction Spectroscopy. The XPS has
shown that product decomposition and associated self-poisoning prevails over
model Pd(111), while electron deficient (formally PdII) centres confer activity in
allylic alcohol selox. At low temperature, the NEXAFS indicates that the C=C
bonds parallel to the Pd(111) surface, much in the same way as allyl alcohol (2-
propen-1-ol) on Ag(110)3.
A further technique that is well suited to the study of molecular adsorbates is
metastable de-excitation spectroscopy (MDS), which utilizes the energy associated
with the metastable states of rare-gas atoms (usually the 23S level of He) to induce
electron emission from a surface or molecule14. For adsorbate systems, the de-
excitation of He 23S atoms generally involves a pseudo one-electron transition in a
process that is similar to photoemission but which has the advantage that, unlike in
ultraviolet photoemission spectroscopy (UPS), there is no penetration of the probe
beam into the bulk.
This renders MDS extremely surface sensitive and enables the adsorbate local
density of states (LDOS) at energies close to the Fermi level, EF, to be studied in
isolation. Occupied electronic states appear in this energy region as a result of
chemisorption bond formation although they are largely masked in UPS due to
dominant emission from metallic d-band states. As such, MDS has been widely
employed in a number of previous studies investigating the electronic properties of
127
simple chemical adsorbates on a variety of metal surfaces4. In this chapter, MDS
and supporting density functional theory (DFT) calculations are utilised to identify
the states involved in bonding crotyl alcohol to the Pd surface. By using this
approach, it is possible to evaluate and understand the adsorption mode and
ultimately the molecular orientation of the alcohol on the Pd surface.
5.2 Results and Discussion
5.2.1 MDS of crotyl alcohol on Pd(111) Experiments were performed in a stainless-steel UHV system with a base pressure
of ~1×10⁻¹⁰ Torr. The system comprises a preparation chamber; equipped with low
energy electron diffraction (LEED), an analysis chamber; equipped with Auger
electron spectroscopy (AES), and a beam-line for metastable He 23S generation.
Full details of the experimental setup are described elsewhere5 but will be briefly
outlined below. The Pd(111) single crystal sample could be heated using a
pyrolytic boron nitride (PBN) heater to 1000 K and cooled to ~150 K using a gas
baffle cooled by liquid nitrogen. Preparation of a clean substrate was carried out in
the preparation chamber and utilized cycles of Ar+ sputtering followed by
annealing to 1000 K until LEED showed a clean well-ordered surface. Oxygen (Air
Liquide, 99.998%) was then dosed as received into the chamber background to
obtain a pressure of 1×10⁻⁷ Torr, while the sample was heated to 800 K to remove
residual carbon. The sample was also cooled in oxygen so as to saturate the
surface, before flashing to ~930 K to desorb oxygen and any remaining
contaminants. This procedure was repeated several times, until AES revealed no
surface impurities. AES is insensitive to the presence of surface carbon on a Pd
substrate below ~0.25 monolayer; however, the effectiveness of this cleaning
procedure has previously been confirmed using temperature-programmed
desorption (TPD) studies where the lack of CO or CO2 desorption in the acquired
spectra can be taken as evidence for a carbon-free surface.6
Once prepared, the sample was immediately transferred into an analysis chamber to
record MDS spectra. Crotyl alcohol (Aldrich, 96%) was purified by repeated
freeze-pump-thaw cycles prior to background dosing (purity checked by mass
spectrometry (MS)). Quoted exposures are given in langmuirs (1 langmuir = 1×10⁻⁶
Torr s-1) and are uncorrected for ion gauge sensitivity. Generally, a clean Pd(111)
128
surface was exposed to 3 langmuirs of crotyl alcohol with the substrate at 150 K.
This dose is known to be large enough to produce a 0.15 monolayer saturation
coverage of chemisorbed molecules for this system.2 Additional physisorbed
molecules may also be present on top of this saturation layer depending on the
substrate temperature.
The metastable He 23S beam was generated using a liquid nitrogen cooled, copper
cathode, dc discharge source, the output of which was manipulated using
techniques of laser cooling to provide an ultrapure and intense He 23S atom beam
at the sample.5 Electrons ejected as a result of metastable atom de-excitation were
collected in the normal direction using a hemi-spherical energy analyser (Omicron
EA125). A He I discharge source (Focus GmbH) was used in UPS experiments
with normally emitted electrons detected by the same analyzer as for MDS. For
both spectroscopies, the angle of incidence of the probe beam was 45°.
The de-excitation of metastable He atoms at clean, transition metal surfaces is well-
characterized and proceeds via the two-stage mechanism of resonance ionization
(RI) followed by Auger neutralization (AN)4. When approaching a clean Pd(111)
surface to within a distance of around 5 Å, overlap of the occupied 2s orbital of the
He atom with an empty surface state above EF allows a tunnelling transition to take
place (RI). The resulting He+ ion continues to approach the surface until a further
transition from the surface valence band to the empty ground state He 1s level
occurs to neutralize the atom.
The energy liberated in this process results in the emission of a second electron
from the valence band in an Auger-type process (AN). As the kinetic energy of this
electron is determined by the binding energies of both initial valence band states
involved in the de-excitation, the resulting energy spectrum for RI + AN is
essentially a self-convoluted map of the surface DOS (SDOS) modified by the de-
excitation transition probability (transition matrix elements), leading to broad and
generally featureless spectra, as seen in Figure 5.1 (a) for the clean Pd(111)
surface.
Strong emission is observed in the region several eV below the kinetic energy
maximum, Ek,max, which occurs when both electrons involved in the de-excitation
process originate at EF. Occupied Pd(111) surface states with a binding energy of
129
0-2 eV have been shown to have a significant local density at the surface layer and
at distances of up to 3 Å away from the surface where AN transition rates are
highest7, and these account for the appearance of the spectrum at high kinetic
energies. At lower energies, the spectrum is dominated by true secondary electrons.
In contrast to the dominant role the SDOS plays in the AN process, penetration of
UV photons into the bulk-like second atomic layer and beyond leads to features in
the corresponding UPS spectrum arising from the bulk DOS (BDOS), specifically
d-band electronic states (Figure 5.1 (c)). This assignment is confirmed by DFT
calculations by ourselves (Figure 5.1 (b)) and others8 which show strong d band
peaks at energies of several eV below EF, accounting for the peaks at ~1.4 eV and
~2.4 eV. Figure 5.1 (c) also shows UPS spectra for a clean surface exposed to a
saturation coverage of crotyl alcohol with the substrate at 150 K and 245 K. The
metallic d states that feature so prominently in the clean spectrum are still dominant
although somewhat attenuated by the adsorbate layer.
A previous UPS study utilizing gas-phase crotyl alcohol as part of a composite
molecular determination of the spectral features of opiate narcotics revealed many
distinct molecular orbitals (MOs)9, as did a further UPS study of allyl alcohol10.
However, for adsorption at both 150 and 245 K, direct emission from these orbitals
is lacking for a saturation coverage of crotyl alcohol on Pd(111), which is known to
be 0.15 ML2. The d states dominate the UPS spectra, due to the penetration of UV
photons below the adsorbate layer. This highlights one of the benefits of using the
more surface sensitive technique of MDS to study the surface electronic properties
of adsorbed molecules.
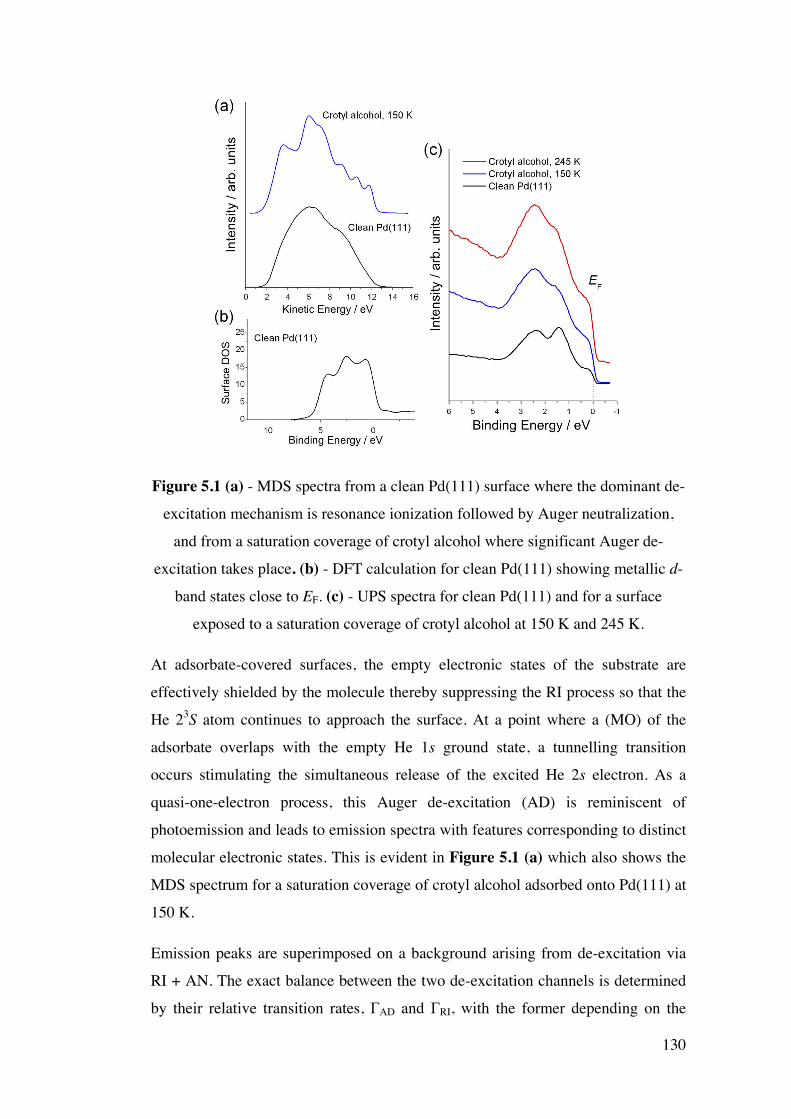
130
Figure 5.1 (a) - MDS spectra from a clean Pd(111) surface where the dominant de-
excitation mechanism is resonance ionization followed by Auger neutralization,
and from a saturation coverage of crotyl alcohol where significant Auger de-
excitation takes place. (b) - DFT calculation for clean Pd(111) showing metallic d-
band states close to EF. (c) - UPS spectra for clean Pd(111) and for a surface
exposed to a saturation coverage of crotyl alcohol at 150 K and 245 K.
At adsorbate-covered surfaces, the empty electronic states of the substrate are
effectively shielded by the molecule thereby suppressing the RI process so that the
He 23S atom continues to approach the surface. At a point where a (MO) of the
adsorbate overlaps with the empty He 1s ground state, a tunnelling transition
occurs stimulating the simultaneous release of the excited He 2s electron. As a
quasi-one-electron process, this Auger de-excitation (AD) is reminiscent of
photoemission and leads to emission spectra with features corresponding to distinct
molecular electronic states. This is evident in Figure 5.1 (a) which also shows the
MDS spectrum for a saturation coverage of crotyl alcohol adsorbed onto Pd(111) at
150 K.
Emission peaks are superimposed on a background arising from de-excitation via
RI + AN. The exact balance between the two de-excitation channels is determined
by their relative transition rates, ΓAD and ΓRI, with the former depending on the
131
coverage, adsorption site and geometry of the molecule. The AD spectrum reflects
the DOS of the adsorbed species weighted by the overlap with the He 1s
wavefunction meaning that electron emission from the outermost MOs of the
adsorbed molecules is strongly favoured. Therefore the features present in the
spectrum represent the local DOS of the adsorbate in the energy range close to EF
which may be strongly modified by interaction with the surface. For ΓAD to be
comparable to ΓRI, the outermost electronic states of the adsorbed crotyl alcohol
must extend beyond ~3 Å from the substrate surface to efficiently suppress RI. This
is approximately equal to the van der Waals radius of sp2-hybridized carbon and so
appreciable AD can be expected at a saturation coverage of crotyl alcohol even for
a coplanar adsorption geometry.
5.2.2 Density Functional Theory DFT calculations were also conducted (by Dr. Chris Eames), in order to aid
interpretation of the MDS results. All theoretical calculations in this work used the
CASTEP11 ab initio DFT code. The Perdew-Burke-Ernzerhof12 generalized
gradient approximation was used to represent exchange and correlation effects. We
have used ultrasoft pseudopotentials with a cut-off energy of 350 eV and a
Monkhorst-Pack13 reciprocal space sampling grid with a density of 0.04 Å-1.
Convergence testing showed that the calculated energies and spectra were not
affected by any further increase in the cut-off energy or the sampling grid density.
The supercell comprised three layers of bulk Pd with a vacuum gap of 20 Å. This
supercell was selected in order to minimise the computational cost of the DFT
calculations. However, this leads to many limitations, mainly due to the lack of
interaction with a ‘bulk’, which need to be considered when interpreting the results.
Despite these limitations, additional Pd layers were shown to have no effect on the
DOS for the bare Pd surface. Molecules were adsorbed on one face of the slabs and
to minimize interactions between vertical periodic images we used a large vacuum
gap, which meant that adjacent surfaces were over 30 Å apart. The molecules were
arranged in a 3×3 grid, which resulted in a lateral spacing of around 11 Å. The 0.15
ML saturation coverage for crotyl alcohol on Pd(111) has a 7×7 periodicity,
although computational resources prevent the use of such a large supercell. The
132
consequent small lateral interactions in the simulated energies and spectra are
another source of approximation error to be considered when comparing
experiment and theory.
The molecules were initially positioned a few Å above the surface in various
specific orientations (as shown in Figure 5.3), and then relaxed to determine the
optimum bonding geometry for each case. The optimisation convergence tolerance
for the forces was 0.01 (eV Å-1). The adsorption energies were calculated using the
formula:
E a = E CrOH/ Pd −E CrOH −E Pd Equation 5.1
Where ECrOH/Pd is the total energy after optimisation of the adsorbed molecule,
ECrOH is the relaxed energy of the isolated molecule and EPd is the energy of the
relaxed clean surface. DOS spectra for the optimised molecules were calculated
using Mulliken population analysis, which determines the contribution from each
energy band to a given atomic orbital.
Figure 5.2 shows the calculated Density of States (DOS) for the isolated molecules
of crotyl alcohol and crotonaldehyde along with the MDS spectrum for the alcohol-
adsorbed Pd(111) surface. The binding energy scale for the latter was calculated
using the high-kinetic-energy cut-off (~12.5 eV) for Auger de-excitation (see
Figure 5.6). Features D and E are most probably due to emission from both deeper
lying molecular orbitals of the adsorbed alcohol and the clean Pd(111) surface.
Low-energy secondary electrons account for feature F. Peaks attributed to
emission from the hydrocarbon skeleton of the alcohol, the O n non-bonding, and
C=C Ǹ states are labelled as C, B and A respectively. Interestingly, a previous
UPS comparison of allyl alcohol and acrolein10, determined that the two lowest
energy MOs of these molecules effectively switched positions, as indicated in
Figure 5.2 and discussed further below.
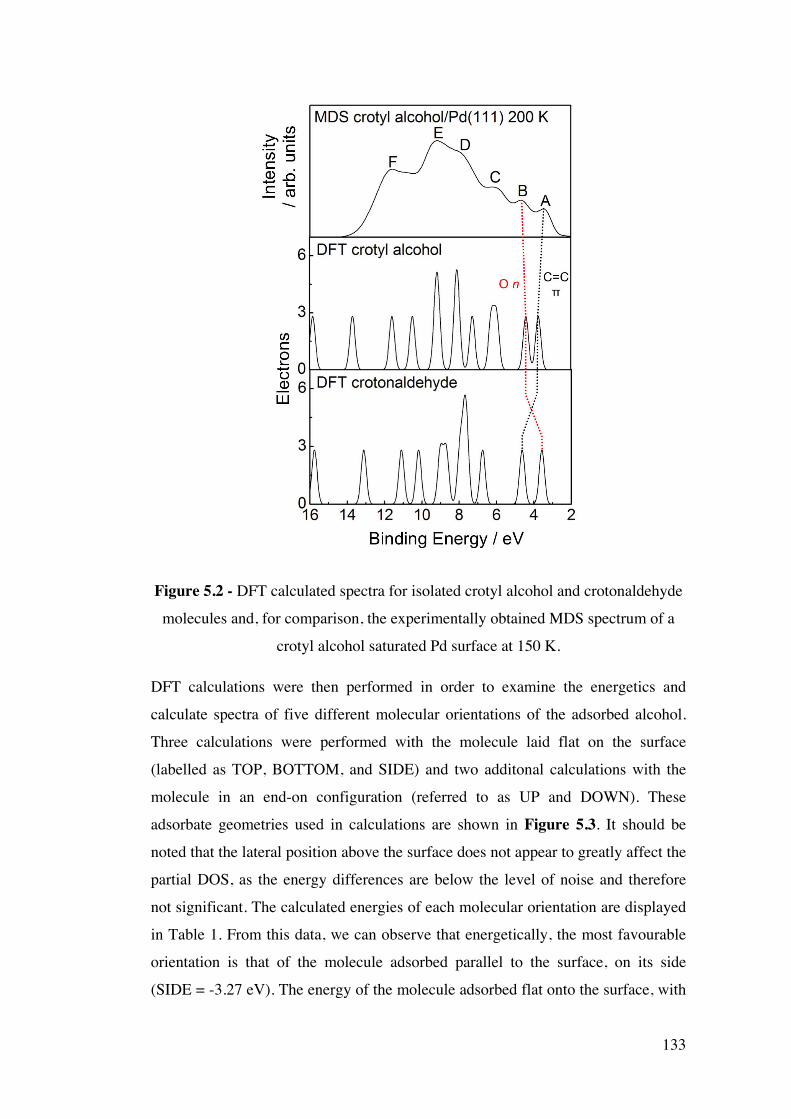
133
Figure 5.2 - DFT calculated spectra for isolated crotyl alcohol and crotonaldehyde
molecules and, for comparison, the experimentally obtained MDS spectrum of a
crotyl alcohol saturated Pd surface at 150 K.
DFT calculations were then performed in order to examine the energetics and
calculate spectra of five different molecular orientations of the adsorbed alcohol.
Three calculations were performed with the molecule laid flat on the surface
(labelled as TOP, BOTTOM, and SIDE) and two additonal calculations with the
molecule in an end-on configuration (referred to as UP and DOWN). These
adsorbate geometries used in calculations are shown in Figure 5.3. It should be
noted that the lateral position above the surface does not appear to greatly affect the
partial DOS, as the energy differences are below the level of noise and therefore
not significant. The calculated energies of each molecular orientation are displayed
in Table 1. From this data, we can observe that energetically, the most favourable
orientation is that of the molecule adsorbed parallel to the surface, on its side
(SIDE = -3.27 eV). The energy of the molecule adsorbed flat onto the surface, with
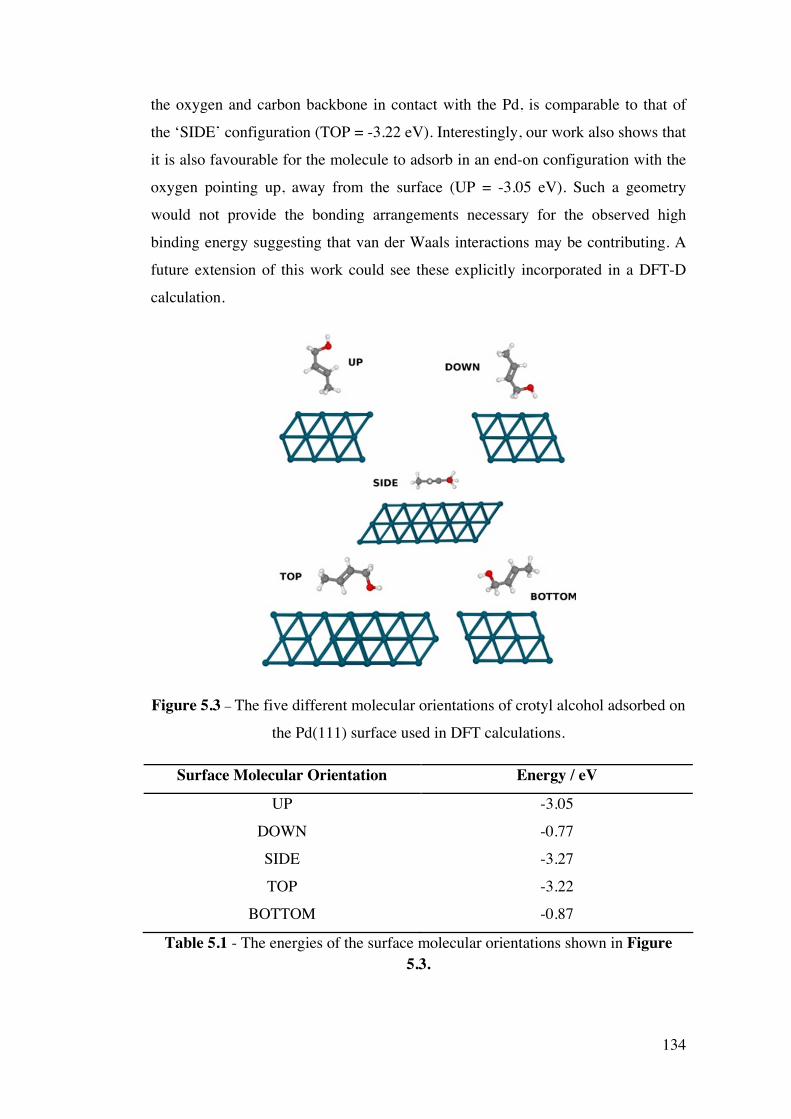
134
the oxygen and carbon backbone in contact with the Pd, is comparable to that of
the ‘SIDE’ configuration (TOP = -3.22 eV). Interestingly, our work also shows that
it is also favourable for the molecule to adsorb in an end-on configuration with the
oxygen pointing up, away from the surface (UP = -3.05 eV). Such a geometry
would not provide the bonding arrangements necessary for the observed high
binding energy suggesting that van der Waals interactions may be contributing. A
future extension of this work could see these explicitly incorporated in a DFT-D
calculation.
Figure 5.3 – The five different molecular orientations of crotyl alcohol adsorbed on
the Pd(111) surface used in DFT calculations.
Surface Molecular Orientation Energy / eV
UP -3.05
DOWN -0.77
SIDE -3.27
TOP -3.22
BOTTOM -0.87
Table 5.1 - The energies of the surface molecular orientations shown in Figure 5.3.
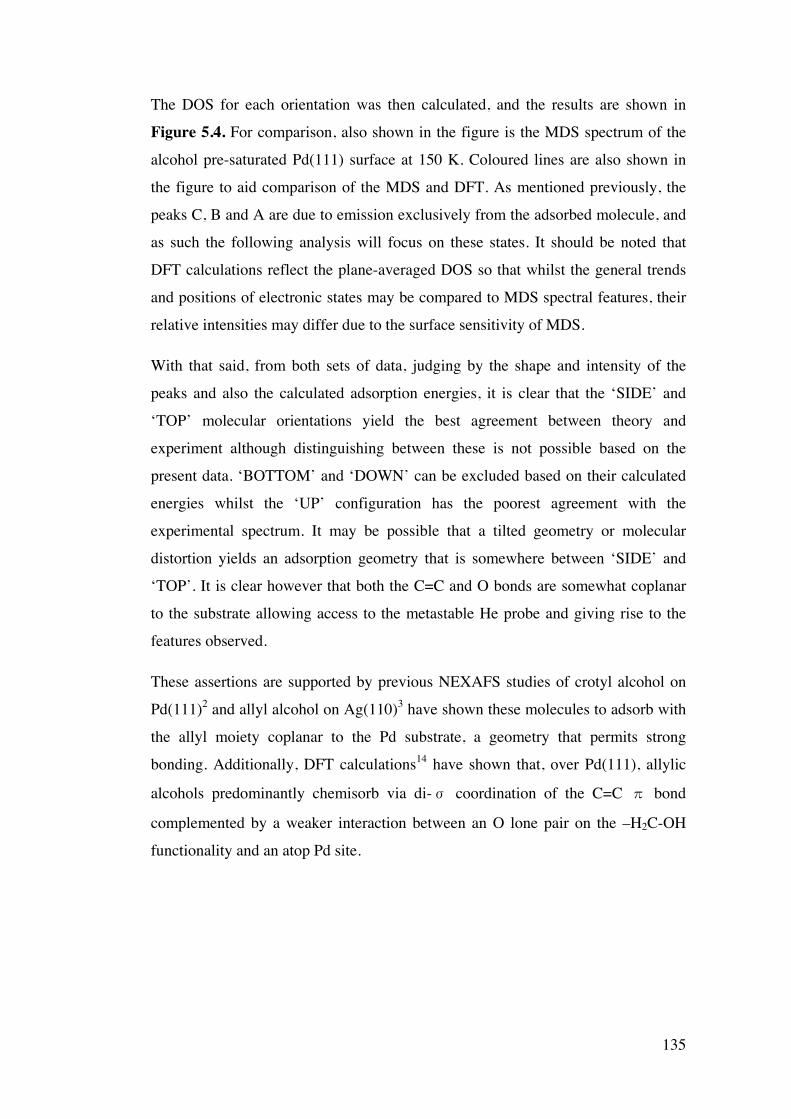
135
The DOS for each orientation was then calculated, and the results are shown in
Figure 5.4. For comparison, also shown in the figure is the MDS spectrum of the
alcohol pre-saturated Pd(111) surface at 150 K. Coloured lines are also shown in
the figure to aid comparison of the MDS and DFT. As mentioned previously, the
peaks C, B and A are due to emission exclusively from the adsorbed molecule, and
as such the following analysis will focus on these states. It should be noted that
DFT calculations reflect the plane-averaged DOS so that whilst the general trends
and positions of electronic states may be compared to MDS spectral features, their
relative intensities may differ due to the surface sensitivity of MDS.
With that said, from both sets of data, judging by the shape and intensity of the
peaks and also the calculated adsorption energies, it is clear that the ‘SIDE’ and
‘TOP’ molecular orientations yield the best agreement between theory and
experiment although distinguishing between these is not possible based on the
present data. ‘BOTTOM’ and ‘DOWN’ can be excluded based on their calculated
energies whilst the ‘UP’ configuration has the poorest agreement with the
experimental spectrum. It may be possible that a tilted geometry or molecular
distortion yields an adsorption geometry that is somewhere between ‘SIDE’ and
‘TOP’. It is clear however that both the C=C and O bonds are somewhat coplanar
to the substrate allowing access to the metastable He probe and giving rise to the
features observed.
These assertions are supported by previous NEXAFS studies of crotyl alcohol on
Pd(111)2 and allyl alcohol on Ag(110)3 have shown these molecules to adsorb with
the allyl moiety coplanar to the Pd substrate, a geometry that permits strong
bonding. Additionally, DFT calculations14 have shown that, over Pd(111), allylic
alcohols predominantly chemisorb via di-ǻ coordination of the C=C Ǹ bond
complemented by a weaker interaction between an O lone pair on the –H2C-OH
functionality and an atop Pd site.
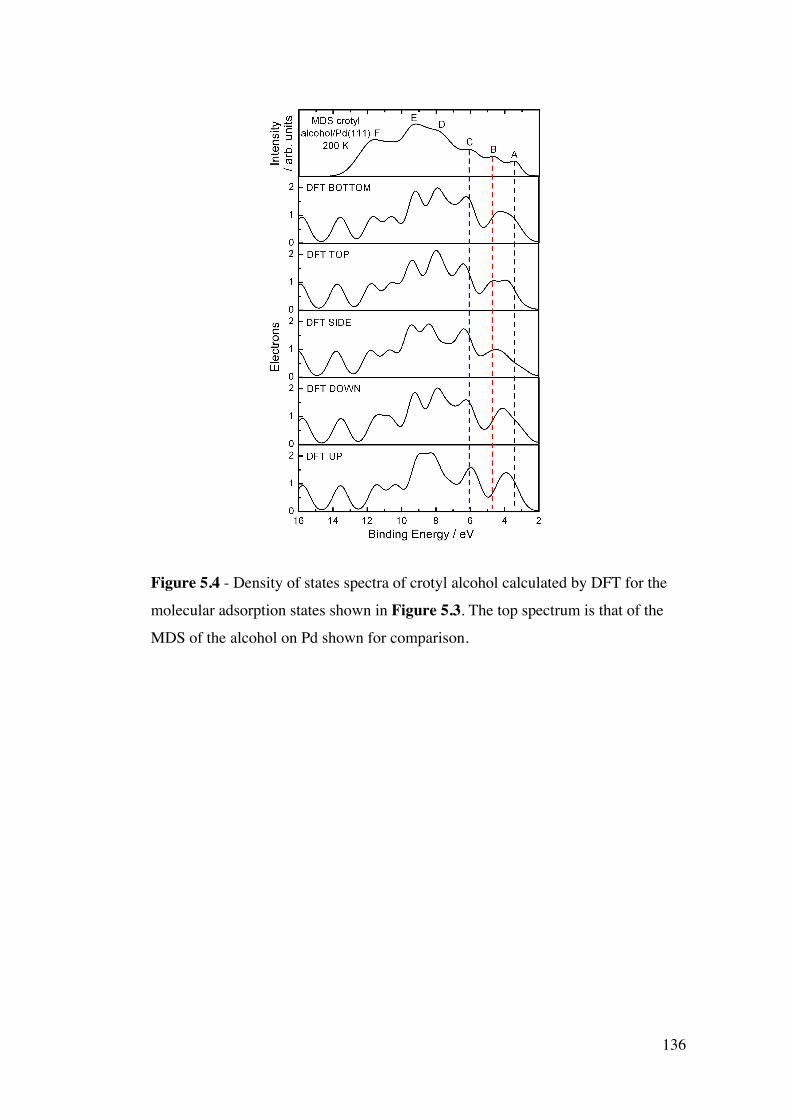
136
Figure 5.4 - Density of states spectra of crotyl alcohol calculated by DFT for the
molecular adsorption states shown in Figure 5.3. The top spectrum is that of the
MDS of the alcohol on Pd shown for comparison.
137
5.2.3 Temperature programmed MDS With the assignment of all states complete, we can now focus on the temperature
evolution of the spectra.
Figure 5.5 - Temperature evolution of MDS spectra for crotyl alcohol adsorption
on clean Pd(111) at 150 K. Temperature regimes where noticeable changes in the
spectra occur are highlighted with different colours and grouped together into three
distinct adsorption regimes. Note the non-linear temperature scale above room
temperature.
Figure 5.5 shows the evolution of MDS spectra taken after a clean Pd(111) surface
was exposed to a 3 L dose of crotyl alcohol at 150 K and then allowed to warm to
room temperature before being heated to 500 K. Detailed analysis of the spectra
reveal different temperature regimes, highlighted in the figure, with sometimes
only subtle variations in the spectral features. To emphasise these differences and
aid a discussion of the adsorption kinetics, representative spectra from each
temperature regime are shown in Figure 5.6. Temperature-programmed C 1s XPS
has shown the reaction of crotyl alcohol over Pd(111) to proceed via three distinct
steps with the in-tact adsorbed molecule first transforming to crotonaldehyde
beginning at 200 K before decarbonylating at room temperature12. At higher
annealing temperatures, carbonyl and CO surface species are removed from the
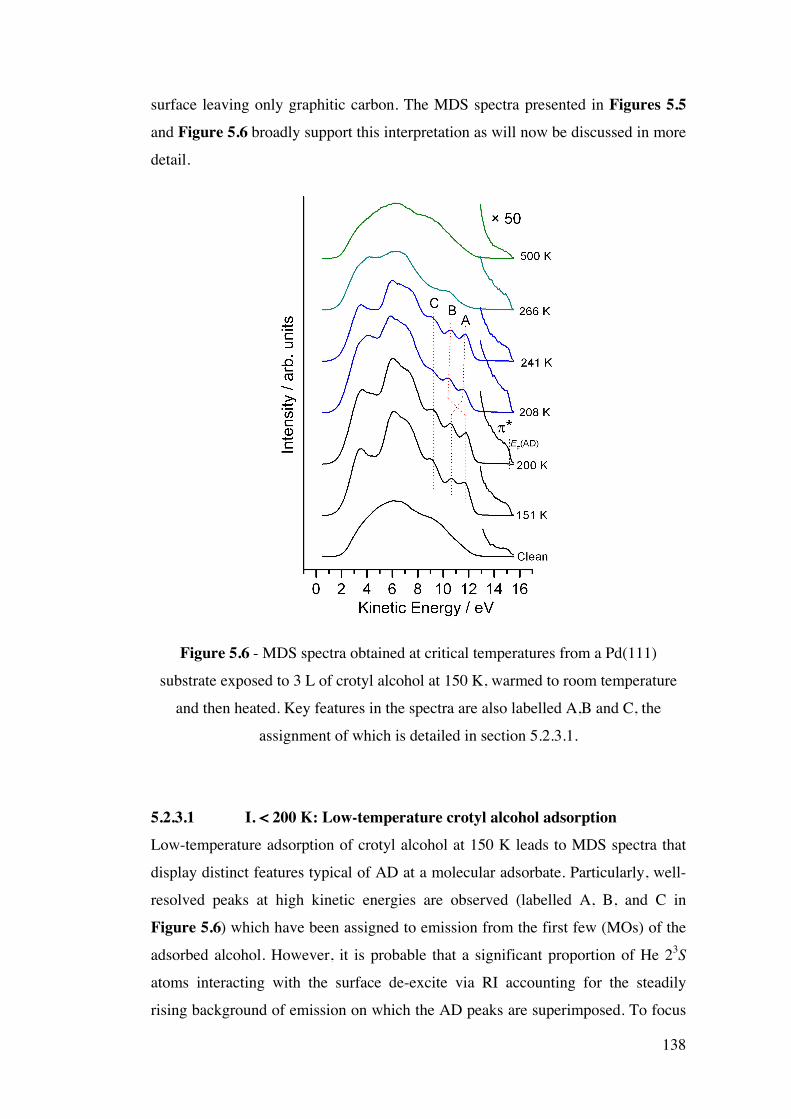
138
surface leaving only graphitic carbon. The MDS spectra presented in Figures 5.5
and Figure 5.6 broadly support this interpretation as will now be discussed in more
detail.
Figure 5.6 - MDS spectra obtained at critical temperatures from a Pd(111)
substrate exposed to 3 L of crotyl alcohol at 150 K, warmed to room temperature
and then heated. Key features in the spectra are also labelled A,B and C, the
assignment of which is detailed in section 5.2.3.1.
5.2.3.1 I. < 200 K: Low-temperature crotyl alcohol adsorption Low-temperature adsorption of crotyl alcohol at 150 K leads to MDS spectra that
display distinct features typical of AD at a molecular adsorbate. Particularly, well-
resolved peaks at high kinetic energies are observed (labelled A, B, and C in
Figure 5.6) which have been assigned to emission from the first few (MOs) of the
adsorbed alcohol. However, it is probable that a significant proportion of He 23S
atoms interacting with the surface de-excite via RI accounting for the steadily
rising background of emission on which the AD peaks are superimposed. To focus
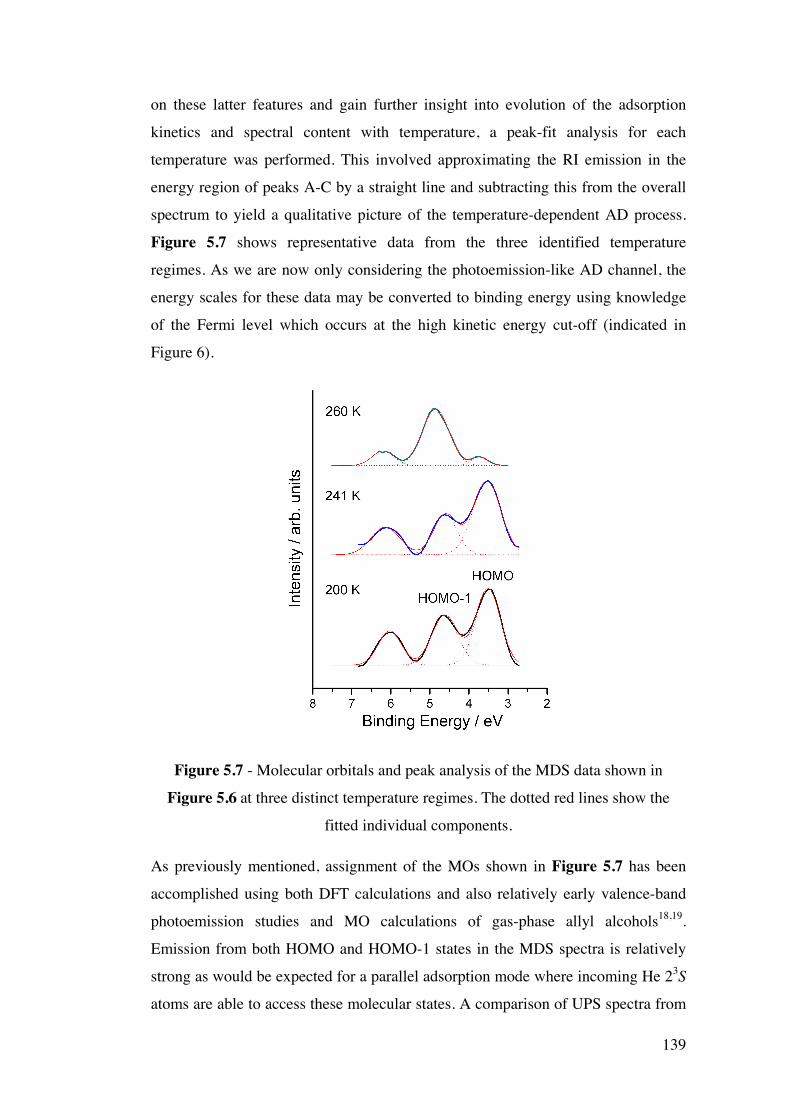
139
on these latter features and gain further insight into evolution of the adsorption
kinetics and spectral content with temperature, a peak-fit analysis for each
temperature was performed. This involved approximating the RI emission in the
energy region of peaks A-C by a straight line and subtracting this from the overall
spectrum to yield a qualitative picture of the temperature-dependent AD process.
Figure 5.7 shows representative data from the three identified temperature
regimes. As we are now only considering the photoemission-like AD channel, the
energy scales for these data may be converted to binding energy using knowledge
of the Fermi level which occurs at the high kinetic energy cut-off (indicated in
Figure 6).
Figure 5.7 - Molecular orbitals and peak analysis of the MDS data shown in
Figure 5.6 at three distinct temperature regimes. The dotted red lines show the
fitted individual components.
As previously mentioned, assignment of the MOs shown in Figure 5.7 has been
accomplished using both DFT calculations and also relatively early valence-band
photoemission studies and MO calculations of gas-phase allyl alcohols18,19.
Emission from both HOMO and HOMO-1 states in the MDS spectra is relatively
strong as would be expected for a parallel adsorption mode where incoming He 23S
atoms are able to access these molecular states. A comparison of UPS spectra from
140
allyl alcohol, acrolein, and propene10 also supports this overall assignment.
Additionally, in a separate UPS study of crotyl alcohol9, the binding energy
difference between the first three MOs agree to within 0.1 eV with those shown for
the 200 K spectrum in Figure 5.7.
As the temperature of the substrate increases within regime I from 150 K toward
200 K, subtle changes in the appearance of the emission peaks occur. At lower
temperatures, peaks A and B are closer together and therefore less well-defined
with peak C also appearing to shift in energy with increasing temperature. In order
to track these temperature-related changes in greater detail, the peak-fitting
procedure used to produce Figure 5.7 was applied to the data shown in Figure 5.5
to obtain the peak positions of the first three MOs. The resulting graph, displayed
in Figure 5.8, shows that, in heating from 150 K to around 190 K, all three peaks
undergo a small (<0.2 eV) shift in binding energy, before stabilizing up to 200 K.
To pre-saturate the Pd(111) surface with crotyl alcohol at low temperature, a
previous study showed that a minimum dose of 1.5 L is required2, with higher
exposures leading to a broadening of XPS features due to the formation of
molecular multilayers. For the 3 L exposure used here, multilayers are also
expected to form yielding AD spectral features that are closer in form to those of
gas-phase crotyl alcohol than the chemisorbed molecule. As the substrate warms,
the physisorbed multilayer molecules desorb revealing the chemisorbed saturation
coverage and allowing He 23S atoms to access π* states induced around EF as a
result of the molecule-substrate interaction. The lack of any major MO energy
difference between the multilayer and chemisorbed phases indicates that the
molecule is relatively undistorted upon adsorption.
To emphasize the induced π* states, the data in Figure 5.6 are also replotted with
the kinetic energy scale multiplied by a factor of 50. As the substrate temperature
increases and the multilayers desorb, emission at energies close to EF intensifies,
clearly demonstrating increased de-excitation at the chemisorption states. Electron
donation/backdonation exchange between metallic d states and molecular π and σ
states results in rehybridization of the adsorbate-metal system and the filling of
empty molecular antibonding π* states which redistribute above and below EF in
the LDOS. In the gas phase and when adsorbed in multilayers, crotyl alcohol
molecules have a band gap around EF and would not give rise to emission in this
141
region. Similar effects have been observed in MDS studies of many other adsorbate
systems, for example benzene adsorption on Fe(110)15. However, in the
corresponding UPS spectra for crotyl alcohol adsorption (Figure 1 (c)), these states
are masked by emission from the Pd substrate.
Emission at high kinetic energies is also observed in the magnified MDS spectrum
for the clean Pd(111) surface, which is unexpected as the de-excitation mechanism
here is RI + AN. This feature is indicative of slight CO contamination as this
molecule is known to strongly chemisorb to Pd(111) yielding bonding states that
arise, according to the Blyholder model, due to mixing between CO 2π* orbitals
with substrate d orbitals. That these states are visible, despite the surface being
clean to the standards of LEED, AES and UPS, highlights the extreme sensitivity
of MDS.
Changes in the relative intensity of the features assigned to emission from C=C and
O n states provide further insight into the adsorption dynamics of crotyl alcohol on
Pd(111). As the substrate temperature increases from 150 K, the peak related to the
latter states becomes increasingly prominent (see Figure 5.5) reflecting the
changing coverage of the substrate as molecules desorb upon warming. For the
adsorption of crotonaldehyde on Pt(111) at low coverage, the C=C and C=O bonds
are known to both align parallel to the surface2, although as the coverage increases,
the C=O bond undergoes a significant re-orientation by tilting strongly toward the
surface. A similar effect may be occurring here with the C-O bond forced closer to
the surface at high coverages and tilting further away from it as the coverage
reduces to saturation. This would explain the increasing intensity of emission
observed for O n states and also for induced π* states as the substrate temperature
rises to leave a saturation coverage of crotyl alcohol. At low coverages, the C=C
bond has a smaller separation from the substrate allowing a greater interaction and
thus yielding more intense π* emission. Whilst this picture of C-O bond behaviour
provides a qualitative description of the trends observed, it is not possible to state
the degree of tilt, if any exists. However, a significant tilt would yield a more
pronounced feature in the MDS spectrum when compared to emission from the
C=C bond. The presented data can therefore be taken as evidence for an adsorption
mode in which the C-O bond of the alcohol is aligned somewhat parallel to the
substrate, in addition to the C=C bond.
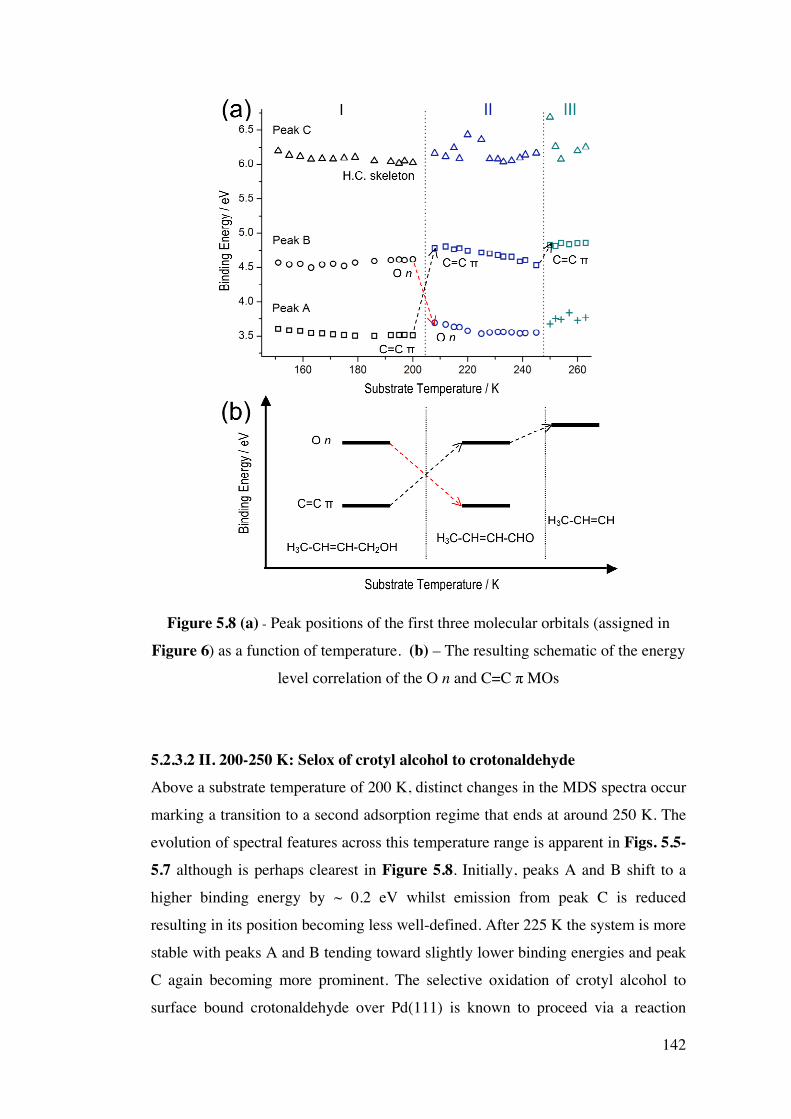
142
Figure 5.8 (a) - Peak positions of the first three molecular orbitals (assigned in
Figure 6) as a function of temperature. (b) – The resulting schematic of the energy
level correlation of the O n and C=C π MOs
5.2.3.2 II. 200-250 K: Selox of crotyl alcohol to crotonaldehyde Above a substrate temperature of 200 K, distinct changes in the MDS spectra occur
marking a transition to a second adsorption regime that ends at around 250 K. The
evolution of spectral features across this temperature range is apparent in Figs. 5.5-5.7 although is perhaps clearest in Figure 5.8. Initially, peaks A and B shift to a
higher binding energy by ~ 0.2 eV whilst emission from peak C is reduced
resulting in its position becoming less well-defined. After 225 K the system is more
stable with peaks A and B tending toward slightly lower binding energies and peak
C again becoming more prominent. The selective oxidation of crotyl alcohol to
surface bound crotonaldehyde over Pd(111) is known to proceed via a reaction
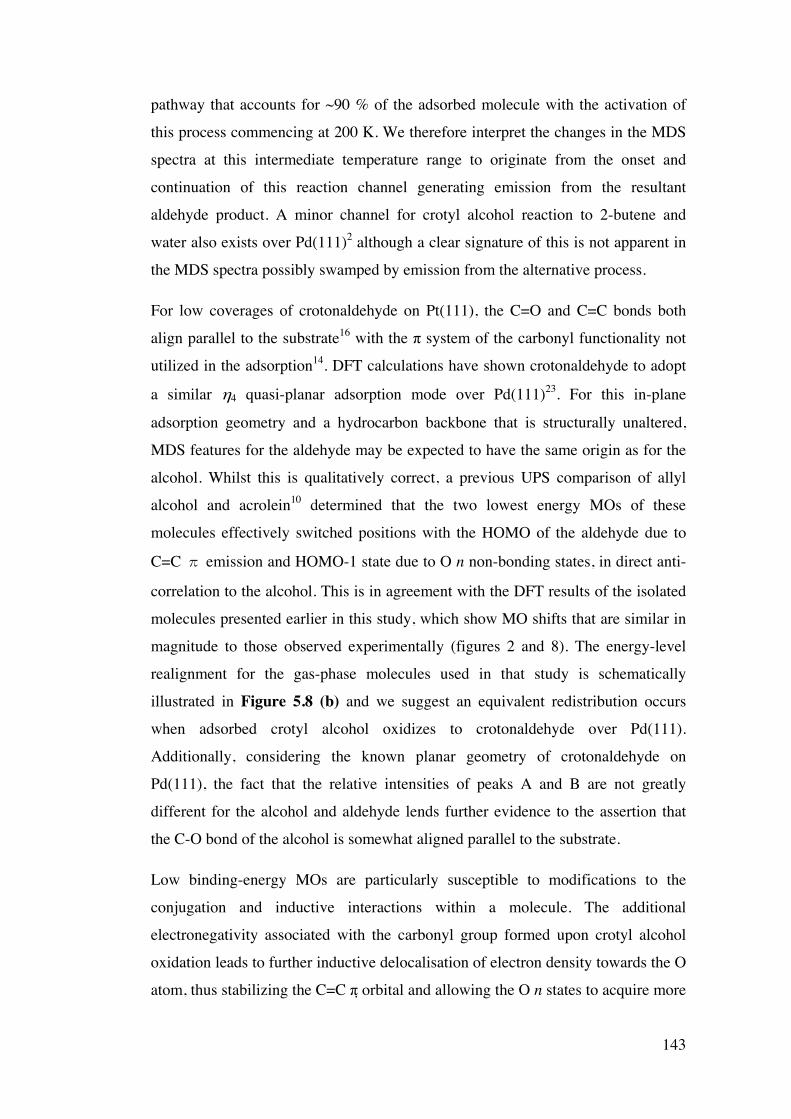
143
pathway that accounts for ~90 % of the adsorbed molecule with the activation of
this process commencing at 200 K. We therefore interpret the changes in the MDS
spectra at this intermediate temperature range to originate from the onset and
continuation of this reaction channel generating emission from the resultant
aldehyde product. A minor channel for crotyl alcohol reaction to 2-butene and
water also exists over Pd(111)2 although a clear signature of this is not apparent in
the MDS spectra possibly swamped by emission from the alternative process.
For low coverages of crotonaldehyde on Pt(111), the C=O and C=C bonds both
align parallel to the substrate16 with the π system of the carbonyl functionality not
utilized in the adsorption14. DFT calculations have shown crotonaldehyde to adopt
a similar η4 quasi-planar adsorption mode over Pd(111)23. For this in-plane
adsorption geometry and a hydrocarbon backbone that is structurally unaltered,
MDS features for the aldehyde may be expected to have the same origin as for the
alcohol. Whilst this is qualitatively correct, a previous UPS comparison of allyl
alcohol and acrolein10 determined that the two lowest energy MOs of these
molecules effectively switched positions with the HOMO of the aldehyde due to
C=C Ǹ emission and HOMO-1 state due to O n non-bonding states, in direct anti-
correlation to the alcohol. This is in agreement with the DFT results of the isolated
molecules presented earlier in this study, which show MO shifts that are similar in
magnitude to those observed experimentally (figures 2 and 8). The energy-level
realignment for the gas-phase molecules used in that study is schematically
illustrated in Figure 5.8 (b) and we suggest an equivalent redistribution occurs
when adsorbed crotyl alcohol oxidizes to crotonaldehyde over Pd(111).
Additionally, considering the known planar geometry of crotonaldehyde on
Pd(111), the fact that the relative intensities of peaks A and B are not greatly
different for the alcohol and aldehyde lends further evidence to the assertion that
the C-O bond of the alcohol is somewhat aligned parallel to the substrate.
Low binding-energy MOs are particularly susceptible to modifications to the
conjugation and inductive interactions within a molecule. The additional
electronegativity associated with the carbonyl group formed upon crotyl alcohol
oxidation leads to further inductive delocalisation of electron density towards the O
atom, thus stabilizing the C=C π orbital and allowing the O n states to acquire more
144
bonding character. Resonance effects may also contribute to the MO binding
energy determination although, due to the large energy separation of the C=C π and
O n states and the in-plane geometry of the aldehyde molecule, these are expected
to be small in comparison to inductive interactions15. With these intramolecular
changes in mind, for peaks A and B to occupy the same approximate energetic
positions for both the alcohol and aldehyde would certainly seem unexpected and a
reversal in the assignment of the first two MOs, albeit coincident in energy, is
altogether more likely.
5.2.3.3 III. > 250 K: Decarbonylation At ~250 K, a further transition in the adsorbate system occurs accompanied by
more distinct changes in the MDS spectra. Peaks A and C reduce dramatically in
intensity and eventually disappear at around room temperature whilst peak B shifts
to a higher binding energy where it remains approximately stable both in position
and intensity. C 1s XPS has shown that surface bound crotonaldehyde
decarbonylates to propene and CO at room temperature with the former either
desorbing or dehydrogenating to graphitic carbon as the temperature increases
above ~330 K2. With propylidyne being the dominant adsorbate species above 250
K, peak B in this temperature regime is assigned to the C=C π orbital (HOMO) of
such molecular fragments. A previous MDS study of CO/Pd(111) by Ertl and co-
workers17 show spectral features at 7.7 and 10.8 eV at 300 K. Unfortunately, these
specific features cannot be observed in this study, as this region is swamped by
emission from both low-energy secondary electrons and deeper lying molecular
orbitals (F, E and D). Unfortunately, further due to the high level of convolution of
these states, peak fitting and therefore further interpretation is extremely difficult.
Earlier studies of olefinic adsorption on Pd(111)14, 18 have shown that significant
hybridization of the C=C π bond with metallic d states results in substituent
functionalities (the methyl group in the case of propene) tilting away from the
surface. In the gas-phase, the C=C π orbital of propene is de-stabilized with respect
to acrolein19 due to a combination of hyperconjugation and inductive interaction
with the methyl group. This leads to the orbital energetically locating between the
two outer lying orbitals of acrolein, as illustrated in Figure 5.8 (b). However, when
145
adopting a di-σ-coordination mode in the formation of a chemisorption bond, the
C=C π orbital is stabilized and shifts to a higher binding energy explaining its
relative position when compared to the MOs of crotonaldehyde (see Figure 5 (a)).
A large shift in binding energy of the C=C π orbital upon chemisorption indicates a
significant electron donation/backdonation interaction between propene and the Pd
substrate, in similarity to ethylene adsorption on Pd(111)19. Emission from induced
π* states is also high providing further evidence for a strong chemisorption bond.
Heating above room temperature results in the loss of clear, identifiable features in
the MDS spectra suggesting that the RI de-excitation channel is now strongly
dominant. Propene almost completely desorbs by 500 K and only a small coverage
of graphitic carbon remains bound to the surface so that the spectra become
increasingly characteristic of clean Pd(111).
5.3 Conclusions A combination of MDS and DFT has been used to study the adsorption of crotyl
alcohol on Pd(111). At a substrate temperature of 150 K, three distinct molecular
features are observed, typical of such adsorbates, due to predominant Auger de-
excitation. Early valence band photoemission studies, MO calculations of gas-
phase allyl alcohols, and density functional theory (DFT) calculations have been
used to interpret the low temperature spectra. States centred around 6 eV (peak C)
can be attributed to the hydrocarbon backbone of the molecule. Further states
appearing at around 4.5 eV (peak B, HOMO-1) and 3.5 eV (peak A, HOMO) have
been assigned to the C=C Ǹ bond and O lone-pair 2p n bonds respectively.
DFT calculations for various adsorption geometries of the alcohol reveal that the
lowest energy state results when the molecule adopts an adsorption geometry that
is parallel to the surface. This assignment is also supported experimentally, as any
significant tilt in the position of the oxygen would lead to a more pronounced
feature in the MDS spectrum when compared to emission from the C=C bond. We
can therefore conclude from both the experimental and DFT results, that the C-O
bond of the alcohol is aligned somewhat parallel to the substrate, in addition to the
C=C bond. Judging by the shape and intensity of the peaks, DOS calculations for
146
such configurations are in excellent agreement with experimentally acquired MDS
spectra.
The chemical transformation of the alcohol to the corresponding aldehyde has been
investigated by temperature programmed MDS. Heating the pre-saturated substrate
causes dramatic changes to be observed in the spectra. In order to track such
changes, a peak fitting analysis was performed. Between approximately 200 K and
250 K, the reaction of crotyl alcohol to crotonaldehyde predominates, generating
emission from the aldehyde product resulting in a small shift in peaks to higher
binding energy. As a result of intramolecular changes, a reversal in the assignment
of the first two MOs occurs, albeit almost coincident in energy. This switchover is
supported by DFT calculations of the isolated alcohol and aldehyde, which show
shifts similar in magnitude to that observed experimentally.
At higher temperatures, peaks A and C dramatically decrease due to
decarbonylation of the aldehyde, meaning that propylidyne is the dominant
adsorbate species above 250 K. Peak B (~ 4.75 eV) therefore arises from C=C Ǹ
orbital (HOMO) of adsorbed propylidyne. Spectral features indicative of CO (7.7
and 10.8 eV)17 are not observed, due to dominant emission from secondary
electrons and lower energy orbitals from 7 - 14 eV. Heating the sample further
results in the loss of identifiable features in the spectra, indicative of dominant
resonance ionisation de-excitation. Propene completely desorbs by ~500 K, with
only a small amount of graphitic carbon remaining on the surface, meaning that
spectra become increasingly characteristic of Pd(111).
5.4 References 1. A. F. Lee and K. Wilson, Green Chem., 2004, 6, 37 – 42.
2. A. F. Lee, Z. Chang, P. Ellis, S. F. J. Hackett and K. Wilson, J. Phys. Chem.
C, 2007, 111, 18844-18847.
3. J. L. Solomon, R. J. Madix and J. Stohr, The Journal of Chemical Physics,
1988, 89, 5316-5322.
4. Y. Harada, S. Masuda and H. Ozaki, Chem. Rev., 1997, 97, 1897-1952.
147
5. A. Pratt, A. Roskoss, H. Menard and M. Jacka, Review of Scientific
Instruments, 2005, 76, 053102-053106.
6. J. Naughton, A. Lee, S. Thompson, C. P. Vinod and K. Wilson, Phys.
Chem. Chem. Phys., 2010, 12, 2670-2678.
7. W. Sesselmann, B. Woratschek, J. Küppers, G. Ertl and H. Haberland,
Physical Review B, 1987, 35, 1547.
8. S. G. Louie, Physical Review Letters, 1979, 42, 476.
9. L. Klasinc, B. Ruscic, A. Sabljic and N. Trinajstic, Journal of the American
Chemical Society, 1979, 101, 7477-7482.
10. A. Katrib and J. W. Rabalais, The Journal of Physical Chemistry, 1973, 77,
2358-2363.
11. S. J. Clark, M. D. Segall, C. J. Pickard, P. J. Hasnip, M. I. J. Probert, K.
Refson and M. C. Payne, Zeitschrift für Kristallographie, 2005, 220, 567-
570.
12. J. P. Perdew, K. Burke and M. Ernzerhof, Physical Review Letters, 1996,
77, 3865.
13. H. J. Monkhorst and J. D. Pack, Physical Review B, 1976, 13, 5188.
14. F. Delbecq and P. Sautet, Journal of Catalysis, 1995, 152, 217-236.
15. X. Sun, Y. Yamauchi, M. Kurahashi, T. Suzuki, Z. P. Wang and S. Entani,
The Journal of Physical Chemistry C, 2007, 111, 15289-15298.
16. A. J. Urquhart, F. J. Williams, O. P. H. Vaughan, R. L. Cropley and R. M.
Lambert, Chem Comm, 2005, 1977–1979.
17. W. Sesselmann, B. Woratschek, G. Ertl, J. Küppers and H. Haberland,
Surface Science, 1984, 146, 17-42.
18. J. E. Demuth, Chemical Physics Letters, 1977, 45, 12-17.
19. L. P. Wang, W. T. Tysoe, R. M. Ormerod, R. M. Lambert, H. Hoffmann
and F. Zaera, The Journal of Physical Chemistry, 1990, 94, 4236-4239.
148
Chapter 6 Magnetorefractive Effect in Fe3O4 thin films
6.1 Introduction Jacquet and Valet in 1995 showed theoretically that the change in the optical
conductivity of magnetic multilayers in an applied magnetic field is also associated
with a significant change in the refractive index of the material1. This effect was
termed the magnetorefractive effect (MRE) and was also demonstrated
experimentally in [Ni80Fe20/Cu/Co/Cu] magnetic multilayers, which showed
reasonable agreement with the theoretical calculations1.
The development of techniques to probe useful properties of materials is vital in order
to refine and improve such characteristics. The work of Jacquet and Valet therefore
represented a new, valuable method to both model and study magneto-transport
within metallic magnetic materials and has been applied to both granular and layered
materials2. Research at York in recent years has also shown that the
magnetoresistance (MR) can be directly related to the MRE by an experimental
correlation3. As a result, this allows the MR of materials of spintronic materials to be
determined via non-destructive, non-contact measurements4-8.
Many different oxide materials also show interesting magnetic properties. The study
of magnetism in pure and diluted oxides is a rapidly growing field9-15, as such
materials have potential for application in spintronic devices15-17. Magnetite (Fe3O4),
is one such material, as it has a high Curie temperature (858 K)18-22, theoretical
calculations predict it to be fully spin polarised at the Fermi level22-30 and thin-films
display MR20, 31-37. As outlined in chapter 1 (section 1.4.5), these properties are highly
dependent upon the film microstructure22, 37-39.
In this chapter, it will be shown that thin-films of Fe3O4 grown on MgO display a
thickness dependent MRE. This is due to the large skin depths associated with the
material, meaning that the IR light probes both the thin-film and the substrate, a
complication not observed for metallic multilayers. A new theoretical model for this
149
dependence will be outlined, allowing oxide materials to be modelled and probed by
MRE. The development of this method not only allows various conductivity
mechanisms to be probed for oxides, but also allows the composition and thickness of
such thin-films to be measured.
6.2 Results and Discussion 6.2.1 Preparation of Fe3O4 thin-films The phase diagram of iron oxides is very complex (see chapter 1, section 1.4.5),
therefore, exact deposition conditions are vital in order to ensure the exclusive growth
of the desired phase. Experiments were first conducted to determine the molecular
beam epitaxy (MBE) growth conditions necessary to ensure that Fe3O4 and not other
phases of iron oxide could be grown repeatedly. Gao et al40 determined the phase
diagram for MBE growth of Fe3O4 on MgO substrates using O radicals produced by
an RF plasma source, by preparing a large number of samples grown at different
conditions. The stoichiometry of samples was controlled by independently controlling
the growth rate, plasma power and O partial pressure. Depending upon the type of
plasma source, size and geometry of the MBE chamber used, there will be slight
variations in the growth conditions required for each vacuum system. As a result,
Chambers work was used as a starting point in order to prepare Fe3O4 samples.
Two MBE chambers were utilised for the growth of Fe3O4 thin-films on MgO
substrates. One chamber was located at Northeastern University in Boston, USA, and
the other was housed at the University of York, UK. Further details regarding these
MBE chambers can be found in section 2.1.2 of chapter 2. All MgO substrates were
first cleaned by sonication in acetone and then isopropyl alcohol, to ensure that the
surface was largely free of any organic contaminants. The substrate was then placed
into the MBE chamber via a load-lock. For samples grown in the Northeastern MBE,
prior to growth the substrates were annealed to 973 K in O2 for 4 hours. The samples
grown in the York MBE were annealed to 973 K in atomic O for 1-2 hours. In both
cases the substrate was then cooled to the required growth temperature.
Samples of Fe3O4 were then grown by simultaneously evaporating Fe in the presence
of atomic O prepared by an RF plasma source (details in chapter 2, section 2.1.2). The
samples grown at Northeastern university were prepared by Dr. Zhuhua Cai. Many
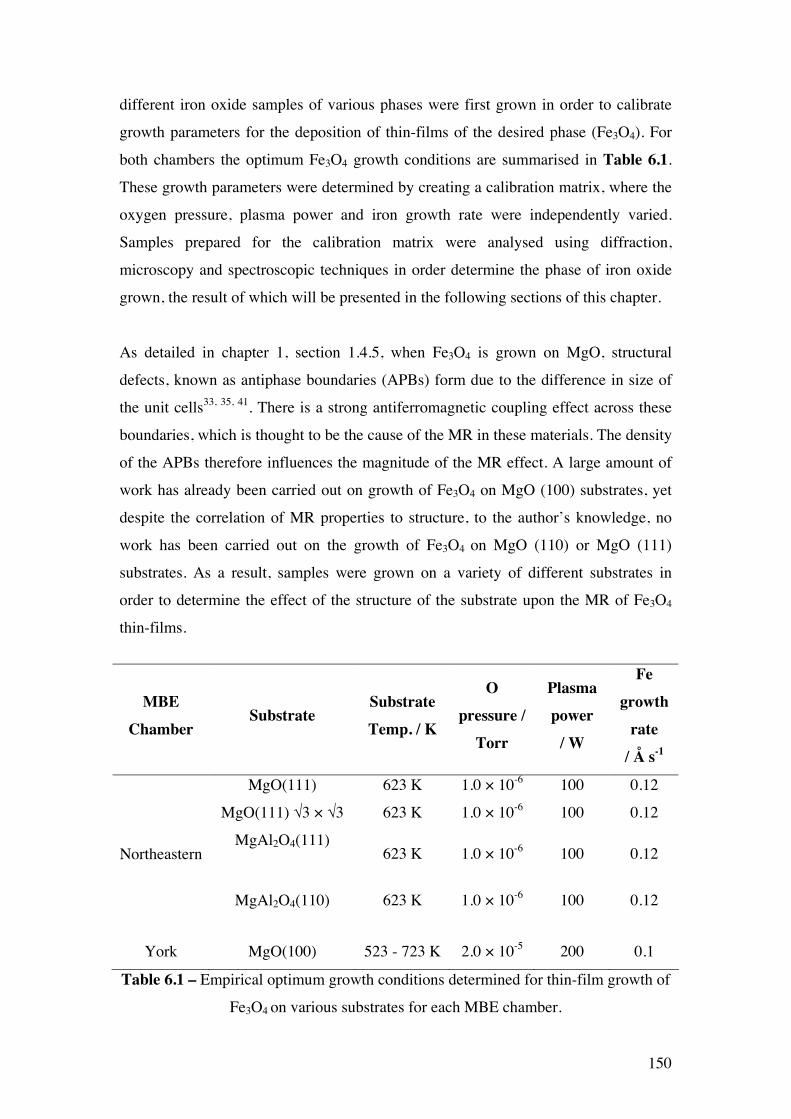
150
different iron oxide samples of various phases were first grown in order to calibrate
growth parameters for the deposition of thin-films of the desired phase (Fe3O4). For
both chambers the optimum Fe3O4 growth conditions are summarised in Table 6.1.
These growth parameters were determined by creating a calibration matrix, where the
oxygen pressure, plasma power and iron growth rate were independently varied.
Samples prepared for the calibration matrix were analysed using diffraction,
microscopy and spectroscopic techniques in order determine the phase of iron oxide
grown, the result of which will be presented in the following sections of this chapter.
As detailed in chapter 1, section 1.4.5, when Fe3O4 is grown on MgO, structural
defects, known as antiphase boundaries (APBs) form due to the difference in size of
the unit cells33, 35, 41. There is a strong antiferromagnetic coupling effect across these
boundaries, which is thought to be the cause of the MR in these materials. The density
of the APBs therefore influences the magnitude of the MR effect. A large amount of
work has already been carried out on growth of Fe3O4 on MgO (100) substrates, yet
despite the correlation of MR properties to structure, to the author’s knowledge, no
work has been carried out on the growth of Fe3O4 on MgO (110) or MgO (111)
substrates. As a result, samples were grown on a variety of different substrates in
order to determine the effect of the structure of the substrate upon the MR of Fe3O4
thin-films.
MBE Chamber
Substrate Substrate Temp. / K
O pressure /
Torr
Plasma power
/ W
Fe growth
rate / Å s-1
MgO(111) 623 K 1.0 × 10⁻⁶ 100 0.12
MgO(111) √3 × √3 623 K 1.0 × 10⁻⁶ 100 0.12
MgAl2O4(111)
623 K 1.0 × 10⁻⁶ 100 0.12
MgAl2O4(110) 623 K 1.0 × 10⁻⁶ 100 0.12
Northeastern
York MgO(100) 523 - 723 K 2.0 × 10⁻⁵ 200 0.1
Table 6.1 – Empirical optimum growth conditions determined for thin-film growth of
Fe3O4 on various substrates for each MBE chamber.
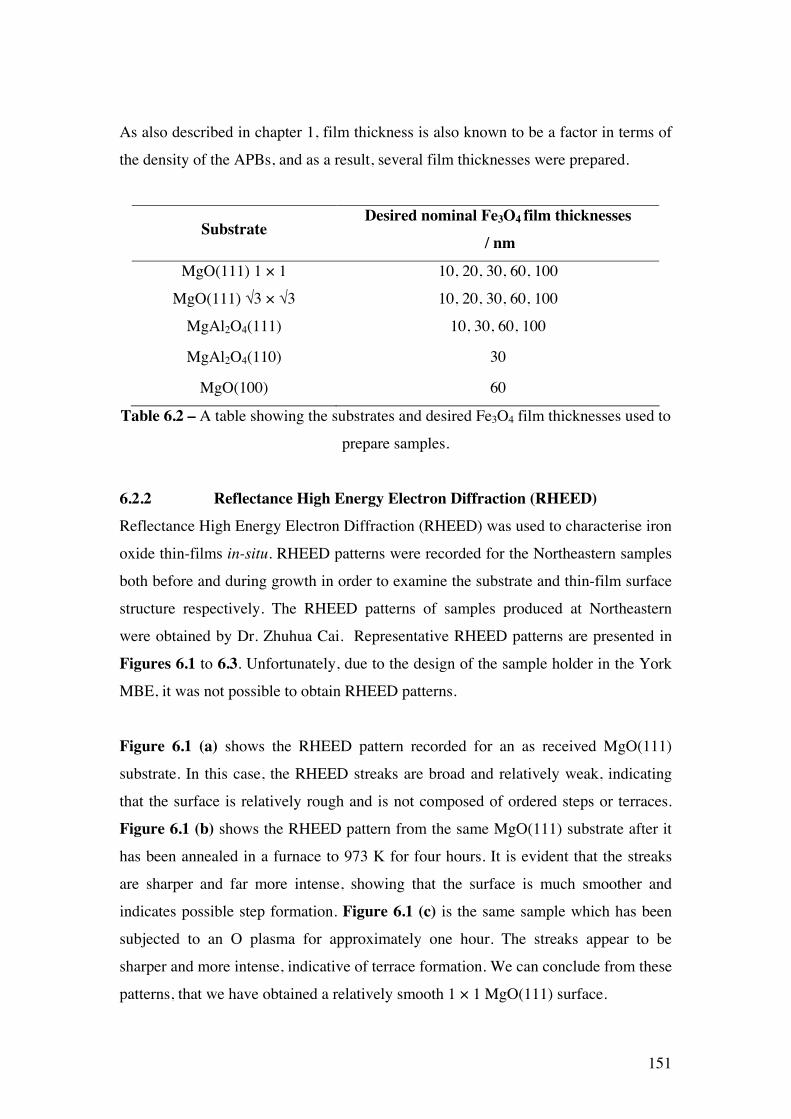
151
As also described in chapter 1, film thickness is also known to be a factor in terms of
the density of the APBs, and as a result, several film thicknesses were prepared.
Substrate Desired nominal Fe3O4 film thicknesses
/ nm
MgO(111) 1 × 1 10, 20, 30, 60, 100
MgO(111) √3 × √3 10, 20, 30, 60, 100
MgAl2O4(111) 10, 30, 60, 100
MgAl2O4(110) 30
MgO(100) 60
Table 6.2 – A table showing the substrates and desired Fe3O4 film thicknesses used to
prepare samples.
6.2.2 Reflectance High Energy Electron Diffraction (RHEED) Reflectance High Energy Electron Diffraction (RHEED) was used to characterise iron
oxide thin-films in-situ. RHEED patterns were recorded for the Northeastern samples
both before and during growth in order to examine the substrate and thin-film surface
structure respectively. The RHEED patterns of samples produced at Northeastern
were obtained by Dr. Zhuhua Cai. Representative RHEED patterns are presented in
Figures 6.1 to 6.3. Unfortunately, due to the design of the sample holder in the York
MBE, it was not possible to obtain RHEED patterns.
Figure 6.1 (a) shows the RHEED pattern recorded for an as received MgO(111)
substrate. In this case, the RHEED streaks are broad and relatively weak, indicating
that the surface is relatively rough and is not composed of ordered steps or terraces.
Figure 6.1 (b) shows the RHEED pattern from the same MgO(111) substrate after it
has been annealed in a furnace to 973 K for four hours. It is evident that the streaks
are sharper and far more intense, showing that the surface is much smoother and
indicates possible step formation. Figure 6.1 (c) is the same sample which has been
subjected to an O plasma for approximately one hour. The streaks appear to be
sharper and more intense, indicative of terrace formation. We can conclude from these
patterns, that we have obtained a relatively smooth 1 × 1 MgO(111) surface.
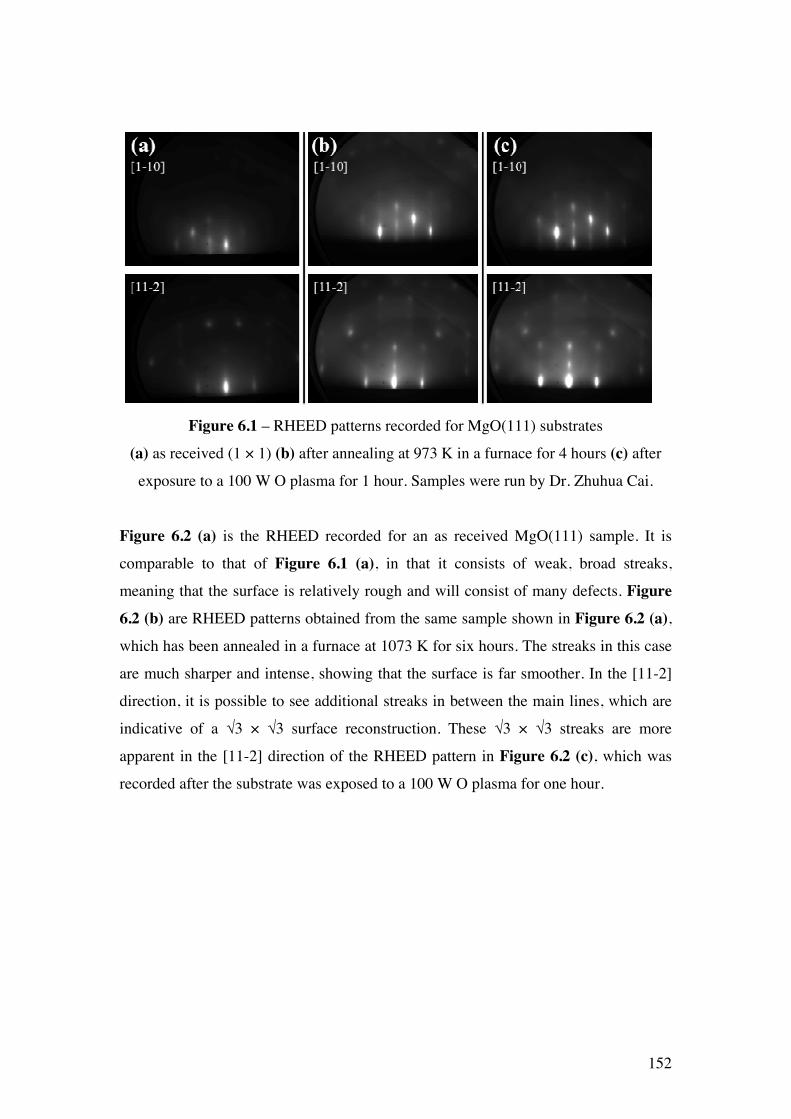
152
Figure 6.1 – RHEED patterns recorded for MgO(111) substrates
(a) as received (1 × 1) (b) after annealing at 973 K in a furnace for 4 hours (c) after
exposure to a 100 W O plasma for 1 hour. Samples were run by Dr. Zhuhua Cai.
Figure 6.2 (a) is the RHEED recorded for an as received MgO(111) sample. It is
comparable to that of Figure 6.1 (a), in that it consists of weak, broad streaks,
meaning that the surface is relatively rough and will consist of many defects. Figure 6.2 (b) are RHEED patterns obtained from the same sample shown in Figure 6.2 (a), which has been annealed in a furnace at 1073 K for six hours. The streaks in this case
are much sharper and intense, showing that the surface is far smoother. In the [11-2]
direction, it is possible to see additional streaks in between the main lines, which are
indicative of a √3 × √3 surface reconstruction. These √3 × √3 streaks are more
apparent in the [11-2] direction of the RHEED pattern in Figure 6.2 (c), which was
recorded after the substrate was exposed to a 100 W O plasma for one hour.
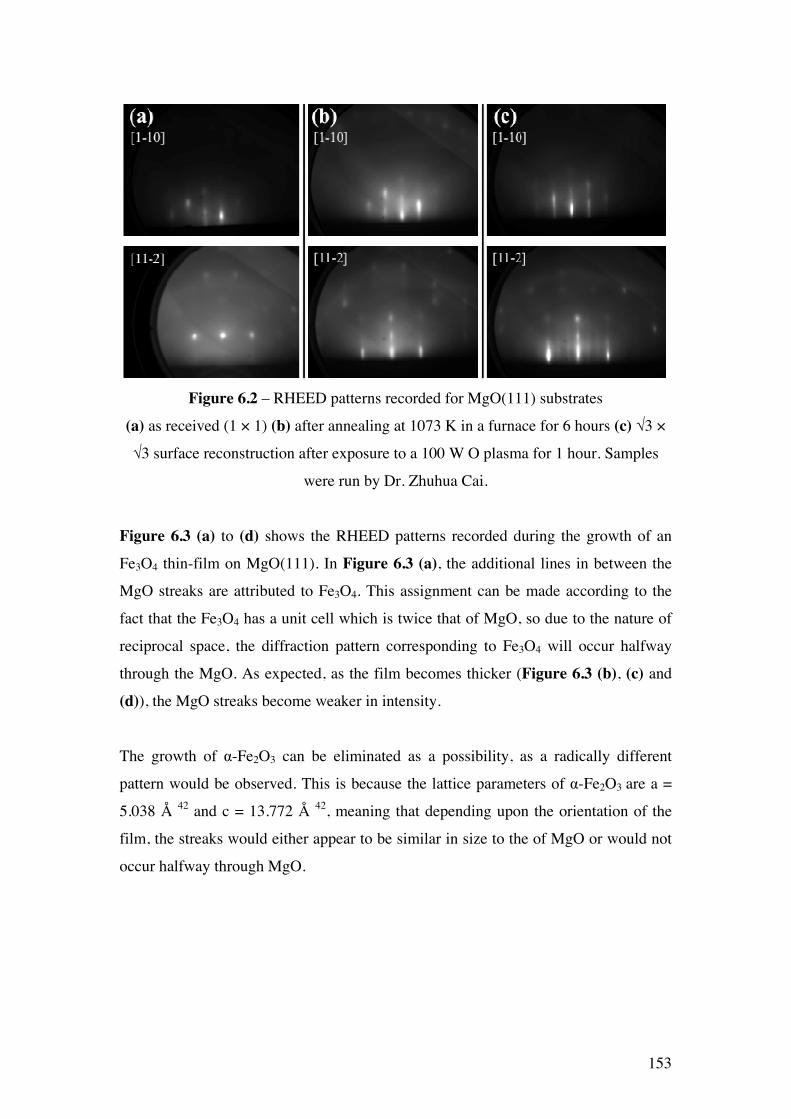
153
Figure 6.2 – RHEED patterns recorded for MgO(111) substrates
(a) as received (1 × 1) (b) after annealing at 1073 K in a furnace for 6 hours (c) √3 ×
√3 surface reconstruction after exposure to a 100 W O plasma for 1 hour. Samples
were run by Dr. Zhuhua Cai.
Figure 6.3 (a) to (d) shows the RHEED patterns recorded during the growth of an
Fe3O4 thin-film on MgO(111). In Figure 6.3 (a), the additional lines in between the
MgO streaks are attributed to Fe3O4. This assignment can be made according to the
fact that the Fe3O4 has a unit cell which is twice that of MgO, so due to the nature of
reciprocal space, the diffraction pattern corresponding to Fe3O4 will occur halfway
through the MgO. As expected, as the film becomes thicker (Figure 6.3 (b), (c) and
(d)), the MgO streaks become weaker in intensity.
The growth of α-Fe2O3 can be eliminated as a possibility, as a radically different
pattern would be observed. This is because the lattice parameters of α-Fe2O3 are a =
5.038 Å 42 and c = 13.772 Å 42, meaning that depending upon the orientation of the
film, the streaks would either appear to be similar in size to the of MgO or would not
occur halfway through MgO.
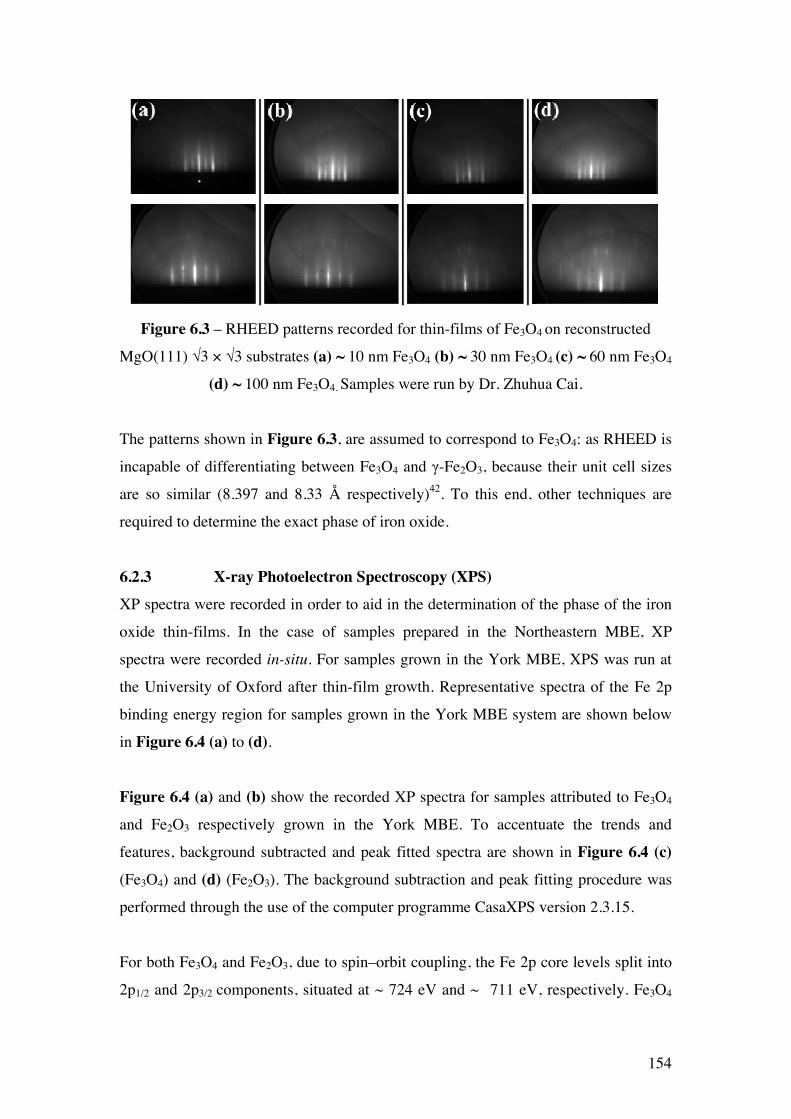
154
Figure 6.3 – RHEED patterns recorded for thin-films of Fe3O4 on reconstructed
MgO(111) √3 × √3 substrates (a) ~ 10 nm Fe3O4 (b) ~ 30 nm Fe3O4 (c) ~ 60 nm Fe3O4
(d) ~ 100 nm Fe3O4. Samples were run by Dr. Zhuhua Cai.
The patterns shown in Figure 6.3, are assumed to correspond to Fe3O4: as RHEED is
incapable of differentiating between Fe3O4 and γ-Fe2O3, because their unit cell sizes
are so similar (8.397 and 8.33 Å respectively)42. To this end, other techniques are
required to determine the exact phase of iron oxide.
6.2.3 X-ray Photoelectron Spectroscopy (XPS) XP spectra were recorded in order to aid in the determination of the phase of the iron
oxide thin-films. In the case of samples prepared in the Northeastern MBE, XP
spectra were recorded in-situ. For samples grown in the York MBE, XPS was run at
the University of Oxford after thin-film growth. Representative spectra of the Fe 2p
binding energy region for samples grown in the York MBE system are shown below
in Figure 6.4 (a) to (d).
Figure 6.4 (a) and (b) show the recorded XP spectra for samples attributed to Fe3O4
and Fe2O3 respectively grown in the York MBE. To accentuate the trends and
features, background subtracted and peak fitted spectra are shown in Figure 6.4 (c) (Fe3O4) and (d) (Fe2O3). The background subtraction and peak fitting procedure was
performed through the use of the computer programme CasaXPS version 2.3.15.
For both Fe3O4 and Fe2O3, due to spin–orbit coupling, the Fe 2p core levels split into
2p1/2 and 2p3/2 components, situated at ~ 724 eV and ~ 711 eV, respectively. Fe3O4
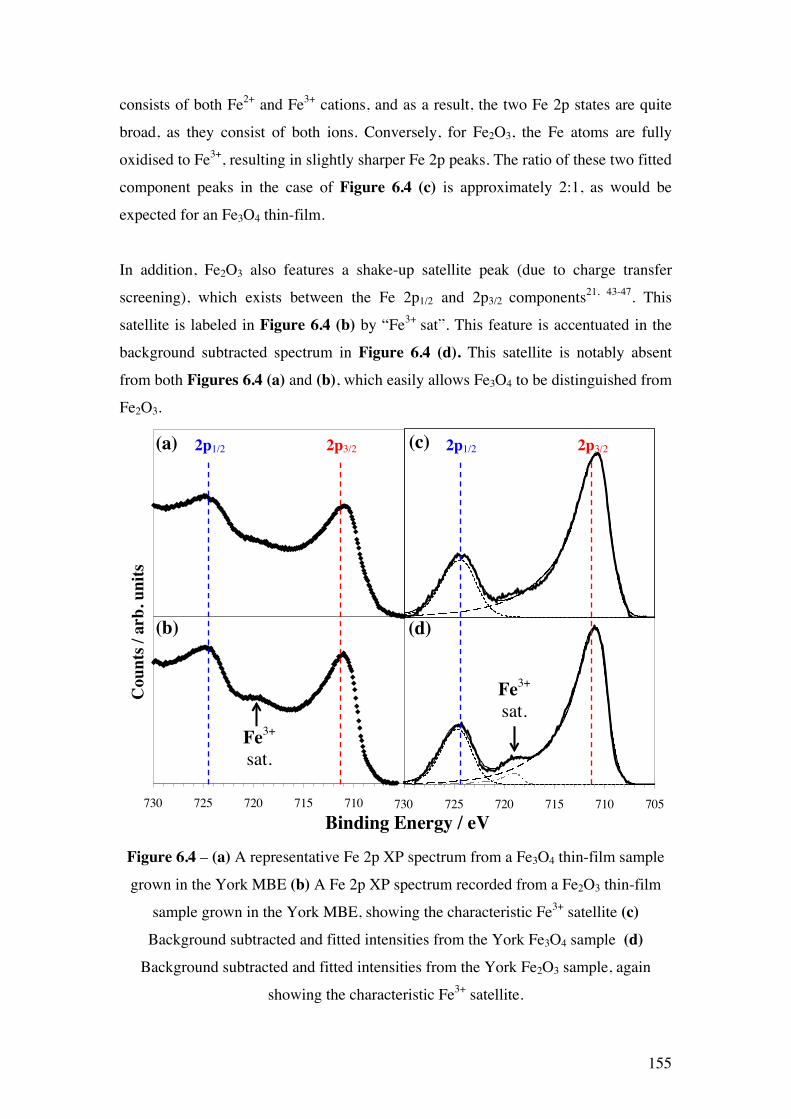
155
consists of both Fe2+ and Fe3+ cations, and as a result, the two Fe 2p states are quite
broad, as they consist of both ions. Conversely, for Fe2O3, the Fe atoms are fully
oxidised to Fe3+, resulting in slightly sharper Fe 2p peaks. The ratio of these two fitted
component peaks in the case of Figure 6.4 (c) is approximately 2:1, as would be
expected for an Fe3O4 thin-film.
In addition, Fe2O3 also features a shake-up satellite peak (due to charge transfer
screening), which exists between the Fe 2p1/2 and 2p3/2 components21, 43-47. This
satellite is labeled in Figure 6.4 (b) by “Fe3+ sat”. This feature is accentuated in the
background subtracted spectrum in Figure 6.4 (d). This satellite is notably absent
from both Figures 6.4 (a) and (b), which easily allows Fe3O4 to be distinguished from
Fe2O3.
705 710 715 720 725 730
Cou
nts /
arb
. uni
ts
(a)
(b)
Fe3+
705 710 715 720 725 730
(d)
Fe3+
730
(c)
Binding Energy / eV Figure 6.4 – (a) A representative Fe 2p XP spectrum from a Fe3O4 thin-film sample
grown in the York MBE (b) A Fe 2p XP spectrum recorded from a Fe2O3 thin-film
sample grown in the York MBE, showing the characteristic Fe3+ satellite (c) Background subtracted and fitted intensities from the York Fe3O4 sample (d)
Background subtracted and fitted intensities from the York Fe2O3 sample, again
showing the characteristic Fe3+ satellite.
Fe3+ sat.
Fe3+ sat.
2p3/2 2p1/2 2p3/2 2p1/2
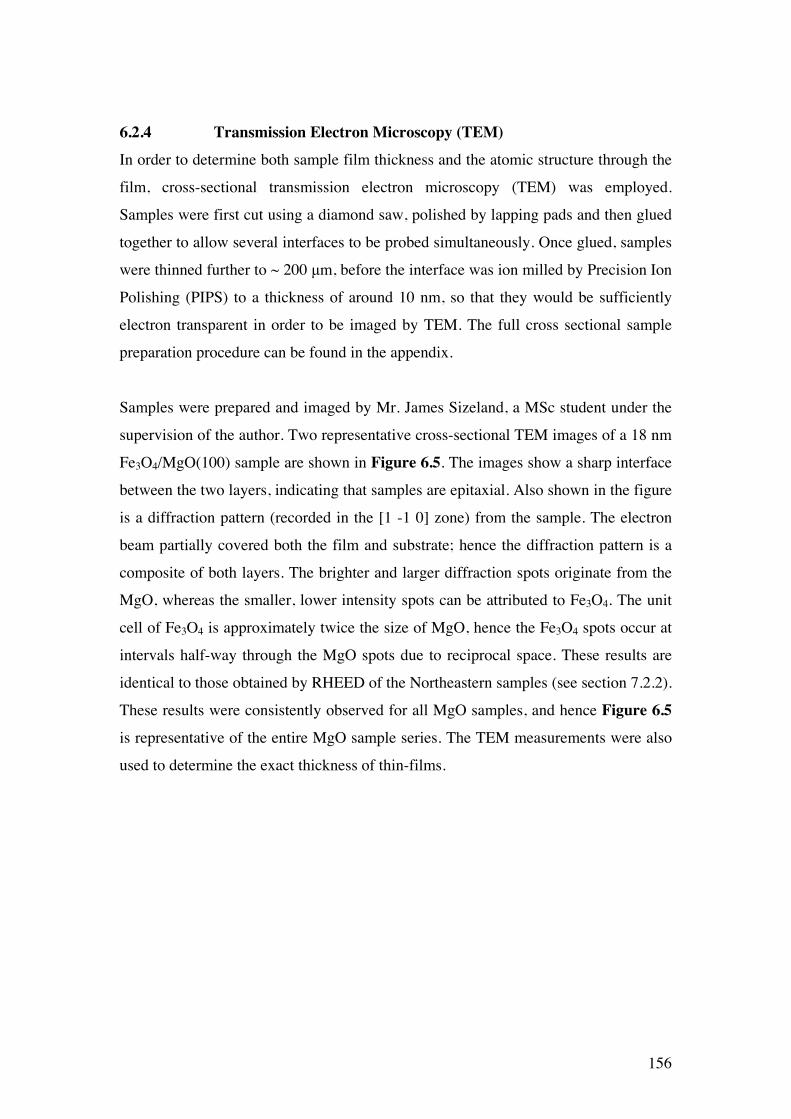
156
6.2.4 Transmission Electron Microscopy (TEM) In order to determine both sample film thickness and the atomic structure through the
film, cross-sectional transmission electron microscopy (TEM) was employed.
Samples were first cut using a diamond saw, polished by lapping pads and then glued
together to allow several interfaces to be probed simultaneously. Once glued, samples
were thinned further to ~ 200 µm, before the interface was ion milled by Precision Ion
Polishing (PIPS) to a thickness of around 10 nm, so that they would be sufficiently
electron transparent in order to be imaged by TEM. The full cross sectional sample
preparation procedure can be found in the appendix.
Samples were prepared and imaged by Mr. James Sizeland, a MSc student under the
supervision of the author. Two representative cross-sectional TEM images of a 18 nm
Fe3O4/MgO(100) sample are shown in Figure 6.5. The images show a sharp interface
between the two layers, indicating that samples are epitaxial. Also shown in the figure
is a diffraction pattern (recorded in the [1 -1 0] zone) from the sample. The electron
beam partially covered both the film and substrate; hence the diffraction pattern is a
composite of both layers. The brighter and larger diffraction spots originate from the
MgO, whereas the smaller, lower intensity spots can be attributed to Fe3O4. The unit
cell of Fe3O4 is approximately twice the size of MgO, hence the Fe3O4 spots occur at
intervals half-way through the MgO spots due to reciprocal space. These results are
identical to those obtained by RHEED of the Northeastern samples (see section 7.2.2).
These results were consistently observed for all MgO samples, and hence Figure 6.5
is representative of the entire MgO sample series. The TEM measurements were also
used to determine the exact thickness of thin-films.
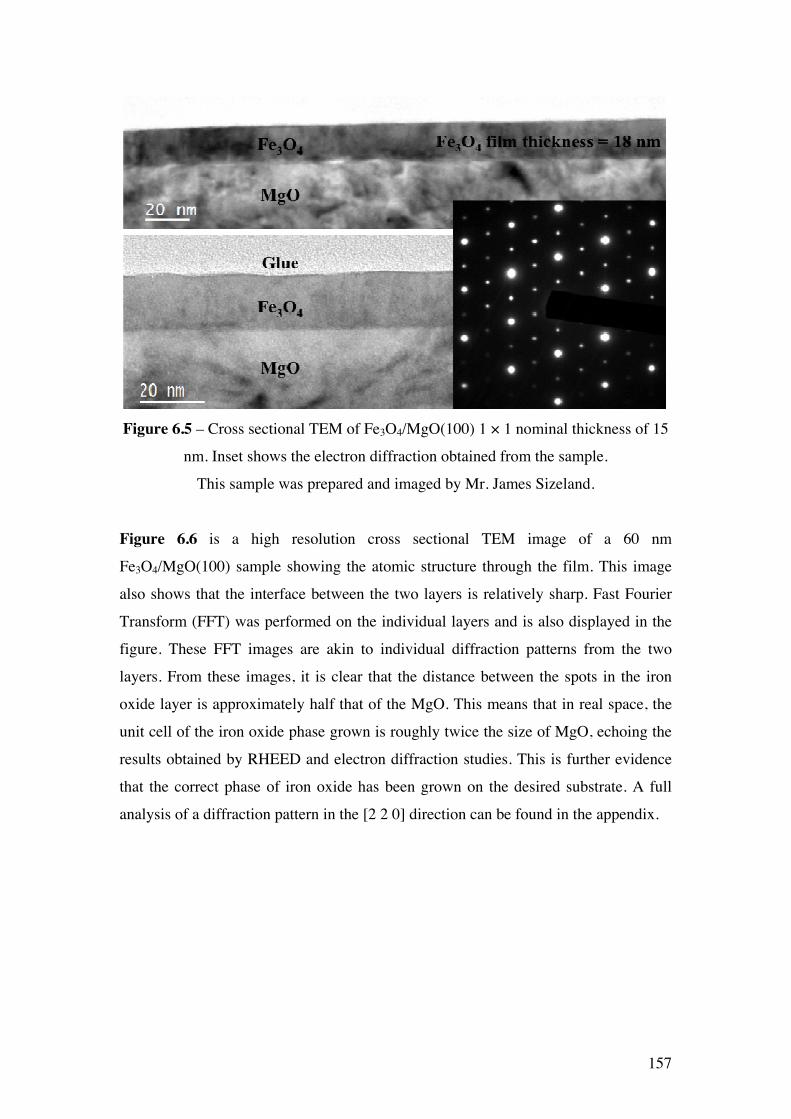
157
Figure 6.5 – Cross sectional TEM of Fe3O4/MgO(100) 1 × 1 nominal thickness of 15
nm. Inset shows the electron diffraction obtained from the sample.
This sample was prepared and imaged by Mr. James Sizeland.
Figure 6.6 is a high resolution cross sectional TEM image of a 60 nm
Fe3O4/MgO(100) sample showing the atomic structure through the film. This image
also shows that the interface between the two layers is relatively sharp. Fast Fourier
Transform (FFT) was performed on the individual layers and is also displayed in the
figure. These FFT images are akin to individual diffraction patterns from the two
layers. From these images, it is clear that the distance between the spots in the iron
oxide layer is approximately half that of the MgO. This means that in real space, the
unit cell of the iron oxide phase grown is roughly twice the size of MgO, echoing the
results obtained by RHEED and electron diffraction studies. This is further evidence
that the correct phase of iron oxide has been grown on the desired substrate. A full
analysis of a diffraction pattern in the [2 2 0] direction can be found in the appendix.
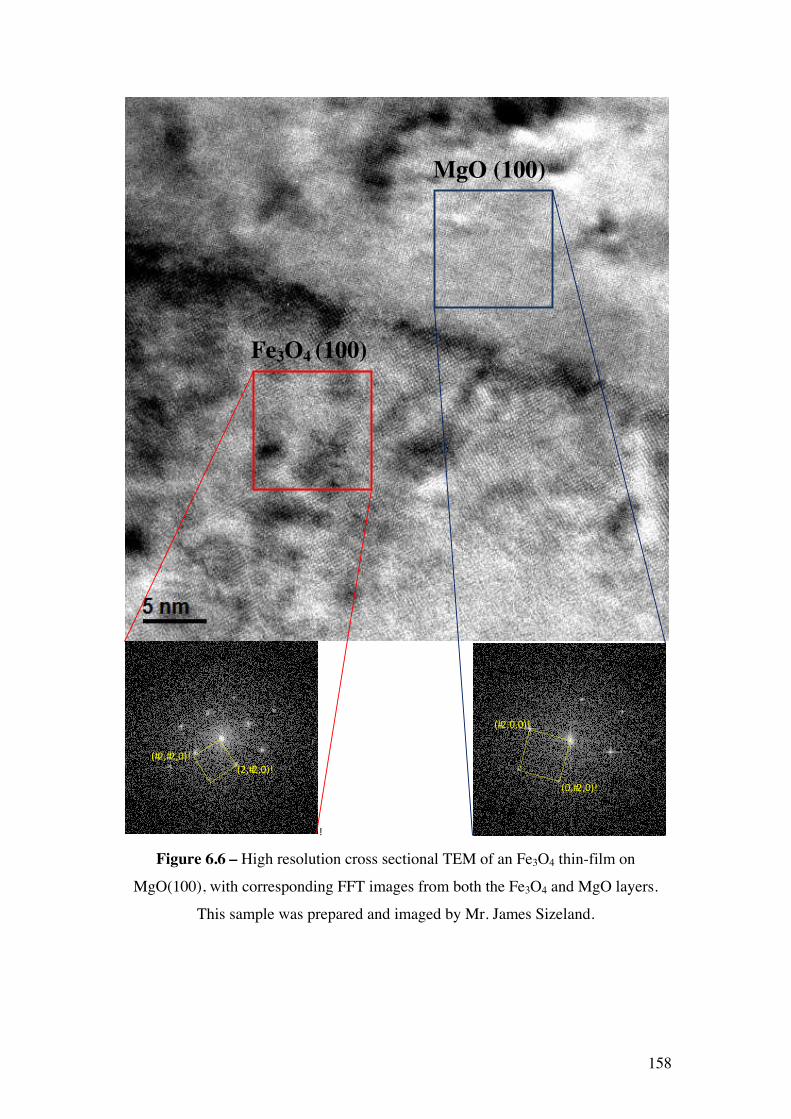
158
!
(#2,#2,0)!(2,#2,0)!
(#2,0,0)!
(0,#2,0)!
MgO (100)
Fe3O4 (100)
Figure 6.6 – High resolution cross sectional TEM of an Fe3O4 thin-film on
MgO(100), with corresponding FFT images from both the Fe3O4 and MgO layers. This sample was prepared and imaged by Mr. James Sizeland.
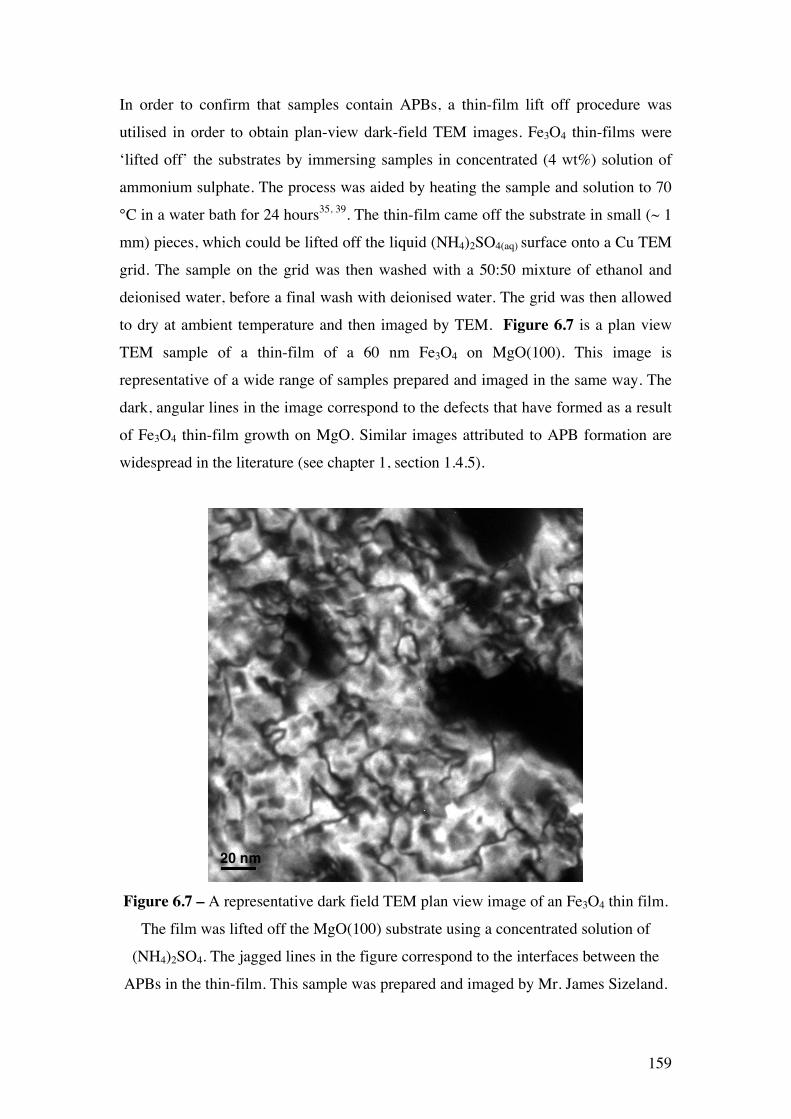
159
In order to confirm that samples contain APBs, a thin-film lift off procedure was
utilised in order to obtain plan-view dark-field TEM images. Fe3O4 thin-films were
‘lifted off’ the substrates by immersing samples in concentrated (4 wt%) solution of
ammonium sulphate. The process was aided by heating the sample and solution to 70
°C in a water bath for 24 hours35, 39. The thin-film came off the substrate in small (~ 1
mm) pieces, which could be lifted off the liquid (NH4)2SO4(aq) surface onto a Cu TEM
grid. The sample on the grid was then washed with a 50:50 mixture of ethanol and
deionised water, before a final wash with deionised water. The grid was then allowed
to dry at ambient temperature and then imaged by TEM. Figure 6.7 is a plan view
TEM sample of a thin-film of a 60 nm Fe3O4 on MgO(100). This image is
representative of a wide range of samples prepared and imaged in the same way. The
dark, angular lines in the image correspond to the defects that have formed as a result
of Fe3O4 thin-film growth on MgO. Similar images attributed to APB formation are
widespread in the literature (see chapter 1, section 1.4.5).
20 nm
Figure 6.7 – A representative dark field TEM plan view image of an Fe3O4 thin film.
The film was lifted off the MgO(100) substrate using a concentrated solution of
(NH4)2SO4. The jagged lines in the figure correspond to the interfaces between the
APBs in the thin-film. This sample was prepared and imaged by Mr. James Sizeland.
160
6.2.5 Vibrating Sample Magnetometry (VSM) Vibrating Sample Magnetometry (VSM) was used to determine the remanence and
coercivity of thin-film Fe3O4 samples. The VSM data from Fe3O4 samples on
MgAl2O4(111) is shown below in Figure 6.8. The trends will first be described, before
possible explanations are outlined at the end of the section. The main figure shows the
hysteresis loops for a variety of Fe3O4 film thicknesses on MgAl2O4(111) substrates. It
should be noted that similar hysteresis curves were obtained for all samples, therefore
Figure 6.8 can be said to be representative of all samples. The magnetic field scale (x
axis) has been decreased in order to emphasise the shape of the curves, along with the
coercivity and remanence. The inset shows the same hysteresis loops at full scale.
Examining the curves in this figure, there is also no evidence of multiphase behaviour
from data.
It should be noted that the samples have been mathematically corrected for the
diamagnetic response of the substrate. This involved dividing the hysteresis loops by
a gradient, which is assumed to correspond to the diamagnetic response. For
reference, the magnitude and shape of this correction is also displayed in the figure.
This correction, coupled with the fact that Fe3O4 thin-films do not magnetically
saturate in high fields33, 39, means that it is impossible to determine the magnetic
saturation (Ms) of samples. With that said, as the magnetisation has been normalised
to the approximate volume of each thin-film, it can be observed that all films have
approximately the same magnetisation at 15000 Oe and this is in the correct range for
Fe3O448. It is important to consider the fact that the volume of each sample was
calculated from the area (measured by CCD) and nominal thickness of samples. As a
result the error associated with this method of correction will be high.
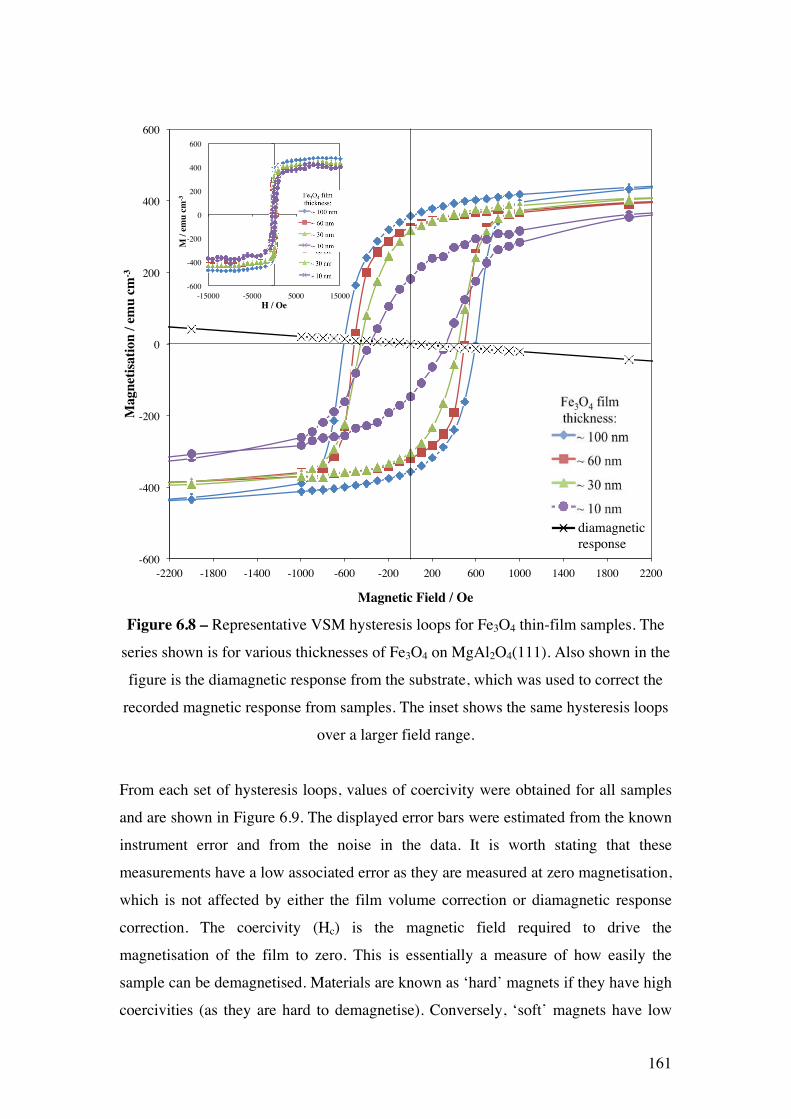
161
-600
-400
-200
0
200
400
600
-2200 -1800 -1400 -1000 -600 -200 200 600 1000 1400 1800 2200
Mag
netis
atio
n / e
mu
cm-3
Magnetic Field / Oe
diamagnetic response
-600
-400
-200
0
200
400
600
-15000 -5000 5000 15000
M /
emu
cm-3
H / Oe
Figure 6.8 – Representative VSM hysteresis loops for Fe3O4 thin-film samples. The
series shown is for various thicknesses of Fe3O4 on MgAl2O4(111). Also shown in the
figure is the diamagnetic response from the substrate, which was used to correct the
recorded magnetic response from samples. The inset shows the same hysteresis loops
over a larger field range.
From each set of hysteresis loops, values of coercivity were obtained for all samples
and are shown in Figure 6.9. The displayed error bars were estimated from the known
instrument error and from the noise in the data. It is worth stating that these
measurements have a low associated error as they are measured at zero magnetisation,
which is not affected by either the film volume correction or diamagnetic response
correction. The coercivity (Hc) is the magnetic field required to drive the
magnetisation of the film to zero. This is essentially a measure of how easily the
sample can be demagnetised. Materials are known as ‘hard’ magnets if they have high
coercivities (as they are hard to demagnetise). Conversely, ‘soft’ magnets have low
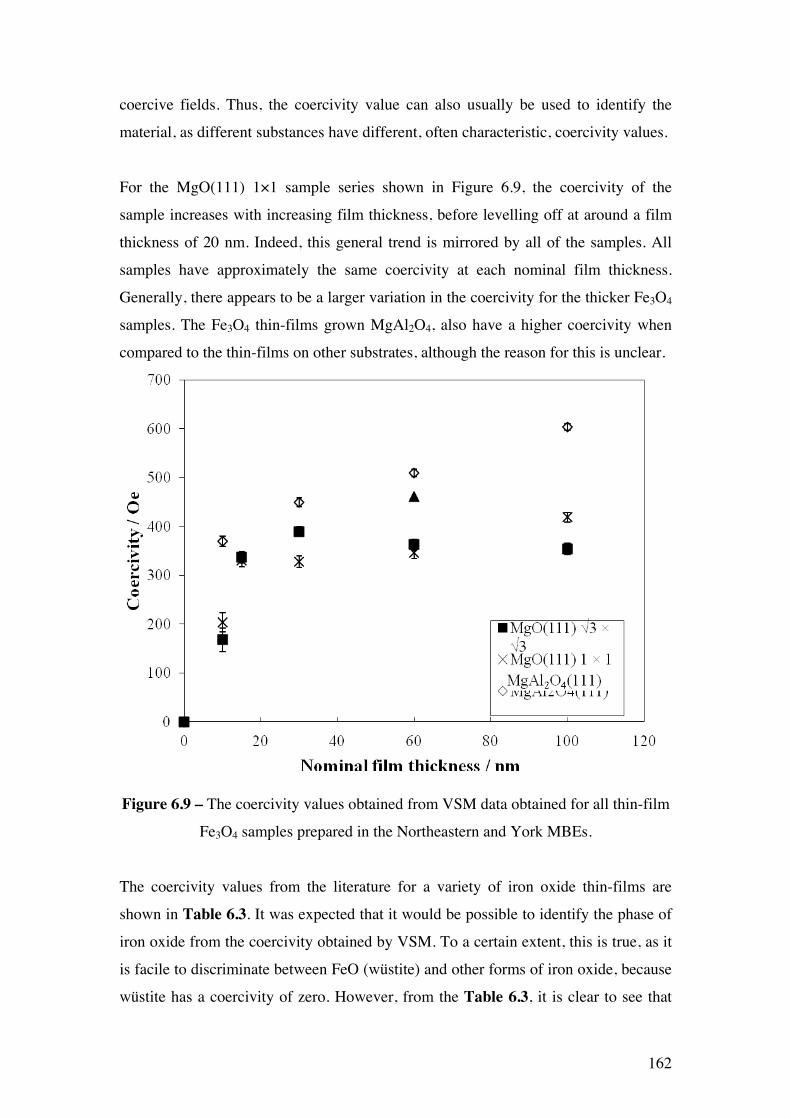
162
coercive fields. Thus, the coercivity value can also usually be used to identify the
material, as different substances have different, often characteristic, coercivity values.
For the MgO(111) 1×1 sample series shown in Figure 6.9, the coercivity of the
sample increases with increasing film thickness, before levelling off at around a film
thickness of 20 nm. Indeed, this general trend is mirrored by all of the samples. All
samples have approximately the same coercivity at each nominal film thickness.
Generally, there appears to be a larger variation in the coercivity for the thicker Fe3O4
samples. The Fe3O4 thin-films grown MgAl2O4, also have a higher coercivity when
compared to the thin-films on other substrates, although the reason for this is unclear.
Figure 6.9 – The coercivity values obtained from VSM data obtained for all thin-film
Fe3O4 samples prepared in the Northeastern and York MBEs.
The coercivity values from the literature for a variety of iron oxide thin-films are
shown in Table 6.3. It was expected that it would be possible to identify the phase of
iron oxide from the coercivity obtained by VSM. To a certain extent, this is true, as it
is facile to discriminate between FeO (wüstite) and other forms of iron oxide, because
wüstite has a coercivity of zero. However, from the Table 6.3, it is clear to see that
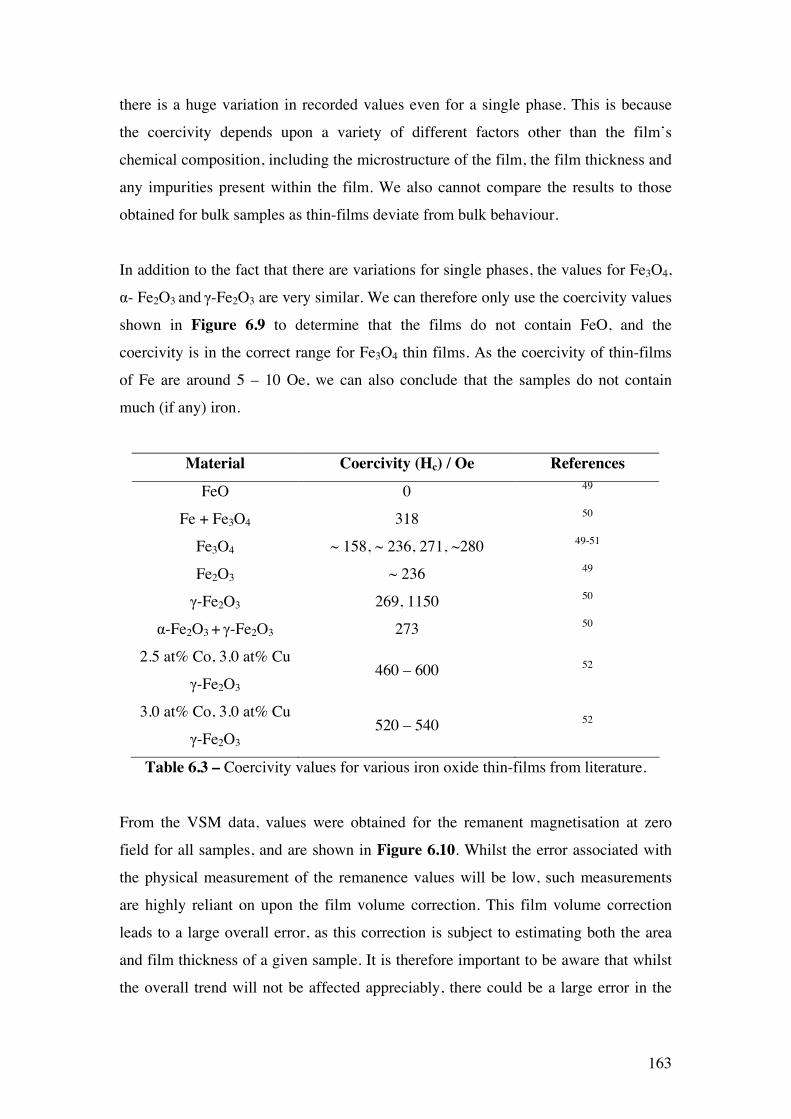
163
there is a huge variation in recorded values even for a single phase. This is because
the coercivity depends upon a variety of different factors other than the film’s
chemical composition, including the microstructure of the film, the film thickness and
any impurities present within the film. We also cannot compare the results to those
obtained for bulk samples as thin-films deviate from bulk behaviour.
In addition to the fact that there are variations for single phases, the values for Fe3O4,
α- Fe2O3 and γ-Fe2O3 are very similar. We can therefore only use the coercivity values
shown in Figure 6.9 to determine that the films do not contain FeO, and the
coercivity is in the correct range for Fe3O4 thin films. As the coercivity of thin-films
of Fe are around 5 – 10 Oe, we can also conclude that the samples do not contain
much (if any) iron.
Material Coercivity (Hc) / Oe References
FeO 0 49
Fe + Fe3O4 318 50
Fe3O4 ~ 158, ~ 236, 271, ~280 49-51
Fe2O3 ~ 236 49
γ-Fe2O3 269, 1150 50
α-Fe2O3 + γ-Fe2O3 273 50
2.5 at% Co, 3.0 at% Cu
γ-Fe2O3 460 – 600 52
3.0 at% Co, 3.0 at% Cu
γ-Fe2O3 520 – 540 52
Table 6.3 – Coercivity values for various iron oxide thin-films from literature.
From the VSM data, values were obtained for the remanent magnetisation at zero
field for all samples, and are shown in Figure 6.10. Whilst the error associated with
the physical measurement of the remanence values will be low, such measurements
are highly reliant on upon the film volume correction. This film volume correction
leads to a large overall error, as this correction is subject to estimating both the area
and film thickness of a given sample. It is therefore important to be aware that whilst
the overall trend will not be affected appreciably, there could be a large error in the
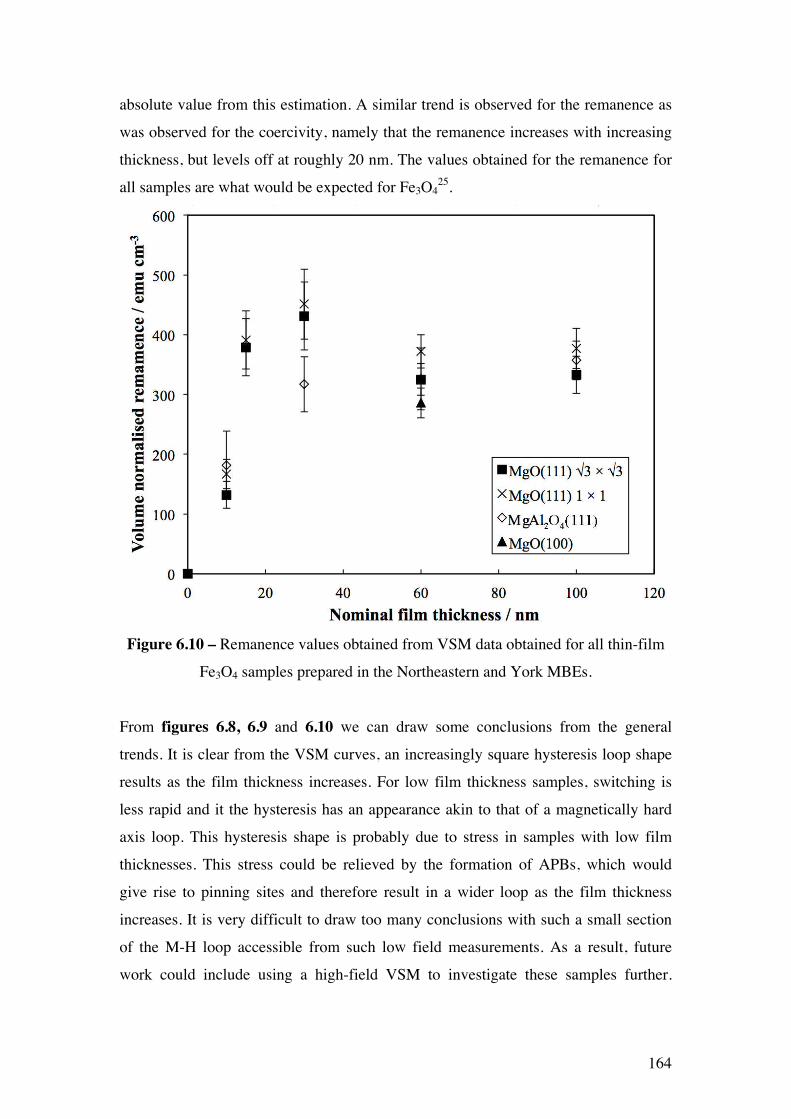
164
absolute value from this estimation. A similar trend is observed for the remanence as
was observed for the coercivity, namely that the remanence increases with increasing
thickness, but levels off at roughly 20 nm. The values obtained for the remanence for
all samples are what would be expected for Fe3O425.
Figure 6.10 – Remanence values obtained from VSM data obtained for all thin-film
Fe3O4 samples prepared in the Northeastern and York MBEs.
From figures 6.8, 6.9 and 6.10 we can draw some conclusions from the general
trends. It is clear from the VSM curves, an increasingly square hysteresis loop shape
results as the film thickness increases. For low film thickness samples, switching is
less rapid and it the hysteresis has an appearance akin to that of a magnetically hard
axis loop. This hysteresis shape is probably due to stress in samples with low film
thicknesses. This stress could be relieved by the formation of APBs, which would
give rise to pinning sites and therefore result in a wider loop as the film thickness
increases. It is very difficult to draw too many conclusions with such a small section
of the M-H loop accessible from such low field measurements. As a result, future
work could include using a high-field VSM to investigate these samples further.
165
6.2.6 Magnetoresistance (MR) measurements The magnetoresistance (MR) of Fe3O4 thin-films was determined by four-point probe
measurements (as detailed in chapter 2, section 2.6.2). Films grown in the York MBE
system with a composition corresponding to Fe2O3 (as determined by XPS, see Figure
6.4 (b) and (d)) did not display any magnetoresistance, meaning that MR could also
be used as an indirect method to determine the phase of iron oxide grown in MBE
experiments.
A representative MR curve is shown in Figure 6.11. From this figure, it can be
observed that the MR increases with increasing magnetic field, although no saturation
occurs by ~ 1 T. What is also interesting to note from the figure, is the appearance of
two ‘humps’ in the MR at low field, which correspond to the coercivity of the sample.
Table 6.4 also displays the magnitude of the MR recorded at ~ 1 T for all samples.
All samples display roughly the same MR (~ 1 %) at ~ 1 T. This is surprising, as one
would expect there to be a thickness dependence in the MR within the same sample
series, as it is known that the density of the APBs varies with film thickness22, 35. One
would also expect there to be a large variation in the MR between different sample
sets, as the density of the APBs also depends upon the substrate surface structure. It is
thought that the MR values are all approximately 1 % as the samples clearly do not
saturate in low fields.
940
941
942
943
944
945
946
947
948
949
-10000 -7500 -5000 -2500 0 2500 5000 7500 10000
Res
istan
ce /
!
Magnetic Field / Oe
!R = 0.78%
Figure 6.11 – A representative MR curve from a thin-film of Fe3O4 on MgO. The MR
shown in the figure is from a 100 nm Fe3O4 thin-film on MgO(111) substrate.
∆R = 0.8 %
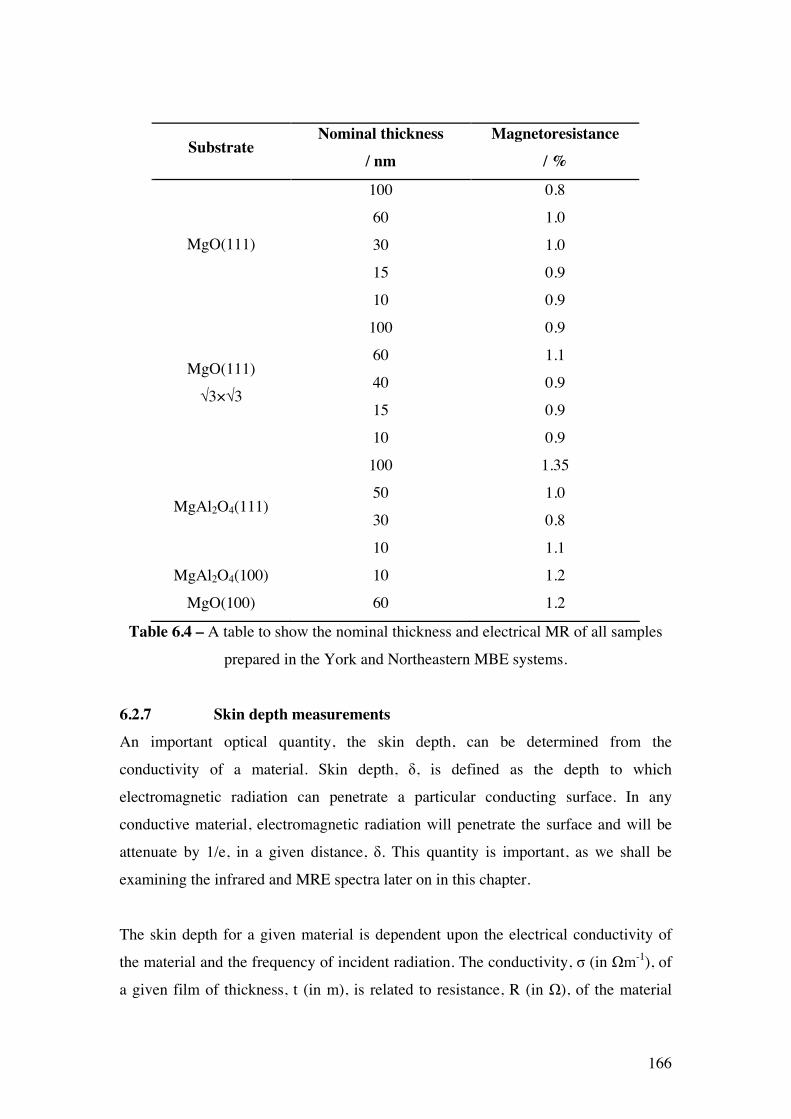
166
Table 6.4 – A table to show the nominal thickness and electrical MR of all samples
prepared in the York and Northeastern MBE systems.
6.2.7 Skin depth measurements An important optical quantity, the skin depth, can be determined from the
conductivity of a material. Skin depth, δ, is defined as the depth to which
electromagnetic radiation can penetrate a particular conducting surface. In any
conductive material, electromagnetic radiation will penetrate the surface and will be
attenuate by 1/e, in a given distance, δ. This quantity is important, as we shall be
examining the infrared and MRE spectra later on in this chapter.
The skin depth for a given material is dependent upon the electrical conductivity of
the material and the frequency of incident radiation. The conductivity, σ (in Ωm-1), of
a given film of thickness, t (in m), is related to resistance, R (in Ω), of the material
Substrate Nominal thickness
/ nm Magnetoresistance
/ %
100 0.8
60 1.0
30 1.0
15 0.9
MgO(111)
10 0.9
100 0.9
60 1.1
40 0.9
15 0.9
MgO(111)
√3×√3
10 0.9
100 1.35
50 1.0
30 0.8 MgAl2O4(111)
10 1.1
MgAl2O4(100) 10 1.2
MgO(100) 60 1.2
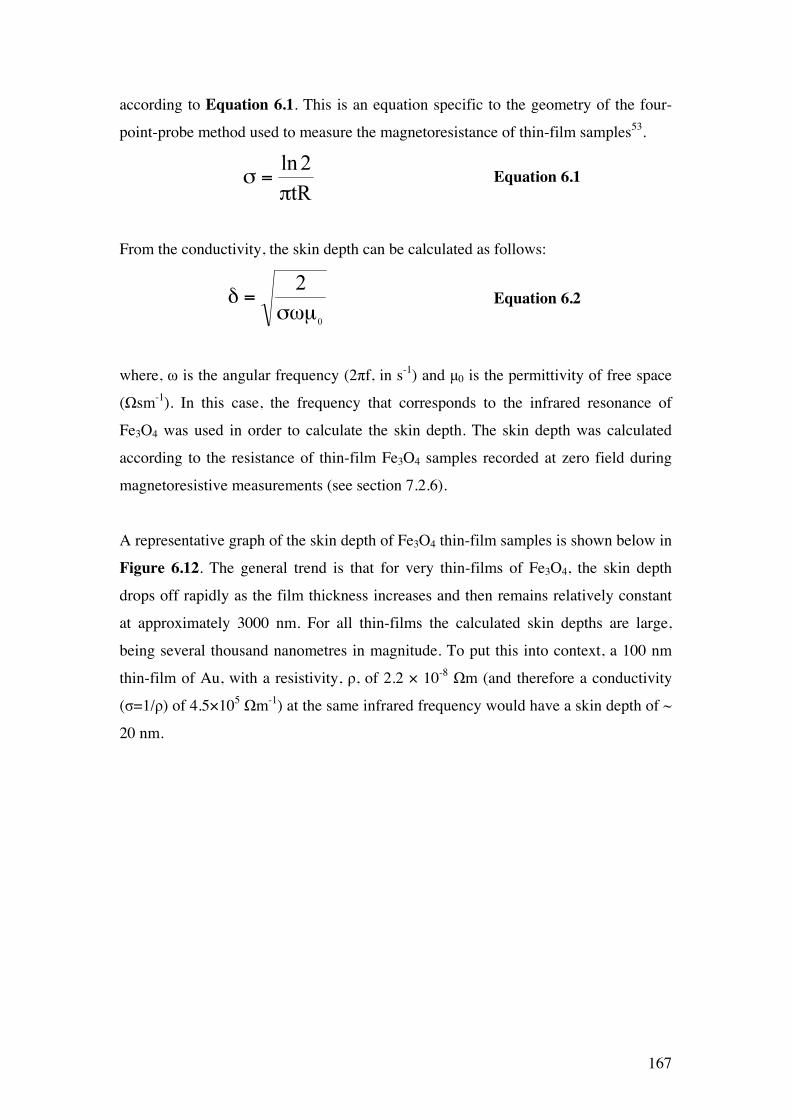
167
according to Equation 6.1. This is an equation specific to the geometry of the four-
point-probe method used to measure the magnetoresistance of thin-film samples53.
Equation 6.1
From the conductivity, the skin depth can be calculated as follows:
Equation 6.2
where, ω is the angular frequency (2πf, in s-1) and µ0 is the permittivity of free space
(Ωsm-1). In this case, the frequency that corresponds to the infrared resonance of
Fe3O4 was used in order to calculate the skin depth. The skin depth was calculated
according to the resistance of thin-film Fe3O4 samples recorded at zero field during
magnetoresistive measurements (see section 7.2.6).
A representative graph of the skin depth of Fe3O4 thin-film samples is shown below in
Figure 6.12. The general trend is that for very thin-films of Fe3O4, the skin depth
drops off rapidly as the film thickness increases and then remains relatively constant
at approximately 3000 nm. For all thin-films the calculated skin depths are large,
being several thousand nanometres in magnitude. To put this into context, a 100 nm
thin-film of Au, with a resistivity, ρ, of 2.2 × 10⁻⁸ Ωm (and therefore a conductivity
(σ=1/ρ) of 4.5×10⁵ Ωm-1) at the same infrared frequency would have a skin depth of ~
20 nm.
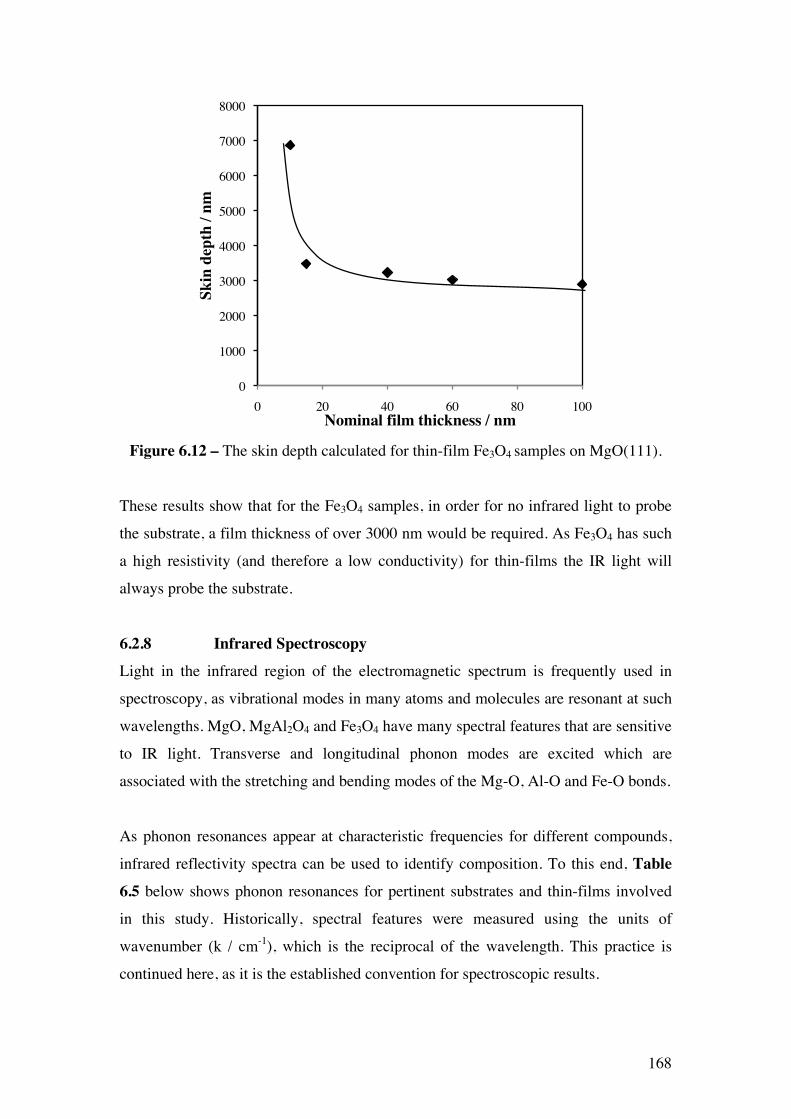
168
0
1000
2000
3000
4000
5000
6000
7000
8000
0 20 40 60 80 100
Skin
dep
th /
nm
Nominal film thickness / nm Figure 6.12 – The skin depth calculated for thin-film Fe3O4 samples on MgO(111).
These results show that for the Fe3O4 samples, in order for no infrared light to probe
the substrate, a film thickness of over 3000 nm would be required. As Fe3O4 has such
a high resistivity (and therefore a low conductivity) for thin-films the IR light will
always probe the substrate.
6.2.8 Infrared Spectroscopy Light in the infrared region of the electromagnetic spectrum is frequently used in
spectroscopy, as vibrational modes in many atoms and molecules are resonant at such
wavelengths. MgO, MgAl2O4 and Fe3O4 have many spectral features that are sensitive
to IR light. Transverse and longitudinal phonon modes are excited which are
associated with the stretching and bending modes of the Mg-O, Al-O and Fe-O bonds.
As phonon resonances appear at characteristic frequencies for different compounds,
infrared reflectivity spectra can be used to identify composition. To this end, Table 6.5 below shows phonon resonances for pertinent substrates and thin-films involved
in this study. Historically, spectral features were measured using the units of
wavenumber (k / cm-1), which is the reciprocal of the wavelength. This practice is
continued here, as it is the established convention for spectroscopic results.
169
Table 6.5 – Literature values for the various resonant phonon modes for both
substrates and thin-films.
Infrared spectra of thin-film samples were obtained in reflection using a Nicolet FTIR
spectrometer coupled to an MCT detector. The setup is housed in a purpose built CO2
scrubbed perspex chamber containing hygroscopic crystals. The full setup is
described in chapter 2, section 2.6.3. In order to remove any remaining CO2 and H2O
peaks from spectra, all IR results were normalised to the spectrum of a sputtered ~
100 nm Au film, as Au does not contain any resonances in this IR wavelength range.
Spectra for a range of Fe3O4/MgO(111) samples are below shown in Figure 6.13.
From data in Table 6.5, we can identify the appearance of an Fe3O4 peak at
approximately 540 cm-1, which increases in size with increasing film thickness. We
can confidently assign this as Fe3O4 and not α-Fe2O3 or γ -Fe2O3 due to the absence of
additional TO resonances at 437 cm-1 (α) or 440 cm-1 (γ). The magnitudes of the MgO
resonances decrease with increasing Fe3O4 film thickness. It is therefore clear that
spectra are consistent with an increasing Fe3O4 film thickness on an MgO substrate.
Phonon resonances
Material Transverse optic
modes kTO / cm-1
Longitudinal optic modes
kLO / cm-1
Reference(s)
Subrates:
MgO 401, 640 729 54, 55
MgAl2O4 485, 670 630, 855 56-58
Thin-films:
FeO 290 535 59
α-Fe2O3 299, 437, 526, 524 414, 494, 662 18, 60-62
γ-Fe2O3 440, 550 453, 572 19, 61, 63
Fe3O4 330, 540 576 19, 61, 63, 64
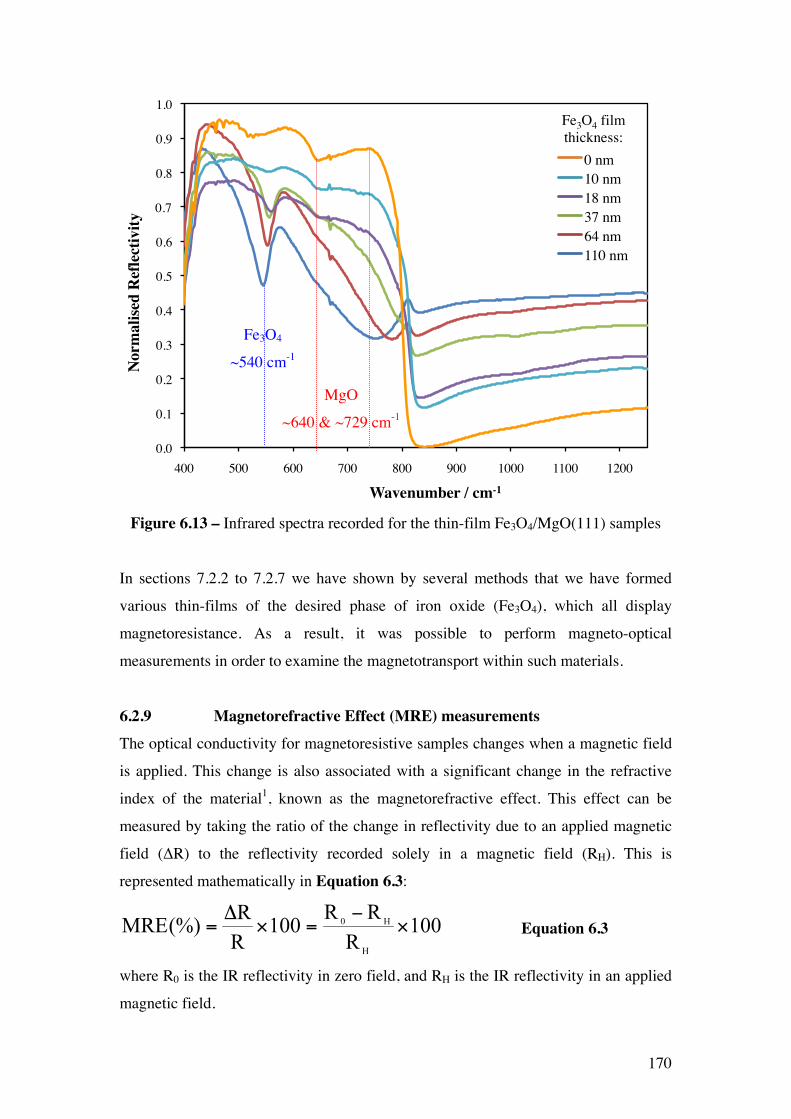
170
0.0
0.1
0.2
0.3
0.4
0.5
0.6
0.7
0.8
0.9
1.0
400 500 600 700 800 900 1000 1100 1200
Nor
mal
ised
Ref
lect
ivity
Wavenumber / cm-1
Figure 6.13 – Infrared spectra recorded for the thin-film Fe3O4/MgO(111) samples
In sections 7.2.2 to 7.2.7 we have shown by several methods that we have formed
various thin-films of the desired phase of iron oxide (Fe3O4), which all display
magnetoresistance. As a result, it was possible to perform magneto-optical
measurements in order to examine the magnetotransport within such materials.
6.2.9 Magnetorefractive Effect (MRE) measurements The optical conductivity for magnetoresistive samples changes when a magnetic field
is applied. This change is also associated with a significant change in the refractive
index of the material1, known as the magnetorefractive effect. This effect can be
measured by taking the ratio of the change in reflectivity due to an applied magnetic
field (∆R) to the reflectivity recorded solely in a magnetic field (RH). This is
represented mathematically in Equation 6.3:
Equation 6.3
where R0 is the IR reflectivity in zero field, and RH is the IR reflectivity in an applied
magnetic field.
0 nm 10 nm 18 nm 37 nm 64 nm 110 nm
Fe3O4 film thickness:
Fe3O4
~540 cm-1
MgO
~640 & ~729 cm-1
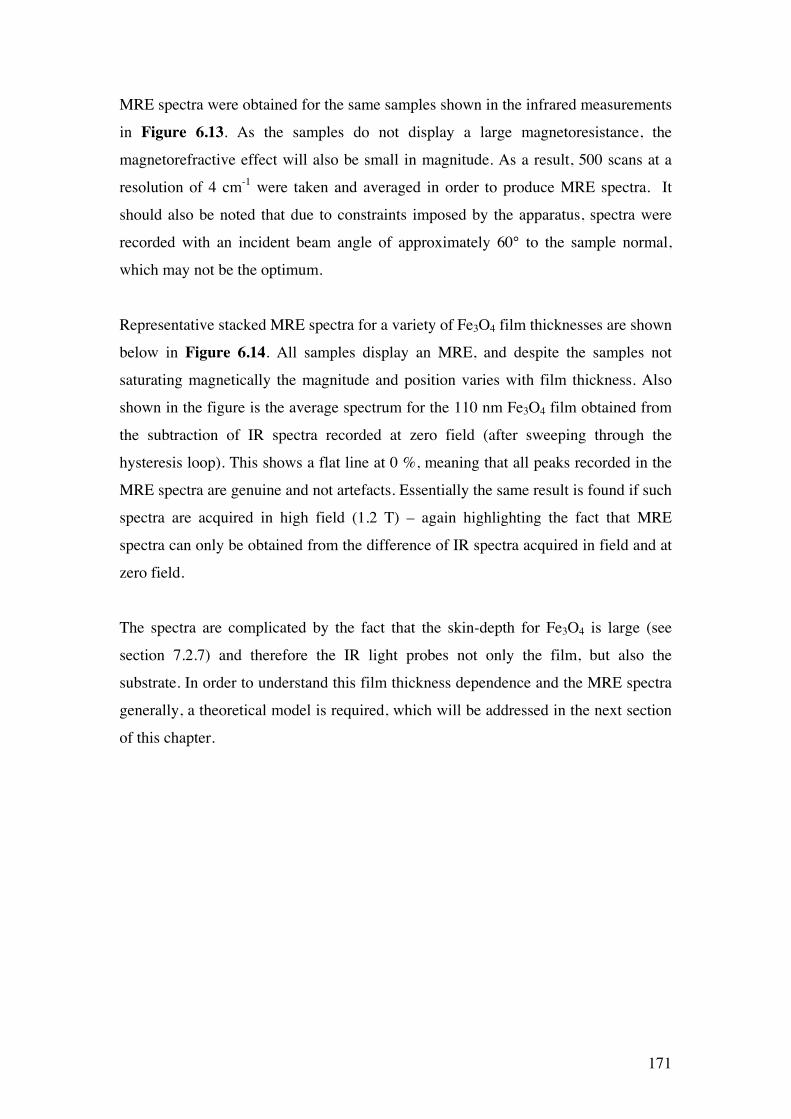
171
MRE spectra were obtained for the same samples shown in the infrared measurements
in Figure 6.13. As the samples do not display a large magnetoresistance, the
magnetorefractive effect will also be small in magnitude. As a result, 500 scans at a
resolution of 4 cm-1 were taken and averaged in order to produce MRE spectra. It
should also be noted that due to constraints imposed by the apparatus, spectra were
recorded with an incident beam angle of approximately 60° to the sample normal,
which may not be the optimum.
Representative stacked MRE spectra for a variety of Fe3O4 film thicknesses are shown
below in Figure 6.14. All samples display an MRE, and despite the samples not
saturating magnetically the magnitude and position varies with film thickness. Also
shown in the figure is the average spectrum for the 110 nm Fe3O4 film obtained from
the subtraction of IR spectra recorded at zero field (after sweeping through the
hysteresis loop). This shows a flat line at 0 %, meaning that all peaks recorded in the
MRE spectra are genuine and not artefacts. Essentially the same result is found if such
spectra are acquired in high field (1.2 T) – again highlighting the fact that MRE
spectra can only be obtained from the difference of IR spectra acquired in field and at
zero field.
The spectra are complicated by the fact that the skin-depth for Fe3O4 is large (see
section 7.2.7) and therefore the IR light probes not only the film, but also the
substrate. In order to understand this film thickness dependence and the MRE spectra
generally, a theoretical model is required, which will be addressed in the next section
of this chapter.
172
450 550 650 750 850 950 1050 1150 1250
Stac
ked
MR
E
Wavenumber / cm-1
MRE MRE
Fe3O4 film thickness:
Figure 6.14 – Stacked MRE spectra recorded for the Fe3O4/MgO(111) samples.
6.2.10 MRE modelling The MRE for simple metallic thin-film multilayers varies linearly with film thickness.
However, as we have observed, MRE spectra for oxide thin-films is complicated by
the relatively large skin depth in such materials. As a result, MRE spectra greatly vary
with increasing film thickness. It is therefore important to model and simulate the
MRE in order to understand not only the thickness variation, but also to examine the
various conductivity mechanisms present within such materials.
6.2.10.1 The complex dielectric function The optical properties of any given material are determined by its complex dielectric
function, ε(ω). A simple theoretical model of the MRE of a given system can
therefore be constructed by determining the form of the complex dielectric function65.
173
6.2.10.2 The Drude model For a metallic system, the complex dielectric function, ε(ω) varies linearly with the
frequency-dependent conductivity, σ(ω) according to the Drude (free electron)
relation66, as shown below.
Equation 6.4
where ω is the frequency of the incident radiation, ε0 is the permittivity of free space
(8.85 × 10⁻¹² F m-1) and ε(∞) is the high frequency response (ω = ∞) of the dielectric
function to optical excitation of frequency ω. ε(∞) is therefore a constant which is
material specific.
6.2.10.3 Plasma frequency The natural frequency of oscillation of electrons in a plasma displaced relative to the
ion background is known as the plasma frequency, ωp. This frequency determines
whether or not waves can propagate in the medium. If ω < ωp then waves can not
propagate and incident waves of lower frequency than the plasma frequency will be
reflected.
We can express Equation 6.4 in terms of this plasma frequency67, 68:
Equation 6.5
where γ is a damping term.
Infrared (IR) light has a frequency lower than the plasma frequency, and is therefore
reflected. This forms the basis of an MRE experiment; which uses IR light to probe
the changes in the reflectivity of the sample when an external magnetic field is
applied.
The plasma frequency is directly related to the number of free carriers (N) and can be
described according to the following relationship:
Equation 6.6
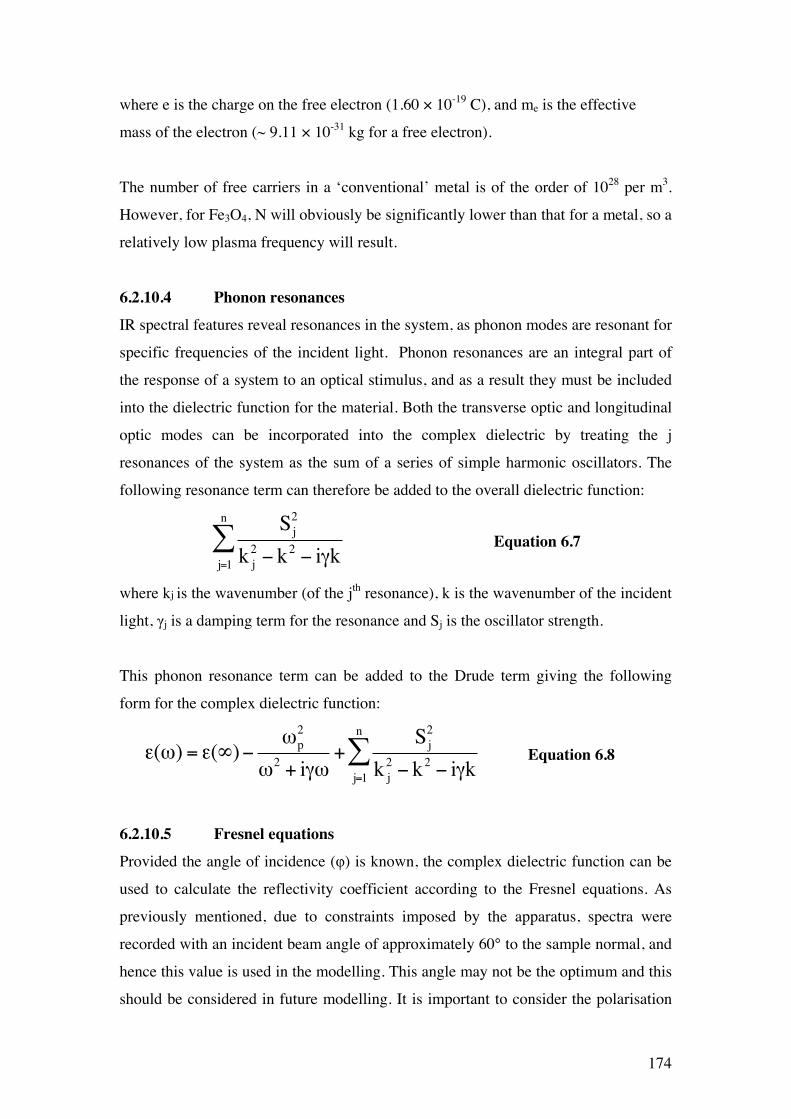
174
where e is the charge on the free electron (1.60 × 10⁻¹⁹ C), and me is the effective
mass of the electron (~ 9.11 × 10⁻³¹ kg for a free electron).
The number of free carriers in a ‘conventional’ metal is of the order of 1028 per m3.
However, for Fe3O4, N will obviously be significantly lower than that for a metal, so a
relatively low plasma frequency will result.
6.2.10.4 Phonon resonances IR spectral features reveal resonances in the system, as phonon modes are resonant for
specific frequencies of the incident light. Phonon resonances are an integral part of
the response of a system to an optical stimulus, and as a result they must be included
into the dielectric function for the material. Both the transverse optic and longitudinal
optic modes can be incorporated into the complex dielectric by treating the j
resonances of the system as the sum of a series of simple harmonic oscillators. The
following resonance term can therefore be added to the overall dielectric function:
Sj2
k j2 − k2 − iγkj=1
n
∑ Equation 6.7
where kj is the wavenumber (of the jth resonance), k is the wavenumber of the incident
light, γj is a damping term for the resonance and Sj is the oscillator strength.
This phonon resonance term can be added to the Drude term giving the following
form for the complex dielectric function:
ε(ω) = ε(∞)−ωp
2
ω2 + iγω+
Sj2
k j2 − k2 − iγkj=1
n
∑ Equation 6.8
6.2.10.5 Fresnel equations Provided the angle of incidence (φ) is known, the complex dielectric function can be
used to calculate the reflectivity coefficient according to the Fresnel equations. As
previously mentioned, due to constraints imposed by the apparatus, spectra were
recorded with an incident beam angle of approximately 60° to the sample normal, and
hence this value is used in the modelling. This angle may not be the optimum and this
should be considered in future modelling. It is important to consider the polarisation
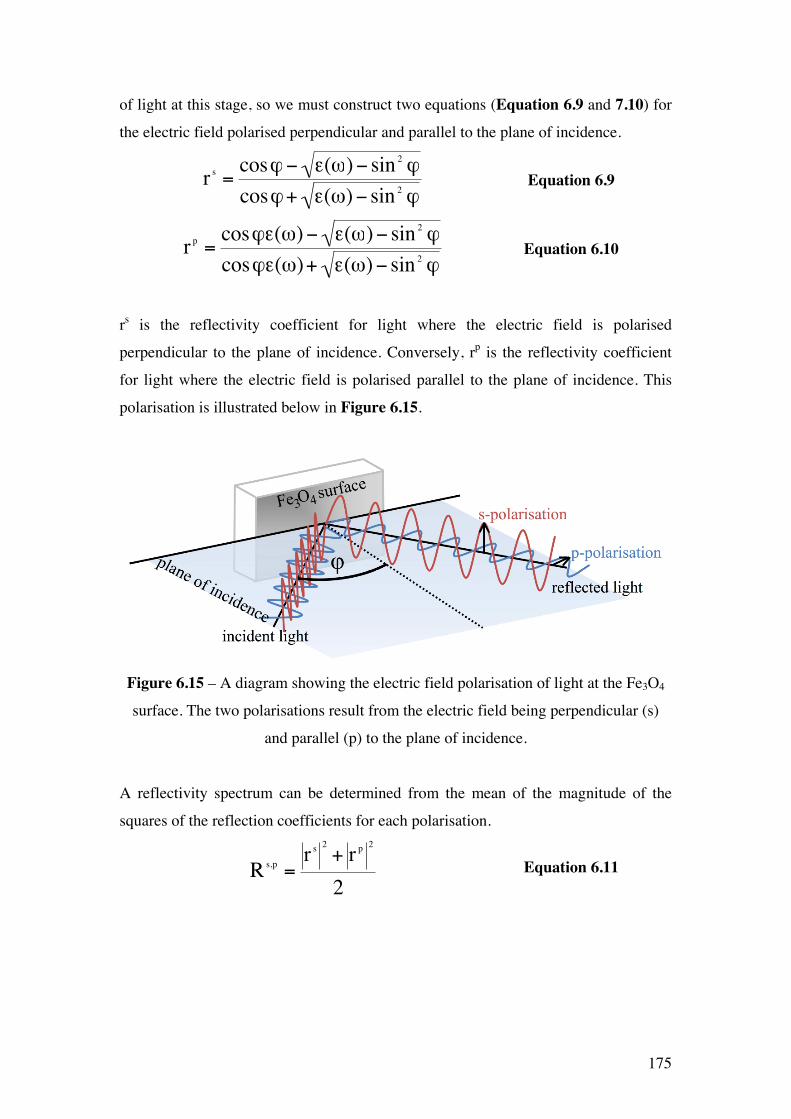
175
of light at this stage, so we must construct two equations (Equation 6.9 and 7.10) for
the electric field polarised perpendicular and parallel to the plane of incidence.
r s =cosϕ− ε(ω)− sin 2 ϕ
cosϕ+ ε(ω)− sin 2 ϕ Equation 6.9
r p =cosϕε(ω)− ε(ω)− sin 2 ϕ
cosϕε(ω)+ ε(ω)− sin 2 ϕ Equation 6.10
rs is the reflectivity coefficient for light where the electric field is polarised
perpendicular to the plane of incidence. Conversely, rp is the reflectivity coefficient
for light where the electric field is polarised parallel to the plane of incidence. This
polarisation is illustrated below in Figure 6.15.
Figure 6.15 – A diagram showing the electric field polarisation of light at the Fe3O4
surface. The two polarisations result from the electric field being perpendicular (s)
and parallel (p) to the plane of incidence.
A reflectivity spectrum can be determined from the mean of the magnitude of the
squares of the reflection coefficients for each polarisation.
Rs,p =r s 2
+ r p 2
2 Equation 6.11
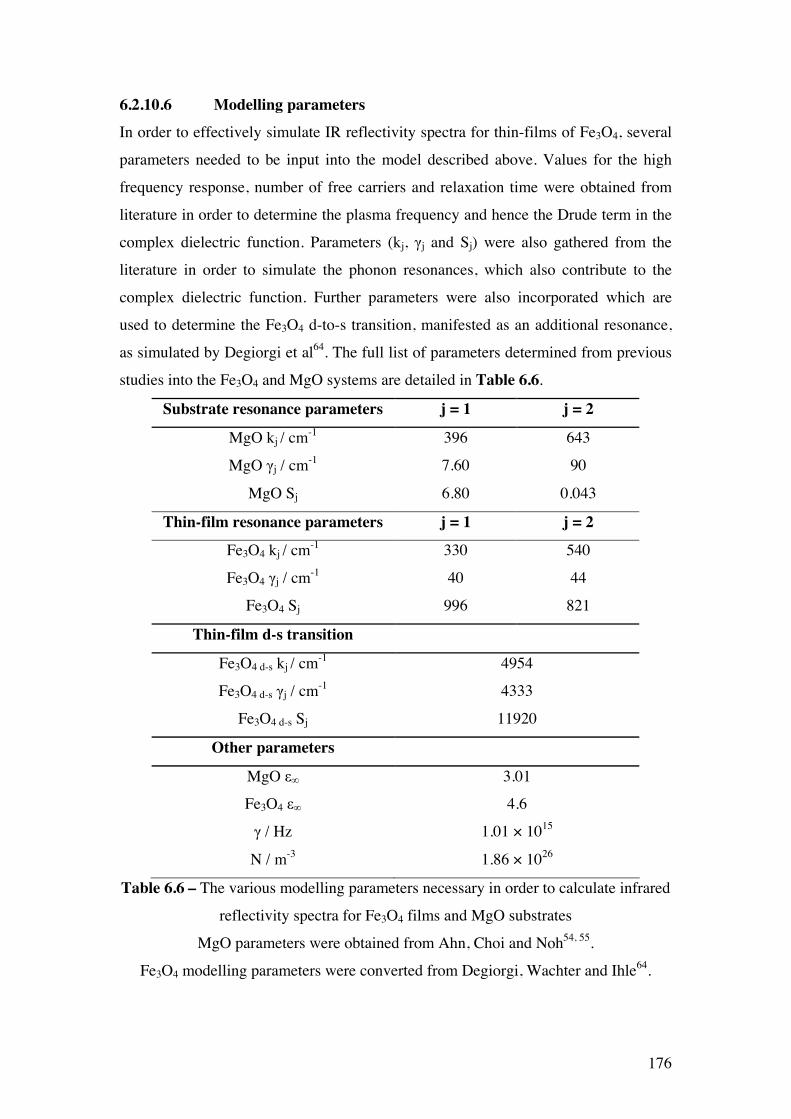
176
6.2.10.6 Modelling parameters In order to effectively simulate IR reflectivity spectra for thin-films of Fe3O4, several
parameters needed to be input into the model described above. Values for the high
frequency response, number of free carriers and relaxation time were obtained from
literature in order to determine the plasma frequency and hence the Drude term in the
complex dielectric function. Parameters (kj, γj and Sj) were also gathered from the
literature in order to simulate the phonon resonances, which also contribute to the
complex dielectric function. Further parameters were also incorporated which are
used to determine the Fe3O4 d-to-s transition, manifested as an additional resonance,
as simulated by Degiorgi et al64. The full list of parameters determined from previous
studies into the Fe3O4 and MgO systems are detailed in Table 6.6.
Table 6.6 – The various modelling parameters necessary in order to calculate infrared
reflectivity spectra for Fe3O4 films and MgO substrates
MgO parameters were obtained from Ahn, Choi and Noh54, 55.
Fe3O4 modelling parameters were converted from Degiorgi, Wachter and Ihle64.
Substrate resonance parameters j = 1 j = 2
MgO kj / cm-1 396 643
MgO γj / cm-1 7.60 90
MgO Sj 6.80 0.043
Thin-film resonance parameters j = 1 j = 2
Fe3O4 kj / cm-1 330 540
Fe3O4 γj / cm-1 40 44
Fe3O4 Sj 996 821
Thin-film d-s transition
Fe3O4 d-s kj / cm-1 4954
Fe3O4 d-s γj / cm-1 4333
Fe3O4 d-s Sj 11920
Other parameters
MgO ε∞ 3.01
Fe3O4 ε∞ 4.6
γ / Hz 1.01 × 10¹⁵
N / m-3 1.86 × 1026
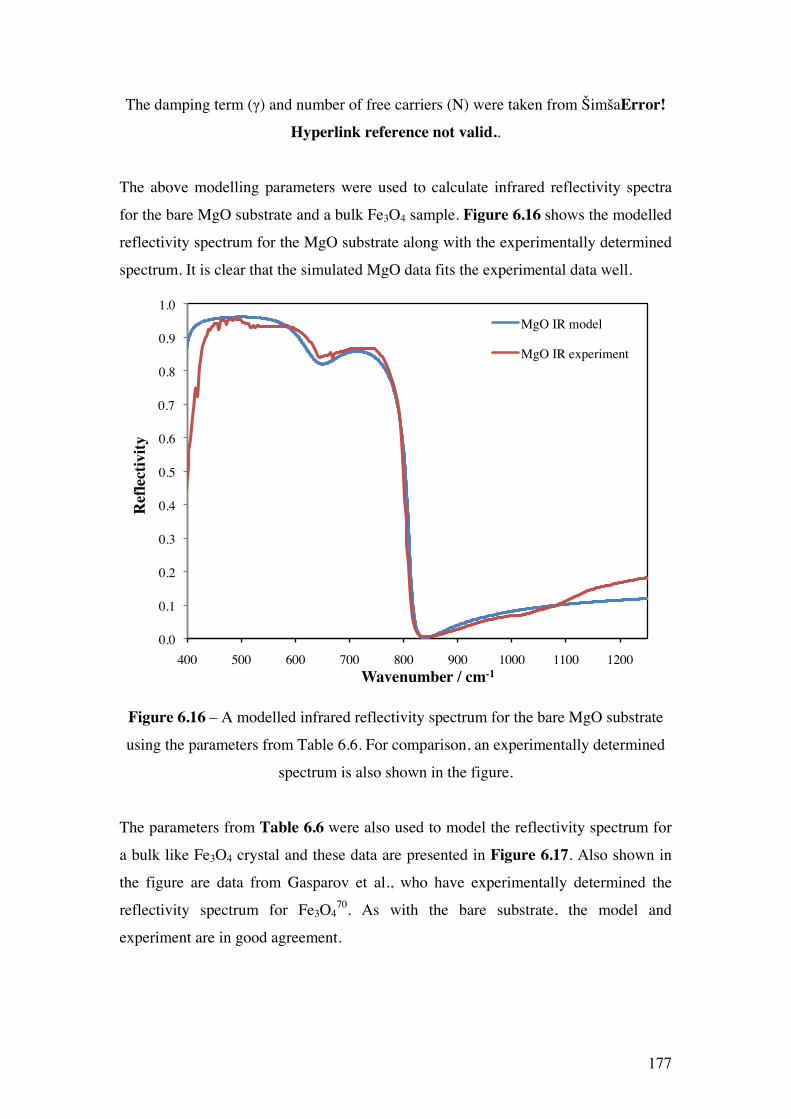
177
The damping term (γ) and number of free carriers (N) were taken from ŠimšaError! Hyperlink reference not valid..
The above modelling parameters were used to calculate infrared reflectivity spectra
for the bare MgO substrate and a bulk Fe3O4 sample. Figure 6.16 shows the modelled
reflectivity spectrum for the MgO substrate along with the experimentally determined
spectrum. It is clear that the simulated MgO data fits the experimental data well.
0.0
0.1
0.2
0.3
0.4
0.5
0.6
0.7
0.8
0.9
1.0
400 500 600 700 800 900 1000 1100 1200
Ref
lect
ivity
Wavenumber / cm-1
MgO IR model
MgO IR experiment
Figure 6.16 – A modelled infrared reflectivity spectrum for the bare MgO substrate
using the parameters from Table 6.6. For comparison, an experimentally determined
spectrum is also shown in the figure.
The parameters from Table 6.6 were also used to model the reflectivity spectrum for
a bulk like Fe3O4 crystal and these data are presented in Figure 6.17. Also shown in
the figure are data from Gasparov et al., who have experimentally determined the
reflectivity spectrum for Fe3O470. As with the bare substrate, the model and
experiment are in good agreement.
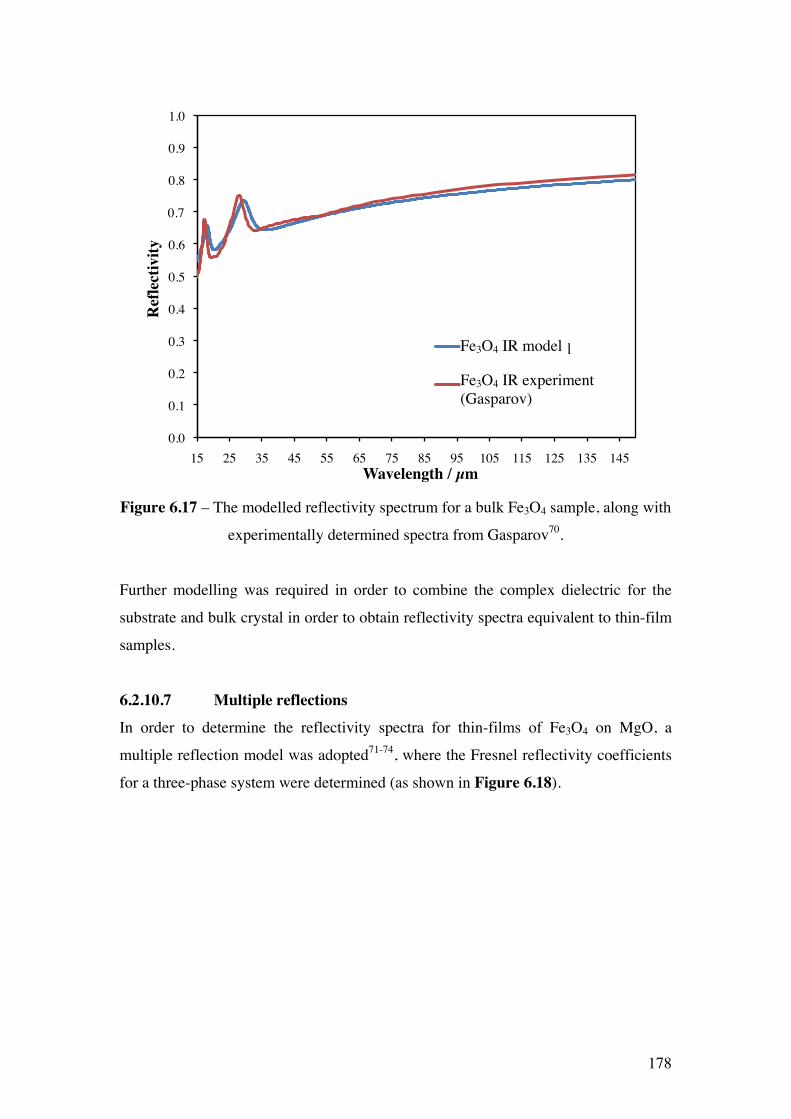
178
0.0
0.1
0.2
0.3
0.4
0.5
0.6
0.7
0.8
0.9
1.0
15 25 35 45 55 65 75 85 95 105 115 125 135 145
Ref
lect
ivity
Wavelength / µm
Fe3O4 IR model
Fe3O4 IR experiment (Gasparov)
Figure 6.17 – The modelled reflectivity spectrum for a bulk Fe3O4 sample, along with
experimentally determined spectra from Gasparov70.
Further modelling was required in order to combine the complex dielectric for the
substrate and bulk crystal in order to obtain reflectivity spectra equivalent to thin-film
samples.
6.2.10.7 Multiple reflections In order to determine the reflectivity spectra for thin-films of Fe3O4 on MgO, a
multiple reflection model was adopted71-74, where the Fresnel reflectivity coefficients
for a three-phase system were determined (as shown in Figure 6.18).
Fe3O4 IR model
Fe3O4 IR experiment (Gasparov)
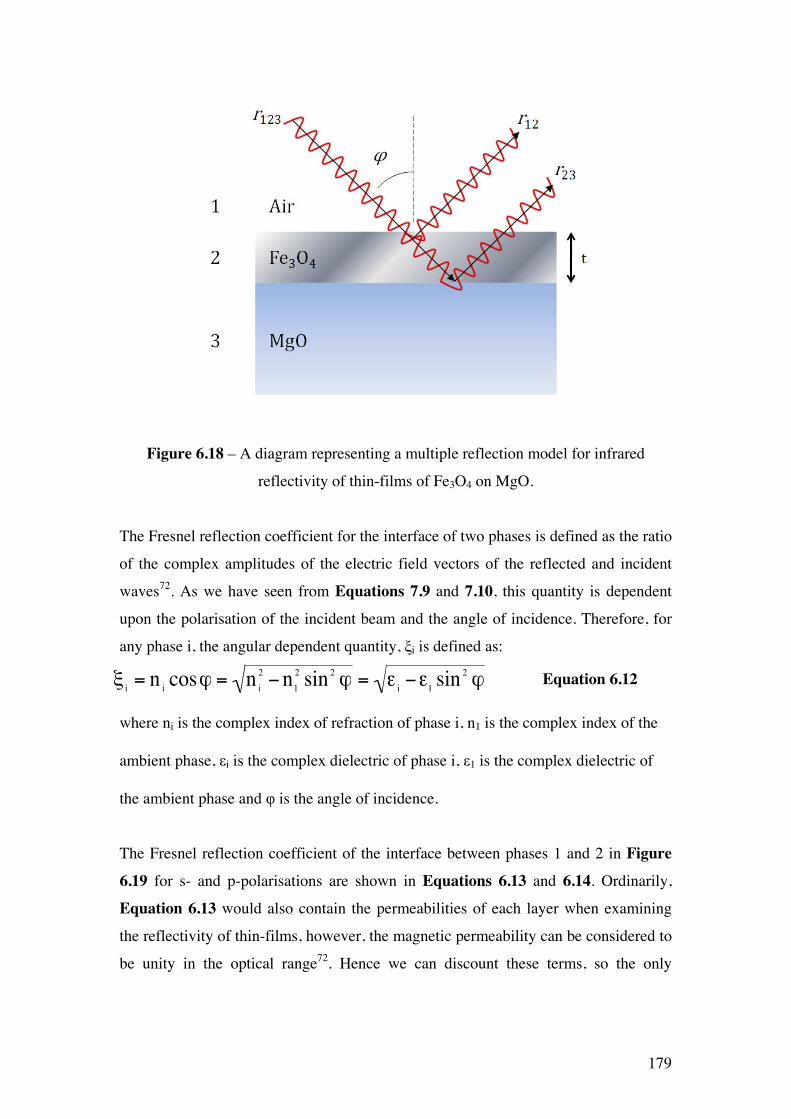
179
Figure 6.18 – A diagram representing a multiple reflection model for infrared
reflectivity of thin-films of Fe3O4 on MgO.
The Fresnel reflection coefficient for the interface of two phases is defined as the ratio
of the complex amplitudes of the electric field vectors of the reflected and incident
waves72. As we have seen from Equations 7.9 and 7.10, this quantity is dependent
upon the polarisation of the incident beam and the angle of incidence. Therefore, for
any phase i, the angular dependent quantity, ξi is defined as:
ξ i = n i cosϕ = n i2 −n1
2 sin2 ϕ = ε i −ε1 sin 2 ϕ Equation 6.12
where ni is the complex index of refraction of phase i, n1 is the complex index of the
ambient phase, εi is the complex dielectric of phase i, ε1 is the complex dielectric of
the ambient phase and φ is the angle of incidence.
The Fresnel reflection coefficient of the interface between phases 1 and 2 in Figure 6.19 for s- and p-polarisations are shown in Equations 6.13 and 6.14. Ordinarily,
Equation 6.13 would also contain the permeabilities of each layer when examining
the reflectivity of thin-films, however, the magnetic permeability can be considered to
be unity in the optical range72. Hence we can discount these terms, so the only
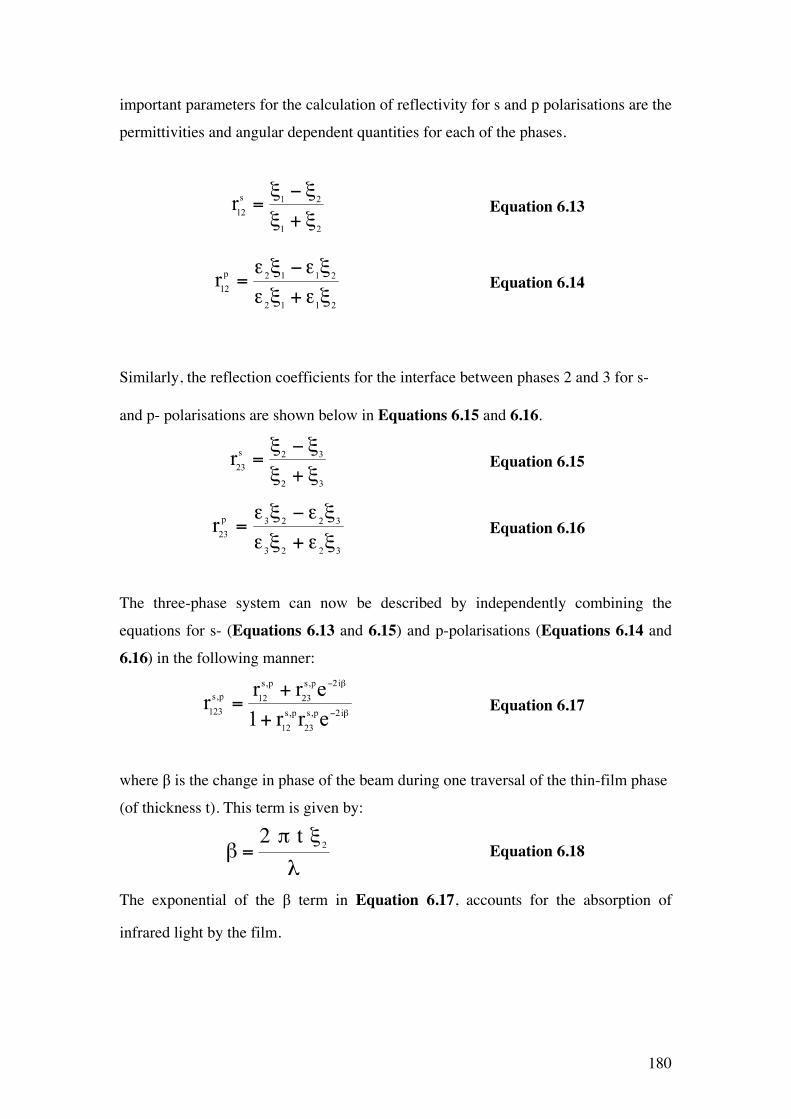
180
important parameters for the calculation of reflectivity for s and p polarisations are the
permittivities and angular dependent quantities for each of the phases.
Equation 6.13
Equation 6.14
Similarly, the reflection coefficients for the interface between phases 2 and 3 for s-
and p- polarisations are shown below in Equations 6.15 and 6.16.
Equation 6.15
Equation 6.16
The three-phase system can now be described by independently combining the
equations for s- (Equations 6.13 and 6.15) and p-polarisations (Equations 6.14 and 6.16) in the following manner:
Equation 6.17
where β is the change in phase of the beam during one traversal of the thin-film phase
(of thickness t). This term is given by:
β =2 π t ξ 2
λ Equation 6.18
The exponential of the β term in Equation 6.17, accounts for the absorption of
infrared light by the film.
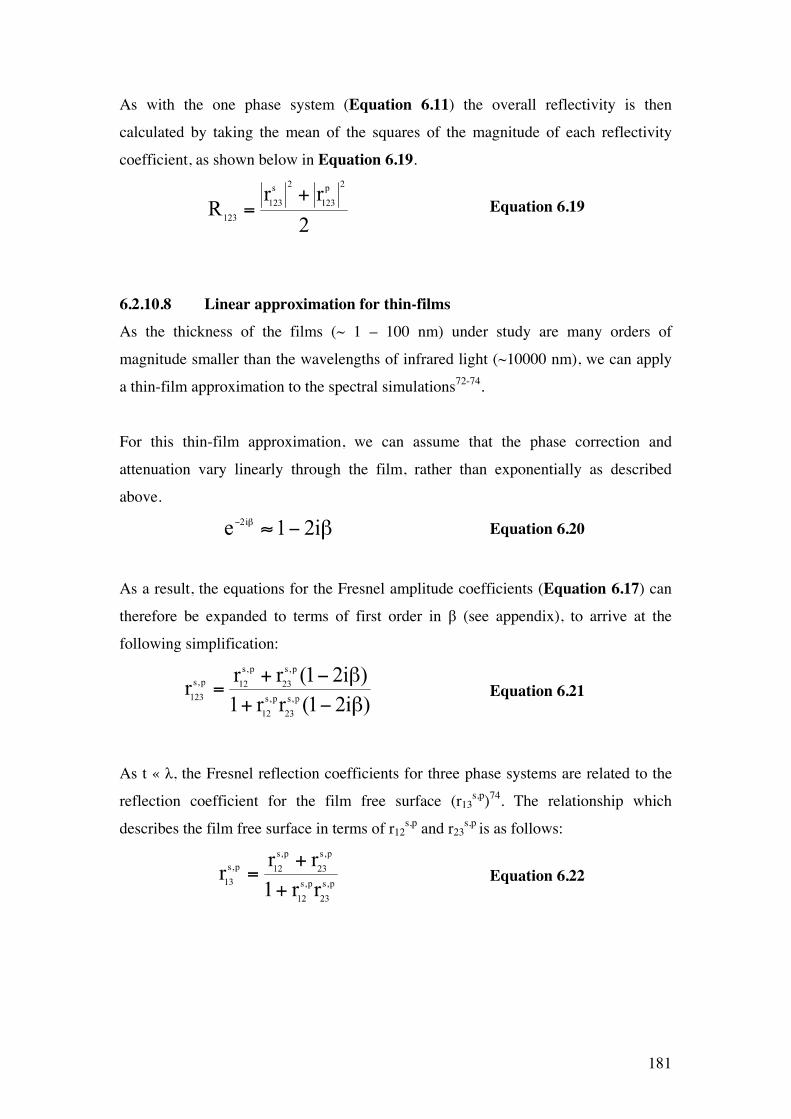
181
As with the one phase system (Equation 6.11) the overall reflectivity is then
calculated by taking the mean of the squares of the magnitude of each reflectivity
coefficient, as shown below in Equation 6.19.
Equation 6.19
6.2.10.8 Linear approximation for thin-films As the thickness of the films (~ 1 – 100 nm) under study are many orders of
magnitude smaller than the wavelengths of infrared light (~10000 nm), we can apply
a thin-film approximation to the spectral simulations72-74.
For this thin-film approximation, we can assume that the phase correction and
attenuation vary linearly through the film, rather than exponentially as described
above.
Equation 6.20
As a result, the equations for the Fresnel amplitude coefficients (Equation 6.17) can
therefore be expanded to terms of first order in β (see appendix), to arrive at the
following simplification:
Equation 6.21
As t « λ, the Fresnel reflection coefficients for three phase systems are related to the
reflection coefficient for the film free surface (r13s,p)74. The relationship which
describes the film free surface in terms of r12s,p and r23
s,p is as follows:
Equation 6.22
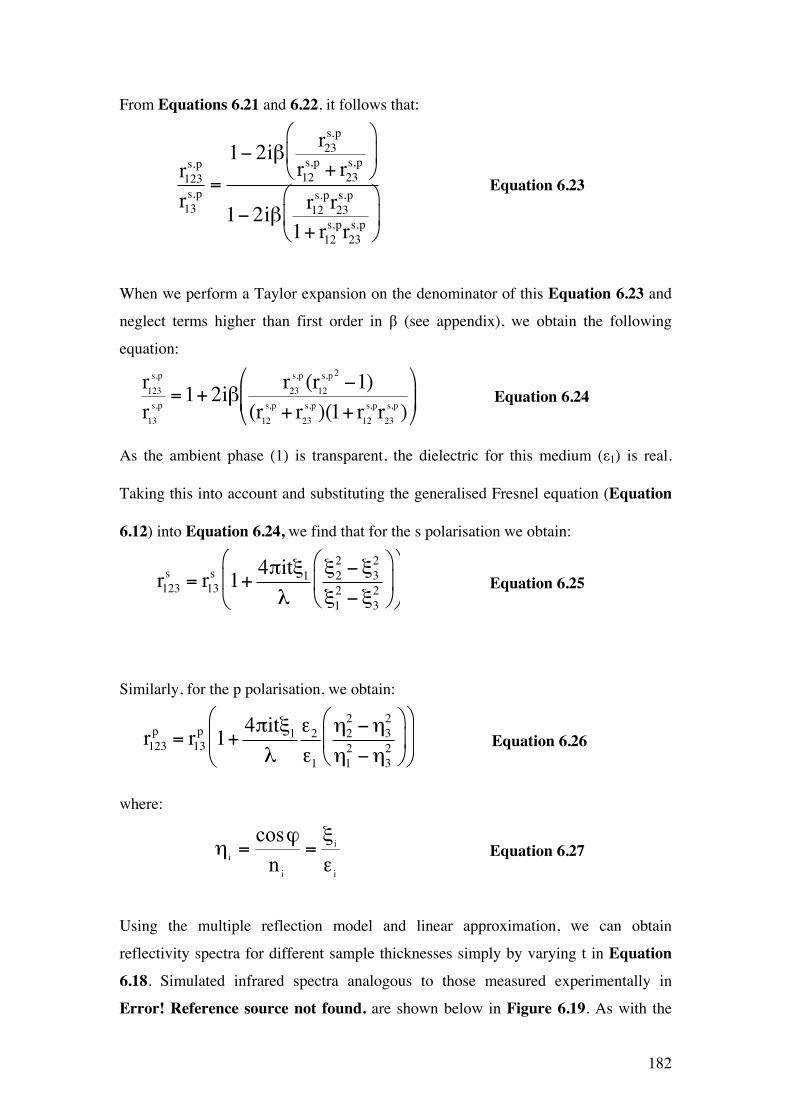
182
From Equations 6.21 and 6.22, it follows that:
r123s,p
r13s,p =
1− 2iβ r23s,p
r12s,p + r23
s,p
1− 2iβ r12s,pr23
s,p
1+ r12s,pr23
s,p
Equation 6.23
When we perform a Taylor expansion on the denominator of this Equation 6.23 and
neglect terms higher than first order in β (see appendix), we obtain the following
equation:
Equation 6.24
As the ambient phase (1) is transparent, the dielectric for this medium (ε1) is real.
Taking this into account and substituting the generalised Fresnel equation (Equation
6.12) into Equation 6.24, we find that for the s polarisation we obtain:
r123s = r13
s 1+ 4πitξ1
λξ2
2 − ξ32
ξ12 − ξ3
2
Equation 6.25
Similarly, for the p polarisation, we obtain:
r123p = r13
p 1+ 4πitξ1
λε2
ε1
η22 −η3
2
η12 −η3
2
Equation 6.26
where:
Equation 6.27
Using the multiple reflection model and linear approximation, we can obtain
reflectivity spectra for different sample thicknesses simply by varying t in Equation 6.18. Simulated infrared spectra analogous to those measured experimentally in
Error! Reference source not found. are shown below in Figure 6.19. As with the
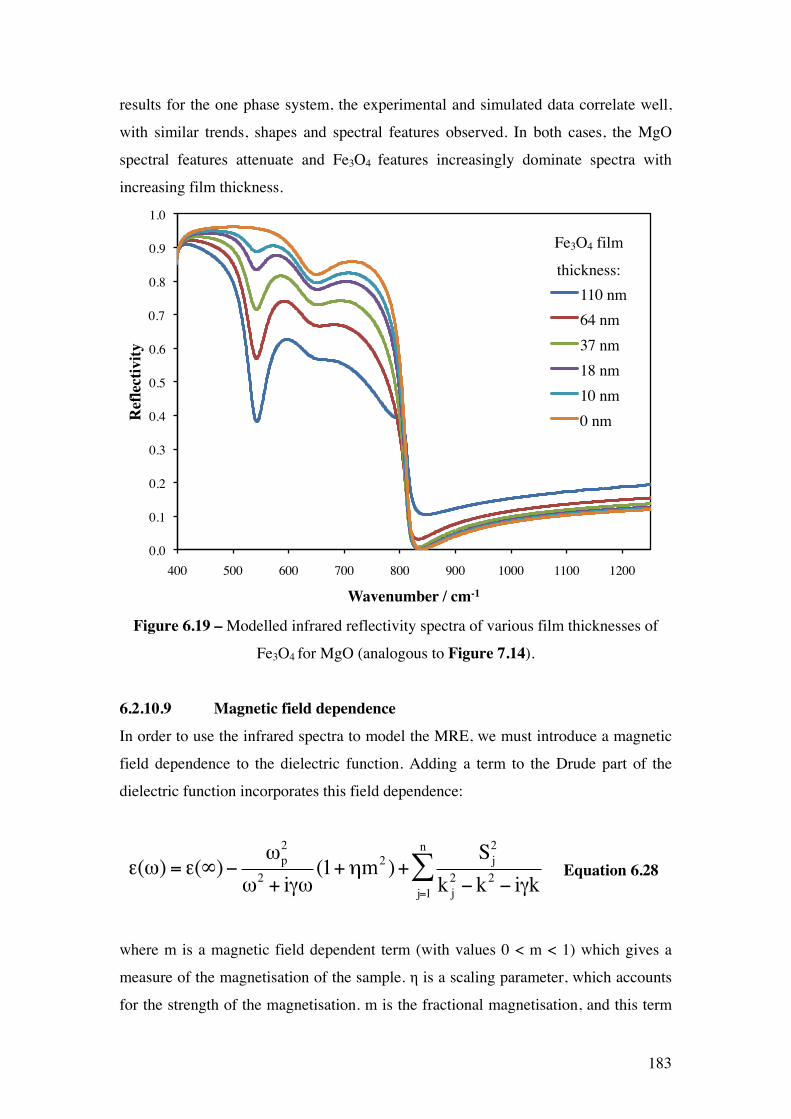
183
results for the one phase system, the experimental and simulated data correlate well,
with similar trends, shapes and spectral features observed. In both cases, the MgO
spectral features attenuate and Fe3O4 features increasingly dominate spectra with
increasing film thickness.
0.0
0.1
0.2
0.3
0.4
0.5
0.6
0.7
0.8
0.9
1.0
400 500 600 700 800 900 1000 1100 1200
Ref
lect
ivity
Wavenumber / cm-1
110 nm 64 nm 37 nm 18 nm 10 nm 0 nm
Figure 6.19 – Modelled infrared reflectivity spectra of various film thicknesses of
Fe3O4 for MgO (analogous to Figure 7.14).
6.2.10.9 Magnetic field dependence In order to use the infrared spectra to model the MRE, we must introduce a magnetic
field dependence to the dielectric function. Adding a term to the Drude part of the
dielectric function incorporates this field dependence:
ε(ω) = ε(∞)−ωp
2
ω2 + iγω(1+ηm2 )+
Sj2
k j2 − k2 − iγkj=1
n
∑ Equation 6.28
where m is a magnetic field dependent term (with values 0 < m < 1) which gives a
measure of the magnetisation of the sample. η is a scaling parameter, which accounts
for the strength of the magnetisation. m is the fractional magnetisation, and this term
Fe3O4 film
thickness:
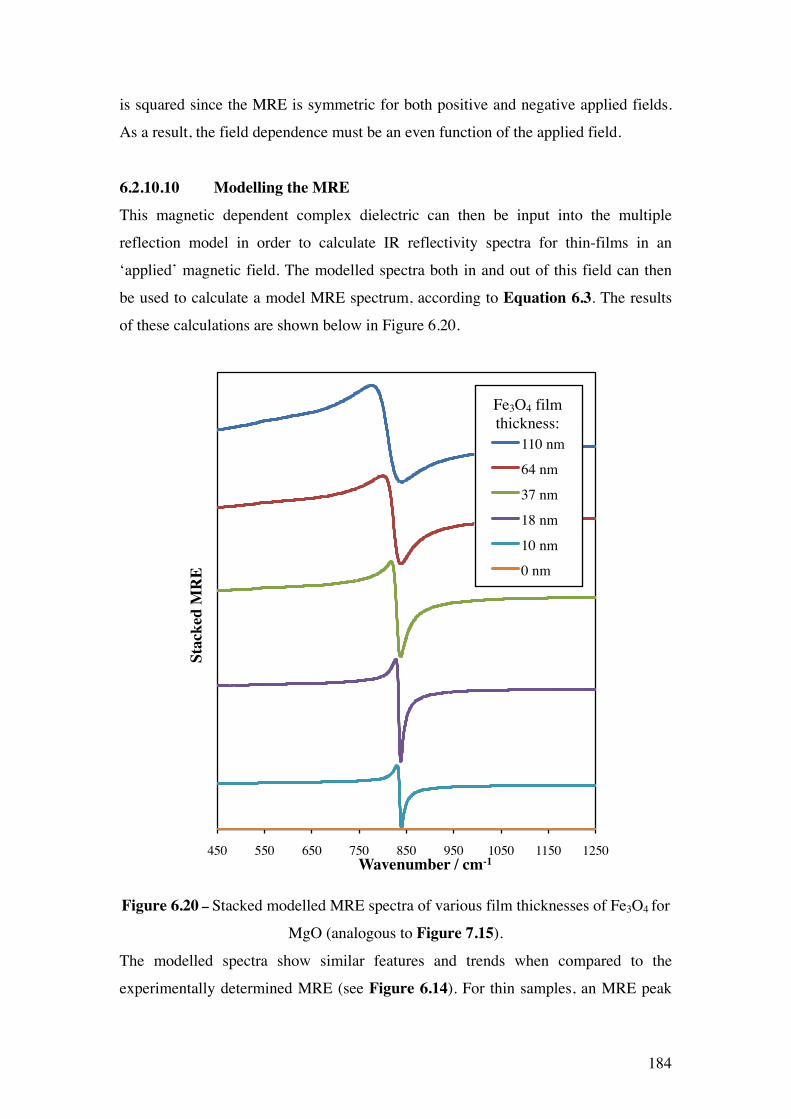
184
is squared since the MRE is symmetric for both positive and negative applied fields.
As a result, the field dependence must be an even function of the applied field.
6.2.10.10 Modelling the MRE This magnetic dependent complex dielectric can then be input into the multiple
reflection model in order to calculate IR reflectivity spectra for thin-films in an
‘applied’ magnetic field. The modelled spectra both in and out of this field can then
be used to calculate a model MRE spectrum, according to Equation 6.3. The results
of these calculations are shown below in Figure 6.20.
450 550 650 750 850 950 1050 1150 1250
Stac
ked
MR
E
Wavenumber / cm-1
110 nm
64 nm
37 nm
18 nm
10 nm
0 nm
Figure 6.20 – Stacked modelled MRE spectra of various film thicknesses of Fe3O4 for
MgO (analogous to Figure 7.15).
The modelled spectra show similar features and trends when compared to the
experimentally determined MRE (see Figure 6.14). For thin samples, an MRE peak
Fe3O4 film thickness:
185
centred around ~ 825 cm-1 is observed for both the experimental and modelled
spectra. In the experimentally determined MRE, the peaks are broader and less well
defined when compared to the modelled spectra. However, for both the experiment
and model, as the film thickness increases, the magnitude of the MRE does not
change appreciably, and the position of the MRE shifts to lower wavenumber. This
work therefore demonstrates that the thickness dependent MRE of oxide samples can
be successfully determined. With further work, it should be possible to use this
modelling to determine the various different conductivity mechanisms responsible to
the MRE and also extend the model to look at other oxide materials.
6.3 Conclusions Thin films of iron oxide on various substrates were prepared by MBE. Through
careful calibration of the growth variables (Fe deposition rate, O partial pressure and
plasma power), it was possible select the desired phase (Fe3O4). Various different
methods were used to determine the phase of iron oxide grown for all of the
calibration samples. Diffraction methods showed that certain films had a unit cell
approximately twice that of MgO42, 75, confirming the growth of Fe3O4.
XPS and other techniques were also employed to provide further evidence of Fe3O4
formation. For all the XP spectra recorded, the Fe 2p line-shape is complex and broad,
with the Fe2+ and Fe3+ states hard to resolve as they both have similar binding
energies. However, the appearance of a shake-up satellite centred around ~ 719 eV
allowed Fe3O4 / Fe2O3 to be distinguished. TEM measurements were also used to
confirm the nominal thickness of samples and also showed that the Fe3O4 films grown
were epitaxial and contained APBs.
VSM measurements allowed the magnetic properties of the thin-films to be probed.
The shapes of the hysteresis curves imply that samples do not contain multiple phases
of iron oxide. All samples also showed similar trends in coercivity and remanence.
The coercivity values were compared to literature values and showed that no Fe or
FeO was present within samples. Samples did not saturate by ~ 2 T, an observation
also seen in the literature for thin-films of Fe3O433.
186
MR measurements were performed on all Fe3O4 samples. All samples displayed a
similar MR value (~ 1 %) at ~ 1 T, thought to arise from the fact that samples require
high fields in order for saturation to occur. For comparison, other calibration samples
corresponding to iron oxide phases other than Fe3O4 were measured and displayed no
MR. IR spectroscopy and MRE was then employed for non-destructive measurement
of both the composition and the MR of the thin-films. IR confirmed the formation of
Fe3O4, due to the presence of a peak at ~ 540 cm-1. It was possible to exclude the
presence of α-Fe2O3 or γ-Fe2O3 in samples due to the absence of resonances at 437
cm-1 (α) or 440 cm-1 (γ). The MRE was discovered to display a thickness dependence,
due to the large skin depth of the Fe3O4.
As a result of the thickness dependent nature of the MRE, simulations based on the
Fresnel equations were carried out in order to model the infrared reflectivity and
MRE. A multiple reflection model was adopted in order to simulate the reflectivity of
a three-phase system. As the thickness of the film was much less than the wavelength
of light, a linear approximation was employed in order to simplify the simulation. The
resulting infrared spectra showed good agreement with the experimental data. By
incorporating a magnetic field dependent term into the complex dielectric function, it
was possible to generate a reflectivity in an ‘applied magnetic field’. From this data,
MRE spectra were obtained, which show similar features and trends when compared
to the experimentally determined spectra. Future work in the group will focus on
using this model to examine the different conductivity mechanisms responsible for the
MRE in Fe3O4. It should also be possible to extend the model to look at other oxide
materials.
6.4 References 1. J. Jaquet and T. Valet, Magnetic Ultrathin Films, Multilayers and Surfaces,
MRS Symposia Proceedings, 1995, 348, 477.
2. R. Mennicke, D. Bozec, V. Kravets, M. Vopsaroiu, J. Matthew and S.
Thompson, Journal of Magnetism and Magnetic Materials, 2006, 303, 92-
110.
3. V. G. Kravets, D. Bozec, J. A. D. Matthew, S. M. Thompson, H. Menard, A.
B. Horn and A. F. Kravets, Physical Review B, 2002, 65, 054415.
187
4. M. Gester, A. Schlapka, R. A. Pickford, S. M. Thompson, J. P. Camplin, J. K.
Eve and E. M. McCash, Journal of Applied Physics, 1999, 85, 5045-5047.
5. J. P. Camplin, S. M. Thompson, D. R. Loraine, D. I. Pugh, J. F. Collingwood,
E. M. McCash and A. B. Horn, Journal of Applied Physics, 2000, 87, 4846-
4848.
6. M. Vopsaroiu, J. Matthew, K. McNeill and S. Thompson, IEEE Transactions
on Magnetics, 2003, 39.
7. R. F. Marques, P. R. Abernethy, J. A. Matthew, C. O. Paiva-Santos, L.
Perazolli, M. J. Jr and S. M. Thompson, Journal of Magnetism and Magnetic
Materials, 2004, 272-276, 1740-1741.
8. M. Vopsaroiu, D. Bozec, J. Matthew, S. Thompson, C. Marrows and M.
Perez, Physical Review B, 2004, 70, 214423.
9. G. F. Dionne, Magnetic Oxides, Springer, 2009.
10. A. Ney, M. Opel, T. Kaspar, V. Ney, S. Ye, K. Ollefs, T. Kammermeier, S.
Bauer, K.-W. Nielsen, S. T. B. Goennenwein, M. H. Engelhard, S. Zhou, K.
Potzger, J. Simon, W. Mader, S. M. Heald, J. C. Cezar, F. Wilhelm, A.
Rogalev, R. Gross and S. Chambers, New Journal of Physics, 2010, 12,
013020.
11. M. Calderón and S. D. Sarma, Annals of Physics, 2007, 322, 2618-2634.
12. J. Coey, Current Opinion in Solid State and Materials Science, 2006, 10, 83-
92.
13. S. Pearton, W. Heo, M. Ivill, D. P. Norton and T. Steiner, Semicond. Sci.
Technol., 2004, 19, R59-R74.
14. S. Matar, Progress in solid state chemistry, 2003, 31, 239-299.
15. M. Ziese, Reports on Progress in Physics, 2002, 65, 143.
16. H. Yamada, Y. Ogawa, Y. Ishii, H. Sato, M. Kawasaki, H. Akoh and Y.
Tokura, Science, 2004, 305, 646-648.
17. A. Gupta and J. Sun, Journal of magnetism and magnetic materials, 1999,
200, 24-43.
18. R. Arras, L. Calmels and B. Warot-Fonrose, Physical Review B, 2010, 81,
104422.
19. D. Venkateshvaran, M. Althammer, A. Nielsen, S. Geprags, M. S. R. Rao, S.
T. B. Goennenwein, M. Opel and R. Gross, Physical Review B, 2009, 79,
134405.
188
20. R. Ramos, S. K. Arora and I. V. Shvets, Physical Review B, 2008, 78, 214402.
21. S. Tiwari, R. Prakash, R. Choudhary and D. M. Phase, J. Phys. D: Appl. Phys.,
2007, 40, 4943-4947.
22. A. Ramos, J.-B. Moussy, M.-J. Guittet, A. Bataille, M. Gautier-Soyer, M.
Viret, C. Gautel, P. Bayle-Guillemaud and E. Snoeck, Journal of Applied
Physics, 2006, 100, 103902.
23. I. Leonov, A. N. Yaresko, V. N. Antonov and V. I. Anisimov, Physical
Review B, 2006, 74, 165117.
24. T. Furubayashi, Journal of applied physics, 2003, 93, 8026-8028.
25. J. Tang, K. Wang and W. Zhou, Journal of Applied Physics, 2001, 89, 7693-
7695.
26. T. Taniyama and Y. Yamazaki, Journal of Applied Physics, 2001, 89, 7693.
27. A. Orozco, S. Ogale, Y. Li, P. Fournier, E. Li, H. Asano, V. Smolyaninova, R.
L. Greene, R. P. Sharma, R. Ramesh and T. Venkatesan, Physical Review
Letters, 1999, 83, 1680.
28. S. K. Park, T. Ishikawa and Y. Tokura, Physical Review B, 1998, 58, 3717.
29. L. Kalev and L. Niesen, Physical Review B, 2003, 67, 224403.
30. S. Jain, A. Adeyeye and C. Boothroyd, Journal of Applied Physics, 2005, 97,
093713.
31. G. Zhang, C. Fan, L. Pan, F. Wang, P. Wu, H. Qiu, Y. Gu and Y. Zhang,
Journal of Magnetism and Magnetic Materials, 2005, 293, 737–745.
32. A. Ramos, S. Matzen, J. Moussy, F. Ott and M. Viret, Physical Review B,
2009, 79, 014401.
33. D. Margulies, F. Parker, M. Rudee, F. Spada, J. Chapman and P. Aitchinson,
Physical Review Letters, 1997, 79, 5162-5165.
34. M. Ziese and H. Blythe, Journal of Physics: Condensed Matter, 2000, 12, 13.
35. W. Eerenstein, T. Palstra, T. Hibma and S. Celotto, Physical Review B, 2002,
66.
36. J. Coey, A. Berkowitz, L. Balcells, F. F. Putris and F. T. Parker, Applied
Physics Letters, 1998, 72, 734-736.
37. W. Eerenstein, T. T. M. Palstra, S. S. Saxena and T. Hibma, Physical Review
Letters, 2002, 88, 247204(247204).
189
38. J. Moussy, S. Gota, A. Bataille, M. Guittet, M. Gautier-Soyer, F. Delille, B.
Dieny, F. Ott, T. Doan, P. Warin, P. Bayle-Guillemaud, C. Gatel and E.
Snoeck, Physical Review B, 2004, 70, 174448(174449).
39. W. Eerenstein, University of Groningen, 2003.
40. Y. Gao, Y. Kim and S. Chambers, Journal of Materials Research, 1998, 13,
2003-2014.
41. F. Voogt, T. Palstra, L. Niesen, O. Rogojanu, M. James and T. Hibma,
Physical Review B, 1998, 57, R8107-R8110.
42. http://www.mindat.org/.
43. W. Mi, E. Jiang and H. Bai, Journal of Physics D-Applied Physics, 2009, 42,
7.
44. Y. Lu, J. Claydon, E. Ahmad, Y. B. Xu, S. M. Thompson, K. Wilson and G.
van der Laan, IEEE Transactions on Magnetics, 2005, 41, 2808-2810.
45. F. Voogt, P. Smulders, G. Wijnja, L. Niesen, T. Fujii, M. A. James and T.
Hibma, Physical Review B, 2001, 63, 125409.
46. Y. Gao and S. Chambers, Journal of Crystal Growth, 1997, 174, 446-454.
47. T. Fujii, F. De Groot, G. Sawatzky, F. Voogt, T. Hibma and K. Okada,
Physical Review B, 1999, 59, 25409(25411).
48. S. Arora, R. Sofin and I. V. Shvets, Physical Review B, 2005, 72, 134404.
49. D. Dimitrov, G. Hadjipanayis, V. Papaefthymiou and A. Simopoulos,
Magnetics, 1997, 33, 4363-4366.
50. Z. Zhou and J.-J. Yan, Journal of magnetism and magnetic materials, 1992,
115, 87-98.
51. O. Ishii, A. Terada and S. Ohta, Magnetics, 1994, 30, 1291-1295.
52. S. Ohta and A. Terada, Thin Solid Films, 1986, 143, 73-82.
53. L. Valdes, Proceedings of the IRE, 1954, 420-427.
54. J. Ahn, H. Choi and T. Noh, Physical Review B, 1996, 53, 10310.
55. H. S. Choi, J. S. Ahn, W. Jo and T. W. Noh, Journal of the Korean Physical
Society, 1995, 28, 636-644.
56. M. Striefler and S. I. Boldish, Journal of Physics C: Solid State Physics, 1978,
11, L237-L224l.
57. M. O'horo, A. Frisillo and W. White, Journal of Physics and Chemistry of
Solids, 1973, 34, 23-28.
190
58. N. Grimes, P. O'Connor and P. Thompson, Journal of Physics C: Solid State
Physics, 1978, 11, L505-L507.
59. G. Kugel, C. Carabatos, B. Hennion, B. Prevot, A. Revcolevschi and D.
Tocchetti, Physical Review B, 1977, 16.
60. C. Serna, J. Rendon and J. Iglesias, Spectrochimica Acta Part A, 1982, 38A,
797-802.
61. A. Jubb and H. C. Allen, ACS Applied Materials & Interfaces, 2010, 2, 2804-
2812.
62. S. Onari, T. Arai and K. Keiei, Physical Review B, 1977, 16.
63. T. D. Glotch and G. Rossman, Icarus, 2009, 204, 663-671.
64. L. Degiorgi, P. Wachter and D. Ihle, Physical Review B, 1987, 35, 9259-9264.
65. P. R. Abernethy, PhD. thesis, University of York, 2007, 1-253.
66. V. V. Kaichev, I. P. Prosvirin, V. I. Bukhtiyarov, H. Unterhalt, G. Rupprechter
and H.-J. Freund, Journal of Physical Chemistry B, 2003, 107, 3522-3527.
67. H. Conrad, G. Ertl, J. Koch and E. E. Latta, Surface Science, 1974, 43.
68. D. Kim and J. Honig, Physical Review B, 1994, 49, 4438.
69. Z. Šimša, physica status solidi (b), 1979, 96, 581-587.
70. L. Gasparov, D. Tanner, D. Romero, H. Berger, G. Margaritondo and L.
Forro, Physical Review B, 2000, 62, 7939-7944.
71. A. B. Winterbottom, Trans. Faraday Soc., 1946, 42, 487.
72. J. D. E. McIntyre and D. E. Aspnes, Surf. Sci., 1971, 24, 417-434.
73. J. D. E. McIntyre, Optical Reflection Spectroscopy of Chemisorbed
Monolayers, North Holland/Elsevier, 1976.
74. V. P. Tolstoy, I. V. Chernyshova and V. A. Skryshevsky, Handbook of
Infrared Spectroscopy of Ultrathin Films, Wiley-VCH, 2003.
75. R. Waldron, Physical Review, 1955, 99, 1727-1735.
191
Chapter 7
Conclusions
7.1 Conclusions
The main aim of this thesis has been to use and/or develop surface science and thin-
film techniques to assist the optimisation of functional materials. Due to their
environmental and economical importance, heterogeneous catalysts were identified as
one possible group of materials that would greatly benefit from such an approach. To
this end, the selox of crotyl alcohol to crotonaldehyde over Au/Pd(111) surface alloys
was studied using ‘Fast’ XPS at the ELETTRA synchrotron. It was found that,
unsurprisingly, no chemistry occurs over epitaxial Au overlayers, as the alcohol
simply reversibly chemisorbs. Conversely, Au-rich surface Au/Pd alloys show
moderate activity crotyl alcohol selox, as crotonaldehyde desorbs intact at room
temperature with minimal side-reactions. Pd-rich alloy surfaces convert 100 % of a
crotyl alcohol adlayer to crotonaldehyde, although as much as half of this aldehyde
subsequently decarbonylates to produce gas phase CO and propene. From these
experiments, it was determined that the optimum surface alloy composition, is
Au2Pd3, associated with a bulk alloy composition of AuPd5. These results show that
even small amounts (XAu 0.2 - 0.3) of Au can promote the selective oxidation of
crotyl alcohol whilst suppressing product decomposition.
Further work was then carried out in order to examine the chemistry of both the main
product (crotonaldehyde) and by-product (propene) formed during the selox of crotyl
alcohol over Au/Pd(111) surface alloys. In doing so, it was hoped that it would be
possible elucidate the reaction pathway for allylic alcohol selox by Au/Pd(111)
surface alloys. It was found that Au rich surface alloys are able to inhibit
decomposition of both the aldehyde (for XAu ≥ 0.3) and propene (for XAu ≥ 0.8).
Conversely, Pd rich alloy surfaces decompose both reaction intermediates, leading to
the formation of CO (solely for the aldehyde) and surface bound C; species
responsible for deactivation. In order to mimic ‘real’ selox conditions, surfaces were
then pre-saturated with O. For the aldehyde, O on Au/Pd(111) surfaces hinders the
decomposition chemistry further, with a small amount of decomposition also
192
occurring. However, propene binds more strongly to O pre-covered surfaces, which
results in an increase in the amount of propene that reacts relative to the O free
surfaces. A larger proportion of the propene therefore undergoes combustion when
compared to the aldehyde over the same surface alloys.
Insight into the adsorbate geometry of the alcohol on the Pd(111) surface has been
provided by MDS work. When the alcohol is adsorbed onto the Pd(111) substrate at
150 K, three distinct molecular features are observed due to Auger de-excitation. The
low temperature spectra were interpreted through the use of early valence band
photoemission studies1, MO calculations of gas-phase allylic alcohols2, and DFT
calculations. States within the spectra were identified which correspond to emission
from the carbon backbone of the molecule, C=C π bond and O lone-pair 2p n bonds.
As the saturated substrate was heated, between ~ 200 K and 250 K, the desired
reaction pathway predominates, generating emission from the aldehyde product
resulting in a small shift in peaks to higher binding energy. As a result of
intramolecular changes, a reversal in the assignment of the first two MOs occurs,
albeit almost coincident in energy, an observation that is supported by shifts in similar
magnitude for DFT calculations of the isolated alcohol and aldehyde. Heating the
sample above 250 K results in a decrease in the emission from both the hydrocarbon
skeleton and O n states due to decarbonylation of the aldehyde, forming propylidyne.
Heating above 500 K results in the loss of any identifiable spectral features, consistent
with propene desorption and residual C formation. The dominant de-excitation
process at this point is due to resonance ionisation, characteristic of Pd(111). DFT
calculations have also shown that the lowest energy adsorption state results when the
alcohol adsorbs parallel to the Pd surface. Experimental work confirms this, as any
large tilt in the position of the O would lead to a more pronounced feature in the MDS
spectrum when compared to emission from the C=C bond. By examining the intensity
and shapes of the MDS peaks, DOS calculations for such geometries are in good
agreement with experimental data.
In order to investigate novel magnetic materials for spintronic applications, Fe3O4
thin-films were prepared on various substrates, with the aim of examining the
relationship between the film micro-structure and properties. The composition,
193
structure and magnetic properties of all such films were characterised. Unfortunately
as such films only magnetically saturate in high fields3, MR values from all samples
were identical. Despite this, the MRE results displayed a thickness dependence, as a
result of the large skin-depths of oxide materials, a phenomena not observed for
metallic spin-valves. By modelling the complex dielectric function, it was possible to
effectively simulate the IR and MRE spectra. Both of which were in good agreement
with experimental data. With further work, it should be possible to use the MRE as an
accurate means of measuring the thickness of a thin-film. With further theoretical
work it also should be possible to probe the different conductivity mechanisms
exhibiting characteristic spectral dependences. This method could therefore be
adopted to a wide range of oxide materials of interest from a spintronics perspective.
The development and calibration of a combinatorial sputtering rig has allowed
libraries of heterogeneous catalysts (AuPd) and magnetic materials (CoAg) to be
prepared. EDX and XRF measurements show that a composition gradient exists
across both sets of samples, which accesses the bulk of each phase diagram. For
CoAg, it has been shown that the GMR also varies across the sample in accordance
with the varying composition. Further work is needed to fully optimise the properties
of these materials with full spatial resolution, which would include infrared
thermography and scanning mass spectrometry. In this basic groundwork, it has
demonstrated that combinatorial methods are potentially useful tools for aiding the
optimisation of materials.
7.2 References
1. A. Katrib and J. Rabalais, The Journal of Physical Chemistry, 1973, 77, 2358-
2363.
2. L. Klasinc, B. Ruscic, A. Sabljic and N. Trinajstic, Journal of the American
Chemical Society, 1979, 101, 7477-7482.
3. D. Margulies, F. Parker, M. Rudee, F. Spada, J. Chapman and P. Aitchinson,
Physical Review Letters, 1997, 79, 5162-5165.
194
Appendix 1 A1.1 List of Publications: James Naughton, Sarah Thompson, Vlado Lazarov, Christopher Kelley, Jim
Matthew, Adam F. Lee and Karen Wilson, “Modelling the Magnetorefractive
Effect in Thin-Films of Fe3O4 on MgO”, manuscript in preparation
James Naughton, Andrew Pratt, Charles W. Woffinden, Christopher Eames, Steve
P. Tear, Sarah M. Thompson, Adam F. Lee and Karen Wilson, “A metastable de-
excitation spectroscopy and DFT study of the selective oxidation of crotyl alcohol
over Pd(111)”, submitted to the Journal of Physical Chemistry C
Adam F. Lee, Christine V. Ellis, James Naughton, Mark A. Newton, Christopher
M. A. Parlett, and Karen Wilson, “Reaction-Driven Surface Restructuring and
Selectivity Control in Allylic Alcohol Catalytic Aerobic Oxidation over Pd”,
Journal of the American Chemical Society, 2011, 133, 5724–5727.
James Naughton, Adam F. Lee, Sarah Thompson, C. P. Vinod and Karen Wilson,
“Reactivity of crotonaldehyde and propene over Au/Pd(111) surfaces”, Physical
Chemistry Chemical Physics, 2010, 12, 2670–2678.
Adam F. Lee, Simon F.J. Hackett, Graham J. Hutchings, Silvano Lizzit, James Naughton, Karen Wilson, “In situ X-ray studies of crotyl alcohol selective
oxidation over Au/Pd(111) surface alloys”,
195
A1.2 Conferences/workshops attended:
Preparation and Patterning of Magnetic Materials Workshop - Institute of Physics
(4th November 2008)
17th Interdisciplinary Surface Science Conference (ISSC-17) - University of
Reading (30th March - 2nd April 2009)*
Magnetic Imaging and Spectroscopy Workshop - University of Leeds (10th - 11th
June 2009)
Catalysis Summer School Workshop - Liverpool (13th - 17th July 2009)*
Density Functional Methods for Experimental Spectroscopy Workshop -
University of Oxford (23rd - 27th August 2009)*
Materials Research Society (MRS) Fall Meeting - Boston (30th November - 4th
December 2009)
10th Condensed Matter and Materials Physics (CMMP 2010) - University of
Warwick (14th - 16th December 2010)*
Materials Research Society (MRS) Spring Meeting - San Francisco (25th -29th
April 2011)##
*presented a poster
#presented a talk
A1.3 Awards received:
10th Condensed Matter and Materials Physics (CMMP 2010) poster prize: “The
Magnetorefractive Effect in Thin-Films of Fe3O4/MgO (111)”
196
Appendix 2 Development of a combinatorial sputtering rig
A2.1 Introduction In chapters 3 and 4, we increased our understanding of the chemistry of crotyl
alcohol over a range of AuPd(111) surface alloys through the use of a variety of
surface science techniques. By performing many complex experiments, the
optimum surface composition of Au/Pd for this catalytic process was determined.
This process involved the preparation and characterisation of many ultrathin-films
with similar surface compositions.
Indeed, the optimisation and/or discovery of materials largely proceeds
experimentally by the serial synthesis and characterisation of a wide variety of
similar samples1. This conventional approach is prohibitively long and expensive
due to the number of iterative steps required2. This arduous approach is necessary
due largely to a poor fundamental understanding of systems with several
components, meaning our ability to predict materials with specific desirable
properties is limited2, 3.
The case of AuPd alloys for selective oxidation catalysis is but one of many
examples of materials optimisation which would greatly benefit from the
application of simultaneous preparation techniques4. This would involve vast
arrays of materials being prepared and rapidly screened for a particular property,
not only accelerating the development of many functional materials, but also
providing enormous economic benefit from a research and development point of
view.
This simultaneous synthetic preparation of large numbers of related compounds is
known as ‘Combinatorial Chemistry’5, 6, a term used predominantly in the area of
drug discovery in the pharmaceutical industry. However, this term can be more
widely applied to any preparative protocol that permits large numbers of related
compounds to be synthesised and rapidly characterised6, 7. This approach is often
also referred to as parallel synthesis or high-throughput synthesis8, 9. Indeed, many
197
classes of materials have been investigated using such a combinatorial approach2,
including catalysts9-12, optical13, 14, magnetic8, 15, and dielectric15, 16 materials,
hydrogen storage materials17, 18 and structural polymers2 to give but a few
examples.
A procedure for the preparation and characterisation of solid inorganic materials
was first outlined by means of RF plasma sputtering by Hanak in 19701. Several
other deposition methods have also been utilised for this purpose, including (but
not limited to), combinatorial laser molecular beam epitaxy (CLMBE)3, 4, pulsed
laser deposition (PLD)15, 18-22, ion beam sputter deposition22, and chemical vapour
deposition (CVD)4, 13. In this chapter, a specialised high-vacuum chamber
(combinatorial sputtering rig) was developed (as outlined in chapter 2, section
2.1.4) which allows the co-deposition of up to four different materials via DC
magnetron sputter guns, in order to prepare a composition gradient across a
substrate (as shown below in Figure A2.1).
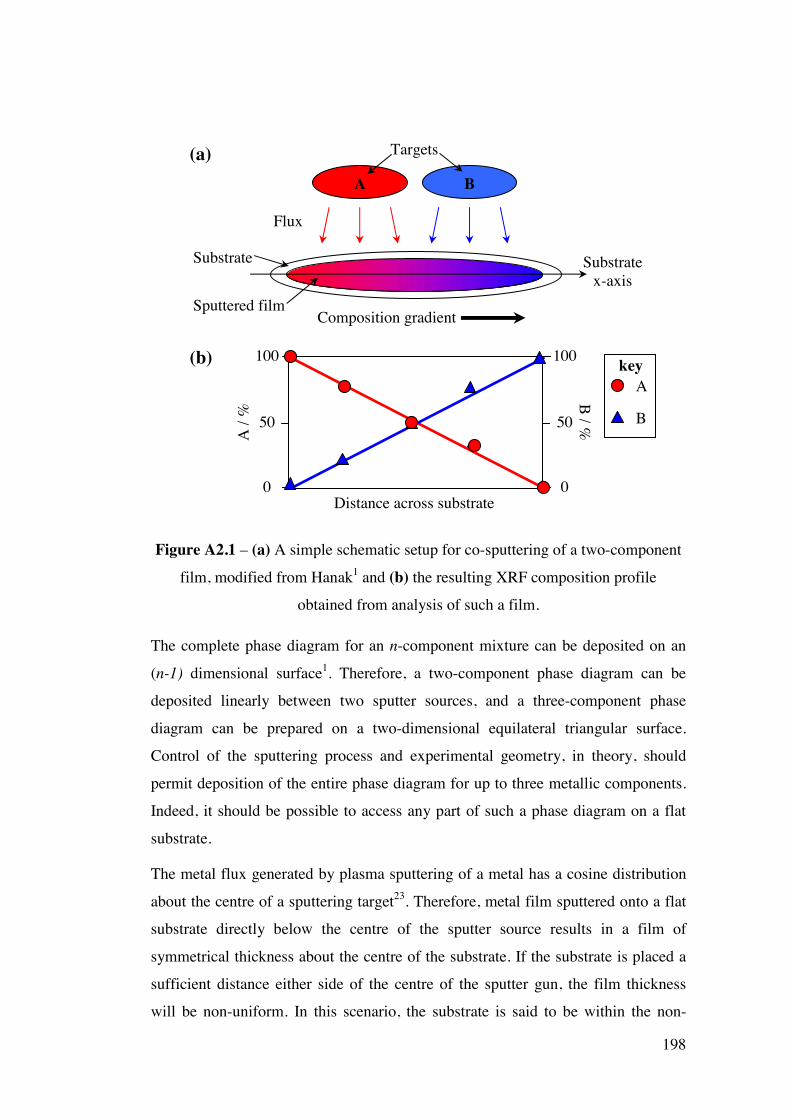
198
B / %
Figure A 2.1 – (a) A simple schematic setup for co-sputtering of a two-component
film, modified from Hanak1 and (b) the resulting XRF composition profile
obtained from analysis of such a film.
The complete phase diagram for an n-component mixture can be deposited on an
(n-1) dimensional surface1. Therefore, a two-component phase diagram can be
deposited linearly between two sputter sources, and a three-component phase
diagram can be prepared on a two-dimensional equilateral triangular surface.
Control of the sputtering process and experimental geometry, in theory, should
permit deposition of the entire phase diagram for up to three metallic components.
Indeed, it should be possible to access any part of such a phase diagram on a flat
substrate.
The metal flux generated by plasma sputtering of a metal has a cosine distribution
about the centre of a sputtering target23. Therefore, metal film sputtered onto a flat
substrate directly below the centre of the sputter source results in a film of
symmetrical thickness about the centre of the substrate. If the substrate is placed a
sufficient distance either side of the centre of the sputter gun, the film thickness
will be non-uniform. In this scenario, the substrate is said to be within the non-
A B
Flux
Targets
Substrate Substrate x-axis
Sputtered film Composition gradient
(a)
Distance across substrate
100
50
0
100
50
0
A /
%
(b) key A
B
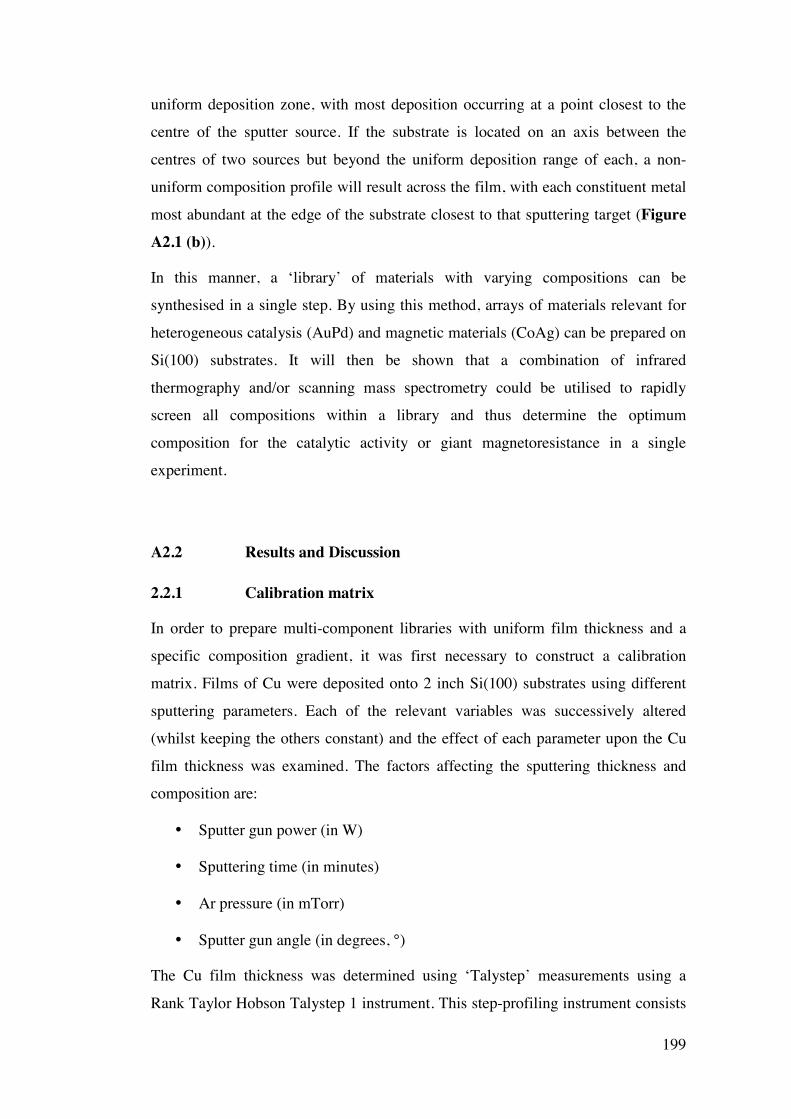
199
uniform deposition zone, with most deposition occurring at a point closest to the
centre of the sputter source. If the substrate is located on an axis between the
centres of two sources but beyond the uniform deposition range of each, a non-
uniform composition profile will result across the film, with each constituent metal
most abundant at the edge of the substrate closest to that sputtering target (Figure A 2.1 (b)).
In this manner, a ‘library’ of materials with varying compositions can be
synthesised in a single step. By using this method, arrays of materials relevant for
heterogeneous catalysis (AuPd) and magnetic materials (CoAg) can be prepared on
Si(100) substrates. It will then be shown that a combination of infrared
thermography and/or scanning mass spectrometry could be utilised to rapidly
screen all compositions within a library and thus determine the optimum
composition for the catalytic activity or giant magnetoresistance in a single
experiment.
A2.2 Results and Discussion
2.2.1 Calibration matrix
In order to prepare multi-component libraries with uniform film thickness and a
specific composition gradient, it was first necessary to construct a calibration
matrix. Films of Cu were deposited onto 2 inch Si(100) substrates using different
sputtering parameters. Each of the relevant variables was successively altered
(whilst keeping the others constant) and the effect of each parameter upon the Cu
film thickness was examined. The factors affecting the sputtering thickness and
composition are:
• Sputter gun power (in W)
• Sputtering time (in minutes)
• Ar pressure (in mTorr)
• Sputter gun angle (in degrees, °)
The Cu film thickness was determined using ‘Talystep’ measurements using a
Rank Taylor Hobson Talystep 1 instrument. This step-profiling instrument consists
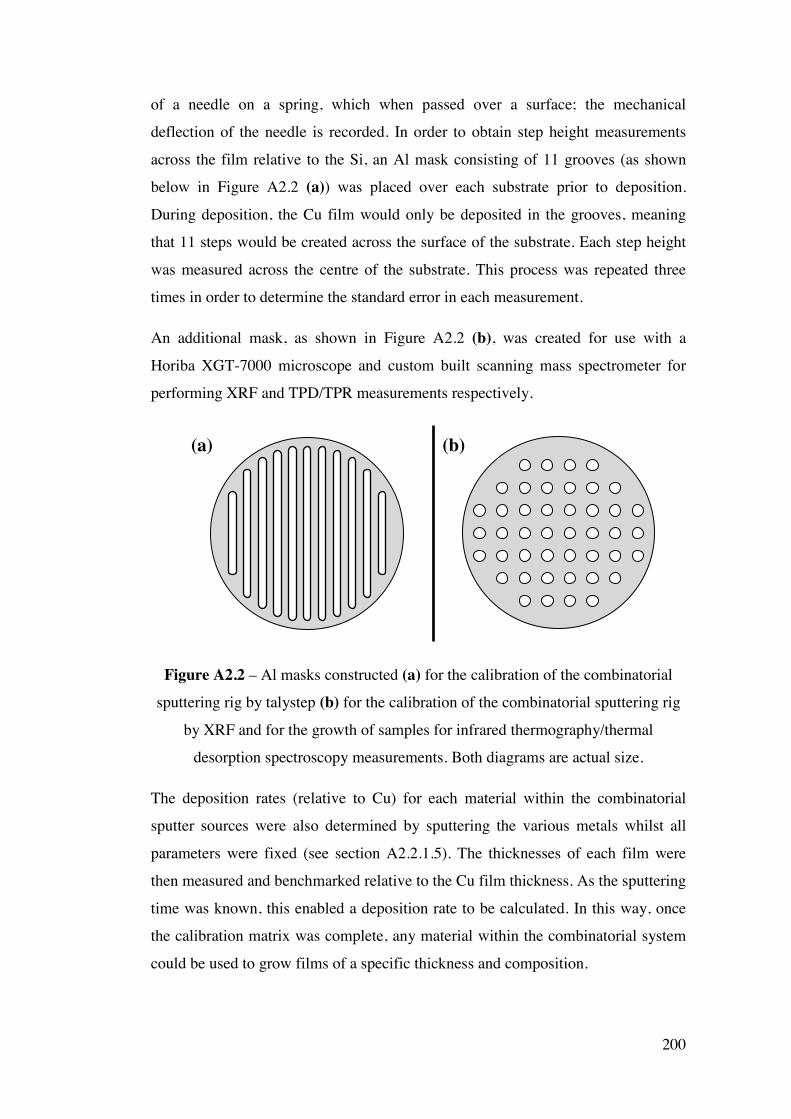
200
of a needle on a spring, which when passed over a surface; the mechanical
deflection of the needle is recorded. In order to obtain step height measurements
across the film relative to the Si, an Al mask consisting of 11 grooves (as shown
below in Figure A 2.2 (a)) was placed over each substrate prior to deposition.
During deposition, the Cu film would only be deposited in the grooves, meaning
that 11 steps would be created across the surface of the substrate. Each step height
was measured across the centre of the substrate. This process was repeated three
times in order to determine the standard error in each measurement.
An additional mask, as shown in Figure A 2.2 (b), was created for use with a
Horiba XGT-7000 microscope and custom built scanning mass spectrometer for
performing XRF and TPD/TPR measurements respectively.
Figure A 2.2 – Al masks constructed (a) for the calibration of the combinatorial
sputtering rig by talystep (b) for the calibration of the combinatorial sputtering rig
by XRF and for the growth of samples for infrared thermography/thermal
desorption spectroscopy measurements. Both diagrams are actual size.
The deposition rates (relative to Cu) for each material within the combinatorial
sputter sources were also determined by sputtering the various metals whilst all
parameters were fixed (see section A2.2.1.5). The thicknesses of each film were
then measured and benchmarked relative to the Cu film thickness. As the sputtering
time was known, this enabled a deposition rate to be calculated. In this way, once
the calibration matrix was complete, any material within the combinatorial system
could be used to grow films of a specific thickness and composition.
(a) (b)
201
2.2.1.1 Sputter Gun Power Figure A 2.3 shows the average Cu deposition rate with increasing sputter gun
power. The trend suggests that the change in deposition rate is linear with
increasing sputter gun power. As the gun power increases, so does the energy of
the Ar ions - resulting in an increase in the overall sputtering rate.
y = 0.0109x R! = 0.89797
0.00
0.20
0.40
0.60
0.80
1.00
1.20
1.40
0 20 40 60 80 100 120
Aver
age C
u D
epos
ition
rate
/ Å
s-1
Power / W
Figure A 2.3 – The change in Cu deposition rate with increasing gun power.
The error bars were calculated based upon the standard deviation and standard error
between Talystep measurements.
2.2.1.2 Sputtering time As with the gun power series, a positive linear relationship is also observed (see
Figure A 2.4). These results are not surprising, as sputtering for a longer time period
will obviously result in a thicker film. The sputtering time is therefore a very useful
factor in growing samples with a desired thickness.
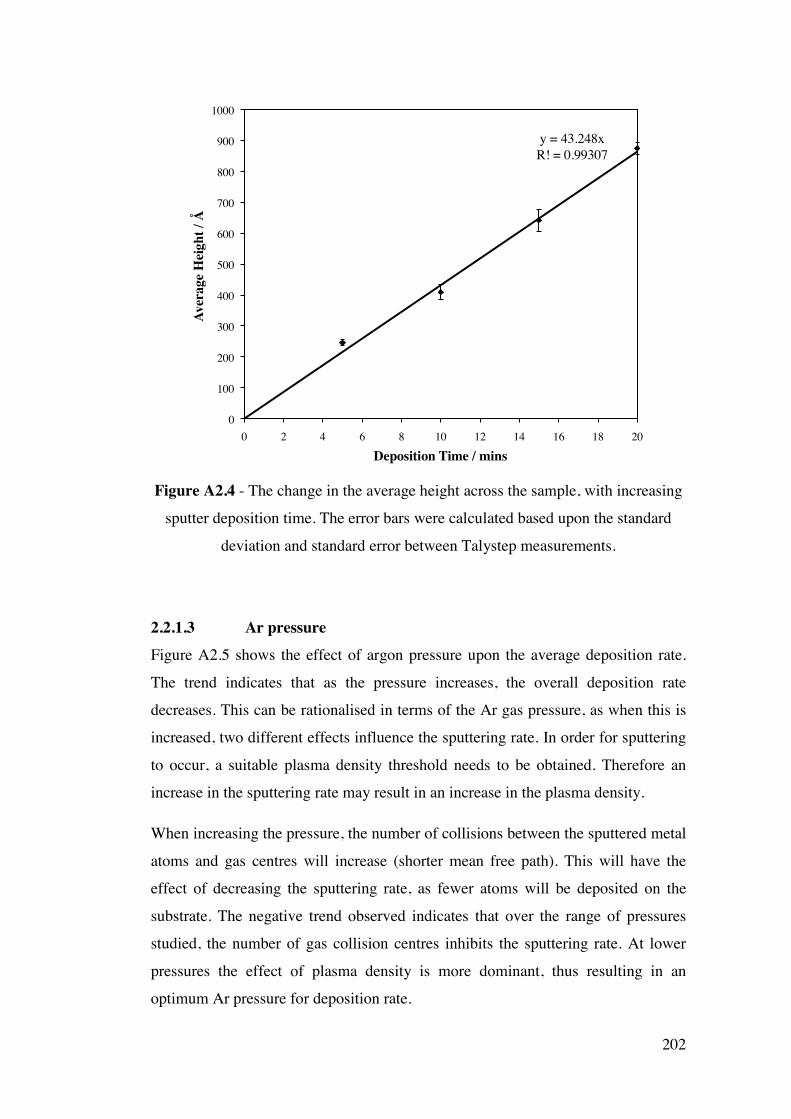
202
y = 43.248x R! = 0.99307
0
100
200
300
400
500
600
700
800
900
1000
0 2 4 6 8 10 12 14 16 18 20
Aver
age H
eigh
t / Å
Deposition Time / mins
Figure A 2.4 - The change in the average height across the sample, with increasing
sputter deposition time. The error bars were calculated based upon the standard
deviation and standard error between Talystep measurements.
2.2.1.3 Ar pressure Figure A 2.5 shows the effect of argon pressure upon the average deposition rate.
The trend indicates that as the pressure increases, the overall deposition rate
decreases. This can be rationalised in terms of the Ar gas pressure, as when this is
increased, two different effects influence the sputtering rate. In order for sputtering
to occur, a suitable plasma density threshold needs to be obtained. Therefore an
increase in the sputtering rate may result in an increase in the plasma density.
When increasing the pressure, the number of collisions between the sputtered metal
atoms and gas centres will increase (shorter mean free path). This will have the
effect of decreasing the sputtering rate, as fewer atoms will be deposited on the
substrate. The negative trend observed indicates that over the range of pressures
studied, the number of gas collision centres inhibits the sputtering rate. At lower
pressures the effect of plasma density is more dominant, thus resulting in an
optimum Ar pressure for deposition rate.
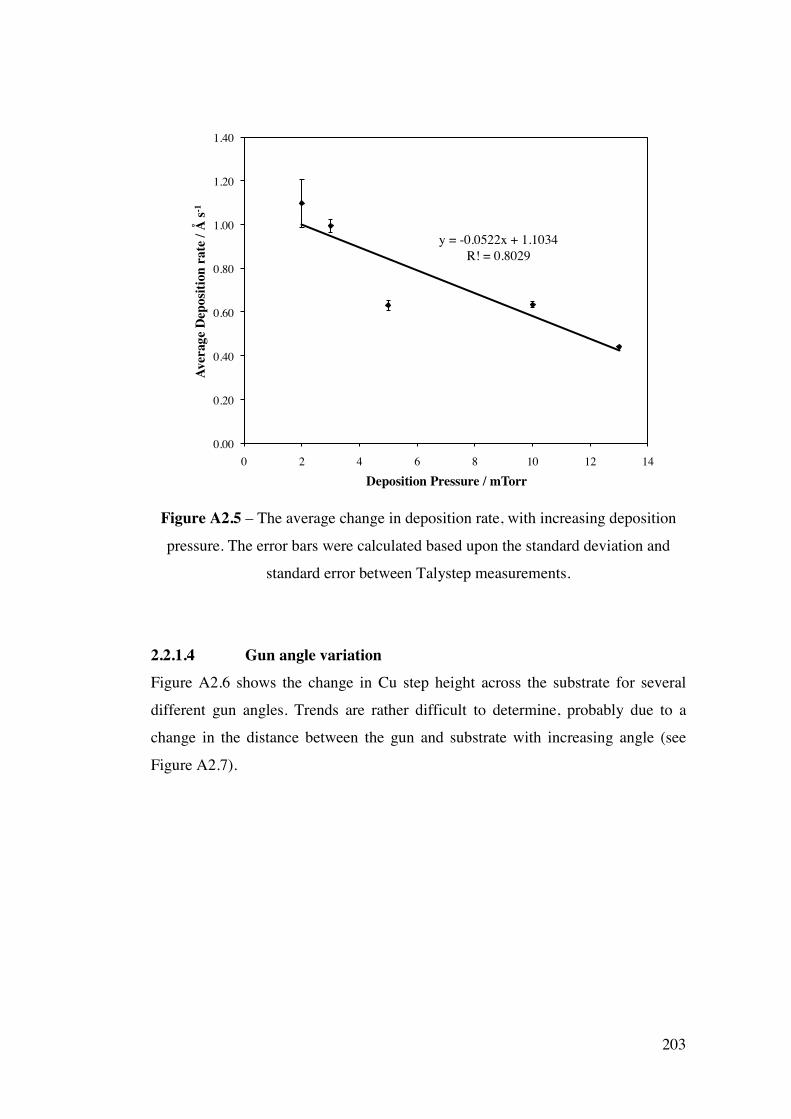
203
y = -0.0522x + 1.1034 R! = 0.8029
0.00
0.20
0.40
0.60
0.80
1.00
1.20
1.40
0 2 4 6 8 10 12 14
Aver
age
Dep
ositi
on r
ate
/ Å s-1
Deposition Pressure / mTorr
Figure A 2.5 – The average change in deposition rate, with increasing deposition
pressure. The error bars were calculated based upon the standard deviation and
standard error between Talystep measurements.
2.2.1.4 Gun angle variation Figure A 2.6 shows the change in Cu step height across the substrate for several
different gun angles. Trends are rather difficult to determine, probably due to a
change in the distance between the gun and substrate with increasing angle (see
Figure A 2.7).
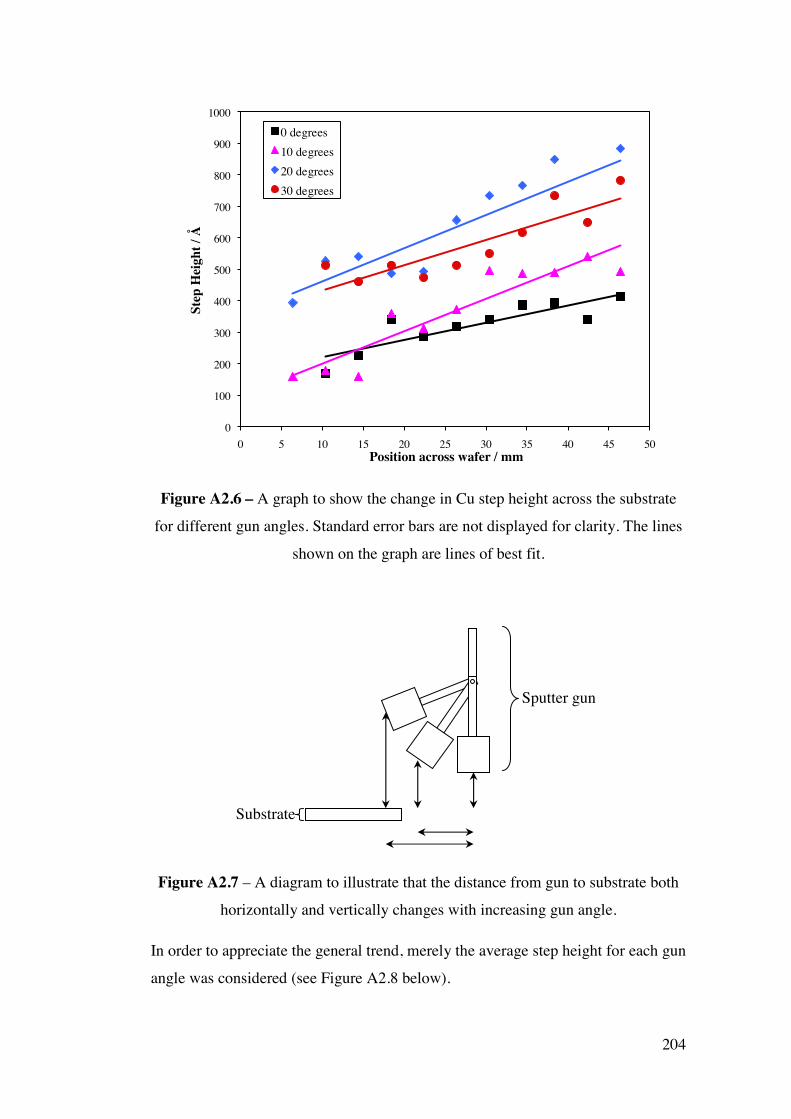
204
0
100
200
300
400
500
600
700
800
900
1000
0 5 10 15 20 25 30 35 40 45 50
Step
Hei
ght /
Å
Position across wafer / mm
0 degrees 10 degrees 20 degrees 30 degrees
Figure A 2.6 – A graph to show the change in Cu step height across the substrate
for different gun angles. Standard error bars are not displayed for clarity. The lines
shown on the graph are lines of best fit.
Figure A 2.7 – A diagram to illustrate that the distance from gun to substrate both
horizontally and vertically changes with increasing gun angle.
In order to appreciate the general trend, merely the average step height for each gun
angle was considered (see Figure A 2.8 below).
Sputter gun
Substrate
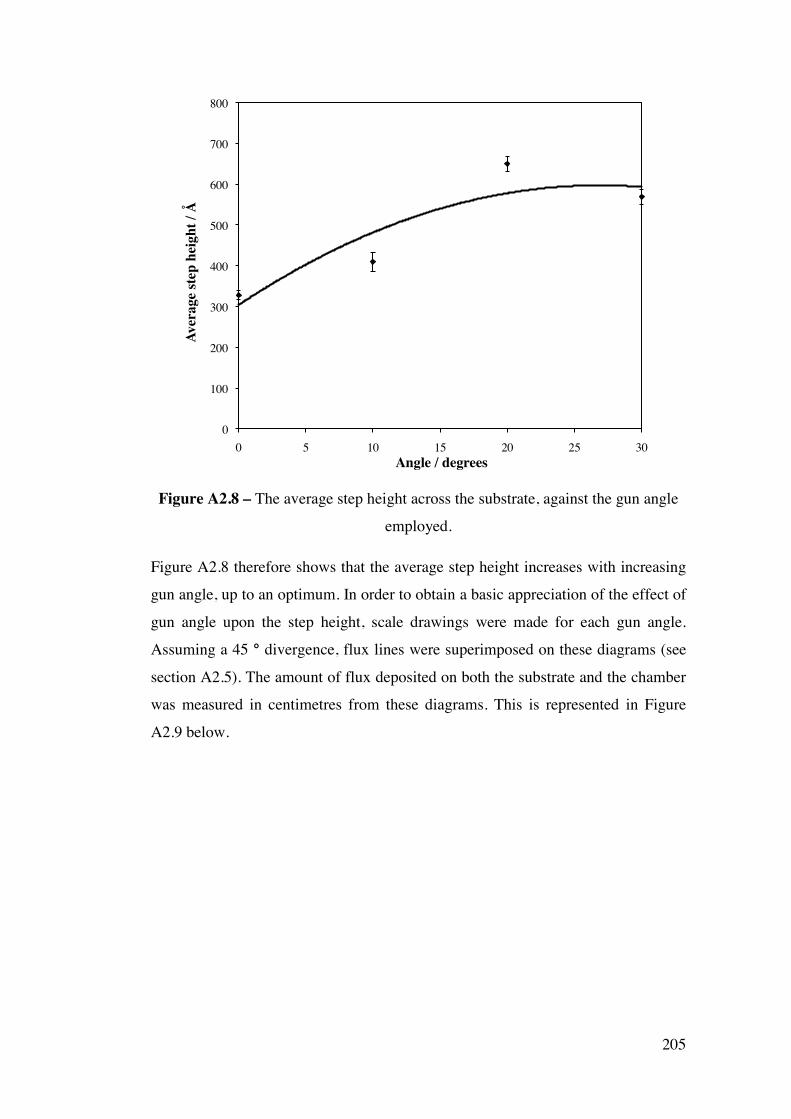
205
0
100
200
300
400
500
600
700
800
0 5 10 15 20 25 30
Aver
age
step
hei
ght /
Å
Angle / degrees
Figure A 2.8 – The average step height across the substrate, against the gun angle
employed.
Figure A 2.8 therefore shows that the average step height increases with increasing
gun angle, up to an optimum. In order to obtain a basic appreciation of the effect of
gun angle upon the step height, scale drawings were made for each gun angle.
Assuming a 45 ° divergence, flux lines were superimposed on these diagrams (see
section A2.5). The amount of flux deposited on both the substrate and the chamber
was measured in centimetres from these diagrams. This is represented in Figure
A 2.9 below.
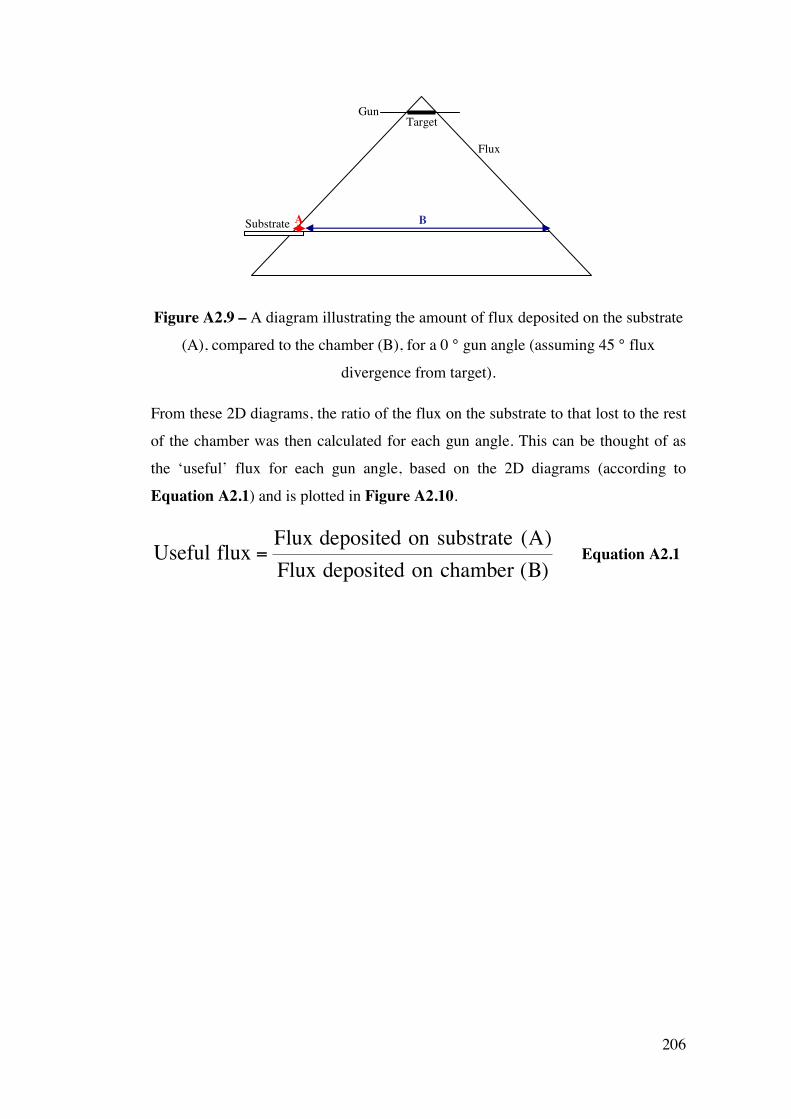
206
Figure A 2.9 – A diagram illustrating the amount of flux deposited on the substrate
(A), compared to the chamber (B), for a 0 ° gun angle (assuming 45 ° flux
divergence from target).
From these 2D diagrams, the ratio of the flux on the substrate to that lost to the rest
of the chamber was then calculated for each gun angle. This can be thought of as
the ‘useful’ flux for each gun angle, based on the 2D diagrams (according to
Equation A2.1) and is plotted in Figure A 2.10.
Useful flux =Flux deposited on substrate (A)Flux deposited on chamber (B)
Equation A 2.1
Gun
Substrate
Target
Flux
B A
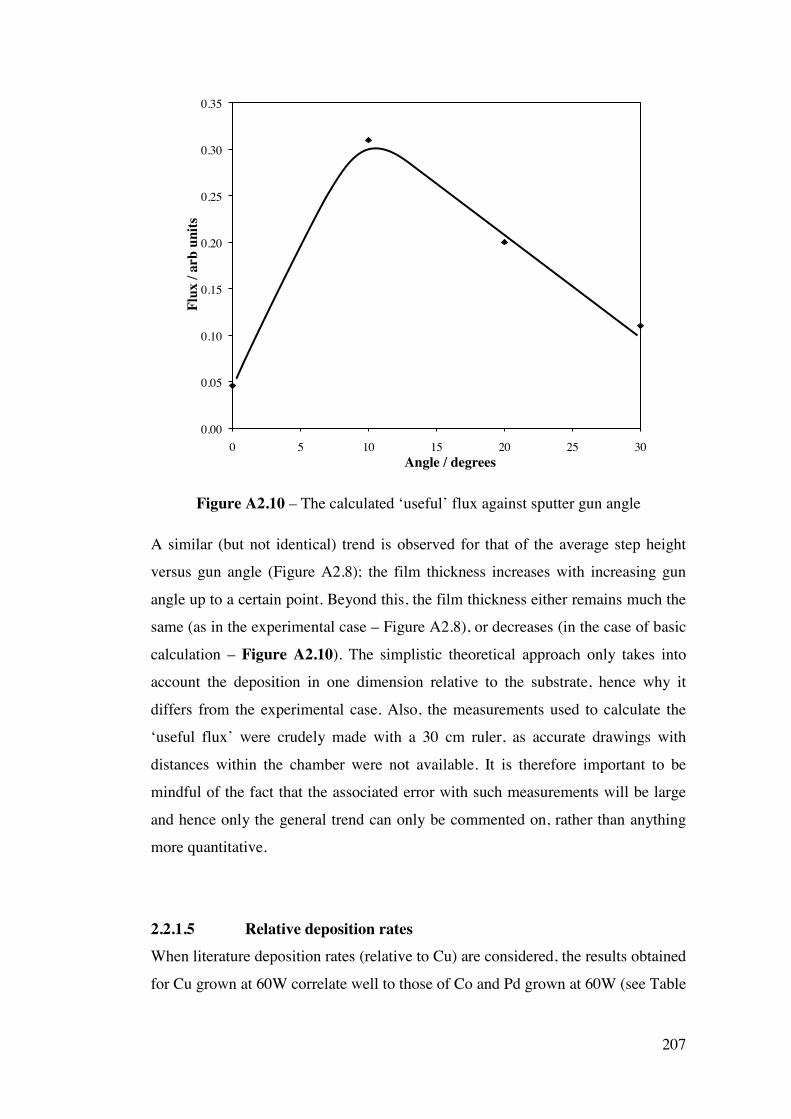
207
0.00
0.05
0.10
0.15
0.20
0.25
0.30
0.35
0 5 10 15 20 25 30
Flux
/ ar
b un
its
Angle / degrees
Figure A 2.10 – The calculated ‘useful’ flux against sputter gun angle
A similar (but not identical) trend is observed for that of the average step height
versus gun angle (Figure A 2.8); the film thickness increases with increasing gun
angle up to a certain point. Beyond this, the film thickness either remains much the
same (as in the experimental case – Figure A 2.8), or decreases (in the case of basic
calculation – Figure A 2.10). The simplistic theoretical approach only takes into
account the deposition in one dimension relative to the substrate, hence why it
differs from the experimental case. Also, the measurements used to calculate the
‘useful flux’ were crudely made with a 30 cm ruler, as accurate drawings with
distances within the chamber were not available. It is therefore important to be
mindful of the fact that the associated error with such measurements will be large
and hence only the general trend can only be commented on, rather than anything
more quantitative.
2.2.1.5 Relative deposition rates When literature deposition rates (relative to Cu) are considered, the results obtained
for Cu grown at 60W correlate well to those of Co and Pd grown at 60W (see Table
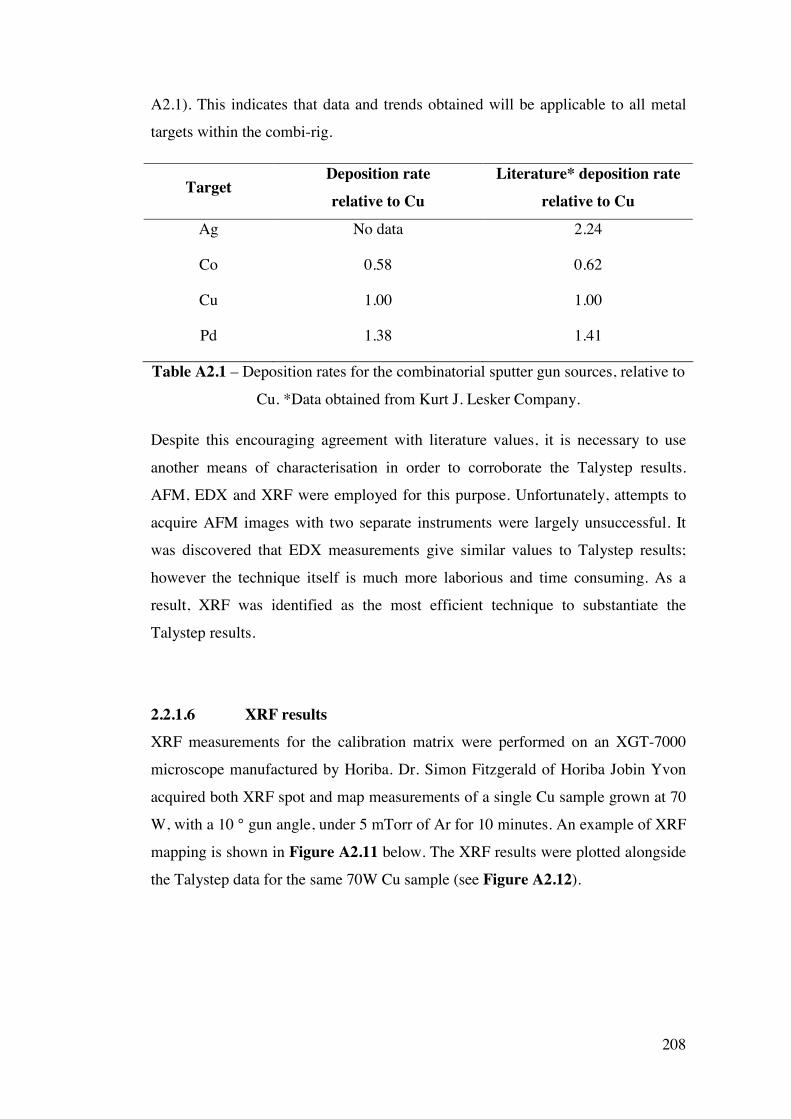
208
A 2.1). This indicates that data and trends obtained will be applicable to all metal
targets within the combi-rig.
Target Deposition rate relative to Cu
Literature* deposition rate relative to Cu
Ag No data 2.24
Co 0.58 0.62
Cu 1.00 1.00
Pd 1.38 1.41
Table A 2.1 – Deposition rates for the combinatorial sputter gun sources, relative to
Cu. *Data obtained from Kurt J. Lesker Company.
Despite this encouraging agreement with literature values, it is necessary to use
another means of characterisation in order to corroborate the Talystep results.
AFM, EDX and XRF were employed for this purpose. Unfortunately, attempts to
acquire AFM images with two separate instruments were largely unsuccessful. It
was discovered that EDX measurements give similar values to Talystep results;
however the technique itself is much more laborious and time consuming. As a
result, XRF was identified as the most efficient technique to substantiate the
Talystep results.
2.2.1.6 XRF results XRF measurements for the calibration matrix were performed on an XGT-7000
microscope manufactured by Horiba. Dr. Simon Fitzgerald of Horiba Jobin Yvon
acquired both XRF spot and map measurements of a single Cu sample grown at 70
W, with a 10 ° gun angle, under 5 mTorr of Ar for 10 minutes. An example of XRF
mapping is shown in Figure A2.11 below. The XRF results were plotted alongside
the Talystep data for the same 70W Cu sample (see Figure A 2.12).
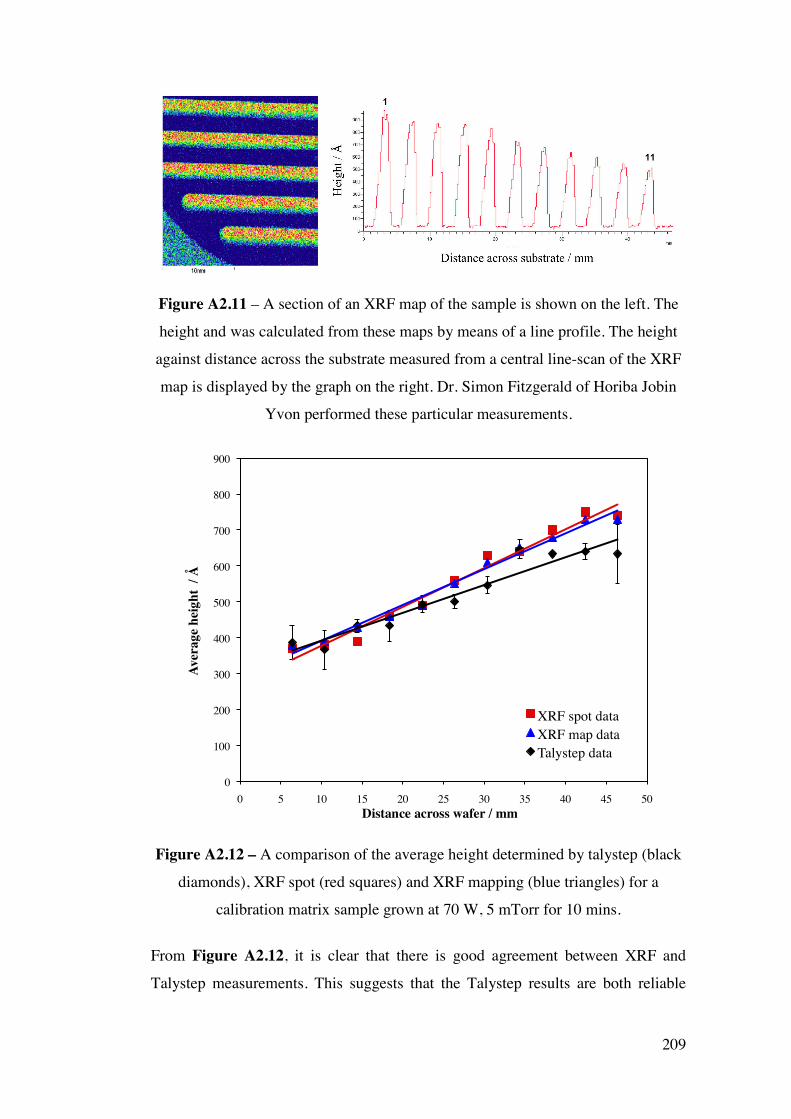
209
Figure A 2.11 – A section of an XRF map of the sample is shown on the left. The
height and was calculated from these maps by means of a line profile. The height
against distance across the substrate measured from a central line-scan of the XRF
map is displayed by the graph on the right. Dr. Simon Fitzgerald of Horiba Jobin
Yvon performed these particular measurements.
0
100
200
300
400
500
600
700
800
900
0 5 10 15 20 25 30 35 40 45 50
Aver
age
heig
ht /
Å
Distance across wafer / mm
XRF spot data XRF map data Talystep data
Figure A 2.12 – A comparison of the average height determined by talystep (black
diamonds), XRF spot (red squares) and XRF mapping (blue triangles) for a
calibration matrix sample grown at 70 W, 5 mTorr for 10 mins.
From Figure A 2.12, it is clear that there is good agreement between XRF and
Talystep measurements. This suggests that the Talystep results are both reliable
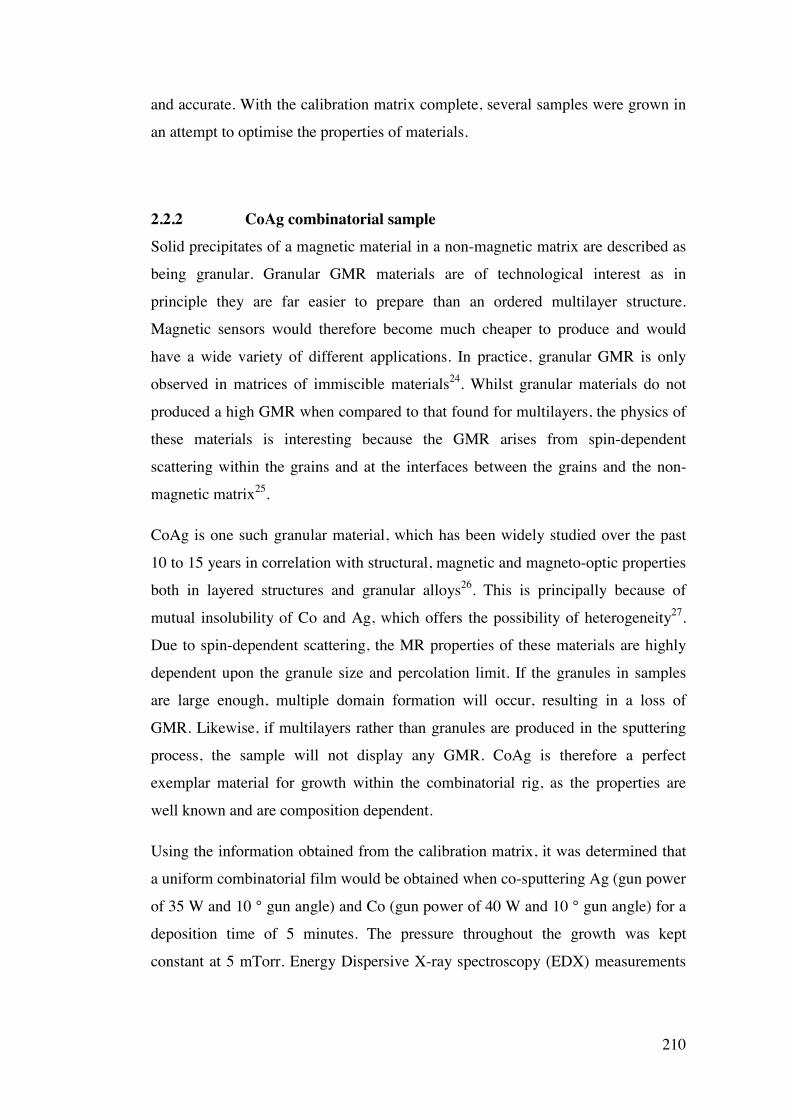
210
and accurate. With the calibration matrix complete, several samples were grown in
an attempt to optimise the properties of materials.
2.2.2 CoAg combinatorial sample Solid precipitates of a magnetic material in a non-magnetic matrix are described as
being granular. Granular GMR materials are of technological interest as in
principle they are far easier to prepare than an ordered multilayer structure.
Magnetic sensors would therefore become much cheaper to produce and would
have a wide variety of different applications. In practice, granular GMR is only
observed in matrices of immiscible materials24. Whilst granular materials do not
produced a high GMR when compared to that found for multilayers, the physics of
these materials is interesting because the GMR arises from spin-dependent
scattering within the grains and at the interfaces between the grains and the non-
magnetic matrix25.
CoAg is one such granular material, which has been widely studied over the past
10 to 15 years in correlation with structural, magnetic and magneto-optic properties
both in layered structures and granular alloys26. This is principally because of
mutual insolubility of Co and Ag, which offers the possibility of heterogeneity27.
Due to spin-dependent scattering, the MR properties of these materials are highly
dependent upon the granule size and percolation limit. If the granules in samples
are large enough, multiple domain formation will occur, resulting in a loss of
GMR. Likewise, if multilayers rather than granules are produced in the sputtering
process, the sample will not display any GMR. CoAg is therefore a perfect
exemplar material for growth within the combinatorial rig, as the properties are
well known and are composition dependent.
Using the information obtained from the calibration matrix, it was determined that
a uniform combinatorial film would be obtained when co-sputtering Ag (gun power
of 35 W and 10 ° gun angle) and Co (gun power of 40 W and 10 ° gun angle) for a
deposition time of 5 minutes. The pressure throughout the growth was kept
constant at 5 mTorr. Energy Dispersive X-ray spectroscopy (EDX) measurements
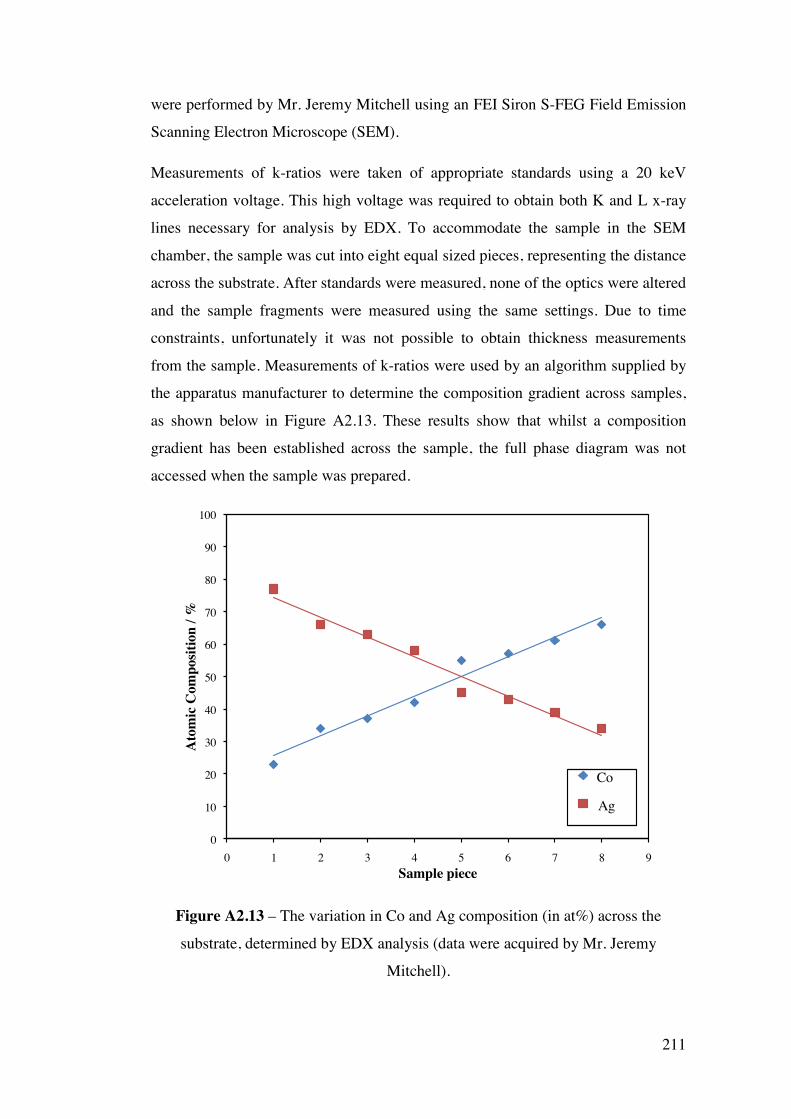
211
were performed by Mr. Jeremy Mitchell using an FEI Siron S-FEG Field Emission
Scanning Electron Microscope (SEM).
Measurements of k-ratios were taken of appropriate standards using a 20 keV
acceleration voltage. This high voltage was required to obtain both K and L x-ray
lines necessary for analysis by EDX. To accommodate the sample in the SEM
chamber, the sample was cut into eight equal sized pieces, representing the distance
across the substrate. After standards were measured, none of the optics were altered
and the sample fragments were measured using the same settings. Due to time
constraints, unfortunately it was not possible to obtain thickness measurements
from the sample. Measurements of k-ratios were used by an algorithm supplied by
the apparatus manufacturer to determine the composition gradient across samples,
as shown below in Figure A 2.13. These results show that whilst a composition
gradient has been established across the sample, the full phase diagram was not
accessed when the sample was prepared.
0
10
20
30
40
50
60
70
80
90
100
0 1 2 3 4 5 6 7 8 9
Ato
mic
Com
posit
ion
/ %
Sample piece
Co
Ag
Figure A 2.13 – The variation in Co and Ag composition (in at%) across the
substrate, determined by EDX analysis (data were acquired by Mr. Jeremy
Mitchell).
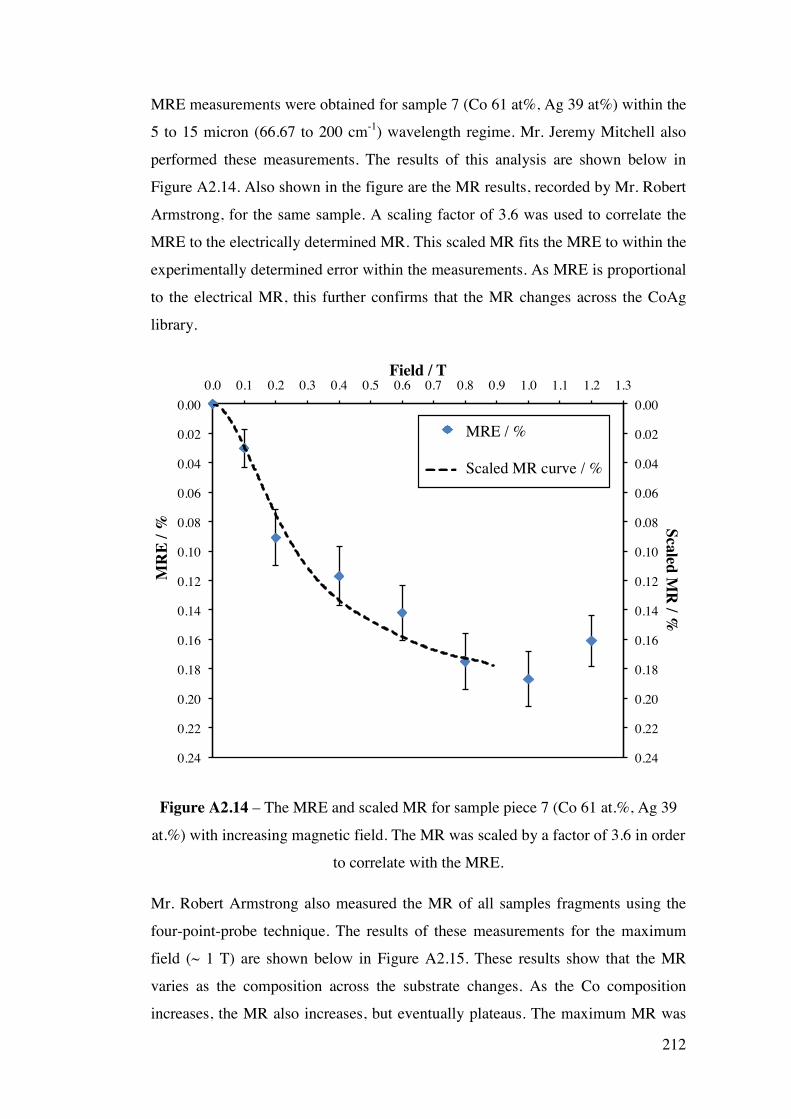
212
MRE measurements were obtained for sample 7 (Co 61 at%, Ag 39 at%) within the
5 to 15 micron (66.67 to 200 cm-1) wavelength regime. Mr. Jeremy Mitchell also
performed these measurements. The results of this analysis are shown below in
Figure A 2.14. Also shown in the figure are the MR results, recorded by Mr. Robert
Armstrong, for the same sample. A scaling factor of 3.6 was used to correlate the
MRE to the electrically determined MR. This scaled MR fits the MRE to within the
experimentally determined error within the measurements. As MRE is proportional
to the electrical MR, this further confirms that the MR changes across the CoAg
library.
0.00
0.02
0.04
0.06
0.08
0.10
0.12
0.14
0.16
0.18
0.20
0.22
0.24
0.00
0.02
0.04
0.06
0.08
0.10
0.12
0.14
0.16
0.18
0.20
0.22
0.24
0.0 0.1 0.2 0.3 0.4 0.5 0.6 0.7 0.8 0.9 1.0 1.1 1.2 1.3
Scaled MR
/ %
MR
E / %
Field / T
MRE / % scaled GMR Poly.(scaled GMR) Scaled MR curve / %
MRE / %
Figure A 2.14 – The MRE and scaled MR for sample piece 7 (Co 61 at.%, Ag 39
at.%) with increasing magnetic field. The MR was scaled by a factor of 3.6 in order
to correlate with the MRE.
Mr. Robert Armstrong also measured the MR of all samples fragments using the
four-point-probe technique. The results of these measurements for the maximum
field (~ 1 T) are shown below in Figure A 2.15. These results show that the MR
varies as the composition across the substrate changes. As the Co composition
increases, the MR also increases, but eventually plateaus. The maximum MR was
213
recorded from sample piece six, which corresponds to a composition of Co 57 at%,
Ag 43 at%.
This can be rationalised in terms of the Co grain size, separation between grains
and the formation of domains. As the concentration of Co increases, so can the
granule size. Conversely, as the granule size increases, the separation between the
grains decreases. The latter tends to improve the GMR, as the distance by which
the spins have to diffuse will be shorter, meaning that the spin orientation is
retained, as scattering is less likely. However, as the grain size increases, the
magnitude of the GMR tends to decrease. Domain formation also leads to a
reduction in the GMR. There are therefore competing factors which influence the
magnitude of the GMR, leading to an optimum concentration of Co, where the
various different factors balance and lead to a maximum GMR value, which
explains the trend observed in Figure A 2.15.
0
10
20
30
40
50
60
70
80
90
100
0
0.01
0.02
0.03
0.04
0.05
0.06
0 1 2 3 4 5 6 7 8 9
Co com
position / at%
MR
at 1
T /
%
Sample piece
MR / %
Co composition / at%
Figure A 2.15 – The variation in MR (at ~ 1 T) across the CoAg substrate
(measured by Mr. Robert Armstrong). Also shown in the figure is the Co
composition as determined by EDX (measured by Mr. Jeremy Mitchell).
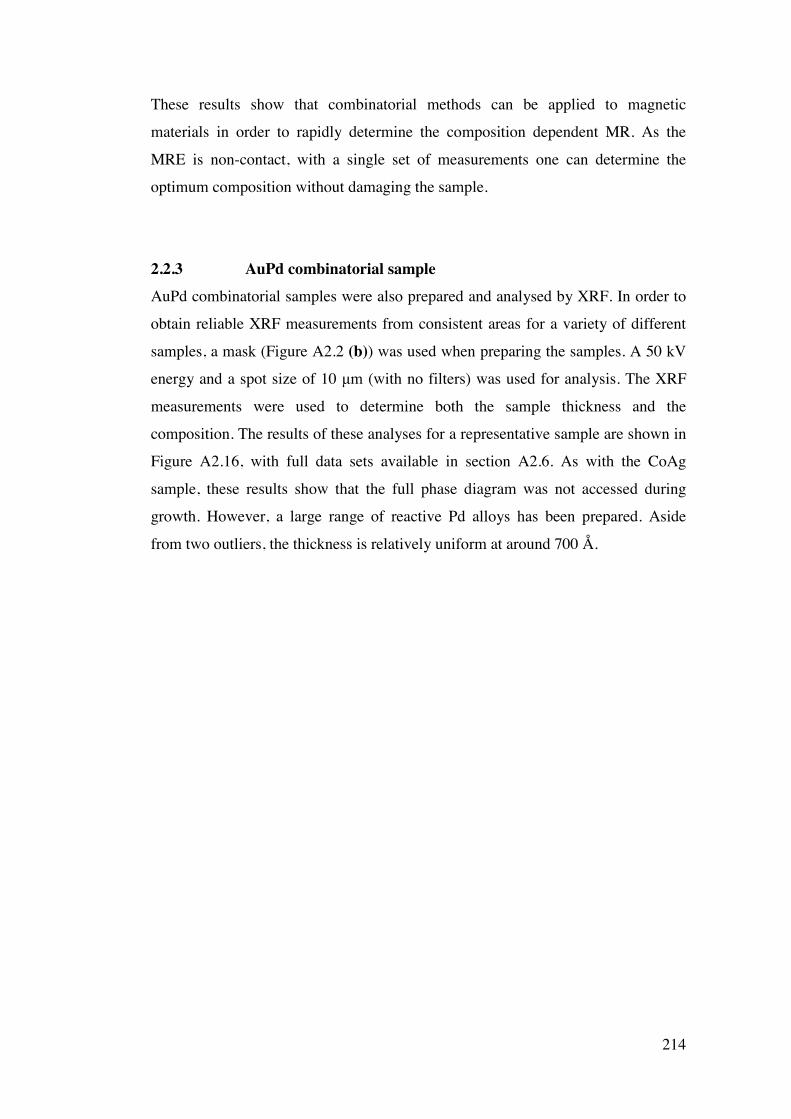
214
These results show that combinatorial methods can be applied to magnetic
materials in order to rapidly determine the composition dependent MR. As the
MRE is non-contact, with a single set of measurements one can determine the
optimum composition without damaging the sample.
2.2.3 AuPd combinatorial sample AuPd combinatorial samples were also prepared and analysed by XRF. In order to
obtain reliable XRF measurements from consistent areas for a variety of different
samples, a mask (Figure A 2.2 (b)) was used when preparing the samples. A 50 kV
energy and a spot size of 10 µm (with no filters) was used for analysis. The XRF
measurements were used to determine both the sample thickness and the
composition. The results of these analyses for a representative sample are shown in
Figure A 2.16, with full data sets available in section A2.6. As with the CoAg
sample, these results show that the full phase diagram was not accessed during
growth. However, a large range of reactive Pd alloys has been prepared. Aside
from two outliers, the thickness is relatively uniform at around 700 Å.
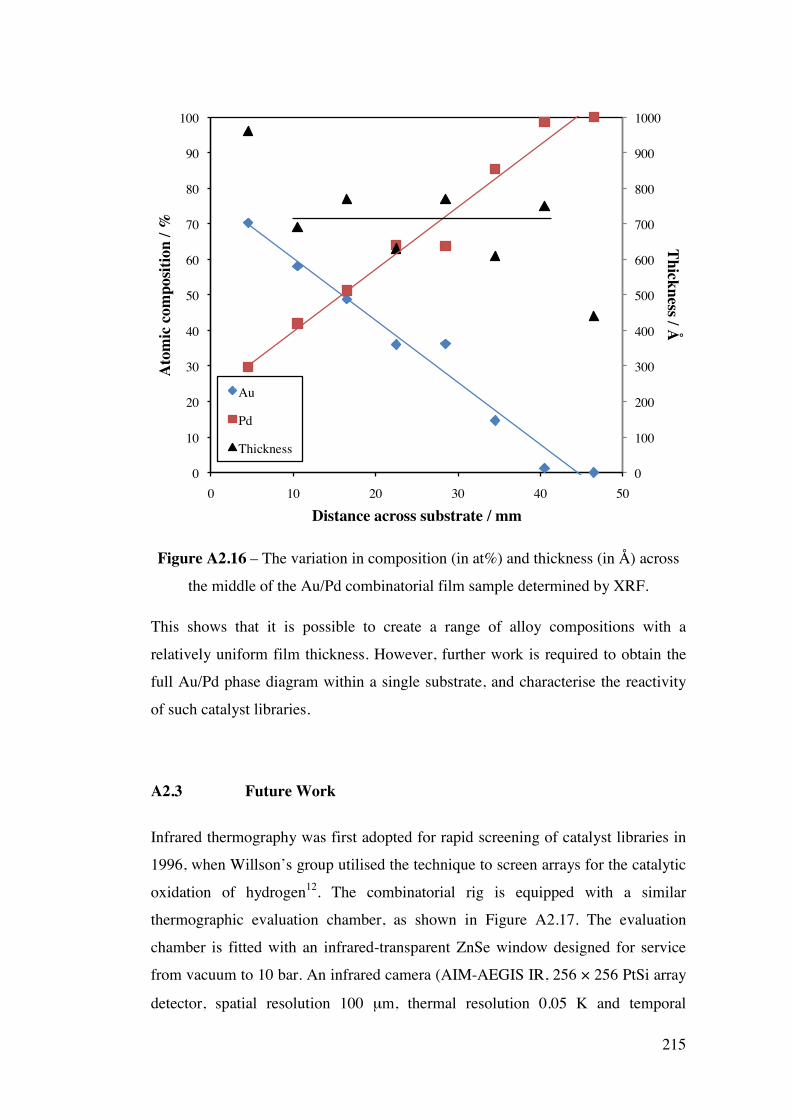
215
0
100
200
300
400
500
600
700
800
900
1000
0
10
20
30
40
50
60
70
80
90
100
0 10 20 30 40 50
Thickness / Å
Ato
mic
com
posit
ion
/ %
Distance across substrate / mm
Au
Pd
Thickness
Figure A 2.16 – The variation in composition (in at%) and thickness (in Å) across
the middle of the Au/Pd combinatorial film sample determined by XRF.
This shows that it is possible to create a range of alloy compositions with a
relatively uniform film thickness. However, further work is required to obtain the
full Au/Pd phase diagram within a single substrate, and characterise the reactivity
of such catalyst libraries.
A2.3 Future Work
Infrared thermography was first adopted for rapid screening of catalyst libraries in
1996, when Willson’s group utilised the technique to screen arrays for the catalytic
oxidation of hydrogen12. The combinatorial rig is equipped with a similar
thermographic evaluation chamber, as shown in Figure A 2.17. The evaluation
chamber is fitted with an infrared-transparent ZnSe window designed for service
from vacuum to 10 bar. An infrared camera (AIM-AEGIS IR, 256 × 256 PtSi array
detector, spatial resolution 100 µm, thermal resolution 0.05 K and temporal
216
resolution 50 Hz) could be used to record the thermal profile of the catalyst library
surface under reaction conditions. This technique requires accurate differentiation
between catalyst library spots of similar reactivity. However, thermal analysis is
complicated by the varying emissivity from different materials within the library,
IR emission from hot gases in the reactor and IR reflection.
Future work would therefore include combining point-by-point emissivity
correction and signal averaging available with the AIM IR system, with powerful
image processing software (which would be developed using MATHCAD and/or
MATLAB software) to facilitate accurate, time-resolved IR thermographic
analysis. Au/Pd catalyst libraries could then be introduced into the attached
reaction chamber via the transfer mechanism and screened using this
thermographic technique for catalytic activity. Through the use of the AIM system,
the temperature of the sample could be accurately measured during the course of
the selective oxidation of crotyl alcohol. Once this was complete, the system could
also be used, in principle, to examine different libraries and/or different chemical
reactions. For exothermic reactions, the most active catalyst composition could be
determined by means of the ‘hot spot’ on the surface. Conversely for endothermic
reactions, this would correspond to a ‘cold spot’ on the film surface.
217
Sputtering guns
Reactive gases
To Turbo pump
Si substrate
IR transparent
window
IR camera
Figure A 2.17 – A simple diagram of the combinatorial sputtering chamber also
showing the attached evaluation chamber. The diagram shows that main chamber is
bolted (by means of a gate valve) to a thermographic evaluation chamber, whereby
catalyst libraries prepared in the main chamber can be transferred for catalytic
activity analysis by infrared thermography.
The same principle of infrared thermography could also be used to measure the
difference in MR across a compositional gradient for a range of magnetic materials
with a high level of spatial resolution. This technique has already been applied to a
sample of Co/Cu with a spatial resolution of ~ 30 µm using a CaF2 lens (see Figure
A 2.18 below).
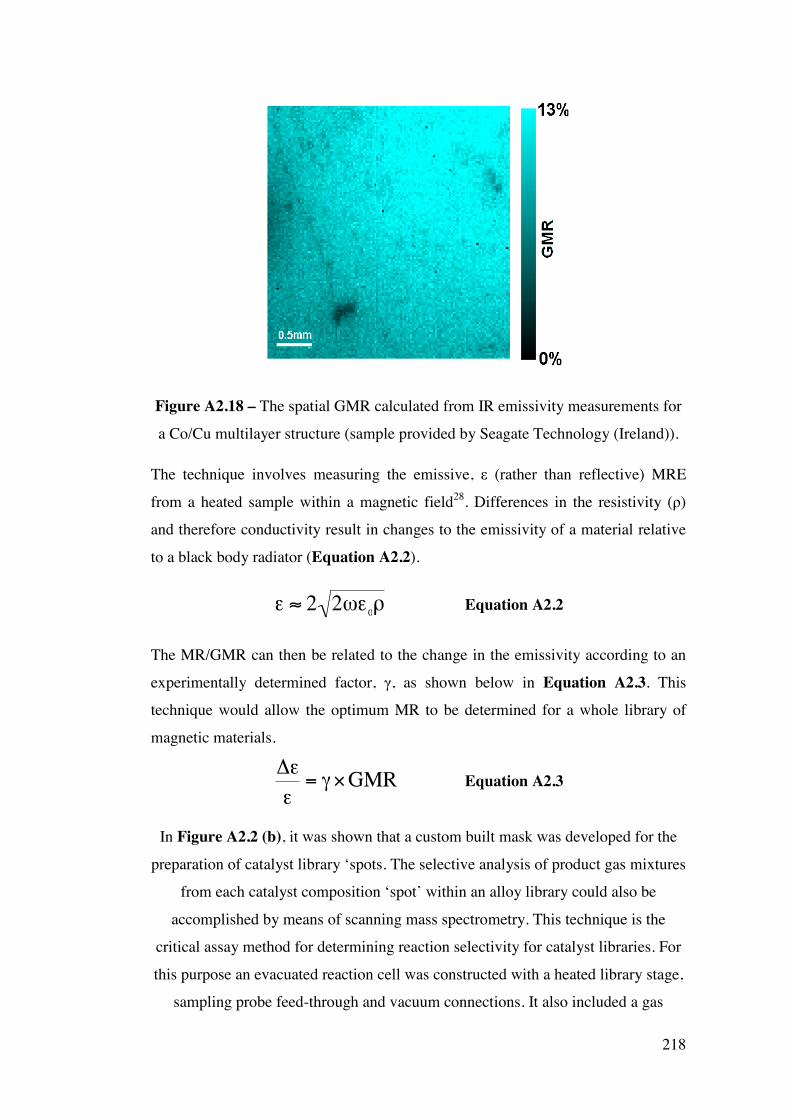
218
Figure A 2.18 – The spatial GMR calculated from IR emissivity measurements for
a Co/Cu multilayer structure (sample provided by Seagate Technology (Ireland)).
The technique involves measuring the emissive, ε (rather than reflective) MRE
from a heated sample within a magnetic field28. Differences in the resistivity (ρ)
and therefore conductivity result in changes to the emissivity of a material relative
to a black body radiator (Equation A2.2).
ε ≈ 2 2ωε0ρ Equation A 2.2
The MR/GMR can then be related to the change in the emissivity according to an
experimentally determined factor, γ, as shown below in Equation A2.3. This
technique would allow the optimum MR to be determined for a whole library of
magnetic materials.
Equation A 2.3
In Figure A 2.2 (b), it was shown that a custom built mask was developed for the
preparation of catalyst library ‘spots. The selective analysis of product gas mixtures
from each catalyst composition ‘spot’ within an alloy library could also be
accomplished by means of scanning mass spectrometry. This technique is the
critical assay method for determining reaction selectivity for catalyst libraries. For
this purpose an evacuated reaction cell was constructed with a heated library stage,
sampling probe feed-through and vacuum connections. It also included a gas
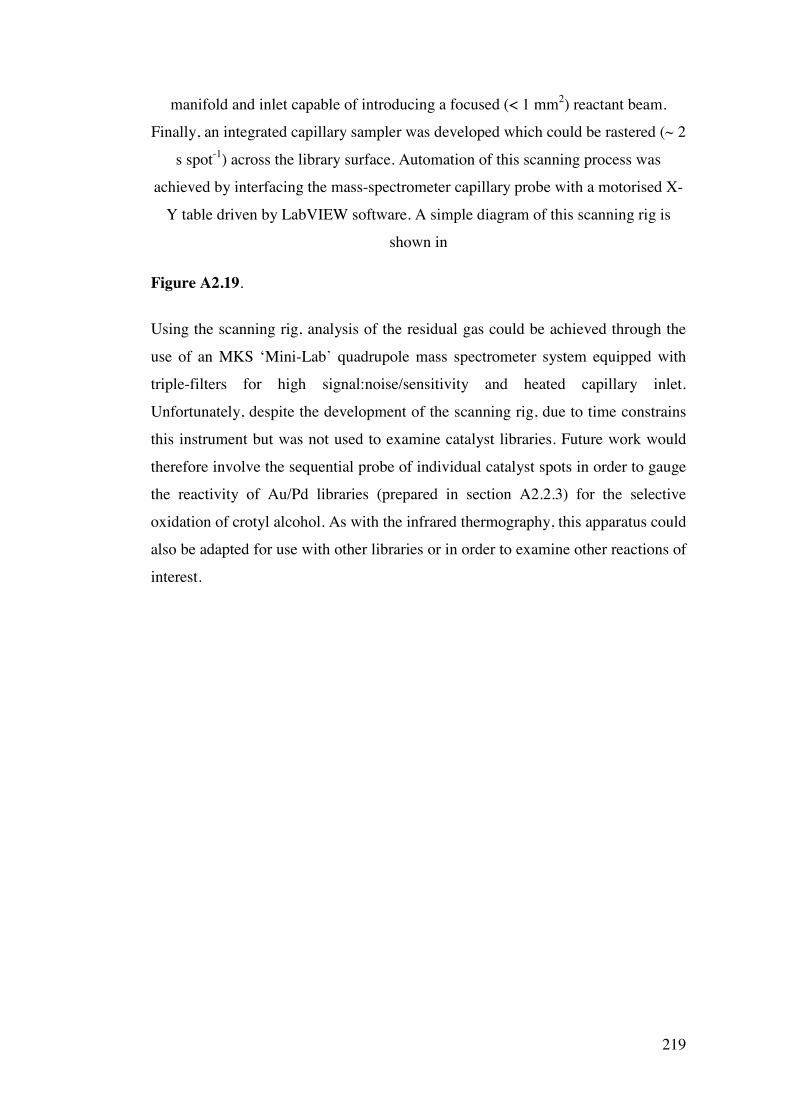
219
manifold and inlet capable of introducing a focused (< 1 mm2) reactant beam.
Finally, an integrated capillary sampler was developed which could be rastered (~ 2
s spot-1) across the library surface. Automation of this scanning process was
achieved by interfacing the mass-spectrometer capillary probe with a motorised X-
Y table driven by LabVIEW software. A simple diagram of this scanning rig is
shown in
Figure A 2.19.
Using the scanning rig, analysis of the residual gas could be achieved through the
use of an MKS ‘Mini-Lab’ quadrupole mass spectrometer system equipped with
triple-filters for high signal:noise/sensitivity and heated capillary inlet.
Unfortunately, despite the development of the scanning rig, due to time constrains
this instrument but was not used to examine catalyst libraries. Future work would
therefore involve the sequential probe of individual catalyst spots in order to gauge
the reactivity of Au/Pd libraries (prepared in section A2.2.3) for the selective
oxidation of crotyl alcohol. As with the infrared thermography, this apparatus could
also be adapted for use with other libraries or in order to examine other reactions of
interest.
220
Figure A 2.19 – A simple diagram of the scanning mass spectrometer apparatus
developed for screening the selectivity of catalyst alloy libraries.
A2.4 Conclusions The calibration of the combinatorial sputtering rig has revealed that there is a linear
dependence of the film thickness with increasing sputter-gun power and sputtering
time. The situation is more complicated for the Ar pressure where an optimum
pressure exists for the sputtering rate. The factor that has the greatest effect upon
the composition gradient across the substrate is that of the sputter-gun angle.
Despite the calibration matrix, in order to obtain the maximum gradient across the
sample, several libraries had to be prepared. The gun angle requires further
calibration, and possibly a more rigorous mathematical approach. As the relative
sputtering rates are known for the materials within the combi-rig, the calibration
matrix can be used to grow any combination of bimetallic materials a uniform film
thickness with a composition gradient across the substrate.
Bellows
Catalyst library
Heater stage
Gas manifold
and inlet
Capillary
Mass
spectrometer
Stepper motor
controlled
X-Y translator
Gas flow
To pump
221
Libraries of magnetic materials and catalysts were prepared based upon data
recorded for the calibration matrix. EDX and XRF measurements have shown that
a composition gradient exists across both sets of samples, although the full phase
diagram for each set of materials has not yet been accessed. In the case of CoAg, it
has been shown that the GMR and MRE also varies across the sample in
accordance with the varying composition. Further work is needed to fully optimise
the properties of these materials with full spatial resolution, which would include
infrared thermography and scanning mass spectrometry. In this basic groundwork,
it has demonstrated that combinatorial methods are potentially useful tools for
aiding the optimisation of materials.
A2.5 Flux Calculations/ Scale drawings of gun angles:
Useful flux =Flux deposited on substrate (A)Flux deposited on chamber (B)
0 degrees:
1.00 cm21.76 cm
= 0.046
10 degrees:
5.20 cm(0.87 +16.09) cm
= 0.31
20 degrees:
5.20 cm(13.27 +12.81) cm
= 0.20
30 degrees:
1 cm(40.73+ 8.56) cm
= 0.11
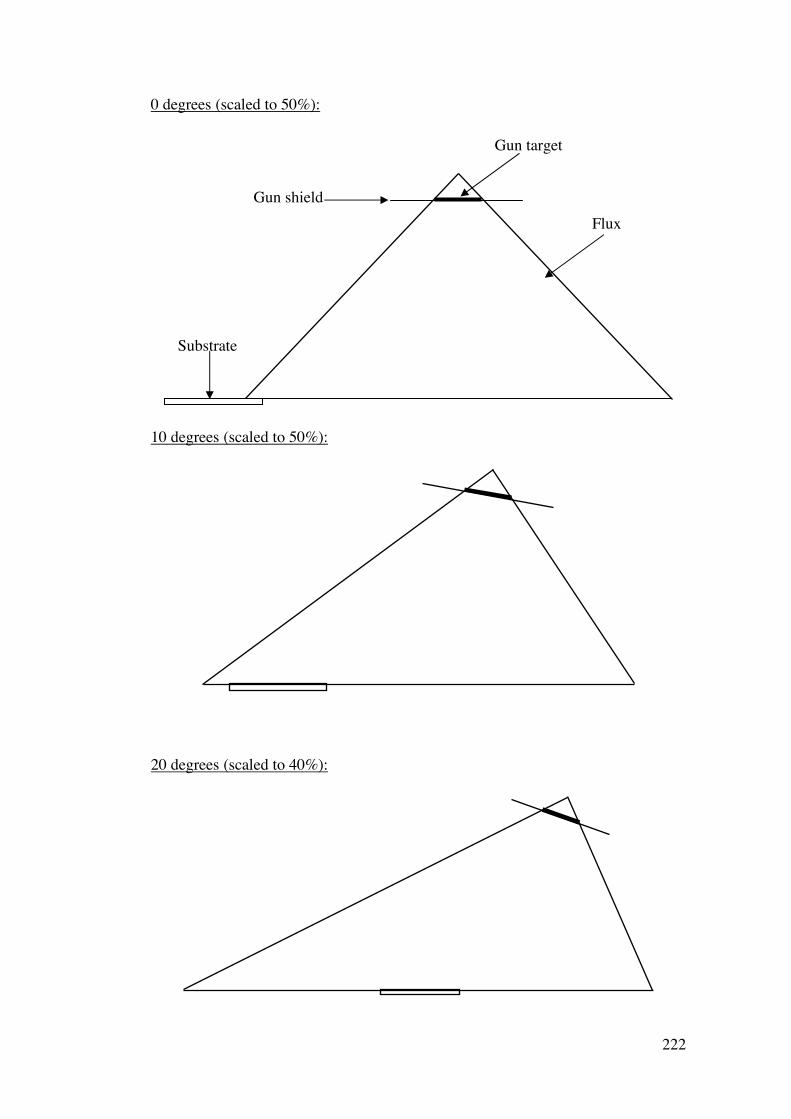
222
0 degrees (scaled to 50%):
10 degrees (scaled to 50%):
20 degrees (scaled to 40%):
Gun shield
Gun target
Flux
Substrate
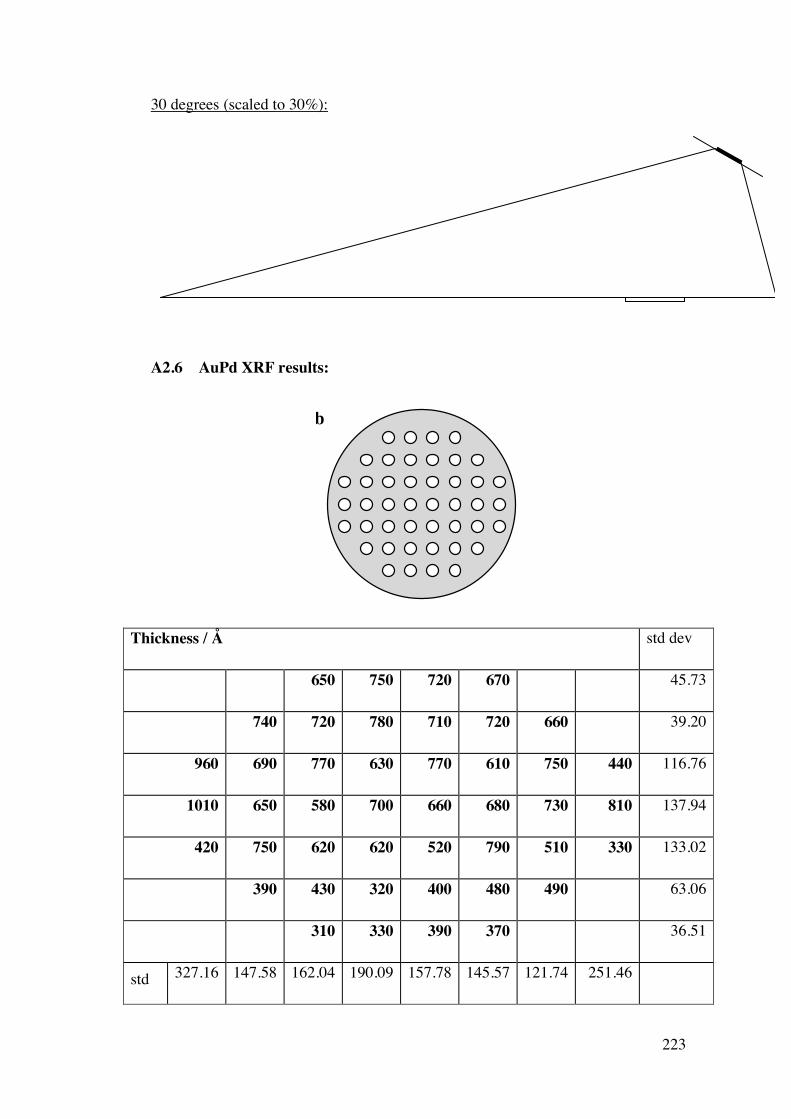
223
30 degrees (scaled to 30%):
A2.6 AuPd XRF results:
(b)
Thickness / Å std dev
650 750 720 670 45.73
740 720 780 710 720 660 39.20
960 690 770 630 770 610 750 440 116.76
1010 650 580 700 660 680 730 810 137.94
420 750 620 620 520 790 510 330 133.02
390 430 320 400 480 490 63.06
310 330 390 370 36.51
std 327.16 147.58 162.04 190.09 157.78 145.57 121.74 251.46
A
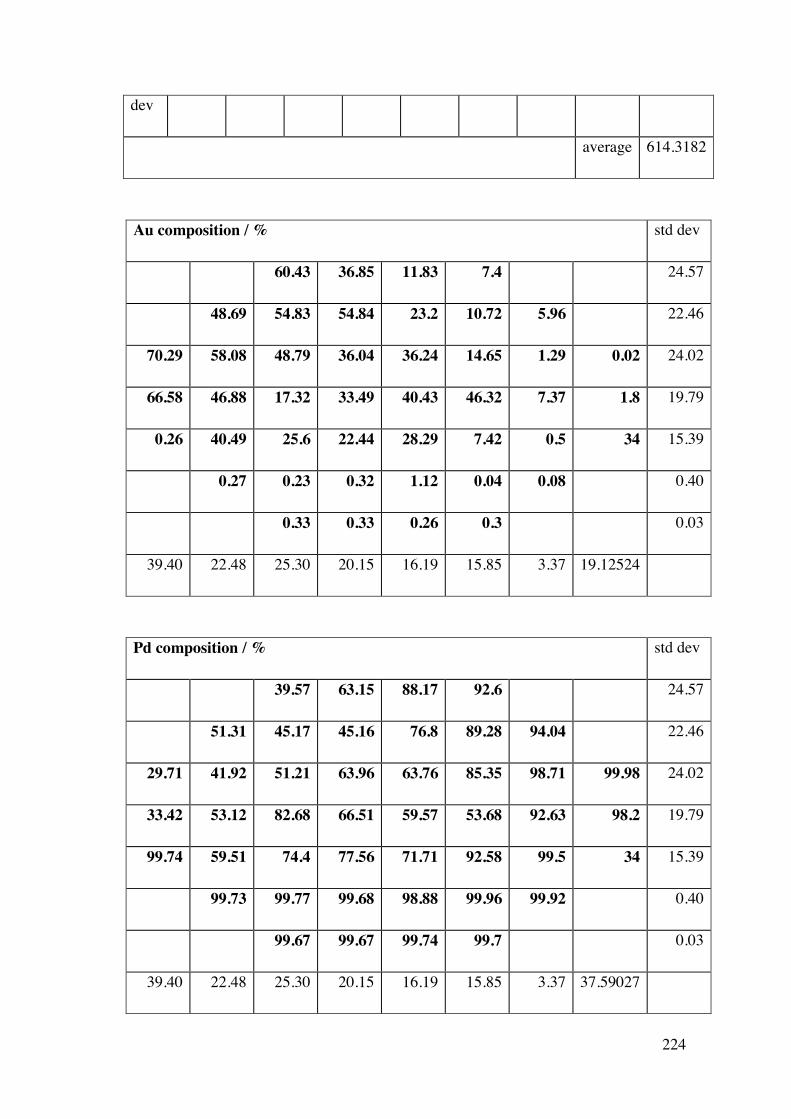
224
dev
average 614.3182
Au composition / % std dev
60.43 36.85 11.83 7.4 24.57
48.69 54.83 54.84 23.2 10.72 5.96 22.46
70.29 58.08 48.79 36.04 36.24 14.65 1.29 0.02 24.02
66.58 46.88 17.32 33.49 40.43 46.32 7.37 1.8 19.79
0.26 40.49 25.6 22.44 28.29 7.42 0.5 34 15.39
0.27 0.23 0.32 1.12 0.04 0.08 0.40
0.33 0.33 0.26 0.3 0.03
39.40 22.48 25.30 20.15 16.19 15.85 3.37 19.12524
Pd composition / % std dev
39.57 63.15 88.17 92.6 24.57
51.31 45.17 45.16 76.8 89.28 94.04 22.46
29.71 41.92 51.21 63.96 63.76 85.35 98.71 99.98 24.02
33.42 53.12 82.68 66.51 59.57 53.68 92.63 98.2 19.79
99.74 59.51 74.4 77.56 71.71 92.58 99.5 34 15.39
99.73 99.77 99.68 98.88 99.96 99.92 0.40
99.67 99.67 99.74 99.7 0.03
39.40 22.48 25.30 20.15 16.19 15.85 3.37 37.59027
225
A2.7 References
1. J. Hanak, Journal of materials science, 1970, 5, 964-971.
2. E. McFarland and W. H. Weinberg, Trends in biotechnology, 1999, 17,
107-115.
3. H. Koinuma, H. Aiyer and Y. Matsumoto, Science and Technology of
Advanced Materials, 2000, 1, 1-10.
4. H. Koinuma and I. Takeuchi, Nature Materials, 2004, 3, 429-438.
5. M. B. Brennan, Chemical and Engineering News, 2000, 78, 63-73.
6. H. Koinuma, Applied surface science, 2002, 189, 179-187.
7. J. Cooper, G. Zhang and P. J. McGinn, Review of Scientific Instruments,
2005, 76, 062221.
8. W. Maier, K. Stöwe and S. Sieg, Angewandte Chemie International
Edition, 2007, 46, 6016-6067.
9. D. Farrusseng, Surface Science Reports, 2008, 63, 487-513.
10. J. Engstrom and W. HenryWeinberg, AIChE journal, 2000, 46, 2-5.
11. R. Hendershot, C. Snively and J. Lauterbach, Chemistry – A European
Journal, 2005, 11, 806-814.
12. F. Moates, M. Somani, J. Annamalai, J. T. Richardson, D. Luss and R. C.
Willson, Ind. Eng. Chem. Res., 1996, 35, 4801-4803.
13. S. Henderson, J. Armstrong, A. Hector and M. T. Weller, J. Mater. Chem.,
2005, 15, 1528-1536.
14. J. Perkins, C. Teplin, M. v. Hest, J. Alleman, X. Li, M. Dabney, B. Keyes,
L. Gedvilas, D. Ginley, Y. Lin and Y. Lu, Applied surface science, 2004,
223, 124-132.
15. X. Xiang, Materials Science and Engineering B, 1998, 56, 246-250.
16. R. Van Dover, L. Schneemeyer and R. M. Fleming, Nature, 1998, 392, 162-
164.
17. C. Olk, Measurement Science and Technology, 2005, 16, 14-20.
18. C. Olk, G. Tibbetts, D. Simon and J. J. Moleski, Journal of applied physics,
2003, 94, 720-725.
19. K. Chang, M. Aronova and I. Takeuchi, Applied surface science, 2004, 223,
224-228.
20. N. Bassim, P. Schenck, M. Otani and H. Oguchi, Review of Scientific
Instruments, 2007, 78, 072203.
226
21. H. Christen, C. Rouleau, I. Ohkubo, H. Y. Zhai, H. N. Lee, S.
Sathyamurthy and D. H. Lowndes, Review of Scientific Instruments, 2003,
79, 4058-4062.
22. P. Ahmet, T. Nagata, D. Kukuruznyak, S. Yagyu, Y. Wakayama, M.
Yoshitake and T. Chikyow, Applied Surface Science, 2006, 252, 2472-
2476.
23. J. Hanak, H. Lehmann and R. K. Wehner, Journal of Applied Physics,
1972, 43, 1666-1673.
24. J. Xiao, J. Jiang and C. L. Chien, Physical review letters, 1992, 68, 3749-
3752.
25. J. Du, W. Liu, Q. Li, H. Sang, S. Zhang, Y. Du and D. Feng, Journal of
Magnetism and Magnetic Materials, 1999, 191, 17-24.
26. M. Angelakeris, E. Papaioannou, P. Poulopoulos, O. Valassiades and N.
Flevaris, Sensors and Actuators A, 2003, 106, 91-95.
27. M. Angelakeris, P. Poulopoulos, O. Valassiades, N. Flevaris, D. Niarchos
and A. Nassiopoulou, Sensors and Actuators A, 2001, 180-183.
28. S. Stirk, S. Thompson and J. Matthew, Applied Physics Letters, 2005, 86,
102505.
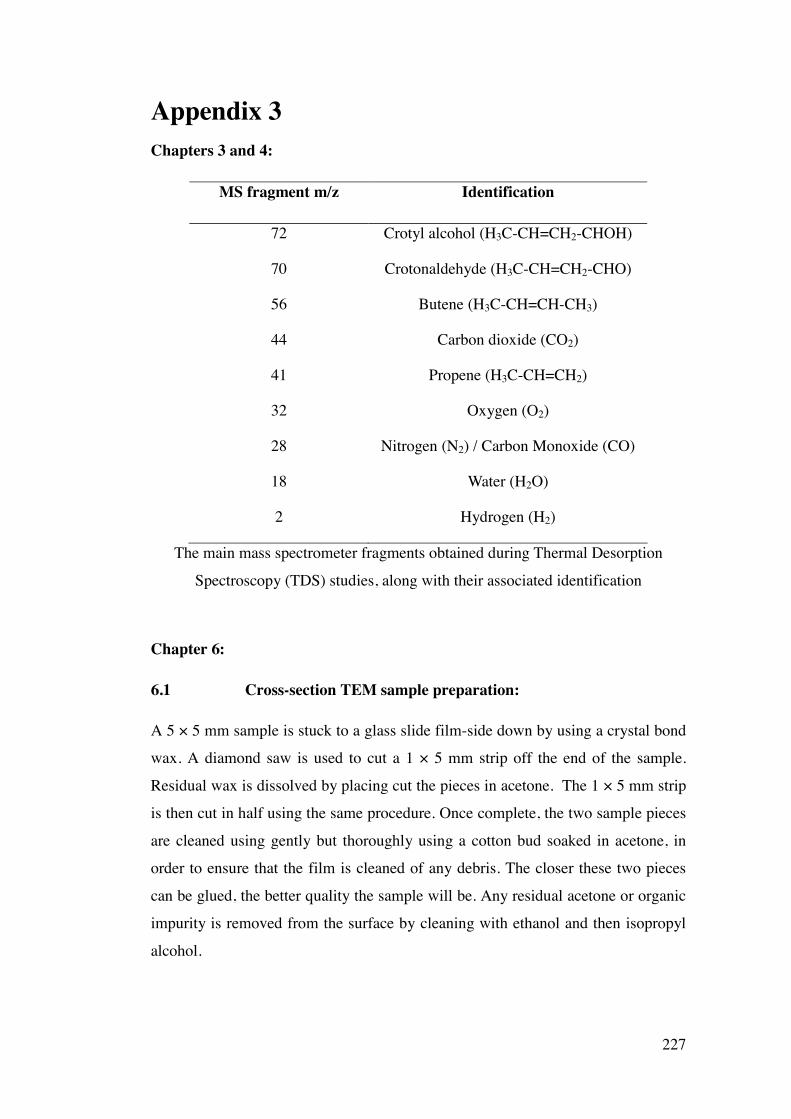
227
Appendix 3 Chapters 3 and 4:
MS fragment m/z Identification
72 Crotyl alcohol (H3C-CH=CH2-CHOH)
70 Crotonaldehyde (H3C-CH=CH2-CHO)
56 Butene (H3C-CH=CH-CH3)
44 Carbon dioxide (CO2)
41 Propene (H3C-CH=CH2)
32 Oxygen (O2)
28 Nitrogen (N2) / Carbon Monoxide (CO)
18 Water (H2O)
2 Hydrogen (H2)
The main mass spectrometer fragments obtained during Thermal Desorption
Spectroscopy (TDS) studies, along with their associated identification
Chapter 6:
6.1 Cross-section TEM sample preparation:
A 5 × 5 mm sample is stuck to a glass slide film-side down by using a crystal bond
wax. A diamond saw is used to cut a 1 × 5 mm strip off the end of the sample.
Residual wax is dissolved by placing cut the pieces in acetone. The 1 × 5 mm strip
is then cut in half using the same procedure. Once complete, the two sample pieces
are cleaned using gently but thoroughly using a cotton bud soaked in acetone, in
order to ensure that the film is cleaned of any debris. The closer these two pieces
can be glued, the better quality the sample will be. Any residual acetone or organic
impurity is removed from the surface by cleaning with ethanol and then isopropyl
alcohol.
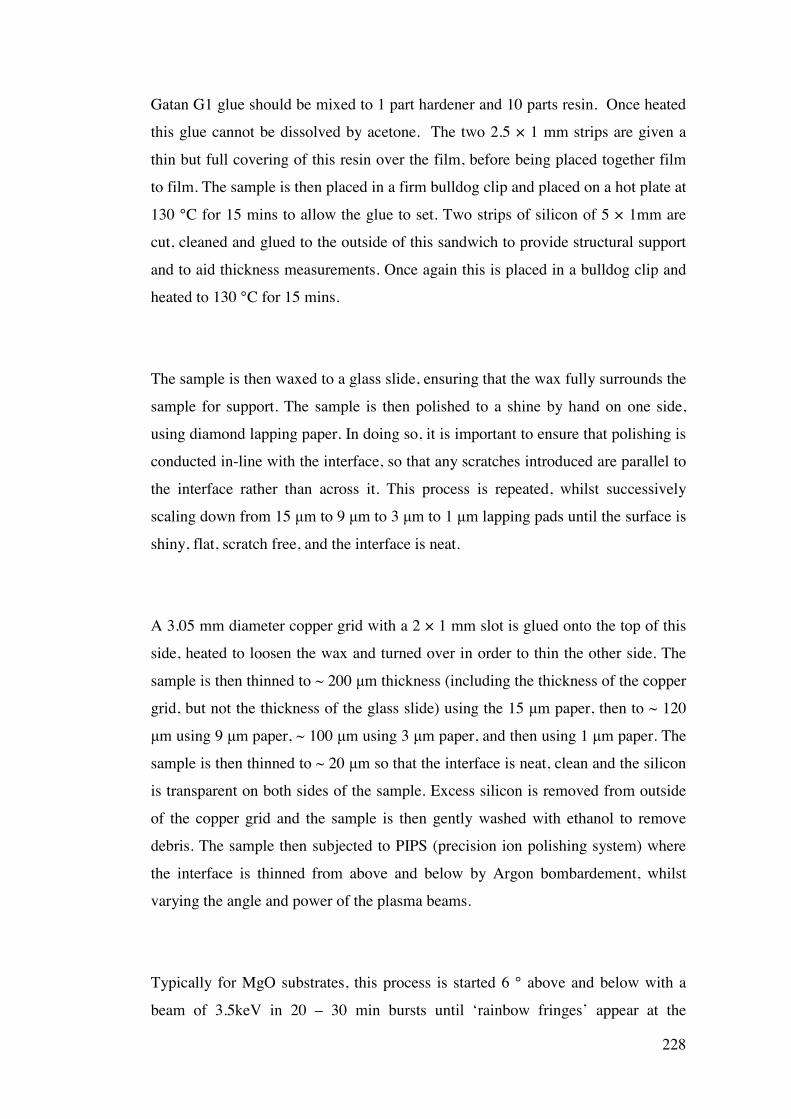
228
Gatan G1 glue should be mixed to 1 part hardener and 10 parts resin. Once heated
this glue cannot be dissolved by acetone. The two 2.5 × 1 mm strips are given a
thin but full covering of this resin over the film, before being placed together film
to film. The sample is then placed in a firm bulldog clip and placed on a hot plate at
130 °C for 15 mins to allow the glue to set. Two strips of silicon of 5 × 1mm are
cut, cleaned and glued to the outside of this sandwich to provide structural support
and to aid thickness measurements. Once again this is placed in a bulldog clip and
heated to 130 °C for 15 mins.
The sample is then waxed to a glass slide, ensuring that the wax fully surrounds the
sample for support. The sample is then polished to a shine by hand on one side,
using diamond lapping paper. In doing so, it is important to ensure that polishing is
conducted in-line with the interface, so that any scratches introduced are parallel to
the interface rather than across it. This process is repeated, whilst successively
scaling down from 15 µm to 9 µm to 3 µm to 1 µm lapping pads until the surface is
shiny, flat, scratch free, and the interface is neat.
A 3.05 mm diameter copper grid with a 2 × 1 mm slot is glued onto the top of this
side, heated to loosen the wax and turned over in order to thin the other side. The
sample is then thinned to ~ 200 µm thickness (including the thickness of the copper
grid, but not the thickness of the glass slide) using the 15 µm paper, then to ~ 120
µm using 9 µm paper, ~ 100 µm using 3 µm paper, and then using 1 µm paper. The
sample is then thinned to ~ 20 µm so that the interface is neat, clean and the silicon
is transparent on both sides of the sample. Excess silicon is removed from outside
of the copper grid and the sample is then gently washed with ethanol to remove
debris. The sample then subjected to PIPS (precision ion polishing system) where
the interface is thinned from above and below by Argon bombardement, whilst
varying the angle and power of the plasma beams.
Typically for MgO substrates, this process is started 6 ° above and below with a
beam of 3.5keV in 20 – 30 min bursts until ‘rainbow fringes’ appear at the
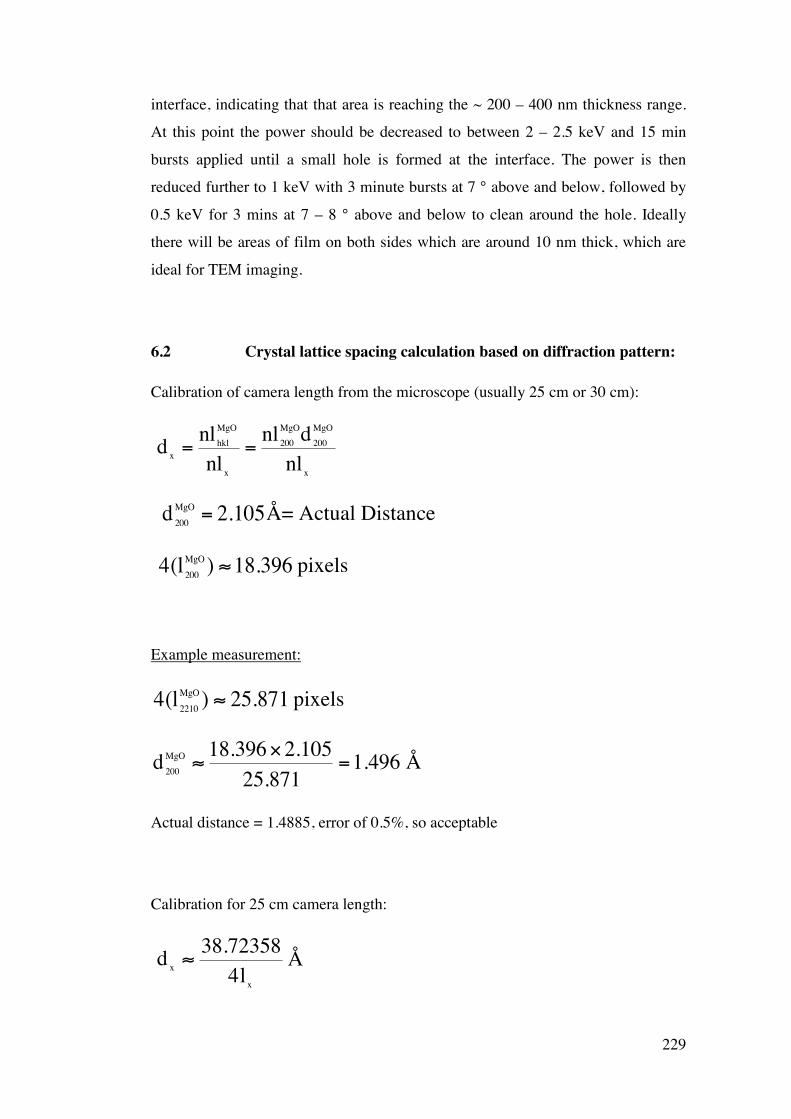
229
interface, indicating that that area is reaching the ~ 200 – 400 nm thickness range.
At this point the power should be decreased to between 2 – 2.5 keV and 15 min
bursts applied until a small hole is formed at the interface. The power is then
reduced further to 1 keV with 3 minute bursts at 7 ° above and below, followed by
0.5 keV for 3 mins at 7 – 8 ° above and below to clean around the hole. Ideally
there will be areas of film on both sides which are around 10 nm thick, which are
ideal for TEM imaging.
6.2 Crystal lattice spacing calculation based on diffraction pattern:
Calibration of camera length from the microscope (usually 25 cm or 30 cm):
d x =nlhkl
MgO
nlx
=nl200
MgOd200MgO
nlx
d 200MgO = 2.105Å= Actual Distance
4(l200MgO ) ≈18.396 pixels
Example measurement:
4(l2210MgO ) ≈ 25.871 pixels
d 200MgO ≈
18.396×2.10525.871
=1.496 Å
Actual distance = 1.4885, error of 0.5%, so acceptable
Calibration for 25 cm camera length:
d x ≈38.72358
4lx
Å
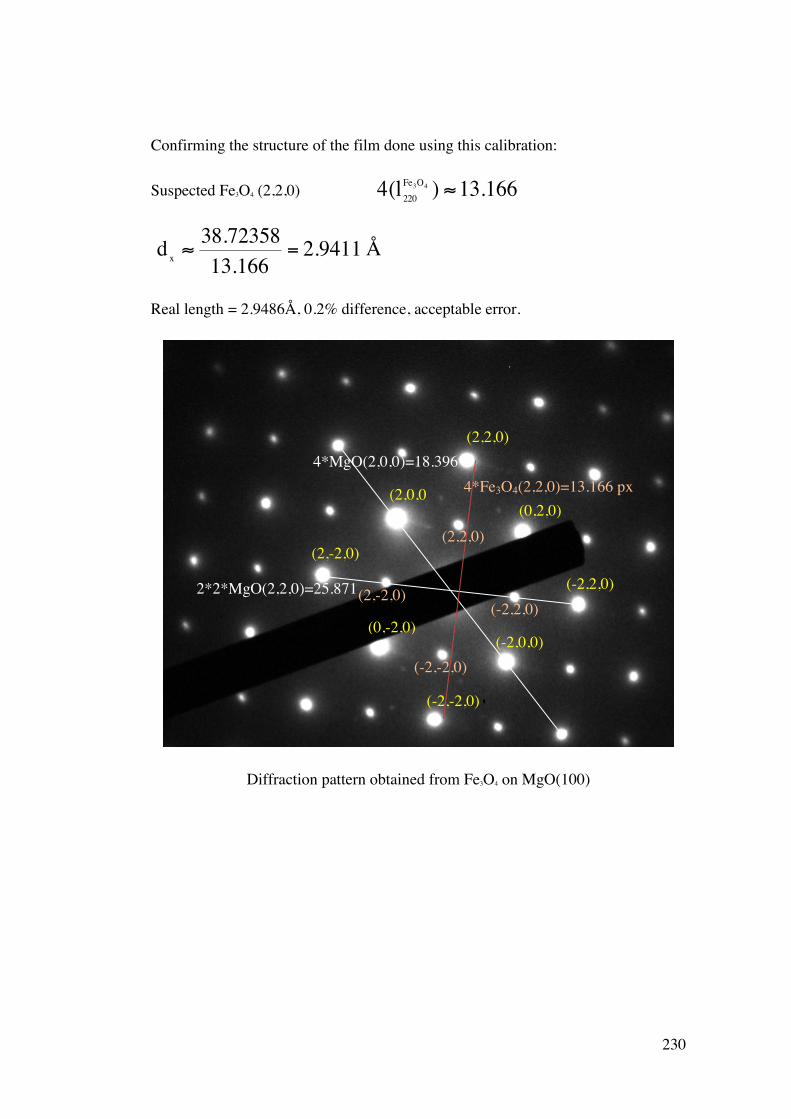
230
Confirming the structure of the film done using this calibration:
Suspected Fe3O4 (2,2,0) 4(l220Fe3O4 ) ≈13.166
d x ≈38.7235813.166
= 2.9411 Å
Real length = 2.9486Å, 0.2% difference, acceptable error.
Diffraction pattern obtained from Fe3O4 on MgO(100)
(2,0,0
)
(2,-2,0)
(2,2,0)
(0,2,0)
(0,-2,0) (-2,0,0)
(-2,-2,0)
(-2,2,0) 2*2*MgO(2,2,0)=25.871
4*MgO(2,0,0)=18.396
(2,2,0)
(-2,2,0)
(-2,-2,0)
(2,-2,0)
4*Fe3O4(2,2,0)=13.166 px
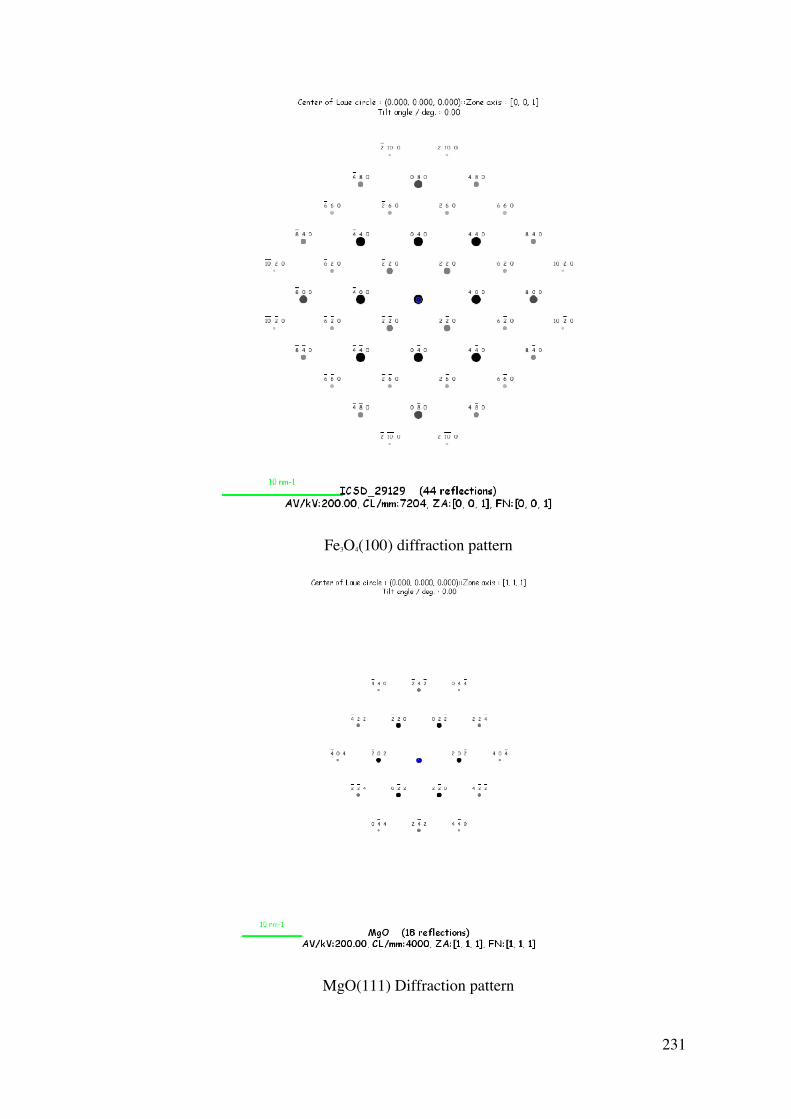
231
Fe3O4(100) diffraction pattern
MgO(111) Diffraction pattern
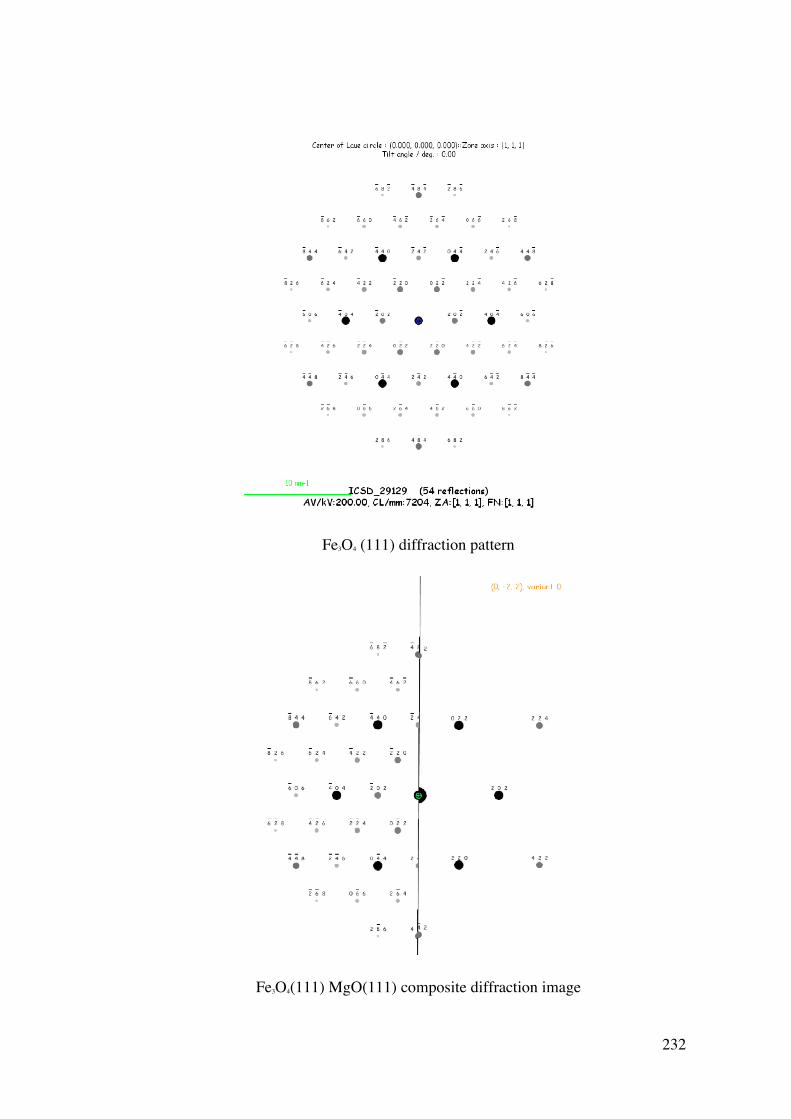
232
Fe3O4 (111) diffraction pattern
Fe3O4(111) MgO(111) composite diffraction image
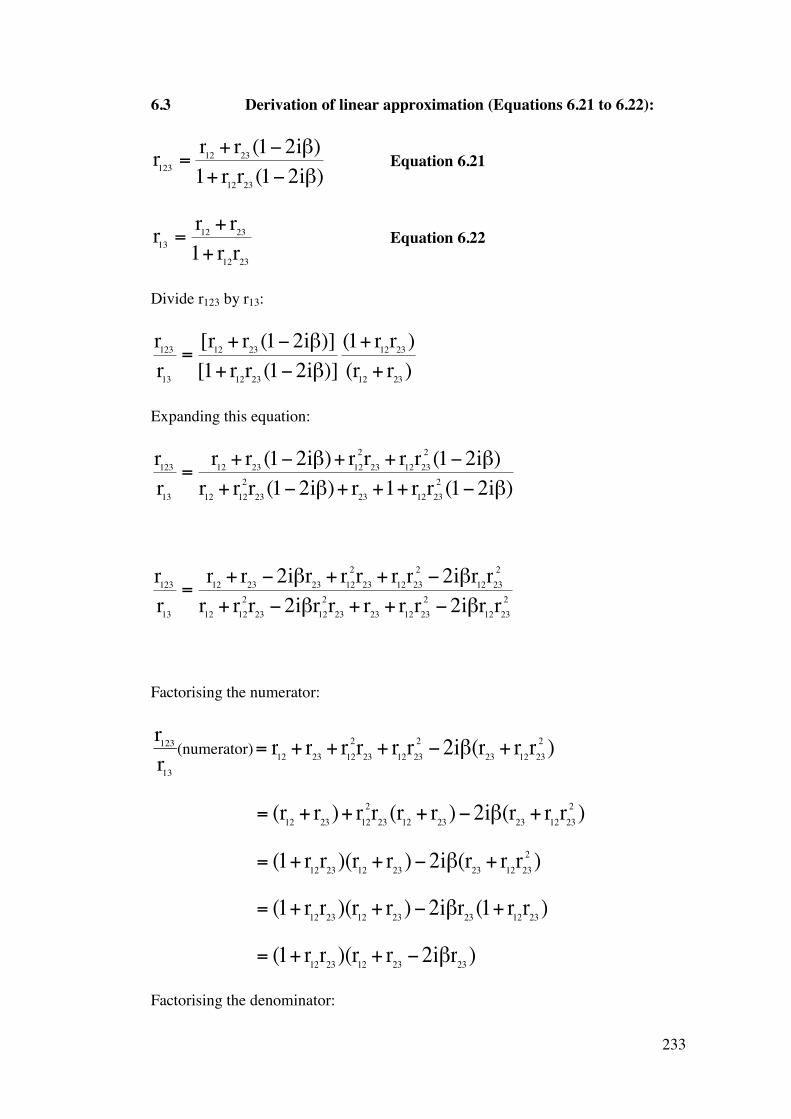
233
6.3 Derivation of linear approximation (Equations 6.21 to 6.22):
r123 =r12 + r23 (1−2iβ)1+ r12r23 (1−2iβ)
Equation 6.21
r13 =r12 + r23
1+ r12r23
Equation 6.22
Divide r123 by r13:
r123
r13
=[r12 + r23 (1−2iβ)][1+ r12r23 (1−2iβ)]
(1+ r12r23 )(r12 + r23 )
Expanding this equation:
r123
r13
=r12 + r23 (1−2iβ)+ r12
2r23 + r12r232 (1−2iβ)
r12 + r122r23 (1−2iβ)+ r23 +1+ r12r23
2 (1−2iβ)
r123
r13
=r12 + r23 −2iβr23 + r12
2r23 + r12r232 −2iβr12r23
2
r12 + r122r23 −2iβr12
2r23 + r23 + r12r232 −2iβr12r23
2
Factorising the numerator:
r123
r13
(numerator)= r12 + r23 + r122r23 + r12r23
2 −2iβ(r23 + r12r232 )
= (r12 + r23 )+ r122r23 (r12 + r23 )−2iβ(r23 + r12r23
2 )
= (1+ r12r23 )(r12 + r23 )−2iβ(r23 + r12r232 )
= (1+ r12r23 )(r12 + r23 )−2iβr23 (1+ r12r23 )
= (1+ r12r23 )(r12 + r23 −2iβr23 )
Factorising the denominator:
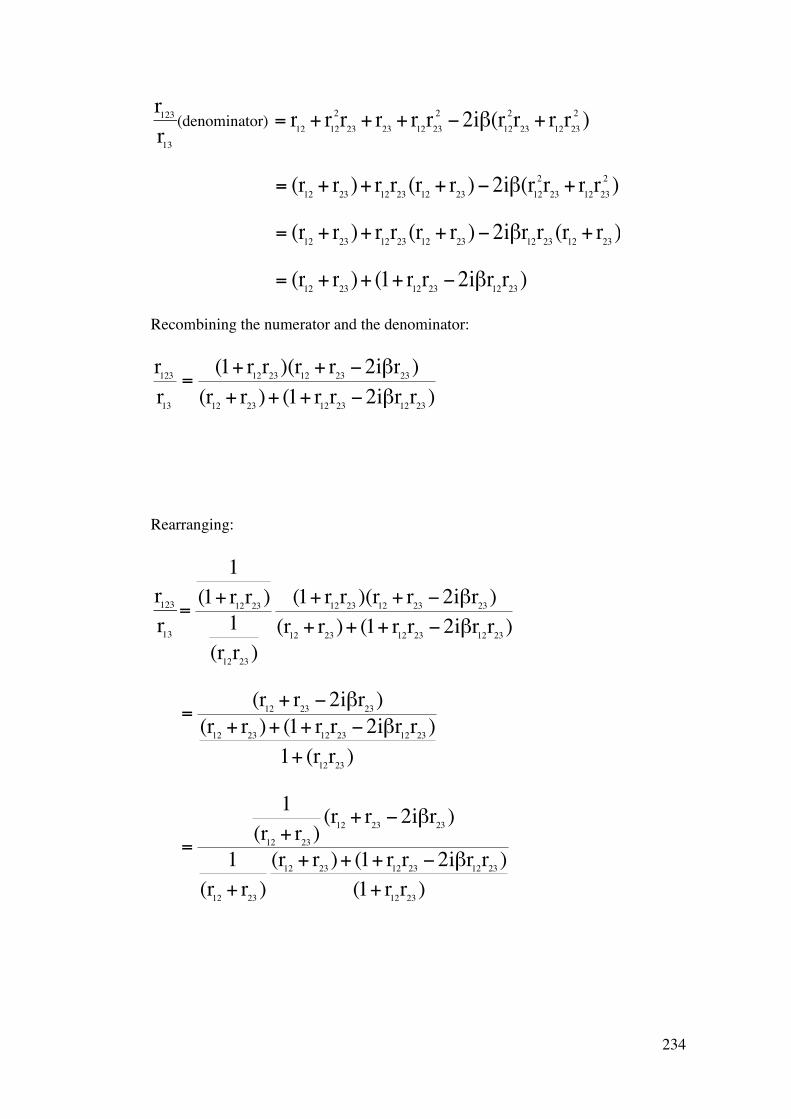
234
r123
r13
(denominator) = r12 + r122r23 + r23 + r12r23
2 −2iβ(r122r23 + r12r23
2 )
= (r12 + r23 )+ r12r23 (r12 + r23 )−2iβ(r122r23 + r12r23
2 )
= (r12 + r23 )+ r12r23 (r12 + r23 )−2iβr12r23 (r12 + r23 )
= (r12 + r23 )+ (1+ r12r23 −2iβr12r23 )
Recombining the numerator and the denominator:
r123
r13
=(1+ r12r23 )(r12 + r23 −2iβr23 )
(r12 + r23 )+ (1+ r12r23 −2iβr12r23 )
Rearranging:
r123
r13
=
1(1+ r12r23 )
1(r12r23 )
(1+ r12r23 )(r12 + r23 −2iβr23 )(r12 + r23 )+ (1+ r12r23 −2iβr12r23 )
=(r12 + r23 −2iβr23 )
(r12 + r23 )+ (1+ r12r23 −2iβr12r23 )1+ (r12r23 )
=
1(r12 + r23 )
(r12 + r23 −2iβr23 )
1(r12 + r23 )
(r12 + r23 )+ (1+ r12r23 −2iβr12r23 )(1+ r12r23 )
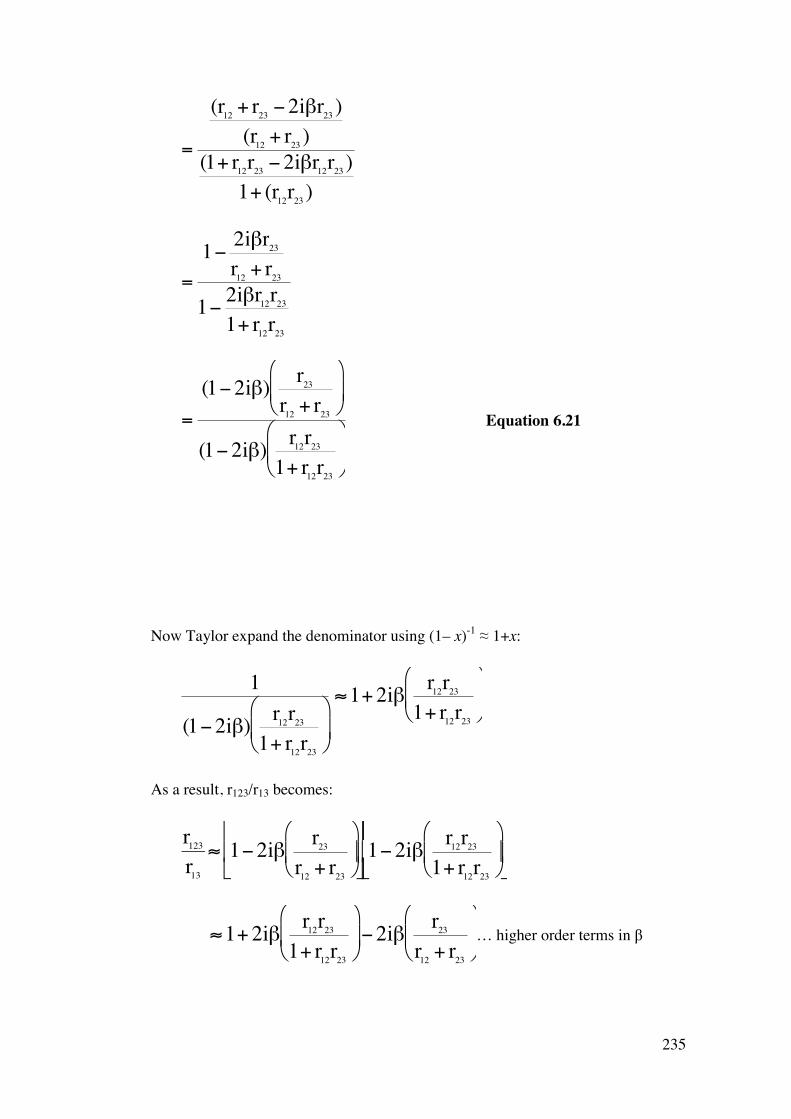
235
=
(r12 + r23 −2iβr23 )(r12 + r23 )
(1+ r12r23 −2iβr12r23 )1+ (r12r23 )
=1− 2iβr23
r12 + r23
1− 2iβr12r23
1+ r12r23
=
(1−2iβ) r23
r12 + r23
(1−2iβ) r12r23
1+ r12r23
Equation 6.21
Now Taylor expand the denominator using (1– x)-1 ≈ 1+x:
1
(1−2iβ) r12r23
1+ r12r23
≈1+ 2iβ r12r23
1+ r12r23
As a result, r123/r13 becomes:
r123
r13
≈ 1−2iβ r23
r12 + r23
1−2iβ r12r23
1+ r12r23
≈1+ 2iβ r12r23
1+ r12r23
−2iβ r23
r12 + r23
… higher order terms in β
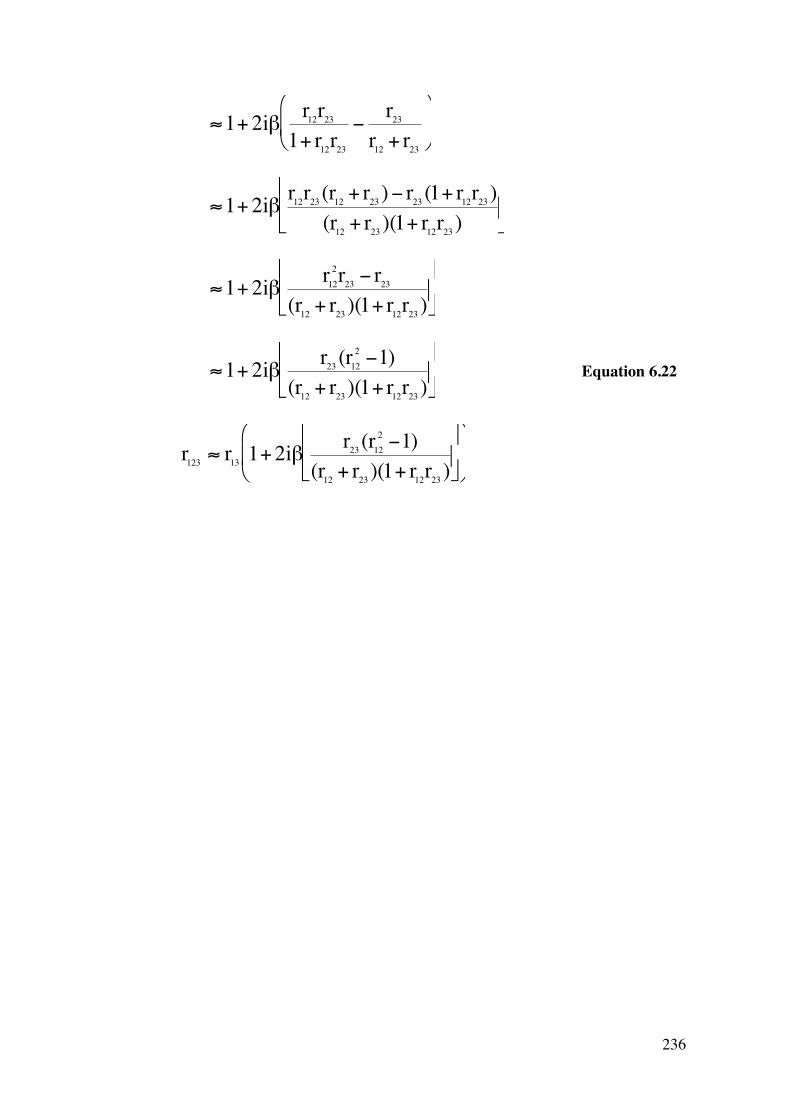
236
≈1+ 2iβ r12r23
1+ r12r23
−r23
r12 + r23
≈1+ 2iβ r12r23 (r12 + r23 )− r23 (1+ r12r23 )(r12 + r23 )(1+ r12r23 )
≈1+ 2iβ r122r23 − r23
(r12 + r23 )(1+ r12r23 )
≈1+ 2iβ r23 (r122 −1)
(r12 + r23 )(1+ r12r23 )
Equation 6.22
r123 ≈ r13 1+ 2iβ r23 (r122 −1)
(r12 + r23 )(1+ r12r23 )
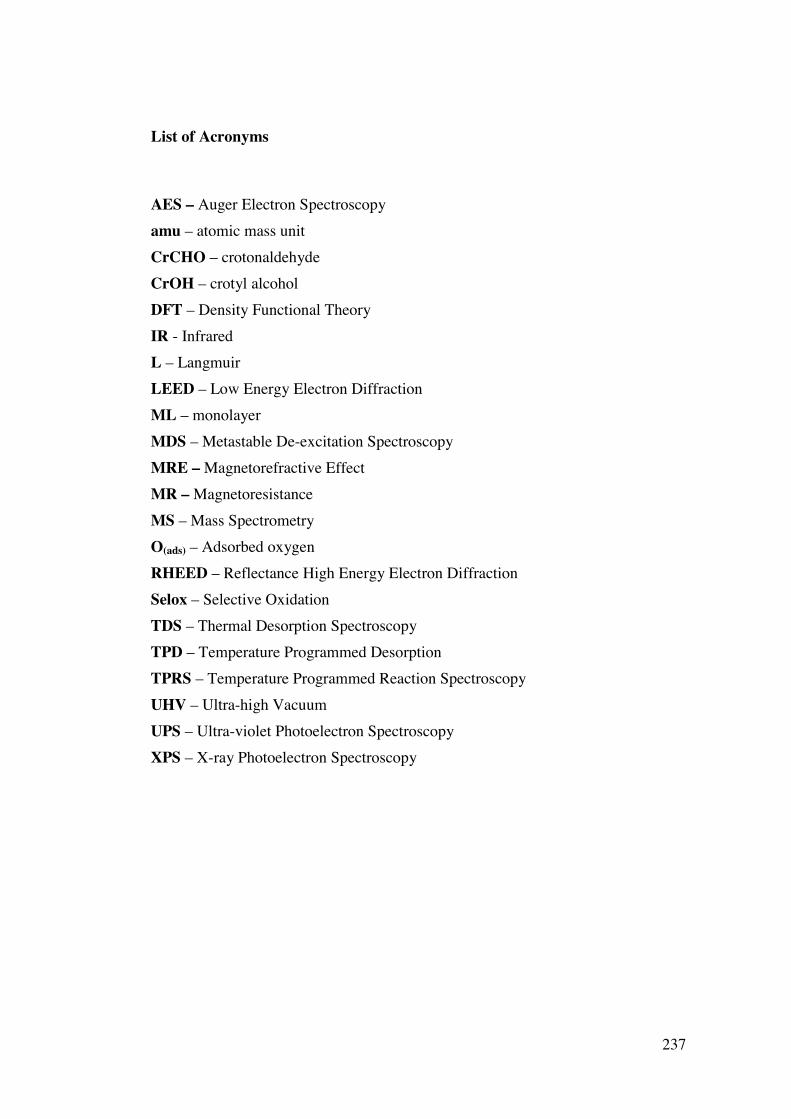
237
List of Acronyms
AES – Auger Electron Spectroscopy amu – atomic mass unit CrCHO – crotonaldehyde CrOH – crotyl alcohol DFT – Density Functional Theory IR - Infrared L – Langmuir LEED – Low Energy Electron Diffraction ML – monolayer MDS – Metastable De-excitation Spectroscopy MRE – Magnetorefractive Effect MR – Magnetoresistance MS – Mass Spectrometry O(ads) – Adsorbed oxygen RHEED – Reflectance High Energy Electron Diffraction Selox – Selective Oxidation TDS – Thermal Desorption Spectroscopy TPD – Temperature Programmed Desorption TPRS – Temperature Programmed Reaction Spectroscopy UHV – Ultra-high Vacuum UPS – Ultra-violet Photoelectron Spectroscopy XPS – X-ray Photoelectron Spectroscopy
Copyright © 2022 FDOKUMEN