Combinatorial Materials Science for Polymer Thin-Film Dewetting
10
Combinatorial Materials Science for Polymer Thin-Film Dewetting J. Carson Meredith, ² Archie P. Smith, Alamgir Karim,* and Eric J. Amis Polymers Division, National Institute of Standards and Technology, 100 Bureau Dr. Stop 8542, Gaithersburg, Maryland 20899-8542 Received July 25, 2000 ABSTRACT: Combinatorial methods involving data collection in multiparameter space allow a rapid identification of measured property trends as a function of system parameters. The technique has been applied with success to pharmaceutical, inorganic and organic materials synthesis, but not significantly to measurements of polymeric films and coatings. We demonstrate the use of 2-D combinatorial libraries to investigate thin-film dewetting. We have prepared libraries of thin films of polystyrene on silicon substrates containing orthogonal, continuous variations of thickness (h), and temperature (T) that represent about 1200 practical state points per library. The libraries were screened for dewetting behavior using automated optical microscopy. Dewetting trends were visibly apparent on the libraries, and a comprehensive map of the T, h, and time (t) dependence was generated in a few hours. The combinatorial libraries, spanning a large T, h, and t range, not only reproduced known dewetting structures and phenomena but also enabled a novel T, h superposition of the heterogeneous nucleated hole dewetting kinetics. We observed three hole nucleation regimes as a function of thickness: heterogeneously nucleated holes (h > 55 nm), a crossover regime where both heterogeneous and capillary instability nucleation compete (33 nm < h < 55 nm), and a regime of holes nucleated by capillary instability (16 nm < h < 33 nm). Introduction Combinatorial and high-throughput characterization methods have changed the paradigm of pharmaceutical research and are likely to have a similar impact on materials science. 1-3 Already there are examples of combinatorial methods for inorganic 4-11 and organic 12-17 materials synthesis. In the midst of the excitement to “make things” with high-throughput synthesis methods, another opportunity arises to make measurements and “understand things” with combinatorial methods. Rapid and systematic generation of experimental data in multiparameter space using combinatorial methods can facilitate the observation of novel phenomena and the development of predictive models. Combinatorial meth- ods also can be used as a primary screen of parameter space to identify regimes of interest for traditional one- sample-for-one-measurement investigations. This paper reports the use of two-dimensional com- binatorial libraries to characterize materials properties of polymeric thin films. In a recent paper, we reported combinatorial methods for mapping thin film polymer blend phase behavior. 18 We applied standard concepts of combinatorial methods: library creation, high- throughput assays, and informatics to investigate phase separation. In this work we extend the methodology to the physics of polymer thin film dewetting behavior. Dewetting represents an ideal phenomenon for combi- natorial analysis because a number of parameters interact to create complex thermodynamic and kinetic behavior. In addition, polymer thin-film dewetting is fundamental to technologies including microelectronics, lubricants, adhesives, and coatings. The critical vari- ables that determine film stability and dewetting kinet- ics are thickness (h), molecular mass (M r ), surface chemistry, and temperature (T). 19-21 The breadth of parameter space and the complex interactions among these variables present a significant challenge to con- ventional experimental methodologies, so that previous studies usually varied only single parameters (e.g, h, M r ). In particular, systematic studies of the effect of T on dewetting kinetics have not been reported. Unfortunately, many of the vapor phase and high- temperature techniques (e.g., sputtering) used to deposit libraries of inorganic materials are not applicable to polymers. In the Experimental Methodology we present novel methods for creating continuous and orthogonal gradients in T and h for polymer thin films. Automated optical microscopy is used for high-throughput screening of the T, h libraries to identify wetted versus dewetted regions and to measure the T and h dependence of dewetted structure type, size, density, and evolution rate. We demonstrate that combinatorial libraries re- produce dewetted structures observed in previous non- combinatorial studies. 20,22-24 We then present several novel observations of the temperature dependence of dewetting kinetics and thickness dependence of nucle- ation, made possible by screening a large variable space with combinatorial methods. Experimental Methodology Library Creation. Figure 1 gives a schematic de- scription of the application of the combinatorial method to thin-film dewetting. We prepared film libraries in which temperature (T) and thickness (h) were varied systematically over the substrate, sampling multiple processing conditions and film properties simulta- neously. Thickness gradients were prepared on “piranha- etched” 25,26 silicon wafers (Polishing Corporation of America) 27 with a velocity-gradient, knife-edge coating apparatus. A drop of polymer solution was spread over the substrate under an angled steel blade (5° relative to substrate) at constant acceleration by using a feedback- controlled translation stage (Compumotor). The solvent dried within seconds of spreading and resulted in a polymer film with a gradient in thickness. Solutions ² Present address: School of Chemical Engineering, Georgia Institute of Technology, Atlanta, GA 30332-0100. 9747 Macromolecules 2000, 33, 9747-9756 10.1021/ma001298g CCC: $19.00 © 2000 American Chemical Society Published on Web 12/02/2000
-
Upload
independent -
Category
Documents
-
view
1 -
download
0
Transcript of Combinatorial Materials Science for Polymer Thin-Film Dewetting
Combinatorial Materials Science for Polymer Thin-Film Dewetting
J. Carson Meredith,† Archie P. Smith, Alamgir Karim,* and Eric J. Amis
Polymers Division, National Institute of Standards and Technology, 100 Bureau Dr. Stop 8542,Gaithersburg, Maryland 20899-8542
Received July 25, 2000
ABSTRACT: Combinatorial methods involving data collection in multiparameter space allow a rapididentification of measured property trends as a function of system parameters. The technique has beenapplied with success to pharmaceutical, inorganic and organic materials synthesis, but not significantlyto measurements of polymeric films and coatings. We demonstrate the use of 2-D combinatorial librariesto investigate thin-film dewetting. We have prepared libraries of thin films of polystyrene on siliconsubstrates containing orthogonal, continuous variations of thickness (h), and temperature (T) thatrepresent about 1200 practical state points per library. The libraries were screened for dewetting behaviorusing automated optical microscopy. Dewetting trends were visibly apparent on the libraries, and acomprehensive map of the T, h, and time (t) dependence was generated in a few hours. The combinatoriallibraries, spanning a large T, h, and t range, not only reproduced known dewetting structures andphenomena but also enabled a novel T, h superposition of the heterogeneous nucleated hole dewettingkinetics. We observed three hole nucleation regimes as a function of thickness: heterogeneously nucleatedholes (h > 55 nm), a crossover regime where both heterogeneous and capillary instability nucleationcompete (33 nm < h < 55 nm), and a regime of holes nucleated by capillary instability (16 nm < h < 33nm).
Introduction
Combinatorial and high-throughput characterizationmethods have changed the paradigm of pharmaceuticalresearch and are likely to have a similar impact onmaterials science.1-3 Already there are examples ofcombinatorial methods for inorganic4-11 and organic12-17
materials synthesis. In the midst of the excitement to“make things” with high-throughput synthesis methods,another opportunity arises to make measurements and“understand things” with combinatorial methods. Rapidand systematic generation of experimental data inmultiparameter space using combinatorial methods canfacilitate the observation of novel phenomena and thedevelopment of predictive models. Combinatorial meth-ods also can be used as a primary screen of parameterspace to identify regimes of interest for traditional one-sample-for-one-measurement investigations.
This paper reports the use of two-dimensional com-binatorial libraries to characterize materials propertiesof polymeric thin films. In a recent paper, we reportedcombinatorial methods for mapping thin film polymerblend phase behavior.18 We applied standard conceptsof combinatorial methods: library creation, high-throughput assays, and informatics to investigate phaseseparation. In this work we extend the methodology tothe physics of polymer thin film dewetting behavior.Dewetting represents an ideal phenomenon for combi-natorial analysis because a number of parametersinteract to create complex thermodynamic and kineticbehavior. In addition, polymer thin-film dewetting isfundamental to technologies including microelectronics,lubricants, adhesives, and coatings. The critical vari-ables that determine film stability and dewetting kinet-ics are thickness (h), molecular mass (Mr), surfacechemistry, and temperature (T).19-21 The breadth ofparameter space and the complex interactions among
these variables present a significant challenge to con-ventional experimental methodologies, so that previousstudies usually varied only single parameters (e.g, h,Mr). In particular, systematic studies of the effect of Ton dewetting kinetics have not been reported.
Unfortunately, many of the vapor phase and high-temperature techniques (e.g., sputtering) used to depositlibraries of inorganic materials are not applicable topolymers. In the Experimental Methodology we presentnovel methods for creating continuous and orthogonalgradients in T and h for polymer thin films. Automatedoptical microscopy is used for high-throughput screeningof the T, h libraries to identify wetted versus dewettedregions and to measure the T and h dependence ofdewetted structure type, size, density, and evolutionrate. We demonstrate that combinatorial libraries re-produce dewetted structures observed in previous non-combinatorial studies.20,22-24 We then present severalnovel observations of the temperature dependence ofdewetting kinetics and thickness dependence of nucle-ation, made possible by screening a large variable spacewith combinatorial methods.
Experimental Methodology
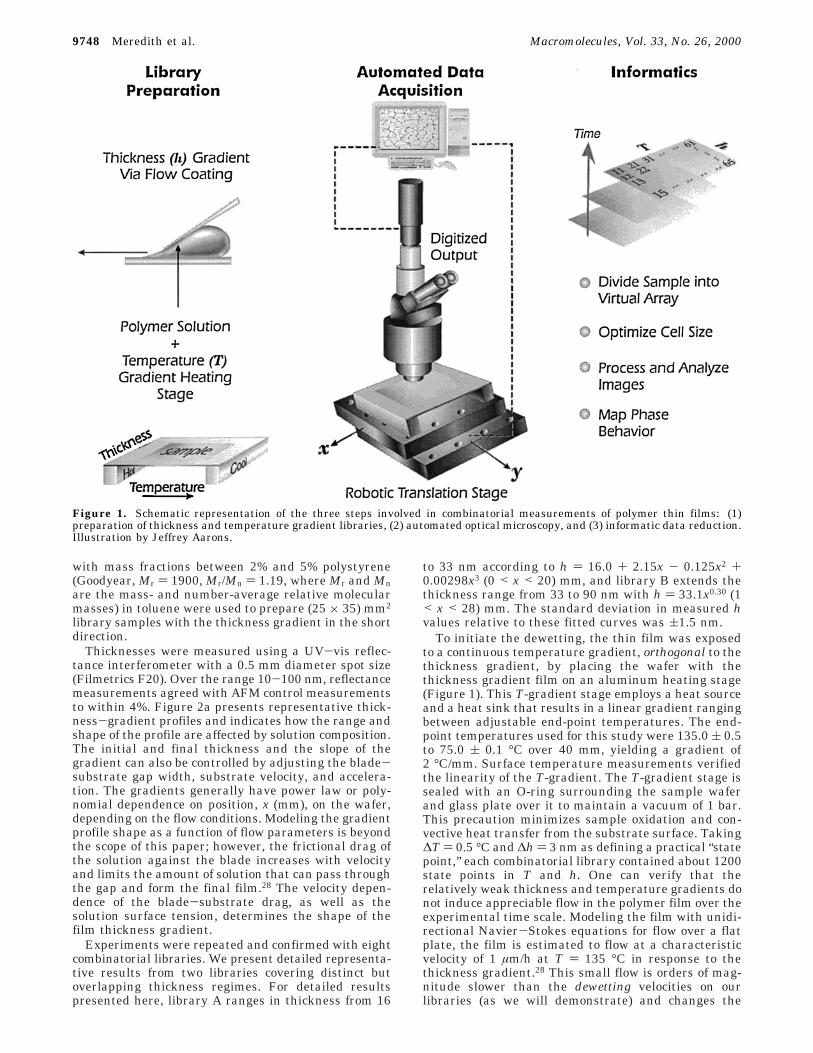
Library Creation. Figure 1 gives a schematic de-scription of the application of the combinatorial methodto thin-film dewetting. We prepared film libraries inwhich temperature (T) and thickness (h) were variedsystematically over the substrate, sampling multipleprocessing conditions and film properties simulta-neously. Thickness gradients were prepared on “piranha-etched”25,26 silicon wafers (Polishing Corporation ofAmerica)27 with a velocity-gradient, knife-edge coatingapparatus. A drop of polymer solution was spread overthe substrate under an angled steel blade (5° relativeto substrate) at constant acceleration by using a feedback-controlled translation stage (Compumotor). The solventdried within seconds of spreading and resulted in apolymer film with a gradient in thickness. Solutions
† Present address: School of Chemical Engineering, GeorgiaInstitute of Technology, Atlanta, GA 30332-0100.
9747Macromolecules 2000, 33, 9747-9756
10.1021/ma001298g CCC: $19.00 © 2000 American Chemical SocietyPublished on Web 12/02/2000
with mass fractions between 2% and 5% polystyrene(Goodyear, Mr ) 1900, Mr/Mn ) 1.19, where Mr and Mnare the mass- and number-average relative molecularmasses) in toluene were used to prepare (25 × 35) mm2
library samples with the thickness gradient in the shortdirection.
Thicknesses were measured using a UV-vis reflec-tance interferometer with a 0.5 mm diameter spot size(Filmetrics F20). Over the range 10-100 nm, reflectancemeasurements agreed with AFM control measurementsto within 4%. Figure 2a presents representative thick-ness-gradient profiles and indicates how the range andshape of the profile are affected by solution composition.The initial and final thickness and the slope of thegradient can also be controlled by adjusting the blade-substrate gap width, substrate velocity, and accelera-tion. The gradients generally have power law or poly-nomial dependence on position, x (mm), on the wafer,depending on the flow conditions. Modeling the gradientprofile shape as a function of flow parameters is beyondthe scope of this paper; however, the frictional drag ofthe solution against the blade increases with velocityand limits the amount of solution that can pass throughthe gap and form the final film.28 The velocity depen-dence of the blade-substrate drag, as well as thesolution surface tension, determines the shape of thefilm thickness gradient.
Experiments were repeated and confirmed with eightcombinatorial libraries. We present detailed representa-tive results from two libraries covering distinct butoverlapping thickness regimes. For detailed resultspresented here, library A ranges in thickness from 16
to 33 nm according to h ) 16.0 + 2.15x - 0.125x2 +0.00298x3 (0 < x < 20) mm, and library B extends thethickness range from 33 to 90 nm with h ) 33.1x0.30 (1< x < 28) mm. The standard deviation in measured hvalues relative to these fitted curves was (1.5 nm.
To initiate the dewetting, the thin film was exposedto a continuous temperature gradient, orthogonal to thethickness gradient, by placing the wafer with thethickness gradient film on an aluminum heating stage(Figure 1). This T-gradient stage employs a heat sourceand a heat sink that results in a linear gradient rangingbetween adjustable end-point temperatures. The end-point temperatures used for this study were 135.0 ( 0.5to 75.0 ( 0.1 °C over 40 mm, yielding a gradient of2 °C/mm. Surface temperature measurements verifiedthe linearity of the T-gradient. The T-gradient stage issealed with an O-ring surrounding the sample waferand glass plate over it to maintain a vacuum of 1 bar.This precaution minimizes sample oxidation and con-vective heat transfer from the substrate surface. Taking∆T ) 0.5 °C and ∆h ) 3 nm as defining a practical “statepoint,” each combinatorial library contained about 1200state points in T and h. One can verify that therelatively weak thickness and temperature gradients donot induce appreciable flow in the polymer film over theexperimental time scale. Modeling the film with unidi-rectional Navier-Stokes equations for flow over a flatplate, the film is estimated to flow at a characteristicvelocity of 1 µm/h at T ) 135 °C in response to thethickness gradient.28 This small flow is orders of mag-nitude slower than the dewetting velocities on ourlibraries (as we will demonstrate) and changes the
Figure 1. Schematic representation of the three steps involved in combinatorial measurements of polymer thin films: (1)preparation of thickness and temperature gradient libraries, (2) automated optical microscopy, and (3) informatic data reduction.Illustration by Jeffrey Aarons.
9748 Meredith et al. Macromolecules, Vol. 33, No. 26, 2000

initial thickness only by about 0.5 nm/h in each imagearea. To check for gravitational or convection flow, weexamined four thickness-gradient libraries before andafter heating on the temperature gradient stage. Basedon T regions that did not significantly dewet within theannealing time of 2 h, the difference of thicknessgradients before and after annealing was within thestandard uncertainty of (1.5 nm, shown in Figure 2b.
High-Throughput Screening. An automated opti-cal microscope (Nikon Optiphot 2) was used to monitorthe evolution of dewetted microstructures on the librar-ies. A black and white CCD camera (Kodak ES1.0)coupled to the microscope sent 1024 × 1024 pixel, 8 bitdigitized images to a computer that also synchronizedsample stage movement over a grid of T and h condi-tions using motorized translation stages. At the begin-ning of each time cycle, the translation stage returnedto a home position to within (0.5 µm. In a typicalexperiment, the T-h-t dependence of dewetting struc-tures was followed by collecting a 5 by 5 array of 200×or 500× magnification images every 5 min over a periodof 2 h, for a total of 600 images. Thus, each imagerepresents the dewetting at a certain point in T-h-t
space. At the completion of the experiment a 5 by 6array of lower magnification images is collected andused to create a mosaic image of the entire library(Figure 3).
Because of a concern that the two-dimensional gra-dients in thickness and temperature might distort theevolution of dewetted structures, control experimentswere performed on one-dimensional gradient samples,in addition to our comparison to literature results fromuniform samples. We performed spot-checks for certainT and h values with constant thickness samples heatedon the temperature gradient stage and constant tem-perature samples that contained thickness gradients.The dewetted structures that occurred on one-dimen-sional controls and two-dimensional libraries wereidentical, within experimental uncertainty, for the samewafer preparation conditions.
Informatic Analysis. For quantitative analysis ofimages, we averaged the library T and h values overan arbitrary image area and indicate these averagevalues as Th and hh. The library data are thus dividedinto a virtual array of images that each correspond to aparticular Th , hh, and t. By using a custom batch program(NIH Image), optical images are automatically thresh-olded, and the dewetted area fraction, Ad, is measuredbased upon the inner dewet hole area (excluding holerims). Using a larger image area for analysis increasesthe number of structures observed at each Th , hh, and t,which improves the statistics of hole size measurementleading to more representative results. On the otherhand, larger images also increase the variance in Th andhh over the image area because of the gradients. Theproper selection of image size for analysis must reflecta balance between counting statistics and variance inTh and hh, e.g., ∆Th and ∆hh. For library A, a 500× imagecontains over 100 holes with a standard uncertaintyalong each cell edge of ∆Th ) 0.4 °C and ∆hh ) 3.0 nm,respectively. Since the structures on library B arelarger, a 200× image is used, which yields standarduncertainties of ∆Th ) 1.0 °C and ∆hh ) 6.0 nm. Basedon these variances, libraries A and B contain ap-proximately 2450 unique Th , hh conditions. It would takeat least several months to screen dewetting behaviorfor 2450 individual conditions by traditional methods,but with combinatorial methods these Th , hh conditionscan be screened in a few hours per library.
Results
Figure 3 presents a composite set of optical micro-scope images of library B at t ) 2 h. (Structures onlibrary A are too small to be represented at the printresolution of Figure 3, and higher magnification imagesfrom library A are presented instead in Figure 4.) Theoverall wetted and dewetted pattern features are in factvisible as dark and bright regions, respectively, to theunaided eye. Figure 4 shows selected regions fromwafers A and B with higher magnification optical andatomic force microscopy (AFM, Digital InstrumentsDimension 3000). There are several distinct regions withdifferent dewetted structures and kinetics. For hh >57 nm, discrete circular holes in the film nucleate andgrow at a rate dependent on Th (quantification of the rateis given in Figure 6). In this thickness regime is ademarcation in Th and hh space separating low T, slow-growing isolated holes (Figure 4d) from high Th , fastgrowing holes (Figure 4a) that have impinged to formpolygons. Higher magnification reveals particles in the
Figure 2. (a) Thickness gradient profiles as measured byellipsometry for PS mass fraction 2-5% in toluene. Thevelocity-gradient flow-coating parameters were blade-sub-strate gap ) 300 µm, maximum velocity ) 9 mm/s, andacceleration ) 1.5 mm/s2. (b) Thickness gradient profiles beforeand after annealing on the temperature gradient stage for afilm flow coated from a mass fraction 5% PS solution usingthe same parameters as in (a). The temperature gradient was135-85 °C over 30 mm. The two profiles agree well, indicatingthat the film does not flow appreciably during the annealingprocess. The thickness measurement after heating was basedon areas that did not significantly dewet during the annealingtime of 2 h.
Macromolecules, Vol. 33, No. 26, 2000 Polymer Thin Film Dewetting 9749

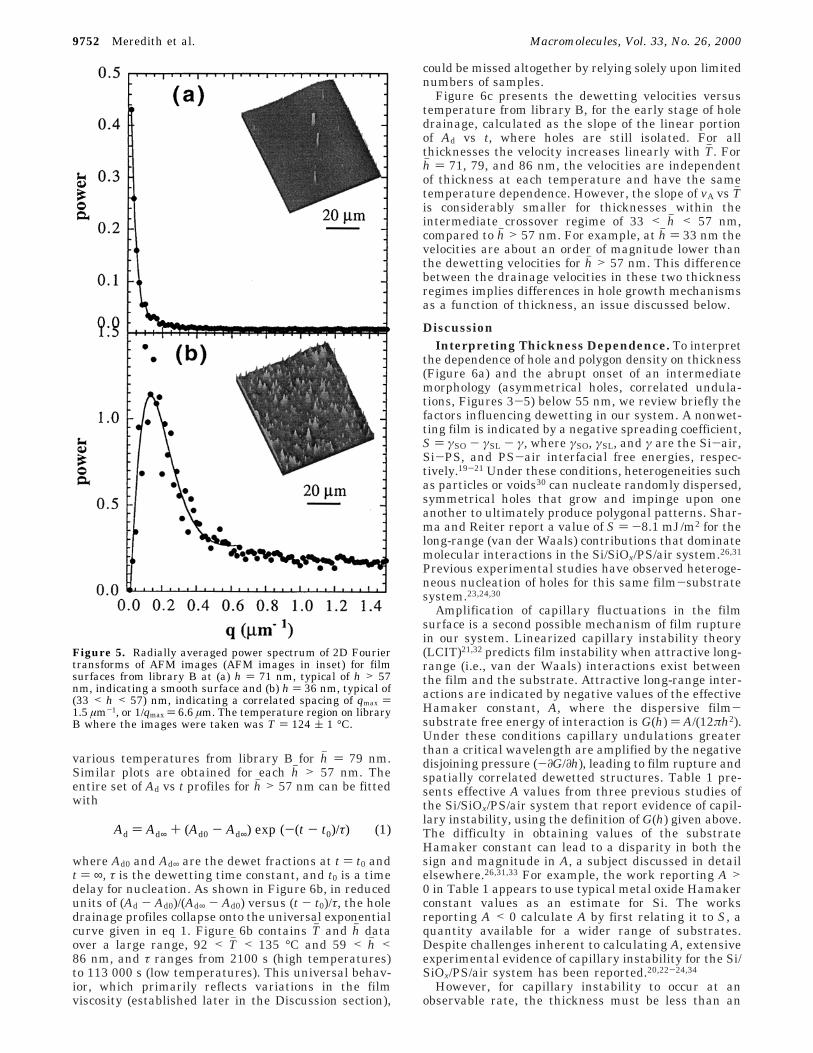
centers of many of the holes that may indicate hetero-geneous nucleation sites for hh > 57 nm. AFM imagesindicate that the unbroken film surface (Figure 5a) issmooth for hh > 57 nm, with a root-mean-square (rms)roughness of 1 nm and no periodic structure.
Below hh ≈ 57 nm, there is a sharp and temperature-independent transition to a regime where irregular,asymmetrical holes (Figure 4b) nucleate and grow moreslowly than at higher thicknesses. Figure 4e shows anoptical micrograph from a region similar to Figure 4b,at higher magnification. The thresholded image indi-cates two patterns: asymmetrical holes surrounded bybicontinuous undulations in the film surface. The bi-continuous undulations do not break the surface of thefilm after 2 h. A similar structure consisting of asym-metrical holes that break up into a bicontinuous patternat late stage, termed an “intermediate morphology”, hasbeen observed recently for 12 nm thick films of poly-(styrene-ran-acrylonitrile).29 As measured by AFM (Fig-ure 5b), the film surface below h ) 57 nm is roughenedwith correlated surface undulations. For example, Fig-ure 5b shows an AFM image for hh ) 36 nm with rmsroughness of 6.5 nm, compared to the 1 nm roughnessof the unbroken surface for hh > 57 nm. The 2D Fouriertransform (Figure 5b) shows a strong correlation peak,and the undulations have an average spacing of 1/qmax) 7 µm. The onset thickness, below which asymmetricalholes and correlated undulations are observed (57 nmin Figure 3), is measured to be 55 ( 4 nm from fivedifferent combinatorial libraries. The deviation in thisonset thickness is presumed to be caused by smalldifferences in the silicon oxide layer introduced duringsubstrate cleaning.
Below hh ≈ 33 nm, another transition in structure isapparent from higher magnification images of libraryA. For these thicknesses, holes (Figure 4f) grow morequickly than in the region 33 nm < hh < 57 nm andimpinge to form small polygons (Figure 4c) withinseveral minutes to about 2 h, depending on Th . Bycollecting the comprehensive Th , hh, and t dependence ofdewetting, these trends in the structures are im-mediately observed and serve as a guide for detailedstudy of each regime, model selection, and quantitativeanalysis.
We note that there are a few small patches on thelibraries (Figure 3) that have wetted or dewetted areasthat are discontinuous from the surrounding areas.These spurious areas, which amount to less than 5% ofthe surface area, probably represent nonequilibriumregions or chemical heterogeneities introduced duringwafer preparation, a complication inherent to all (evennoncombinatorial) thin-film studies. The results of thispaper do not depend on these spurious regions, and theycan be excluded from the analysis that follows.
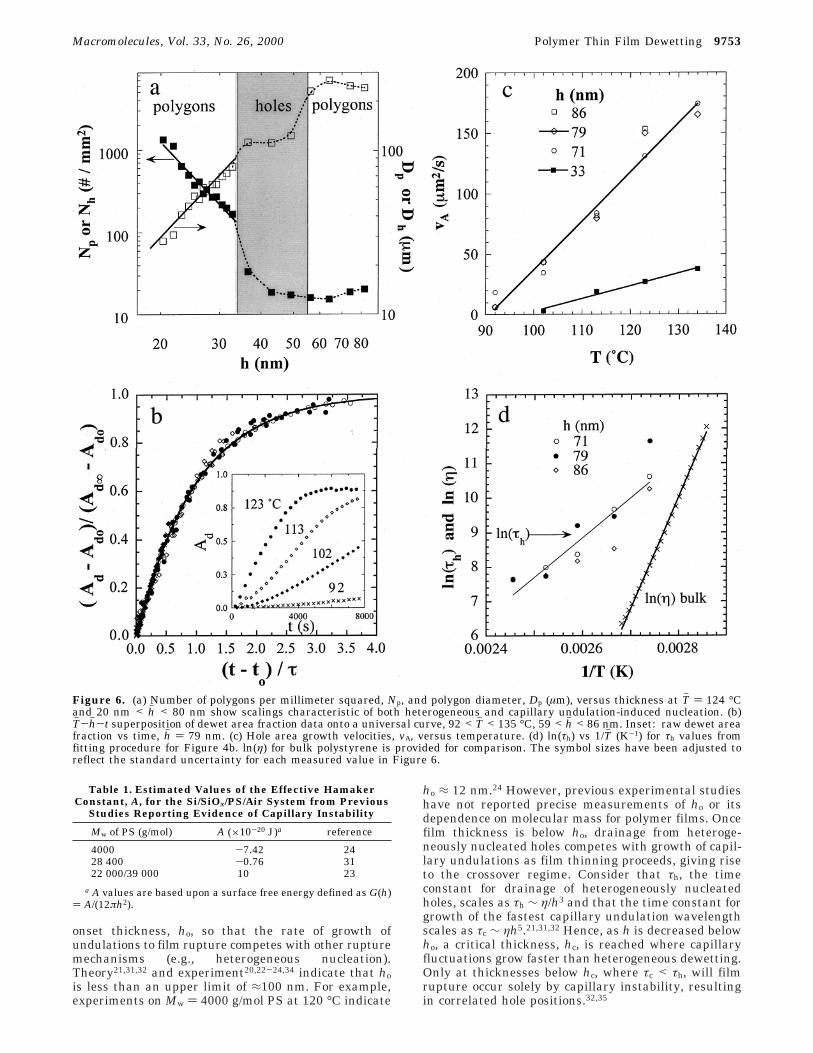
We performed a quantitative analysis of the thicknessand temperature dependence of dewetted structures onthe sample libraries as a function of thickness. Figure6a shows the number density, Np (Nh), and circulareffective diameter, Dp (Dh), of polygons (holes) at Th )124 °C and t ) 2 h over the entire thickness range.Three regimes are observed: hh < 33 nm, 33 nm < hh <57 nm, and hh > 57 nm. Linear least-squares fits to thedata for hh < 33 nm indicate that Np ∼ hh-4.3(0.3 and Dp∼ hh-2.1(0.1. These scaling exponents were also observedin previous work with uniform samples20,22 and arepredicted from theory21,32 for nucleation by capillary
Figure 3. Composite of optical images of library B combinatorial library of PS on silicon, t ) 2 h, 25× magnification. Boxedregions A, B, and D identify higher magnification images given in Figure 4a,b,d. Scale bar ) 2.0 ( 0.1 mm. The thickness scaleis a power law function, reflecting the nonlinear thickness gradient deposition procedure. Images from library A are too small tobe reasonable represented at the scale used in Figure 3.
9750 Meredith et al. Macromolecules, Vol. 33, No. 26, 2000

instability. For hh > 57 nm, Np and Dp are essentiallyinvariant with hh, indicating randomly dispersed nucle-ation sites. The intermediate regime, 33 nm < hh < 57nm, shown by the shaded region in Figure 6a, indicatesa crossover for the nucleation and structure size depen-dence on hh, an issue expanded upon in the discussion.Based on the dewetted area versus time profiles (Figure6b), dewetting approaches late stage within 2 h at 124°C for hh < 33 nm and hh > 57 nm. However, it isimportant to note that the regime 33 < hh < 57 nm isnot at late stage “equilibrium” after 2 h of annealing at124 °C. The holes in this crossover or intermediateregime grow slower (rate given in Figure 6c), and thestructures are qualitatively different (i.e., asymmetricalholes and surface undulations) than for hh < 33 nm and
hh > 57 nm. The plateau in Dh in the shaded region ofFigure 6a is caused by the fact that the slowly growingasymmetrical holes in the crossover regime have not yetreached late stage. In the discussion these differencesin morphology and dewetting rate are described in termsof heterogeneous versus capillary instability hole nucle-ation and growth.
Systematic studies of the temperature dependence ofdewetting rates have not been reported to our knowl-edge. However, through its effect on viscosity, T has astrong influence on hole drainage rates. The T-gradientlibraries presented here offer a convenient means toassay a broad range of temperatures and dewettingrates in a single experiment. The inset to Figure 6bshows the raw dewetted area fraction, Ad, versus t at
Figure 4. Close-up optical images of boxed regions from Figure 2, specified by [Th °C, hh nm], illustrating the variety of structuresobserved on the combinatorial libraries. (A) [124, 71], polygons typical for h > 57 nm; (B) [124, 36], asymmetrical holes typical of33 < h < 57 nm; (C) [128, 24], small polygons typical of h < 33 nm; (D) [92, 71], symmetrical holes; (E) [124, 36], high-magnificationthresholded image typical of regime 33 < h < 57 nm (as in (b)) indicating two patterns: asymmetrical holes and bicontinuousundulations; (F) [123, 31], high-magnification image of early stage of dewetting typical of h < 33 nm. Scale bar ) 640 ( 10 µmfor (A)-(D), 55 ( 5 µm for (E), and 64 ( 2 µm for (F).
Macromolecules, Vol. 33, No. 26, 2000 Polymer Thin Film Dewetting 9751
various temperatures from library B for hh ) 79 nm.Similar plots are obtained for each hh > 57 nm. Theentire set of Ad vs t profiles for hh > 57 nm can be fittedwith
where Ad0 and Ad∞ are the dewet fractions at t ) t0 andt ) ∞, τ is the dewetting time constant, and t0 is a timedelay for nucleation. As shown in Figure 6b, in reducedunits of (Ad - Ad0)/(Ad∞ - Ad0) versus (t - t0)/τ, the holedrainage profiles collapse onto the universal exponentialcurve given in eq 1. Figure 6b contains Th and hh dataover a large range, 92 < Th < 135 °C and 59 < hh <86 nm, and τ ranges from 2100 s (high temperatures)to 113 000 s (low temperatures). This universal behav-ior, which primarily reflects variations in the filmviscosity (established later in the Discussion section),
could be missed altogether by relying solely upon limitednumbers of samples.
Figure 6c presents the dewetting velocities versustemperature from library B, for the early stage of holedrainage, calculated as the slope of the linear portionof Ad vs t, where holes are still isolated. For allthicknesses the velocity increases linearly with Th . Forhh ) 71, 79, and 86 nm, the velocities are independentof thickness at each temperature and have the sametemperature dependence. However, the slope of vA vs This considerably smaller for thicknesses within theintermediate crossover regime of 33 < hh < 57 nm,compared to hh > 57 nm. For example, at hh ) 33 nm thevelocities are about an order of magnitude lower thanthe dewetting velocities for hh > 57 nm. This differencebetween the drainage velocities in these two thicknessregimes implies differences in hole growth mechanismsas a function of thickness, an issue discussed below.
DiscussionInterpreting Thickness Dependence. To interpret
the dependence of hole and polygon density on thickness(Figure 6a) and the abrupt onset of an intermediatemorphology (asymmetrical holes, correlated undula-tions, Figures 3-5) below 55 nm, we review briefly thefactors influencing dewetting in our system. A nonwet-ting film is indicated by a negative spreading coefficient,S ) γSO - γSL - γ, where γSO, γSL, and γ are the Si-air,Si-PS, and PS-air interfacial free energies, respec-tively.19-21 Under these conditions, heterogeneities suchas particles or voids30 can nucleate randomly dispersed,symmetrical holes that grow and impinge upon oneanother to ultimately produce polygonal patterns. Shar-ma and Reiter report a value of S ) -8.1 mJ/m2 for thelong-range (van der Waals) contributions that dominatemolecular interactions in the Si/SiOx/PS/air system.26,31
Previous experimental studies have observed heteroge-neous nucleation of holes for this same film-substratesystem.23,24,30
Amplification of capillary fluctuations in the filmsurface is a second possible mechanism of film rupturein our system. Linearized capillary instability theory(LCIT)21,32 predicts film instability when attractive long-range (i.e., van der Waals) interactions exist betweenthe film and the substrate. Attractive long-range inter-actions are indicated by negative values of the effectiveHamaker constant, A, where the dispersive film-substrate free energy of interaction is G(h) ) A/(12πh2).Under these conditions capillary undulations greaterthan a critical wavelength are amplified by the negativedisjoining pressure (-∂G/∂h), leading to film rupture andspatially correlated dewetted structures. Table 1 pre-sents effective A values from three previous studies ofthe Si/SiOx/PS/air system that report evidence of capil-lary instability, using the definition of G(h) given above.The difficulty in obtaining values of the substrateHamaker constant can lead to a disparity in both thesign and magnitude in A, a subject discussed in detailelsewhere.26,31,33 For example, the work reporting A >0 in Table 1 appears to use typical metal oxide Hamakerconstant values as an estimate for Si. The worksreporting A < 0 calculate A by first relating it to S, aquantity available for a wider range of substrates.Despite challenges inherent to calculating A, extensiveexperimental evidence of capillary instability for the Si/SiOx/PS/air system has been reported.20,22-24,34
However, for capillary instability to occur at anobservable rate, the thickness must be less than an
Figure 5. Radially averaged power spectrum of 2D Fouriertransforms of AFM images (AFM images in inset) for filmsurfaces from library B at (a) h ) 71 nm, typical of h > 57nm, indicating a smooth surface and (b) h ) 36 nm, typical of(33 < h < 57) nm, indicating a correlated spacing of qmax )1.5 µm-1, or 1/qmax ) 6.6 µm. The temperature region on libraryB where the images were taken was T ) 124 ( 1 °C.
Ad ) Ad∞ + (Ad0 - Ad∞) exp (-(t - t0)/τ) (1)
9752 Meredith et al. Macromolecules, Vol. 33, No. 26, 2000
onset thickness, ho, so that the rate of growth ofundulations to film rupture competes with other rupturemechanisms (e.g., heterogeneous nucleation).Theory21,31,32 and experiment20,22-24,34 indicate that hois less than an upper limit of ≈100 nm. For example,experiments on Mw ) 4000 g/mol PS at 120 °C indicate
ho ≈ 12 nm.24 However, previous experimental studieshave not reported precise measurements of ho or itsdependence on molecular mass for polymer films. Oncefilm thickness is below ho, drainage from heteroge-neously nucleated holes competes with growth of capil-lary undulations as film thinning proceeds, giving riseto the crossover regime. Consider that τh, the timeconstant for drainage of heterogeneously nucleatedholes, scales as τh ∼ η/h3 and that the time constant forgrowth of the fastest capillary undulation wavelengthscales as τc ∼ ηh5.21,31,32 Hence, as h is decreased belowho, a critical thickness, hc, is reached where capillaryfluctuations grow faster than heterogeneous dewetting.Only at thicknesses below hc, where τc < τh, will filmrupture occur solely by capillary instability, resultingin correlated hole positions.32,35
Figure 6. (a) Number of polygons per millimeter squared, Np, and polygon diameter, Dp (µm), versus thickness at Th ) 124 °Cand 20 nm < hh < 80 nm show scalings characteristic of both heterogeneous and capillary undulation-induced nucleation. (b)Th-hh-t superposition of dewet area fraction data onto a universal curve, 92 < Th < 135 °C, 59 < hh < 86 nm. Inset: raw dewet areafraction vs time, hh ) 79 nm. (c) Hole area growth velocities, vA, versus temperature. (d) ln(τh) vs 1/Th (K-1) for τh values fromfitting procedure for Figure 4b. ln(η) for bulk polystyrene is provided for comparison. The symbol sizes have been adjusted toreflect the standard uncertainty for each measured value in Figure 6.
Table 1. Estimated Values of the Effective HamakerConstant, A, for the Si/SiOx/PS/Air System from Previous
Studies Reporting Evidence of Capillary Instability
Mw of PS (g/mol) A (×10-20 J)a reference
4000 -7.42 2428 400 -0.76 3122 000/39 000 10 23
a A values are based upon a surface free energy defined as G(h)) A/(12πh2).
Macromolecules, Vol. 33, No. 26, 2000 Polymer Thin Film Dewetting 9753
The combinatorial libraries used here encompass alarge thickness range, 15 nm < hh < 90 nm, making itpossible to observe both heterogeneous nucleation (hh >hho) and capillary instability nucleation (hh < hhc), as wellas a crossover regime between the two mechanisms (hhc< hh < hho). In Figure 6a, values of Np and Dp arerelatively invariant for hh > 57 nm (55 ( 4 nm from allfive libraries), indicating uniformly distributed nucle-ation sites expected for heterogeneous nucleation. Sincethe entire sample was exposed to the same cleaningprocedure and airborne particulates, the density ofheterogeneously nucleated sites is expected to be uni-form across the wafer. Because of the abrupt appearanceof correlated undulations on the surface of the unbrokenfilm (Figures 4e,f and 5) below hho, we propose that hho )55 ( 4 nm indicates the onset of capillary instability.We interpret the transition to a scaling regime consis-tent with capillary instability, e.g., polygon density (Np∼ hh-4) and diameter (Dp ∼ hh2) in Figure 6a, as indicativethat hhc ≈ 33 nm.
We note that voids present in all polymer filmsprepared in air can also nucleate dewetting in additionto the two forms of nucleation discussed above. Voidnucleation was observed in high molecular mass PSfilms on Si/octadecyltrisilane substrates30 and wasindicated by a scaling of Np ∼ exp(-hh). This exponentialfunction fits the data in our Figure 6a only slightly lesssatisfactorily than Np ∼ hh-4. Because of the standarduncertainty in the Np vs h data, the scaling of Np or Dpwith h is not sufficient to distinguish between capillaryinstability and void nucleation. Void nucleation mayoccur to some extent in our films; however, there arethree reasons why we attribute the dominant nucleationmechanism for hhc < 33 nm to capillary instability. First,the transition to Np vs hh-4 scaling occurs rather abruptlyat 33 nm on our libraries. For uniformly distributedbubbles, the void nucleation model does not account foran abrupt change in the Np vs h dependence. LCIT doesprovide a physical reason why capillary instabilitygrowth rates abruptly overcome growth of heteroge-neously nucleated holes below a critical thickness,discussed above. Second, we observe correlated undula-tions in the early stage of film breakup (Figure 5b),which is not observed or predicted for void nucleation.30
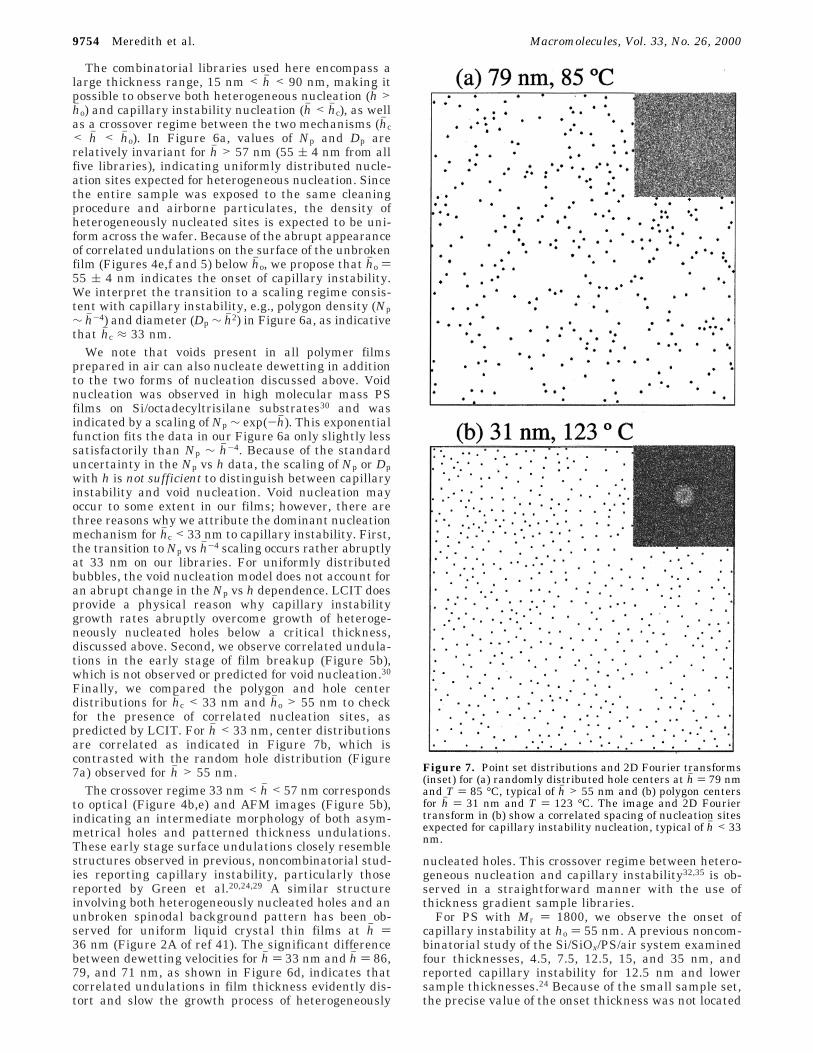
Finally, we compared the polygon and hole centerdistributions for hhc < 33 nm and hho > 55 nm to checkfor the presence of correlated nucleation sites, aspredicted by LCIT. For hh < 33 nm, center distributionsare correlated as indicated in Figure 7b, which iscontrasted with the random hole distribution (Figure7a) observed for hh > 55 nm.
The crossover regime 33 nm < hh < 57 nm correspondsto optical (Figure 4b,e) and AFM images (Figure 5b),indicating an intermediate morphology of both asym-metrical holes and patterned thickness undulations.These early stage surface undulations closely resemblestructures observed in previous, noncombinatorial stud-ies reporting capillary instability, particularly thosereported by Green et al.20,24,29 A similar structureinvolving both heterogeneously nucleated holes and anunbroken spinodal background pattern has been ob-served for uniform liquid crystal thin films at hh )36 nm (Figure 2A of ref 41). The significant differencebetween dewetting velocities for hh ) 33 nm and hh ) 86,79, and 71 nm, as shown in Figure 6d, indicates thatcorrelated undulations in film thickness evidently dis-tort and slow the growth process of heterogeneously
nucleated holes. This crossover regime between hetero-geneous nucleation and capillary instability32,35 is ob-served in a straightforward manner with the use ofthickness gradient sample libraries.
For PS with Mr ) 1800, we observe the onset ofcapillary instability at ho ) 55 nm. A previous noncom-binatorial study of the Si/SiOx/PS/air system examinedfour thicknesses, 4.5, 7.5, 12.5, 15, and 35 nm, andreported capillary instability for 12.5 nm and lowersample thicknesses.24 Because of the small sample set,the precise value of the onset thickness was not located
Figure 7. Point set distributions and 2D Fourier transforms(inset) for (a) randomly distributed hole centers at hh ) 79 nmand T ) 85 °C, typical of hh > 55 nm and (b) polygon centersfor hh ) 31 nm and T ) 123 °C. The image and 2D Fouriertransform in (b) show a correlated spacing of nucleation sitesexpected for capillary instability nucleation, typical of hh < 33nm.
9754 Meredith et al. Macromolecules, Vol. 33, No. 26, 2000

but is assumed to be between 12.5 and 35 nm. In fact,Figure 8 presents AFM images from this previousstudy24 that show a distorted hole morphology andsurface undulations similar to that observed here in thecrossover thickness regime between heterogeneous andcapillary instability nucleation. We suspect that theprevious work observed a slightly lower onset thicknessprimarily because the PS had a higher Mr of 4000.Qualitatively, a higher Mr leads to an increase inviscosity that will require a higher disjoining pressure(Π ) A/(6πh3), or lower thickness, to induce an observ-able capillary instability.32,35 In addition, this previous
work used Si wafers from another supplier and slightlydifferent cleaning conditions, which could induce quan-titative differences in ho through modifications in theHamaker constant. For example, employing a differentlot of Si wafers (Polishing Corporation of America) thanthose used in this paper, we observe the onset ofcapillary instability at ho ) 65 nm for Mr ) 1800. Acomprehensive investigation of the factors affecting hois beyond the scope of this paper, but we note that it isan ideal topic for a future investigation by the combi-natorial approach as we have described in this study.
Interpreting Temperature Dependence. A physi-cal interpretation of the T, h superposition for hh >55 nm (Figure 6b) is challenging given the sparsity ofwork on the temperature dependence of dewetting rates.Brochard-Wyart21 presents a model of capillary andviscous forces that predicts the isolated hole growthvelocity varies as V ∼ γθ3/ηfilm, where θ is the equilib-rium contact angle and ηfilm is the film viscosity. Sinceτh ∼ 1/V, then τh ∼ ηfilm and both τh and ηfilm shouldhave a similar T dependence. Although measurementsof ηfilm are not available for our system, measurementsof the bulk viscosity, η, of PS used in our study areavailable. Figure 6d presents a plot of ln(τh) and ln(η)versus 1/Th . Although there is some scatter in the fittedτh parameters, the plots indicate a monotonic increaseof τh with 1/T. The slopes of lines fitted through the datain Figure 6d can be treated as activation energies,38 i.e.,ln(η) ) a + ∆εη/kT and ln(τh) ) b + ∆ετ/kT. Since Figure6d compares thin film (τh) and bulk (η) properties, wedo not expect the slopes to agree quantitatively. How-ever, ln(τh) and ln(η) both follow approximately a 1/Tdependence, and the slopes are of the same order ofmagnitude. The slopes through the ln(τh) data do notvary appreciably with thickness and yield an average∆ετ/k of 11 800 K, whereas the bulk viscosity data yields∆εη/k ) 34 500 K. Discrepancies between these activa-tion energies may reflect differences in the viscosity ofbulk and thin-film PS, a subject beyond the scope of thiswork but discussed elsewhere.39,40 Tentatively, a smalleractivation energy (∆ετ) for the thin films is consistentwith a lower viscosity and glass transition temperature(Tg) than in the bulk, although these values were notmeasured here. Previous experiments have reportedevidence of a decrease in Tg for PS thin films on Si/SiOxrelative to the bulk.40,42
Conclusions
By using a novel combinatorial technique to preparelibraries in which the temperature and thickness arevaried systematically and continuously, we have mea-sured the temperature-thickness-time dependence ofdewetting structures and kinetics. The covered rangeincluded thicknesses of 16 < hh < 90 nm and tempera-tures of 85 < Th < 135 °C in two experiments that canbe performed in 1 day (although subsequent controlexperiments were performed also). To validate theapproach, the thickness range was chosen to allowobservation of dewetting regimes reported in previousnoncombinatorial work. Given the known sensitivity ofpolymer-substrate interactions to even minor differ-ences in cleaning procedures and substrate composition,the quantitative comparisons to previous noncombina-torial work are remarkable. It is evident that the widerange of structures observed on the libraries are asuperset encompassing those observed individually inprevious work (using uniform samples) over similar
Figure 8. AFM images from a previous study24 of dewettingon the Si/SiOx/PS/air system using uniform samples. (a) h )15 nm, t ) 12 h, T ) 115 °C, image size ) 32 µm × 25 µm.Distorted holes are observed, similar to Figure 4b,e of thiswork. (b) h ) 12.5 nm, t ) 5.5 h, T ) 115 °C, image size ) 10µm × 10 µm. The undulations in surface thickness are similarto those observed in the crossover thickness regime of thiswork shown in the inset to Figure 5b. We gratefully acknowl-edge Riu Xie for providing the AFM images.
Macromolecules, Vol. 33, No. 26, 2000 Polymer Thin Film Dewetting 9755
thickness ranges.20,22-24,29,30,34,41 It is important to es-tablish this validation comparison to uniform samplesbecause we have treated the local Th and hh values asconstants over the image analysis area.
The method presented here is unique in its ability torapidly identify fundamental trends in film stability,nucleation mechanisms, and dewetting kinetics over awide range of parameter space. The combinatorialmethod is a technique that can be used for rapidparametric variation early in a scientific study and toguide parameter selection (e.g., T, h, Mr) for conven-tional one-sample for one-measurement experiments. Inaddition, the use of high-throughput measurementscovering broad regimes of parameter space may lead tothe discovery of novel regions of phase space for thin-film phenomena.18
For the Si/SiOx/PS/air system investigated here, threedistinct structural regimes were observed on the com-binatorial libraries. At thicknesses above ho > 55 nm,holes are nucleated heterogeneously. The appearanceof correlated undulations and an intermediate morphol-ogy below hho ) 55 nm is interpreted as the onset ofcapillary instability. In this crossover regime, 33 nm <hh < 55 nm, growth of capillary fluctuations competeswith heterogeneously nucleated holes. Below hhc <33 nm, nucleation occurs solely by capillary instability.Libraries with continuous thickness variations allow aconvenient determination of the location of the hetero-geneous to capillary instability kinetic crossover regime.In addition, a superposition of the growth kinetics ofnucleated holes for a wide range of T and h values,previously unreported, was observed.
Acknowledgment. We thank Dr. Jack Douglas forhis suggestions on the collapse of drainage data to auniversal exponential curve. Dr. Mark VanLandinghamaided with AFM measurements. Kathy Barnes mea-sured the bulk PS viscosities. J.C.M. was supported byan NRC/NIST Postdoctoral Associateship.
References and Notes
(1) Hanak, J. J. J. Mater. Sci. 1970, 5, 964.(2) Dagani, R. Chem. Eng. News 2000, 78, 66.(3) Jandeleit, B.; Schaefer, D. J.; Powers, T. S.; Turner, H. W.;
Weinberg, W. H. Angew. Chem., Int. Ed. Engl. 1999, 38, 2494.(4) Danielson, E.; Golden, J. H.; McFarland, E. W.; Reaves, C.
M.; Weinberg, W. H.; Wu, X. D. Nature 1997, 389, 944.(5) Danielson, E.; Devenney, M.; Giaquinta, D. M.; Golden, J.
H.; Haushalter, R. C.; McFarland, E. W.; Poojary, D. M.;Reaves, C. M.; Wenberg, W. H.; Wu, X. D. Science 1998, 279,837.
(6) Sun, X.-D.; Xiang, X.-D. Appl. Phys. Lett. 1998, 72, 525.(7) Wang, J.; Yoo, Y.; Gao, C.; Takeuchi, I.; Sun, X.; Chang, H.;
Xiang, X.-D.; Schultz, P. G. Science 1998, 279, 1712.(8) Briceno, G.; Chang, H.; Sun, X.; Schultz, P. G.; Xiang, X.-D.
Science 1995, 270, 273.(9) Xiang, X.-D.; Sun, X.; Briceno, G.; Lou, Y.; Wang, K.-A.;
Chang, H.; Wallace-Freedman, W. G.; Chen, S.-W.; Schultz,P. G. Science 1995, 268, 1738.
(10) Reddington, E.; Sapienza, A.; Gurau, B.; Viswanathan, R.;Sarangapani, S.; Smotkin, E.; Mallouk, T. Science 1998, 280,1735.
(11) Schmitz, C.; Thelakkat, M.; Schmidt, H. W. Adv. Mater. 1999,11, 821.
(12) Klein, J.; Lehmann, C. W.; Schmidt, H.-W.; Maier, W. F.Angew. Chem., Int. Ed. Engl. 1998, 37, 3369.
(13) Taylor, S. J.; Morken, J. P. Science 1998, 280, 267.(14) Bein, T. Angew. Chem., Int. Ed. Engl. 1999, 38, 323.(15) Fodor, S. P. A.; Read, J. L.; Pirrung, M. C.; Stryer, L.; Lu, A.
T.; Solas, D. Science 1991, 251, 767.(16) Dickinson, T. A.; Walt, D. R.; White, J.; Kauer, J. S. Anal.
Chem. 1997, 69, 3413.(17) Newkome, G. R.; Weis, C. D.; Moorefield, C. N.; Baker, G.
R.; Childs, B. J.; Epperson, J. Angew. Chem., Int. Ed. Engl.1998, 37, 307.
(18) Meredith, J. C.; Karim, A.; Amis, E. J. Macromolecules 2000,33, 5760.
(19) de Gennes, P. G. Rev. Mod. Phys. 1985, 57, 827.(20) Reiter, G. Phys. Rev. Lett. 1992, 68, 75.(21) Brochard-Wyart, F.; Daillant, J. Can. J. Phys. 1990, 68, 1084.(22) Reiter, G. Langmuir 1993, 9, 1344.(23) Stange, T. G.; Evans, D. F. Langmuir 1997, 13, 4459.(24) Xie, R.; Karim, A.; Douglas, J. F.; Han, C. C.; Weiss, R. A.
Phys. Rev. Lett. 1998, 81, 1251.(25) Handbook of Semiconductor Wafer Cleaning Technology;
Kern, W., Ed.; Noyes Publications: Park Ridge, NJ, 1993.(26) Experimental substrates are coated with a thin layer of oxide
and/or organic contaminant. We have attempted to minimizeorganic contaminants by cleaning our substrates in a piranhabath immediately before film coating. In this procedure thewafers are cleaned in a volume fraction 70% H2SO4/9% H2O2/21% H2O solution at 80 °C for 1.5 h, which is known toproduce an SiOx layer of thickness δ ∼ 1-2 nm. Thus, werefer to our system as Si/SiOx/PS/air. References 28 and 30discuss the incorporation of thin coatings in calculations ofS and A (effective Hamaker constant). When long-range (vander Waals) interactions dominate the early stage of filmrupture, S and A are not affected strongly by the thin oxidelayer when the film thickness h . δ.
(27) Certain equipment and instruments or materials are identi-fied in the paper in order to adequately specify the experi-mental details. Such identification does not imply recom-mendation by the National Institute of Standards andTechnology, nor does it imply the materials are necessarilythe best available for the purpose.
(28) Leal, L. G. Laminar Flow and Convective Transport Processes;Butterworth-Heinemann: Boston, 1992.
(29) Masson, J. L.; Green, P. F. J. Chem. Phys. 1999, 112, 349.(30) Jacobs, K.; Herminghaus, S.; Mecke, K. R. Langmuir 1998,
14, 965.(31) Sharma, A.; Reiter, G. J. Colloid Interface Sci. 1996, 178,
383.(32) Vrij, A.; Overbeek, J. T. G. J. Am. Chem. Soc. 1968, 90, 3074.(33) Kerle, T.; Yerushalmi-Rozen, R.; Klein, J.; Fetters, L. J.
Europhys. Lett. 1998, 44, 484.(34) Segalman, R. A.; Green, P. F. Macromolecules 1999, 32, 801.(35) Vrij, A. Discuss. Faraday Soc. 1966, 42, 23.(36) Polymer Handbook, 4th ed.; Brandrup, J., Immergut, E. H.,
Grulke, E. A., Eds.; John Wiley and Sons: New York, 1999.(37) Fox, T. G.; Allen, V. R. J. Chem. Phys. 1964, 41, 344.(38) Hiemenz, P. C. Polymer Chemistry; Marcel Dekker: New
York, 1984.(39) Wallace, W. E.; van Zanten, J. H.; Wu, W. L. Phys. Rev. E
1995, 52, 52.(40) Orts, W. J.; van Zanten, J. H.; Wu, W.-L.; Satija, S. K. Phys.
Rev. Lett. 1993, 71, 867.(41) Herminghaus, S.; Jacobs, K.; Mecke, K.; Bischof, J.; Fery, A.;
Ibn-Elhaj, M.; Schlagowski, S. Science 1998, 282, 916.(42) Fryer, D. S.; Nealey, P. F.; de Pablo, J. J. Macromolecules
2000, 33, 6439.
MA001298G
9756 Meredith et al. Macromolecules, Vol. 33, No. 26, 2000