
A Study of ERP, SCM and CRM System Implementations ...
41
The Impact of Enterprise Systems on Corporate Performance: A Study of ERP, SCM and CRM System Implementations Kevin B. Hendricks Richard Ivey School of Business The University of Western Ontario London, Ontario N6A-3K7 CANADA Phone: (519) 661-3874 Fax: (519) 661-3959 E-mail: [email protected] Vinod R. Singhal* College of Management Georgia Institute of Technology 800 West Peachtree St., NW Atlanta, GA 30332-0520 Phone: (404) 894-4908 Fax: (404) 894-6030 E-mail: [email protected] Jeff K. Stratman College of Management Georgia Institute of Technology 800 West Peachtree St., NW Atlanta, GA 30332-0520 Phone: (404) 894-4928 Fax: (404) 894-6030 E-mail: [email protected] October 2005 * Corresponding author
-
Upload
khangminh22 -
Category
Documents
-
view
0 -
download
0
Transcript of A Study of ERP, SCM and CRM System Implementations ...
The Impact of Enterprise Systems on Corporate Performance: A Study of ERP, SCM and
CRM System Implementations
Kevin B. Hendricks Richard Ivey School of Business
The University of Western Ontario London, Ontario N6A-3K7
CANADA Phone: (519) 661-3874
Fax: (519) 661-3959 E-mail: [email protected]
Vinod R. Singhal*
College of Management Georgia Institute of Technology
800 West Peachtree St., NW Atlanta, GA 30332-0520 Phone: (404) 894-4908
Fax: (404) 894-6030 E-mail: [email protected]
Jeff K. Stratman
College of Management Georgia Institute of Technology
800 West Peachtree St., NW Atlanta, GA 30332-0520 Phone: (404) 894-4928
Fax: (404) 894-6030 E-mail: [email protected]
October 2005
* Corresponding author
The Impact of Enterprise Systems on Corporate Performance: A Study of ERP, SCM and
CRM System Implementations
ABSTRACT
This paper documents the effect of investments in Enterprise Resource Planning (ERP),
Supply Chain Management (SCM), and Customer Relationship Management (CRM) systems on
a firm’s long-term stock price performance and profitability measures such as return on assets
and return on sales. The results are based on a sample of 186 announcements of ERP
implementations; 140 SCM implementations; and 80 CRM implementations. Our analysis of the
financial benefits of these implementations yields mixed results. In the case of ERP systems, we
observe some evidence of improvements in profitability but not in stock returns. The results for
improvements in profitability are stronger in the case of early adopters of ERP systems. On
average, adopters of SCM system experience positive stock returns as well as improvements in
profitability. There is no evidence of improvements in stock returns or profitability for firms that
have invested in CRM. Although our results are not uniformly positive across the different
enterprise systems (ES), they are encouraging in the sense that despite the high implementation
costs, we do not find persistent evidence of negative performance associated with ES
investments. This should help alleviate the concerns that some have expressed about the
viability of ES given the highly publicized implementation problems at some firms.
1
1.0 Introduction
Enterprise systems (ES) represent an important technology investment option for
operations managers, and have been acclaimed in the practitioner and academic literature for
their potential to improve business performance (Akkermans et al. (1999), Davenport (1998)).
For the purposes of this research, ES includes one or more of the following applications:
Enterprise Resource Planning (ERP); Supply Chain Management (SCM); and/or Customer
Relationship Management (CRM) systems. Firms have invested heavily in ES. AMR Research
estimates that investment in ES amounted to more than $38 billion in 2001 (Krause and O’Brian
(2002)). Forecasters predict continued high growth in the level of investments in ES (AMR
Research (2004)). Given the significant level of investments in ES, a relevant issue is whether
investments in ES affect corporate performance.
Most empirical evaluations of the benefits of ES assume that a successful implementation
of ES will have a positive impact on operational performance metrics, which in turn will improve
financial performance. However, little empirical research has been done to link investments in
ES to financial performance using objective data. We are aware of only two such studies that
have analyzed investments in ERP systems. Hitt et al. (2002) analyze a sample of SAP’s ERP
implementations using accounting and stock market based performance measures. Although
they find evidence of improved financial performance during implementation, they are unable to
estimate the long-run impact of ERP systems due to a lack of post-implementation data at the
time they conducted their study. Ranganathan and Samarah (2003) find that the stock market
reacts positively to announcements of ERP investments. Compared to ERP systems, the
evidence on the impact of investments in SCM and CRM on financial performance is even more
limited. Dehning et al. (2004) study the effect of investments in SCM systems on accounting
2
based performance metrics and find that such investments improve profitability. We are not
aware of any academic study that has analyzed the effect of CRM systems on firm performance.
This paper documents the effect of investments in ERP, SCM, and CRM systems on
long-run stock price and profitability performance. By estimating the long-run financial effects
of investments in ES, we shed light on the value of these systems. The results of this paper are
based on an analysis of a sample of 186 announcements of ERP implementations, 140 SCM
implementations, and 80 CRM implementations at publicly traded firms. Performance effects
are examined over a five-year time period for ERP implementations and a four-year time period
for SCM and CRM implementations. Performance effects are also examined for both the
implementation and post-implementation periods.
There are a number of differences between our study and other studies that have focused
on publicly traded firms (Dehning et al. (2004), Hitt et al. (2002), Ranganathan and Samarah
(2003)). First, previous studies have focused on a specific type of ES such as ERP or SCM. In
contrast, we analyze the impacts of ERP, SCM, and CRM - three types of commonly used ES.
Second, unlike previous studies, we examine the effect of ES on both stock price and
profitability to examine the consistency between different measures of performance. In the long-
run both the stock price changes and profitability changes should point to the same conclusion
about the effect of ES on performance. Third, unlike other studies, we examine performance
effects for both the implementation and the post-implementation periods. Finally, to isolate the
effect of ES on performance, we use recently developed methodologies that are the current
standards in the literature (Lyon et al. (1999), Barber and Lyon (1997), Kothari and Warner
(1997), Barber and Lyon (1996)).
The paper is organized as follows: Section 2 briefly reviews the rationale behind the
3
belief that investment in ES will improve financial performance. The contribution of this paper
is a rigorous validation of this premise. We do not develop a theory of how this value is realized.
Instead we establish whether or not ES adoption is associated with improvements in financial
performance. Section 3 describes the sample collection. Section 4 describes the methods used to
estimate the long-run stock price and profitability effects of the sample firms. The empirical
results are presented in Section 5. Section 6 compares our results with other studies that have
examined the performance effects of ES. Section 7 discusses these results in the context of
theories on how firms develop competitive capabilities and develops suggestions for future
research on the operational mechanisms by which ES systems can improve performance.
2.0 Benefits of Enterprise Systems
Information integration is a key benefit of ES. This integration can replace functionally
oriented and often poorly connected legacy software, resulting in savings in infrastructure
support costs. Furthermore, improvements in operational integration enabled by ES can affect
the entire organization and therefore can positively impact firm performance. As discussed
below, ERP systems also provide benefits in the area of transaction automation, SCM systems
provide more sophisticated planning capabilities, and CRM systems facilitate customer
relationship management.
2.1 ERP Systems
ERP systems replace complex and sometimes manual interfaces between different
systems with standardized, cross-functional transaction automation. Order cycle times (the time
from when an order is placed until the product or service is delivered) can be reduced, resulting
in improved throughput, customer response times and delivery speeds (Cotteleer (2002), McAfee
(2002)). Similarly, automated financial transactions can reduce cash-to-cash cycle times and the
4
time needed to reconcile financial data at the end of the quarter or year (Mabert et al. (2000,
2003), McAfee (1999), Stratman (2001)). The result is a reduction in operating capital and the
headcount of the financial area.
Another benefit of ERP systems is that all enterprise data is collected once during the
initial transaction, stored centrally, and updated in real time. This ensures that all levels of
planning are based on the same data and that the resulting plans realistically reflect the prevailing
operating conditions of the firm. For example, a single, centrally developed forecast ensures that
operational processes remain synchronized and allows the firm to provide consistent order
information to customers (Bancroft et al. (1998)).
Taken together, the standardized firm-wide transactions and centrally stored enterprise
data greatly facilitate the governance of the firm (Scott and Vessey (2000), McAfee and Upton
(1996)). ERP reports provide managers with a clear view of the relative performance of the
various parts of the enterprise, which can be used to identify needed improvements and take
advantage of market opportunities (AT Kearney (2000), Boston Consulting Group (2000)).
2.2 SCM Systems
The primary benefit of SCM systems is better operational and business planning. The
MRP II and ERP systems of the nineties usually included only rough-cut capacity planning logic,
with basic finite capacity planning functionality limited to key work centers (Vollmann et al.
(2005)). SCM systems use finite-capacity planning algorithms that do not require iterative
adjustments to the master schedule (Raman and Singh (1998)), and real-time planning
capabilities allow firms to react quickly to supply and demand changes. Coordinated planning
and flow of materials and information among supply chain partners can mitigate the “bullwhip
effect” (Lee at al. (1997)). There is a rich literature in OM on the benefits of better supply chain

5
planning and coordination (Cachon and Fisher (2000), Cheung and Lee (2002), Milner and
Kouvelis (2002)). Recent empirical research has demonstrated that reducing forecasting and
planning errors that result in supply chain disruptions avoids value destruction (Hendricks and
Singhal (2003)). Increased revenue, increased productivity, operational cost savings, lower
inventory, and reduced order-to-fulfillment cycle time are some of the benefits from SCM
system implementations (Nucleus Research (2003a)).
2.3 CRM Systems
CRM is a synthesis of many existing principles from relationship marketing (Jancic and
Zabkar (2002), Sheth et al. (2000), Morgan and Hunt (1994)), and the broader issue of customer-
focused management. CRM systems provide the infrastructure that facilitates long-term
relationship building with customers. Some examples of the functionality of CRM systems are
sales force automation, data warehousing, data mining, decision support and reporting tools
(Katz (2002), Suresh (2004)). CRM systems also reduce duplication in data entry and
maintenance by providing a centralized firm-wide database of customer information. This
database replaces systems maintained by individual sales people, institutionalizes customer
relationships, and prevents the loss of organizational customer knowledge when sales people
leave the firm. Centralized customer data is also valuable to firms managing multiple product
lines. In many cases customers will overlap across different lines of business, providing an
opportunity for increasing revenues through cross-selling.
Based on the above review and discussion of the literature we hypothesize:
H1 (2 and 3): Investments in ERP (SCM and CRM) systems lead to improvements in financial performance as measured by stock returns and profitability.
3.0 Sample selection procedure and data description
Business Wire, Dow Jones News Service, PR Newswire, and the Wall Street Journal are
6
our primary sources for collecting the sample of firms that have invested in ES. We started with
the set of all announcements during 1991-1999 that mention ES providers by name. Although
more than 25 providers are used in our search, the major ones are SAP, Oracle, JD Edwards, and
Peoplesoft for ERP systems; i2 Technologies, Manugistics, Aspen Technology, American
Software, and Logility Inc for SCM systems; and Siebel and SCT Corp for CRM systems. These
announcements mentioned firms that have invested in ES. To be included in the final sample a
firm must have stock price information on the Center for Research on Security Prices (CRSP)
database and accounting information on the COMPUSTAT database. Nearly 98% of the
announcements were made during 1995 to 1999.
Our sample consists of 406 firms with the following breakdown: 186 announcements
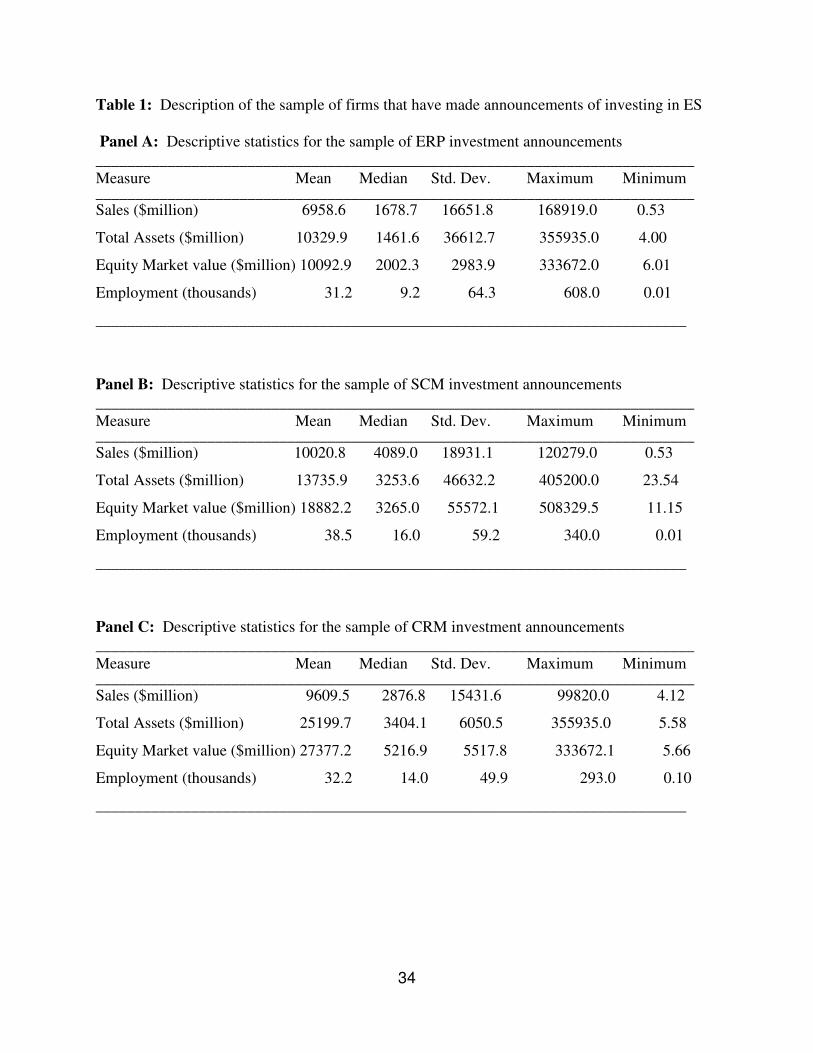
of investments in ERP systems; 140 in SCM systems; and 80 in CRM systems. Panel A of Table
1 presents statistics on the sample based on the most recent fiscal year completed before the date
of the announcement of investing in ES. The mean (median) ERP observation represents a firm
with annual sales of nearly $6,956 million ($1,679 million) and total assets of $10,330 million
($1,461 million). SCM observations represents firms with mean (median) annual sales of nearly
$10,020 million ($4,089 million) and total assets of $13,735 million ($3,253 million) whereas
CRM observations represent firms with mean (median) annual sales of nearly $9,609 million
($2,879 million) and total assets of $25,199 million ($3,404 million). Overall, it appears that
larger firms have invested in ES. Furthermore, the size of firms that invest in SCM and CRM
applications is larger than those that invest in ERP applications. This may be because SCM and
CRM applications are relatively new compared to ERP applications.
Our sample has two distinct sets of announcements. One set indicates that the firm has
started or plans to start the implementation of an ES application. The other set indicates that the
7
firm has completed the implementation of an ES application. Of the 186 ERP announcements,
35 are on completed implementations; of the 140 SCM announcements, 12 are on completed
implementations; and of the 80 CRM announcements, 5 are on completed implementations.
4.0 Methodology for estimating performance effects of investments in ES
This section describes our methodology including the period over which the performance
effects are measured and the approach used to estimate the long-term stock price and profitability
effects of investments in ES.
4.1 Choosing the period over which to measure performance impacts.
In deciding the period over which to measure performance changes, we focus on longer
periods to fully capture the performance effects of ES. We also examine the performance during
the implementation period as well as the post-implementation period. Based on the evidence in
the literature, we use a two-year implementation period for ERP systems. O’Leary (2000) and
McAfee (1999) report that ERP installation takes between 1 and 3 years, with an average of 21
months. Stratman (2001) collected detailed timeline information from 43 respondents, and
estimates that the average time from start of installation to live is 17.1 months. The weighted
average implementation time from the survey of 479 U.S. manufacturing firms by Mabert et al.
(2000) is about 17.5 months. Given the above evidence, we choose to use a two-year
implementation period.
The evidence on the time required to implement SCM and CRM applications is limited.
Compared to ERP systems, SCM and CRM systems are less complex and easier to implement.
Raman and Singh’s (1998) case study on i2 Technologies indicated that implementation of SCM
systems can take about 6 to 12 months. Nucleus Research (2003a, 2003b) reports a 1.5-year
implementation period for SCM systems. Our discussion with an SCM expert at SAP suggests

8
that a 12-month implementation period seems reasonable. We are unable to find much
information about implementation time for CRM. A summary of white papers found at
crmguru.com indicated that 50% of the projects get a payback within 18 months, suggesting that
implementation time might be short. Based on the above evidence, we choose to use a one-year
implementation period for SCM and CRM systems.
The existing literature provides little guidance on what should be the appropriate length of
the post-implementation period over which one should measure the benefit of investments in ES.
There does seem to be an agreement that the benefits will be felt over a long time period. Given
this, we choose a three-year post implementation period for ERP, SCM, and CRM applications.
Overall, we examine the changes in financial performance over a five-year period for ERP
systems (a two-year implementation period and a three-year post-implementation period), and a
four-year period for SCM and CRM systems (a one-year implementation period and a three-year
post-implementation period).
For sample firms that plan to implement ES, the five-year period in the case of ERP
systems (four-year period in the case of SCM and CRM systems) starts on the announcement
date. For sample firms that have announced they have completed the implementation of an ES
application, we set the starting date back by two years (one year) relative to the announcement
date of completion of the implementation of ERP system (SCM and CRM systems), and use
these reset dates to measure the five-year and four-year periods. This adjustment of dates allows
us to align the starting time for both the planned and completed implementations.
4.2 Methodology for estimating the long-term stock price effects
We estimate the long-run buy-and-hold abnormal returns using daily returns. An
abnormal return is the difference between the return on a stock and the return on an appropriate
9
benchmark. There has been considerable discussion in the literature on the appropriate
methodology for computing long-run abnormal returns (Lyon et al. (1999), Fama (1998), Barber
and Lyon (1997) and Kothari and Warner (1997)). This discussion has focused on two issues.
The first issue is the appropriate factors that should be controlled for in computing long-run
abnormal returns. The current consensus seems to be that abnormal return computations should
control for size, market-to-book ratio of equity, and prior performance. The second issue is the
interpretation of the statistical significance of long-run abnormal returns. Barber and Lyon
(1997) and Kothari and Warner (1997) report that test statistics from many commonly used
methods are misspecified because these methods do not adjust for cross-sectional dependency.
Barber and Lyon (1997) and Lyon et al. (1999) find that abnormal returns using matching
portfolios of similar firms give well-specified tests. We implement this approach as follows:
Step1: In each month, all eligible NYSE firms are sorted into deciles according to their market
value of equity. Next all AMEX and NASDAQ firms are placed into the appropriate size
portfolio. The smallest size decile portfolio is further divided into quintiles, resulting in 14 size
portfolios. Each portfolio is further divided into quintiles according to their market-to-book ratio
of equity, resulting in 70 portfolios. Each portfolio is further divided into three portfolios based
on the stock price performance of firms in that portfolio over the previous year, resulting in 210
portfolios for each month where firms in each portfolio are similar in terms of size, market-to-
book ratio, and prior performance. Over 300 months, the mean (median) number of firms over
63000 portfolios is about 22 (21).
Step 2: We identify the portfolio that a sample firm is assigned to in the first month of the start
of the sample firm’s measurement period. Since all other firms in this portfolio are similar to the
sample firm on size, market-to-book ratio, and prior performance, all these firms can be

10
considered as benchmarks for the sample firm. For example, Allied Signal announced on
October 7, 1998 that they plan to implement an ERP system. In this case we search the 210
portfolios for August 1998 and identify the portfolio that includes Allied Signal. Suppose that
Allied Signal is in portfolio #20, which also includes 25 other firms. These 25 firms then
become the benchmark against which Allied Signal’s performance is evaluated.
Step 3: A sample firm’s abnormal return is the difference between its buy-and-hold return and
the average of the buy-and-hold returns of all other firms that belong to the sample firm’s
portfolio (see Hendricks and Singhal (2005) for more details). For example, in the case of Allied
Signal, we compute the buy-and-hold return of Allied Signal and the 25 other firms that belong
to portfolio #20. If Allied Signal’s return over a particular period is say 25%, and the average
return of the 25 other firms in portfolio #20 is 15%, then Allied Signal’s abnormal return is 10%.
Step 4: Statistical inference is based on a simulation approach (see Lyon et al. (1999)). The idea
is to compute an empirical distribution of abnormal returns for a portfolio that has similar
characteristics to those of the sample portfolio, and compare where the abnormal return of the
sample portfolio falls on this distribution. To achieve this we create a pseudo-sample where for
each sample firm we randomly select, with replacement, a firm that belongs to the portfolio
assigned to the sample firm. This randomly selected firm is assigned the same announcement
date as that of the sample firm. Thus, in the case of Allied Signal, we would select one of the 25
firms that belong to portfolio #20 and assign it the date of October 7, 1998. Once this is done for
all sample firms, the mean abnormal performance for this pseudo-sample is computed using the
portfolio approach discussed in Step 3. This results in one observation of the mean abnormal
performance from a pseudo-sample. We repeat this process 1000 times to obtain 1000 mean
abnormal return observations.
11
Step 5: The empirical distribution of the mean abnormal returns from 1000 pseudo-portfolios is
used to test whether the mean abnormal return for the sample portfolio is significantly different
from zero. We compute the p-value as the fraction of the 1000 pseudo-samples with mean
abnormal returns less than the mean abnormal return of the sample portfolio. For example, if
600 pseudo-samples have mean abnormal returns above the mean abnormal return of the sample,
then the p-value is 0.400. Using the empirical distribution to compute p-values explicitly
accounts for cross-sectional dependencies, which has been a major source of concern about the
validity of p-values from conventional test-statistics (Lyon et al. (1999)).
To pool observations across time, for each sample firm, we translate calendar time to
event time as follows. The announcement date is day 0 in event time, the next trading date is day
1, and trading day after that is day 2, and so on. Since a year typically has 250 trading days, the
implementation period for ERP systems (SCM and CRM systems) span event days 0 to 500 (0 to
250) and the post-implementation period spans event days 501 to 1250 (251 to 1000).
4.3 Methodology for estimating the long-term operating performance effects
To estimate the profitability effects of investments in ES, we analyze changes in
operating return on assets (ROA) and operating return on sales (ROS). ROA (ROS) is the ratio
of operating income to book value of total assets (sales), where operating income is defined as
sales less cost of goods sold, and selling, general, and administrative expenses. We focus on
operating income over other income measures (for example, net income or earnings per share)
because it is a cleaner measure of performance as it is not obscured by special items, tax
considerations, or capital structure changes.
To control for various factors unrelated to investments in ES that could affect the
performance, we compare the performance of each sample firm against an appropriately chosen
12
comparison group. We estimate abnormal performance as the change in the sample firm’s
performance minus the change in the median performance of the comparison group. More
formally, let PIt1 and PIt2 be the performance level in year t1 and t2 (where t2 > t1), respectively,
for the sample firm I. Let PCt1 and PCt2 be the median performance level in year t1 and t2,
respectively, for the comparison group for sample firm I. Then API, the abnormal performance
of sample firm I is
API = (PIt2 - PIt1) - (PCt2 - PCt1)
In earlier studies of operating performance the choice of the comparison group was
generally based on industry and size. Furthermore, some researchers used a single firm as the
basis for comparison while others used a portfolio of firms as their comparison group. More
recently, Barber and Lyon (1996) develop robust guidelines on selecting comparison groups that
give well specified and powerful test statistics. They emphasize the importance of selecting
comparison groups that have similar prior performance as that of the sample firms as well as
using a portfolio of firms as the comparison group. We implement the findings of Barber and
Lyon (1996) using a four-step procedure.
Step 1: For each sample firm we identify all firms that have the same two-digit SIC code as that
of the sample firms and whose ROA (ROS) in the starting year of the measurement period is
within 90% to 110% of the sample firm. All firms that meet these criteria are considered part of
the comparison group for the sample firm. The 90% to 110% filter on performance is used
because this range yields well specified test statistics (Barber and Lyon (1996)).
Step 2: If we do not find any firms in Step 1, then we attempt to match performance within the
90% to 110% filter using all firms in the same one-digit SIC code.
13
Step 3: If we do not find any firms in Step 2, then we attempt to match performance within the
90% to 110% filter without regard to SIC code.
Step 4: If we do not find any firms in step 3, then we chose the firm that is closest in
performance without regard to SIC code.
The mean (median) number of firms in the comparison groups is 20 (14) for the ERP
sample, 17 (12) for the SCM sample, and 28 (18) for the CRM sample. To test the sensitivity of
our results from the above approach, we create a second comparison group, which takes the
firms identified in the first comparison group and includes only those firms whose total assets are
within a factor of 10 of the total assets of the sample firm. Since these results are very similar to
the first comparison group, we only report the results from the first comparison group.
Abnormal performance can be reported as the change in the level of performance or as
the percent change in the level of performance. To see the difference between these two
methods, consider a sample firm where the ROA has changed from 3% to 5%. In this case the
change in the level of ROA is 2%, whereas the percent change in ROA is 66.66%. If the starting
ROA is negative, then percent change calculations are nonsensical. Therefore, basing results on
percent change require that we exclude firms (sample or comparison group firms) that have
negative starting ROA. This not only diminishes the power of statistical tests, but can also lead
to biases in test statistics. Because of these issues with the percent change method, we report
abnormal performance based on the change in the level of performance.
To pool observations across time, for each firm in our sample, we translate calendar year
to event years as follows. The year of the announcement date is year 0 in event year, the next
year is year 1, and year after that is year 2, and so on. For ERP systems (SCM and CRM
14
systems) the implementation period spans year 0 to 2 (0 to 1) and the post-implementation period
spans year 2 to 5 (1 to 4).
5.0 Empirical Results
Outliers can influence the mean values of long-term performance effects. To control for
outliers, all abnormal stock return results are reported after capping the data at the 1.0% level in
each tail. Outliers are a more serious problem with accounting data. To control for outliers all
profitability results are reported after capping the data at the 2.5% level in each tail. Even with
capping, outliers can still influence the mean values of long-term performance effects.
Therefore, we will put more emphasis on non-parametric statistics such as median and percent of
sample firms with positive abnormal performance. In addition to reporting the parametric tests
on changes in the mean, we report two non-parametric tests. The Wilcoxon sign rank test is used
to test whether the median of the changes is significantly different from zero, and the binomial
sign test is used to test whether the percent of sample firms experiencing positive abnormal
performance is significantly different from 50%. Consistent with our hypotheses, we measure
statistical significance using one-tailed tests.
5.1 Results for investments in ERP systems
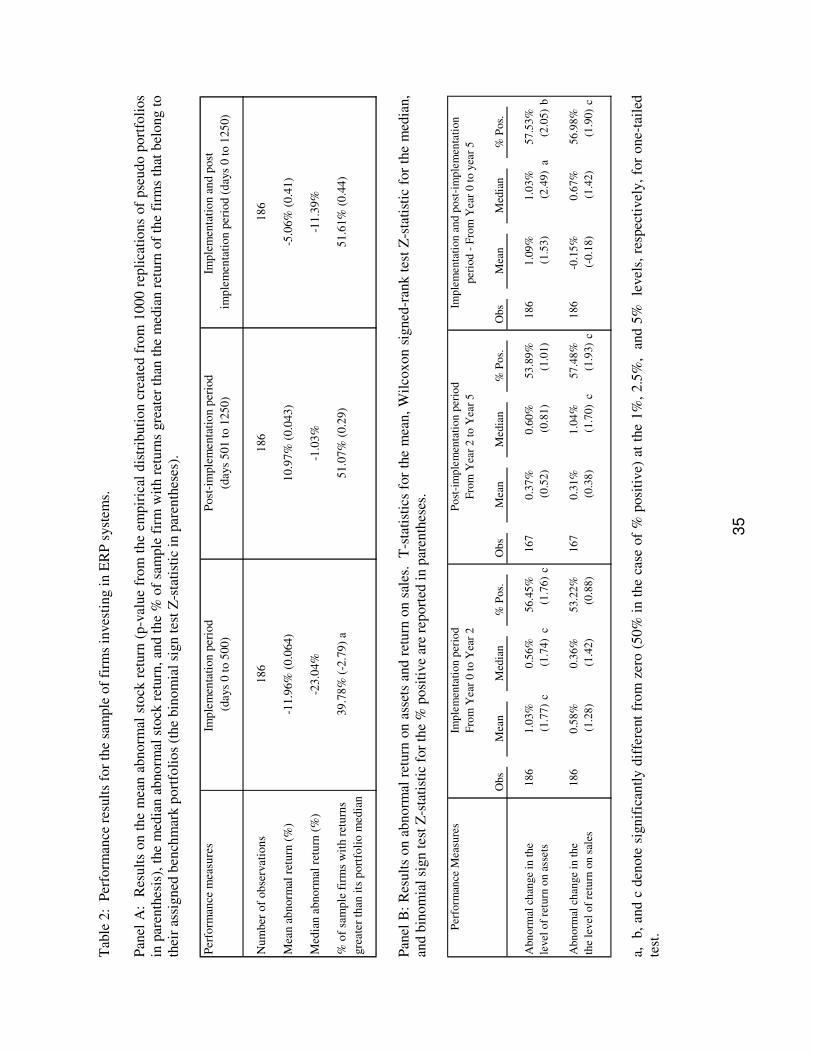
Table 2 presents results for the sample of firms that invested in ERP systems. During the
two-year implementation period, the stock price performance of the sample firms fared poorly
relative to the benchmark portfolios. The mean (median) abnormal return during this time period
is -11.96% (-23.04%). A p-value of 0.064 indicates that the mean abnormal return of the sample
firm is lower than the mean abnormal returns of 936 out of the 1000 pseudo-portfolios abnormal
returns. Of the 186 sample firms, only 40% of the sample firms do better than the median return
of the firms that belong to their assigned portfolios, significantly lower than 50% (p-value �
15
0.01). The abnormal stock price performance during the implementation period is negative and
statistically significant.
The results for the three-year post-implementation period are mixed. The mean abnormal
return of 10.97% is statistically significant (p-value = 0.043) and similar in magnitude to the loss
experienced during the implementation period. However, the median abnormal return is -1.03%.
Only 51.07% of the firms do better than the median return of the firms that belong to their
assigned portfolio, insignificantly different from 50%. Overall, only one of the three statistics
suggests positive abnormal performance.
When the performance is examined over the full five-year period (the combined
implementation and post-implementation periods), there is no evidence of abnormal
performance. The mean abnormal return is -5.06%, insignificantly different from zero (p-value
= 0.41). The median abnormal return is -11.39%. Nearly 52% of the sample firms do better than
the median return of the firms that belong to their assigned portfolio, insignificantly different
from 50%. The evidence suggests that over the five-year period, the stock price performance of
firms that invest in ERP systems is no different from that of their benchmark portfolios.
The results on changes in profitability (Panel B of Table 2) provide some evidence of
improvements in profitability. The mean and median changes in ROA are positive for the
implementation, post-implementation, and the combined implementation and post
implementation periods. The positive changes in ROA during the implementation period are
statistically significant at the 5% level. Although the changes in ROA during the post-
implementation period are positive, none of the changes are statistically significant. However,
during the combined implementation and post-implementation periods the median change of
1.03% in ROA is significantly different from zero (p-value � 0.01), and nearly 58% of the
16
sample firms experienced positive abnormal change in ROA, significantly different from 50%
(p-value � 0.025). The evidence suggests that ERP adopters show an improvement in ROA.
When ROS is used as the performance metrics, 8 of the 9 performance metrics (3 for
each time period) are positive but only three changes are statistically significant at the 5% level.
These are the median change during the post-implementation period, the percent of sample firms
that experience positive abnormal change during the post-implementation period, and the percent
of sample firms that experience positive abnormal change during the combined implementation
and post-implementation periods. Although there is some evidence of positive abnormal
changes in ROS, the results are not as strong as that of the changes in ROA.
Overall the evidence suggests that although firms that invest in ERP systems do not
experience a statistically significant increase in stock returns, there is some evidence to suggest
that profitability improves over the combined implementation and post-implementation periods.
To examine the ERP results in more detail, we segment the sample into four different
subsamples. We briefly summarize these findings. The detailed results are available from the
authors.
To estimate the effect of ERP systems during the post-implementation period more
precisely we examine the results only for those announcements that indicated that the firm has
completed the implementation of an ERP system. In this case we know when the
implementation was completed, and hence the time period after the completion would more
accurately represent the performance effects during the post-implementation period. The results
for this subsample are very similar to the overall sample.
We also examine the results for those announcements that indicated that the firm has
started or planned to start the implementation of an ERP system. In this case we know when the
17
implementation was started but not necessarily when it was completed. By examining the
performance of these firms over the five-year period, we shed some light on the payback from
ERP systems over a five-year period. Again the results for these subsamples are very similar to
the overall sample.
We also segment our sample into manufacturing and service firms to see if the benefits
from investments in ERP systems are more or less for manufacturing or service firms. We did
not find any evidence to suggest that the benefits of ERP implementation are different for
manufacturing or service firms. Basically, the results for these two subsamples are very similar
to those for the full sample.
5.2 Results for investments in SCM systems
Table 3 presents results for the sample of firms that invested in SCM systems. During
the one-year implementation period, the mean abnormal return is -1.46%, insignificantly
different from zero (p-value = 0.624). The median abnormal return is -8.11%. Of the 140
sample firms, about 45% of the sample firms did better than the median return of the firms that
belong to their assigned portfolios, insignificantly different from 50%. Basically, the abnormal
stock price performance during the implementation period is not statistically significant.
During the post-implementation period the mean abnormal return of 18.06% is
statistically significant (p-value = 0.025). However, the median abnormal return is -4.91%.
Nearly 51% of the firms do better than the median return of the firms that belong to their
assigned portfolio, insignificantly different from 50%. Over the full four-year period, the mean
abnormal return of 18.75% is statistically significant at the 7% level. The median is -9.24%.
Half the sample firms do better than the median return of the firms that belong to their assigned
18
portfolio. Overall, there is some evidence of positive abnormal stock price performance during
the four-year period.
The results for the accounting metrics (see Panel B of Table 3) provide strong support
that firms that invest in SCM systems show improvements in ROA and ROS. Improvements are
observed in both the implementation and post-implementation periods, with mean and median
changes in ROA and ROS generally positive and most are statistically significant at the 2.5%
level or better. The results for the combined implementation and post-implementation periods
indicate that the median change in the level of ROA is 1.78%. The median change in the level of
ROS is 1.44%. Both these changes are statistically significant (p-value � 0.01). More than 60%
of the sample firms experience positive abnormal changes in ROA and ROS during the
combined implementation and post-implementation periods. All the results for the combined
implementation and post-implementation periods are statistically significant at the 1% level or
better. Overall the results indicate that investments in SCM systems improved profitability.
Since very few of the SCM investment announcements in our sample indicated that the
firm had completed the implementation of an SCM system, it is not meaningful to analyze this
subsample separately. We also segment the SCM announcements sample into those made by
manufacturing firms (about 80% of the sample). The results for this subsample are generally
consistent with the results for the full sample.
5.3 Results for investments in CRM systems
Table 4 presents results for the sample firms that invested in CRM systems. During the
implementation period, the mean abnormal return is 6.84%, insignificantly different from zero
(p-value = 0.15). During the post-implementation period the mean abnormal return of -3.07% is
not statistically significant (p-value = 0.617). The percent of sample firms that do better than the
19
median return of the firms that belong to their assigned portfolio is insignificantly different from
50%. Overall, there is no evidence of positive or negative abnormal stock price performance
during the implementation and post-implementation periods. Over the full four-year period, the
mean (median) abnormal return is -15.22% (-12.41%), and nearly 53% of the sample firms do
better than the median return of the firms that belong to their assigned portfolio. However, none
of these performance changes are statistically significant. Basically, investments in CRM
systems have had little effect on the stock returns of investing firms.
The results of abnormal stock price performance are corroborated by the results on
changes in operating performance (see Panel B of Table 4). Changes in ROA and ROS are
generally positive during the implementation, post-implementation, and the combined
implementation and post-implementation period. Except for the mean change in ROA and ROS
during the combined implementation and post-implementation periods, none of these changes are
statistically significant. Overall, investments in CRM systems seem to have had little impact on
profitability.
Since very few of the CRM investments announcements in our sample indicated that the
firm has completed the implementation of a CRM system, it is not meaningful to analyze this
subsample separately. We also segment the CRM announcements sample into those made by
manufacturing firms (about 67% of the sample) and service firms (about 33% of the sample). In
both these subsamples, the results are generally consistent with the results for the full sample.
5.4 Are the results driven by the control group methodology?
Before we discuss the implications of our results, we need to address an important issue
that has been raised during the review process. The issue is whether our results could be driven
by the control sample, as it is not clear that the controls have not invested in ES. Hence, it is

20
plausible that the some of the insignificant results that we find with respect to ES systems are
because the controls have adopted ES systems. We certainly cannot claim that all firms in our
control set have not implemented ES. However, as discussed below we believe that the chances
are low that our results are driven by the possibility that a subset of control firms may have
implemented ES.
First, our sample has 406 ERP, SCM, and CRM announcements. Given that at any point
in time more than 5,000 firms are publicly traded, our control firms will come from a sample of
more than 4600 firms. If most of these 4600 firms have adopted ES, then one would be very
much concerned about our results. While we do not know what the controls have done, the
chances that most of the controls have ES are quite low. The adoption of ERP systems is still
limited among midsize and small firms, and the adoption is even lower for SCM and CRM
systems. Furthermore, given that our last announcement is in December 1999, the adoption rate
among controls in 1999 is likely to be much lower than today.
Second, even if some of the 4600 control firms have adopted ES, it should not have much
of an impact on our stock price performance results because of the method used to create the
1000 pseudo samples. In each pseudo sample we use size, prior performance, and market to
book ratio to select 406 firms from the sample of more than 4600 firms. We then compare the
results of the sample firms against the results of these 1000 pseudo samples. If each of these
1000 pseudo samples is dominated by control firms that have implemented ES then our results
would be a source of concern. While this could happen in a few of the pseudo samples, the
chances of this happening in most of the pseudo samples are very low as process of creating the
pseudo samples is quite randomized.
21
Third, in analyzing the performance effect of ES on ROA and ROS, we match each
sample firm to a comparison group that consists of firms from the same industry, and which have
similar performance characteristics. On average each comparison group consists of 20 firms.
Furthermore, we estimate abnormal performance relative to the change in the median
performance of the comparison group. The median of the comparison group is less likely to be
impacted by non-identified ES adopters. For example, with this approach if more than 50% of
the firms in each comparison group adopt ES, and ES adoption leads to positive results, then it
would be a cause of concern as these adopters would drive the median, and negate any positive
effect observed in the sample firms.
Finally, we note that our sample is based on firms that have started their implementation
between 1991 and 1999. At least in the case of SCM and CRM systems our sample is likely to
have firms that are early adopters, which minimizes the chances that the control firms may have
also implemented SCM and CRM systems.
The above discussion provides some rationale of why the chances are low that our results
are impacted by controls that may have also implemented ES. The purpose of controls is to
control for broad economic and industry factors. No control process will be perfect on all
dimensions. With a large sample of firms and reasonable level of randomization in the selection
process, there should not be any systematic bias in the selection of controls. Nonetheless given
the concerns about whether the controls are driving the results we report some additional
analyses on early ES adopters to test the robustness of our results.
5.5 Analysis of the performance of early adopters of ERP
Since it is not clear that controls have not invested in ES, another way of dealing with the
issue of whether this could drive our results is to examine the performance of early adopters.
22
While at a conceptual level the issue of controls adopting ES still remains, at a practical level the
issue would be less of a concern for the early adopters. It is less likely that most of our controls
are early adopters. We restrict our analysis only to the ERP sample as ERP systems have been
around longer than SCM and CRM systems. We define as early adopters those firms that have
made announcements of investments in ERP systems before 1998. Table 5 reports the abnormal
stock price and operating performance results for the early adopter
The evidence indicates that abnormal stock price performance results of early adopters
are not that different from the overall sample. The abnormal return during the implementation
period is negative, and is positive during the post-implementation period. However, the mean
abnormal returns over the implementation and post-implementation periods are insignificantly
different from zero.
The profitability performance (see Panel B of Table 5) of early adopters appears to be
stronger than the results for the full ERP sample (see Panel B of Table 2). Over the combined
implementation and post implementation periods, the improvements in ROA and ROS are
positive and statistically significant. There is some evidence of statistically significant positive
changes in ROA and ROS during the post-implementation period, which is stronger than what
was observed for the full ERP sample. Consistent with the results for the full sample, there is
weak evidence of improvements in profitability during the implementation period. The evidence
of Table 5 suggests that early adopters may have benefited more from ERP implementation when
compared to later adopters.
6.0 Comparison of our results with other studies
Despite the generally positive acceptance of ERP systems in practice and the academic
literature, other studies have not found overwhelmingly evidence of strong positive performance

23
effects from investments in ERP systems. Our results are generally consistent with these
findings. For example, although Peerstone Research (Zaino (2004)) found that 63% of 215 firms
gained “real benefits” from adopting ERP, they also report that only 40 percent could claim a
hard return on investment (ROI). Other ROI results are reported by Cooke and Peterson (1998)
in a survey of 63 companies that found an average ROI for ERP adoption of -$1.5 million.
Ranganathan and Samarah (2003) find that ERP adoption and implementation announcements
are associated with a statistically significant 0.84% abnormal stock price performance
improvement around announcement. Hitt et al. (2002) examine the performance effects of a
sample of SAP implementations. Although they find that ERP systems positively affect
performance, they are able to show this only for the implementation period.
While McAfee’s (2002) case study finds clear improvements in operational performance,
broad-based survey research reports conflicting results. Mabert et al. (2003) report limited
improvements in perceptual performance measures (mainly in financial close cycles and order
management) but found that few firms had reduced direct operational costs. Similarly, Stratman
(2001) found that manufacturing firms saw little change in operational metrics. It appears that
although managers are generally satisfied with the performance of ERP, perhaps high
implementation costs, together with few directly tangible performance benefits have led to
limited financial returns from ERP.
The evidence is more positive regarding the value of investments in SCM systems.
Although Nucleus Research (2003a) finds that 55% of 22 i2 Technologies users had not achieved
a positive ROI after using their SCM system for an average of 2.2 years, other studies are in line
with the results of this study. 80% of a Nucleus Research (2003b) survey of 20 Manugistics
users reported a positive payback within 16 months. More recently, Dehning et al. (2004)
24
provide evidence on the financial benefits of SCM systems by analyzing a set of 123
manufacturing firms (SIC Codes 2011-3999) who have chosen to implement or have
implemented an SCM application. They find that that these systems generally are associated
with improved financial performance. Our analyses, which includes both manufacturing and
service firms and uses methodology and metrics that are different from that used by Dehning et
al. (2004), confirm that SCM systems have a positive impact on financial performance over a
four-year period.
With respect to CRM our evidence indicates that investments in these systems do not
result in statistically significant changes in stock prices or profitability. These results are
consistent with that of Nucleus Research (2002), who report that 61% of the 23 Siebel customers
that they surveyed did not believe they had achieved a positive ROI.
7.0 Summary and future research
Our analysis of the financial benefits of ES implementations yields mixed results. In the
case of adopters of ERP systems, we find some evidence of improvements in profitability but not
in stock returns. The results for improvements in profitability are stronger in the case of early
adopters of ERP systems. On average, adopters of SCM system experience positive abnormal
returns as well as improvements in profitability. There is no evidence of improvements in stock
returns or profitability for firms that have invested in CRM. Although our results are not
uniformly positive across the different ES systems, they are encouraging in the sense that despite
the high implementation costs, we do not find persistent evidence of negative performance
associated with ES adoption. This should help alleviate the concerns that some have expressed
about the viability of ES given the highly publicized implementation problems at few firms.

25
Our results also add to the emerging literature on information technology (IT) and
productivity. The mixed results of studies examining the financial impact of IT investments led
some to propose a “productivity paradox”. Brynjolfsson and Hitt (1996) and Kohli and Devaraj
(2003) argue that often the financial value of large systems was hidden from those studies
because of lack of sufficient rigor. Some of the research issues that may obscure the results are:
(1) the choice of the performance metrics (Bharadwaj et al. (1999)), (2) the time period studied
(Devaraj and Kohli (2000)), (3) the method of analysis (Robey and Boudreau (1999)), and (4)
the presence of important intermediate variables (Barua et al. (1996), Bresnahan et al. (2002)).
This study addresses the first three of the four issues. The use of both accounting data
and stock returns gets at the need for financial metrics. We analyze data over a four or five-year
period to capture the long-term impact of ES adoption, and our estimation procedures ensure that
abnormal performance is robustly measured, and that the associated statistical tests are well
specified. However, in using publicly available stock price and accounting data, we are not able
to examine internal firm mediating factors that may influence the financial value from ES.
The linkage between specific internal capability factors and overall financial performance
is not always clear. The resource-based view (RBV) provides a theoretical framework for
evaluating the types of internal capabilities that provide a competitive advantage that can in turn
lead to improvements in financial performance (Peteraf (1993), Rumelt (1984), Wernerfelt
(1984, 1995)). Competitive capabilities are defined by the “VRIN” criteria of value, rarity,
inimitability, and non-substitutablity (Barney (1991)). Grant (1991) further classified internal
firm capabilities into tangible, intangible, and personnel-based capabilities. Tangible capabilities
are the hardware, software and network connections that make up the physical components of an
ES. Intangible capabilities are the customer and intra-firm relationships that are used to
26
exchange knowledge in support of the business. Personnel-based capabilities are the managerial
and technical skills of the personnel using the system.
The business integration and transaction automation offered by ES are valuable tangible
capabilities. However, the other three VRIN criteria are somewhat questionable when applied to
software systems that can be readily purchased (Carr (2003)). Nevertheless, the complex and
expensive implementation process may serve as a barrier to competitors (Rumelt (1984), Weill
and Broadbent (1998)). Sambamurthy et al. (2003) suggest that the personnel training and
business process changes required to integrate the technical capabilities of these systems into the
day-to-day operational practices of the firm are difficult to imitate and effectively non-
substitutable. The decisions made during the adoption process are likely to differ across firms
(Adner and Helfat (2003)), which implies that the outcomes may also differ. Indeed, several
studies suggest that internal organizational capabilities could influence the direction and extent
of financial benefits from ES adoption (Boudreau and Robey (2005), Brynjolfsson et al. (2002),
(Mata et al. (1995), Melville et al. (2004), Powell and Dent-Micallef (1997)).
A more detailed analysis of the distribution of abnormal performance of our sample firms
suggests that future research should explore the relationship between internal organizational
capabilities and financial performance. The abnormal stock price performance results presented
in Tables 2 through 5 have mean values that are generally higher than the median values. For
example, the buy-and-hold abnormal returns during the post-implementation period of firms
investing in ERP systems (Table 2) have a mean value of 13.41%, but a median value of -9.52%.
This suggests that some firms are achieving high returns from their ES investments. Additional
support for this explanation is provided by Figure 1, which shows the distribution of abnormal
stock returns during the three-year post-implementation period for our three ES samples. In the
27
case of the ERP adopters, nearly 20 out of 186 sample firms have abnormal returns greater than
100%. While one must be careful in drawing strong conclusions based on a small sample, it is
plausible that these 20 firms may represent firms that are best able to develop the requisite
internal capabilities during ES adoption. The performance improvements reported by such firms
may have convinced later adopters that they can achieve similar results by purchasing ES, even
though they lack the internal capabilities needed to fully leverage the potential of these systems.
Existing OM research in the area of ES has primarily focused on key factors for
successful implementation (e.g., Mabert et al. (2003)) and the operational benefits, such as faster
transaction processing and customer response, obtained from the use of these systems (e.g.,
McAfee (2002)). Researchers have started to examine organizational capabilities that influence
the success of ES adoption. For example, Stratman and Roth (2002) investigate the development
of internal capabilities such as the ERP competence, which is comprised of a portfolio of
intangible capabilities that enable a firm to leverage its ERP technology for competitive
advantage. These capabilities encompass both technical and organizational elements. Stratman
(2001) found that ERP users with high ERP competence are more likely to experience a
performance improvement from ERP adoption. Somers and Nelson (2003) also look beyond
implementation issues to assess the fit between ERP capabilities and organizational strategies
and integration mechanisms.
Future research on ES should move beyond the key factors for successful implementation
to address three key issues. First, operations strategy researchers need to use resource-based
theory to understand how firms realize benefits from the use of ES. Important questions such as
what organizational capabilities facilitate the successful use of ES, and what types of operational
processes promote the development of these capabilities, need to be addressed. This research
28
would logically focus on firms that have successfully implemented the software component of
ES in order to avoid confounding the analyses with the organizational disruptions associated
with failed software projects.
This raises an important issue related to the results of this study. We report the financial
impact experienced by the average firm adopting ES. Although we do not capture details of
individual firm implementation success or failure, it is likely that our sample includes some firms
which had implementation difficulties or failed implementations. Although the presence of such
firms would tend to attenuate the average performance benefits of ES investment, our approach
allows us to assess the overall benefits and risks faced by a typical firm planning to adopt ES.
Sampling only “successful” firms would tend to bias our results toward the benefits of ES and
provide managers with unrealistic expectations of ES adoption. However, future research
examining only firms that are actively and successfully using ES in day-to-day operations would
show the potential of these systems for those adopters skilled at complex systems
implementation.
Second, objective performance criteria need to be applied when assessing ES benefits. A
study that combines both secondary and primary source data might provide a clearer picture of
how ES influence operational, and in turn financial, performance. Primary data sources could be
used to determine precise implementation timelines, as well as to collect information on specific
operational practices that leverage the capabilities of ES. A study that compares and contrasts
the operational practices of firms that have financially benefited from ES against those that have
not could be very valuable.
Finally, the statistically significant improvement in performance of SCM adopters
suggests that the benefits of these systems are also tied to the capabilities of the software. SCM
29
systems codify many of the optimization techniques and algorithms developed by OM
researchers. Matching business characteristics such as extent of machine-paced production,
environmental dynamism, location in the supply chain, market power etc., would provide
validation for the applicability of OM models, as well as guidance to the most useful avenues of
future theory development.
Acknowledgements
We are very grateful to Gregory Hines, Serguei Netessine, four referees and the associate editor,
whose constructive comments have significantly improved the paper.
REFERENCES
Adner, R., Helfat, C.E., 2003. Corporate effects and dynamic managerial capabilities. Strategic Management Journal 24, 1011-1025. Akkermans, H. A., Bogerd, P., Yucesan, P.E., van Wassenhove, L., 1999. The impact of ERP on supply chain management: Exploratory findings from a European delphi study. European Journal of Operational Research 146, 284-301. AMR Research Press Release, 2004. AMR Research Press Release: Tech Trends Survey. AMR Research, Boston, MA. AT Kearney, 2000. Information technology monograph: Strategic information technology and the CEO agenda. AT Kearney, Chicago, Illinois. Bancroft, N.H., Seip, H., Sprengel, A., 1998. Implementing SAP R/3 (2nd ed.). Manning Publications Co., Greenwich, MA. Barber, B.M., Lyon, J.D., 1996. Detecting abnormal operating performance: The empirical power and specification of test statistics. Journal of Financial Economics 41, 359-399. Barber, B.M., Lyon, J.D., 1997. Detecting long-run abnormal stock returns: The empirical power and specification of test-statistics. Journal of Financial Economics 43, 341-372. Barney, J.B., 1991. Firm resources and sustained competitive advantage. Journal of Management 17 (1), 99-120. Barua A., Lee C.H., Whinston A.B., 1996. The calculus of reengineering. Information Systems Research 7(4), 409-428.

30
Bharadwaj A., Bharadwaj S., Konsynski B.R., 1999. Information technology effects on firm performance as measured by Tobin's Q. Management Science 45(7), 1008-1024. Boston Consulting Group, 2000. Creating value from enterprise initiatives: A survey of executives. Boston Consulting Group, Boston, Massachusetts. Boudreau M.C., Robey D., 2005. Enacting integrated information technology: A human agency perspective. Organization Science 16(1), 3-18. Bresnahan T.F., Brynjolfsson E., Hitt L.M., 2002. Information technology, workplace organization, and the demand for skilled labor: Firm level evidence. Quarterly Journal of Economics 117(1), 339-377. Brynjolfsson E., Hitt L., 1996. Paradox lost? Firm level evidence on the returns to information systems spending. Management Science 42(4), 541-558. Brynjolfsson E., Hitt L., Yang S., 2002. Intangible assets: Computers and organizational capital. Brookings Papers on Economic Activity 1, 137-182. Cachon, G., Fisher M., 2000. Supply chain inventory management and the value of shared information. Management Science 46, 1032-1048. Carr N.G., 2003. IT Doesn’t Matter. Harvard Business Review May, 5–12. Cheung, K.L., Lee H.L., 2002. The inventory benefit of shipment coordination and stock rebalancing in a supply chain. Management Science 48 (3), 300-306. Cooke, D.P., Peterson, W.J., 1998. SAP implementation: Strategies and results. The Conference Board, Research Report 1217-98-PR. Cotteleer, M.J., 2002. Order lead-time improvement following enterprise-IT implementation: An empirical study. Working paper, Harvard Business School, Boston, MA. Davenport, T.H., 1998. Putting the enterprise into the enterprise system. Harvard Business Review 76 (4), 121-131. Dehning, B., Richardson, V.J., Zmud, R.W., 2004. The financial performance effects of IT-based supply chain management systems in manufacturing firms. Working Paper, Argyros School of Business and Economics, Chapman University, California. Devaraj, S., Kohli, R., 2000. Performance impacts of information technology: Is actual usage the missing link? Management Science 49(3), 273-289. Fama, E.F., 1998. Market efficiency, long-term returns, and behavioral finance. Journal of Financial Economics 49, 283-306.
Grant, R.M., 1991. The resource-based theory of competitive advantage. California Management
31
Review 33 (3) 114-135. Hendricks, K.B., Singhal, V.R., 2003. The effect of supply chain glitches on shareholder value. Journal of Operations Management 21, 501-522. Hendricks, K. B., and Singhal, V. R. 2005. An Empirical analysis of the effect of supply chain disruptions on long-run stock price performance and risk of the firm. Production and Operations Management, 14, 35-52. Hitt, L.M., Wu, D.J., Zhou, X., 2002. Investment in enterprise resources planning. Journal of Management Information Systems 19, 71-98. Jancic, Z., Zabkar, V., 2002. Interpersonal vs. Personal Exchanges in Marketing Relationships. Journal of Marketing Management 18, 657-671. Katz, H., 2002. How to embrace CRM and make it succeed in an organization. SYSPRO White Paper. SYSPRO, Costa Mesa, CA. Kohli, R., Devaraj, S. 2003. Measuring information technology payoff: A meta-analysis of structural variables in firm-level empirical research. Information Systems Research 14(2), 127-145. Kothari, S.P., Warner, J.B., 1997. Measuring long-horizon security price performance. Journal of Financial Economics 43, 301-339. Kraus, B., O’Brian, D., 2002. Enterprise applications growth falls back to earth, will stay grounded in 2002. AMR Research, Boston, MA. Lee, H., Padamanabhan, P., Whang, S., 1997. Information distortion in supply chain: The bullwhip effect. Management Science 43, 546-558. Lyon, J.D, Barber, B.M., Tsai, C., 1999. Improved methods for tests of long-run abnormal stock returns. Journal of Finance 54, 165-201. Mabert, V.A., Soni, A.K., Venkataramanan, M.A., 2000. Enterprise resource planning survey of US manufacturing firms. Production & Inventory Management Journal 41 (20), 52-58. Mabert, V.A., Soni, A.K., Venkataramanan, M.A., 2003. The impact of organization size on enterprise resource planning (ERP) implementations in the US manufacturing sector. OMEGA 31, 235-246. Mata, F.J., Fuerst, W.L., Barney, J.B., 1995. Information technology and sustained competitive advantage: A resource-based analysis. MIS Quarterly 19(4), 487-505. McAfee, A., 1999. The impact of enterprise resource planning systems on company performance. Unpublished presentation at Wharton Supply Chain Conference December 1999.
32
McAfee, A., 2002. The impact of enterprise information technology adoption on operational performance: An empirical investigation. Production and Operations Management 11 (1), 33-53. McAfee, A., Upton, D., 1996. Vandelay Industries. Harvard Business School Case # 9-697-037, Harvard Business School Publishing, Boston, MA. Melville N., Kraemer K., Gurbaxani V., 2004. Review: Information technology and organizational performance: An integrative model of IT business value. MIS Quarterly 28(2), 283-322. Milner, J.M., Kouvelis, P., 2002. On the complementary value of accurate demand information and production and supplier flexibility. Manufacturing & Service Operations Management 4, 99-113. Morgan, R. M., Hunt, S.D. 1994. The commitment-trust theory of relationship marketing. Journal of Marketing 58, 20-38. Nucleus Research, 2002. Assessing the real ROI from Siebel. Nucleus Research Note C47, Wellesley, MA. Nucleus Research, 2003a. The real ROI from i2 supply chain management. Nucleus Research Note D11, Wellesley, MA. Nucleus Research, 2003b. The real ROI from Manugistics. Nucleus Research Note D16, Wellesley, MA. O’Leary, D., 2000. Enterprise resource planning systems, life cycle, electronic commerce, and risk. Cambridge University Press, New York. Peteraf M.A., 1993. The cornerstones of competitive advantage: A resource based view. Strategic Management Journal 14(3), 179-191. Powell T.C., Dent-Micallef A., 1997. Information technology as competitive advantage: The role of human, business and technology resources. Strategic Management Journal 18(5), 375-405. Raman, A., Singh, J., 1998. i2 Technologies. Harvard Business School Case # 9-699-042, Harvard Business School Publishing, Boston, MA. Ranganathan, C., I. Samarah, I., 2003. Enterprise resource planning systems and firm value: An event study analysis. Working Paper, University of Illinois at Chicago, Chicago. Robey, D., Boudreau, M.C., 1999. Accounting for the contradictory organizational consequences of information technology: Theoretical directions and methodological implications. Information Systems Research 10(2), 167-185.
33
Rumelt, R.P. 1984. Towards a strategic theory of the firm. In R.B. Lamb, ed. Competitive Strategic Management. Prentice Hall, Englewood Cliffs, NJ. Sambamurthy V., Bharadwaj A., Grover V., 2003. Shaping agility through digital options: Reconceptualizing the role of information technology in contemporary firms. MIS Quarterly 27(2), 237-263. Scott, J.E., Vessey, I., 2000. Implementing enterprise resource planning systems: The role of learning from failure. Information Systems Frontiers 2 (2), 213-232. Sheth, J. N., Sisodia, R.S., Sharma, A., 2000. The antecedents and consequences of customer-centric marketing. Journal of the Academy of Marketing Science 28 (1), 55-66. Somers, T.M., Nelson, K.G. 2003. The impact of strategy and integration mechanisms on enterprise system value: Empirical evidence from manufacturing firms. European Journal of Operational Research 146, 315-338. Stratman, J.K. 2001. Information integration for supply chain management: An empirical investigation of ERP systems in manufacturing. Ph.D. Dissertation (unpublished), University of North Carolina, Chapel Hill, NC. Stratman, J.K., Roth, A.V., 2002. Enterprise resource planning (ERP) competence constructs: Two-stage multi-item scale development and validation. Decision Sciences 33 (4), 601-628. Suresh, H., 2004. What is customer relationship management (CRM)? Supply Chain Planet, April, 2004. Vollmann, T.E., Berry, T.E., Whybark, D.C., Jacobs, F.R. 2005. Manufacturing planning and control for supply chain management. McGraw-Hill Irwin, Boston, MA. Weill, P., Broadbent, M. 1998. Leveraging the new infrastructure: How market leaders capitalize on information technology. Harvard Business School Press, Boston, MA. Wernerfelt, B. 1995. The resource-based view of the firm: Ten years after. Strategic Management Journal, 16(2), 171-174. Wernerfelt, B., 1984. A resource-based view of the firm. Strategic Management Journal 5 (2), 171-180. Zaino, J., 2004. ERP integration struggles to connect. Information Week, March 29. Retrieved April 22, 2004 from the World Wide Web: http://www.informationweek.com/showArticle.jhtml?articleID=18402681.
34
Table 1: Description of the sample of firms that have made announcements of investing in ES Panel A: Descriptive statistics for the sample of ERP investment announcements ___________________________________________________________________________ Measure Mean Median Std. Dev. Maximum Minimum ___________________________________________________________________________ Sales ($million) 6958.6 1678.7 16651.8 168919.0 0.53
Total Assets ($million) 10329.9 1461.6 36612.7 355935.0 4.00
Equity Market value ($million) 10092.9 2002.3 2983.9 333672.0 6.01
Employment (thousands) 31.2 9.2 64.3 608.0 0.01
__________________________________________________________________________
Panel B: Descriptive statistics for the sample of SCM investment announcements ___________________________________________________________________________ Measure Mean Median Std. Dev. Maximum Minimum ___________________________________________________________________________ Sales ($million) 10020.8 4089.0 18931.1 120279.0 0.53
Total Assets ($million) 13735.9 3253.6 46632.2 405200.0 23.54
Equity Market value ($million) 18882.2 3265.0 55572.1 508329.5 11.15
Employment (thousands) 38.5 16.0 59.2 340.0 0.01
__________________________________________________________________________
Panel C: Descriptive statistics for the sample of CRM investment announcements ___________________________________________________________________________ Measure Mean Median Std. Dev. Maximum Minimum ___________________________________________________________________________ Sales ($million) 9609.5 2876.8 15431.6 99820.0 4.12
Total Assets ($million) 25199.7 3404.1 6050.5 355935.0 5.58
Equity Market value ($million) 27377.2 5216.9 5517.8 333672.1 5.66
Employment (thousands) 32.2 14.0 49.9 293.0 0.10
__________________________________________________________________________
3
5
Tab
le 2
: P
erfo
rman
ce r
esult
s fo
r th
e sa
mple
of
firm
s in
ves
ting i
n E
RP
syst
ems.
Pan
el A
: R
esult
s on t
he
mea
n a
bnorm
al s
tock
ret
urn
(p-v
alue
from
the
empir
ical
dis
trib
uti
on c
reat
ed f
rom
1000 r
epli
cati
ons
of
pse
udo p
ort
foli
os
in p
aren
thes
is),
the
med
ian a
bnorm
al s
tock
ret
urn
, an
d t
he
% o
f sa
mple
fir
m w
ith r
eturn
s gre
ater
than
the
med
ian r
eturn
of
the
firm
s th
at b
elong t
o
thei
r as
signed
ben
chm
ark p
ort
foli
os
(the
bin
om
ial
sign t
est
Z-s
tati
stic
in p
aren
thes
es).
Per
form
ance
mea
sure
sIm
ple
men
tati
on
per
iod
Post
-im
ple
men
tati
on p
erio
dIm
ple
men
tati
on a
nd p
ost
(day
s 0
to 5
00
)(d
ays
501
to 1
250
)im
ple
men
tati
on
per
iod (
day
s 0 t
o 1
25
0)
Num
ber
of
ob
serv
atio
ns
18
61
86
18
6
Mea
n a
bno
rmal
ret
urn
(%
)-1
1.9
6%
(0.0
64)
10.9
7%
(0.0
43)
-5.0
6%
(0.4
1)
Med
ian a
bno
rmal
ret
urn
(%
)-2
3.0
4%
-1.0
3%
-11.3
9%
% o
f sa
mp
le f
irm
s w
ith r
etu
rns
39
.78
% (
-2.7
9)
a51.0
7%
(0.2
9)
51.6
1%
(0
.44
)
gre
ater
th
an i
ts p
ort
foli
o m
edia
n
Pan
el B
: R
esult
s on a
bnorm
al r
eturn
on a
sset
s an
d r
eturn
on s
ales
. T
-sta
tist
ics
for
the
mea
n,
Wil
coxon s
igned
-ran
k t
est
Z-s
tati
stic
for
the
med
ian,
and b
inom
ial
sign t
est
Z-s
tati
stic
for
the
% p
osi
tive
are
report
ed i
n p
aren
thes
es.
P
erfo
rman
ce M
easu
res
Obs
Mea
nM
edia
n%
Pos.
Ob
sM
ean
Med
ian
% P
os.
Obs
Mea
nM
edia
n%
Pos.
Abn
orm
al c
han
ge
in t
he
186
1.0
3%
0.5
6%
56.4
5%
16
70.3
7%
0.6
0%
53
.89
%1
86
1.0
9%
1.0
3%
57.5
3%
level
of
retu
rn o
n a
sset
s(1
.77)
c(1
.74)
c(1
.76
)c
(0.5
2)
(0.8
1)
(1.0
1)
(1.5
3)
(2.4
9)
a(2
.05)
b
Abn
orm
al c
han
ge
in t
he
186
0.5
8%
0.3
6%
53.2
2%
16
70.3
1%
1.0
4%
57
.48
%1
86
-0.1
5%
0.6
7%
56.9
8%
the
level
of
retu
rn o
n s
ales
(1.2
8)
(1.4
2)
(0.8
8)
(0.3
8)
(1.7
0)
c(1
.93)
c(-
0.1
8)
(1.4
2)
(1.9
0)
c
Imp
lem
enta
tion p
erio
dP
ost
-im
ple
men
tati
on p
erio
dIm
ple
men
tati
on
an
d p
ost
-im
ple
men
tati
on
Fro
m Y
ear
0 t
o Y
ear
2F
rom
Yea
r 2
to
Yea
r 5
per
iod -
Fro
m Y
ear
0 t
o y
ear
5
a,
b,
and c
den
ote
sig
nif
ican
tly d
iffe
rent
from
zer
o (
50%
in t
he
case
of
% p
osi
tive)
at
the
1%
, 2.5
%,
and 5
%
level
s, r
espec
tivel
y,
for
one-
tail
ed
test
.
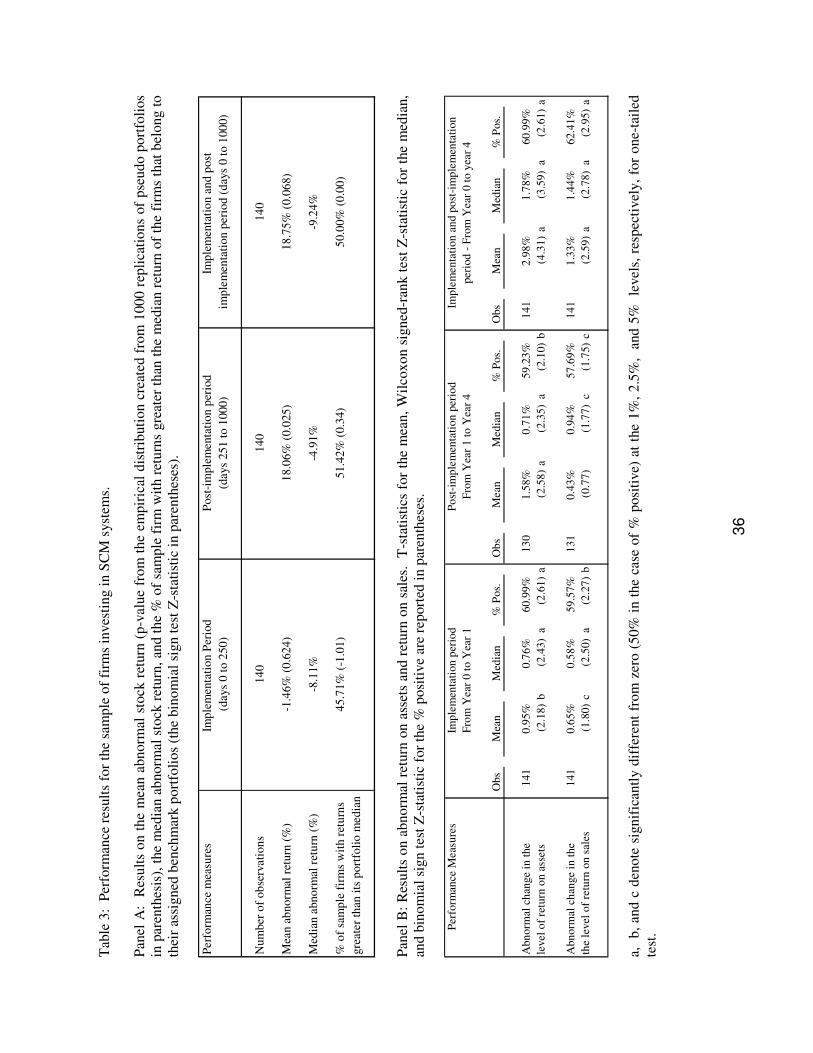
3
6
Tab
le 3
: P
erfo
rman
ce r
esult
s fo
r th
e sa
mple
of
firm
s in
ves
ting i
n S
CM
syst
ems.
Pan
el A
: R
esult
s on t
he
mea
n a
bnorm
al s
tock
ret
urn
(p-v
alue
from
the
empir
ical
dis
trib
uti
on c
reat
ed f
rom
1000 r
epli
cati
ons
of
pse
udo p
ort
foli
os
in p
aren
thes
is),
the
med
ian a
bnorm
al s
tock
ret
urn
, an
d t
he
% o
f sa
mple
fir
m w
ith r
eturn
s gre
ater
than
the
med
ian r
eturn
of
the
firm
s th
at b
elong t
o
thei
r as
signed
ben
chm
ark p
ort
foli
os
(the
bin
om
ial
sign t
est
Z-s
tati
stic
in p
aren
thes
es).
P
erfo
rman
ce m
easu
res
Imp
lem
enta
tio
n P
erio
d
Post
-im
ple
men
tati
on p
erio
dIm
ple
men
tati
on a
nd p
ost
(day
s 0
to 2
50
)(d
ays
251
to 1
000
)im
ple
men
tati
on
per
iod (
day
s 0 t
o 1
00
0)
Num
ber
of
ob
serv
atio
ns
14
01
40
14
0
Mea
n a
bno
rmal
ret
urn
(%
)-1
.46%
(0
.62
4)
18.0
6%
(0.0
25)
18
.75
% (
0.0
68)
Med
ian a
bno
rmal
ret
urn
(%
)-8
.11%
-4.9
1%
-9.2
4%
% o
f sa
mp
le f
irm
s w
ith r
etu
rns
45.7
1%
(-1
.01)
51.4
2%
(0.3
4)
50.0
0%
(0
.00
)
gre
ater
th
an i
ts p
ort
foli
o m
edia
n
Pan
el B
: R
esult
s on a
bnorm
al r
eturn
on a
sset
s an
d r
eturn
on s
ales
. T
-sta
tist
ics
for
the
mea
n,
Wil
coxon s
igned
-ran
k t
est
Z-s
tati
stic
for
the
med
ian,
and b
inom
ial
sign t
est
Z-s
tati
stic
for
the
% p
osi
tive
are
report
ed i
n p
aren
thes
es.
P
erfo
rman
ce M
easu
res
Obs
Mea
nM
edia
n%
Pos.
Ob
sM
ean
Med
ian
% P
os.
Obs
Mea
nM
edia
n%
Pos.
Abn
orm
al c
han
ge
in t
he
141
0.9
5%
0.7
6%
60.9
9%
13
01.5
8%
0.7
1%
59
.23
%1
41
2.9
8%
1.7
8%
60.9
9%
level
of
retu
rn o
n a
sset
s(2
.18)
b(2
.43)
a(2
.61
)a
(2.5
8)
a(2
.35)
a(2
.10)
b(4
.31)
a(3
.59)
a(2
.61)
a
Abn
orm
al c
han
ge
in t
he
141
0.6
5%
0.5
8%
59.5
7%
13
10.4
3%
0.9
4%
57
.69
%1
41
1.3
3%
1.4
4%
62.4
1%
the
level
of
retu
rn o
n s
ales
(1.8
0)
c(2
.50)
a(2
.27
)b
(0.7
7)
(1.7
7)
c(1
.75)
c(2
.59)
a(2
.78)
a(2
.95)
a
Imp
lem
enta
tion p
erio
dP
ost
-im
ple
men
tati
on p
erio
dIm
ple
men
tati
on
an
d p
ost
-im
ple
men
tati
on
Fro
m Y
ear
0 t
o Y
ear
1F
rom
Yea
r 1
to
Yea
r 4
per
iod -
Fro
m Y
ear
0 t
o y
ear
4
a,
b,
and c
den
ote
sig
nif
ican
tly d
iffe
rent
from
zer
o (
50%
in t
he
case
of
% p
osi
tive)
at
the
1%
, 2.5
%,
and 5
%
level
s, r
espec
tivel
y,
for
one-
tail
ed
test
.

3
7
Tab
le 4
: P
erfo
rman
ce r
esult
s fo
r th
e sa
mple
of
firm
s in
ves
ting i
n C
RM
sys
tem
s.
Pan
el A
: R
esult
s on t
he
mea
n a
bnorm
al s
tock
ret
urn
(p-v
alue
from
the
empir
ical
dis
trib
uti
on c
reat
ed f
rom
1000 r
epli
cati
ons
of
pse
udo p
ort
foli
os
in p
aren
thes
is),
the
med
ian a
bnorm
al s
tock
ret
urn
, an
d t
he
% o
f sa
mple
fir
m w
ith r
eturn
s gre
ater
than
the
med
ian r
eturn
of
the
firm
s th
at b
elong t
o
thei
r as
signed
ben
chm
ark p
ort
foli
os
(the
bin
om
ial
sign t
est
Z-s
tati
stic
in p
aren
thes
es).
P
erfo
rman
ce m
easu
res
Imp
lem
enta
tion
per
iod
Post
-im
ple
men
tati
on p
erio
dIm
ple
men
tati
on a
nd p
ost
(day
s 0
to 2
50
)(d
ays
251
to 1
000
)im
ple
men
tati
on
per
iod (
day
s 0 t
o 1
00
0)
Num
ber
of
ob
serv
atio
ns
80
80
80
Mea
n a
bno
rmal
ret
urn
(%
)6.8
4%
(0.1
52
)-3
.07
% (
0.6
17
)-1
5.2
2%
(0.8
04
)
Med
ian a
bno
rmal
ret
urn
(%
)-4
.66%
-12
.12
%-1
2.4
1%
% o
f sa
mp
le f
irm
s w
ith r
etu
rns
53
.75%
(0
.67
)48
.75
% (
-0.2
2)
52.5
0%
(0
.45
)
gre
ater
th
an i
ts p
ort
foli
o m
edia
n
P
anel
B:
Res
ult
s on a
bnorm
al r
eturn
on a
sset
s an
d r
eturn
on s
ales
. T
-sta
tist
ics
for
the
mea
n,
Wil
coxon s
igned
-ran
k t
est
Z-s
tati
stic
for
the
med
ian,
and b
inom
ial
sign t
est
Z-s
tati
stic
for
the
% p
osi
tive
are
report
ed i
n p
aren
thes
es.
P
erfo
rman
ce M
easu
res
Obs
Mea
nM
edia
n%
Pos.
Ob
sM
ean
Med
ian
% P
os.
Obs
Mea
nM
edia
n%
Pos.
Abn
orm
al c
han
ge
in t
he
81
1.0
1%
0.2
5%
56.7
9%
77
0.7
9%
0.0
2%
50
.64
%81
2.2
1%
0.2
5%
55.5
5%
level
of
retu
rn o
n a
sset
s(0
.79)
(-0
.80)
(1.2
2)
(0.5
8)
(0.8
4)
(0.1
1)
(1.9
4)
c(1
.46)
(0.9
9)
Abn
orm
al c
han
ge
in t
he
81
2.4
0%
0.6
7%
58.0
2%
77
0.7
5%
1.0
5%
53
.25
%81
4.6
4%
1.3
7%
54.3
2%
the
level
of
retu
rn o
n s
ales
(1.5
7)
(1.6
3)
(1.4
4)
(0.5
7)
(0.9
6)
(0.5
7)
(2.2
5)
b(1
.48)
(0.7
8)
Imp
lem
enta
tion p
erio
dP
ost
-im
ple
men
tati
on p
erio
dIm
ple
men
tati
on
an
d p
ost
-im
ple
men
tati
on
Fro
m Y
ear
0 t
o Y
ear
1F
rom
Yea
r 1
to
Yea
r 4
per
iod -
Fro
m Y
ear
0 t
o y
ear
4
a,
b,
and c
den
ote
sig
nif
ican
tly d
iffe
rent
from
zer
o (
50%
in t
he
case
of
% p
osi
tive)
at
the
1%
, 2.5
%,
and 5
%
level
s, r
espec
tivel
y,
for
one-
tail
ed
test
.
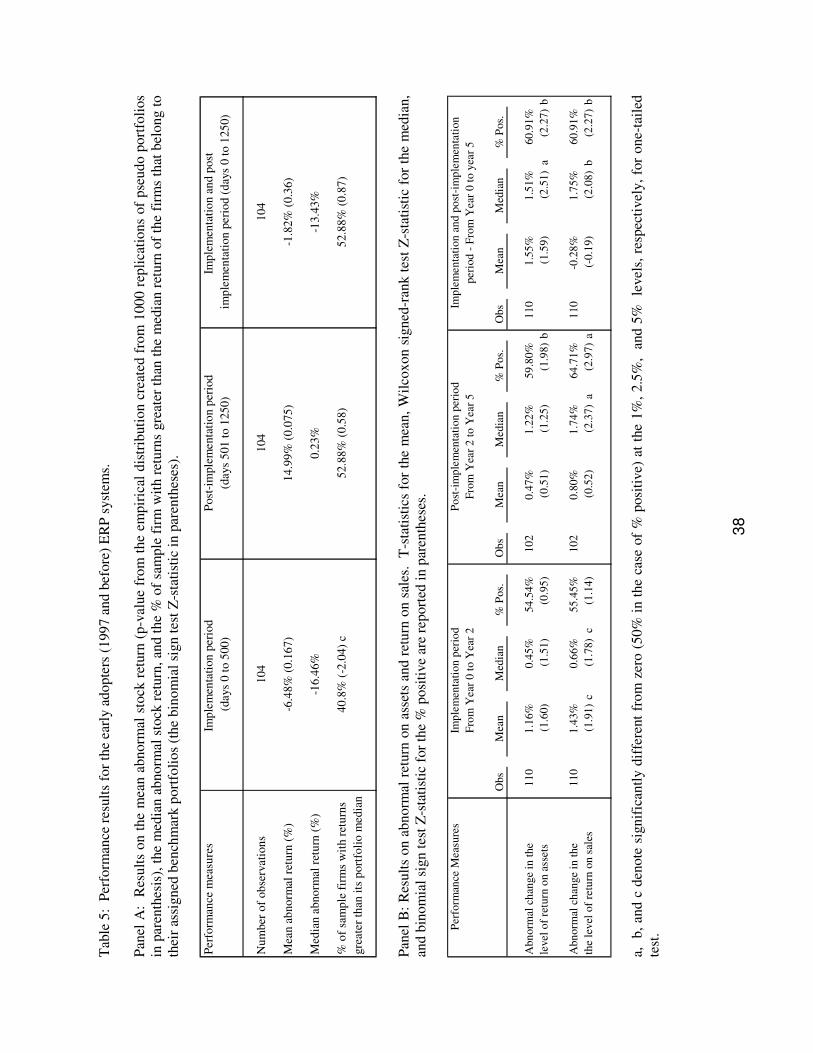
3
8
Tab
le 5
: P
erfo
rman
ce r
esult
s fo
r th
e ea
rly a
dopte
rs (
1997 a
nd b
efore
) E
RP
syst
ems.
Pan
el A
: R
esult
s on t
he
mea
n a
bnorm
al s
tock
ret
urn
(p-v
alue
from
the
empir
ical
dis
trib
uti
on c
reat
ed f
rom
1000 r
epli
cati
ons
of
pse
udo p
ort
foli
os
in p
aren
thes
is),
the
med
ian a
bnorm
al s
tock
ret
urn
, an
d t
he
% o
f sa
mple
fir
m w
ith r
eturn
s gre
ater
than
the
med
ian r
eturn
of
the
firm
s th
at b
elong t
o
thei
r as
signed
ben
chm
ark p
ort
foli
os
(the
bin
om
ial
sign t
est
Z-s
tati
stic
in p
aren
thes
es).
Per
form
ance
mea
sure
sIm
ple
men
tati
on
per
iod
Post
-im
ple
men
tati
on p
erio
dIm
ple
men
tati
on a
nd p
ost
(day
s 0
to 5
00
)(d
ays
501
to 1
250
)im
ple
men
tati
on
per
iod (
day
s 0 t
o 1
25
0)
Num
ber
of
ob
serv
atio
ns
10
41
04
10
4
Mea
n a
bno
rmal
ret
urn
(%
)-6
.48%
(0
.16
7)
14.9
9%
(0.0
75)
-1.8
2%
(0.3
6)
Med
ian a
bno
rmal
ret
urn
(%
)-1
6.4
6%
0.2
3%
-13.4
3%
% o
f sa
mp
le f
irm
s w
ith r
etu
rns
40
.8%
(-2
.04)
c52.8
8%
(0.5
8)
52.8
8%
(0
.87
)
gre
ater
th
an i
ts p
ort
foli
o m
edia
n
Pan
el B
: R
esult
s on a
bnorm
al r
eturn
on a
sset
s an
d r
eturn
on s
ales
. T
-sta
tist
ics
for
the
mea
n,
Wil
coxon s
igned
-ran
k t
est
Z-s
tati
stic
for
the
med
ian,
and b
inom
ial
sign t
est
Z-s
tati
stic
for
the
% p
osi
tive
are
report
ed i
n p
aren
thes
es.
P
erfo
rman
ce M
easu
res
Obs
Mea
nM
edia
n%
Pos.
Ob
sM
ean
Med
ian
% P
os.
Obs
Mea
nM
edia
n%
Pos.
Abn
orm
al c
han
ge
in t
he
110
1.1
6%
0.4
5%
54.5
4%
10
20.4
7%
1.2
2%
59
.80
%1
10
1.5
5%
1.5
1%
60.9
1%
level
of
retu
rn o
n a
sset
s(1
.60)
(1.5
1)
(0.9
5)
(0.5
1)
(1.2
5)
(1.9
8)
b(1
.59)
(2.5
1)
a(2
.27)
b
Abn
orm
al c
han
ge
in t
he
110
1.4
3%
0.6
6%
55.4
5%
10
20.8
0%
1.7
4%
64
.71
%1
10
-0.2
8%
1.7
5%
60.9
1%
the
level
of
retu
rn o
n s
ales
(1.9
1)
c(1
.78)
c(1
.14
)(0
.52
)(2
.37)
a(2
.97)
a(-
0.1
9)
(2.0
8)
b(2
.27)
b
Imp
lem
enta
tion p
erio
dP
ost
-im
ple
men
tati
on p
erio
dIm
ple
men
tati
on
an
d p
ost
-im
ple
men
tati
on
Fro
m Y
ear
0 t
o Y
ear
2F
rom
Yea
r 2
to
Yea
r 5
per
iod -
Fro
m Y
ear
0 t
o y
ear
5
a,
b,
and c
den
ote
sig
nif
ican
tly d
iffe
rent
from
zer
o (
50%
in t
he
case
of
% p
osi
tive)
at
the
1%
, 2.5
%,
and 5
%
level
s, r
espec
tivel
y,
for
one-
tail
ed
test
.
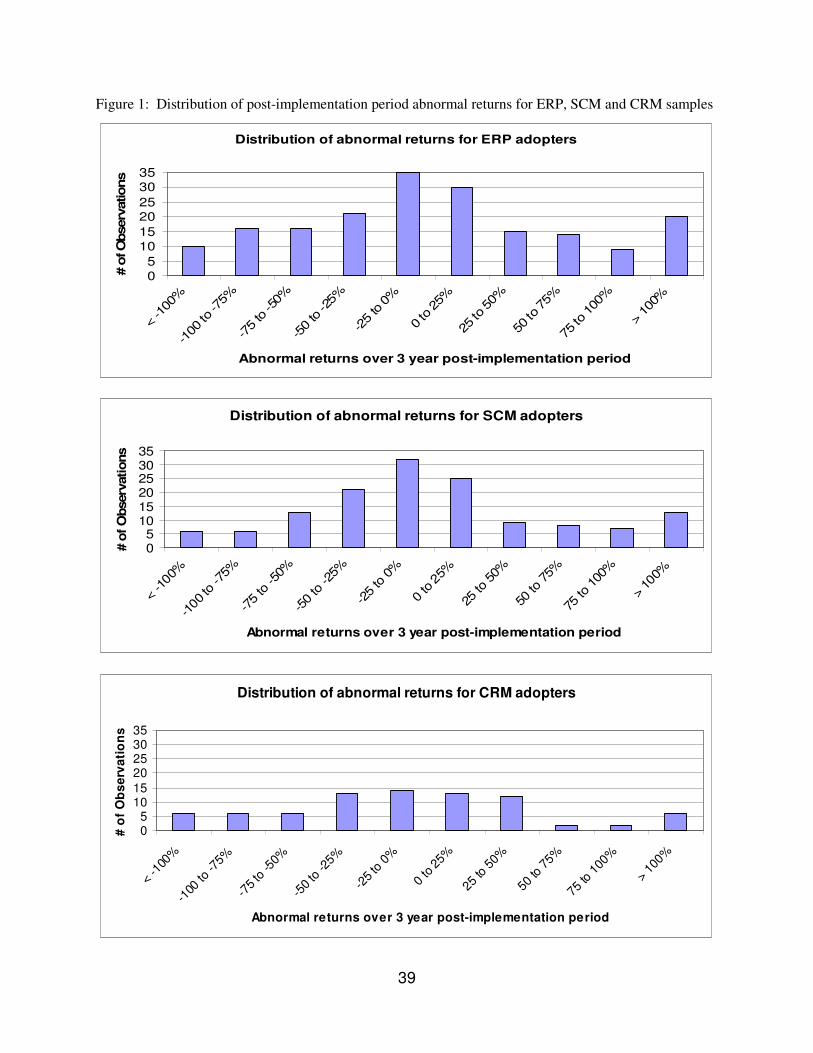
39
Figure 1: Distribution of post-implementation period abnormal returns for ERP, SCM and CRM samples
Distribution of abnormal returns for ERP adopters
0
5
10
15
20
25
30
35
< -100%
-100 to -75%
-75 to -50%
-50 to -25%
-25 to 0%
0 to 25%
25 to 50%
50 to 75%
75 to 100%
> 1
00%
Abnormal returns over 3 year post-implementation period
# o
f O
bserv
ations
Distribution of abnormal returns for SCM adopters
0
5
10
15
20
25
30
35
< -100%
-100 to -75%
-75 to -50%
-50 to -25%
-25 to 0
%
0 to 2
5%
25 to 5
0%
50 to 7
5%
75 to 1
00%
> 100%
Abnormal returns over 3 year post-implementation period
# o
f O
bserv
ations
Distribution of abnormal returns for CRM adopters
0
5
10
15
20
25
30
35
< -100
%
-100
to -75%
-75 to
-50%
-50
to -25%
-25
to 0
%
0 to 25%
25 to
50%
50 to
75%
75 to
100%
> 1
00%
Abnormal returns over 3 year post-implementation period
# o
f O
bs
erv
ati
on
s