SCM 302 OPERATIONS MANAGEMENT
29
SCM 302 OPERATIONS MANAGEMENT Supply Chain Management
-
Upload
khangminh22 -
Category
Documents
-
view
0 -
download
0
Transcript of SCM 302 OPERATIONS MANAGEMENT

SCM 302OPERATIONS MANAGEMENTSupply Chain Management

Supply Chain ManagementWho are my partners?Which organizations are in my network?
• Supply Chain Management1. Explain the strategic importance of the supply chain2. Identify six sourcing strategies3. Explain issues and opportunities in the supply chain4. Describe the steps in supplier selection5. Explain major issues in logistics management6. Compute percent of assets committed to inventory and inventory
turnover
• Supply Chain Analytics1. Use a decision tree to determine number of suppliers to manage risk2. Explain and measure the bullwhip effect3. Describe the factor weighting approach to supplier evaluation4. Evaluate cost-of-shipping alternatives
Chapter 11, 11S
SCM 302 - Supply Chain Management
2
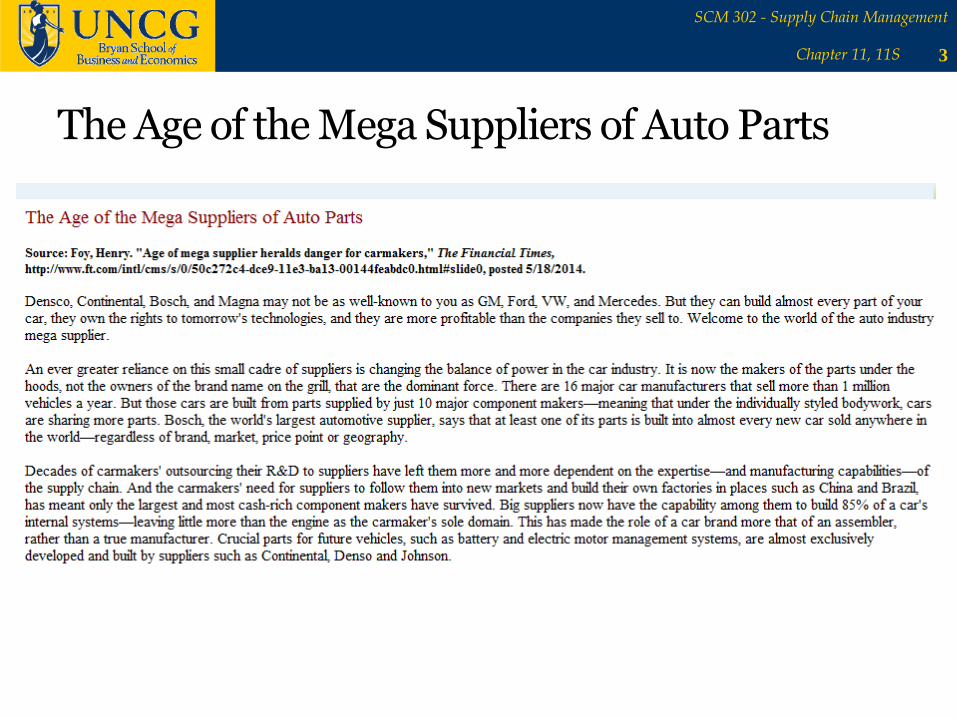
The Age of the Mega Suppliers of Auto Parts
Chapter 11, 11S
SCM 302 - Supply Chain Management
3

Supply-Chain Management
Management of activities related to procuring materials and services, transforming them into intermediate goods and final products and delivering them through the distribution system• Raw materials to customer• Suppliers, manufacturers and/or service
providers, distributors, wholesalers, retailers, and final customer
• Objective: build a chain of suppliers that focuses on maximizing value to the ultimate customer.• Competition is no longer between companies, but
between supply chains
IT’S ALL ABOUT RELATIONSHIPS!• Managing supplier and customer relationships
which are increasingly integrated and long-term
Chapter 11, 11S
SCM 302 - Supply Chain Management
4

A Supply Chain for Beer
Chapter 11, 11S
SCM 302 - Supply Chain Management
5
Figure 11.1

Issue #1: Sourcing. Make vs. Buy
• Choosing between obtaining products and services externally or to producing them internally
• Outsourcing• Transfer traditional internal activities and resources to
outside vendors
• Efficiency in specialization
• Focus on core competencies
Chapter 11, 11S
SCM 302 - Supply Chain Management
6

Issue#2. Sourcing. How many suppliers?Six Sourcing Strategies
Chapter 11, 11S
SCM 302 - Supply Chain Management
7
1. Many suppliers•Negotiate with many suppliers.•Common for commodities•Suppliers compete on price•Suppliers responsible for
technology, expertise, forecasting, cost, quality, and delivery
2. Few suppliers•Long-term partnerships•Economies of scale.•Learning curve benefits•Supplier incentives to
participate in JIT, contribute expertise
•High cost of changing suppliers
3. Vertical integration•Ability to produce goods or
services previously purchased•Acquire a supplier/distributor•Forward or Backward•Can improve cost, quality, and
inventory but requires capital, managerial skills
•Better in stable market
4. Joint ventures•Formal collaboration•Enhance skills, secure supply,
reduce costs, pool resources•Risks: dilute brand, concede
competitive advantage•E.g. Deere-Hitachi
5. Keiretsu networks•Financially independent,
mutually supportive coalition•Financial support for other
members, e.g. loans•Members expect long-term
relationships, provide technical expertise and stable deliveries
•Extends to several levels•E.g. Mitsubishi
6. Virtual companies•Rely on telecommunications
technologies to work with suppliers, employees, contractors around the world.
•Fluid boundaries allow for flexibility, responsiveness
•Lean performance, low capital investment
•E.g. Amazon

Vertical Integration
Chapter 11, 11S
SCM 302 - Supply Chain Management
8
Figure 11.2
Raw material (suppliers)
Tree Harvesting
Backward integration Chipmakers Pulpmaking
Current transformation
Pepsi AppleInternational Paper
Forward integration Bottling Retail storesEnd-User Paper Conversion
Finished goods (customers)
Vertical Integration Examples of Vertical Integration

Issue #3. Managing Supply Chain Risk
• More reliance on supply chains means more risk• Fewer suppliers = putting all of your eggs in one basket• Compounded by globalization and logistical complexity
• Types of risk (see next slide)• Vendor reliability and quality risks• Political and currency risks• Research and assess possible risks
• Risk Mitigation Tactics• Innovative planning• Reduce potential disruptions• Insurance and contingency plans• Information sharing• Flexible, secure supply chains• Diversified supplier base
Chapter 11, 11S
SCM 302 - Supply Chain Management
9

Chapter 11, 11S
SCM 302 - Supply Chain Management
10
TABLE 11.3 Supply Chain Risks and Tactics
RISK RISK REDUCTION TACTICS EXAMPLE
Supplier failure to deliver
Use multiple suppliers; effective contracts with penalties; subcontractors on retainer; pre-planning
McDonald’s planned its supply chain 6 years before its opening in Russia. Every plant—bakery, meat, chicken, fish, and lettuce—is closely monitored to ensure strong links.
Supplier quality failure
Careful supplier selection, training, certification, and monitoring
Darden Restaurants has placed extensive controls, including third-party audits, on supplier processes and logistics to ensure constant monitoring and reduction of risk.
Logistics delays or damage
Multiple/redundant transportation modesand warehouses; secure packaging; effective contracts with penalties
Walmart, with its own trucking fleet and numerous distribution centers located throughout the U.S., finds alternative origins and delivery routes bypassing problem areas.
Distribution Careful selection, monitoring, and effective contracts with penalties
Toyota trains its dealers around the world, invoking principles of the Toyota Production System to help dealers improve customer service, used-car logistics, and body and paint operations.
Information loss or distortion
Redundant databases; secure IT systems; training of supply chain partners on the proper interpretations and uses of information
Boeing utilizes a state-of-the-art international communication system that transmits engineering, scheduling, and logistics data to Boeing facilities and suppliers worldwide.
Political Political risk insurance; cross-country diversification; franchising and licensing
Hard Rock Cafe ́ reduces political risk by franchising and licensing, rather than owning, when the political and cultural barriers seem significant.
Economic Hedging to combat exchange rate risk; purchasing contracts that address price fluctuations
Honda and Nissan are moving more manufacturing out of Japan as the exchange rate for the yen makes Japanese-made autos more expensive.
Natural catastrophes Insurance; alternate sourcing; cross-country diversification
Toyota, after its experience with fires, earthquakes, and tsunamis, now attempts to have at least two suppliers, each in a different geographical region, for each component.
Theft, vandalism, and terrorism
Insurance; patent protection; security measures including RFID and GPS; diversification
Domestic Port Radiation Initiative: The U.S. government has set up radiation portal monitors that scan nearly all imported containers for radiation.

Issue #4. Supplier selection & Contracting.4 Stage Process
1. Supplier evaluation• Finding potential suppliers• Determine likelihood of their becoming good
suppliers• Supplier certification, qualification, education
2. Supplier development• Integrate the supplier into the system:• Training; Engineering help; Information transfer;
Product specifications; Schedules and delivery; Procurement
3. Negotiations: approach for setting prices1. Cost-based price model: supplier opens books2. Market-based price model: published, auction, or indexed prices3. Competitive bidding
4. Contracting • A design to share risks, benefits, create incentives,
optimize supply chain• Centralized purchasing• E-procurement
Chapter 11, 11S
SCM 302 - Supply Chain Management
11

Issue #5. Supply Chain Integration.Flows of Information, Materials, and Cash.
Supply chain integration beings with mutual agreement on goals, trust, and compatible organizational cultures
Complicating Issues1. Local optimization magnifies fluctuations (bullwhip effect).
2. Incentives to push merchandise into the supply chain
3. Large lots reduce shipping costs but increase inventory holding and do not reflect actual sales
Chapter 11, 11S
SCM 302 - Supply Chain Management
12
Challenges and Opportunities• Pull data: accurate sales data that initiate transactions to
pull product through the supply chain• Single-stage control of replenishment – retailer
responsible for monitoring and managing inventory• Vendor Managed Inventory: supplier maintains
material/inventory for the buyer, direct delivery• Collaborative planning, forecasting, and replenishment
(CPFR): members of the a supply chain share information, joint effort to reduce supply chain costs.
• Blanket order: a long-term purchase commitment for items to be delivered against short-term releases to ship.• Lot size reduction• Standardization:• Postponement withholds modification as long as possible• Electronic ordering and funds transfer• Drop shipping and packaging to bypasses the seller

Issue #6. Logistics Management
• Integration of material acquisition, movement, and storage activities
• Outsourced via third-party logistics:• Faster shipping more expensive than
slower shipping• Faster methods involve smaller
shipment sizes while slower methods involve very large shipment sizes,
• Warehousing: how to store goods
• Channel assembly: a system that postpones final assembly of a product so that it is assembled within the distribution channel
Chapter 11, 11S
SCM 302 - Supply Chain Management
13
Trucking Vast majority of manufactured goods
Chief advantage = flexibility
Railroads Large loads
Little flexibility
Airfreight Fast and flexible for light loads
Expensive
Waterways Bulky, low-value cargo
Is cost more important than speed?
Pipelines Oil, gas, and other chemical products
Multimodal Combines shipping methods

Distribution Management• Focused on the outbound flow of final products:• Total logistics costs: facility costs + inventory costs + transportation costs.
rapid response; product choice; service• Increasing # facilities improves response and customer satisfaction but increases costs
• Faster response, better product choice may lead to higher revenues• The best distribution network should maximize total profits.
Chapter 11, 11S
SCM 302 - Supply Chain Management
14

Operations Strategy as Supply Chain Strategy
Chapter 11, 11S
SCM 302 - Supply Chain Management
15
TABLE 11.2 How Corporate Strategy Impacts Supply Chain Decisions
LOW COST STRATEGY
RESPONSE STRATEGY
DIFFERENTIATION STRATEGY
Primary supplier selection criteria
• Cost • Capacity• Speed• Flexibility
• Product development skills• Willing to share information• Jointly and rapidly develop
products
Supply chain inventory
• Minimize inventory to hold down costs
• Use buffer stocks to ensure speedy supply
• Minimize inventory to avoid product obsolescence
Distribution network
• Inexpensive transportation
• Sell through discount distributors/retailers
• Fast transportation• Provide premium
customer service
• Gather and communicate market research data
• Knowledgeable sales staff
Product design characteristics
• Maximize performance
• Minimize cost
• Low setup time• Rapid production
ramp-up
• Modular design to aid product differentiation

Sustainable Supply Chain Management
• Return or reverse logistics
• Sending returned products back up the supply chain for resale, repair, reuse, remanufacture, recycling, or disposal
• Closed-loop supply chain
• Proactive design of a supply chain that tries to optimize all forward and reverse flows
• Prepares for returns prior to product introduction
Chapter 11, 11S
SCM 302 - Supply Chain Management
16

Measuring Supply Chain Performance
Typical supply chain benchmark metrics include:• Lead time, % Late Deliveries, % Rejected Material, Shortages per year.
Important financial ratios:
%Assets in Inventory =𝑇𝑜𝑡𝑎𝑙 𝐼𝑛𝑣𝑒𝑛𝑡𝑜𝑟𝑦 𝐼𝑛𝑣𝑒𝑠𝑡𝑚𝑒𝑛𝑡
𝑇𝑜𝑡𝑎𝑙 𝐴𝑠𝑠𝑒𝑡𝑠
𝐼𝑛𝑣𝑒𝑛𝑡𝑜𝑟𝑦 𝑇𝑢𝑟𝑛𝑜𝑣𝑒𝑟 =𝐶𝑜𝑠𝑡 𝑜𝑓 𝐺𝑜𝑜𝑑𝑠 𝑆𝑜𝑙𝑑
𝐴𝑣𝑔. 𝐼𝑛𝑣𝑒𝑛𝑡𝑜𝑟𝑦 𝐼𝑛𝑣𝑒𝑠𝑡𝑚𝑒𝑛𝑡
𝑊𝑒𝑒𝑘𝑠 𝑜𝑓 𝑆𝑢𝑝𝑝𝑙𝑦 =𝐼𝑛𝑣𝑒𝑛𝑡𝑜𝑟𝑦 𝐼𝑛𝑣𝑒𝑠𝑡𝑚𝑒𝑛𝑡
𝐴𝑛𝑛𝑢𝑎𝑙 𝐶𝑜𝑠𝑡 𝑜𝑓 𝐺𝑜𝑜𝑑𝑠 𝑆𝑜𝑙𝑑 ÷ 52 𝑤𝑒𝑒𝑘𝑠
Supply Chain Operations Reference (SCOR) Model: A set of processes, metrics, and best practices developed by the supply chain council.
Chapter 11, 11S
SCM 302 - Supply Chain Management
17
Plan: Demand/Supply planning and Management
Source: Identify, select, manage, and assess sources
Make: Manage production execution, testing and packaging
Deliver: Invoice, warehouse, transport and install
Return: Raw material Return: Finished goods
Assets committed to inventory
Chapter 11, 11S
SCM 302 - Supply Chain Management
18
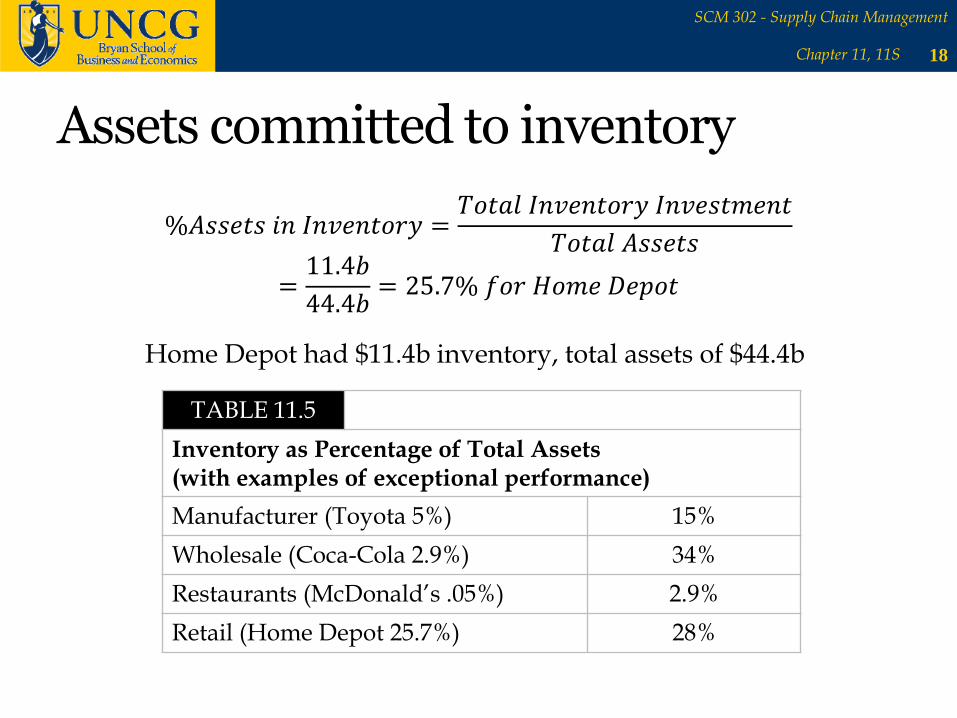
Home Depot had $11.4b inventory, total assets of $44.4b
TABLE 11.5
Inventory as Percentage of Total Assets (with examples of exceptional performance)
Manufacturer (Toyota 5%) 15%
Wholesale (Coca-Cola 2.9%) 34%
Restaurants (McDonald’s .05%) 2.9%
Retail (Home Depot 25.7%) 28%
%𝐴𝑠𝑠𝑒𝑡𝑠 𝑖𝑛 𝐼𝑛𝑣𝑒𝑛𝑡𝑜𝑟𝑦 =𝑇𝑜𝑡𝑎𝑙 𝐼𝑛𝑣𝑒𝑛𝑡𝑜𝑟𝑦 𝐼𝑛𝑣𝑒𝑠𝑡𝑚𝑒𝑛𝑡
𝑇𝑜𝑡𝑎𝑙 𝐴𝑠𝑠𝑒𝑡𝑠
=11.4𝑏
44.4𝑏= 25.7% 𝑓𝑜𝑟 𝐻𝑜𝑚𝑒 𝐷𝑒𝑝𝑜𝑡

Inventory Turnover & Weeks of Supply
Chapter 11, 11S
SCM 302 - Supply Chain Management
19
TABLE 11.6 Examples of Annual Inventory Turnover
FOOD, BEVERAGE, RETAIL
Anheuser Busch 15
Coca-Cola 15
Home Depot 5
McDonald’s 112
MANUFACTURING
Dell Computer 90
Johnson controls 22
Toyota (overall) 13
Nissan (assembly) 150
Net revenue $32.5
Cost of goods sold $14.2
Inventory:
Raw material inventory $.74
Work-in-process inventory $.11
Finished goods inventory $.84
Total inventory investment $1.69
𝑰𝒏𝒗𝒆𝒏𝒕𝒐𝒓𝒚 𝑻𝒖𝒓𝒏𝒐𝒗𝒆𝒓 =𝑪𝒐𝒔𝒕 𝒐𝒇 𝑮𝒐𝒐𝒅𝒔 𝑺𝒐𝒍𝒅
𝑰𝒏𝒗𝒆𝒏𝒕𝒐𝒓𝒚 𝑰𝒏𝒗𝒆𝒔𝒕𝒎𝒆𝒏𝒕=14.2
1.69= 8.4 𝑓𝑜𝑟 𝑃𝑒𝑝𝑠𝑖
𝑾𝒆𝒆𝒌𝒔 𝒐𝒇 𝑺𝒖𝒑𝒑𝒍𝒚 =𝑰𝒏𝒗𝒆𝒏𝒕𝒐𝒓𝒚 𝑰𝒏𝒗𝒆𝒔𝒕𝒎𝒆𝒏𝒕
(𝑨𝒏𝒏𝒖𝒂𝒍 𝑪𝒐𝒔𝒕 𝒐𝒇 𝑮𝒐𝒐𝒅𝒔 𝑺𝒐𝒍𝒅)/𝟓𝟐=
1.69
14.2/52= 6.19 𝑤𝑒𝑒𝑘𝑠 𝑓𝑜𝑟 𝑃𝑒𝑝𝑠𝑖

The SCOR Model
Chapter 11, 11S
SCM 302 - Supply Chain Management
20
SCOR Model Metrics to Help Firms Benchmark Performance Against the Industry
PERFORMANCE ATTRIBUTE SAMPLE METRIC CALCULATION
Supply chain reliability
Perfect order fulfillment
(Total perfect orders) / (Total number of orders)
Supply chain responsiveness
Average order fulfillment cycle time
(Sum of actual cycle times for all orders delivered) / (Total number of orders delivered)
Supply chain agility
Upside supply chain flexibility
Time required to achieve an unplanned 20% increase in delivered quantities
Supply chain costs Supply chain management costs
Cost to plan + Cost to source + Cost to deliver + Cost to return
Supply chain asset management
Cash-to-cash cycle time Inventory days of supply + Days of receivables outstanding – Days of payables outstanding
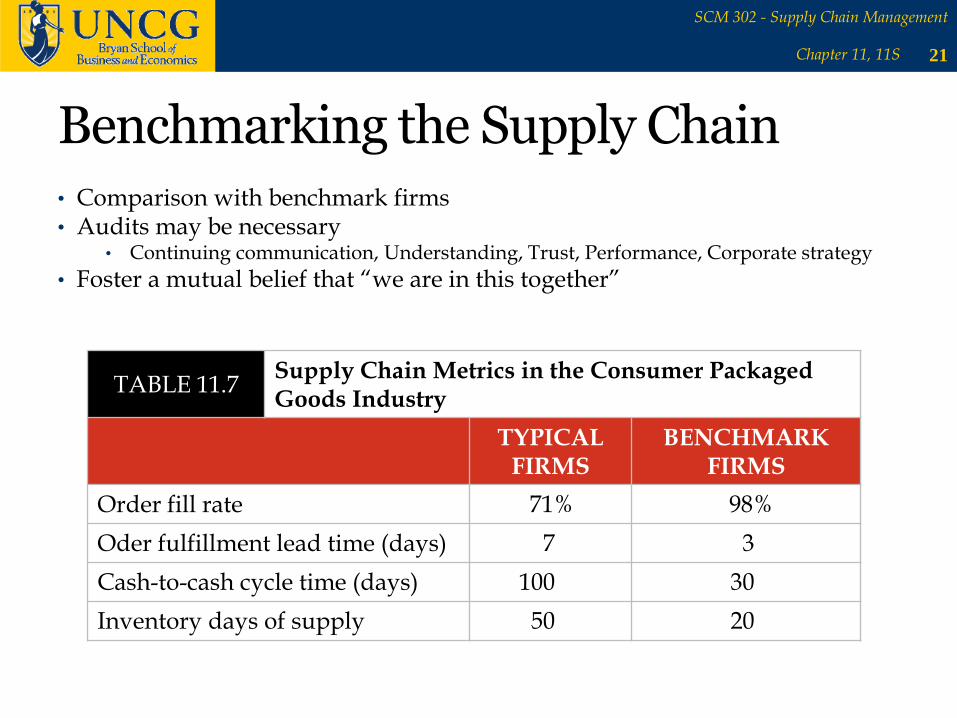
Benchmarking the Supply Chain• Comparison with benchmark firms• Audits may be necessary
• Continuing communication, Understanding, Trust, Performance, Corporate strategy
• Foster a mutual belief that “we are in this together”
Chapter 11, 11S
SCM 302 - Supply Chain Management
21
TABLE 11.7Supply Chain Metrics in the Consumer Packaged Goods Industry
TYPICALFIRMS
BENCHMARK FIRMS
Order fill rate 71% 98%
Oder fulfillment lead time (days) 7 3
Cash-to-cash cycle time (days) 100 30
Inventory days of supply 50 20

The Bullwhip Effect
Chapter 11, 11S
SCM 302 - Supply Chain Management
26
60 –
50 –
40 –
30 –
20 –
10 –
0 –
1 2 3 4 5 6 7 8 9 10 11
| | | | | | | | | | | |
Day
Ord
er
Qu
an
tity
Suppliers believe sales are huge and respond accordingly
A short-term increase in consumer demand
Wholesalers order even more to be sure retailers can be adequately supplied
Retailers respond by ordering more
Suppliers
Wholesalers
Retailers
Consumers
Figure S11.2

The Bullwhip Effect• Variability in orders increases as
orders are relayed up the supply chain• Leads to unstable production schedules,
longer lead times, product obsolescence
• Damage can be minimized with supplier coordination and planning
Chapter 11, 11S
SCM 302 - Supply Chain Management
27
CAUSE REMEDY
Demand forecast errors (cumulative uncertainty in the supply chain)
Share demand information throughout the supply chain
Order batching (large, infrequent orders leading suppliers to order even larger amounts)
Channel coordination: Determine lot sizes as though the full supply chain was one company
Price fluctuations (buying in advance of demand to take advantage of low prices, discounts, or sales)
Price stabilization (everyday low prices)
Shortage gaming (hoarding supplies for fear of a supply shortage)
Allocate orders based on past demand

RFID Helps Control Bullwhip
Chapter 11, 11S
SCM 302 - Supply Chain Management
28

The Bullwhip Effect Measure
Chapter 11, 11S
SCM 302 - Supply Chain Management
29
Bullwhip =Variance of orders
Variance of demand=
s 2
orders
sdemand
2
If measure is:
> 1 : Variance amplification is present
= 1 : No amplification is present
< 1 : Smoothing or dampening is occurring

Calculating the Bullwhip Effect
• Transform sheet steel to tabletops
• Each firm in the supply chain has one supplier and one customer
Chapter 11, 11S
SCM 302 - Supply Chain Management
30
FIRMVARIANCE
OF DEMANDVARIANCE OF ORDERS
BULLWHIP MEASURE
Furniture Mart, Inc. 100 110 110/100 = 1.10
Furniture Distributors, Inc. 110 180 180/110 = 1.64
Furniture Makers of America 180 300 300/180 = 1.67
Chieh Lee Metals, Inc. 300 750 750/300 = 2.50
Metal Suppliers Ltd. 750 2000 2000/750 = 2.67

Manufacturers Urge Fuel Tax Review
• Crumbling and congested U.S. roadways are driving up costs for U.S. manufacturers as late deliveries and unreliable transportation undermine hard-fought gains in production efficiency, according to U.S. manufacturing executives.
1. What different product quality variables are affected by transportation suppliers?
2. How can unreliable transportation hurt a focal firm in terms of profit, scheduling, fees, productivity, quality?
3. What incentive does the government have for boosting infrastructure expenditures?
Chapter 11, 11S
SCM 302 - Supply Chain Management
31

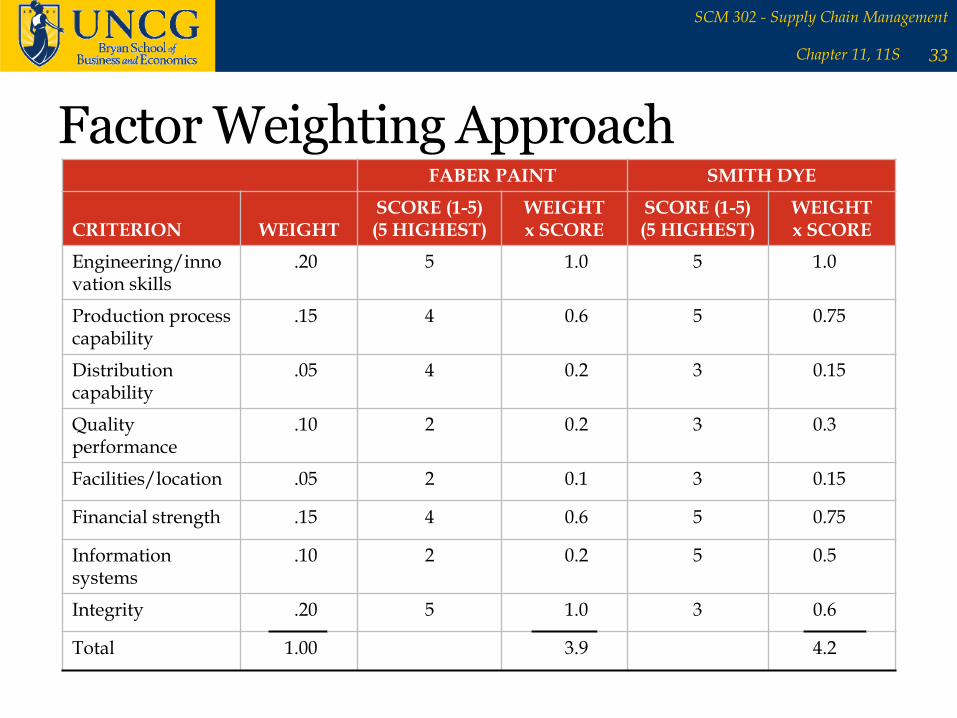
Supplier Selection Analysis
• Many factors play a role
• Choosing lowest bid is becoming rare
• Factor weighting techniques consider multiple criteria
• Each factor is assigned a weight and a score
• Choose the supplier with the best weighted score
Chapter 11, 11S
SCM 302 - Supply Chain Management
32
Factor Weighting Approach
Chapter 11, 11S
SCM 302 - Supply Chain Management
33
FABER PAINT SMITH DYE
CRITERION WEIGHTSCORE (1-5)(5 HIGHEST)
WEIGHT x SCORE
SCORE (1-5)(5 HIGHEST)
WEIGHT x SCORE
Engineering/innovation skills
.20 5 1.0 5 1.0
Production process capability
.15 4 0.6 5 0.75
Distribution capability
.05 4 0.2 3 0.15
Quality performance
.10 2 0.2 3 0.3
Facilities/location .05 2 0.1 3 0.15
Financial strength .15 4 0.6 5 0.75
Information systems
.10 2 0.2 5 0.5
Integrity .20 5 1.0 3 0.6
Total 1.00 3.9 4.2