a straightness measuring interferometer characterised with
15
59 th ILMENAU SCIENTIFIC COLLOQUIUM Technische Universität Ilmenau, 11 – 15 September 2017 URN: urn:nbn:de:gbv:ilm1-2017iwk-002:2 ©2017 - TU Ilmenau A STRAIGHTNESS MEASURING INTERFEROMETER CHARACTERISED WITH DIFFERENT WEDGE PRISMS Christoph Weichert 1 *, Paul Köchert 2 , Eugen Schötka 1 , Jens Flügge 1 , Eberhard Manske 2 1: Physikalisch-Technische Bundesanstalt, Bundesallee 100, 38116 Braunschweig, Germany 2: Ilmenau University of Technology, Ehrenbergstraße 29, 98684 Ilmenau, Germany ABSTRACT Independently of the component used to introduce a divergence angle between the two probing beams of straightness interferometers, their uncertainty is limited by three main errors linked to each other: their resolution, the influence of refractive index gradients and the topography of the straightness reflector. The larger the divergence angle the higher is the resolving capability, but also the potential influence of the other two error sources. A fully fibre-coupled heterodyne interferometer was successively equipped with three different wedge prisms to investigate the optimal divergence angle under laboratory conditions. For that, the straightness interferometer was qualified with the Nanometer Comparator, which is a one-dimensional line scale interferometer with an additional straightness measurement capability. This feature is based on the traceable multi-sensor method, where an angle measurement embodies the “straightedge”. Therefore, the qualification of the straightness interferometer was also a comparison of two different straightness measurement methods. The influence of the refractive index gradients of air did not increase with interspaces between the probing beams larger than 11.3 mm. Therefore, over a movement range of 220 mm, the lowest uncertainty was realized with the largest divergence angle. The dominant uncertainty contribution arose from the uncorrected mirror topography determined with sub-nanometre uncertainty with the Nanometer Comparator. Index Terms - heterodyne interferometer, straightness measurement, error separation 1. INTRODUCTION Straightness measurements are an essential part of testing or controlling accurate positioning of machine tools [1]. Accordingly, many standardized methods to qualify the horizontal straightness motion error do exist [2]. Beside methods based on angle measurements, straightedges or self-calibration, straightness interferometers provide a more direct answer to the problem [3]. Most of the straightness interferometers are based on a splitting element in combination with a straightness reflector realizing two beams with an angle relatively to each other and to the moving direction of the slide. Independently, whether a grating, wedge prisms or a Wollaston prism is used to split the beams, straightness interferometers are limited by three main error sources: their resolving capability, gradients of the refractive index and the mirror topography of the straightness reflector. The resolution of straightness interferometers results from the detection noise multiplied by a factor, which is defined by the divergence angle between the two probing beams. Increasing the divergence angle will minimize this factor and improve the resolving capability, but this may also increase the influence of the two other main error sources. Additionally, the maximum movement range is limited by the size of the straightness reflector and the divergence angle. General rules for the optimal configuration do not exist, since the achievable uncertainty depends on the environmental conditions, the
-
Upload
khangminh22 -
Category
Documents
-
view
0 -
download
0
Transcript of a straightness measuring interferometer characterised with
59th ILMENAU SCIENTIFIC COLLOQUIUM Technische Universität Ilmenau, 11 – 15 September 2017
URN: urn:nbn:de:gbv:ilm1-2017iwk-002:2
©2017 - TU Ilmenau
A STRAIGHTNESS MEASURING INTERFEROMETER CHARACTERISED WITH DIFFERENT WEDGE PRISMS
Christoph Weichert1*, Paul Köchert2, Eugen Schötka1, Jens Flügge1, Eberhard Manske2
1: Physikalisch-Technische Bundesanstalt, Bundesallee 100, 38116 Braunschweig, Germany 2: Ilmenau University of Technology, Ehrenbergstraße 29, 98684 Ilmenau, Germany
ABSTRACT
Independently of the component used to introduce a divergence angle between the two probing beams of straightness interferometers, their uncertainty is limited by three main errors linked to each other: their resolution, the influence of refractive index gradients and the topography of the straightness reflector. The larger the divergence angle the higher is the resolving capability, but also the potential influence of the other two error sources. A fully fibre-coupled heterodyne interferometer was successively equipped with three different wedge prisms to investigate the optimal divergence angle under laboratory conditions. For that, the straightness interferometer was qualified with the Nanometer Comparator, which is a one-dimensional line scale interferometer with an additional straightness measurement capability. This feature is based on the traceable multi-sensor method, where an angle measurement embodies the “straightedge”. Therefore, the qualification of the straightness interferometer was also a comparison of two different straightness measurement methods. The influence of the refractive index gradients of air did not increase with interspaces between the probing beams larger than 11.3 mm. Therefore, over a movement range of 220 mm, the lowest uncertainty was realized with the largest divergence angle. The dominant uncertainty contribution arose from the uncorrected mirror topography determined with sub-nanometre uncertainty with the Nanometer Comparator.
Index Terms - heterodyne interferometer, straightness measurement, error separation
1. INTRODUCTION
Straightness measurements are an essential part of testing or controlling accurate positioning of machine tools [1]. Accordingly, many standardized methods to qualify the horizontal straightness motion error do exist [2]. Beside methods based on angle measurements, straightedges or self-calibration, straightness interferometers provide a more direct answer to the problem [3]. Most of the straightness interferometers are based on a splitting element in combination with a straightness reflector realizing two beams with an angle relatively to each other and to the moving direction of the slide. Independently, whether a grating, wedge prisms or a Wollaston prism is used to split the beams, straightness interferometers are limited by three main error sources: their resolving capability, gradients of the refractive index and the mirror topography of the straightness reflector. The resolution of straightness interferometers results from the detection noise multiplied by a factor, which is defined by the divergence angle between the two probing beams. Increasing the divergence angle will minimize this factor and improve the resolving capability, but this may also increase the influence of the two other main error sources. Additionally, the maximum movement range is limited by the size of the straightness reflector and the divergence angle. General rules for the optimal configuration do not exist, since the achievable uncertainty depends on the environmental conditions, the

©2017 - TU Ilmenau 2
scheduled movement range, the mirror topography and the quality of potential error corrections by using either a reversal method [4] or a characterisation of the mirror topography. For this investigation, we equipped a self-developed, fully fibre-coupled, heterodyne interferometer successively with three different wedge prisms resulting in three different divergence angles and, accordingly, in three different resolving capabilities. In any case, a reference with a smaller uncertainty or at least a smaller repeatability is needed to analyse the influence of the different error sources. Therefore, the straightness interferometer was characterised with the Nanometer Comparator of the Physikalisch-Technische Bundesanstalt.
The Nanometer Comparator (NMC) is the national standard of Germany for the calibration of length graduations. It is used for the calibration of line scales [5], encoder systems [6] and photomasks [7] to disseminate the unit of length to industry. Lately, a straightness measurement capability with an uncertainty in the single-digit nanometre range has been added to this one-dimensional length comparator [8].
The characterisation of the straightness interferometer with the NMC was also a comparison of two different straightness measurement methods with different sensitivities to error sources like angle variations of the moving slide. While the system under test measured the horizontal straightness motion error directly, an error separation method based on an angle measurement and a multi-sensor element was used at the NMC to determine this motion error.
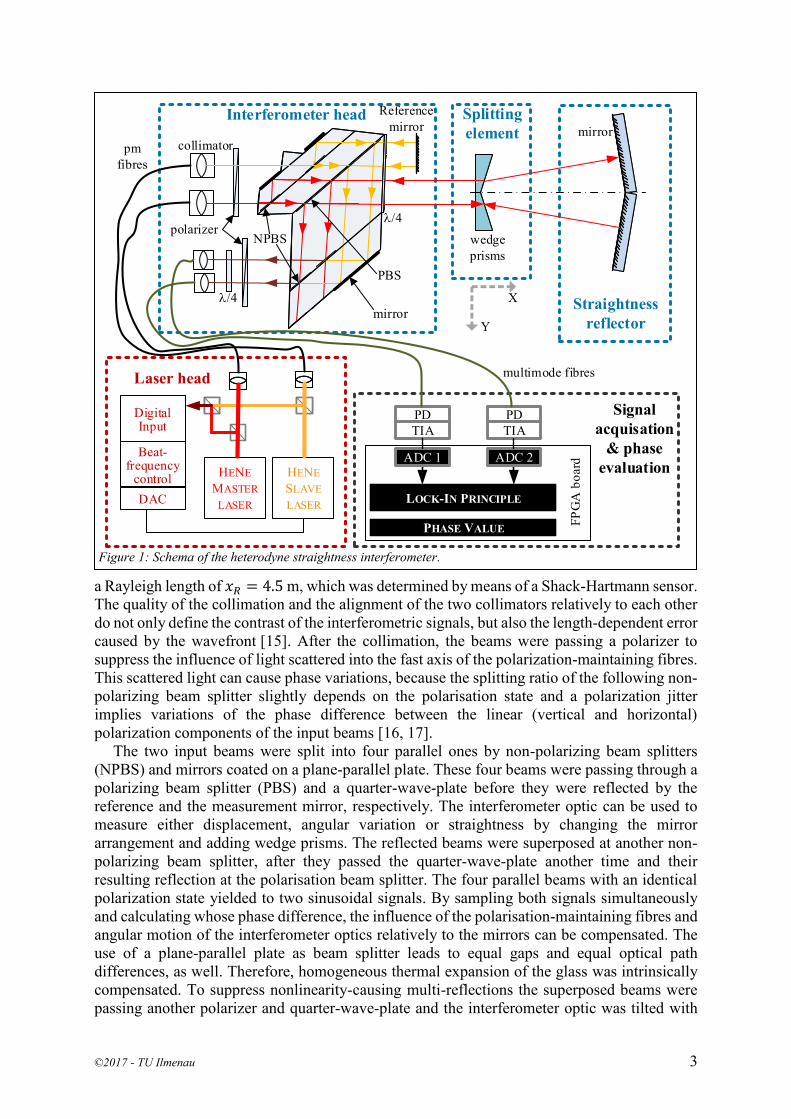
2. THE STRAIGHTNESS INTERFEROMETER The straightness interferometer under test was based on a fully fibre-coupled, heterodyne displacement interferometer. One limitation of the uncertainty of displacement interferometer systems is their periodic nonlinearity, which appears as an error source of straightness interferometers as well. At heterodyne interferometers, the presence of periodic nonlinearities can be minimized with spatially separated input beams [9]. This basic approach entails a more complex design of the interferometer optics, especially in case of fibre-fed interferometers. Here, the reference phase must be picked behind the fibres to be able to compensate for the phase variations introduced by them. But the reference path can also be used to compensate for thermal influences on the interferometer optics. This compensation was realized in the interferometer setup shown in figure 1, which was conceptually designed based on a previous proposal [10]. In opposite to the previous interferometer setup, it is scaled down in geometrical size to enable its integration at the NMC, fully fibre coupled to separate heat sources and equipped with wedge prisms to measure the horizontal straightness motion error.
Two offset-locked HeNe lasers [11] operating at a wavelength of 633 nm were used as light source. The master laser was two-mode-stabilized [12]. The frequency of the master laser was determined to 𝑓Laser = 473 612 572.565 MHz within a comparison with an HeNe laser stabilized on the hyperfine structure line R(127) 11-5 d of the iodine molecule [13]. After a warm-up time of several hours, the relative frequency variation was in the negligible order of 5 ∙ 10−11 over hours. But turning the laser system on and off resulted in variations of the centre frequency of several MHz, leading to a standard deviation of the centre frequency of 𝜎(𝑓Laser) = 1.54 MHz (3 ∙ 10−9). The slave laser was offset-locked by means of a digital beat frequency control resulting in an adjustable beat frequency. The beat frequency was chosen to 2.5 MHz and exhibited an Allan deviation of 8.6 Hz over an integration time of 1 s [14].
The light of each laser was coupled into a separate angle polished, polarisation maintaining (pm) fibre resulting in spatially separated input beams at the interferometer optics. The beat frequency was chosen that only negligible small influences of the mechanical resonances of the optical fibres remained in the signal. Therefore, a stabilization of the power and phase at the fibre outputs was not required. The beams were collimated with aspheric lenses with a focal length of approximately 11 mm resulting in a minimal beam diameter of 2 𝜔0 = 1.64 mm and
©2017 - TU Ilmenau 3
a Rayleigh length of 𝑥𝑅 = 4.5 m, which was determined by means of a Shack-Hartmann sensor. The quality of the collimation and the alignment of the two collimators relatively to each other do not only define the contrast of the interferometric signals, but also the length-dependent error caused by the wavefront [15]. After the collimation, the beams were passing a polarizer to suppress the influence of light scattered into the fast axis of the polarization-maintaining fibres. This scattered light can cause phase variations, because the splitting ratio of the following non-polarizing beam splitter slightly depends on the polarisation state and a polarization jitter implies variations of the phase difference between the linear (vertical and horizontal) polarization components of the input beams [16, 17].
The two input beams were split into four parallel ones by non-polarizing beam splitters (NPBS) and mirrors coated on a plane-parallel plate. These four beams were passing through a polarizing beam splitter (PBS) and a quarter-wave-plate before they were reflected by the reference and the measurement mirror, respectively. The interferometer optic can be used to measure either displacement, angular variation or straightness by changing the mirror arrangement and adding wedge prisms. The reflected beams were superposed at another non-polarizing beam splitter, after they passed the quarter-wave-plate another time and their resulting reflection at the polarisation beam splitter. The four parallel beams with an identical polarization state yielded to two sinusoidal signals. By sampling both signals simultaneously and calculating whose phase difference, the influence of the polarisation-maintaining fibres and angular motion of the interferometer optics relatively to the mirrors can be compensated. The use of a plane-parallel plate as beam splitter leads to equal gaps and equal optical path differences, as well. Therefore, homogeneous thermal expansion of the glass was intrinsically compensated. To suppress nonlinearity-causing multi-reflections the superposed beams were passing another polarizer and quarter-wave-plate and the interferometer optic was tilted with
Figure 1: Schema of the heterodyne straightness interferometer.
LOCK-IN PRINCIPLE
PHASE VALUE
ADC 2ADC 1
PD PDTIA TIA
PBS
NPBS
l/4
l/4
Reference mirror
polarizer
collimator
mirror
HENE SLAVE LASER
HENE MASTER
LASERDAC
Digital Input
Interferometer head
Beat-frequency
control
Laser head
FPG
A b
oard
Signal acquisation
& phase evaluation
X
Y
Splitting element
wedge prisms
Straightness reflector
mirrorpm
fibres
multimode fibres
©2017 - TU Ilmenau 4
respect to the beams. The coupling of the superposed beams into multimode fibres separated the heat of the photo receivers and worked as spatial filter for multi-reflected beams with different angles due to the limited core diameter of the fibres.
The interfering beams are usually not superposed perfectly, so that they exhibit an angle between their directions of propagation and an offset. This misalignment has an additional impact on the length-proportional error [15] and adds noise and drift in case the superposed beams are coupled into multi-mode fibres. Due to their different angle and offset the two beams are coupled with different mode power distributions, which leads to different transmission characteristics despite the perpetual mixing process. This results in a partly separation of the superposed beams, different delays and consequently in noise and drift of the phase difference at the interferometer. The effect scales with the number of guided modes of the fibre [18], therefore gradient-index fibres were used at the presented setup. The usage of single-mode fibres would have avoided this effect, but also has the drawback of a higher sensitivity to angle variations of the moving mirror.
The interference signals were converted to electrical signals by photo receivers consisting of photo diodes (PD) and transimpedance amplifiers (TIA). The resulting voltage signals were acquired using a self-developed phase meter. It was based on a board with 100 MHz, 16 bit analogue-to-digital converters (ADC), on-board memory, and field-programmable-gate-array (FPGA) units for high speed as well as low latency signal processing. A lock-in based phase evaluation was implemented in the FPGA units [19] with a bandwidth of 720 kHz. Therefore, the phase meter was capable to detect motion speeds up to 31 mm s⁄ . During the comparison with the NMC eight values were averaged, to reduce the data acquisition rate to 48.8 kHz.
Prior to the straightness measurements, the performance of the heterodyne interferometer head was verified by a comparison with the vacuum X-interferometer of the Nanometer Comparator and by measurements using a common mirror for the reference and measurement beams. In this investigation, a resolution of 4.85 pm was obtained at acquisition rate of 10 kHz, while averaging 391 phase values [20]. The periodic nonlinearities of the heterodyne interferometer head with spatially separated input beams were below 20 pm.
During the straightness measurements, the beams of the slave laser were reflected by a plane mirror attached to the housing of the interferometer optics and two wedge prisms were used to introduce a divergence angle between the beams of the master laser. The refracted beams were reflected by the straightness reflector. The straightness reflector consisted of two plane mirrors arranged at an angle to each other. Their bisection axis represents the “straightedge”. The horizontal straightness motion error of a slide can be measured, independently whether the splitting element or the straightness reflector is moved. In both cases the sensitivity to movements in Y-direction depends on the divergence angle (𝛼) and can be calculated by the formula: 2 ∙ sin(𝛼
2⁄ ). But, there are differences in the sensitivity to yaw angle variations (rotation about the Z-axis), since the nodal point of the interferometer system is located inside or close to the slitting element [3, 21]. Successively, three different sets of wedge prisms were used as splitting element to implement divergence angles of 4°, 8° and 20° during the comparison measurements. 3. STRAIGHTNESS MEASUREMENT WITH THE NANOMETER COMPARATOR The Nanometer Comparator is a one-dimensional length comparator with an additional straightness measurement capability to calibrate position and straightness deviations with uncertainties in the single-digit nanometre range. The system under test was mounted on a slide with a movement range of up to 600 mm in X-direction, as illustrated in figure 2. The horizontal

©2017 - TU Ilmenau 5
straightness motion error of the slide was evaluated using the traceable multi-sensor method (TMS) [22]. This error separation method requires at least two coupled distance sensors measuring perpendicularly to the general movement direction of the slide and an angle measurement, which embodies the “straightedge”. Under the permission of a small angle approximation (linearization of trigonometric functions), the measurement values of these sensors are used to solve a linear equation system and to reconstruct the horizontal straightness motion error of the slide. Three non-equidistantly arranged distance sensors were used at the NMC to increase the lateral resolution of the reconstruction [23]. Therefore, the NMC was equipped with a sample carriage providing a mirror parallel to its long-range measurement axis with a length of over 600 mm [24] and three heterodyne interferometers probing the position of this mirror [8]. These three Y-interferometers were working in air while the homodyne yaw angle interferometer was working under vacuum conditions [25]. The Y-interferometers had a dead-path below 1 mm, minimal periodic nonlinearities and a measurement distance below 10 µm. By this means, a straightness encoder system was measured with a repeatability below 0.1 nm over length of 322 mm [26]. The uncertainty of the straightness measurement was limited by the linear length-dependent error of the yaw angle interferometer with an uncertainty of its slope of 421 nrad/m [27]. This error was not reproducible and resulted in parabolic deviations of the reconstructed nonlinear Y-movement of the slide. The size scales with the measurement length and caused a standard uncertainty of 4.2 nm for a measurement length of 322 mm.
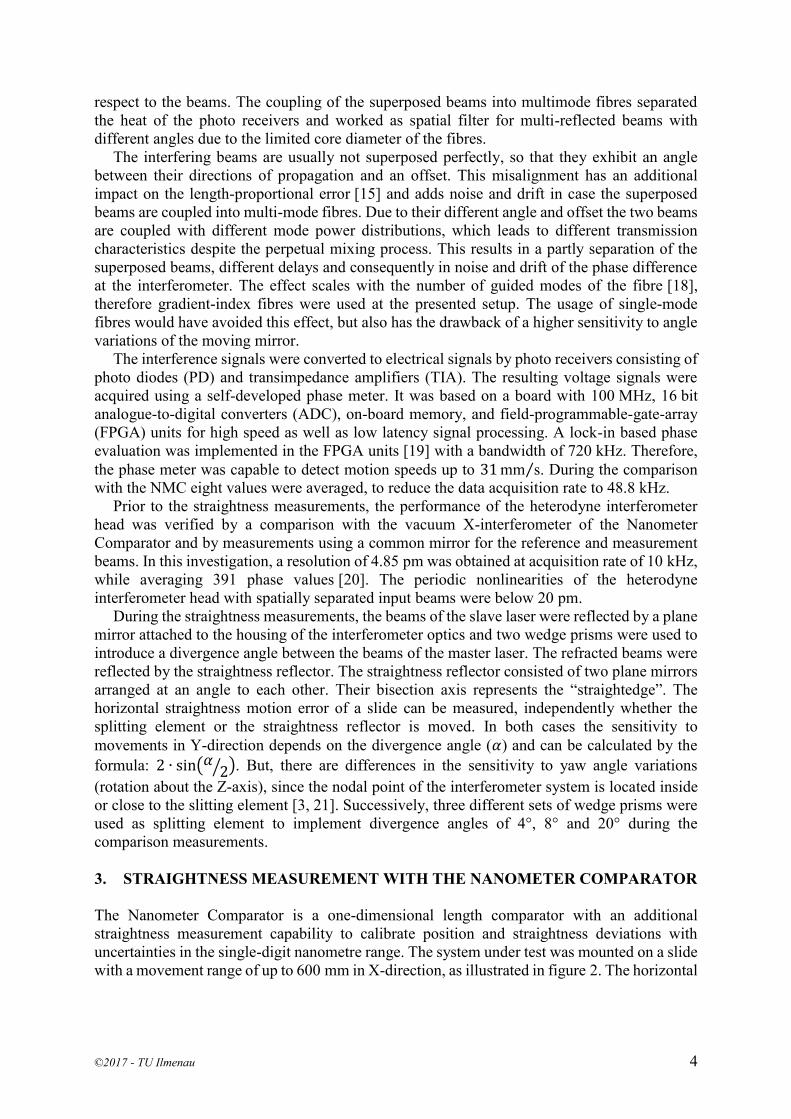
In this investigation, the linear position-dependent error of the yaw interferometer was reduced below 50 nrad/m. In contrast to former results, the homodyne interferometer signals had not been corrected with a global set of ellipse parameters, but with ellipse parameters proportional to the position of the slide. For the verification of this approach, the straightness interferometer, shown in figure 1, was used as an angle interferometer by removing the splitting element and adapting the angles of the plane mirrors of the straightness reflector. In this configuration, six measurements were performed, while the slide was moved over 240 mm. Figure 3 shows the differences of the yaw angle measured by the vacuum interferometer and the straightness interferometer. Since the straightness interferometer was working in air and the
Figure 2: Schematic drawing of the Nanometer Comparator: 1: vacuum chamber for the X-, yaw- and pitch-interferometers, 2: X-interferometer beamsplitter [24], 3: vacuum bellow connecting the moving slide and the vacuum chamber guiding the measurement beams, 4: pipes for the reference beams of the interferometers, 5: bridge with all reference mirrors, 6: sample carriage with long-range Y-mirror and moving mirrors of the vacuum interferometers [23], 7: moving slide, 8+9: voice coil and linear motor for the positioning of the slide, 10: granite base (size: 3,15x0,8x0,7 m³), 11: active vibration isolation, 12: piezo elements connecting the air bearings and the slide 13: straightness reflector mounted on the bridge, 14: straightness interferometer (interferometer head and splitting element) mounted on the sample carriage.
11 22 33 44 55 1313 1414 66 77
99
10101111 1111
881212
©2017 - TU Ilmenau 6
two probing beams had an offset of 11.3 mm, refractive index gradients caused angle variations, which increased with the distance between the reference and the measurement mirror (labelled “position” in figure 3). The calculated best-fit line of the difference values averaged over six measurements identifies the length-proportional error of the vacuum yaw interferometer. The slope was reduced by a factor of 15 by using linear length-proportional ellipse parameters instead of global ones to correct the homodyne interferometer. Since the angle measurement represents the “straightedge” at the traceable multi-sensor method, the reduction of the uncertainty of the yaw interferometer enabled straightness measurements with sub-nanometre uncertainty with the Nanometer Comparator.
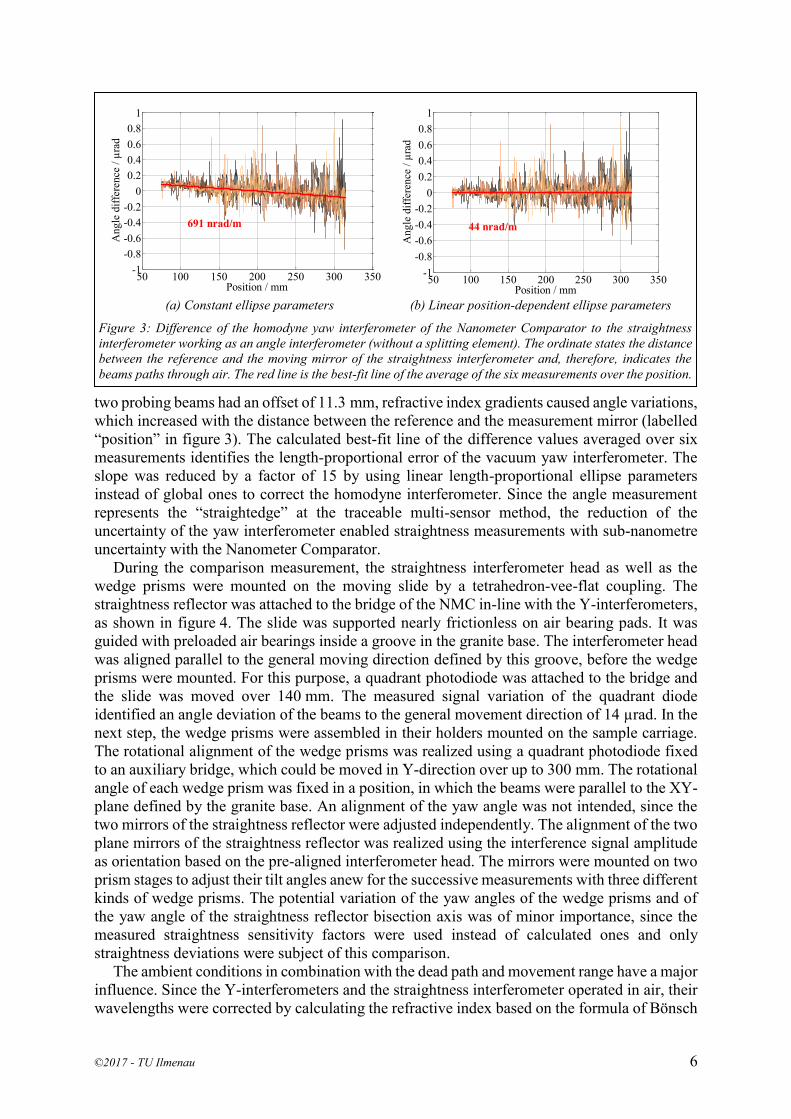
During the comparison measurement, the straightness interferometer head as well as the wedge prisms were mounted on the moving slide by a tetrahedron-vee-flat coupling. The straightness reflector was attached to the bridge of the NMC in-line with the Y-interferometers, as shown in figure 4. The slide was supported nearly frictionless on air bearing pads. It was guided with preloaded air bearings inside a groove in the granite base. The interferometer head was aligned parallel to the general moving direction defined by this groove, before the wedge prisms were mounted. For this purpose, a quadrant photodiode was attached to the bridge and the slide was moved over 140 mm. The measured signal variation of the quadrant diode identified an angle deviation of the beams to the general movement direction of 14 µrad. In the next step, the wedge prisms were assembled in their holders mounted on the sample carriage. The rotational alignment of the wedge prisms was realized using a quadrant photodiode fixed to an auxiliary bridge, which could be moved in Y-direction over up to 300 mm. The rotational angle of each wedge prism was fixed in a position, in which the beams were parallel to the XY- plane defined by the granite base. An alignment of the yaw angle was not intended, since the two mirrors of the straightness reflector were adjusted independently. The alignment of the two plane mirrors of the straightness reflector was realized using the interference signal amplitude as orientation based on the pre-aligned interferometer head. The mirrors were mounted on two prism stages to adjust their tilt angles anew for the successive measurements with three different kinds of wedge prisms. The potential variation of the yaw angles of the wedge prisms and of the yaw angle of the straightness reflector bisection axis was of minor importance, since the measured straightness sensitivity factors were used instead of calculated ones and only straightness deviations were subject of this comparison.
The ambient conditions in combination with the dead path and movement range have a major influence. Since the Y-interferometers and the straightness interferometer operated in air, their wavelengths were corrected by calculating the refractive index based on the formula of Bönsch
(a) Constant ellipse parameters
(b) Linear position-dependent ellipse parameters
Figure 3: Difference of the homodyne yaw interferometer of the Nanometer Comparator to the straightness interferometer working as an angle interferometer (without a splitting element). The ordinate states the distance between the reference and the moving mirror of the straightness interferometer and, therefore, indicates the beams paths through air. The red line is the best-fit line of the average of the six measurements over the position.
50 100 150 200 250 300 350-1
-0.8
-0.6
-0.4
-0.2
0
0.2
0.4
0.6
0.8
1
Position / mm
An
gle
dif
fere
nce
/ µ
rad
691 nrad/m
50 100 150 200 250 300 350-1
-0.8
-0.6
-0.4
-0.2
0
0.2
0.4
0.6
0.8
1
Position / mm
An
gle
dif
fere
nce
/ µ
rad
44 nrad/m
©2017 - TU Ilmenau 7
and Potulski [28] and measurements of the air temperature, pressure and humidity. The Nanometer Comparator was situated inside a separately conditioned measurement cabin with a minimal amount of disturbing heat sources [29]. The air temperature was measured using thermocouples, one joint situated in air and the other on inside a copper block together with a calibrated PT25 sensor. The measured temperature varied between 20.018°C and 20.028°C over the time span of six straightness measurements. But, due to the acquisition rate of 193 s and the thermal capacity of the thermocouple, the real temperature variation was expected to be higher. Additionally, the straightness interferometer was surrounded by four sides and the pervious floor of the sample carriage, as illustrated in figure 4. Therefore, the air flow was expected to be turbulent and dependent on the position of the slide.
Several different measurements were performed at the Nanometer Comparator. The sensitivities of the straightness interferometer were determined by moving the slide in Y-direction. The four air bearings, which complementary countered the slide inside the groove, were each jointed with the slide with a piezo element. These piezo elements were used to vary the Y-position of the slide in the range of ±3 µm, while the yaw angle was controlled to remain zero. In a second measurement, these piezo elements were used to vary the yaw angle of the slide in the range of ±3 µrad at different slide positions. This measurement was used to evaluate the position-dependent ellipse parameters for the correction of the homodyne yaw interferometer and to evaluate the sensitivity of the straightness interferometer to yaw angle variations. In a last step, the slide was moved six times over 220 mm with a velocity of 2 mm/s. During these measurements, the phase values of the three vacuum interferometers (the X-, yaw and pitch interferometer), the three Y-interferometers and the straightness interferometer were evaluated with two synchronised phase meter boards [30]. The maximum delay between the different measurement systems introduced by the phase meter was 10 ns. For the qualification of other measurement systems, the phase meter boards can be triggered externally. In case of an external trigger, the phase values of the heterodyne interferometer systems are calculated using a linear regression based on the last four phase values. Otherwise the acquisition time of 20.5 µs would introduce an unknown delay time relatively to the system under test.
Figure 4: Arrangement of the straightness interferometer at the Nanometer Comparator: 5: bridge with reference mirrors attached to it, 6: sample carriage with long-range Y-mirror, 7: moving slide, 13: straightness reflector mounted on the bridge, 14: interferometer head mounted on the sample carriage, 15: Wedge prisms mounted on the sample carriage, 16: three heterodyne Y-interferometers probing the long-range mirror of the sample carriage.
©2017 - TU Ilmenau 8
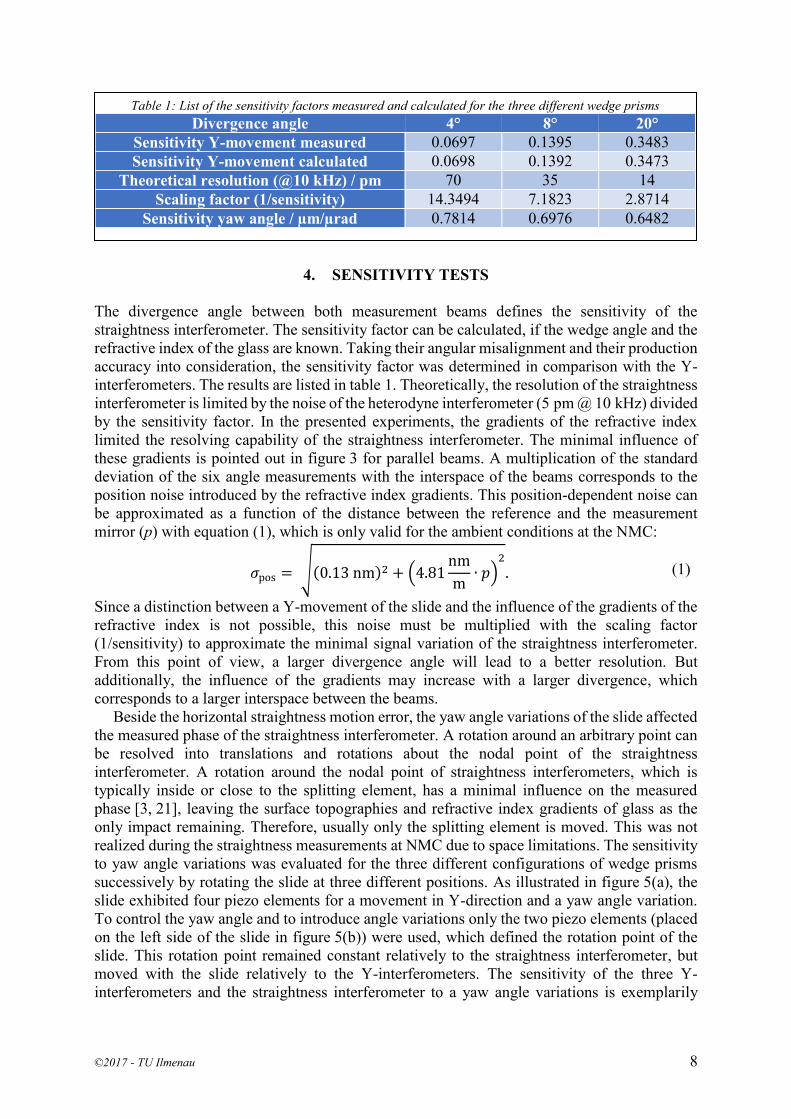
4. SENSITIVITY TESTS
The divergence angle between both measurement beams defines the sensitivity of the straightness interferometer. The sensitivity factor can be calculated, if the wedge angle and the refractive index of the glass are known. Taking their angular misalignment and their production accuracy into consideration, the sensitivity factor was determined in comparison with the Y-interferometers. The results are listed in table 1. Theoretically, the resolution of the straightness interferometer is limited by the noise of the heterodyne interferometer (5 pm @ 10 kHz) divided by the sensitivity factor. In the presented experiments, the gradients of the refractive index limited the resolving capability of the straightness interferometer. The minimal influence of these gradients is pointed out in figure 3 for parallel beams. A multiplication of the standard deviation of the six angle measurements with the interspace of the beams corresponds to the position noise introduced by the refractive index gradients. This position-dependent noise can be approximated as a function of the distance between the reference and the measurement mirror (p) with equation (1), which is only valid for the ambient conditions at the NMC:
𝜎pos = √(0.13 nm)2 + (4.81nm
m∙ 𝑝)
2
. (1)
Since a distinction between a Y-movement of the slide and the influence of the gradients of the refractive index is not possible, this noise must be multiplied with the scaling factor (1/sensitivity) to approximate the minimal signal variation of the straightness interferometer. From this point of view, a larger divergence angle will lead to a better resolution. But additionally, the influence of the gradients may increase with a larger divergence, which corresponds to a larger interspace between the beams.
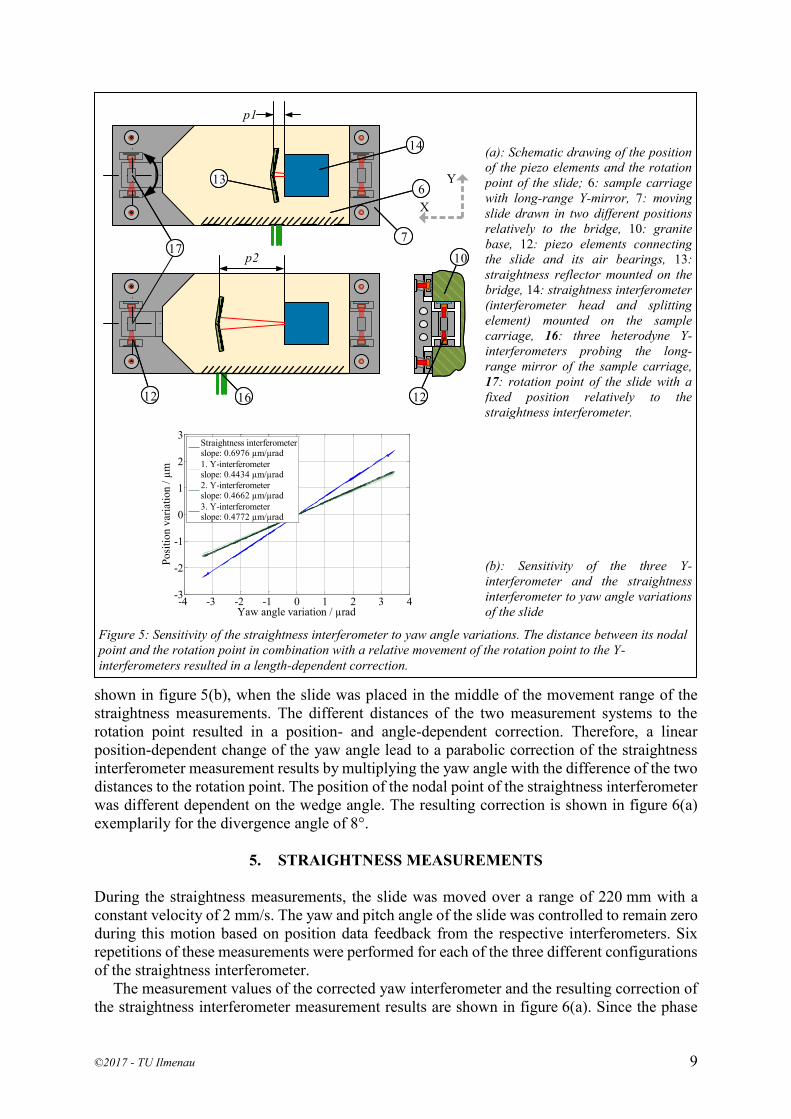
Beside the horizontal straightness motion error, the yaw angle variations of the slide affected the measured phase of the straightness interferometer. A rotation around an arbitrary point can be resolved into translations and rotations about the nodal point of the straightness interferometer. A rotation around the nodal point of straightness interferometers, which is typically inside or close to the splitting element, has a minimal influence on the measured phase [3, 21], leaving the surface topographies and refractive index gradients of glass as the only impact remaining. Therefore, usually only the splitting element is moved. This was not realized during the straightness measurements at NMC due to space limitations. The sensitivity to yaw angle variations was evaluated for the three different configurations of wedge prisms successively by rotating the slide at three different positions. As illustrated in figure 5(a), the slide exhibited four piezo elements for a movement in Y-direction and a yaw angle variation. To control the yaw angle and to introduce angle variations only the two piezo elements (placed on the left side of the slide in figure 5(b)) were used, which defined the rotation point of the slide. This rotation point remained constant relatively to the straightness interferometer, but moved with the slide relatively to the Y-interferometers. The sensitivity of the three Y-interferometers and the straightness interferometer to a yaw angle variations is exemplarily
Table 1: List of the sensitivity factors measured and calculated for the three different wedge prisms Divergence angle 4° 8° 20°
Sensitivity Y-movement measured 0.0697 0.1395 0.3483 Sensitivity Y-movement calculated 0.0698 0.1392 0.3473
Theoretical resolution (@10 kHz) / pm 70 35 14 Scaling factor (1/sensitivity) 14.3494 7.1823 2.8714
Sensitivity yaw angle / µm/µrad 0.7814 0.6976 0.6482
©2017 - TU Ilmenau 9
shown in figure 5(b), when the slide was placed in the middle of the movement range of the straightness measurements. The different distances of the two measurement systems to the rotation point resulted in a position- and angle-dependent correction. Therefore, a linear position-dependent change of the yaw angle lead to a parabolic correction of the straightness interferometer measurement results by multiplying the yaw angle with the difference of the two distances to the rotation point. The position of the nodal point of the straightness interferometer was different dependent on the wedge angle. The resulting correction is shown in figure 6(a) exemplarily for the divergence angle of 8°.
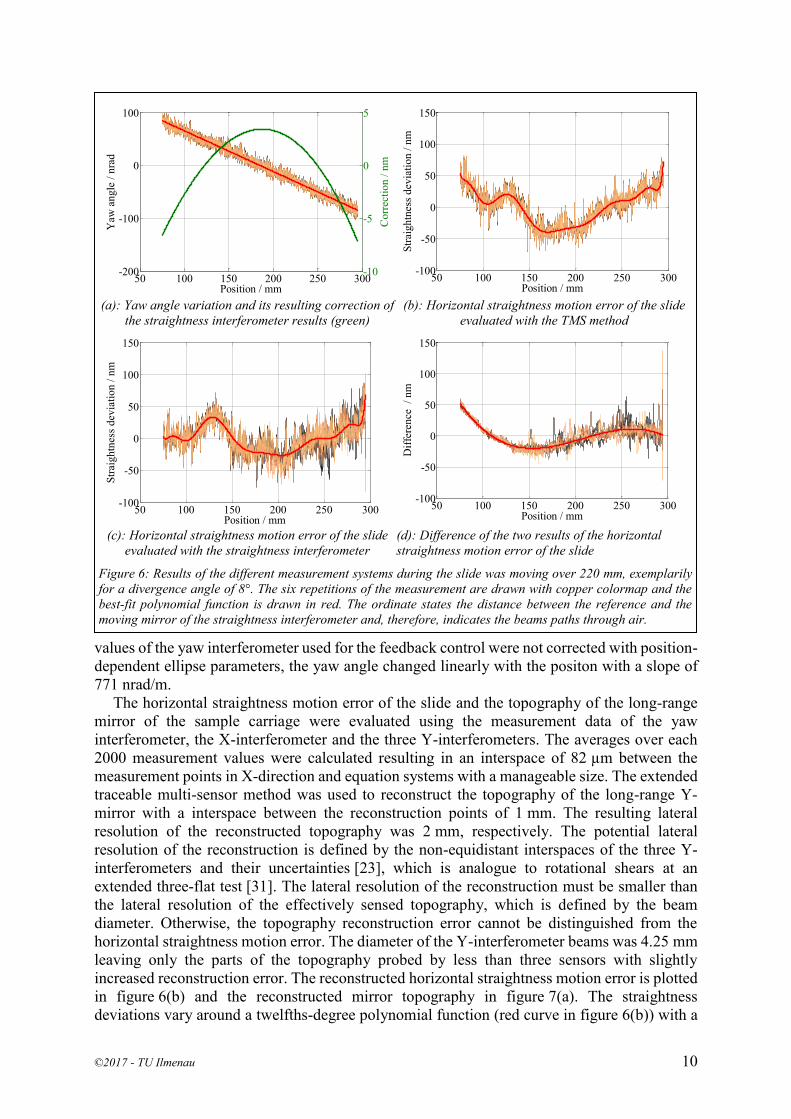
5. STRAIGHTNESS MEASUREMENTS During the straightness measurements, the slide was moved over a range of 220 mm with a constant velocity of 2 mm/s. The yaw and pitch angle of the slide was controlled to remain zero during this motion based on position data feedback from the respective interferometers. Six repetitions of these measurements were performed for each of the three different configurations of the straightness interferometer.
The measurement values of the corrected yaw interferometer and the resulting correction of the straightness interferometer measurement results are shown in figure 6(a). Since the phase
(a): Schematic drawing of the position of the piezo elements and the rotation point of the slide; 6: sample carriage with long-range Y-mirror, 7: moving slide drawn in two different positions relatively to the bridge, 10: granite base, 12: piezo elements connecting the slide and its air bearings, 13: straightness reflector mounted on the bridge, 14: straightness interferometer (interferometer head and splitting element) mounted on the sample carriage, 16: three heterodyne Y-interferometers probing the long-range mirror of the sample carriage, 17: rotation point of the slide with a fixed position relatively to the straightness interferometer.
(b): Sensitivity of the three Y-interferometer and the straightness interferometer to yaw angle variations of the slide
Figure 5: Sensitivity of the straightness interferometer to yaw angle variations. The distance between its nodal point and the rotation point in combination with a relative movement of the rotation point to the Y-interferometers resulted in a length-dependent correction.
1616
p2
1212 1212
1010
1414
p1
1313
171777
66X
Y
-4 -3 -2 -1 0 1 2 3 4-3
-2
-1
0
1
2
3
Yaw angle variation / µrad
Po
siti
on
var
iati
on
/ µ
m
Straightness interferometerslope: 0.6976 µm/µrad1. Y-interferometerslope: 0.4434 µm/µrad2. Y-interferometerslope: 0.4662 µm/µrad3. Y-interferometerslope: 0.4772 µm/µrad
©2017 - TU Ilmenau 10
values of the yaw interferometer used for the feedback control were not corrected with position-dependent ellipse parameters, the yaw angle changed linearly with the positon with a slope of 771 nrad/m.
The horizontal straightness motion error of the slide and the topography of the long-range mirror of the sample carriage were evaluated using the measurement data of the yaw interferometer, the X-interferometer and the three Y-interferometers. The averages over each 2000 measurement values were calculated resulting in an interspace of 82 µm between the measurement points in X-direction and equation systems with a manageable size. The extended traceable multi-sensor method was used to reconstruct the topography of the long-range Y-mirror with a interspace between the reconstruction points of 1 mm. The resulting lateral resolution of the reconstructed topography was 2 mm, respectively. The potential lateral resolution of the reconstruction is defined by the non-equidistant interspaces of the three Y-interferometers and their uncertainties [23], which is analogue to rotational shears at an extended three-flat test [31]. The lateral resolution of the reconstruction must be smaller than the lateral resolution of the effectively sensed topography, which is defined by the beam diameter. Otherwise, the topography reconstruction error cannot be distinguished from the horizontal straightness motion error. The diameter of the Y-interferometer beams was 4.25 mm leaving only the parts of the topography probed by less than three sensors with slightly increased reconstruction error. The reconstructed horizontal straightness motion error is plotted in figure 6(b) and the reconstructed mirror topography in figure 7(a). The straightness deviations vary around a twelfths-degree polynomial function (red curve in figure 6(b)) with a
(a): Yaw angle variation and its resulting correction of
the straightness interferometer results (green)
(b): Horizontal straightness motion error of the slide
evaluated with the TMS method
(c): Horizontal straightness motion error of the slide
evaluated with the straightness interferometer
(d): Difference of the two results of the horizontal straightness motion error of the slide
Figure 6: Results of the different measurement systems during the slide was moving over 220 mm, exemplarily for a divergence angle of 8°. The six repetitions of the measurement are drawn with copper colormap and the best-fit polynomial function is drawn in red. The ordinate states the distance between the reference and the moving mirror of the straightness interferometer and, therefore, indicates the beams paths through air.
50 100 150 200 250 300-200
-100
0
100
Position / mm
Yaw
an
gle
/ n
rad
-10
-5
0
5
Co
rrec
tio
n /
nm
50 100 150 200 250 300-100
-50
0
50
100
150
Position / mm
Str
aig
htn
ess
dev
iati
on
/ n
m
50 100 150 200 250 300-100
-50
0
50
100
150
Position / mm
Str
aig
htn
ess
dev
iati
on
/ n
m
50 100 150 200 250 300-100
-50
0
50
100
150
Position / mm
Dif
fere
nce
/
nm
©2017 - TU Ilmenau 11
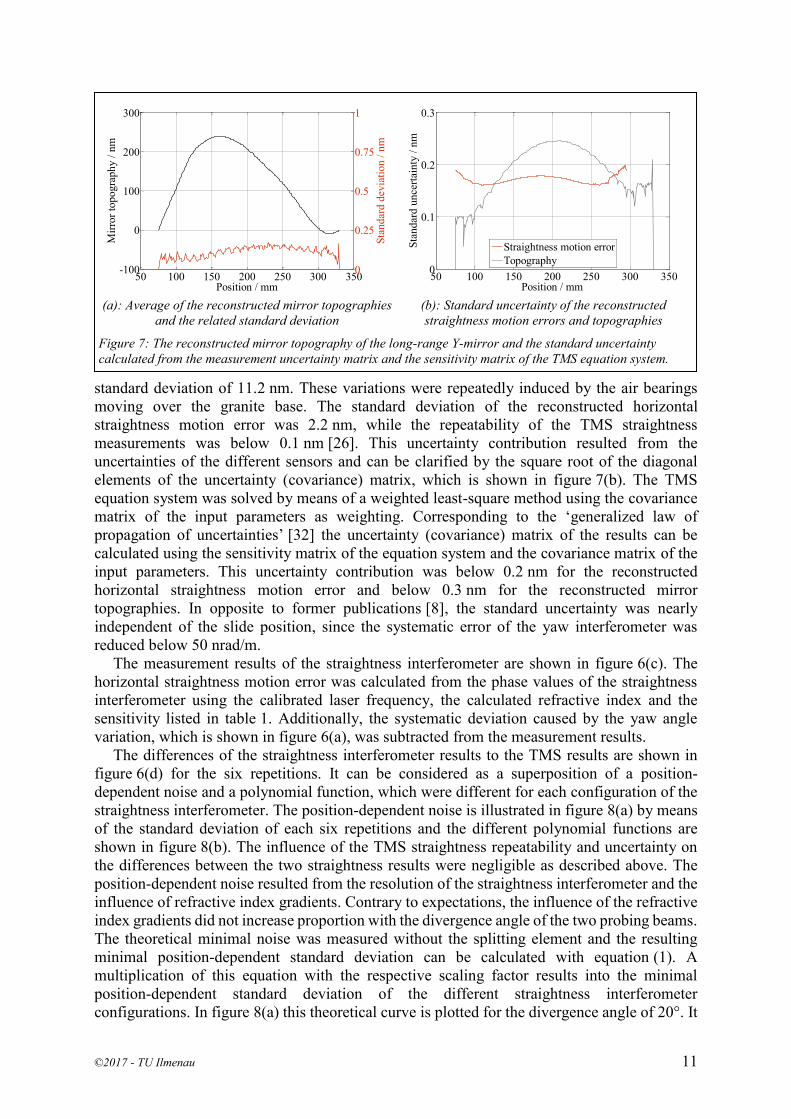
standard deviation of 11.2 nm. These variations were repeatedly induced by the air bearings moving over the granite base. The standard deviation of the reconstructed horizontal straightness motion error was 2.2 nm, while the repeatability of the TMS straightness measurements was below 0.1 nm [26]. This uncertainty contribution resulted from the uncertainties of the different sensors and can be clarified by the square root of the diagonal elements of the uncertainty (covariance) matrix, which is shown in figure 7(b). The TMS equation system was solved by means of a weighted least-square method using the covariance matrix of the input parameters as weighting. Corresponding to the ‘generalized law of propagation of uncertainties’ [32] the uncertainty (covariance) matrix of the results can be calculated using the sensitivity matrix of the equation system and the covariance matrix of the input parameters. This uncertainty contribution was below 0.2 nm for the reconstructed horizontal straightness motion error and below 0.3 nm for the reconstructed mirror topographies. In opposite to former publications [8], the standard uncertainty was nearly independent of the slide position, since the systematic error of the yaw interferometer was reduced below 50 nrad/m.
The measurement results of the straightness interferometer are shown in figure 6(c). The horizontal straightness motion error was calculated from the phase values of the straightness interferometer using the calibrated laser frequency, the calculated refractive index and the sensitivity listed in table 1. Additionally, the systematic deviation caused by the yaw angle variation, which is shown in figure 6(a), was subtracted from the measurement results.
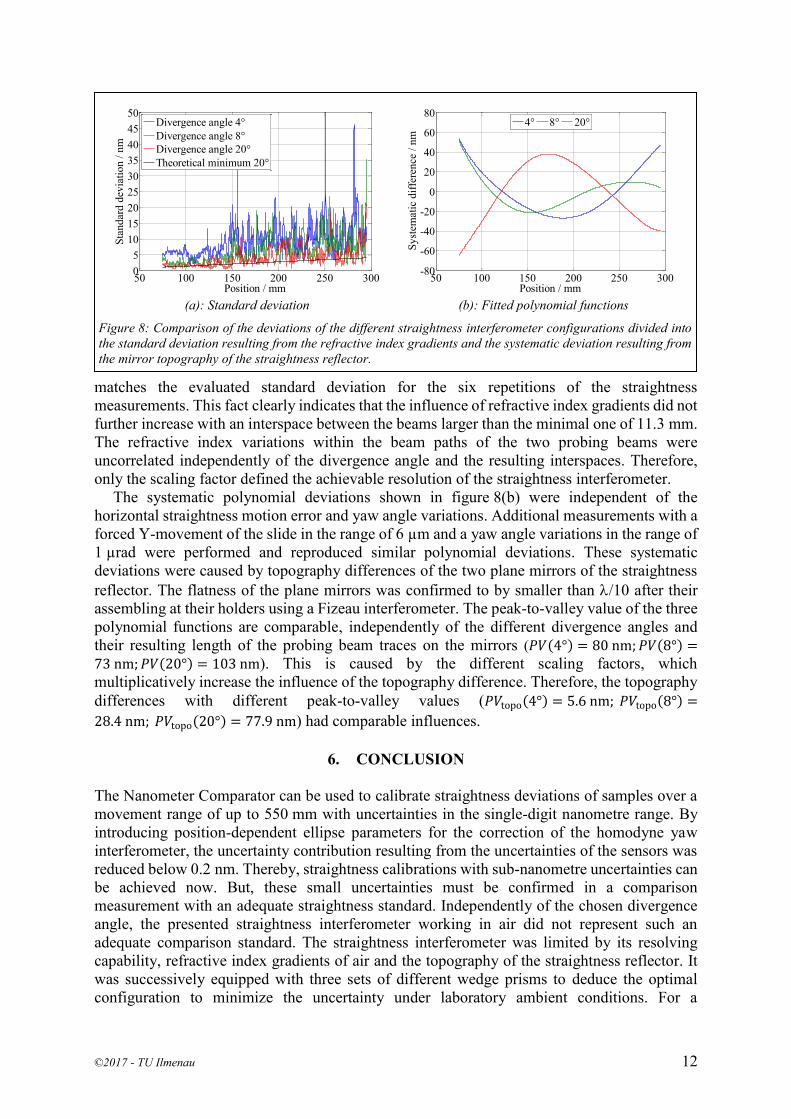
The differences of the straightness interferometer results to the TMS results are shown in figure 6(d) for the six repetitions. It can be considered as a superposition of a position-dependent noise and a polynomial function, which were different for each configuration of the straightness interferometer. The position-dependent noise is illustrated in figure 8(a) by means of the standard deviation of each six repetitions and the different polynomial functions are shown in figure 8(b). The influence of the TMS straightness repeatability and uncertainty on the differences between the two straightness results were negligible as described above. The position-dependent noise resulted from the resolution of the straightness interferometer and the influence of refractive index gradients. Contrary to expectations, the influence of the refractive index gradients did not increase proportion with the divergence angle of the two probing beams. The theoretical minimal noise was measured without the splitting element and the resulting minimal position-dependent standard deviation can be calculated with equation (1). A multiplication of this equation with the respective scaling factor results into the minimal position-dependent standard deviation of the different straightness interferometer configurations. In figure 8(a) this theoretical curve is plotted for the divergence angle of 20°. It
(a): Average of the reconstructed mirror topographies
and the related standard deviation
(b): Standard uncertainty of the reconstructed straightness motion errors and topographies
Figure 7: The reconstructed mirror topography of the long-range Y-mirror and the standard uncertainty calculated from the measurement uncertainty matrix and the sensitivity matrix of the TMS equation system.
50 100 150 200 250 300 350-100
0
100
200
300
Position / mm
Mir
ror
top
og
rap
hy
/ n
m
0
0.25
0.5
0.75
1
Sta
nd
ard
dev
iati
on
/ n
m
50 100 150 200 250 300 3500
0.1
0.2
0.3
Position / mm
Sta
nd
ard
un
cert
ain
ty /
nm
Straightness motion error
Topography
©2017 - TU Ilmenau 12
matches the evaluated standard deviation for the six repetitions of the straightness measurements. This fact clearly indicates that the influence of refractive index gradients did not further increase with an interspace between the beams larger than the minimal one of 11.3 mm. The refractive index variations within the beam paths of the two probing beams were uncorrelated independently of the divergence angle and the resulting interspaces. Therefore, only the scaling factor defined the achievable resolution of the straightness interferometer.
The systematic polynomial deviations shown in figure 8(b) were independent of the horizontal straightness motion error and yaw angle variations. Additional measurements with a forced Y-movement of the slide in the range of 6 µm and a yaw angle variations in the range of 1 µrad were performed and reproduced similar polynomial deviations. These systematic deviations were caused by topography differences of the two plane mirrors of the straightness reflector. The flatness of the plane mirrors was confirmed to by smaller than l/10 after their assembling at their holders using a Fizeau interferometer. The peak-to-valley value of the three polynomial functions are comparable, independently of the different divergence angles and their resulting length of the probing beam traces on the mirrors (𝑃𝑉(4°) = 80 nm; 𝑃𝑉(8°) =73 nm; 𝑃𝑉(20°) = 103 nm). This is caused by the different scaling factors, which multiplicatively increase the influence of the topography difference. Therefore, the topography differences with different peak-to-valley values (𝑃𝑉topo(4°) = 5.6 nm; 𝑃𝑉topo(8°) =
28.4 nm; 𝑃𝑉topo(20°) = 77.9 nm) had comparable influences.
6. CONCLUSION The Nanometer Comparator can be used to calibrate straightness deviations of samples over a movement range of up to 550 mm with uncertainties in the single-digit nanometre range. By introducing position-dependent ellipse parameters for the correction of the homodyne yaw interferometer, the uncertainty contribution resulting from the uncertainties of the sensors was reduced below 0.2 nm. Thereby, straightness calibrations with sub-nanometre uncertainties can be achieved now. But, these small uncertainties must be confirmed in a comparison measurement with an adequate straightness standard. Independently of the chosen divergence angle, the presented straightness interferometer working in air did not represent such an adequate comparison standard. The straightness interferometer was limited by its resolving capability, refractive index gradients of air and the topography of the straightness reflector. It was successively equipped with three sets of different wedge prisms to deduce the optimal configuration to minimize the uncertainty under laboratory ambient conditions. For a
(a): Standard deviation
(b): Fitted polynomial functions
Figure 8: Comparison of the deviations of the different straightness interferometer configurations divided into the standard deviation resulting from the refractive index gradients and the systematic deviation resulting from the mirror topography of the straightness reflector.
50 100 150 200 250 3000
5
10
15
20
25
30
35
40
45
50
Position / mm
Sta
nd
ard
dev
iati
on
/ n
m
Divergence angle 4°
Divergence angle 8°
Divergence angle 20°
Theoretical minimum 20°
50 100 150 200 250 300-80
-60
-40
-20
0
20
40
60
80
Position / mm
Sy
stem
atic
dif
fere
nce
/ n
m
4° 8° 20°
©2017 - TU Ilmenau 13
movement range of 220 mm the comparison measurements with the Nanometer Comparator revealed the following two conclusions:
• The influence of the refractive index gradients of air do not increase significantly in case the spacing of the beams is increased above 11.3 mm. Therefore, the resolving capability of the presented straightness interferometer was defined by the scaling factor. Thus, the best resolution was achieved with the divergence angle of 20°.
• The systematic deviations caused by the mirror topography had in a similar magnitude for different wedge prisms, as emphasised by figure 8(b). The influence of the straightness reflector topography is proportional to the scaling factor. For the divergence angle of 4°, the difference of the mirror topographies was only in the single-digit nanometre range, but scaled up by the factor of 14.35. Therefore, the topographies of the two mirrors would have to be measured each with an uncertainty below 0.5 nm to achieve a correction with an uncertainty of 10 nm. The possibility of a mirror topography correction either by a measurement or by a 180° rotation of the straightness reflector is additionally limited by the ability to know or to match the beam traces on the mirror surfaces. The demand on a small uncertainty for the topography determination and the ability to know the beam traces is smaller for larger divergence angles. Therefore, the best opportunity to realise a correction of this systematic deviation is offered with the divergence angle of 20°.
ACKNOWLEDGEMENT The authors would like to thank the European Commission for funding from the European community’s Seventh Framework Program, ERA-NET Plus, under the project number IND58. We also thank Heiko Reinsch, Klemens Budin and Uwe Sterr. Without their support the realization of the topography measurements of the straightness reflector and the determination of the laser frequency would not have been possible. Further acknowledgements go to Johannes Ostermann and Rainer Köning for carefully reading this manuscript. REFERENCES [1] R. Fesperman, N. Brown, K. Elliott, J. Ellis, A. Grabowski, S. Ludwick, S. Maneuf, B.
O’Conner and S. Woody, “Methods for Performance Evaluation of Single Axis Positioning Systems: A New Standard”, Proc. of the ASPE Annual Meeting, 56, pp. 498-503, 2013+
[2] ISO 230-1:2012, “Test code for machine tools -- Part 1: Geometric accuracy of machines operating under no-load or quasi-static conditions”.
[3] R. R. Baldwin, B. E. Grote and D. A. Harland, “A laser interferometer that measures straightness of travel”, Hewlett-Packard Journal, 1, pp. 10-20, 1974.
[4] C. J. Evans, R. J. Hocken and W. T. Estler, “Self-Calibration: Reversal, Redundancy, Error Separation, and ‘Absolute Testing’”, CIRP Annals – Manufacturing Technology, 45(2), pp. 617-634 ,1996.
[5] R. Köning, J. Flügge and H. Bosse, “Achievement of sub nanometer reproducibility in line scale measurements with the nanometer comparator”, Proc. SPIE, 6518, pp. 65183F-65183F-8, 2007.
[6] I. Tiemann, C. Spaeth, G. Wallner, G. Metz, W. Israel, Y. Yamaryo, T. Shimomura, T. Kubo, T. Wakasa, T. Morosawa, R. Köning, J. Flügge, J. and H. Bosse, “An international length comparison using vacuum comparators and a photoelectric incremental encoder as transfer standard”, Precision Engineering, 32, pp. 1-6, 2008.
©2017 - TU Ilmenau 14
[7] R. Köning, C. Weichert, B. Przebierala, J. Flügge, W. Haessler-Grohne and H. Bosse, “Implementing registration measurements on photomasks at the nanometer comparator”, Measurement Science and Technology, 23(9), p. 094010, 2012.
[8] C. Weichert, H. Bosse, J. Flügge, R. Köning, P. Köchert, A. Wiegmann and H. Kunzmann, “Implementation of straightness measurements at the nanometer comparator”, CIRP Annals - Manufacturing Technology, 65(1), pp. 507-510, 2016.
[9] M. Tanaka, T. Yamagami, and K. Nakayama, “Linear interpolation of periodic error in a heterodyne laser interferometer at subnanometer levels”, IEEE Transactions on Instrumentation and Measurement, 38(2), pp. 552-554, 1989.
[10] C. Weichert, P. Köchert, R. Köning, J. Flügge, B. Andreas, U. Kuetgens, and A. Yacoot, “A heterodyne interferometer with periodic nonlinearities smaller than ±10 pm”, Measurement Science and Technology, 23(9), p. 094005, 2012.
[11] C. Sternkopf, C. Diethold, U. Gerhardt, J. Wurmus, and E. Manske, “Heterodyne interferometer laser source with a pair of two phase locked loop coupled He–Ne lasers by 632.8 nm”,Measurement Science and Technology, 23(7), p. 074006, 2012.
[12] R. Balhorn, H. Kunzmann and F. Lebowsky, “Frequency stabilization of internal-mirror Helium-Neon lasers”, Applied Optics, 11(4), pp. 742-744, 1972.
[13] T. J. Quinn, “Practical realization of the definition of the metre, including recommended radiations of other optical frequency standards”, Metrologia, 40, pp. 103-133, 2003.
[14] P. Köchert, C. Weichert, J. Flügge, J. Wurmus and E. Manske, “Digital beat frequency control of an offset-locked laser system”, Proc. of the 58th Ilmenau Scientific Colloquium, 2014.
[15] G. Cavagnero, G. Mana and E. Massa, “Aberration effects in two-beam laser interferometers”, Journal of the Optical Society of America A, Optics and Image Science, 23(8), pp. 1951-1959, 2006.
[16] C. Weichert, J. Flügge, R. Köning, H. Bosse and R. Tutsch, “Aspects on design and characterization of a high resolution heterodyne interferometer”, Fringe 2009: Proc. 6th Int. Workshop on Advanced Optical Metrology, pp. 263-268, 2009.
[17] E. Massa, G. Mana, J. Krempel and M. Jentschel, “Polarization delivery in heterodyne interferometry”, Optics Express, 21(22), pp. 27119-27126, 2013.
[18] C. Weichert, P. Köchert, R. Köning and J. Flügge, “Stability of a fully fibre-coupled interferometer”, Proc. of the 58th Ilmenau Scientific Colloquium, 2014.
[19] P. Köchert, J. Flügge, C. Weichert, R. Köning and E. Manske, “Phase measurement of various commercial heterodyne He-Ne-laser interferometers with stability in the picometer regime”, Measurement Science and Technology, 23(7), p. 074005, 2012.
[20] P. Köchert, C. Weichert, S. Strube, R. Köning, J. Flügge and E. Manske, “A fully-fibre coupled interferometer system for displacement and angle metrology”, Proc. of the 16th International Conference of the European Society for Precision Engineering and Nanotechnology, pp. 51-52, 2016.
[21] W. Gao, Y. Arai, A. Shibuya, S. Kiyono and C. H. Park, “Measurement of multi-degree-of-freedom error motions of a precision linear air-bearing stage”, Precision Engineering, 30(1), pp. 96-103, 2006.
[22] C. Elster, I. Weingärtner and M. Schulz, “Coupled Distance Sensor Systems for High-Accuracy Topography Measurement: Accounting for Scanning Stage and Systematic Sensor Errors”, Precision Engineering, 30, pp. 32-38, 2006.
[23] A. Wiegmann, M. Schulz and C. Elster, “Improving the Lateral Resolution of a Multi-Sensor Profile Measurement Method by Non-Equidistant Sensor Spacing”, Optics Express, 18(15), pp. 15807-15819, 2010.
[24] J. Flügge, R. Köning, E. Schötka, C. Weichert, P. Köchert, H. Bosse and H. Kunzmann, “Improved Measurement Performance of the Physikalisch-Technische Bundesanstalt
©2017 - TU Ilmenau 15
Nanometer Comparator by Integration of a New Zerodur Sample Carriage”, Optical Engineering, 53(12), pp. 122404-1-122404-5, 2014.
[25] J. Flügge, C. Weichert, H. Hu, R. Köning, H. Bosse, A. Wiegmann, M. Schulz, C. Elster, and R.D. Geckeler, “Interferometry at the PTB Nanometer Comparator: Design, Status and Development”, Proc. of SPIE, 7133, pp. 713346-713346-8, 2008.
[26] C. Weichert, R. Köning, P. Köchert, A. Wiegmann, J. Flügge and R. Tutsch, “Straightness measurements with sub-nanometre repeatability”, Proc. of the 16th International Conference of the European Society for Precision Engineering and Nanotechnology, pp. 99-100, 2016.
[27] R. Köning, C. Weichert, P. Köchert, J. Guan and J. Flügge, “Redetermination of the Abbe Errors’ Uncertainty Contributions at the Nanometer Comparator”, Measurement 2013 Proc. of the 9th International Conference, pp. 171-174, 2013.
[28] G. Bönsch and E. Potulski, “Measurement of the refractive index of air and comparison with modified Edlén’s formulae”, Metrologia, 35(2), pp. 133-139, 1998.
[29] R. Köning, J. Flügge and H. Bosse, “Characterizing the performance of the PTB line scale interferometer by measuring photoelectric incremental encoders”, Proc. of SPIE, 5879, pp. 587908-587908-9, 2005.
[30] P. Köchert, R. Köning, C. Weichert, J. Flügge and E. Manske, “An upgraded data acquisition and drive system at the Nanometer Comparator”, Proc. of ASPE 5th Topical Meeting: Precision Interferometric Metrology, pp. 61-66, 2015.
[31] K.R. Freischlad, “Absolute interferometric testing based on reconstruction of rotational shear”, Applied Optics, 40(10), pp. 1637-1648, 2001.
[32] I. Lira, “ Evaluating the Measurement Uncertainty: Fundamentals and Practical Guidance”, Institute of Physics Publishing, ISBN 978-07503-0840-0, 2002.
CONTACT Christoph Weichert [email protected]