Interferometer-controlled scanning transmission X-ray ...
13
electronic reprint Journal of Synchrotron Radiation ISSN 0909-0495 Interferometer-controlled scanning transmission X-ray microscopes at the Advanced Light Source A. L. D. Kilcoyne, T. Tyliszczak, W. F. Steele, S. Fakra, P. Hitchcock,K. Franck,E. Anderson, B. Harteneck, E. G. Rightor, G. E. Mitchell, A. P. Hitchcock, L. Yang, T. Warwick and H. Ade Copyright © International Union of Crystallography Author(s) of this paper may load this reprint on their own web site provided that this cover page is retained. Republication of this article or its storage in electronic databases or the like is not permitted without prior permission in writing from the IUCr. J. Synchrotron Rad. (2003). 10, 125–136 A. L. D. Kilcoyne et al. Microscopes at the Advanced Light Source
-
Upload
khangminh22 -
Category
Documents
-
view
3 -
download
0
Transcript of Interferometer-controlled scanning transmission X-ray ...
electronic reprint
Journal of
SynchrotronRadiation
ISSN 0909-0495
Interferometer-controlled scanning transmission X-ray microscopes atthe Advanced Light Source
A. L. D. Kilcoyne, T. Tyliszczak, W. F. Steele, S. Fakra, P. Hitchcock, K. Franck, E.Anderson, B. Harteneck, E. G. Rightor, G. E. Mitchell, A. P. Hitchcock, L. Yang, T.Warwick and H. Ade
Copyright © International Union of Crystallography
Author(s) of this paper may load this reprint on their own web site provided that this cover page is retained. Republication of this article or itsstorage in electronic databases or the like is not permitted without prior permission in writing from the IUCr.
J. Synchrotron Rad. (2003). 10, 125–136 A. L. D. Kilcoyne et al. � Microscopes at the Advanced Light Source

Interferometer-controlled scanningtransmission X-ray microscopes at theAdvanced Light Source
A. L. D. Kilcoyne,a T. Tyliszczak,b,c W. F. Steele,c
S. Fakra,c P. Hitchcock,a,b K. Franck,c E. Anderson,d
B. Harteneck,d E. G. Rightor,e G. E. Mitchell,e
A. P. Hitchcock,b L. Yang,b T. Warwickc and H. Adea*
aDepartment of Physics, North Carolina State University,Raleigh, NC 27895, USA, bBrockhouse Institute for MaterialResearch, McMaster University, Hamilton, ON L8S 4M1,Canada, cAdvanced Light Source, Lawrence Berkeley NationalLaboratory, Berkeley, California 94720, USA, dCenter for X-rayOptics, Lawrence Berkeley National Laboratory, Berkeley,California 94720, USA, and eDow Chemical, 1897 Bldg,Midland, MI 48667, USA. E-mail: [email protected].
Two new soft X-ray scanning transmission microscopes located at the
Advanced Light Source (ALS) have been designed, built and
commissioned. Interferometer control implemented in both micro-
scopes allows the precise measurement of the transverse position of
the zone plate relative to the sample. Long-term positional stability
and compensation for transverse displacement during translations of
the zone plate have been achieved. The interferometer also provides
low-distortion orthogonal x, y imaging. Two different control systems
have been developed: a digital control system using standard VXI
components at beamline 7.0, and a custom feedback system based on
PC AT boards at beamline 5.3.2. Both microscopes are diffraction
limited with the resolution set by the quality of the zone plates.
Periodic features with 30 nm half period can be resolved with a zone
plate that has a 40 nm outermost zone width. One microscope is
operating at an undulator beamline (7.0), while the other is operating
at a novel dedicated bending-magnet beamline (5.3.2), which is
designed speci®cally to illuminate the microscope. The undulator
beamline provides count rates of the order of tens of MHz at high-
energy resolution with photon energies of up to about 1000 eV.
Although the brightness of a bending-magnet source is about four
orders of magnitude smaller than that of an undulator source, photon
statistics limited operation with intensities in excess of 3 MHz has
been achieved at high energy resolution and high spatial resolution.
The design and performance of these microscopes are described.
Keywords: X-rays; zone plates; scanning microscopy; NEXAFS.
1. Introduction
Structure and phenomena on a length scale from nanometres to
micrometres are the focus of much current scienti®c research. For
example, heterogeneous composition and chemical properties on this
scale are key to the behaviour of multiphasic polymeric materials,
biomaterials and composites. Furthermore, environmental and
biological processes often involve microscopically variable chemistry.
There is therefore a growing need for detailed compositional and
chemical analysis at high spatial resolution. Transmission X-ray
microscopy in both scanning (STXM) and full-®eld variants (TXM) is
becoming increasingly important on account of the relatively low
radiation damage and compositional information that is provided by
near-edge X-ray absorption ®ne-structure (NEXAFS) spectroscopy.
Various implementations of zone-plate-based scanning transmission
X-ray microscopes (STXM) have been developed during the past two
decades at several synchrotron radiation facilities (Kirz & Rarback,
1985; Kirz et al., 1995; Warwick et al., 1998; McNulty et al., 1998;
Kaulich et al., 1999). These instruments have been used to study many
different types of samples including polymeric (Ade et al., 1992, 1995;
Ade & Hsiao, 1993; Ade & Urquhart, 2002), geochemical (Botto et
al., 1994; Cody et al., 1998), environmental (Plaschke et al., 2002),
magnetic (Kim et al., 2001), extraterrestrial (Flynn et al., 1998; Keller
et al., 2000) and biological (Kirz et al., 1995) samples. Most STXM
studies use the information provided by the NEXAFS of elements
with absorption edges in the soft X-ray energy range, particularly of
carbon, nitrogen and oxygen (StoÈ hr, 1992). The ability of STXM to
adapt to a wide range of sample environments, such as magnetic ®elds
(Kim et al., 2001), variable temperature (Wang et al., 2000) and
polymeric and environmental samples in aqueous media (NeuhaÈusler
et al., 1999; Mitchell et al., 2002), is an important aspect of the tech-
nique, as is the relatively low amount of radiation damage caused by
soft X-rays (Rightor et al., 1997; Coffey et al., 2002). In order to scan
the photon energy for NEXAFS we need to use a synchrotron
radiation facility as a tunable source for these instruments. In order to
acquire useful information in a reasonable time, high photon ¯ux in a
small spot is required. During the past decade STXMs have been
operated exclusively at high-brightness undulator sources (Kirz et al.,
1995; Warwick et al., 1998). Since the number of straight sections at
high-brightness synchrotron facilities is very limited, the use of
undulator sources greatly limits the potential for growth of STXM
technology. Furthermore, since the overall utility of NEXAFS
microscopy to a wide variety of ®elds is now without question, the use
of high-brightness bending magnets would offer increased access.
Two STXMs that signi®cantly extend prior instrumental capabil-
ities have been commissioned at the Advanced Light Source (ALS)
in Berkeley. Their design and performance are described and
discussed. One of these microscopes is the upgrade to the ®rst-
generation STXM at the ALS and is located on undulator beamline
7.0. In an important new development, the other new microscope has
been installed on a dedicated bending-magnet beamline (5.3.2) in
order to explore and, if adequate performance is found, exploit the
utility of high-brightness bending magnets for STXM illumination.
The 5.3.2 beamline itself was highly optimized for STXM use and was
described in a companion paper (Warwick et al., 2002). This bending-
magnet beamline and the STXM implemented there have been
shown to have excellent performance. The STXMs described here
will be designated by their present beamline number at the Advanced
Light Source and will be referred to as the 5.3.2 STXM and the 7.0
STXM, respectively. These new STXMs share many design features
and both use laser interferometry to accurately position the sample
relative to the X-ray optics. We will ®rst discuss the basic operating
principles of a STXM and describe the prior state-of-the-art tech-
nology to provide context. Subsequently, the design of the new ALS
STXM instruments will be presented and their performance will be
discussed with results from the 5.3.2 STXM as examples.
1.1. Basic operating principle of a zone-plate-based STXM
In a scanning X-ray microscope, a small spot of X-rays is raster
scanned relative to the sample to create an image one pixel at a time
while a suitable signal is monitored under computer control. The
most common signal is the photon ¯ux that is transmitted through the
sample (STXM). In addition, measurements in the scanning instru-
ments have also used front-face electron yield, luminescence yield
and X-ray ¯uorescence yield. Because of challenges in scanning
X-ray optics, samples are typically scanned relative to a stationary
J. Synchrotron Rad. (2003). 10, 125±136 # 2003 International Union of Crystallography � Printed in Great Britain ± all rights reserved 125
research papers
electronic reprint

research papers
126 A. L. D. Kilcoyne et al. � Microscopes at the Advanced Light Source J. Synchrotron Rad. (2003). 10, 125±136
X-ray beam in a STXM. Two-axis x, y piezoelectric stages have
generally been used for ®ne motion over a limited ®eld of view. This
x, y piezo stage itself is mounted on top of x, y, z stepping motor
stages that provide motion in excess of many millimetres for large-
scale images or coarse positioning of dispersed small samples. The
small X-ray spot is produced by a zone-plate lens. This is a variable-
line-spacing circular diffraction grating.
In order to suppress unwanted diffraction orders that would
decrease the available signal-to-background ratio, the zone plate is
fabricated with a central stop. A slightly smaller pinhole, the order
selection aperture (OSA), is placed between the zone plate and the
sample at about 0.75 times the zone-plate-to-sample distance. This
allows only the positive ®rst diffraction order to pass (see Fig. 1).
Careful transverse and longitudinal alignment of the OSA with the
zone plate is an essential aspect of tuning and operating a STXM. The
alignment determines the imaging properties of the microscopes and
the higher-order spectral contamination that may pass the zone-plate/
OSA arrangement.
The numerical aperture (NA) of a zone plate, i.e. the largest
diffraction angle for the variable zones, is determined by the size of
the outermost zone width �r at a ®xed wavelength of the incident
X-rays [NA = �/(2�r)]. For fully coherent illumination, plane-waves
or point sources, the Raleigh resolution of a zone plate, which
corresponds to the ®rst minimum of the Airy diffraction pattern,
depends on the size of the central stop relative to the size of the zone
plate and ranges from 0.9�r to 1.22�r (Michette, 1986). In practice, a
®nite source is used for illumination, and the diffraction pattern is
convolved with the de-magni®ed ®nite source to obtain the actual
point-spread function of the STXM. The illumination parameter
p = d�/�, where d is the illuminating source size and � is the full
acceptance angle of the zone plate, is a convenient way to char-
acterize the illumination. p = 0.5 corresponds roughly to the half-
Airy-disk illumination criterion, and represents a good trade-off
between ¯ux and achievable spatial resolution (Kirz et al., 1995). The
point-spread function and the modulation-transfer function of a zone
plate as a function of p have been calculated (Winn et al., 2000), and
the result shows in great detail how the imaging characteristics
depend on the illumination characteristics. Random or systematic
departures of the zones from circularity will also degrade the optical
properties of a zone plate. In order to achieve adequate performance
the zones have to be placed with an absolute accuracy of about 0.3�r(Michette, 1986). The achievable resolution depends on the
capabilities of the zone-plate-fabrication technology and on the
degree of coherence of the illuminating beam. Zone plates with
outermost zone widths as small as 20±25 nm have been fabricated,
and a spatial resolution suf®cient to resolve half-period features
25±30 nm in size has been achieved (Anderson et al., 2000; Spector et
al., 1997; Schneider et al., 1995; Denbeaux et al., 2001). Details of soft
X-ray optics for STXM have been discussed in articles by Jacobsen et
al. (1991, 1992).
Zone plates are achromatic lenses with a focal length proportional
to the photon energy. Thus, during the acquisition of NEXAFS
spectra or an image-sequence at many energy values (sometimes
referred to as `stacks'), a STXM microscope has to be refocused
synchronously with the photon energy changes (Jacobsen et al., 2000).
Depending on the focal length of the zone plate used, this requires
motions over 150±200 mm for a 30 eV-wide C 1 s NEXAFS scan or
> 1 mm for a change between different absorption edges. This range
can typically only be covered with conventional roller-bearing or
crossed-roller-bearing stages. Unfortunately, these stages exhibit
transverse motion, which is referred to as run-out, of the order of
several hundreds of nanometres during a translation. Unless
controlled, the run-out results in a relatively random misregistration
of subsequent images of the same sample area or a `blurring' of the
spot size sampled during the acquisition of a spectrum from a point
on the sample. If in-focus point spectra are acquired from small highly
contrasting sample features, the spectra will contain artifacts with
large spectral amplitudes if the photon beam moves on and off a
feature of interest because of uncorrected transverse run-out.
Overall, a STXM requires control and operational adjustment of
the z position of the zone plate, at least x and y control of the OSA, x,
y and z control over the sample, and generally x, y and z control over
the detector.
For alignment, since the X-ray beam is ®xed in space externally,
either the zone plate or the whole instrument needs to be translated
in x and y relative to the X-ray beam with about 10 mm precision. The
translation stage that provides the focusing has to be aligned in two
angles to be parallel with the externally de®ned optical axis. The
rotational degree of freedom around the optical axis, i.e. roll, is not
important.
1.2. Prior state-of-the-art technology
Pioneering efforts to construct the ®rst soft X-ray STXM were
made in the early 1980s (Rarback et al., 1984) at bending-magnet
beamline U15 at the vacuum ultraviolet ring at the National
Synchrotron Light Source (NSLS). The U15 STXM utilized a
toroidal-grating monochromator with a resolving power E/�E = 200
at photon energies within the so-called water window between the
absorption edges of oxygen and carbon. An initial spatial resolution
of about 300 nm could be achieved with a zone plate that had an
outermost zone width �r = 150 nm. Typical count rates were on the
order of 10 kHz.
The Stony Brook effort was ®rst relocated within the NSLS to a
temporary undulator at beamline X17 in 1986±1987 (Rarback et al.,
1988) and, subsequently, in 1988±1989 (Buckley et al., 1989), to its
present location at beamline X1A. The spatial resolution improved to
75 nm in 1988 (25±75% knife-edge test) with a 50 nm outermost
zone-width zone plate (Rarback et al., 1988). By 1991, 35 nm half-
period features could be resolved (Jacobsen et al., 1991; Kirz et al.,
1992), and, by 1997, half-period features of less than 30 nm in size
could be resolved (Spector et al., 1997). Typical count rates with the
NSLS X1A microscope for operation near the carbon edge and with
low higher-order spectral contamination are about 500 kHz. ForFigure 1Focusing scheme of a STXM.
electronic reprint

much of the past two decades, the Stony Brook efforts have de®ned
the state-of-the-art in STXM technology.
The X17 and the initial X1A STXM used a custom-built laser
interferometer that included custom electronics to provide high-
speed control and readout of the sample position relative to a
reference prism (Rarback et al., 1988; Shu et al., 1988). These
microscopes were designed to be used at a ®xed photon energy within
the water window. The interferometer had a least-count step size, or
sensitivity, of 31.5 nm and was somewhat dif®cult to maintain. This
sensitivity was insuf®cient for the high spatial resolution achieved,
and, when integrated capacitance-controlled scanning stages with
much higher sensitivity became available, from Queensgate and later
from Physik Instrumente, two further incarnations of the Stony
Brook STXMs were developed, in 1990±1992 and 1998±2000,
respectively, which could take full advantage of the improvements
made in zone-plate technology. Neither of these microscopes was
designed to control run-out directly in hardware or ®rmware. In-
accurate registration between images is corrected with post proces-
sing based on image-correlation procedures (Jacobsen et al., 2000).
Point spectra and line spectra cannot be measured at well de®ned
locations with an accuracy near the spatial resolution limit. This
information has to be extracted from image sequences after data
acquisition. Details about the Stony Brook microscopes have been
published (Jacobsen et al., 1991; Maser et al., 2000; Feser et al., 1998).
The Stony Brook team also developed a cryo-STXM with tomo-
graphy capabilities (Wang et al., 2000).
At the ALS, a STXM was developed in the mid-1990s by a team
that included several of the present authors (Warwick et al., 1998).
The STXM was located on beamline BL7.0, an undulator beamline
that was conceived and optimized for spectroscopy. This ®rst-
generation ALS BL7.0 STXM was based on a capacitance-controlled
piezoelectric stage from Queensgate Inc. as a ®ne stage. It used
Newport PM-500 stages as sample coarse stages and for the zone-
plate z motion. The coarse and ®ne stages could be rotated together
to provide in-focus scans over the full ®eld of view when polar sample
rotation with respect to the polarization vector of the photon beam
was desired (Kim et al., 2001). The interface electronics were based
on VXI crate/modules controlled by a Unix workstation. A second
Unix workstation was dedicated for a graphical user interface (GUI).
The GUI and low-level interface software were written in Labview.
Spatial resolution of 60 nm FWHM was measured in a knife-edge test
(Warwick et al., 1999). Routine operation used a slightly incoherent
beam that resulted in a degraded spatial resolution on the order of
100 nm with improved noise characteristics. The microscope suffered
from signi®cant run-out of the zone-plate ®ne and coarse stages
(> 500 nm) and from magni®ed Abbe errors, the latter due to an off-
centre sample mount. In addition, the STXM operation has to be
shared with several other instruments on BL7.0 on a daily timeshared
basis. One of the microscopes described below is the upgrade to this
®rst-generation STXM at the ALS.
A STXM, built by a group from King's College, London (Kenney
et al., 1989), was operated for a short time at the Daresbury U6
undulator beamline. The GoÈ ttingen X-ray microscopy group devel-
oped and operated for a short period a STXM located at a bending
magnet of the BESSY-I facility. This group is now developing a new
STXM and a new full-®eld transmission X-ray microscope (TXM),
which are both located at the same undulator at BESSY-II (Gutt-
mann et al., 2001). Scanning X-ray microscopes at higher photon
energy have been implemented at the Advanced Photon Source
(McNulty et al., 1998) and at the European Synchrotron Radiation
Facility (Kaulich et al., 1999). Several scanning photoemission
microscopes (SPEM) have been built at a number of facilities. These
SPEMs could be used, but are not optimized, for transmission
experiments (Ade et al., 1990; Ko et al., 1995, 1998; Marsi et al., 1997;
Ng et al., 1994; Shin & Lee, 2001; Welnak et al., 1995).
2. Instrument description: the 5.3.2 and 7.0 STXMs at the ALS
2.1. Technical goals and requirements
The new ALS STXMs will be used almost exclusively for NEXAFS
spectromicroscopy. This requires energy scanning and continuous
refocusing. Prior experience showed that post-processing of data via
image-correlation techniques does not always eliminate the run-out
or drift that occur during data acquisition of image sequences, the
result being residual spatial degradation (Hitchcock et al., 2003).
Some correlation algorithms can be unreliable, and tedious manual
image registration may be required. Our goal is to acquire data in a
sequence of photon energy values in registry at the spatial-resolution
limit of the microscope. Run-out has to be eliminated at the hardware
level or automatically compensated for during data acquisition. In
addition, in order to eliminate systematic image shifts as the focal
length is changed, the microscope mechanical reference system has to
be precisely colinear with the optical axis de®ned by the X-ray beam.
Low run-out and component colinearity mean that high-quality
spectroscopic information from a few speci®c locations in the sample
is immediately availability to the instrument operator, and thus the
ef®ciency and productivity of the instruments are improved.
Although the mechanical design of these two new microscopes at
the ALS differs in some ways, they share the same basic concepts and
components. The main new feature is the differential measurement of
the relative position of the zone plate and the sample, which greatly
improved the run-out of the new microscopes compared with that of
the old 7.0 STXM. The 5.3.2 STXM is described here in detail. Some
of the differences of the 7.0 STXM are pointed out.
2.2. System components
The following major system components have been incorporated:
zone-plate z stage; OSA x, y stages; sample x, y coarse stage; sample
x, y ®ne piezo stage; sample z stage; detector x, y, z stage; inter-
ferometer system; mounting platform; passive vibration isolation to
the ¯oor and vacuum/He enclosure. The arrangement and stacking of
these stages is shown schematically in Fig. 2. Fig. 3 shows three-
dimensional CAD drawings of the 5.3.2 STXM. Annotated photo-
graphs of the instrument as implemented at beamline 5.3.2 are shown
in Fig. 4.
J. Synchrotron Rad. (2003). 10, 125±136 A. L. D. Kilcoyne et al. � Microscopes at the Advanced Light Source 127
research papers
Figure 2Schematic of the 5.3.2 STXM components.
electronic reprint

research papers
128 A. L. D. Kilcoyne et al. � Microscopes at the Advanced Light Source J. Synchrotron Rad. (2003). 10, 125±136
2.3. Mounting platforms and vibration control
Traditional air±table vibration-reduction systems are low-
frequency oscillators that isolate a heavy table from ¯oor vibrations
at frequencies above the lowest rigid-body mode, which typically
resonates at about 1 Hz. These systems are soft and can easily be
moved by external forces. Such systems will not maintain the long-
term angular alignment that is required with respect to the optical
axis.
Rather than isolate the instruments from ¯oor vibrations, we have
built these microscopes on a rigid polymer composite base ± referred
to as polymer granite or polymer concrete (Zanite, Precision Polymer
Casting) ± that avoids resonant ampli®cation at low frequencies. The
top surface of the polymer-granite block moves with the ¯oor. The
microscopes themselves are built so that only a small fraction of this
amplitude (typically 10 nm) shows up as problematic transverse
vibration of the zone-plate lens relative to the sample. A multi-tier
approach has been implemented. An inner mounting base plate for
the STXM (see Fig. 3) is supported by a high-stiffness six-strut
adjustable support system (Thur et al., 1997) mounted on the heavy
polymer-granite block. This support system allows the adjustment of
three translation and three angular degrees of freedom in order to
accurately position the whole microscope and hence the zone plate
and its translation axis with respect to the optical axis. The zone plate
and sample are mounted from this `inner' base plate with the set of
stages as depicted in Figs. 2 and 3.
A vacuum vessel is employed,
which covers the instrument without
transmitting vacuum forces to the
alignment mechanism and the
aligned components inside and
without transmitting vibrations of
the beamline components to the
instrument. The chamber seals to a
metal plate embedded into the top
of the granite, and this plate does
not move or de¯ect in any appreci-
able way as the pressure is changed.
The ALS ¯oor vibrations have a
pronounced 110 Hz component. An
attempt was thus made to keep
resonance frequencies of all
components above 130 Hz. The
polymer-granite block, which weighs
about 1200 kg, is supported on the
¯oor by four 2 inch-thick poly-
styrene-foam pads. The foam has
suf®cient strength and long-term
stability to support the massive
block yet provides for some passive
damping of vibrations. The 5.3.2
STXM six-strut support system uses
0.75 inch turnbuckle struts, with a
stiffness of 52 N mmÿ1 each, in a
con®guration that provides the most
stiffness in the y direction (three
struts), a medium stiffness in the x
direction (two struts) and the least
stiffness in the z direction (one
strut). This stiffness is matched to
the relative magnitude of the hori-
zontal (x) and vertical (y) vibrations
in the ¯oor, as well as the relative
tolerance of the microscope to these
vibrations: x, y has a tolerance of
10 nm (one-quarter of the transverse
resolution), while z has a tolerance
of about 100 nm (one-quarter of the
longitudinal resolution). The three
struts in the y direction that support
the 180 kg microscope result in a
resonant frequency of about 150 Hz.
The BL7.0 STXM is lighter and uses
0.5 inch turnbuckle struts in a
slightly different con®guration.Figure 4Photographs of the STXM at beamline 5.3.2.
Figure 3Annotated CAD drawings of the instrument at beamline 5.3.2.
electronic reprint

2.4. Translation stages
All translation stages of the 5.3.2 STXM have been selected for
stiffness, range and accuracy, with much emphasis placed on stiffness.
The sample z stage is a large dovetail slide with a planetary roller-
bearing spindle (Cleveland GmbH). This slide is used to retract the
scanner assembly and the pre-aligned detector for sample installa-
tion. The sample z stage is also used to position the sample surface
about 200 mm downstream of the OSA. The sample x and y coarse
scan stages were also chosen for high stiffness (UTM25 and UZM160,
respectively, from Newport). The zone-plate z stage is a small high-
precision crossed-roller-bearing stage (M-126, Polytech PI) that is
chosen for minimum run-out and for high stiffness with excellent
vibration properties. This z stage is moved or scanned as the photon
energy is changed. The OSA x and y stages and the detector x, y and z
stages are less critical (MFN series from Newport).
The sample x, y piezo ®ne scan stage for the 5.3.2 microscope was
chosen for its 200 mm range and load capacity (P-527.3CL from
Physik Instrumente). Even at the relatively high load of 500 g, the
resonance frequency as speci®ed by the manufacturer is 190 Hz, well
above the resonance frequency of the stacked mechanical stages on
which the piezo scanner is carried from the common base mounting
plate. A smaller, lighter, 100 mm-range piezo stage (P-517.2CL from
Physik Instrumente) was chosen for the BL7.0 STXM because of the
higher speed requirements of that microscope.
Details of the geometrical arrangement in the 5.3.2 STXM of the
zone plate, OSA, sample mounting and detector in relation to each
other and to their translation stages are shown from three perspec-
tives in Fig. 4. The optical path from the detector to the Si3N4 exit
window (not shown) of the UHV vacuum section, which is 0.5 mm
upstream of the zone plate, is about 3.5 mm.
2.5. Interferometer
Direct interferometric differential measurement of the position of
the zone plate with respect to the sample is implemented in both
STXMs, in order to meet the above-mentioned requirements for
linearity, run-out and orthogonality.1 Two Agilent Technologies
10719 A differential interferometers with 10889B PC Servo-Axis
Boards (5.3.2), or with 10897B VME interferometer controllers (7.0),
are used with the mirrors mounted to the sample and zone-plate
carriers, respectively (see Fig. 3). The precision of this combination is
2.5 nm (least signi®cant count). The orthogonality of the scan can be
tuned by adjusting the sample mirror mounts. The peak-to-peak
deviation from ¯atness of the mirrors is about 20 nm. The laser
interferometer is integrating over deviations from ¯atness within its
3 mm-diameter beam, effectively averaging any small deviations from
¯atness over the much smaller image scan. Hence, once the mirrors
are aligned, the transverse motion of the laser beam along the mirrors
introduces neither image distortion nor appreciable run-out. The use
of closed-loop piezo stage motion with a differential interferometer
as a feedback is a major reason for the excellent performance of the
5.3.2 STXM.
After the axis of the zone-plate z-translation stage has been
aligned to the optical axis by aligning the whole microscope via the
struts, the reference mirrors on the zone-plate z carrier can be tilted
with adjustment screws such that the optical axis lies in a plane
parallel to each mirror surface. In practice, the ®nal angular adjust-
ment of these mirrors with respect to the optical axis is more readily
accomplished with the six-strut support system.2
Other bene®cial characteristics of the interferometer are linear and
equal image magni®cation in the x and y directions with orthogonal
x, y axes. These magni®cation characteristics will aid the direct
comparison of images from samples that have been rotated and hence
the derivation of quantitative linear dichroic ratios. If such images
from rotated samples cannot be made congruent, artifacts are
introduced when calculating ratio or difference images.
The laser interferometer allows the direct measurement of the
relative vibration of the zone plate and the sample. Ambient vibra-
tions of the zone plate relative to the sample are seen with typical
amplitudes of tens of nm. When the interferometer is operated in a
closed-loop mode, vibrations in both scan directions can be reduced
to about 10 nm peak-to-peak. A typical measurement is displayed in
Fig. 5. This measurement shows that the dominant modes have a few
well de®ned frequencies. These results suggest that the performance
of the microscopes should depend only on the quality of the zone
plate and the illumination conditions provided by the beamline.
These measurements also show that the 5.3.2 microscope, with closed-
loop control, is ready to use zone plates with spatial resolution better
than 20 nm.
The implementation of a laser interferometer also provides for a
continuous absolute coordinate system with a ®eld of view of over
20 mm. This makes the operation and selection of the coarse and ®ne
motion transparent to the operator. The operation is entirely under
computer control. The large-®eld absolute coordinate system is also
integral to a pre-indexing system based on visible-light microscopy.
Areas of interest on a sample can be selected with a high-quality
visible-light microscope, and the coordinates can be stored under
computer control for later use. After sample transfer to an identical
sample mount with a transfer accuracy of about 20±30 mm, the areas
of interest can be recalled by the operator and easily found.
2.6. Interface electronics and GUI for 5.3.2 STXM
Fig. 6 is a simpli®ed schematic of the 5.3.2 control system. The
differential interferometers (x and y) measure the transverse position
J. Synchrotron Rad. (2003). 10, 125±136 A. L. D. Kilcoyne et al. � Microscopes at the Advanced Light Source 129
research papers
Figure 5Ambient vibrations (left) and power spectrum (right) of the relative positionof the zone plate and sample of the 5.3.2 STXM measured with theinterferometer. Top: x axis. Bottom: y axis.
1 We considered using a monolithic stage for the refocusing translation withweak links that have virtually no run-out. Besides the dif®culty of developingsuch stages with motion over 3 or even 5 mm as required, they would haveinvolved a long mechanical coupling between the sample and the X-ray opticsand their use would have most likely resulted in long-term drift.
2 The resultant small misalignment of the z-translation stage results in a smalldisplacement of the zone plate relative to the OSA as the energy is scanned.The effect is very small and can be readily tolerated.
electronic reprint

research papers
130 A. L. D. Kilcoyne et al. � Microscopes at the Advanced Light Source J. Synchrotron Rad. (2003). 10, 125±136
of the sample with respect to the zone-plate lens by means of mirrors
attached to these components. The interferometers provide an
accurate real-time measurement of the location of the X-ray spot on
the sample. Digital signals from the interferometers are used to servo
the piezo-scanning stage, in order to eliminate drift and vibrations
under static conditions, and to servo the image coordinates during
closed-loop scanning
The 10889B PC servo-controller cards were designed to control
servo motors. These cards were found to work very well in our
unusual application of using the 10889B analog control voltage for
the piezo stage in closed-loop mode using the interferometer as
feedback. This servo-controller provides full motion control with
adjustable dead band, proportional-integral-differential (PID) and
feed-forward parameters. The servo-loop on this board works with a
selectable update frequency of up to 20 kHz. This high sampling
frequency makes vibration reduction possible. The servo-loop inside
the piezo controller is disabled since this loop uses capacitance
position sensors inside the stage that cannot detect vibrations and
drift of the structure or run-out of the z stage. The interferometer/
piezo-stage servo-loop is opened when the sample is moved with the
sample x, y coarse stages. The loop is closed after the move in order to
servo the stage to the new interferometer values. In this way an
accurate and universal coordinate system is available over the entire
®eld of view, which extends for tens of millimetres.
The typical scan mode records images one line at a time. The piezo
stage is moved with a constant velocity; buffered acquisition and
synchronization of the channel advance is used, and the velocity of
the piezo stage is set so as to achieve the desired per-pixel dwell.
During the scan of each line, the starting point is positioned a suf®-
cient distance before the user-de®ned start-of-line to allow for stage
acceleration. The servo-axis controller outputs a signal when the
piezo stage is at the desired ®rst-point position and thus starts the
buffered and timed acquisition. While this method provides adequate
precision at the current spatial resolution, we are developing an
improved scheme that will provide on-the-¯y use of the inter-
ferometer signal to gate the acquisition at an accurate position at
each pixel.
The system is capable of acquiring up to four counting channels,
each 32 bit deep, and eight bipolar analog channels, with per-pixel
dwells (time for all signals) as short as 100 ms. Owing to the time
needed to decelerate, stop, return to start and re-accelerate the
relatively massive piezo stage, the duty cycle for very fast acquisitions
is much less than this point-to-point rate suggests. For a typical
10 � 10 mm scan, the time overhead for the ¯y-back and acceleration
factors is about 200 ms per line. Thus, if the image is acquired with
200 pixels per line (i.e. a point spacing of 50 nm), this is equivalent to
a 1 ms per pixel overhead. Implementation of point-by-point on-the-
¯y digital feedback will allow us to use bi-directional scanning, which
will decrease the time not used for signal acquisition and improve the
duty cycle.
The 5.3.2 STXM is operated through a single computer that
controls all instrument and beamline parameters. The user interface
controls 12 dimensions of motion of the various microscope stages
(ZP, OSA, sample, detector), along with four aspects of the mono-
chromator (grating angle, entrance slit, and horizontal and vertical
exit-slit dimensions) and a fast-acting (1 ms open±close time) in-
vacuum shutter. The latter is usually run in an automatic mode that
closes the shutter at all times (including during the acceleration stage
of each line in image-scan mode) except during data acquisition.
Closing the shutter is essential to avoid unnecessary damage to
radiation-sensitive samples. The computer is a dual-processor system
running under the Windows 2000 operating system. Optimization of
the number and contents of separate threads of the code is critical in
order to achieve high performance without memory leakage and
memory addressing collisions. A separate dedicated computer
continuously optimizes the signals at the entrance and exit slits of the
beamline via a feedback loop to two piezo transducers that control
the angular ®ne adjustment of the toroidal M1 mirror of the beam-
line.
Ten translation stages are operated through two Newport universal
controllers (ESP) that are computer interfaced with USB lines. The
main sample z stage is controlled by a conventional serial port. The
pulse counting and analog acquisition is achieved through a National
Instruments counter (PCI 6602) and multi-function I/O card (PCI
MIO-16XE-10).
The control and acquisition software is designed to give the user
full access to all motions of the instrument (microscope and beam-
line). The software has a ¯exible scan engine that allows single and
multi-dimensional axis scanning using similar user interfaces. At the
same time the GUI is structured so that only information necessary to
the current task is provided to the user to avoid information overload.
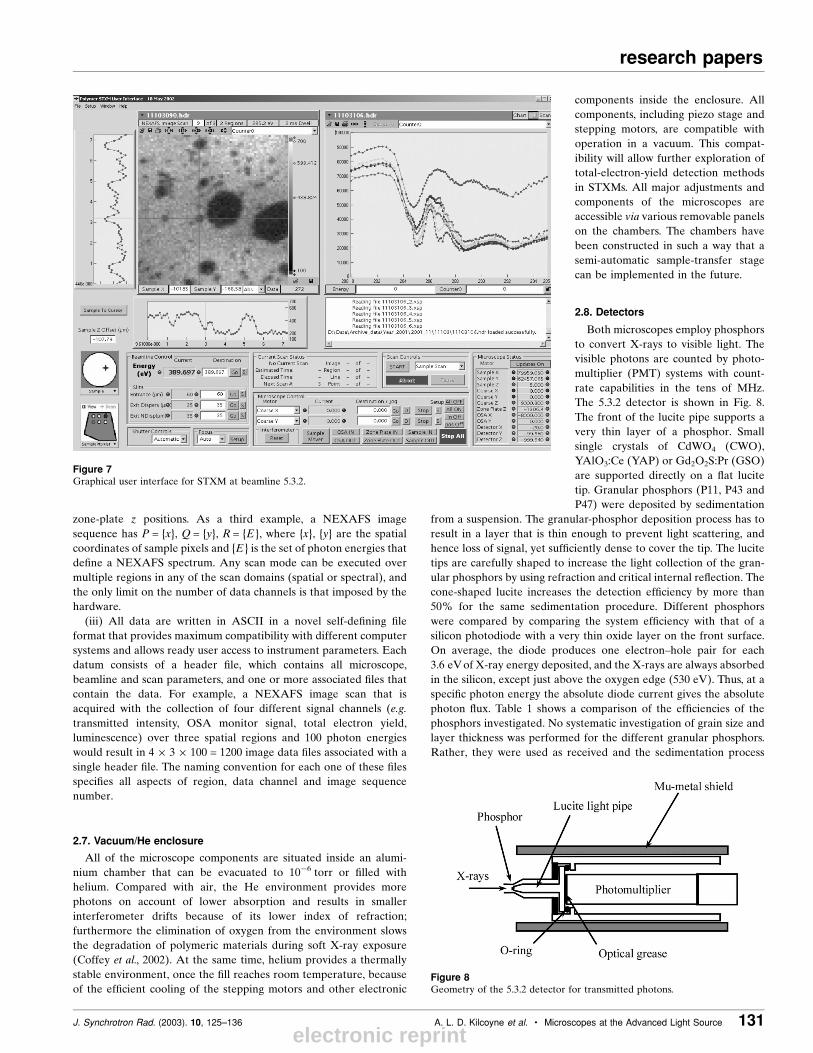
The front panel during image acquisition is shown in Fig. 7. Since
spectromicroscopy involves a balanced use of the spectral and spatial
domains, this panel gives equal weight to image and spectral
presentation and manipulation. Novel aspects of the software
include:
(i) Custom two-dimensional graph code that provides high-quality
image presentation with updates of only the new information to avoid
the overhead associated with full-screen rewrites.
(ii) Abstraction of the referencing and storage of the scan axes. The
control aspects of all scan modes and associated data ®les are three-
dimensional, with P, Q and R axes assigned as needed to speci®c axes.
Thus an image has P = {x}, Q = {y}, R = E, where {x}, {y} are the
spatial coordinates of sample pixels (which can be de®ned arbitrarily)
and E is the photon energy. A focus scan has P = {x}, Q = {y},
R = {ZP ÿ z}, where {x}, {y} are the spatial coordinates of a line
across a contrast feature of the sample and {ZP ÿ z} is a sequence ofFigure 6Scheme of the control system for STXM at beamline 5.3.2.
electronic reprint
zone-plate z positions. As a third example, a NEXAFS image
sequence has P = {x}, Q = {y}, R = {E }, where {x}, {y} are the spatial
coordinates of sample pixels and {E } is the set of photon energies that
de®ne a NEXAFS spectrum. Any scan mode can be executed over
multiple regions in any of the scan domains (spatial or spectral), and
the only limit on the number of data channels is that imposed by the
hardware.
(iii) All data are written in ASCII in a novel self-de®ning ®le
format that provides maximum compatibility with different computer
systems and allows ready user access to instrument parameters. Each
datum consists of a header ®le, which contains all microscope,
beamline and scan parameters, and one or more associated ®les that
contain the data. For example, a NEXAFS image scan that is
acquired with the collection of four different signal channels (e.g.
transmitted intensity, OSA monitor signal, total electron yield,
luminescence) over three spatial regions and 100 photon energies
would result in 4 � 3 � 100 = 1200 image data ®les associated with a
single header ®le. The naming convention for each one of these ®les
speci®es all aspects of region, data channel and image sequence
number.
2.7. Vacuum/He enclosure
All of the microscope components are situated inside an alumi-
nium chamber that can be evacuated to 10ÿ6 torr or ®lled with
helium. Compared with air, the He environment provides more
photons on account of lower absorption and results in smaller
interferometer drifts because of its lower index of refraction;
furthermore the elimination of oxygen from the environment slows
the degradation of polymeric materials during soft X-ray exposure
(Coffey et al., 2002). At the same time, helium provides a thermally
stable environment, once the ®ll reaches room temperature, because
of the ef®cient cooling of the stepping motors and other electronic
components inside the enclosure. All
components, including piezo stage and
stepping motors, are compatible with
operation in a vacuum. This compat-
ibility will allow further exploration of
total-electron-yield detection methods
in STXMs. All major adjustments and
components of the microscopes are
accessible via various removable panels
on the chambers. The chambers have
been constructed in such a way that a
semi-automatic sample-transfer stage
can be implemented in the future.
2.8. Detectors
Both microscopes employ phosphors
to convert X-rays to visible light. The
visible photons are counted by photo-
multiplier (PMT) systems with count-
rate capabilities in the tens of MHz.
The 5.3.2 detector is shown in Fig. 8.
The front of the lucite pipe supports a
very thin layer of a phosphor. Small
single crystals of CdWO4 (CWO),
YAlO3:Ce (YAP) or Gd2O2S:Pr (GSO)
are supported directly on a ¯at lucite
tip. Granular phosphors (P11, P43 and
P47) were deposited by sedimentation
from a suspension. The granular-phosphor deposition process has to
result in a layer that is thin enough to prevent light scattering, and
hence loss of signal, yet suf®ciently dense to cover the tip. The lucite
tips are carefully shaped to increase the light collection of the gran-
ular phosphors by using refraction and critical internal re¯ection. The
cone-shaped lucite increases the detection ef®ciency by more than
50% for the same sedimentation procedure. Different phosphors
were compared by comparing the system ef®ciency with that of a
silicon photodiode with a very thin oxide layer on the front surface.
On average, the diode produces one electron±hole pair for each
3.6 eV of X-ray energy deposited, and the X-rays are always absorbed
in the silicon, except just above the oxygen edge (530 eV). Thus, at a
speci®c photon energy the absolute diode current gives the absolute
photon ¯ux. Table 1 shows a comparison of the ef®ciencies of the
phosphors investigated. No systematic investigation of grain size and
layer thickness was performed for the different granular phosphors.
Rather, they were used as received and the sedimentation process
J. Synchrotron Rad. (2003). 10, 125±136 A. L. D. Kilcoyne et al. � Microscopes at the Advanced Light Source 131
research papers
Figure 7Graphical user interface for STXM at beamline 5.3.2.
Figure 8Geometry of the 5.3.2 detector for transmitted photons.
electronic reprint

research papers
132 A. L. D. Kilcoyne et al. � Microscopes at the Advanced Light Source J. Synchrotron Rad. (2003). 10, 125±136
was repeated for each phosphor until a uniform ®lm was formed. The
detector system may thus not be optimized yet, and our results re¯ect
what can be achieved readily. P43 was chosen for both microscopes. It
has no appreciable long-lived emission, which would otherwise cause
streaking in images.
The detector system ef®ciency versus photon energy of a detector
with P43 phosphor is shown in Fig. 9. The dependence of the ef®-
ciency on photon energy varies somewhat between deposited ®lms.
Fig. 10 shows the count-rate capability of a P43 detector. The detector
system is linear up to about 5 MHz of detected photons and only
marginally nonlinear below 10 MHz. At higher photon rates the
deadtime of the counting electronics becomes signi®cant. The linear
range of these detectors is suf®cient for the count rates at the
bending-magnet beamline 5.3.2. Nonlinearity, however, can be an
issue for the higher count rates that are possible with an undulator
beamline.
The mu-metal shielding of the PMT is extended towards the
sample and together with the sample mount serves as an effective
visible-light baf¯e against scattered laser light from the inter-
ferometer. The typical dark count rate is less than 200 Hz. Compared
with the signal, this value is very small and does not cause any
spectral distortions, even for samples that are several optical densities
thick.
2.9. Suppression of higher-order spectral contamination
The spectroscopic performance of the microscopes is degraded by
the presence of higher-order photons ± those at multiples of the
selected photon energy. Typical soft X-ray monochromator diffrac-
tion gratings produce second- and third-order diffraction of photons
with twice and three times the desired energy with 2±10% of the
ef®ciency of the ®rst order. A bending-magnet STXM is potentially
rather sensitive to higher-order spectral contamination because of the
intrinsically higher ¯ux of the bending magnet at higher energies in
the energy range of interest, the higher ef®ciency of the detector with
photons with higher energy, and the increased penetration of higher-
energy photons through the thin Si3N4 membranes used to support
the zone plate and for the exit window. Fortunately, an amplitude
zone plate with a 1:1 mark-to-space ratio has a second-order
diffraction ef®ciency close to zero. In reality, there is always some
higher diffraction order intensity, but it can be very small. With
proper positioning of the zone plate and the OSA, this results in a
relatively effective suppression of second-order spectral contamina-
tion. Furthermore, the grating groove depth at beamline 5.3.2 was
chosen to optimize the diffraction ef®ciency for 320 eV photons, thus
depressing higher-order spectral contamination over much of the
important 280±420 eV energy range. For experiments near the carbon
K-edge, any residual second-order light can be effectively and
conveniently suppressed with a nitrogen-gas ®lter (Winesett & Ade,
1997; originally only an oxygen ®lter was explored ± it was later
realized that nitrogen is a superior ®lter for work near the carbon
edge). Second-order suppression by a factor of 10 has been achieved
with a modest reduction in ¯ux of about 50%. Reduced re¯ectivity of
grazing-incidence optics in the beamline at high photon energy
reduces third-order spectral contamination. For working energies
between 250 and 660 eV, third-order light can be attenuated parti-
cularly well by nickel coatings on the optics. This approach works well
at beamline 5.3.2, which is not intended for use at energies above
600 eV.
3. Results
3.1. Spatial resolution
The 5.3.2 beamline follows design principles developed at beamline
X1A at the NSLS (Winn et al., 2000) and provides very ¯exible
illumination (Warwick et al., 2002). Because of the large phase space
available at a bending magnet, independent control over a relatively
large range of the zone-plate illumination parameter (p) and resol-
ving power (E/�E ) has been achieved. For typical operating condi-
tions the resolving powers at the carbon, nitrogen and oxygen edges
Figure 9Ef®ciency of 5.3.2 P43/PMT counting system versus photon energy. Somevariation occurs from one coating to another.
Figure 10Linearity and non-linearity of the 5.3.2 P43/PMT detector system at high countrates. The fast pre-amp was divided by 10.
Table 1Ef®ciency of the PMT-based soft X-ray detector system with differentphosphors at 390 eV.
Count rate with 60 mm entrance, 35 mm vertical exit and 35 mm horizontal exitslits, scaled to 400 mA stored electron current. CdWO4, YAlO3:Ce andGd2O2S:Pr single crystals are approximately 100 mm thick.
Phosphor Ef®ciency (%) Count rate (MHz)
P43 ¯at 27.3 14P43 cone 41.0 21P11 ¯at 12.8 6.56P47 ¯at 6.9 3.54CdWO4 9.2 4.7YAlO3:Ce 5.9 3Gd2O2S:Pr 6.4 3.3
electronic reprint

are in excess of 2000 but can be improved to greater than 5000
(Warwick et al., 2002). For high-spatial-resolution imaging, an illu-
mination parameter (Winn et al., 2000) of between p = 0.5 and p = 1 is
selected, which corresponds (at 310 eV) to exit slits of 10 and 20 mm
and to half-Airy-disk and full-Airy-disk illumination criterion,
respectively. Various test patterns fabricated in Au with electron-
beam lithography techniques and supported on Si3N4 membranes
have been imaged with a 180 mm-diameter zone plate with an
outermost zone width of 40 nm and a central stop of 80 mm. Results
from periodic features with a 1:1 line-to-space ratio are displayed in
Fig. 11. Features as small as 30 nm half period can be resolved. The
contrast for 40 nm and 30 nm features is 24% and 11%, respectively.
These results are as good as can be expected with this zone plate. The
microscope is limited neither by mechanical vibrations nor by the use
of the laser interferometer. The total overhead time of the image scan
is about 1 ms pixelÿ1, which is similar to the dwell time used for
navigation (typically < 1 ms pixelÿ1) but is small compared with that
used for high-quality images (typically 3±5 ms pixelÿ1) or spectra
(typically 30 ms pointÿ1). No astigmatism could be detected. Both
horizontal and vertical features on the elbow test pattern displayed in
Fig. 11 were in focus at the same z location. Opening the vertical and
horizontal exit slits greatly increases the intensity, at some cost in
spatial and spectral resolution. An extreme case is p = 4 and
E/�E = 1500, for which count rates in excess of 20 MHz could be
achieved at the carbon K-edge while features 120 nm in size could
still be resolved. All images, including those in Figs. 11 and 12, exhibit
orthogonal linear magni®cation.
For quantitative NEXAFS analysis it is important that there be
negligible unfocused light. Images of small (10 mm diameter) pinholes
have been acquired in order to verify the effective blocking of the
zone-plate zero order and the absence of higher-order light from the
beamline at higher energy. The contrast in these images from bright
(pinhole) to dark (periphery of pinhole) is shown in Fig. 12. The
integrated intensity of unfocused light at beamline 5.3.2 is typically
less than 0.5% of the intensity of the zone-plate ®rst-order focal spot.
3.2. Image sequences, point and line spectra
The interferometer servo-control of run-out works in both the x
and the y direction. Image sequences (`stacks') register, one to
another, with very little spatial jitter. In order to demonstrate the
precision of the registration, a sequence of images of a high-contrast
test object (the 10 mm-diameter pinhole) was analysed to extract
quantitative shifts. This test `stack' is a sequence of 31 images taken
with varying photon energy from 360 to 390 eV, with the zone plate
translating longitudinally over a total distance of 175 mm to stay in
focus. A range of 175 mm is suf®cient for a NEXAFS scan at the
carbon, nitrogen, and oxygen edges. Fig. 13 shows the residual
alignment shifts in x and y from image to image of the sequence.
These values were derived by tracking shifts in the peak of the two-
dimensional Fourier transform of images of an Au test pattern
(Jacobsen et al., 2000). High-frequency run-out is controlled to about
20 nm. Residual, still to be corrected, misalignment in the y direction
amounts to less than 40 nm. If the interferometer is properly aligned,
it will be possible to acquire images sequences, line scans and point
spectra without degradation in spatial resolution. The long-term
stability of this interferometer alignment in response to heavy use by
many different researchers is still being assessed.
With demonstrably small transverse shifts as the zone-plate moves,
NEXAFS spectra from small areas near the resolution limit can be
extracted from image sequences without post-acquisition re-regis-
tration. Spectra can also be acquired in `point' or `line' mode. In
`point' mode the transmitted ¯ux is measured with the microscope
pointed to speci®c spatial features at each energy. In `line' mode a line
is scanned in the xy plane and the transmitted intensity is measured
on the line at each value of photon energy. The `line' mode is useful if
the sample has a transition from one chemical state in one region to a
different state in another region. Fig. 14 shows spectra acquired from
J. Synchrotron Rad. (2003). 10, 125±136 A. L. D. Kilcoyne et al. � Microscopes at the Advanced Light Source 133
research papers
Figure 12STXM image of a 10 mm-diameter pinhole acquired at 390 eV showingnegligible halo. (Image displayed on optical density scale. Line scan fromlocation indicated by cross-hair in image.)
Figure 11Images of test patterns and their contrast. Acquired with STXM at beamline5.3.2. Top left: Berkeley logo and sequence of dots whose sizes range from250 nm down to 75 nm. Bottom left: 30 nm angular features with 1:1mark:space ratio. Right side: line pro®les of periodic structures with featuresize and mark:space ratio as indicated.
electronic reprint

research papers
134 A. L. D. Kilcoyne et al. � Microscopes at the Advanced Light Source J. Synchrotron Rad. (2003). 10, 125±136
a point on a polyurethane that contains styrene-r-acrylonitrile (SAN)
and polyisocyanate polyaddition (PIPA) ®ller particles. The three
chemical constituents ± polyurethane matrix, SAN and PIPA ± can be
differentiated by their NEXAFS spectra. Spectra are measured
cleanly down to the smallest particles, which are about 200 nm. In
addition to eliminating problems of drifting of point positions that
plagued previous STXMs, the results plotted in Fig. 14 demonstrate
the ability of the interferometrically controlled system to address
desired features to better than 200 nm spatial precision.
Line-mode results are displayed in Fig. 15. The transmitted signal is
recorded while a line trajectory is scanned across the sample at each
value of the photon energy through the NEXAFS spectrum. Optical
density is derived from the transmitted intensity and plotted versus
photon energy (x axis) and distance along the line (y axis). Thanks to
interferometer control the line across the sample is scanned at
precisely the same trajectory and thus the spectra of chemically
distinct regions along the line are seen as horizontal stripes in the
`line' spectral image (Fig. 15).
Figure 13Residual alignment shifts in a servo-controlled image sequence with the 5.3.2STXM. The shifts are extracted from correlation analysis of the imagesequence (see text).
Figure 14NEXAFS spectra extracted from speci®c points in the sample. Navigation tothese points at each value of the photon energy is under interferometer servocontrol. Two organic polymer species (SAN, PIPA) can be identi®ed to particlesizes as small as about 200 nm.
Figure 15Line spectra obtained along a line in the sample, scanned under servo controlat each value of the photon energy. The two-dimensional plot shows theoptical density measured along the line versus the photon energy. Spectra arehorizontal cuts across the two-dimensional plot.
electronic reprint

4. Conclusion
The laser interferometer-controlled instruments described here
represent a qualitatively new design that has improved the capabil-
ities of soft X-ray STXM technology and, in particular, the facilities at
the ALS. The approach that we present provides for highly ef®cient
data acquisition and minimizes data analysis and post-processing.
Avoiding the use of active vibration isolation provides stable long-
term positional and angular alignment with the X-ray beam. Small-
amplitude vibrations of the zone plate with respect to the sample
have been achieved. We observe only 10 nm peak-to-peak vibrations
when the interferometer servo-loop is active. This result shows that
the hardware of these microscopes is ready to take advantage of the
zone-plate improvements that are anticipated in the near future and
maybe even over the next decade.
The absolute accurate coordinate system based on the laser
interferometer has made the distinction between coarse and ®ne
motion transparent to the experimenter without introducing artifacts.
Accommodation of accurate visible-light pre-indexing of the samples
further enhances the ef®ciency of the 5.3.2 microscope.
The successful operation of a STXM at bending-magnet beamline
5.3.2 has signi®cant implications. The ability to operate a STXM
successfully at a bending-magnet beamline signi®cantly lowers the
overall costs for these instruments. In addition, the 5.3.2 STXM is the
only STXM with dedicated illumination, so that it is available for
STXM experiments whenever electrons are stored in the ALS ring.
The gas ®lter for higher-order spectral suppression at 5.3.2 can be
easily tuned by controlling the pressure; the retuning has no impact
on the alignment or performance of the optical system.
A new dedicated beamline, BL11.0, which uses an elliptically
polarized undulator as its source, is under construction. This beam-
line will add signi®cant new capabilities by allowing control over the
polarization (rotating linear as well as left/right circular). The 7.0
STXM is scheduled to move to BL11.0 in the fall of 2002.
We are grateful for the invaluable contributions made by Tim
Harvell and Frank Milkowski from the NCSU machine shop, and
Frank Zucca, John Pepper and Steve Klingler from the ALS vacuum
group. Discussion with C. Jacobsen, J. Kirz, H. Padmore and C. Zimba
contributed to developing the conceptual design. We thank M.
Howells for discussions about the possibilities and limitations of
monolithic stages with low run-out; I. Koprinarov for help with the
selection of the visible-light indexing microscope; and C. Jacobsen
and J. Kirz for commenting on the manuscript. This work was
supported by NSERC, the Canada Research Chair program, Dow
Chemical, DOE (DE-FG02-98ER45737) and NSF (DMR-9975694).
References
Ade, H. & Hsiao, B. (1993). Science, 262, 1427±1429.Ade, H., Kirz, J., Hulbert, S. L., Johnson, E. D., Anderson, E. & Kern, D.
(1990). Appl. Phys. Lett. 56, 1841±1843.Ade, H., Smith, A. P., Cameron, S., Cieslinski, R., Mitchell, G., Hsiao, B. &
Rightor, E. (1995). Polymer, 36, 1843±1848.Ade, H. & Urquhart, S. (2002). Chemical Applications of Synchrotron
Radiation, edited by T. K. Sham. Singapore: World Scienti®c.Ade, H., Zhang, X., Cameron, S., Costello, C., Kirz, J. & Williams, S. (1992).
Science, 258, 972.Anderson, E. H., Olynick, D. L., Harteneck, B., Veklerov, E., Denbeaux, G.,
Chao, W. L., Lucero, A., Johnson, L. & Attwood, D. (2000). J. Vac. Sci.Technol. B, 18, 2970±2975.
Botto, R. E., Cody, G. D., Kirz, J., Ade, H., Behal, S. & Disko, M. (1994).Energy Fuels, 8, 151±154.
Buckley, C., Rarback, H., Alforque, R., Shu, D., Ade, H., Hellman, S.,Iskander, N., Kirz, J., Lindaas, S., McNulty, I., Oversluizen, M., Tang, E.,Attwood, D., DiGennaro, R., Howells, M., Jacobsen, C., Vladimirsky, Y.,Rothman, S., Kern, D. & Sayre, D. (1989). Rev. Sci. Instrum. 60, 2444±2447.
Cody, G. D., Ade, H., Wirick, S., Mitchell, G. D. & Davis, A. (1998). Org.Geochem. 28, 441±455.
Coffey, T., Urquhart, S. G. & Ade, H. (2002). J. Electron Spectrosc. Relat.Phenom. 122, 65±78.
Denbeaux, G., Anderson, E., Chao, W., Eimuller, T., Johnson, L., Kohler, M.,Larabell, C., Legros, M., Fischer, P., Pearson, A., Schultz, G., Yager, D. &Attwood, D. (2001). Nucl. Instrum. Methods A, 467/468, 841±844.
Feser, M., Carlucci-Dayton, M., Jacobsen, C., Kirz, J., NeuhaÈusler, U., Smith,G. & Yu, B. (1998). Proc. SPIE, 3449, 19.
Flynn, G. J., Keller, L. P., Midler, M. A., Jacobsen, C. & Wirick, S. (1998).Lunar and Planetary Science XXIX. Abstract #1156.
Guttmann, P., Niemann, B., Thieme, J., Hambach, D., Schneider, G.,Wiesemann, U., Rudolph, D. & Schmahl, G. (2001). Nucl. Instrum.Methods A, 468, 849±852.
Hitchcock, A. P., Koprinarov, I., Croll, L. M., StoÈ ver, H. & Kneedler, E. M.(2003). In preparation.
Jacobsen, C., Kirz, J. & Williams, S. (1992). Ultramicroscopy, 47, 55±79.Jacobsen, C., Williams, S., Anderson, E., Brown, M. T., Buckley, C. J., Kern, D.,
Kirz, J., Rivers, M. & Zhang, X. (1991). Opt. Commun. 86, 351±364.Jacobsen, C., Wirick, S., Flynn, G. & Zimba, C. (2000). J. Microsc. 197, 173±184.Kaulich, B., Oestreich, S., Salome, M., Barrett, R., Susini, J., Wilhein, T.,
Fabrizio, E. D., Gentili, M. & Charalambous, P. (1999). Appl. Phys. Lett. 75,4061±4063.
Keller, L. P., Messenger, S., Flynn, G. J., Jacobsen, C. & Wirick, S. (2000).Meteoritics Planet. Sci. 35, A86±87.
Kenney, J. M., Morrison, G. R., Browne, M. T., Buckley, C. J., Burge, R. E.,Cave, R. C., Charalambous, P. S., Duke, P. J., Hare, A. R., Hills, C. P. B.,Michette, A. G., Ogawa, K. & Rogoyski, A. M. (1989). J. Phy. E Sci.Instrum. 22, 234±238.
Kim, S. K., Kortright, J. B. & Shin, S. C. (2001). Appl. Phys. Lett. 78, 2742±2744.Kirz, J., Ade, H., Jacobsen, C., Ko, C.-H., Lindaas, S., McNulty, I., Sayre, D.,
Williams, S., Zhang, X. & Howells, M. (1992). Rev. Sci. Instrum. 63, 557±563.
Kirz, J., Jacobsen, C. & Howells, M. (1995). Q. Rev. Biophys. 28, 33±130.Kirz, J. & Rarback, H. (1985). Rev. Sci. Instrum. 56, 1±13.Ko, C.-H., Kirz, J., Ade, H., Johnson, E., Hulbert, S. & Anderson, E. (1995).
Rev. Sci. Instrum. 66, 1416±1418.Ko, C.-H., Klauser, R., Wei, D. H., Chan, H. H. & Chuang, T. J. (1998). J.
Synchrotron Rad. 5, 299±304.McNulty, I., Frigo, S. P., Retsch, C. C., Wang, Y., Feng, Y. P., Qian, Y.,
Trakhtenberg, E., Tieman, B., Cha, B. C., Goetze, K., Mooney, T. &Haddad, W. S. (1998). Proc. SPIE, 3449, 67±74.
Marsi, M., Casalis, L., Gregoratti, L., GuÈ nther, S., Kolmakov, A., Kovac, J.,Lonza, D. & Kiskinova, M. (1997). J. Electron Spectrosc. Relat. Phenom. 84,73±83.
Maser, J., Osanna, A., Wang, Y., Jacobsen, C., Kirz, J., Spector, S., Winn, B. &Tennant, D. (2000). J. Microsc. 197, 68±79.
Michette, A. G. (1986). Optical Systems for Soft X-rays. New York/London:Plenum Press.
Mitchell, G. E., Wilson, L. R., Dineen, M. T., Urquhart, S. G., Hayes, F.,Rightor, E. G., Hitchcock, A. P. & Ade, H. (2002). Macromolecules, 35,1336±1341.
NeuhaÈusler, U., Abend, S., Jacobsen, C. & Lagaly, G. (1999). Colloid Polym.Sci. 277, 719±726.
Ng, W., Ray-Chaudhuri, A. K., Liang, S., Singh, S., Solak, H., Welnak, J.,Cerrina, F., Margaritondo, G., Underwood, J. H., Kortright, J. B. & Perera,R. C. C. (1994). Nucl. Instrum. Methods Phys. Res. A, 347, 422.
Plaschke, M., Rothe, J., Schafer, T., Denecke, M. A., Dardenne, K., Pompe, S.& Heize, K. H. (2002). Colloid Surface A, 197, 245±256.
Rarback, H., Kenney, J. M., Kirz, J., Howells, M. R., Chang, P., Coane, P. J.,Feder, R., Jouzego, P. J., Kern D. P. & Sayre, D. (1984). X-ray Microscopy,edited by G. Schmahl & D. Rudolf. Berlin: Springer.
Rarback, H., Shu, D., Feng, S. C., Ade, H., Kirz, J., McNulty, L., Kern, D.,Chang, T. H. P., Vladimirsky, Y., Iskander, N., Attwood, D., McQuaid, K. &Rothman, S. (1988). Rev. Sci. Instrum. 59, 52±59.
Rightor, E. G., Hitchcock, A. P., Ade, H., Leapman, R. D., Urquhart, S. G.,Smith, A. P., Mitchell, G., Fisher, D., Shin, H. J. & Warwick, T. (1997). J.Phys. Chem., B101, 1950±1960.
Schneider, G., Schliebe, T. & Aschoff, H. (1995). J. Vac. Sci. Technol. B, 13,2809.
Shin, H. J. & Lee, M. K. (2001). Nucl. Instrum. Methods Phys. Res. A, 467, 909.
J. Synchrotron Rad. (2003). 10, 125±136 A. L. D. Kilcoyne et al. � Microscopes at the Advanced Light Source 135
research papers
electronic reprint

research papers
136 Received 6 July 2002 � Accepted 27 September 2002 J. Synchrotron Rad. (2003). 10, 125±136
Shu, D., Siddons, D. P., Rarback, H. & Kirz, J. (1988). Nucl. Instrum. MethodsA, 266, 313±317.
Spector, S., Jacobsen, C. & Tennant, D. (1997). J. Vac. Sci. Technol. B, 15,2872±2876.
StoÈ hr, J. (1992). NEXAFS Spectroscopy. Berlin: Springer-Verlag.Thur, W., Lauritzen, T., DeMarco, R., Baldock, B. & Rex, K. (1997). Internal
Note LBNL-40963. Lawrence Berkeley National Laboratory, Berkeley,CA, USA.
Wang, Y., Jacobsen, C., Maser, J. & Osanna, A. (2000). J. Microsc. 197, 80±93.Warwick, T., Ade, H., Kilcoyne, A. L. D., Kritscher, M., Tylisczcak, T., Fakra,
S., Hitchcock, P., Hitchcock, A. P. & Padmore, H. A. (2002). J. SynchrotronRad. 9, 254±257.
Warwick, T., Franck, K., Kortright, J., Meigs, G., Moronne, M., Myneni, S.,Rotenberg, E., Seal, S., Steele, W. F., Ade, H., Garcia, A., Cerasari, S.,Denlinger, J., Hayakawa, S., Hitchcock, A. P., Tyliszczak, T., Kikuma, J.,
Rightor, E. G., Shin, H.-J. & Tonner, B. P. (1998). Rev. Sci. Instrum. 69,2964±2973.
Warwick, T., Meigs, G., Morisson, G. & Ade, H. (1999). ALS Internal NoteLSBL517. Advanced Light Source, Berkeley, CA, USA.
Welnak, J., Dong, Z., Solak, H., Wallace, J., Cerrina, F., Bertolo, M., Bianco, A.,Fonzo, S. D., Fontana, S., Jark, W., Mazzolini, F., Rosei, R., Savoia, A.,Underwood, J. H. & Margaritondo, G. (1995). Rev. Sci. Instrum. 66, 2273±2276.
Winesett, D. A. & Ade, H. (1997). X-ray Microscopy and Spectromicroscopy,edited by J. Thieme, G. Schmahl, E. Umbach & D. Rudolph. Berlin:Springer-Verlag.
Winn, B., Ade, H., Buckley, C., Feser, M., Howells, M., Hulbert, S., Jacobsen,C., Kaznacheyev, K., Kirz, J., Osanna, A., Maser, J., McNulty, I., Miao, J.,Oversluizen, T., Spector, S., Sullivan, B., Wang, Y., Wirick, S. & Zhang, H.(2000). J. Synchrotron Rad. 7, 395±404.
electronic reprint