A Differential Phase-Modulated Interferometer with Rotational ...
10
Citation: Yan, L.; Yan, Y.; Chen, B.; Lou, Y. A Differential Phase-Modulated Interferometer with Rotational Error Compensation for Precision Displacement Measurement. Appl. Sci. 2022, 12, 5002. https://doi.org/10.3390/ app12105002 Academic Editors: Xiuguo Chen, Guanhao Wu and Yuki Shimizu Received: 12 April 2022 Accepted: 12 May 2022 Published: 16 May 2022 Publisher’s Note: MDPI stays neutral with regard to jurisdictional claims in published maps and institutional affil- iations. Copyright: © 2022 by the authors. Licensee MDPI, Basel, Switzerland. This article is an open access article distributed under the terms and conditions of the Creative Commons Attribution (CC BY) license (https:// creativecommons.org/licenses/by/ 4.0/). applied sciences Article A Differential Phase-Modulated Interferometer with Rotational Error Compensation for Precision Displacement Measurement Liping Yan , Yucen Yan, Benyong Chen and Yingtian Lou * Precision Measurement Laboratory, Zhejiang Sci-Tech University, Hangzhou 310018, China; [email protected] (L.Y.); [email protected] (Y.Y.); [email protected] (B.C.) * Correspondence: [email protected] Abstract: In this paper, a differential phase-modulated interferometer (DPMI) is proposed to com- pensate for the rotational error for precision displacement measurement. In DPMI, a reference interferometer sharing the same reference arm with the measurement interferometer is constructed. Using the two interferometers to differentially measure the displacement, the unbalanced environ- mental disturbance on the measurement can be minimized. An integrated 2 × 2 array photodetector (APD) is adopted in DPMI. Based on APD with differential wavefront sensing (DWS) technology, the rotation angle can be detected and compensated. Therefore, precision displacement without rotational error and unbalanced environmental disturbance can be achieved. Three confirmatory experiments were performed, and the experimental results show that the maximum displacement drift is reduced from 902.9 nm to 16.3 nm in 100 min stability test, the standard deviations between the pitch and yaw angles obtained by DPMI and Renishaw interferometer are 1.68 × 10 -5 ◦ and 1.86 × 10 -5 ◦ , respectively, and the maximum deviation between the measurement result of DPMI and the stage positioning before and after angle compensation is reduced from 5.207 μm to about 0.719 μm. Keywords: differential interferometer; phase-modulated interferometer; precision displacement measurement; environmental disturbance; rotational error compensation 1. Introduction Laser interferometer has widely been used in the field of precision displacement mea- surement [1,2] due to its advantages of meter traceability, high sensitivity, wide dynamic range, etc. For laser interferometers, improvements in measurement performance have focused on the optimization of phase demodulation and the optics. The optimization of phase demodulation aims to minimize the periodic non-linearities in measurement. Compared with the non-linear error of several nanometers, the measurement error of the optics due to the target rotation or the environmental disturbance is much larger [3–5]. During the movement, the measured target will inevitably rotate, resulting in the deviation of the displacement measurement. To compensate for the measurement deviations, the angle of rotation must be measured simultaneously. For simultaneous measurement of displacement and rotational angle, there are two techniques: multi-beam measurement and single-beam measurement. The multi-beam measurement method usually adopts an angle collimator [6,7] or interferometer [8] attached to the displacement interferometer, to generate multiple beams for measurement. Although it can measure the displacement and rotational angle simultaneously, its bulky optical configuration limits its applicability. Compared with multi-beam measurement, the single- beam measurement method uses only one measuring beam to obtain displacement and rotational angle simultaneously, based on interference fringe analysis [9–11] or differential sensing technology [12–17]. For interference fringe analysis, CCD is usually used to collect interference images to obtain the rotational angle and displacement information through Appl. Sci. 2022, 12, 5002. https://doi.org/10.3390/app12105002 https://www.mdpi.com/journal/applsci
-
Upload
khangminh22 -
Category
Documents
-
view
3 -
download
0
Transcript of A Differential Phase-Modulated Interferometer with Rotational ...
Citation: Yan, L.; Yan, Y.; Chen, B.;
Lou, Y. A Differential
Phase-Modulated Interferometer
with Rotational Error Compensation
for Precision Displacement
Measurement. Appl. Sci. 2022, 12,
5002. https://doi.org/10.3390/
app12105002
Academic Editors: Xiuguo Chen,
Guanhao Wu and Yuki Shimizu
Received: 12 April 2022
Accepted: 12 May 2022
Published: 16 May 2022
Publisher’s Note: MDPI stays neutral
with regard to jurisdictional claims in
published maps and institutional affil-
iations.
Copyright: © 2022 by the authors.
Licensee MDPI, Basel, Switzerland.
This article is an open access article
distributed under the terms and
conditions of the Creative Commons
Attribution (CC BY) license (https://
creativecommons.org/licenses/by/
4.0/).
applied sciences
Article
A Differential Phase-Modulated Interferometer with RotationalError Compensation for Precision Displacement MeasurementLiping Yan , Yucen Yan, Benyong Chen and Yingtian Lou *
Precision Measurement Laboratory, Zhejiang Sci-Tech University, Hangzhou 310018, China;[email protected] (L.Y.); [email protected] (Y.Y.); [email protected] (B.C.)* Correspondence: [email protected]
Abstract: In this paper, a differential phase-modulated interferometer (DPMI) is proposed to com-pensate for the rotational error for precision displacement measurement. In DPMI, a referenceinterferometer sharing the same reference arm with the measurement interferometer is constructed.Using the two interferometers to differentially measure the displacement, the unbalanced environ-mental disturbance on the measurement can be minimized. An integrated 2 × 2 array photodetector(APD) is adopted in DPMI. Based on APD with differential wavefront sensing (DWS) technology,the rotation angle can be detected and compensated. Therefore, precision displacement withoutrotational error and unbalanced environmental disturbance can be achieved. Three confirmatoryexperiments were performed, and the experimental results show that the maximum displacementdrift is reduced from 902.9 nm to 16.3 nm in 100 min stability test, the standard deviations betweenthe pitch and yaw angles obtained by DPMI and Renishaw interferometer are 1.68 × 10⁻⁵◦ and1.86 × 10−5◦, respectively, and the maximum deviation between the measurement result of DPMIand the stage positioning before and after angle compensation is reduced from 5.207 µm to about0.719 µm.
Keywords: differential interferometer; phase-modulated interferometer; precision displacementmeasurement; environmental disturbance; rotational error compensation
1. Introduction
Laser interferometer has widely been used in the field of precision displacement mea-surement [1,2] due to its advantages of meter traceability, high sensitivity, wide dynamicrange, etc. For laser interferometers, improvements in measurement performance havefocused on the optimization of phase demodulation and the optics. The optimizationof phase demodulation aims to minimize the periodic non-linearities in measurement.Compared with the non-linear error of several nanometers, the measurement error of theoptics due to the target rotation or the environmental disturbance is much larger [3–5].During the movement, the measured target will inevitably rotate, resulting in the deviationof the displacement measurement. To compensate for the measurement deviations, theangle of rotation must be measured simultaneously.
For simultaneous measurement of displacement and rotational angle, there are twotechniques: multi-beam measurement and single-beam measurement. The multi-beammeasurement method usually adopts an angle collimator [6,7] or interferometer [8] attachedto the displacement interferometer, to generate multiple beams for measurement. Althoughit can measure the displacement and rotational angle simultaneously, its bulky opticalconfiguration limits its applicability. Compared with multi-beam measurement, the single-beam measurement method uses only one measuring beam to obtain displacement androtational angle simultaneously, based on interference fringe analysis [9–11] or differentialsensing technology [12–17]. For interference fringe analysis, CCD is usually used to collectinterference images to obtain the rotational angle and displacement information through
Appl. Sci. 2022, 12, 5002. https://doi.org/10.3390/app12105002 https://www.mdpi.com/journal/applsci
Appl. Sci. 2022, 12, 5002 2 of 10
fringe tilt and interval change analysis [11]. For differential sensing technology, it ismainly divided into differential power sensing (DPS) technology and differential wavefrontsensing (DWS) technology. The two technologies both adopt the four-quadrant detector(QD) as the detector, but the difference is that DPS technology uses QDs to obtain thepower unbalanced signals, and DWS technology uses QDs to obtain the phase unbalancedsignals. For DPS technology, the DPS signal is used for angle measurement, and the averagephase of four interference signals is used for displacement measurement, but this will belimited by the performance of the detector itself [12]. A Mach–Zehnder interferometer isdeveloped by combining DPS and DWS; it uses the DWS signal to measure a large rotationrange and the DPS signal to provide high measurement accuracy [13]. In our previousstudy, we proposed a modulated laser homodyne interferometer using an integrated four-photodetector to obtain a DWS signal to measure the displacement and rotational anglesimultaneously [16]. An electro-optic phase modulator (EOM) was applied in the referencearm as a phase modulator. Although a high measurement sensitivity was achieved, theunbalanced environmental disturbances on the reference and measuring arms leads to anincrease in measurement uncertainty.
To minimize the impact of unbalanced environmental disturbances, a series of differen-tial interferometers have been developed [17–20]. For example, a differential interferometerwas designed to eliminate the influence of environmental fluctuations by constructing ameasuring interferometer and a reference interferometer that share the same referencearm [17]. Displacement can be measured by detecting the phase change in the interferencesignals of two interferometers. However, using PZT as the phase modulator, its modulationspeed limits the displacement measurement speed. An all-fiber differential interferometerwas proposed to measure displacement, using two circulators as a reference arm and ameasuring arm that do not affect each other [18]. Furthermore, a compact, double-passdifferential plane interferometer with coaxial four parallel and coplanar beams in the refer-ence and measuring arms was presented [19]. The interferometer has a non-linearity of lessthan 0.1 nm but is limited by complex fabrication processes and long-term temperaturesensitivity.
In this paper, a differential phase-modulated interferometer (DPMI) with rotationalerror compensation for precision displacement measurement is proposed. In DPMI, byconstructing the reference and measuring interferometers with a common reference arm,the unbalanced disturbance between the reference and measuring arms of the measuringinterferometer is converted into a common-mode disturbance between the two interferome-ters, and the common-mode disturbance can be minimized by subtracting the displacementresults of the two interferometers. Using DWS technology, an integrated 2 × 2 array pho-todetector is applied in the measuring interferometer for rotational angle compensation.With the proposed design, the displacement without unbalanced disturbance and rota-tional angle errors can be measured. The optical configuration is presented in Section 2, themeasurement principle is described in Section 3, and experiments are carried out to verifythe feasibility of DPMI in Section 4.
2. Optical Configuration
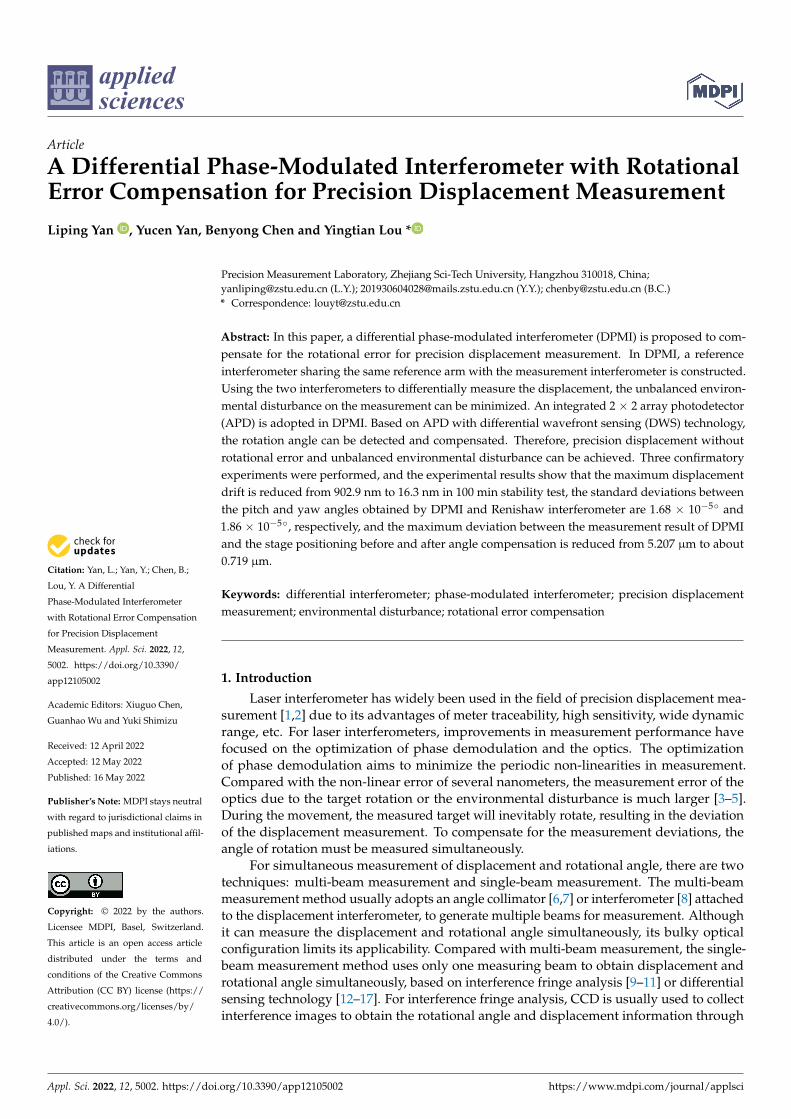
The configuration of DPMI is shown in Figure 1. The output beam of a stabilizedHe-Ne laser is adjusted into 45◦ linearly polarized light by an isolator (IO), followed byan incident beam on an electro-optic phase modulator (EOM). The beam is output fromEOM and expanded by a beam expander (BE); then, it is split into two beams by a non-polarization beam splitting cube (NPBS). The transmitted (blue) beam serves as the sourceof the reference interferometer (RI), and the reflected (red) beam is reflected by a planemirror (M) and serves as the source of the measuring interferometer (MI). In RI, the bluebeam is split into two beams with orthogonal polarizations by a polarization beam splittingcube (PBS), and the reflected beam serves as the reference beam of RI and is reflected by areference plane mirror (MR). The beam transmitted via PBS serves as the measuring beamof RI and is reflected by a fixed measuring plane mirror (M1). M1 is fixed at a suitable
Appl. Sci. 2022, 12, 5002 3 of 10
position. As the reference beam and the measuring beam pass quarter-wave plates (QWP1and QWP2) twice, the polarization directions of the two beams become perpendicular totheir original polarization directions. Then, the two beams return to PBS. After the use ofa polarizer (P) with an angle of 45◦, the two beams interfere with each other in the samepolarization direction, reaching a photodetector (PD). The measuring signal of PD is usedto measure the displacement drift in M1. Similarly, in MI, the reference beam is reflected byMR, and the measuring beam is reflected by another measuring plane mirror (M2). M2 ismounted on the measured object and moves with it. The reference and measuring beamsinterfere with each other and reach an integrated 2 × 2 array photodetector (APD). Themeasuring signals of APD are used to measure the displacement and rotational angle ofM2 simultaneously.
Appl. Sci. 2022, 12, x FOR PEER REVIEW 3 of 10
position. As the reference beam and the measuring beam pass quarter-wave plates (QWP1
and QWP1) twice, the polarization directions of the two beams become perpendicular to their original polarization directions. Then, the two beams return to PBS. After the use of a polarizer (P) with an angle of 45°, the two beams interfere with each other in the same polarization direction, reaching a photodetector (PD). The measuring signal of PD is used to measure the displacement drift in M1. Similarly, in MI, the reference beam is reflected by MR, and the measuring beam is reflected by another measuring plane mirror (M2). M2 is mounted on the measured object and moves with it. The reference and measuring beams interfere with each other and reach an integrated 2 × 2 array photodetector (APD). The measuring signals of APD are used to measure the displacement and rotational angle of M2 simultaneously.
He-Ne激光器
PBS
EOM
NPBS
IO
He-Ne激光器
He-Ne Laser
M
PDAPD
x
zyP
2 14 3
BE∆z
p0 p1
M2
M1
MR
QWP2
QWP1
Figure 1. Configuration of DPMI: IO, isolator; EOM, electro-optic phase modulator; BE, beam ex-pander; NPBS, non-polarization beam splitting cube; PBS, polarization beam splitting cube; MR, ref-erence plane mirror; M1,2, fixed and moveable measuring plane mirrors; QWP, quarter-wave plate; P, polarizer; PD, photodetector; APD, integrated 2 × 2 array photodetector.
3. Measurement Principles Since the measuring and reference arms of RI or MI are perpendicular to each other,
as shown in Figure 1, the unbalanced environmental disturbance introduces drifts in the optical path difference (OPD) between the measuring and reference arms of RI or MI. Benefitting from the design of DPMI, the reference and measuring arms of the two inter-ferometers are almost in the same optical path when M1 and M2 are in the initial position p0, so the unbalanced disturbances are almost the same and can be converted into a com-mon-mode disturbance between the two interferometers. The common-mode disturbance can be minimized by converting the measurement of OPD between the measuring and reference arms to the measurement of OPD between two measuring arms of RI and MI. When M2 moves from the initial position p0 to the current position p1, the displacement of M2 can be expressed as
( )M2-M1 M2-MR M1-MR 2 1λΔz=ΔL =ΔL -ΔL = Δφ -Δφ
4π (1)
where ΔLM2-M1, ΔLM2-MR, and ΔLM1-MR are the OPD changes between M2 and M1, between M2 and MR, and between M1 and MR before and after the movement, respectively; λ is the wavelength of the laser in the air, while Δφ1 and Δφ2 are the phase changes corresponding to OPDs ΔLM1-MR and ΔLM2-MR.
For phase demodulation, the phase generated carrier (PGC) demodulation with a combined sinusoidal and triangular modulation signal [20] was adopted. In DPMI, EOM is used to modulate the source beam, different from our previous study [16], in which EOM was used to modulate the reference beam. When a combined modulation signal is applied to EOM, the x-direction polarization component of the source beam is modulated
Figure 1. Configuration of DPMI: IO, isolator; EOM, electro-optic phase modulator; BE, beamexpander; NPBS, non-polarization beam splitting cube; PBS, polarization beam splitting cube; MR,reference plane mirror; M1,2, fixed and moveable measuring plane mirrors; QWP, quarter-wave plate;P, polarizer; PD, photodetector; APD, integrated 2 × 2 array photodetector.
3. Measurement Principles
Since the measuring and reference arms of RI or MI are perpendicular to each other,as shown in Figure 1, the unbalanced environmental disturbance introduces drifts in theoptical path difference (OPD) between the measuring and reference arms of RI or MI.Benefitting from the design of DPMI, the reference and measuring arms of the two interfer-ometers are almost in the same optical path when M1 and M2 are in the initial position p0,so the unbalanced disturbances are almost the same and can be converted into a common-mode disturbance between the two interferometers. The common-mode disturbance can beminimized by converting the measurement of OPD between the measuring and referencearms to the measurement of OPD between two measuring arms of RI and MI. When M2moves from the initial position p0 to the current position p1, the displacement of M2 can beexpressed as
∆z = ∆LM2-M1= ∆LM2-MR−∆LM1-MR =λ
4π(∆ϕ2−∆ϕ1) (1)
where ∆LM2-M1, ∆LM2-MR, and ∆LM1-MR are the OPD changes between M2 and M1, betweenM2 and MR, and between M1 and MR before and after the movement, respectively; λ is thewavelength of the laser in the air, while ∆ϕ1 and ∆ϕ2 are the phase changes correspondingto OPDs ∆LM1-MR and ∆LM2-MR.
For phase demodulation, the phase generated carrier (PGC) demodulation with acombined sinusoidal and triangular modulation signal [20] was adopted. In DPMI, EOM isused to modulate the source beam, different from our previous study [16], in which EOMwas used to modulate the reference beam. When a combined modulation signal is appliedto EOM, the x-direction polarization component of the source beam is modulated with
Appl. Sci. 2022, 12, 5002 4 of 10
respect to the y-direction polarization component. Then, the interference signals detectedby PD and APD can be expressed as
S1(t) = A1+B1 cos[(
mx−my)cosωct +ϕ1+ϕtri
](2)
Sn2 (t) = An
2+Bn2 cos
[(mx−my
)cosωct +ϕn
2+ϕtri]
(3)
where A1 and B1 are the amplitudes of the DC and AC components of the PD signal,respectively; An
2 and Bn2 are the amplitudes of the DC and AC components of the n-th
APD signal, respectively; mx = Vm/Vπx and my = Vm/Vπy are the modulation depths ofEOM corresponding to x-direction and y-direction, respectively; Vm is the amplitude of thesinusoidal modulated signal, Vπx and Vπy are the half-wave voltage of EOM correspondingto x-direction and y-direction, respectively;ωc is the frequency of the sinusoidal modulatedsignal, ϕ1 is the phase corresponding to the optical path difference (OPD) between thereference and measuring beams on PD; ϕn
2 is the phase corresponding to the OPD betweenthe reference and measuring beams on the n-th detector of APD;ϕtri is the phase introducedby the triangular modulation signal.
The interference signals S1(t) and Sn2 (t) are processed in FPGA for phase modulation.
Taking the signal S1(t) as an example, it is multiplied with the sinusoidally modulatedsignal cosωct and its second harmonic carrier signal cos2ωct, and a pair of sinusoidal andcosinusoidal signals can be obtained by
Ix(t) = LPF[S1(t)× cosωct]= a(t) sin(ϕ1+ϕtri)+x0(t) (4)
Iy(t) = LPF[S1(t)× cos 2ωct]= b(t) cos(ϕ1+ϕtri)+y0(t) (5)
where a(t) and b(t) are the amplitudes of the signal Ix(t) and Iy(t), x0(t) and y0(t) are theDC offsets of the signal Ix(t) and Iy(t). Real-time ellipse fitting is used to calculate thecorrect DC offsets and amplitudes of Ix(t) and Iy(t), thereby eliminating the influences ofmodulation depth drift and carrier phase delay. After arctangent calculation and removingthe triangular modulated phaseϕtri with mean filter, the phasesϕ1 andϕn
2 can be recovered.During the movement of M2, the phases are demodulated in real time, and the phasechanges ∆ϕ1 and ∆ϕn
2 before and after the movement can be obtained. By averaging thephase changes ∆ϕn
2 and substituting them into Equation (1) with ∆ϕ1, the displacementcan be re-expressed as
∆z =λ
4π(∆ϕ2−∆ϕ1) =
λ
4π
[14
4
∑n=1
∆ϕn2−∆ϕ1
](6)
Using the differential design, the measurement deviation caused by the unbalancedenvironmental disturbance can be minimized. However, the measurement deviation causedby the rotation of the measuring mirror M2 with the measured object during the movementstill remains.
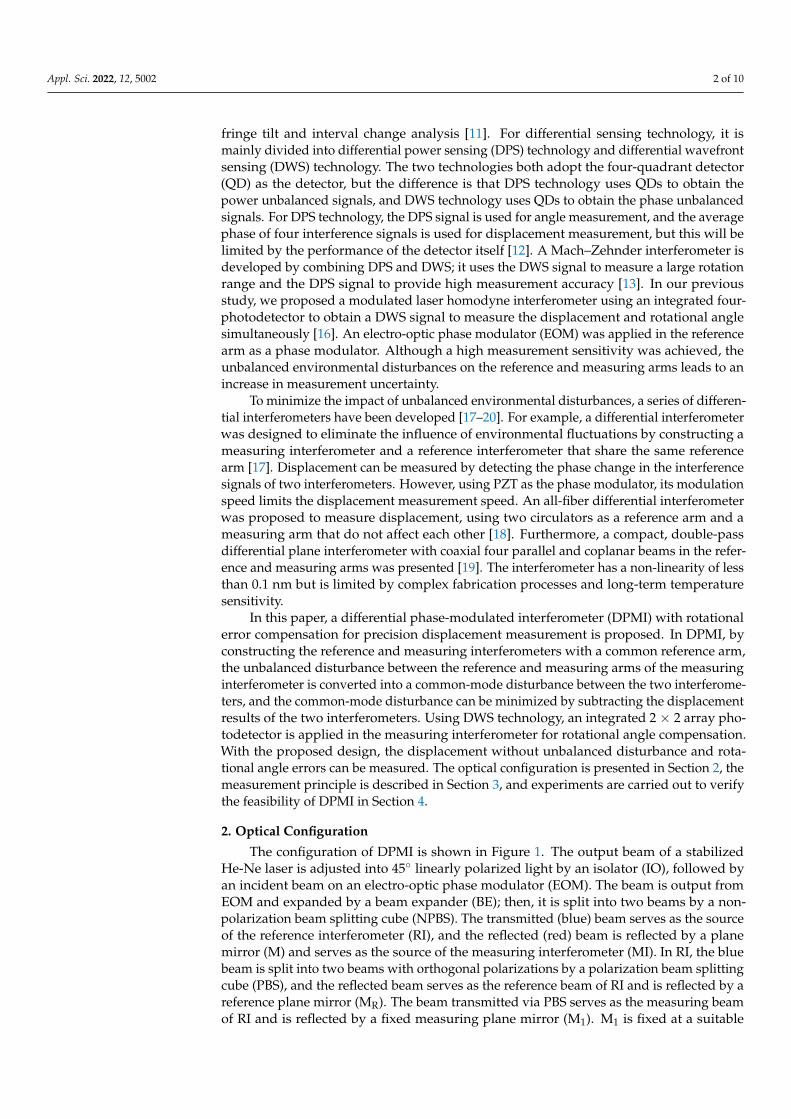
To compensate for the rotation error, the DWS technology with APD was adopted. Asshown in Figure 2, when M2 tilts with the measured object, the direction of the returnedmeasuring beam changes. Since the reference beam direction does not change, the OPDsbetween the reference and measuring beams on each detector of APD become unequal.Using this OPD unbalance and the geometric relationship between the direction of themeasuring beam and the rotational angle of M2, the yaw angle θx and the pitch angle θycan be derived as θx= arctan
[1
2d1∆L1–2
]= arctan
[1
2d1× λ
2π
(∆ϕ1
2 − ∆ϕ22)]
θy= arctan[
12d2
∆L1–3
]= arctan
[1
2d2× λ
2π
(∆ϕ1
2 − ∆ϕ32)] (7)
where d1 and d2 are the distance in the x-direction between first and second detectors, andthe distance in the z-direction between first and third detectors of APD, respectively; ∆L1–2
Appl. Sci. 2022, 12, 5002 5 of 10
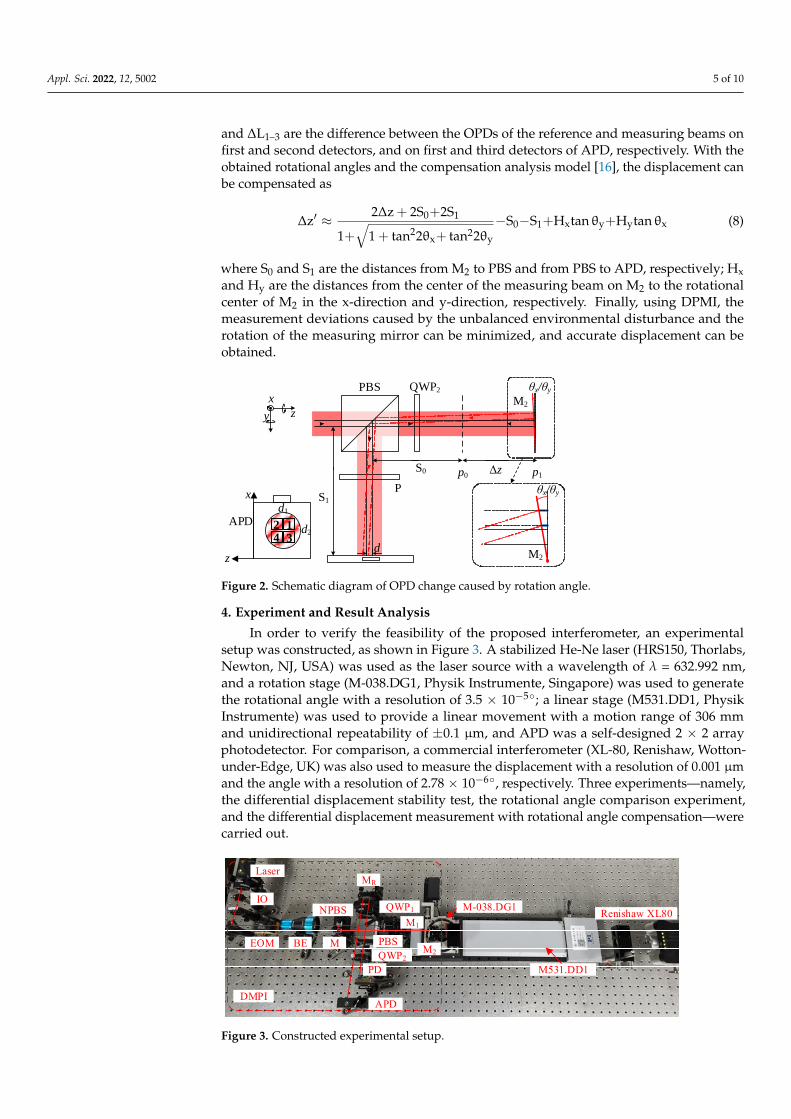
and ∆L1–3 are the difference between the OPDs of the reference and measuring beams onfirst and second detectors, and on first and third detectors of APD, respectively. With theobtained rotational angles and the compensation analysis model [16], the displacement canbe compensated as
∆z′ ≈ 2∆z + 2S0+2S1
1+√
1 + tan22θx+ tan22θy
−S0−S1+Hxtan θy+Hytan θx (8)
where S0 and S1 are the distances from M2 to PBS and from PBS to APD, respectively; Hxand Hy are the distances from the center of the measuring beam on M2 to the rotationalcenter of M2 in the x-direction and y-direction, respectively. Finally, using DPMI, themeasurement deviations caused by the unbalanced environmental disturbance and therotation of the measuring mirror can be minimized, and accurate displacement can beobtained.
Appl. Sci. 2022, 12, x FOR PEER REVIEW 5 of 10
( )
( )
λθ Δ Δφ Δφ
π
λθ Δ Δφ Δφ
π
1 2
x 1-2 2 2
1 1
1 3
y 1-3 2 2
2 2
1 1=arctan L =arctan -
2d 2d 2
1 1=arctan L =arctan -
2d 2d 2
(7)
where d1 and d2 are the distance in the x-direction between first and second detectors, and
the distance in the z-direction between first and third detectors of APD, respectively; ΔL1–
2 and ΔL1–3 are the difference between the OPDs of the reference and measuring beams on
first and second detectors, and on first and third detectors of APD, respectively. With the
obtained rotational angles and the compensation analysis model [16], the displacement
can be compensated as
0 10 1 x y y x
2 2
x y
2Δz+2S +2SΔz -S -S +H tanθ +H tanθ
1+ 1+tan 2θ +tan 2θ (8)
where S0 and S1 are the distances from M2 to PBS and from PBS to APD, respectively; Hx
and Hy are the distances from the center of the measuring beam on M2 to the rotational
center of M2 in the x-direction and y-direction, respectively. Finally, using DPMI, the
measurement deviations caused by the unbalanced environmental disturbance and the
rotation of the measuring mirror can be minimized, and accurate displacement can be
obtained.
PBS QWP2
P
θx/θy
x
zy
d
S1
M2
S0 Δz
APD 1234
d1
d2
p0 p1
x
z M2
θx/θy
Figure 2. Schematic diagram of OPD change caused by rotation angle.
4. Experiment and Result Analysis
In order to verify the feasibility of the proposed interferometer, an experimental
setup was constructed, as shown in Figure 3. A stabilized He-Ne laser (HRS150, Thorlabs,
Newton, NJ, USA) was used as the laser source with a wavelength of λ = 632.992 nm, and
a rotation stage (M-038.DG1, Physik Instrumente, Singapore) was used to generate the
rotational angle with a resolution of 3.5 × 10⁻⁵°; a linear stage (M531.DD1, Physik Instru-
mente) was used to provide a linear movement with a motion range of 306 mm and uni-
directional repeatability of ±0.1 μm, and APD was a self-designed 2 × 2 array photodetec-
tor. For comparison, a commercial interferometer (XL-80, Renishaw, Wotton-under-Edge,
UK) was also used to measure the displacement with a resolution of 0.001 μm and the
angle with a resolution of 2.78 × 10⁻⁶°, respectively. Three experiments—namely, the dif-
ferential displacement stability test, the rotational angle comparison experiment, and the
differential displacement measurement with rotational angle compensation—were car-
ried out.
Figure 2. Schematic diagram of OPD change caused by rotation angle.
4. Experiment and Result Analysis
In order to verify the feasibility of the proposed interferometer, an experimentalsetup was constructed, as shown in Figure 3. A stabilized He-Ne laser (HRS150, Thorlabs,Newton, NJ, USA) was used as the laser source with a wavelength of λ = 632.992 nm,and a rotation stage (M-038.DG1, Physik Instrumente, Singapore) was used to generatethe rotational angle with a resolution of 3.5 × 10⁻⁵◦; a linear stage (M531.DD1, PhysikInstrumente) was used to provide a linear movement with a motion range of 306 mmand unidirectional repeatability of ±0.1 µm, and APD was a self-designed 2 × 2 arrayphotodetector. For comparison, a commercial interferometer (XL-80, Renishaw, Wotton-under-Edge, UK) was also used to measure the displacement with a resolution of 0.001 µmand the angle with a resolution of 2.78 × 10⁻⁶◦, respectively. Three experiments—namely,the differential displacement stability test, the rotational angle comparison experiment,and the differential displacement measurement with rotational angle compensation—werecarried out.
Appl. Sci. 2022, 12, x FOR PEER REVIEW 6 of 10
Laser
DMPI
IO
EOM BE
NPBS
M
QWP1
MR
PBSQWP2
PD
APD
M2
M1
M-038.DG1
M531.DD1
Renishaw XL80
Figure 3. Constructed experimental setup.
4.1. Differential Displacement Stability Experiment In this experiment, M1 and M2 were fixed at the same distance from PBS to minimize
other uncontrollable influences on the measurement results. The experiment lasted for 100 min; during the experiment, the two interferometers MI and RI recorded the displacement simultaneously. The experimental results are shown in Figure 4. In Figure 4a, the red line and blue line represent the measurement results of MI and RI, respectively. The yellow line is the measurement results of DPMI obtained by the difference between the measure-ment results of MI and RI. The measurement results of MI and RI drift with the environ-mental change such as the changes in air temperature, air pressure, and humidity, as shown in Figure 4b,c, during 100 min. The maximum measurement drifts in MI and RI were, respectively, 902.9 nm and 892.1 nm during the experiment. Additionally, in the subplots, the changes in measured displacement by MI and RI were, respectively, 61.1 nm and 60.7 nm between 80 and 90 min. However, the trends in the measurements of MI and RI were in good agreement. Due to the good consistency, there was no significant change trend in the measurements of DPMI. The maximum measurement drift of DPMI was 16.3 nm during the experiment, and the change in measured displacement by DPMI was 3.6 nm between 80 and 90 min, respectively. The experimental results verified that the de-signed DPMI can effectively reduce the influence of environmental disturbance.
80 82 84 86 88 90760780800820840860
0 10 20 30 40 50 60 70 80 90 100
0
150
300
450
600
750
900
Disp
lace
men
t (nm
)
Time (minutes)
MI RI DPMI
80 82 84 86 88 90101112131415
(a)
0 20 40 60 80 10024.72
24.74
24.76
24.78
24.80
24.82 Air temperature
Tem
pera
ture
(°C)
Time (minutes)0 20 40 60 80 100
101496
101502
101508
101514
101520
101526 Air pressure
Pres
sure
(Pa)
Time (minutes)0 20 40 60 80 100
52.5
52.8
53.1
53.4
53.7
54.0 Humidity
Hum
idity
(% R
H)
Time (minutes)
101,526
101,520
101,514
101,508
101,502
101,496
(b) (c) (d)
Figure 3. Constructed experimental setup.
Appl. Sci. 2022, 12, 5002 6 of 10
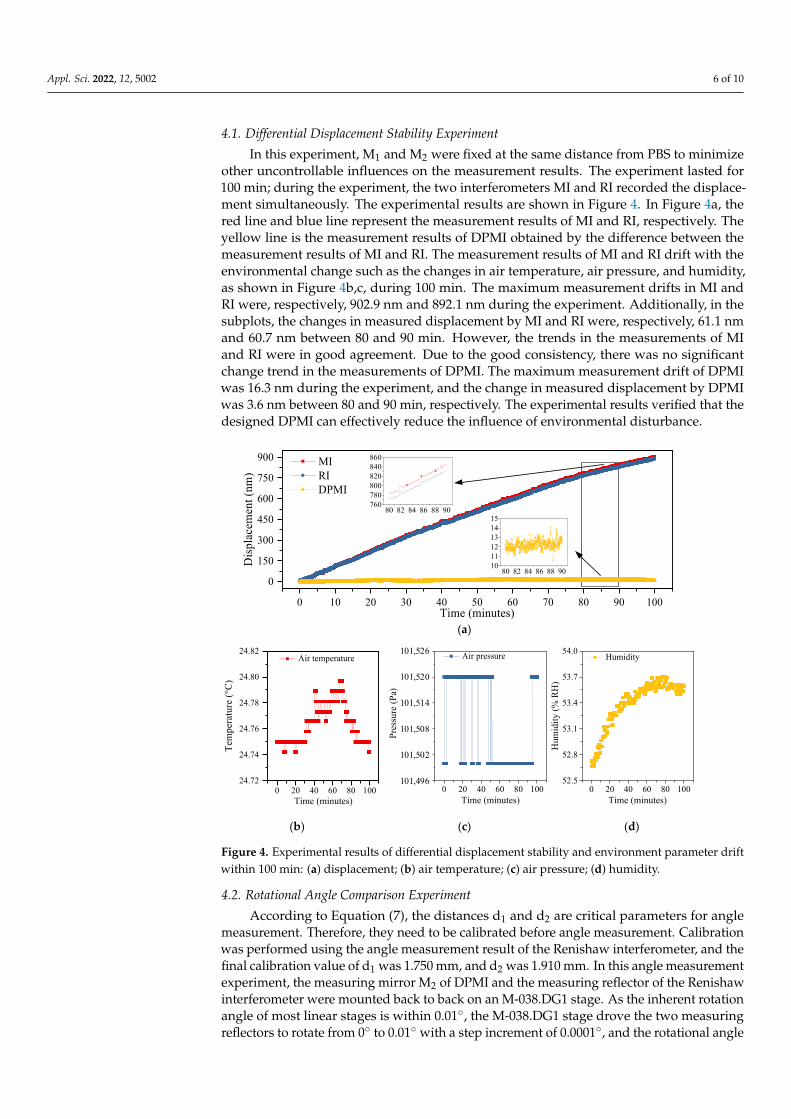
4.1. Differential Displacement Stability Experiment
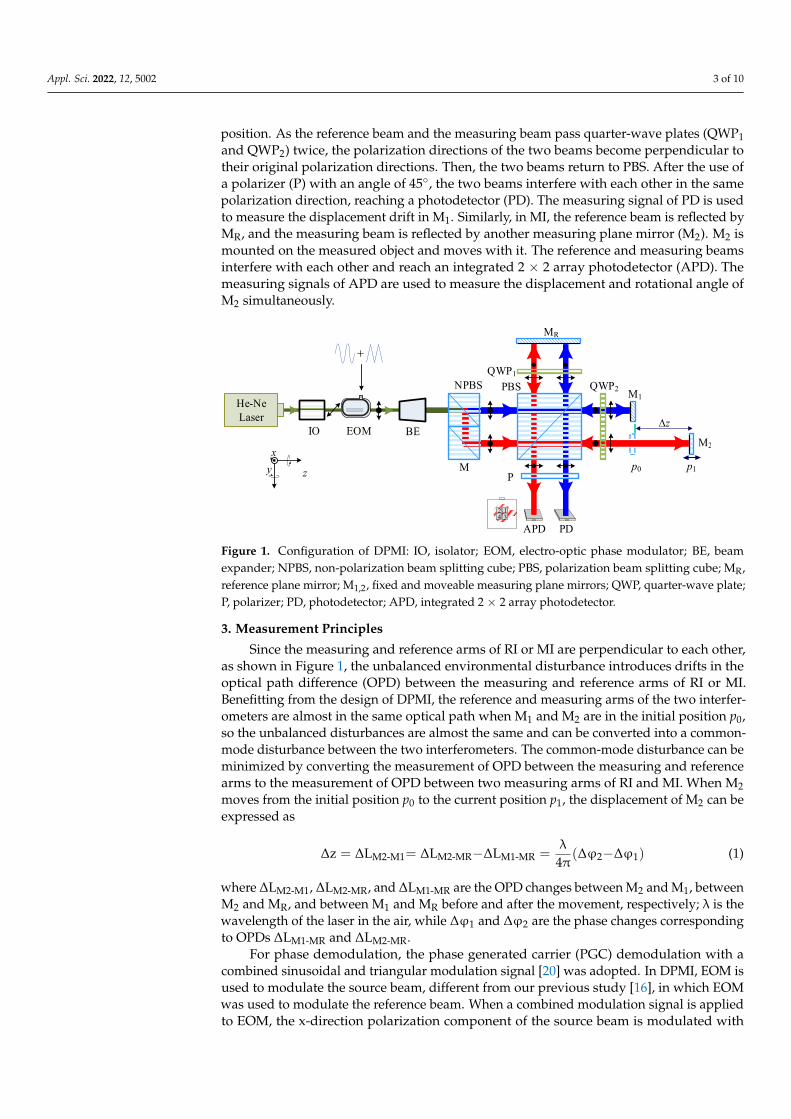
In this experiment, M1 and M2 were fixed at the same distance from PBS to minimizeother uncontrollable influences on the measurement results. The experiment lasted for100 min; during the experiment, the two interferometers MI and RI recorded the displace-ment simultaneously. The experimental results are shown in Figure 4. In Figure 4a, thered line and blue line represent the measurement results of MI and RI, respectively. Theyellow line is the measurement results of DPMI obtained by the difference between themeasurement results of MI and RI. The measurement results of MI and RI drift with theenvironmental change such as the changes in air temperature, air pressure, and humidity,as shown in Figure 4b,c, during 100 min. The maximum measurement drifts in MI andRI were, respectively, 902.9 nm and 892.1 nm during the experiment. Additionally, in thesubplots, the changes in measured displacement by MI and RI were, respectively, 61.1 nmand 60.7 nm between 80 and 90 min. However, the trends in the measurements of MIand RI were in good agreement. Due to the good consistency, there was no significantchange trend in the measurements of DPMI. The maximum measurement drift of DPMIwas 16.3 nm during the experiment, and the change in measured displacement by DPMIwas 3.6 nm between 80 and 90 min, respectively. The experimental results verified that thedesigned DPMI can effectively reduce the influence of environmental disturbance.
Appl. Sci. 2022, 12, x FOR PEER REVIEW 6 of 10
Laser
DMPI
IO
EOM BE
NPBS
M
QWP1
MR
PBSQWP2
PD
APD
M2
M1
M-038.DG1
M531.DD1
Renishaw XL80
Figure 3. Constructed experimental setup.
4.1. Differential Displacement Stability Experiment In this experiment, M1 and M2 were fixed at the same distance from PBS to minimize
other uncontrollable influences on the measurement results. The experiment lasted for 100 min; during the experiment, the two interferometers MI and RI recorded the displacement simultaneously. The experimental results are shown in Figure 4. In Figure 4a, the red line and blue line represent the measurement results of MI and RI, respectively. The yellow line is the measurement results of DPMI obtained by the difference between the measure-ment results of MI and RI. The measurement results of MI and RI drift with the environ-mental change such as the changes in air temperature, air pressure, and humidity, as shown in Figure 4b,c, during 100 min. The maximum measurement drifts in MI and RI were, respectively, 902.9 nm and 892.1 nm during the experiment. Additionally, in the subplots, the changes in measured displacement by MI and RI were, respectively, 61.1 nm and 60.7 nm between 80 and 90 min. However, the trends in the measurements of MI and RI were in good agreement. Due to the good consistency, there was no significant change trend in the measurements of DPMI. The maximum measurement drift of DPMI was 16.3 nm during the experiment, and the change in measured displacement by DPMI was 3.6 nm between 80 and 90 min, respectively. The experimental results verified that the de-signed DPMI can effectively reduce the influence of environmental disturbance.
80 82 84 86 88 90760780800820840860
0 10 20 30 40 50 60 70 80 90 100
0
150
300
450
600
750
900
Disp
lace
men
t (nm
)
Time (minutes)
MI RI DPMI
80 82 84 86 88 90101112131415
(a)
0 20 40 60 80 10024.72
24.74
24.76
24.78
24.80
24.82 Air temperature
Tem
pera
ture
(°C)
Time (minutes)0 20 40 60 80 100
101496
101502
101508
101514
101520
101526 Air pressure
Pres
sure
(Pa)
Time (minutes)0 20 40 60 80 100
52.5
52.8
53.1
53.4
53.7
54.0 Humidity
Hum
idity
(% R
H)
Time (minutes)
101,526
101,520
101,514
101,508
101,502
101,496
(b) (c) (d)
Figure 4. Experimental results of differential displacement stability and environment parameter driftwithin 100 min: (a) displacement; (b) air temperature; (c) air pressure; (d) humidity.
4.2. Rotational Angle Comparison Experiment
According to Equation (7), the distances d1 and d2 are critical parameters for anglemeasurement. Therefore, they need to be calibrated before angle measurement. Calibrationwas performed using the angle measurement result of the Renishaw interferometer, and thefinal calibration value of d1 was 1.750 mm, and d2 was 1.910 mm. In this angle measurementexperiment, the measuring mirror M2 of DPMI and the measuring reflector of the Renishawinterferometer were mounted back to back on an M-038.DG1 stage. As the inherent rotationangle of most linear stages is within 0.01◦, the M-038.DG1 stage drove the two measuringreflectors to rotate from 0◦ to 0.01◦ with a step increment of 0.0001◦, and the rotational angle
Appl. Sci. 2022, 12, 5002 7 of 10
was measured simultaneously via DPMI and Renishaw interferometer. The experimentwas performed twice, and the stage was placed vertically to generate pitch motion and wasplaced horizontally to generate yaw motion.
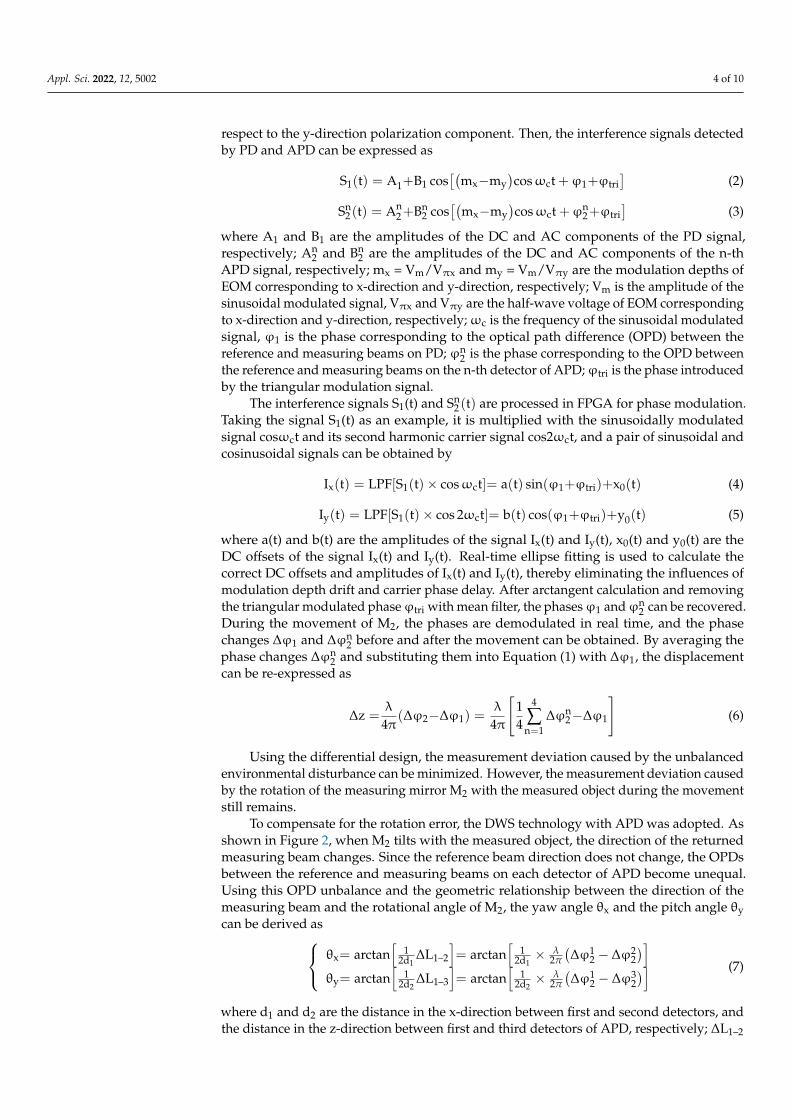
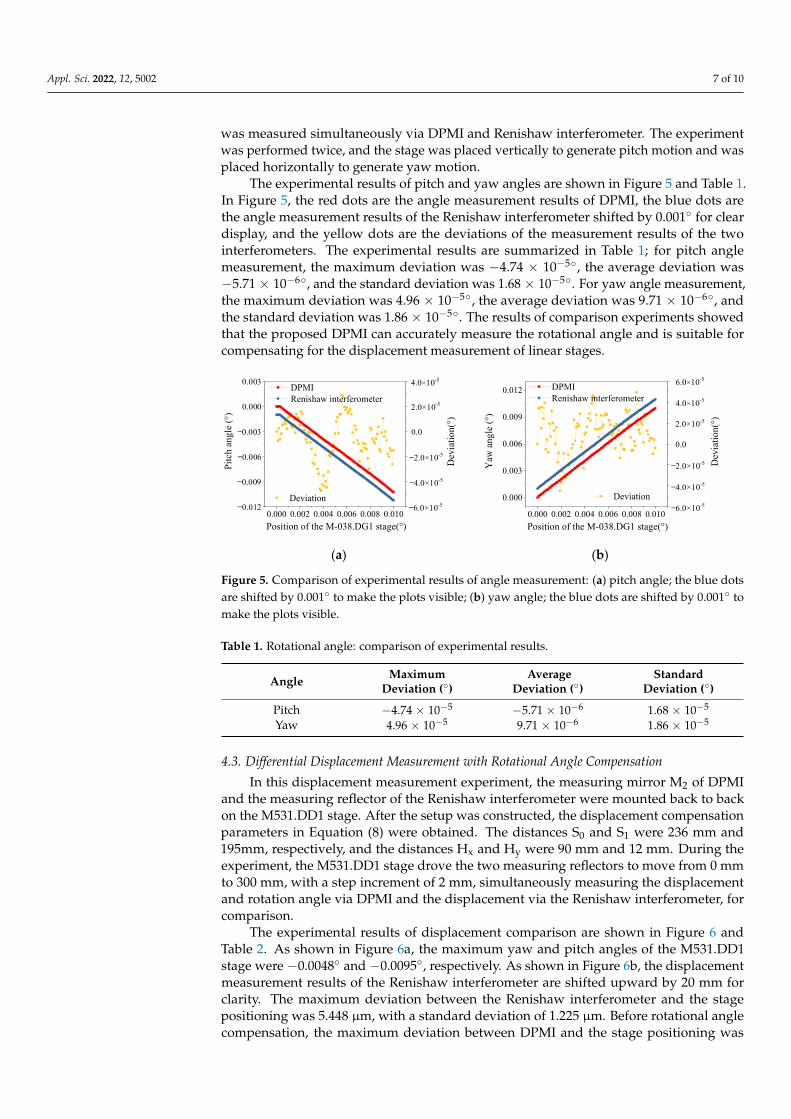
The experimental results of pitch and yaw angles are shown in Figure 5 and Table 1.In Figure 5, the red dots are the angle measurement results of DPMI, the blue dots arethe angle measurement results of the Renishaw interferometer shifted by 0.001◦ for cleardisplay, and the yellow dots are the deviations of the measurement results of the twointerferometers. The experimental results are summarized in Table 1; for pitch anglemeasurement, the maximum deviation was −4.74 × 10⁻⁵◦, the average deviation was−5.71 × 10⁻⁶◦, and the standard deviation was 1.68 × 10⁻⁵◦. For yaw angle measurement,the maximum deviation was 4.96 × 10⁻⁵◦, the average deviation was 9.71 × 10⁻⁶◦, andthe standard deviation was 1.86 × 10⁻⁵◦. The results of comparison experiments showedthat the proposed DPMI can accurately measure the rotational angle and is suitable forcompensating for the displacement measurement of linear stages.
Appl. Sci. 2022, 12, x FOR PEER REVIEW 7 of 10
Figure 4. Experimental results of differential displacement stability and environment parameter drift within 100 min: (a) displacement; (b) air temperature; (c) air pressure; (d) humidity.
4.2. Rotational Angle Comparison Experiment According to Equation (7), the distances d1 and d2 are critical parameters for angle
measurement. Therefore, they need to be calibrated before angle measurement. Calibra-tion was performed using the angle measurement result of the Renishaw interferometer, and the final calibration value of d1 was 0.990 mm, and d2 was 0.816 mm. In this angle measurement experiment, the measuring mirror M2 of DPMI and the measuring reflector of the Renishaw interferometer were mounted back to back on an M-038.DG1 stage. As the inherent rotation angle of most linear stages is within 0.01°, the M-038.DG1 stage drove the two measuring reflectors to rotate from 0° to 0.01° with a step increment of 0.0001°, and the rotational angle was measured simultaneously via DPMI and Renishaw interferometer. The experiment was performed twice, and the stage was placed vertically to generate pitch motion and was placed horizontally to generate yaw motion.
The experimental results of pitch and yaw angles are shown in Figure 5 and Table 1. In Figure 5, the red dots are the angle measurement results of DPMI, the blue dots are the angle measurement results of the Renishaw interferometer shifted by 0.001° for clear dis-play, and the yellow dots are the deviations of the measurement results of the two inter-ferometers. The experimental results are summarized in Table 1; for pitch angle measure-ment, the maximum deviation was 3.88 × 10⁻⁵°, the average deviation was −4.5 × 10⁻⁶°, and the standard deviation was 2.08 × 10⁻⁵°. For yaw angle measurement, the maximum devi-ation was 4.96 × 10⁻⁵°, the average deviation was 9.71 × 10⁻⁶°, and the standard deviation was 1.86 × 10⁻⁵°. The results of comparison experiments showed that the proposed DPMI can accurately measure the rotational angle and is suitable for compensating for the dis-placement measurement of linear stages.
0.000 0.002 0.004 0.006 0.008 0.010-6.0x10⁻⁵
-4.0x10⁻⁵
-2.0x10⁻⁵
0.0
2.0x10⁻⁵
4.0x10⁻⁵
-0.012
-0.009
-0.006
-0.003
0.000
0.003
Deviation
Pitc
h an
gle
(°)
Position of the M-038.DG1 stage(°)
Dev
iatio
n(°)
DPMI Renishaw interferometer
4.0×10⁻⁵
2.0×10⁻⁵
0.0
−2.0×10⁻⁵
−4.0×10⁻⁵
−6.0×10⁻⁵
0.003
0.000
−0.003
−0.006
−0.009
−0.012
0.000 0.002 0.004 0.006 0.008 0.010-6.0x10⁻⁵
-4.0x10⁻⁵
-2.0x10⁻⁵
0.0
2.0x10⁻⁵
4.0x10⁻⁵
6.0x10⁻⁵
0.000
0.003
0.006
0.009
0.012
DeviationY
aw a
ngle
(°)
Position of the M-038.DG1 stage(°)
Dev
iatio
n(°)
DPMI Renishaw interferometer 4.0×10⁻⁵
2.0×10⁻⁵
0.0
−2.0×10⁻⁵
−4.0×10⁻⁵
−6.0×10⁻⁵
6.0×10⁻⁵
(a) (b)
Figure 5. Comparison of experimental results of angle measurement: (a) pitch angle; the blue dots are shifted by 0.001° to make the plots visible; (b) yaw angle; the blue dots are shifted by 0.001° to make the plots visible.
Table 1. Rotational angle: comparison of experimental results.
Angle Maximum Deviation (°)
Deviation Average (°)
Standard Deviation (°)
Pitch 3.88 × 10⁻⁵ −4.5 × 10⁻⁶ 2.08 × 10⁻⁵ Yaw 4.96 × 10⁻⁵ 9.71 × 10⁻⁶ 1.86 × 10⁻⁵
4.3. Differential Displacement Measurement with Rotational Angle Compensation In this displacement measurement experiment, the measuring mirror M2 of DPMI and
the measuring reflector of the Renishaw interferometer were mounted back to back on the M531.DD1 stage. After the setup was constructed, the displacement compensation
Figure 5. Comparison of experimental results of angle measurement: (a) pitch angle; the blue dotsare shifted by 0.001◦ to make the plots visible; (b) yaw angle; the blue dots are shifted by 0.001◦ tomake the plots visible.
Table 1. Rotational angle: comparison of experimental results.
Angle MaximumDeviation (◦)
AverageDeviation (◦)
StandardDeviation (◦)
Pitch −4.74 × 10⁻⁵ −5.71 × 10⁻⁶ 1.68 × 10⁻⁵
Yaw 4.96 × 10⁻⁵ 9.71 × 10⁻⁶ 1.86 × 10⁻⁵
4.3. Differential Displacement Measurement with Rotational Angle Compensation
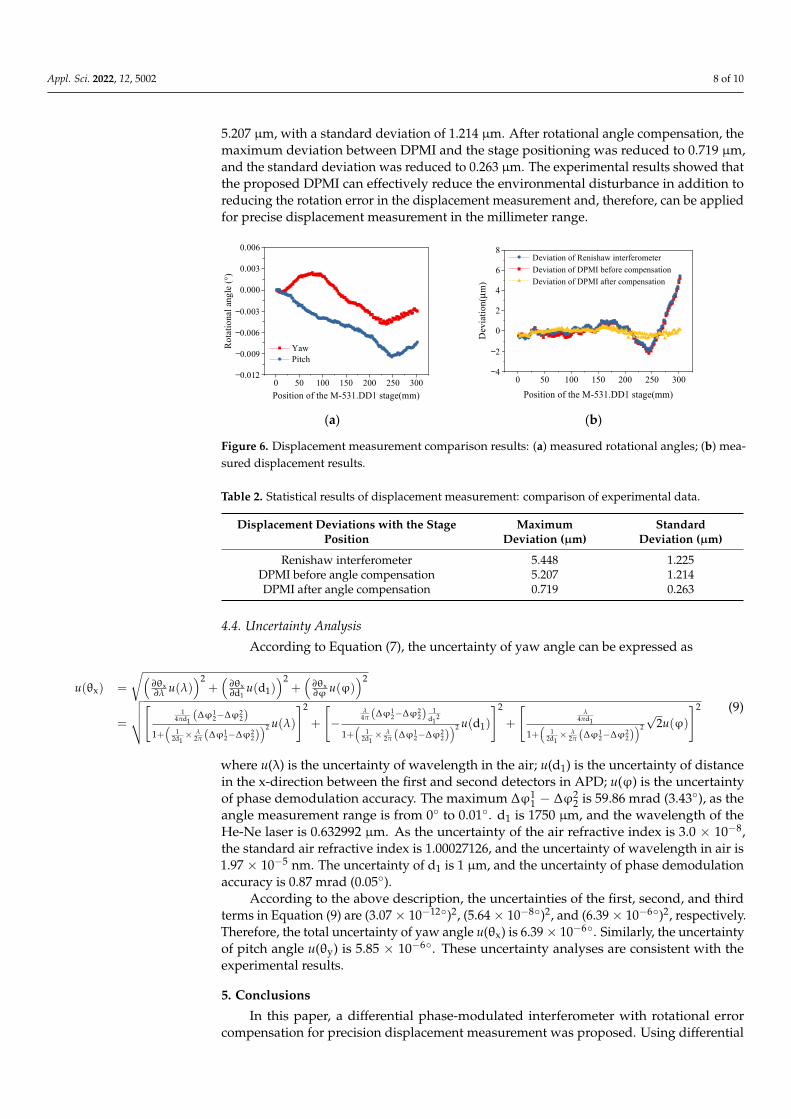
In this displacement measurement experiment, the measuring mirror M2 of DPMIand the measuring reflector of the Renishaw interferometer were mounted back to backon the M531.DD1 stage. After the setup was constructed, the displacement compensationparameters in Equation (8) were obtained. The distances S0 and S1 were 236 mm and195mm, respectively, and the distances Hx and Hy were 90 mm and 12 mm. During theexperiment, the M531.DD1 stage drove the two measuring reflectors to move from 0 mmto 300 mm, with a step increment of 2 mm, simultaneously measuring the displacementand rotation angle via DPMI and the displacement via the Renishaw interferometer, forcomparison.
The experimental results of displacement comparison are shown in Figure 6 andTable 2. As shown in Figure 6a, the maximum yaw and pitch angles of the M531.DD1stage were −0.0048◦ and −0.0095◦, respectively. As shown in Figure 6b, the displacementmeasurement results of the Renishaw interferometer are shifted upward by 20 mm forclarity. The maximum deviation between the Renishaw interferometer and the stagepositioning was 5.448 µm, with a standard deviation of 1.225 µm. Before rotational anglecompensation, the maximum deviation between DPMI and the stage positioning was
Appl. Sci. 2022, 12, 5002 8 of 10
5.207 µm, with a standard deviation of 1.214 µm. After rotational angle compensation, themaximum deviation between DPMI and the stage positioning was reduced to 0.719 µm,and the standard deviation was reduced to 0.263 µm. The experimental results showed thatthe proposed DPMI can effectively reduce the environmental disturbance in addition toreducing the rotation error in the displacement measurement and, therefore, can be appliedfor precise displacement measurement in the millimeter range.
Appl. Sci. 2022, 12, x FOR PEER REVIEW 8 of 10
parameters in Equation (8) were obtained. The distances S0 and S1 were 236 mm and 195mm, respectively, and the distances Hx and Hy were 90 mm and 12 mm. During the experiment, the M531.DD1 stage drove the two measuring reflectors to move from 0 mm to 300 mm, with a step increment of 2 mm, simultaneously measuring the displacement and rotation angle via DPMI and the displacement via the Renishaw interferometer, for comparison.
The experimental results of displacement comparison are shown in Figure 6 and Ta-ble 2. As shown in Figure 6a, the maximum yaw and pitch angles of the M531.DD1 stage were −0.0048° and −0.0095°, respectively. As shown in Figure 6b, the displacement meas-urement results of the Renishaw interferometer are shifted upward by 20 mm for clarity. The maximum deviation between the Renishaw interferometer and the stage positioning was 5.448 μm, with a standard deviation of 1.225 μm. Before rotational angle compensa-tion, the maximum deviation between DPMI and the stage positioning was 5.207 μm, with a standard deviation of 1.214 μm. After rotational angle compensation, the maximum de-viation between DPMI and the stage positioning was reduced to 0.719 μm, and the stand-ard deviation was reduced to 0.263 μm. The experimental results showed that the pro-posed DPMI can effectively reduce the environmental disturbance in addition to reducing the rotation error in the displacement measurement and, therefore, can be applied for pre-cise displacement measurement in the millimeter range.
0 50 100 150 200 250 300-0.012
-0.009
-0.006
-0.003
0.000
0.003
0.006
Rota
tiona
l ang
le (°
)
Position of the M-531.DD1 stage(mm)
Yaw Pitch
−0.003
−0.006
−0.009
−0.012
0 50 100 150 200 250 300-4
-2
0
2
4
6
8
Dev
iatio
n(μm
)
Position of the M-531.DD1 stage(mm)
Deviation of Renishaw interferometer Deviation of DPMI before compensation Deviation of DPMI after compensation
−2
−4
(a) (b)
Figure 6. Displacement measurement comparison results: (a) measured rotational angles; (b) meas-ured displacement results.
Table 2. Statistical results of displacement measurement: comparison of experimental data.
Displacement Deviations with the Stage Position
Maximum Deviation (μm)
Standard Deviation (μm)
Renishaw interferometer 5.448 1.225 DPMI before angle compensation 5.207 1.214 DPMI after angle compensation 0.719 0.263
4.4. Uncertainty Analysis According to Equation (7), the uncertainty of yaw angle can be expressed as
( ) ( ) ( ) ( )
( )
( )( )
( )
( )( )
( )
θ θ θθ λ φ
λ φ
λ λΔφ ΔφΔφ Δφππ π
λλ λ λΔφ Δφ Δφ Δφ Δφ Δφπ π π
∂ ∂ ∂ = + + ∂ ∂ ∂
= + − + + × + × + ×
22 2
x x xx 1
1
2 2
1 21 22 22 2 2
1 1 112 2
1 2 1 2 1 22 2 2 2 2 2
1 1 1
dd
11 --44 d d 4 d
d1 1 11 - 1 - 1 -
2d 2 2d 2 2d 2
u u u u
u u ( )φ
2
2 2u
(9)
Figure 6. Displacement measurement comparison results: (a) measured rotational angles; (b) mea-sured displacement results.
Table 2. Statistical results of displacement measurement: comparison of experimental data.
Displacement Deviations with the StagePosition
MaximumDeviation (µm)
StandardDeviation (µm)
Renishaw interferometer 5.448 1.225DPMI before angle compensation 5.207 1.214DPMI after angle compensation 0.719 0.263
4.4. Uncertainty Analysis
According to Equation (7), the uncertainty of yaw angle can be expressed as
u(θx) =
√(∂θx∂λ u(λ)
)2+(
∂θx∂d1
u(d1))2
+(
∂θx∂ϕ u(ϕ)
)2
=
√√√√[ 14πd1
(∆ϕ12−∆ϕ2
2)
1+(
12d1× λ
2π (∆ϕ12−∆ϕ2
2))2 u(λ)
]2
+
[−
λ4π (∆ϕ1
2−∆ϕ22)
1d1
2
1+(
12d1× λ
2π (∆ϕ12−∆ϕ2
2))2 u(d1)
]2
+
[λ
4πd1
1+(
12d1× λ
2π (∆ϕ12−∆ϕ2
2))2
√2u(ϕ)
]2 (9)
where u(λ) is the uncertainty of wavelength in the air; u(d1) is the uncertainty of distancein the x-direction between the first and second detectors in APD; u(ϕ) is the uncertaintyof phase demodulation accuracy. The maximum ∆ϕ1
1 − ∆ϕ22 is 59.86 mrad (3.43◦), as the
angle measurement range is from 0◦ to 0.01◦. d1 is 1750 µm, and the wavelength of theHe-Ne laser is 0.632992 µm. As the uncertainty of the air refractive index is 3.0 × 10⁻⁸,the standard air refractive index is 1.00027126, and the uncertainty of wavelength in air is1.97 × 10−5 nm. The uncertainty of d1 is 1 µm, and the uncertainty of phase demodulationaccuracy is 0.87 mrad (0.05◦).
According to the above description, the uncertainties of the first, second, and thirdterms in Equation (9) are (3.07× 10⁻¹²◦)2, (5.64× 10⁻⁸◦)2, and (6.39× 10⁻⁶◦)2, respectively.Therefore, the total uncertainty of yaw angle u(θx) is 6.39× 10⁻⁶◦. Similarly, the uncertaintyof pitch angle u(θy) is 5.85 × 10⁻⁶◦. These uncertainty analyses are consistent with theexperimental results.
5. Conclusions
In this paper, a differential phase-modulated interferometer with rotational errorcompensation for precision displacement measurement was proposed. Using differential
Appl. Sci. 2022, 12, 5002 9 of 10
optics design and APD-based angle measurement, the environmental disturbance and therotation error in the displacement measurement were minimized. Three experiments forfeasibility verification were carried out. In the differential displacement stability experiment,the displacement drift was only 16.3 nm during 100 min using DPMI. In the rotational anglecomparison experiment, the standard deviations of pitch and yaw between DPMI andRenishaw interferometer were 1.68 × 10⁻⁵◦ and 1.86 × 10⁻⁵◦, respectively. In comparisonwith our previously obtained standard deviations of 6.91 × 10⁻⁵◦ and 9.349 × 10⁻⁵◦
using the DWS technology, standard deviations in this study were reduced to about one-third of the originals. In the differential displacement measurement with rotational anglecompensation, after compensation, the maximum deviation between the measurementresult of DPMI and the stage positioning was reduced from 5.207 µm to about 0.719 µm,and the standard deviation was reduced from 1.214 µm to 0.263 µm. This result is in goodagreement with the positioning accuracy of the linear stage. These experimental resultsverify the feasibility and effectiveness of the proposed interferometer and demonstrate thatit can be applied in the field of precision displacement measurement.
Author Contributions: Conceptualization, methodology, Writing—review and editing, L.Y.; inves-tigation, validation, formal analysis, Y.Y.; supervision, project administration, funding acquisition,data curation, B.C.; software, investigation, writing—original draft preparation, Y.L. All authors haveread and agreed to the published version of the manuscript.
Funding: This research was funded by the National Natural Science Foundation of China, grant num-bers 51875530 and 52005449; Natural Science Foundation of Zhejiang Province, China, grant numberLQ20E050002; Program for Changjiang Scholars and Innovative Research Team in University, grantnumber IRT_17R98; and Postdoctoral Science Preferential Funding of Zhejiang Province (ZJ2021122).
Institutional Review Board Statement: Not applicable.
Informed Consent Statement: Not applicable.
Data Availability Statement: The data presented in this study are available on request from thecorresponding author.
Conflicts of Interest: The authors declare no conflict of interest.
References1. Gao, W.; Kim, S.W.; Bosse, H.; Haitjema, H.; Chen, Y.L.; Lu, X.D.; Knapp, W.; Weckenmann, A.; Estler, W.T.; Kunzmann, H.
Measurement Technologies for Pecision Positioning. CIRP Ann. 2015, 64, 773–796. [CrossRef]2. Lin, Y.H.; Chang, W.L.; Hsieh, C.L. Shot-noise Limited Localization of Single 20 nm Gold Particles With Nanometer Spatial
Precision Within Microseconds. Opt. Express 2014, 22, 9159–9170. [CrossRef] [PubMed]3. Lipus, L.C.; Budzyn, G.; Acko, B. Analysis of Laser Interferometer Measurement Uncertainty by Simulating Error Sources. Int. J.
Simul. Model. 2021, 20, 339–350. [CrossRef]4. Gao, H.; Wang, Z.; Zou, W.; Liu, Y.; Sun, S. High-accuracy Measurement System for The Refractive Iindex of Air Based on A
Simple Double-beam Interferometry. Opt. Express 2021, 29, 1396–1411. [CrossRef] [PubMed]5. Hill, I.R.; Hendricks, R.J.; Donnellan, S.; Gaynor, P.; Allen, B.; Barwood, G.P.; Gill, P. Dual-axis Cubic Cavity for Drift-compensated
Multi-wavelength Laser Stabilisation. Opt. Express 2021, 29, 36758–36768. [CrossRef] [PubMed]6. Clark, L.; Shirinzadeh, B.; Tian, Y.; Oetomo, D. Laser-Based Sensing, Measurement, and Misalignment Control of Coupled Linear
and Angular Motion for Ultrahigh Precision Movement. IEEE/ASME Trans. Mech. 2014, 20, 84–92. [CrossRef]7. Zhang, E.; Chen, B.; Zheng, H.; Yan, L.; Teng, X. Laser Heterodyne Interferometer with Rotational Error Compensation for
Precision Displacement Measurement. Opt. Express 2018, 26, 90–98. [CrossRef] [PubMed]8. Yan, H.; Duan, H.Z.; Li, L.T.; Liang, Y.R.; Luo, J.; Yeh, H.C. A Dual-heterodyne Laser Interferometer for Simultaneous Measurement
of Linear and Angular Displacements. Rev. Sci. Instrum. 2015, 86, 123102. [CrossRef] [PubMed]9. Ge, Z.; Takeda, M. High-resolution Two-dimensional Angle Measurement Technique Based on Fringe Analysis. Appl. Opt. 2003,
42, 6859–6868. [CrossRef] [PubMed]10. Prakash, S.; Singh, S.; Rana, S. Automated Small Tilt-angle Measurement Using Lau Interferometry. Appl. Opt. 2005, 44, 5905–5909.
[CrossRef] [PubMed]11. Wang, D.; Yang, Y.; Liu, D.; Zhuo, Y. High-Precision Technique for In-Situ Testing of The PZT Scanner Based on Fringe Analysis.
Opt. Commun. 2010, 283, 3115–3121. [CrossRef]12. Heinzel, G.; Wand, V.; García, A.; Jennrich, O.; Braxmaier, C.; Robertson, D.; Middleton, K.; Hoyland, D.; Rüdiger, A.; Schilling, R.;
et al. The LTP Interferometer and Phasemeter. Class. Quantum Grav. 2004, 21, S581–S587. [CrossRef]
Appl. Sci. 2022, 12, 5002 10 of 10
13. Meshksar, N.; Mehmet, M.; Isleif, K.S.; Heinzel, G. Applying Differential Wave-Front Sensing and Differential Power Sensing forSimultaneous Precise and Wide-Range Test-Mass Rotation Measurements. Sensors 2020, 21, 164. [CrossRef] [PubMed]
14. Yu, X.; Gillmer, S.R.; Ellis, J.D. Beam Geometry, Alignment, and Wavefront Aberration Effects on Interferometric DifferentialWavefront Sensing. Meas. Sci. Technol. 2015, 26, 125203. [CrossRef]
15. Duan, H.Z.; Liang, Y.R.; Yeh, H.C. Analysis of Non-Linearity in Differential Wavefront Sensing Technique. Opt. Lett. 2016, 41,914–917. [CrossRef] [PubMed]
16. Lou, Y.; Yan, L.; Chen, B. A Phase Modulating Homodyne Interferometer with Tilting Error Compensation by Use of An IntegratedFour-Photodetector. Rev. Sci. Instrum. 2019, 90, 025111. [CrossRef] [PubMed]
17. Yan, L.; Chen, B.; Wang, B. A Differential Michelson Interferometer with Orthogonal Single Frequency Laser for NanometerDisplacement Measurement. Meas. Sci. Technol. 2017, 28, 045001. [CrossRef]
18. Wang, X.; Guo, X.; Wang, Y.; Jiang, C.; Jiang, J.; Zhang, Z. All-Fiber Differential Interferometer for Nanometric DisplacementMeasurement. Opt. Commun. 2020, 475, 126283. [CrossRef]
19. Rerucha, Š.; Holá, M.; Šarbort, M.; Hrabina, J.; Oulehla, J.; Cíp, O.; Lazar, J. Compact Differential Plane Interferometer withIn-Axis Mirror Tilt Detection. Opt. Lasers Eng. 2021, 141, 106568. [CrossRef]
20. Yan, L.; Chen, Z.; Chen, B.; Xie, J.; Zhang, S.; Lou, Y.; Zhang, E. Precision PGC Demodulation for Homodyne InterferometerModulated with a Combined Sinusoidal and Triangular Signal. Opt. Express 2018, 26, 4818–4831. [CrossRef]