A simulation study of the adsorption—concentration polarisation interplay in protein...
13
A SIMULATION STUDY OF THE ADSORPTION-CONCENTRATION F’OLARISATION INTERPLAY IN PROTEIN ULTRAFILTRATION VASSILTS GEKAS,t PTERRE ATMAR, JEAN-PIERRE LAFAILLE and VICTOR SANCHEZ URA CNRS dc Gknnic Cbimiquc, Lakatoirc dc Gknnie Chimique et Eleetroehimie, Universitk Paul Sabatier~ 118route de Narhonnc, 3 1082 Toulouse, Framx (Remiced 10 June 1991; accepted for publication 15 3mtuary 1993) Abet-A theoretical approach to study the &rption-poltirisatiom interplay in ultrafiltration is presented. The m&l is &d on transient tnagf transfer ia the boundary layer, with an appropriate ysourcc term” to aoxunt for adsorption on the wall boundary of rhe membrane. The membrane is assumed to be rotally selective and of homogeneous surface porosity. Permeate flux is modelled aa J = (AP - dII)/( R, + R&). where both AlI, the osmotic term. and Rad, the additional resistance due to adsorption, are time- dependent. This approach is basically d&rent from that of the semi-empirical models currently employed. The transient mass transfer equation is solved numerically using a tridiagonal matrix algorithm. The evolution of flux and wall concentration over time is obtained for elected values of the pdarisa~iotl and adsorprion parameuxs involvti, particularly in reference to protin ultrafiltration, However, the model can also be applied in a more general way. The characteristic trend for the interplay of the two phenomena, as the simulation results indicate, is for the wall conozntration to increase initially for a very shoit time and then decrease towards a steady-state or quasi-steady-state Bevel jn the long term. Preliminary experiments carried out yielded results in cl= agreement with the m&z1 con~rning flux as a function& time and steady-state flux as a Function of pressure. I. INTRODIJ~ION The role of both adSorption and concentration polar- isation as limiting phenomena in ultra6ltration are recognized generally today by those working in the area. Neverthelm little has been done to study the combined effect of the two phenomena. Modelling vf coricentration polarisation baa4 on film theory often assumes there to be nu adsorption. Adsorption, sim- ilarly, has primarily been studied under conditions in which poiarisaticm is negligible or is at a constant IWel. In practice, empirical of semiempirical model5 have been used to explain the typical flux decline observed over time (Fig. 1). These take the two phe nomcna into account in a simple additive way. The sharp decrease observed at the start is attributed to the build-up of polarisation, fouling here being nag- lected. The smoother and slower decline towards a steady or quasi-steady state which follows tends, in turn, to he attributed to fouling. The erect of the latter is seen as being superimposed on that of polarisation, which is often assumed to remain constant over time (Aimar et al., 1988). Although such modeIs may sometimes fit the ex- perimental data, they are unclear regarding how much of this flux reduction is reversible. This is an important point since, if the flux loss under steady- state conditions is as the above models suggest, mainly due to concentration polarization, and is, thus, ‘mnt address: Department of Food Engineering, hi- &ity of Lund, P.O.B. 124, 221 Q0 Lund, Sweden. A I Time Fig, t. A !ypical flux decline curve in tie ultrafiltration of a macromolecular solution+ The period of uuttal rapid d-line comprises somt tens of minutes and the Mowing slow dedine some hours. basically reversible, it should readily be overcome after ultrafiltration through simply passing water over the,membrane without use of chemical cleaning. Ex- perience often indicates, however, that most of the flux loss is irrevers&,le. In addition, the models referred to abve fail to take account of the possible effects on concentration polar&at&r which changes in flux based on fouling may have. The steady-state flux values obtained at diffemht transmembrane presstis from zEro to a critical level- ling-off (Fig. 2) often yield an almost straight line coinciding with the “bystek” line obtained in prac- tice. when the pressure is deceasing. This is indicative of rtsgligible Polaris&on. This is in disagreement with CES 48%:I5-F
Transcript of A simulation study of the adsorption—concentration polarisation interplay in protein...

A SIMULATION STUDY OF THE ADSORPTION-CONCENTRATION F’OLARISATION
INTERPLAY IN PROTEIN ULTRAFILTRATION
VASSILTS GEKAS,t PTERRE ATMAR, JEAN-PIERRE LAFAILLE and VICTOR SANCHEZ
URA CNRS dc Gknnic Cbimiquc, Lakatoirc dc Gknnie Chimique et Eleetroehimie, Universitk Paul Sabatier~ 118 route de Narhonnc, 3 1082 Toulouse, Framx
(Remiced 10 June 1991; accepted for publication 15 3mtuary 1993)
Abet-A theoretical approach to study the &rption-poltirisatiom interplay in ultrafiltration is presented. The m&l is &d on transient tnagf transfer ia the boundary layer, with an appropriate ysourcc term” to aoxunt for adsorption on the wall boundary of rhe membrane. The membrane is assumed to be rotally selective and of homogeneous surface porosity. Permeate flux is modelled aa J = (AP - dII)/( R, + R&). where both AlI, the osmotic term. and Rad, the additional resistance due to adsorption, are time-
dependent. This approach is basically d&rent from that of the semi-empirical models currently employed. The transient mass transfer equation is solved numerically using a tridiagonal matrix algorithm. The evolution of flux and wall concentration over time is obtained for elected values of the pdarisa~iotl and adsorprion parameuxs involvti, particularly in reference to protin ultrafiltration, However, the model can also be applied in a more general way. The characteristic trend for the interplay of the two phenomena, as the simulation results indicate, is for the wall conozntration to increase initially for a very shoit time and then decrease towards a steady-state or quasi-steady-state Bevel jn the long term. Preliminary experiments carried out yielded results in cl= agreement with the m&z1 con~rning flux as a function& time and steady-state flux as a Function of pressure.
I. INTRODIJ~ION
The role of both adSorption and concentration polar- isation as limiting phenomena in ultra6ltration are recognized generally today by those working in the area. Neverthelm little has been done to study the combined effect of the two phenomena. Modelling vf coricentration polarisation baa4 on film theory often assumes there to be nu adsorption. Adsorption, sim- ilarly, has primarily been studied under conditions in which poiarisaticm is negligible or is at a constant IWel.
In practice, empirical of semiempirical model5 have been used to explain the typical flux decline observed over time (Fig. 1). These take the two phe nomcna into account in a simple additive way. The sharp decrease observed at the start is attributed to the build-up of polarisation, fouling here being nag- lected. The smoother and slower decline towards a steady or quasi-steady state which follows tends, in turn, to he attributed to fouling. The erect of the latter is seen as being superimposed on that of polarisation, which is often assumed to remain constant over time (Aimar et al., 1988).
Although such modeIs may sometimes fit the ex- perimental data, they are unclear regarding how much of this flux reduction is reversible. This is an important point since, if the flux loss under steady- state conditions is as the above models suggest, mainly due to concentration polarization, and is, thus,
‘mnt address: Department of Food Engineering, hi- &ity of Lund, P.O.B. 124, 221 Q0 Lund, Sweden.
A
I Time
Fig, t. A !ypical flux decline curve in tie ultrafiltration of a macromolecular solution+ The period of uuttal rapid d-line comprises somt tens of minutes and the Mowing slow
dedine some hours.
basically reversible, it should readily be overcome after ultrafiltration through simply passing water over the,membrane without use of chemical cleaning. Ex- perience often indicates, however, that most of the flux loss is irrevers&,le. In addition, the models referred to abve fail to take account of the possible effects on concentration polar&at&r which changes in flux based on fouling may have.
The steady-state flux values obtained at diffemht transmembrane presstis from zEro to a critical level- ling-off (Fig. 2) often yield an almost straight line coinciding with the “bystek” line obtained in prac- tice. when the pressure is deceasing. This is indicative of rtsgligible Polaris&on. This is in disagreement with
CES 48%:I5-F

Fig. 2. *A typical flux a pre~ure. curve in the ultra6lt~tion or a macronloIecuIar dution. The pure water flux is ob- tinei piw lo UF. Its slope relative to the pressure axb gives tbc initial membrane resistance, R,. The dape of the straight line, obtaimd when decreasing the procure or the “hysteesis line”, gives the total resistanck aker adsorption has baen completed. It reprwmts the sum of the initial resistanoz and the tistana added due to adsorptisn, B swn which under L,anpuir conditions is equal to RJl -I_ R*).
what the above-mentioned models suggest, which explain only the curve obtain& when the pressure is increased. The discrepancies here suggest that during ultra6ltration an interaction b3wwn polarisatioti and adsorption may occur.
Doshi (1986) has developed a model for the inter- play of adsorption and polarisation in an unstirred batch cell. His aim was to identify factors limiting flux in the ultr<ration of macromolecules. Doshi argues that, in general, both diffusion in the boundary layer and adsorption are important. but he considers adsorption kinetics to be diffusion-limited in all: ca8es.
However, the diffusion-limited case, involving rel- atively rapid intrinsic adsorption kinetics, is a simpli- fication for proteins, even in the absence of convective transport near the surface (Wojckhowski and Brash, 1990). Studies of adsorption of proteins on mem- branes (Matthiasson, 1983, 1984; Aimar et aI., 1986; Robertson and Zydney, 1990) show that adsorption occurs slowly enough to be the controlling step.
Wojciechowski and Brash (1990) worked with adsorption on non-porous surfaces (no convection). Nevertheless, their consideration of various adsorp- tion and desorption mechanisms is of relevance to the kinetics of adsorption in general, although their ana- lysis was Limited to first-order equations. They placed emphasis on kinetically limited mechanisms, disre- garding isotherm aspects.
In this study, a more flexible approach has been taken in order lo accommodate both adsorption kin- etics atld isotherm models. At the s&me time, the model developed is particularly applicable to the ultrafiltration of proteins. The modd is based on the generalized diausion equation for the polari& boundary layer, completed by a source term for adsorption, which is properly included in the bound- ary conditions at the membrane surface. As a tit step, simulation results are .used here to explain the trends OF exprimental observations. Further expeti- mental work would be r~cecfecl in particular to provide more complete data on the adsorption parameters of
various proteins on different types -of membranes in order to enable the model which has been developed to be used in a predictive way.
2 THEORY
2.1. General&d d@sion equation The solute mass transfer equation for the ooacen-
tratiotr ~olarisation boundary layer, assuming dif- fusion. and wnvection par&e1 to the membrane sur- face to TV negligible, is written as follows:
BC@t + Uacfay = DPCf8yZ (1)
where C is the concentration of the -lute (kg/m’, the same as s/r), u the velocity (m/s) normal to the mem- brane, equal to the average permeate flux (m3/m2 s), y the distance on the boundary Iayer (rn), with y = 0 at the interface with the bulk solution and y = 6 (6 the layer thic%zn@ at the liquid+oLid (membrane) inter- faq D the diflusion ooefficicnt (m’/s) wumed to be concentration-indepeudenendtnt.
The initial condition is
C(v) - Co (at t = 0) (2)
and the boundary conditions are
(a) for y = 0. C(O) = Co (all t) (3)
(b) for y = d and for a perfectly selective membrane
u C(d. r) = - WC&, t),‘ay] + s (4)
where s is the source term mnccrning the solute quantity adsorbed on the membrane surfaaz, given as
s - dCJdt (5)
where C= (ii kdm’) is the quantity adsorbed at a given time I [corresponding to r (Aimar et al., I Mg)].
2.2. Flux equation This model appIies to membratus of rather homo-
geneous surface porosity so that the ConveEtivt flow velocity u can lx set equal to the average permeate flux. In other words, the permeate flux defines a mean flow velocity, assumed to be equal to the convectjve flow velocity in the boundary Iayer. At any given time t, the following reIationship is assumed to hold:
u = JS = +W - Al-I)/(R, + Ra (61
where 11Tl is given by a polynomial expression of the folIowing type:
AI7 = b,C + b$= + b3C3 PI
where AII is the difference in osmotic pmure of the solutions separated by the membrane. R, ia the itiitial resistance of the membrane, equal to AP/JOm where J,, is the pure water flux prior to ultrafiltration and Rad the additional resistance due to adsorption.
2.3. Alorptiun models Aimur et al. (1986) have proposed the following
general-order kinetics equation for the adsorbed pro- t&n quantity on an ultrafiltration membrane and for

the additional resisiana? R,,,
&,dt = p’C(d, r)=‘(C.. - Cd’ @a)
dR,/df = pC{d, +( %, - R,,$ (W
III integrated form eq. (8b) becomes
R, = &[I -exp(-pC(d,t)*r)]. (SC)
C, is used instead of f_ of Wojciechowski and Brash (1990) &h the additional difkrenw that Aimar et al. (1986) dlow both this quantity and %, to depend on the concentratiorr in accotdancc with a Langmuir or Freundlich model:
c,, = A’C(d,t)/[I + B’C(d,t))
R, = AC(d, rj/[l + BC(d, t)J (+a)
C,, = AC’(d, t)+, R, = AC(d, q. I9b)
The above equations constitute a simplification of the problem faced in practice, since fouling phe- nomena other -than that of adsorption may be present. It is, thus, very probable that after a period required for coverage of the surface by an adsorbed monolayer, the protein is deposited a-r&g to same other form of kinetics. In the literature a simple first-order equa- tion has been considered for this case. In addition, the situation may become more camplicated through the crosslinking of protein molecules in the deposited layer. Due to the complicated nature of the fouling problem, we pcefcrrcd in this study to start with a simpfi&d approach which nevertheless provides a good approximation of what happens at the very beginning of ultrafiltration, an approach which can be improved stepwise by use of appropriate equations for the source term and for the additional r&stance which the other phenomena just mentioned produce.
2.4. Numerical sohtion Equations (I)-(Pb), constituting a system solvable
by numerical methods, are made dimensionless through defining
Y’ = y/d (loa)
U* = LI/~ where u0 = JVo UW
t* = t/t, where 5 = b/u, (1oC)
Fe = u,8/D = u0 f k (Km)
c* = c/c, (1QeI
AP* = AJf/AF (IOf)
s* = s/(u,C,) (1QgI
Rzd = RtijR, IlW p* = pc;t or p- = p’C$‘t (loi>
A* = AGJR, aud B* = BC, &angmuir)
(W) OC
A* = R”Cf#, (Freundlich). (IOk)
The transfomd equations are given below:
c’(y*,o) = 1 (29
c* (0, r*) = 1 (37
PC*& t*) + (l/Pe)dC*(l, t*)/dy = 5’ (4’)
u* = (is- AP*)/(l -I- Rs) W)
R.* = Rzc[ 1 - exp (- p+C*Y)]. (s*)
The discretisation ofeqs (I*)-(49, the details of which are given in the Appendix, is based on an implicit method proposed by Richtmeyer and Morton (1967). This method makes use of the concept of the tridiago- nal matrix. The results of the model are given in terms of dimensionless flux. tk* as a function of time and dimensionl~s concentration C* as a function both of distance y and time. Dimensionless time can be converted into real time using eq. (IOF).
25. Physical meaning and s&ction of th input para- meters
nte initial Pe number, defined in eq. (l&f), is a measure of the ratio of convection to diffusion in the boundary layer; thus, it provides an indicaiion of the importance of the polarisation found in the boundary layer. A high value for Pe corresponds to a strong concentration at the membrane-solution interface.
Variations in pressure and cross-flow velocity are included in the Peclet number, since the pressure for a given membrane defines the initial water Rux, uo(JUo), whereas cross-flow velocity influences the mass trans- fer coefficient. k. for a given module geometry. Varia- tlons in the initial concentration. Cc? also influence the Pe number: at high Co values, k decreases because of changes in the physicaI properties of the solute. Lafaille (1984) has shown empirically that the influ- ence of this can be described by a power law as follows:
k = AR&&
In the case of serum albumin c = - 0.39. Since the permeate concentration in macromofe-
cubs is generally low, ATI is equal to the osmotic pressure of the mtentate at the wall and on the coefhcients bi, values of which for BSA at pH = 7 arc known from the literature (Vilker er al., INi). The speed of development of the polarised layer is indic; atcd by the characteristic time r defined in eq. (l(k) as the time needed at the start of ultrafiltration for a molecule to travel a distance 6, the thickn~ of the layer, which is given as D/k, k being the mass transfer coefficient. A measure of the relative magnitude of the adsorbed quantity is given by the dimensionless term of source s*, defined in cq. (108) as the ratio of adsorption to initial convective flux. It is possible to define an initial value of s* as

Values QF A’, n’, p’ md x’ for BSA adsorbed on a polyaerylenitrile membrane at pH = 7 were reported by Aimar et al. (I986) and are shown in Table I.
Previous experimental studies have shown that the quantity of adsorbed, proteins obeys an isotherm of Freundiicb type, wh& the additional resistance fol- lows either a Langrnuir (MA, poIyacryIonitri1~ tnetr-
brane, pH = 7.2) or a Fraundlich (BSA, polyacryloni- tdle membrane, pH = 2 ur 4.7) type of isotherm (Aimar et al., 1986).
There is a relation between adsorbed material C, and resistance R;,:
R,, = k’c’ (13)
k’ being a constant and m depending upon pH. Ac- cording to Aimar et al. (1986), MC 1 for BSA adsorp- tion at pHc7. According to Matthiasson (1984), at pH = 7, m is equal to one tinti a Welling-off value {m = 0) of R,, is reached (corresponding to C,, of lo-20 mg/m2 in the case ol BSA on polysulphone and cellulose acetate membranes).
This shows that it is possible to observe a levelling- offfor the resistance due to adsorption at pH = 7 even though the adsorbed quantity shows a “FreuncKch” type of behaviour. Nilsson (1989) has observed similar hehaviour of j?-lactoglobulin on a polysulpbone {20 kD) membrane. Initially, the amount of protein adsorbed showed a sharp increaM of R,, I&ore levelling off at 100-200 mg/m’. However, at high Cd., values (from 200 up to 1200mg_Im”) a secondary mechanism seems to be responsible for a new increase in the additional resistance, this increase, however, Mug weaker than tbhe first one.
Results reported by Nilsson (1989) show that the resistance “isotherms” for protein concentrations up to 250 g/kg of both r-lactalbumin and &lactoglo- bulin, as well as of whey protein concentrate, contain
more than one plateau. This complicated situation is probably asstiated with pore-related phenomena, since in these cases the proteins are only pdrtly re- tained by the membrane. In the case 0s Langmuir isotherms, mainly considered in this study, for a homogeneous tnembrane totally retaining the protein, the resistance tends towards a plateau value, I?+, which represents a maximum, or a “saturation” of the additional resistance, for a given membrane/pro&n pair:
R’ = A /( RJ3) (14)
where Rzd, R,‘, and R* are sh&u schematically in Fig 3. R* is the parameter consisting of the initial
WC R’
%“.,
t’
C-A CI
Fig. 3. Diagram showing the relationship between I&, R& and Rt’. For a given sofution concentration Cl;, RL is a function of time t* (tide box) its asymptotically ap- pFO2lChiIlg R:, e e is a ruwtion of conwntration Only (main box}. When this function, the “isotherm”. follows a L&mdr IW, the upper limit is the maximum added resiatanct R+, which is independent. of C+ and characterisea a given membrane/adsorbed macromolecule pair. All resistanas have been reduced by the initial membrane resistance; there-
fore they are dimmsionle~.
Table 1. Input parameters, their influenrr atrd selected values used in the study
Adsorption P0larisatioi-l
SiE Kinetics sizs Kinetics Selected values
+
+
+
+ + +
+
+
+
11.1, 1 and IO &$I or kg/m3) 2.5, 4, 6. 7,9, IO, 15
0.5-10 (6) to-2,10-3,O I, 0.1, 10-2, to-“. to-4 0, 0.5, I, 2.5. 5
%, = 2.3 x 10-s, bz = - 3.3 x 10m6, b, = 4 x IO-" for BSA at pH = 7, where the concentra- tion is in kg/m” and the presaurc All in bar ( to3 Pa) (Vilker tit crL, L981k
JAs BII example, for BSA at pH = 7 adsorbed on a 2W kD polyaerylonitrile membrane. S$ = 1.8 x 10-j [based on values reported by Aimar et aI. (1986), given in SI units, with p’ = s x 10-4, A’ - 9x 10⁻⁵, n’ = 0.65. x’ = O-051. The adsorbed protein amounts repot-tad by Matthiasson (19X3), I*lilsson (1989) and Robertson and Zydney (1990) differ somewhat due to differences in measurement methodology. They nevertheless lie within the limits obtained for the selected values employed hcrc.
Measured R* values (this study) for BSA on a polyacrylonitrile and a polysulphone M kD membrane were 2.5 and 4.2 respectively. Robertson and Zydaey UWI) found mtitwm additional resistance values of 1.5 up to 5 for BSA and polyethersulphone membranes OI various cut-ufT values (5&3MI kl)).
input values, known a priori or selected. It is a meas- ure &f the relative magnitude of the resistan& due to adsorption compared to the initial membrane resist- ance R,. A u&ul relationship exists between the initial Paclet number (Fe = rr,JK) and a final Per value which character&s the “saturated” membrane:
PC, = Pe/(l f Iv) = u,/k I151
where uJ is pure-wa!er flux through the membrane after fouling to saturation (additional fouling resist- ance, R*). In the Freundlich case, a similar parameter R* may be defined as A”‘/R,, but R* no longer represents a limiting value due to the exponential dependence of R,*, on conentration [eq. (9b)J.
Concerning the kinetics, the parameter p* defined in eq. (loi) becomes a measure of the relative rate of adsorption compared to the rate of polarisation, since it ‘is a ratio between r, the characteristic time of polarisation, and tad. = PC;)- ’ I , which is a character- istic time of adsorption. At t = tyds,
R sds = R,,(t - I/e) = 0.633R,,
by virtue of eq. (Sb).
3. EXPERIMENTAL PART
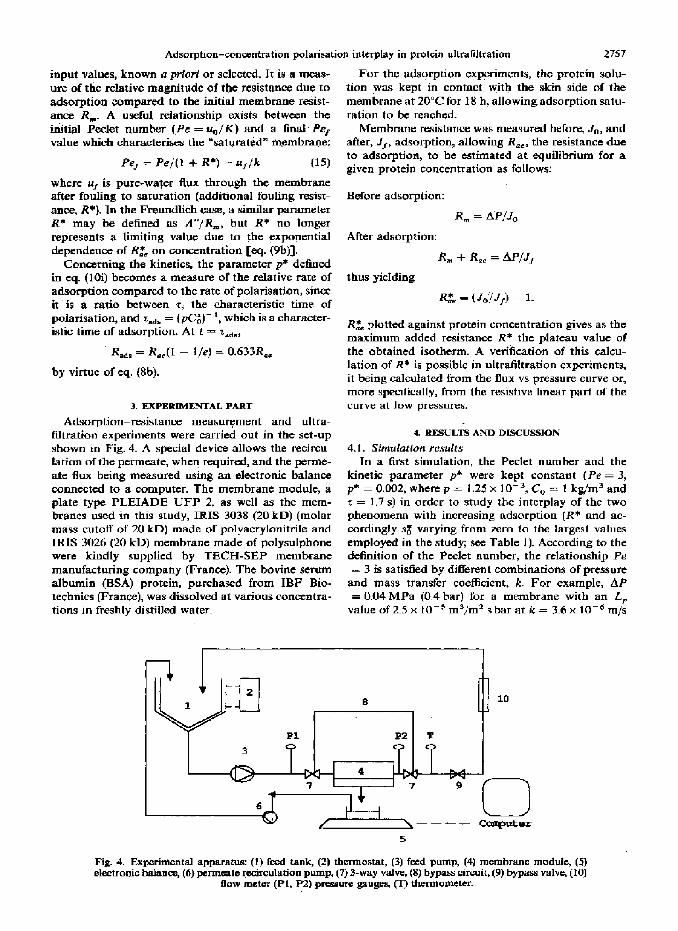
Adsorption-resistance measurement and ultra- filtration experiments were carried out in the set-up shown in Fig. 4. A special device allows the recircu- lation of the permeate, when required, and the perme- ate flux being measured using an electronic balance connected to s computer. The membrane module, a plate type PLEIADE UFP 2, as well as the mem- branes used in this study, IRIS 3038 (20 kD) (molar mass cutoff of 20 kD) made OF polyacrylonitrile and IRlS 3026 (20 kD) membrane made of polgsulphone were kindly supplied by TECH-SEP membrane manufacturing company (Fran+. The bovine serum albumin (BSA) protein. purchased from IBF Bio- technics (France), was dissolved at various concentra- tions in freshly distilled water.
For the adsorption exwments, the protein solu- tion was kept in contact with the skin side of the membrane at 20°C for 18 h, allowing adsorption satu- ration to bt reached.
Membrane resistance was measured before, J,,. and after, J,, adsorption, allowing R,,, the resistance due to adsorption, to be estimated al equilibrium for a given protein concentration as follows:
Before adsorption:
R, = AP/J,
After adsorption: R, + R,, = AP,U/
thus yieIding
Rz plotted against protein concentration gives as the maximum added resistance R* the plateau value of the obtained isotherm. A v&&cation of this calcu- lation of R* is possible in ultrafiltration exFimcnts, it being calculated from the flux vs pressure curve or, more specifically, from the resistive linear part OC the curve at low pressures.
4. RESULTS AM3 DLSCUSSION
4. f . Sitdation results In a first simulation, the Peclet oumbzr and the
kinetic parameter p* were kept constant (Pe = 3, p* = 0.002, where p = 1.25 x 1 K3, C,, = 1 kg/n? and z = 1.7 s) in order to study the interplay of the two phenomena with increasing adsorption (R* and ac- cordingly s$ varying from zero to the largest values employed in the study; see Table 1). According to the definition of the PBclet number, the relationship Pe = 3 is satisfied by different combinations of pressure
and mass transfer coefficient, k. For example, AP = 0.04 MPa (0.4 bar) for a membrane with an ~5~
value of2.5 x IOms m3/m2 sbar at R: = 3.6 x 10m6 m/s
Fig. 4. Experimenral apparatus (1) feed tank, (2) thermostat, (3) feed pump, (4) membrane module, (5) ehxtroaic balance, (6) permeate rscireulation pump. (7) 3-way valve, (S) bypass circuit, (9) bypass valve, (10)
Bow meter (Pl, P2) pressure gaugeq (-r) tllermome~er.
and AP = 0.08 MPa for the same membrane at k = 7+2 x IO-& m/s. The results are given in Figs 5 and
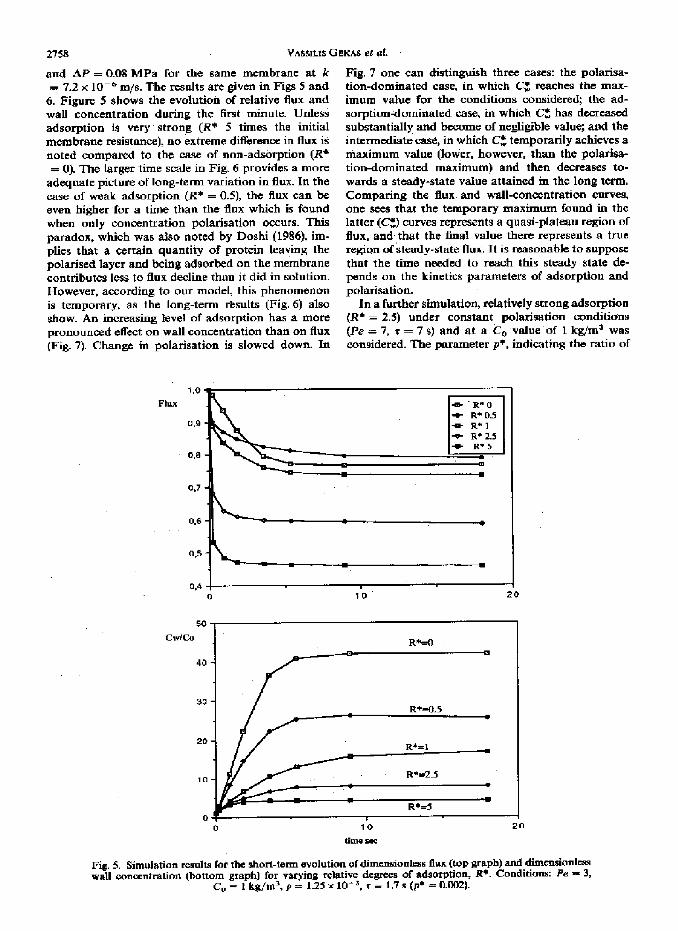
6. Figure S shows the evdutioh of relative flux and wall concentration during the first minute. Unless adsorption is very strong (I?* S times the initial membrane resistance), no extreme difference in flux is noted compared to the w of non-adsorption (R* = 0). The larger time scale in Fig. 6 provides a more
adequate picture of long-term variation in flux. In the case of weak adsorption (R* = OS), the flux can be even higher for a time than the flux which is found when only concentration polarisation occurs. This paradox, which was also noted by Dashi (1986), im- plies that a certain quantity of protein leaving the Polarised layer and being adsorbed on the membrane contributes less to flux decline than it did in solution. However, according to our model, this phenomenon is temporary, as the long-term ~sults (Fig. 6) also show. An increasing level of adsorption has a more pronounced effect on wall concentration than on flux {Fig. 7J Change in polarisation is slowed down. In
FhU
Fig. 7 one can distinguish thm cages: the polarisa- tion-dominated case, in which C; reaches the max- imum value for the conditions considered; the ad- sorption4ominated case, in which C$ has decreased substantially and become of negligible value; and the intermediate case, in which c, temporarily acbicves a maximum value (lower, however, than the polarisa- tion-duminated maximum) and then dsreascs to- wards a steady-state value attained in the long term. Comparing the flux. and wall-concentration curves. one sees that the temporary maximum found in the latter ICz) cufyes reprf3ents a quasi-plateau region of flux, and. that the f&d value there represents a true region of steady-state flux. It is reasonable to suppose that the time needed to reach this steady state de- pends on the kinetics parameters of adsorption and polatisation.
In a further simulation, relatively strong adsorption (R* = 2.5) under constant polarisation conditi&rs (Pe = 7, r = 7 s) and at a C, value. of 1 kg/m3 was considered. The parameter p*, indicating the ratio of
0 10
time scf
Fig. 5. Simulation rewlts fbr the short-term evoluti~ of dl TmwGonles~ flu (hop graph) and dimcnsionlcss wall concentration (bottom graph) for varying relative degrees of adsorptjon, i?*. Conditions: Fe = 3,
c, = 1 kg/m’, p = 1.25 X lo- 3, T = 1.7 s (p’ = 0.002).

Adsorption-concentration poladsation interphy in protein ultra6Itration 2759
0.0
rimemir
20
1Q
0 .Ol -1 1
lhnrmill

2760 VASSIL~S GEUS ei rd.
adsorption to polarisation rate, varied from 0.001 (relatively very slow adsorption) to 1. The results for flux and wall concentration are shown in Fig. 8, in which for comparison the non-adsorption caSe has been plotted. With adsorption, the same steady-state values are obtained in every case but after differing time-periods, which are longer for slower adsorption. For fast adsorption (p* = lj, no temporary maximum is predict4 C$ reaching the steady state under the above conditions after 20 min. At the other extreme (the slowest adsorption rate), Cc quickly passes a maximum almost as high as the polarisation-domin- ated value (since polarisation in this simulation is strong; Pe = 7) and then suffers a dramatic decline before reaching steady state after 3000 min or 50 h.
In practice, these two extreme cases, those of no adsorption and of extremely slow adsorption, are too rare to be observed. In the case of p* = 0.1, a tendency toward oscillation of C$ just before steady state is attained is evident. This appears to imply that the interplay of the two phenumena leads to a temper- arily unstable state at the polarisation boundary
layer. This is a point, however, which needs further investigation.
As can be noted in Fig 8, the pmnt model pre- diets that decreases in flux from the “zero adsorption” plateau down to “stationary adsorption” occur only when the wall concentration is sufficiently low (parti- cuiarly visible for p * = 0.001 and 0.01). Prior to this final drop, the flux remains high despite the increase in resistan= (due to adsorption)_ These results suggest that the effects of increases in resistance are damped by changes in the wall ,concentration (by a decrease in osmotic pressure, in other words) until the effects of concentration polarisation on flux become negligible: flux then homes sensitive to the membrane resist- ance.
In another series of simulations, the initial concen- tration was varied. As expected, higher initial concen- tration resulted in greater flux decline and higher concentration at the wall. Flux and C; curves of similar form to More were obtained here. As shown in Table 2, C, affects the steady-state value of R,’ strongly, especially when polarisation is relatively
1 1 10 100 1000 10000 b nlin
Fig. B. Dimensionless flux(top $raph)anJ wall Lvnozntration (bottom graph) as a fundion of time. E&t af the kinctics patameter pan Smulation conditions: Pe = 7, C, = 1 kg/&, R’ = 25.

Adsorption~onoentration @arisation iqtcrplay in protein ultrafiltration 2761
Table 2, Simulation results for varying titial conentration. Conditions: Fe = 7, R* = 5, p* = MI, 1 = 0.7 s
Initial mncentrmrtion G (k&m’)
0.1 1 10
Permeate flux, #.I* at steady rtate 0.310 0.235 0.179 (alter 30 tin)
Wall concentration, C; peak value 33.1 55.9 123.8 at steady atate 1.5 6.5 39.5
Additional resistance, R$ at steady state 1.3 3.1 4.1
Table 3. Simulated steady&ate flux for varying R* and for two Pe
ualues. Co = I kg/m’
R* Pe = 3 Fe-6
0 0.765 0.476 0.5 0.730 0,470 1 0.641 0.470 2.5 0.369 0.313 5 0.244 0.229
weak, This steady-state resistance does not necessarily In Table 3 the simulation results concern various coincide with R*, the maximum “saturation” value. R.* values at a higher Pe (= 6). In that case polarisa- Our simulations have shown, however, that for either tion is more importanr; one obswves that stronger C, or C$> 10 gjl, R’ is attained. On the other hand, adsorptiofi is tieaxssary to yield a substantial differ- low values of Co, since they limit both phenomena, ence in terms of flux as compared to the poiarisation- lead to steady-state added r&stance which is less than dominated CaSe. When the limiting flux uf [corn-- R*. pending to the Pef value. eq. (1511 is higher in value
Membrane HXIS 30266.2OKP
AP&.IhlPa. cc=lK&n3. v=l riIJs
t (min)
Fig. 9. Exwmental and simulated dim&o&lis flux as a functiop of time for a XI kD polyac&onitrile (PAN) membrane (top graph) and a 20 kD polysulphoac IMIM&E (PSf) (bottom graph), BSA solution of C, = 1 kg/m’. &n&ions: AF = 0.1 MFq u - i m/s (yielding a Pe numbet d 3); for PAN R* = 25,
p+ = 0.001: ror Pgf R* = 4.5 F* = 3 x 10⁻⁴.

2762 VASSILIS G~KAS r3 OL
0.6
0.7 100
t (miol
Fig. 10. Simulated dimendonlesr flux and wall mncentration for a 20 kD polyacrylonitrile me&bran= (top wph) and B 20 kD poiysulphone membrane (PSf) (bottom grqh) as a function of time. BSA solution of
C, = 1 kg/m’. finditions as in Fig 9.
than the steady-state flux at no adsorption, then polarisation is the controlling phenomenon; other- wise, it is adsorption. The overall conclusion which can lx drawn is that there is a general tendency for one of the two phenomena to dominate, as far as steady-state flux is concerned, with a rather narrow zone of mixed contributions.
4.2. Application in cmnection with expvimmtul obsma uasi0n.s
As a 6rst applied step, we have used the model to explain typical trends observed in practice.. Its use a~ a predictive tool in ultrafiltration implies an. &curate knowledge of the values of the involved parameters for various protein-membrane pairs, knowledge of which is not available at present.
Figure 9 shows there to be satisfactory agreement, for use of BSA with the IRIS 3038 membrane, between the flux vs time curves obtained experimentally and by simulation. In the simulation, the measured R* value was used whereas p* was appropriately selected for fitting the experimental curve.
Similar results are shown for the polysulphone membrane. For both membranes, it was been ob- served at the end of UF that
(a) recovery of the initial ,fluux was impossibIe with- out chemimI cleaning,
(b) cross-flow velocity, when varied froth 0.1 to 2 m/s, had no effect on flux.
Under the same cbnditbns, the prediction of the model (Fig 10) is that at steady state the wall con- centration haa decreased to a minimum value, a value which under the conditions studied here can be con- sidered negligible. Consequently, the flux decline which occurs in the reaching of steady state is totally irreversible and is, thus, based on adsorption and not on polarisatioo provided that fouling is evenly dis- tributed over the surface.
The same kind of explanation is provided for the ,phenomenon of hysteresis in the flux-transmem- bran-pressure diagram (Fig. 11). The straight line observed when plotting flux YS pressure (under de-

Adsorption-concentration p&risetion intcrpla~ in protein ultrafiltration 2763
kxh.ed ftlor (Jhp) 1.0
0.8 -
Fig. 1 1. Simulated steady-stare reduced flux (I/L,) and wall concentration for a 20 kT) polYa@O~itrile membrane ss a function OC pr~ure+ WA solution oF C0 = 10 kg/m3. Co,nditionr R* = 2.5. p* = 0.001,
k=8,6xl0-6t@.
1 .o J~P
0.8
02
; 1
1 3 pressure ‘10 mlrw
Fig. 1L Simulated and experimental steady-state reduced flux (J/L,) for a 20 kD polyacrylonltrilc membrane as a function of pr~ure. BSA solution aI C, = 10 kglm3. conditions as in Fig. 11.
credng pressure) in the low-pressure dumain (O-O.1 MPa) implies that very little pwltition DC- curs. This result is remarkable if one considers that the initial concentration wds rat& high (10 kg/ml) and suets that adsorption, when it is sufficiently strong, decrease wlarisation substantially.
This is shawn in Fig. 11, in which simulated values for both flux and wall conmtration are shown. As can be seen in Fig. 12, a comparison of the simulated J-AP curve with the experimental ode shows a satis- factory ament.
The results For permeate flux at steady state showed that, unless the additional resistance due to ad- sorption was more than twlm the initial membrane
resistance, no large difference appeared in comparison with the totally polarisation-dominated case, The characteristic trend in the interplay of the two phe- nomena, as the simulation results indicted, is that of an initial increase in wall: mneentration within a very short time and then a long-term decrease towards a steady-state OF quasi-steady-state level.
This trend is not observed when the effcts of adsorption or fouling on the membrane resistance are too weak or adsorption is relatively strong or occurs very quickly. In iuch cases the wall concentration increase continuously up to a plateau, which is lower than that obtained in the abfznce of adsorption.
The present simulation iltustrates the competition between two flux-limiting phenomena: concentration polarization and adsorption. It shows that, after the

petiti during which concentration polariisation builds up and flux rapidly decreases, Rux should remain almost constant wheu hydraulic resistance varies with adsorption (or with some other type of fouling mechanism), until the osmotic pressure of the wall solution has time. negligible compared to the applied pressure. In terms of an osmotic/fouling model, one should expect that the reaction of the system to fouling is first a decrease in concentration polarisation, and then flux decline. This emphasixs the difficulty in simultaneously analysing membrane fouling and ths levelfkng-off of flux with pressure. Results of the study suggest that if the membrane surface, whether clean or fouled, is homogeneous in its permeability then whenever, Following the rapid decay in the first minutes, one. observes a 0ux decline.over time the effect of concentration polarisation should be negligible. Further investigation to account for surface heterogeneity in mass transfer equations might lead to a more adequate conception of what hamns,
The use of the model in a predictive way requires a more precise knowledge of the adsorption (isotherm, kinetics) parameters of various membranes and ma- cromolecules than is presently available. This is the subject for future studies.
The present model has been particularly considered in relation to protein ultrafiltration in accordance with Langmuir-type isotherm for the additional resistance which develops on a polymeric membrane. The model’s formulation, however, provides the pos- sibility of generalisation to other macromolecules and/or to other typ of isotherm or kinetic behaviour of the fouling substances.
Ack~owIeJ~~t~~til~l)r._ V. G&as retived financial suppct from Soci& Nationale Elf Aquitaiae (Franc=@ to spend a post-doctoral year in TCXIIOW, where the research wad carried out. The help of Dr. M. Clifton in numerical solution matters is gratefully acknowledged.
A, B A', 8’ A”
ht C Gd c mz
D .i k LP
m n, n’
P Fe
P R
KOTATIOP? Langmuir constants for the added resistance Langmuir constants for the adsorbed mass Freundlich constant for the add4 resistance virial coefficients for the osmotic pressure concentration of the solute, kg/m3 adsorbed quantity, kg/m’ adsorbad quantity at equilibrium, kg/m’ diffusion +E&nt, ml/s permeate flux, mj/m2 5 mass transfer coefficient, m/s hydraulic membrane permeability, m’/m” Pas exponent in eq. (I 3) “Freundlich” exponent for the resistapce and the adsorbed mass, pqxctively pressure, Pa Peclet number in the boundary layer constant of reaction (adsorption) rate resistance to permeate flow, Pa s/m
resistance ralue at equilibrium. Pa s/m adsorption source term, kg/m’ s time, s flow velocity normal UI the membrane, m/s flow velocity parallel to the membrane, m/s order of reaction (adsorption) co-ordinate axis along the direction or permeate flow, M
Greek letters rr,e diacretisatinn parameters defined in the Ap-
pendix l- adsorbed quantity kg/m’ 6 thickness of the boundary layer, m n osmotic^ pressure, Pa r characteristic time, s
Supemript * dimensionless
Subscripts ad additional ads adsorption f final 0 initial
Ahbreuiaclons BSA bovine serum albumin kD kilodalton PAN polyacrylonitrile PSf polysulphone UF ultrafiltration
REFERENCE!3
Aimar, P., Baklouti. S. and Sanchw V., 1986, Membraae- solute interactions: influence on pure solvent transfer dur- ing ultrafiltration. J. Metiwne Sci. 29.207.
Aimar. P.. Taddei. C., Lafaik J. P. and SanGhe& V., 1988, Mars transfer limitations during ultrtitration of cheese whey with inorganic membranes. J. Me&rune Scl. 38, 24x4-21.
‘fishi, M. R., 1986. Limiting flux in the ultrafiltration of -omolecular solutions. in Reverse &ma& & UitdZ trnt& (Edited by S. !$o&irajan &I T. Matsuur& AkS Symp0sium series No. 281, pp. 20!-223.
Laf&, J. P., 1984, Con&&ion et purification de macromolecules par ultrafiltration. University thesis, Uni- writi: Paul Sabatier. Toulouse, France.
Mattbiassson, E., 1983, The role of macromolecular adsorp tion in fouling of utfrafiltration membranes. J. Me&rune Sd. 16. 23-36_
Matthia&n. E., 1984, Macromolecular adsorption and Fouling in ultrafiltration and their relationships with con- centration polarisstion. Ph.D. thesis, Lund University. Sweden.
Nilsson. J. L., 1989, A study of ultra6ltration membrane fouling Ph.D. thesis, Lund University, Sweden
Richtmeyer, R. and Morton, K_ W., 1967, D~arrmce 1Wethods for Initial-c&e Problems, 2nd Edition, pp_ 185-200. Interscience, Ni3G York.
Robertson, B, and Zydney. A. L,, 1990. Protein adsorption in asymmetric ultrafiltration membranes with hi&ly re- stricted pores. J. C~l~~uid Intvq$xe Sci. 134, 563-575.
Vilker, V.. Colton, C. K. and Smith, K. A, 198 1, The omotic pressure 0Coanantrard protein solution: e&&t of concen- tration and pH in saline solution of bovine 8crum albumin. J. Cobid Interface Sci., 79, 548.

Ad.sorption-concentratiion polarisaiion interplay in protein ultra6ltr~tion 2765
Wojciechowski, P. W. and Brash, J. L., 1990, A computer simulation for the study of macromolecular adsorption with s~n=xiaJ applications to singlfimmponent protein adsorption. J. Colloti Inrq-$ucr Sci. 140, 238-252.
APPENDIX
The mass transfer equation in dimensionless form is reg resented in the form of a tridiagoudl system:
lx(l) +
UC(l) +
aC(2) = d(l)
K(2) + aC(3) = J(2)
oC(2) + K(3) + UC(4) = d(3)
aC(j - I) + bC(l] + &(j + 1) = d(j)
aC(J - 2) + nc(J - 1) = d(J- 1).
The left-hand sick of the above equations refer to values in the concmtration array C(j) at time interval n + 1, whereas the right-hand sides refer to aJ> values at time interval n. The result is given by the array d(j). the equation of which (at time interval n) is
d(f) = (al + ti)‘C(j - I) + al*C(j + 1)
+ [l - 2%1 - u)*C(j)
for j=2 to 5-2 whereas for j= 1 and j=J-1 the
expr~sions are given by the boundary conditions
d(l) = aICI2) + (al + U - a)C(O) + (1 - 2nl - u)C[l)
d(J - 1) = al C(J) + (01 + u)C(J - 2) + (I - Lx1
- u)C(J - 1) - A(J - l)C,
C(0) = 1
@3)uC(J) = 3C(fi - 4C(J - 1) + C(J - 2) - (a3)s.
The meaning of the various discrctisation symbols is as follows:
a=-&
h = t + 2d m = At/{ Pc(Ay)2}
B = 0.5 - J/(lZcr)
ul=41-II)
a3 = 2~i’.e*Ay
where j and n are position and time indices, respectively, Ay and At are position and time intervals. respectively, C is the dimensionless concentration, Fe the Poclet number. II rhc ctimeusionless flus and 9 the dimensionless aouraz term for adsorption.
For stability of the. numericrl solution it is required ,that
u(Ar/Ay) < I and a x l/(2 - 4s).