Grape Solar Photovoltaic Modules Safety and Installation ...
Upload
khangminh22Category
view
0download
0
applied sciences
Article
The Interplay between Atmospheric Conditions andGrape Berry Quality Parameters in Portugal
Cátia Costa 1,2,*, António Graça 1 , Natacha Fontes 1, Marta Teixeira 1, Hernâni Gerós 2,3,4 andJoão A. Santos 4
1 Sogrape Vinhos, S.A., Rua 5 de Outubro 4527, 4430-852 Avintes, Portugal; [email protected] (A.G.);[email protected] (N.F.); [email protected] (M.T.)
2 Centre of Molecular and Environmental Biology (CBMA), Department of Biology, University of Minho,4710-057 Braga, Portugal; [email protected]
3 Centre of Biological Engineering (CEB), Department of Biological Engineering, University of Minho,4710-057 Braga, Portugal
4 Centre for the Research and Technology of Agro-environmental Sciences, CITAB, University ofTrás-os-Montes e Alto Douro, UTAD, 5001-801 Vila Real, Portugal; [email protected]
* Correspondence: [email protected]
Received: 18 June 2020; Accepted: 16 July 2020; Published: 18 July 2020�����������������
Abstract: The atmospheric conditions are a strong modulator of grape berry composition, but furtherresearch is required to better understand this relationship, which is particularly pertinent under thecontext of climate change. The present study assesses the relationship between interannual variabilityin atmospheric conditions (mean, maximum and minimum air temperatures and precipitationtotals) on grape berry quality attributes in three main Portuguese wine regions—Douro, Dão andAlentejo—and targets two major varieties growing in Portugal (cv. Touriga Nacional and cv.Aragonez/Tempranillo). Berry weight, titratable acidity (TA), pH, potential alcohol (PA), anthocyaninsand total phenols index (TPI) data, collected two to three weeks after the end of the veraisonuntil technological maturity, since 1999 in Douro, 2004 in Alentejo and 2008 in Dão, were selected.Meteorological data were obtained from both automatic weather stations and a climatic databasedefined at a very-high-resolution grid (<1 km) (PTHRES). The influence of daily mean, maximumand minimum air temperatures (November–October) and precipitation totals (April to June andJuly to September) on the above-mentioned berry quality parameters were first explored to identifythe months/periods more influential to grape berry composition. Different statistical approacheswere subsequently carried out to explore in greater detail these relationships. At technologicalmaturity, temperature was negatively correlated to berry weight, titratable acidity, anthocyaninsand TPI, but was positively correlated to pH and potential alcohol. Moreover, lowest levels ofberry weight and TA (and highest levels of pH) were more frequent in warmer regions, while theopposite was seen in the cooler regions. PA, TPI and anthocyanins at maturity did not show a cleartrend across regions. In addition, the maturation parameters of each site were grouped into twoclusters—years where the maturation parameter is higher (cluster 1) and years where it is lower(cluster 2)—and significant differences in monthly mean temperatures between clusters were found.Overall, temperatures at veraison and maturation periods (June–August) were more influential indetermining grape berry composition at harvest. The influence of precipitation was dependent onlocation and variety. The results also suggested that berry composition in Alentejo is more sensitive toatmospheric variability, while Aragonez seems more resilient than Touriga Nacional. These outcomesare based on a systematized and unprecedentedly large grape berry quality database in Portugaland provided the grounds for the development of grape quality forecast models, either to be usedoperationally in each vintage or for assessing potential modifications in berry composition in responseto changing climates.
Appl. Sci. 2020, 10, 4943; doi:10.3390/app10144943 www.mdpi.com/journal/applsci

Appl. Sci. 2020, 10, 4943 2 of 22
Keywords: climate variability; climate change; viticulture; berry quality; grape maturation;anthocyanins; phenolic compounds; Touriga Nacional; Aragonez; Portugal
1. Introduction
Grapevines are one of the most economically important fruit species worldwide. The current worldvineyard area is approximately 7.4 million ha and Portugal ranked fifth and eleventh as a wine producerin Europe and worldwide, respectively [1]. The viticultural and winemaking sector heavily relies on theability to produce high-quality wines, which are in turn strongly dependent on grape berry chemicalcomponents and their concentration at harvest [2]. Although the suitability of a region for grapevinecultivation is largely controlled by growing season mean temperature that should range between 12and 22 ◦C, other atmosphere-driven conditions, such as growing season length, radiation levels, winterminimum temperatures, spring and fall frosts or soil water balance, among others, are also importantlimiting factors [3]. Air temperature plays a central role in determining grapevine phenology [4],influencing the onset of phenological stages like budbreak, flowering and veraison and the phenophaseintervals [5,6]. Temperature also affects grapevine yield [7], wine production [8] and quality [9].Relatively constant and moderate temperatures during ripening favour the biochemical processes ofcolour, flavour and aroma development in grape berries [10]. For rainfed grapevines, the water balanceis mainly determined by precipitation, atmospheric humidity and soil water holding capacity [10].The amount of annual precipitation and its seasonal distribution are also crucial to the evolution ofthe plant water status, with subsequent effects on berry quality [10]. Moreover, under extremelydry atmospheric conditions, stomata can close to preserve moisture, ceasing photosynthesis [11].Nevertheless, some reported effects of water stress on grape berry quality attributes are contradictory,being strongly dependent on the local conditions, on the degree of water stress and on the period inwhich it occurred.
The acid versus sugar balance is fundamental to build grape flavour, which ultimately determinesthe wine quality. Grape juice with low acidity often results in unstable musts and wines that aremore susceptible to organoleptic degradation (e.g., due to oxidative and microbiological spoilage [12]),while excessive berry acidity is commonly undesirable for the production of high-quality wines.The titratable acidity levels are frequently lower in warmer years than in cooler ones [13]. It wassuggested that some of the strongest and most consistent negative links between titratable acidityand temperature are related to maximum temperatures [14]. In general, respiration of tartaric andmalic acids, particularly malic acid, increases with increasing temperatures, thus leading to a dropin titratable acidity and increased pH [15,16]. Total acidity also drops due to the dilution of acidscaused by increased berry size, but in semi-arid regions, total acidity values are significantly higherunder irrigation than in non-irrigated conditions [17], hinting at the need of a minimum of wateravailability for balance in berry composition to be achieved. Furthermore, higher levels of malic acidmeasured under those conditions of irrigation may be associated with greater synthesis during thegrowth period [17]. Overall, titratable acidity at maturity is preserved with moderate precipitationand/or irrigation [14], which can be explained by a combined effect, of enhanced vegetative growthprior to maturity with greater moisture availability and by the lowering of air temperature oftenassociated with rainy weather.
High temperatures promote sugar accumulation and thus higher potential alcohol levels [18,19].Previous studies showed that total soluble solids accumulation are greater at higher temperatures(30 ◦C) than lower temperatures (20 ◦C) at veraison and a few days after [20,21]. During the growingseason, the highest sugar content is frequently associated with drier years, while the lowest is relatedto rainier years [13]. It has been shown that water limitation affects plant hormonal equilibriumdirecting sugar accumulation in grape berries. Furthermore, in irrigated conditions, total soluble solids

Appl. Sci. 2020, 10, 4943 3 of 22
concentration can decrease due to the dilution caused by greater berry size [17], but enhanced sugaraccumulation associated with higher photosynthetic activity also occurs under irrigation [22].
Although the mechanisms of phenolic biosynthesis at high temperatures are still poorly understood,the optimum temperature for phenolic accumulation is nearly 25 ◦C, while above or below this levelaccumulation tends to fall significantly [20]. The effect of temperature on grape berry anthocyaninscontent has been studied for different varieties and regions [13,14,23,24]. For instance, mature berriesfrom Cabernet Sauvignon, Shiraz and Chardonnay varieties cultivated in cooler sites accumulatehigher levels of anthocyanins than those from warmer climates [14]. High temperatures can reduceanthocyanins accumulation through either the impairment of its synthesis or the acceleration of itsdegradation [25]. In the berry skin of Darkridge (Vitis vinifera L. × Vitis labrusca L.), two enzymes of theanthocyanins biosynthetic pathway were favoured by cool night temperatures [21]. In water stressconditions, phenolic compounds, including anthocyanins, are concentrated due to berry size reduction.In addition, the biosynthesis of each phenolic compound is differently affected by the severity of thewater deficit and the period when it occurs [26]. Water deficits during veraison and maturation increaseanthocyanin [26–28], proanthocyanin and flavonol biosynthesis [26], while early in the growing seasonhigh water availability is beneficial for anthocyanins content, as it promotes vegetative growth and,consequently, berry development and composition at later stages [29]. However, other reports showthat high moisture availability late in the growing season may reduce anthocyanins content [30].
Previous studies already demonstrated the role of some climatic variables in grape berry qualityparameters [7,13,14,31,32], some of them using long-term historical data for a few variables [7]. To ourknowledge, this is the only study that uses a long-time series of biochemical data in field conditions,for many berry quality aspects (berry weight, titratable acidity, pH, potential alcohol, anthocyaninsand TPI): maximum of 19 years for Douro region (1999–2017) and a minimum of six years for Alentejoregion (2012–2017). Moreover, this study is unprecedented in Portugal, being the first to assess theclimate–berry quality relationships using several grape berry quality parameters and over such a longtime period.
Portuguese wine production is characterized by a strong interannual variability, which is a featureof Mediterranean climates, with adverse consequences for wine business [33]. Therefore, it is ofgreat interest for the wine industry to understand the role of atmospheric variability on grape berrycomposition to develop and implement optimized agronomic/oenological strategies, such as stressmitigation agronomic practices while reducing water, fertilizers and pesticides usage. The identificationof cause–effect relationships will set the grounds for the development of predictive models of grapevinequality and decision support tools that can be used either to monitor grapevine development, in theshort-term, or to assess the potential impacts of climate change, in the long-term [34].
Hence, the present study aims to determine the responses of some key berry attributes toatmospheric variability, namely berry weight, titratable acidity (TA), pH, potential alcohol (PA),anthocyanins and total phenols index (TPI). The study was carried out for three Portuguese wine regions(Douro, Dão and Alentejo) and two major grapevine varieties: cv. Touriga Nacional (TON, PRT52206)and cv. Aragonez (ARA, PRT52603, International synonym Tempranillo). A large and systematizeddatabase of both berry quality parameters and climate data in Portugal enabled an unprecedentedcomprehensive analysis of the interplay between climate and grape berry quality under the PortugueseMediterranean-type conditions.
2. Materials and Methods
2.1. Maturation Database
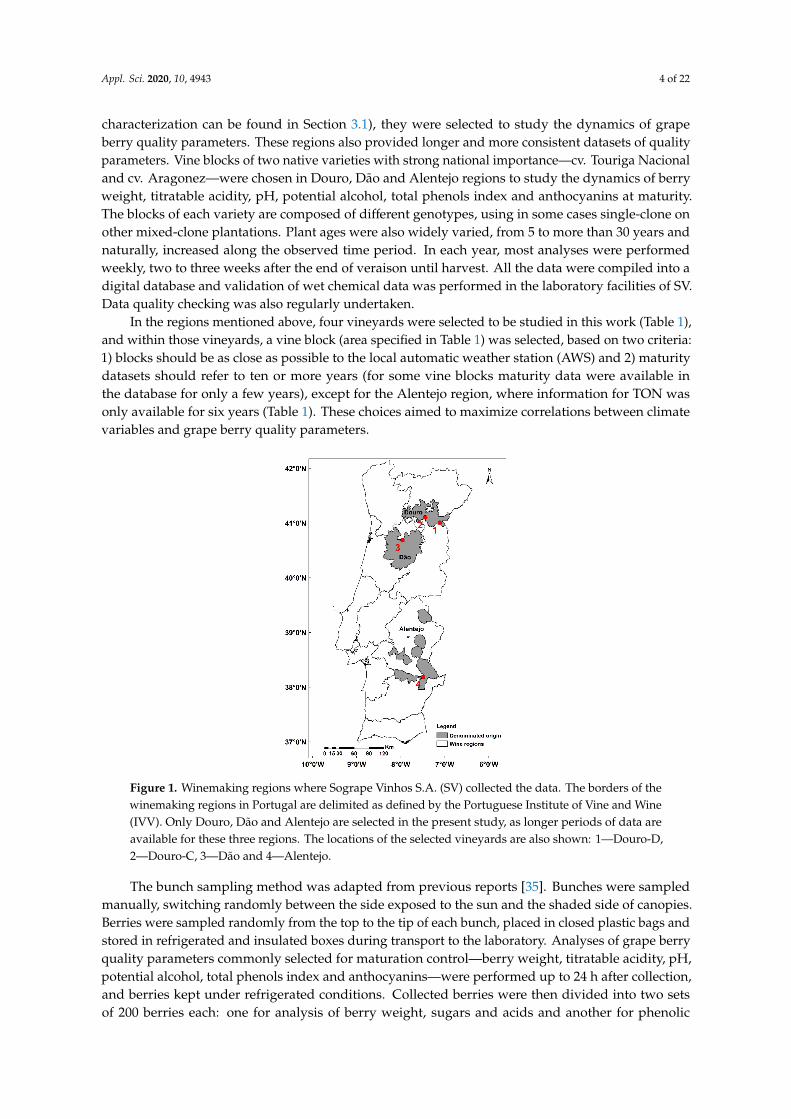
In the present study, the maturation data were provided by Sogrape Vinhos S.A. (SV) and collectedannually in the vineyards of SV and its supplier grape farmers. Data for three different Portuguesewinemaking regions were used herein: Douro, Dão and Alentejo (Figure 1). Since these threeregions have different terroirs and, mainly, are subject to different climatic conditions (their climatic
Appl. Sci. 2020, 10, 4943 4 of 22
characterization can be found in Section 3.1), they were selected to study the dynamics of grapeberry quality parameters. These regions also provided longer and more consistent datasets of qualityparameters. Vine blocks of two native varieties with strong national importance—cv. Touriga Nacionaland cv. Aragonez—were chosen in Douro, Dão and Alentejo regions to study the dynamics of berryweight, titratable acidity, pH, potential alcohol, total phenols index and anthocyanins at maturity.The blocks of each variety are composed of different genotypes, using in some cases single-clone onother mixed-clone plantations. Plant ages were also widely varied, from 5 to more than 30 years andnaturally, increased along the observed time period. In each year, most analyses were performedweekly, two to three weeks after the end of veraison until harvest. All the data were compiled into adigital database and validation of wet chemical data was performed in the laboratory facilities of SV.Data quality checking was also regularly undertaken.
In the regions mentioned above, four vineyards were selected to be studied in this work (Table 1),and within those vineyards, a vine block (area specified in Table 1) was selected, based on two criteria:1) blocks should be as close as possible to the local automatic weather station (AWS) and 2) maturitydatasets should refer to ten or more years (for some vine blocks maturity data were available inthe database for only a few years), except for the Alentejo region, where information for TON wasonly available for six years (Table 1). These choices aimed to maximize correlations between climatevariables and grape berry quality parameters.Appl. Sci. 2020, 10, x FOR PEER REVIEW 5 of 24
Figure 1. Winemaking regions where Sogrape Vinhos S.A. (SV) collected the data. The borders of the winemaking regions in Portugal are delimited as defined by the Portuguese Institute of Vine and Wine (IVV). Only Douro, Dão and Alentejo are selected in the present study, as longer periods of data are available for these three regions. The locations of the selected vineyards are also shown: 1—Douro-D, 2—Douro-C, 3—Dão and 4—Alentejo.
Table 1. Selected maturation data. Wine region, sub-region, vineyard designation, vine block area, variety (Touriga Nacional, TON, and Aragonez, ARA) and the period of the records are listed.
Wine Region
Sub-Region Vineyard Designation
Vine Block Area (m2)
Variety Years
Alentejo Vidigueira Alentejo 168 000 TON 2012–2017 Alentejo Vidigueira Alentejo 51 000 ARA 2004–2017
Dão Terras da Azurara Dão 16 000 TON 2008–2017 Dão Terras da Azurara Dão 23 000 ARA 2008–2017
Douro Cima Corgo Douro-C 42 000 TON 2007–2017 Douro Cima Corgo Douro-C 33 000 ARA 2007–2017 Douro Douro Superior Douro-D 187 000 TON 1999–2017 Douro Douro Superior Douro-D 19 000 ARA 1999–2017
2.2. Climate Data
AWS located in or nearby the selected vineyard blocks (Table 1) provided daily average (TG), minimum (TN) and maximum (TX) air temperatures, as well as daily precipitation totals for the period of 2011–2017. As climatic data before 2011 are not available from the AWS, these variables were obtained from a gridded climatic database (PTHRES), available throughout Portugal on ca. 1 km spatial resolution and from 1950 onwards [37]. The nearest grid point to each vineyard was retrieved from PTHRES. As the determination coefficients of the linear regression models between PTHRES and AWS temperatures were very high (>90% for TN and >98% for both TG and TX), linear equations were used to estimate TG, TN and TX before 2011. However, since the determination coefficients for precipitation were variable (51–92%), a multiplicative method was used instead. Firstly, the climate-means of AWS and PTHRES monthly precipitation totals were calculated for each calendar month for the baseline period of 2011–2015. The corresponding monthly ratios were then interpolated to the daily timescale by a second-order polynomial fit. The daily precipitation totals before 2011 were then reconstructed by multiplying the corresponding ratio by PTHRES precipitation.
Figure 1. Winemaking regions where Sogrape Vinhos S.A. (SV) collected the data. The borders of thewinemaking regions in Portugal are delimited as defined by the Portuguese Institute of Vine and Wine(IVV). Only Douro, Dão and Alentejo are selected in the present study, as longer periods of data areavailable for these three regions. The locations of the selected vineyards are also shown: 1—Douro-D,2—Douro-C, 3—Dão and 4—Alentejo.
The bunch sampling method was adapted from previous reports [35]. Bunches were sampledmanually, switching randomly between the side exposed to the sun and the shaded side of canopies.Berries were sampled randomly from the top to the tip of each bunch, placed in closed plastic bags andstored in refrigerated and insulated boxes during transport to the laboratory. Analyses of grape berryquality parameters commonly selected for maturation control—berry weight, titratable acidity, pH,potential alcohol, total phenols index and anthocyanins—were performed up to 24 h after collection,and berries kept under refrigerated conditions. Collected berries were then divided into two setsof 200 berries each: one for analysis of berry weight, sugars and acids and another for phenolic

Appl. Sci. 2020, 10, 4943 5 of 22
compounds analysis. One set of berries was weighed and then crushed and decanted. The obtainedgrape was used to evaluate sugars, acidity and pH. For sugar analysis, performed using refractometry,results were expressed in terms of potential alcohol percentage, considering 1% of potential alcohol asequivalent to 17 g/L of total sugars. Titratable acidity was analysed by titration of the sample with0.1 M NaOH solution and the results were expressed as g of tartaric acid equivalents per L of juice (g/L).pH was analysed with a digital potentiometer. Phenolic compound analysis was carried out with thesecond sample of 200 grape berries. The results were expressed in terms of extractable anthocyanins(mg/L) and total phenols index (TPI), following the methodology of Saint-Cricq and Vivas [36]. TPI isan indirect index of the total polyphenolic abundance in grapes and correlates with other phenoliccompounds, such as phenolic acids and flavonoids, in addition to anthocyanins.
Table 1. Selected maturation data. Wine region, sub-region, vineyard designation, vine block area,variety (Touriga Nacional, TON, and Aragonez, ARA) and the period of the records are listed.
WineRegion Sub-Region Vineyard
DesignationVine BlockArea (m2) Variety Years
Alentejo Vidigueira Alentejo 168 000 TON 2012–2017Alentejo Vidigueira Alentejo 51 000 ARA 2004–2017
Dão Terras da Azurara Dão 16 000 TON 2008–2017Dão Terras da Azurara Dão 23 000 ARA 2008–2017
Douro Cima Corgo Douro-C 42 000 TON 2007–2017Douro Cima Corgo Douro-C 33 000 ARA 2007–2017Douro Douro Superior Douro-D 187 000 TON 1999–2017Douro Douro Superior Douro-D 19 000 ARA 1999–2017
2.2. Climate Data
AWS located in or nearby the selected vineyard blocks (Table 1) provided daily average (TG),minimum (TN) and maximum (TX) air temperatures, as well as daily precipitation totals for the periodof 2011–2017. As climatic data before 2011 are not available from the AWS, these variables wereobtained from a gridded climatic database (PTHRES), available throughout Portugal on ca. 1 km spatialresolution and from 1950 onwards [37]. The nearest grid point to each vineyard was retrieved fromPTHRES. As the determination coefficients of the linear regression models between PTHRES and AWStemperatures were very high (>90% for TN and >98% for both TG and TX), linear equations were usedto estimate TG, TN and TX before 2011. However, since the determination coefficients for precipitationwere variable (51–92%), a multiplicative method was used instead. Firstly, the climate-means of AWSand PTHRES monthly precipitation totals were calculated for each calendar month for the baselineperiod of 2011–2015. The corresponding monthly ratios were then interpolated to the daily timescaleby a second-order polynomial fit. The daily precipitation totals before 2011 were then reconstructed bymultiplying the corresponding ratio by PTHRES precipitation.
2.3. Relationships of Grape Berry Quality Parameters with Climate Variables
The potential influence of climatic variables on grape berry composition was examined at theberry maturation phase through correlation analyses. For this purpose, monthly means of TG,TX and TN and monthly precipitation totals during vine vegetative cycle (November–October) wereselected. This exploratory correlation analysis allowed to identify the regions and plots more affectedby interannual climate variability, thus deserving further research. The Pearson product-momentcorrelation coefficients were used. Even though the Spearman rank non-parametric correlations werealso computed, the outcomes were very similar and thus will not be presented herein. These resultshighlight that the distributions of values are nearly Gaussian, therefore the application of non-parametriccorrelations is not necessary. The following terminology (Pearson’s rule of thumb) will also be appliedto the absolute value of the correlation coefficient: very weak (<0.20), weak (from 0.20 to 0.39), moderate(0.40–0.59), strong (0.60–0.79) and very strong (≥0.80) correlation [38]. For those sites, each grape berry

Appl. Sci. 2020, 10, 4943 6 of 22
quality parameter was divided into two clusters by the median: years where the maturation parameterwas higher (cluster 1) and years where it was lower (cluster 2). We have chosen medians and not means,as the former non-parametric metric is much less sensitive to extreme values, thus being more robustfrom a statistical viewpoint. Furthermore, the split of the years based on, for example, quartiles, wouldresult in very small samples that would threaten the representativeness of the clusters. The monthlymean temperatures of the two clusters for each grape quality parameter, region and variety studied,as well as the corresponding differences between cluster averages were calculated. For the largestmonthly temperature differences found, daily temperature differences between clusters were calculatedfrom June 1 to August 31. This analysis allowed for the identification of critical days/periods thatmay have contributed to the interannual variability of maturation parameters. An 11-day movingaverage was also applied in order to filter out erratic high-frequency oscillations and to isolate lowfrequency trends. The statistical significance of the differences was assessed by Student’s t-test. For eachgrape quality parameter, cluster averages of each region were compared to each other by a one-wayANOVA analysis.
3. Results
3.1. Climate Characterization of the Selected Sites
Temperature and precipitation for each site and over the baseline period of 1991–2017 (period inwhich maturation data were available for study, however for the regions and vine blocks studiedin this work, we only have data available since 1999 for Douro, 2004 for Alentejo and 2008 for Dão)were used (Table 2). The average growing season temperature (GST, April–October) [3], calculatedover the baseline period, ranged from 18.1 ◦C in Dão, or 18.2 ◦C in Douro-C, to 20.5 ◦C in Douro-D,or 21.1 ◦C in Alentejo. The average (1991–2017) TG, TX and TN from June to August were also greaterin Alentejo and Douro-D than in Douro-C and Dão. Furthermore, the average annual precipitation(1991–2017) showed that the Dão and Douro-C sites were the rainiest when compared to Alentejoand Douro-D (Table 2). Overall, warm Mediterranean-type conditions were found at the four sites,with Douro-D and Alentejo clearly warmer and drier than Dão and Douro-C. The Alentejo site isindeed close to the widely accepted upper thermal limit for viticultural suitability (22 ◦C), as previouslymentioned. These conditions are in general agreement with several previous studies [39] and highlightthat grapevines in Portugal are typically growing under moderate-to-severe water and heat stressconditions during the maturation period, though deficit irrigation systems are applied to avoid severewater stress [40]. Deficit irrigation is applied in order to enhance water management, owing to thelow water resources available, as well as to promote berry quality [40]. Furthermore, the strongirregularity of the precipitation regime in Portugal frequently leads to severe or extreme droughtconditions, driven by anomalies in the large-scale atmospheric flow [41,42], with major implicationsin viticulture [43]. Precipitation extremes are also an important threat [44], including hailstorms [45].Temperature extremes, such as heatwaves, are also an important abiotic stress to take into accountin the Portuguese conditions [46]. In addition, Portugal is expected to undergo significant changesin the grapevine growing conditions over the next decades, with warmer and drier climates, thusexacerbating these current limitations [39,47].
Appl. Sci. 2020, 10, 4943 7 of 22
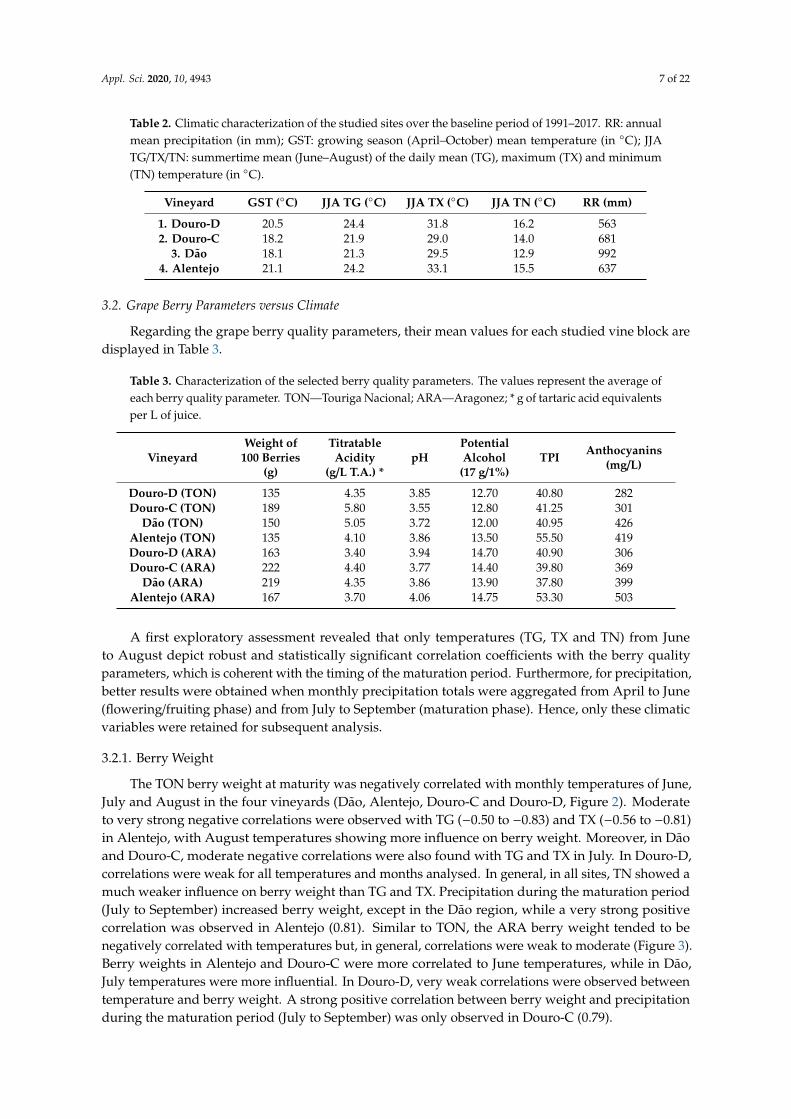
Table 2. Climatic characterization of the studied sites over the baseline period of 1991–2017. RR: annualmean precipitation (in mm); GST: growing season (April–October) mean temperature (in ◦C); JJATG/TX/TN: summertime mean (June–August) of the daily mean (TG), maximum (TX) and minimum(TN) temperature (in ◦C).
Vineyard GST (◦C) JJA TG (◦C) JJA TX (◦C) JJA TN (◦C) RR (mm)
1. Douro-D 20.5 24.4 31.8 16.2 5632. Douro-C 18.2 21.9 29.0 14.0 681
3. Dão 18.1 21.3 29.5 12.9 9924. Alentejo 21.1 24.2 33.1 15.5 637
3.2. Grape Berry Parameters versus Climate
Regarding the grape berry quality parameters, their mean values for each studied vine block aredisplayed in Table 3.
Table 3. Characterization of the selected berry quality parameters. The values represent the average ofeach berry quality parameter. TON—Touriga Nacional; ARA—Aragonez; * g of tartaric acid equivalentsper L of juice.
VineyardWeight of
100 Berries(g)
TitratableAcidity
(g/L T.A.) *pH
PotentialAlcohol
(17 g/1%)TPI Anthocyanins
(mg/L)
Douro-D (TON) 135 4.35 3.85 12.70 40.80 282Douro-C (TON) 189 5.80 3.55 12.80 41.25 301
Dão (TON) 150 5.05 3.72 12.00 40.95 426Alentejo (TON) 135 4.10 3.86 13.50 55.50 419Douro-D (ARA) 163 3.40 3.94 14.70 40.90 306Douro-C (ARA) 222 4.40 3.77 14.40 39.80 369
Dão (ARA) 219 4.35 3.86 13.90 37.80 399Alentejo (ARA) 167 3.70 4.06 14.75 53.30 503
A first exploratory assessment revealed that only temperatures (TG, TX and TN) from Juneto August depict robust and statistically significant correlation coefficients with the berry qualityparameters, which is coherent with the timing of the maturation period. Furthermore, for precipitation,better results were obtained when monthly precipitation totals were aggregated from April to June(flowering/fruiting phase) and from July to September (maturation phase). Hence, only these climaticvariables were retained for subsequent analysis.
3.2.1. Berry Weight
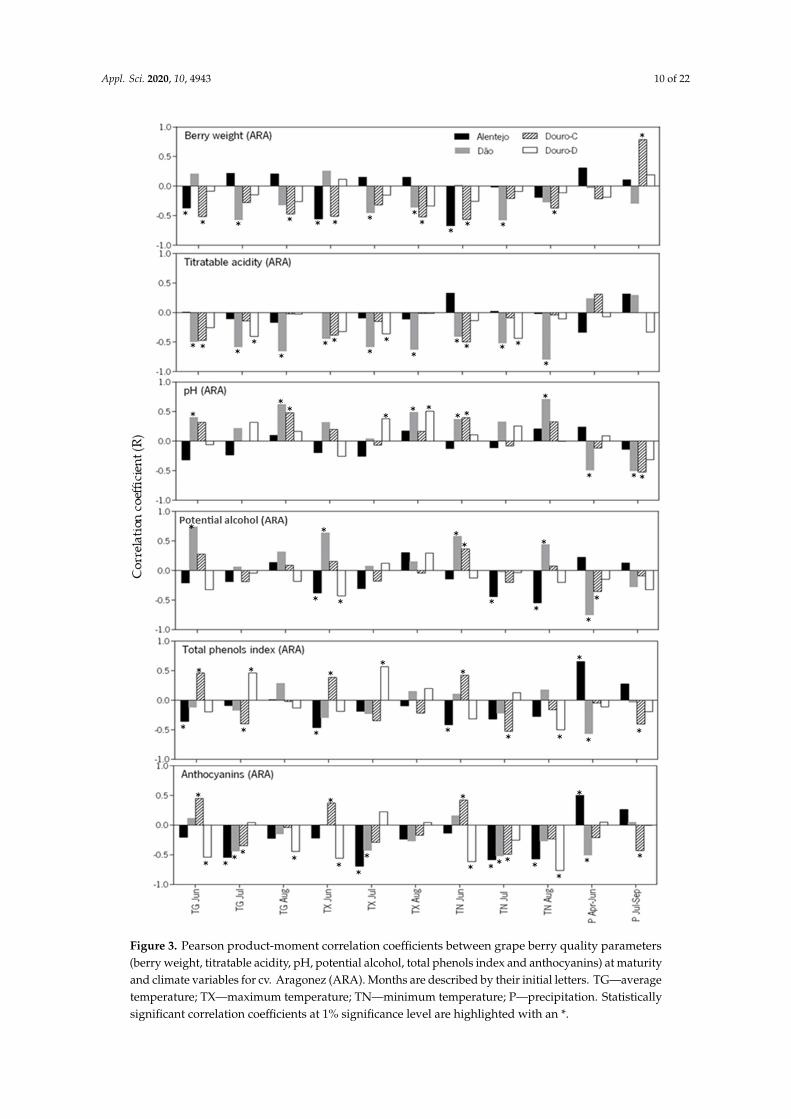
The TON berry weight at maturity was negatively correlated with monthly temperatures of June,July and August in the four vineyards (Dão, Alentejo, Douro-C and Douro-D, Figure 2). Moderateto very strong negative correlations were observed with TG (−0.50 to −0.83) and TX (−0.56 to −0.81)in Alentejo, with August temperatures showing more influence on berry weight. Moreover, in Dãoand Douro-C, moderate negative correlations were also found with TG and TX in July. In Douro-D,correlations were weak for all temperatures and months analysed. In general, in all sites, TN showed amuch weaker influence on berry weight than TG and TX. Precipitation during the maturation period(July to September) increased berry weight, except in the Dão region, while a very strong positivecorrelation was observed in Alentejo (0.81). Similar to TON, the ARA berry weight tended to benegatively correlated with temperatures but, in general, correlations were weak to moderate (Figure 3).Berry weights in Alentejo and Douro-C were more correlated to June temperatures, while in Dão,July temperatures were more influential. In Douro-D, very weak correlations were observed betweentemperature and berry weight. A strong positive correlation between berry weight and precipitationduring the maturation period (July to September) was only observed in Douro-C (0.79).

Appl. Sci. 2020, 10, 4943 8 of 22
3.2.2. Titratable Acidity
High temperatures during the maturation phase also negatively impacted the titratable acidityof TON berries. In Dão, the strength of the correlations increased steadily as the season progressed,peaking in August. TA was mainly affected by July temperatures in Alentejo, while correlations weremoderate for all temperatures and months in Douro-C (Figure 2). Temperature negatively impactedTA levels of ARA berries at maturity, but mainly in Dão, with a growing trend throughout maturation(Figure 3). Generally, correlations between TA and precipitation were positive but weak (Figures 2and 3). Negative correlations with precipitation were found in Alentejo and Douro-D. In these tworegions grapevines are deficit-irrigated to avoid severe stress. Any precipitation occurring is notaccounted for in the water allocation and may result in dissolution of all grape berry metabolites,including acids.
3.2.3. pH
As expected, the correlations between temperature and berry pH were, in general, opposite tothose found for TA, as pH tended to decrease with the increase of titratable acidity (Figures 2 and 3).Correlations of pH with temperatures during all months studied were relatively weak and inconsistentin Douro-D. For ARA, the temperature had significant positive impacts on pH levels only in Dão, withstronger correlations in August for all temperature variables. Negative correlations between berrypH and precipitation were found in Dão and Douro-C for both varieties. An unexpected positivecorrelation between pH of TON berries and precipitation in April to June period was observed inAlentejo (Figure 2).
3.2.4. Potential Alcohol
In Alentejo and Douro-C, potential alcohol levels of TON berries were positively correlated withtemperature, with the effect of July TG and TX particularly apparent (Figure 2). Weak to moderatepositive correlations were found between TN and PA in these regions. Nonetheless, in Dão andDouro-D, TN revealed very weak correlations. Only the temperature in June consistently affectedalcohol levels positively in ARA grapes of Dão (Figure 3). For Dão, a strong negative correlationbetween precipitation and PA was observed for both varieties (Figures 2 and 3). In the remainingregions, precipitation had no clear effect on PA levels, possibly because of irrigation compensating forlow precipitation.
3.2.5. Total Phenols Index
The results showed that temperature negatively impacted the total phenols index at maturityin TON berries from Alentejo. However, the opposite effect can be found in Douro-D (Figure 2).Correlations between temperature and TPI in ARA berries were weak to moderate and dependenton the region (Figure 3). Precipitation increased or reduced the phenols level, also depending on theregion (Figures 2 and 3). The analysis of the impact of climatic variables on TPI is very complex, sincethe impact on different phenols can be different or even opposite.
3.2.6. Anthocyanins
The concentration of anthocyanins in both varieties was negatively associated with all temperatures.The correlations were particularly strong in Alentejo, where June temperatures (particularly TG andTX) depicted a great impact on the concentration of anthocyanins at maturity. Moderate correlationsbetween minimum temperatures and anthocyanins at maturity were found for all regions. Correlationsbetween precipitation and anthocyanins in TON berries were weak and depended on the region(Figure 2). Nevertheless, moderate positive and negative correlations were found between precipitation(from April to June) and anthocyanins in ARA berries (Figure 3).

Appl. Sci. 2020, 10, 4943 9 of 22Appl. Sci. 2020, 10, x FOR PEER REVIEW 10 of 24
Figure 2. Pearson product-moment correlation coefficients between grape berry quality parameters (berry weight, titratable acidity, pH, potential alcohol, total phenols index and anthocyanins) at maturity and climate variables for cv. Touriga Nacional (TON). Months are described by their initial letters. TG—average temperature; TX—maximum temperature; TN—minimum temperature; P—precipitation. Statistically significant correlation coefficients at 1% significance level are highlighted with an *.
Figure 2. Pearson product-moment correlation coefficients between grape berry quality parameters(berry weight, titratable acidity, pH, potential alcohol, total phenols index and anthocyanins) at maturityand climate variables for cv. Touriga Nacional (TON). Months are described by their initial letters.TG—average temperature; TX—maximum temperature; TN—minimum temperature; P—precipitation.Statistically significant correlation coefficients at 1% significance level are highlighted with an *.
Appl. Sci. 2020, 10, 4943 10 of 22Appl. Sci. 2020, 10, x FOR PEER REVIEW 11 of 24
Figure 3. Pearson product-moment correlation coefficients between grape berry quality parameters (berry weight, titratable acidity, pH, potential alcohol, total phenols index and anthocyanins) at maturity and climate variables for cv. Aragonez (ARA). Months are described by their initial letters. TG—average temperature; TX—maximum temperature; TN—minimum temperature; P—precipitation. Statistically significant correlation coefficients at 1% significance level are highlighted with an *.
Figure 3. Pearson product-moment correlation coefficients between grape berry quality parameters(berry weight, titratable acidity, pH, potential alcohol, total phenols index and anthocyanins) at maturityand climate variables for cv. Aragonez (ARA). Months are described by their initial letters. TG—averagetemperature; TX—maximum temperature; TN—minimum temperature; P—precipitation. Statisticallysignificant correlation coefficients at 1% significance level are highlighted with an *.
Appl. Sci. 2020, 10, 4943 11 of 22
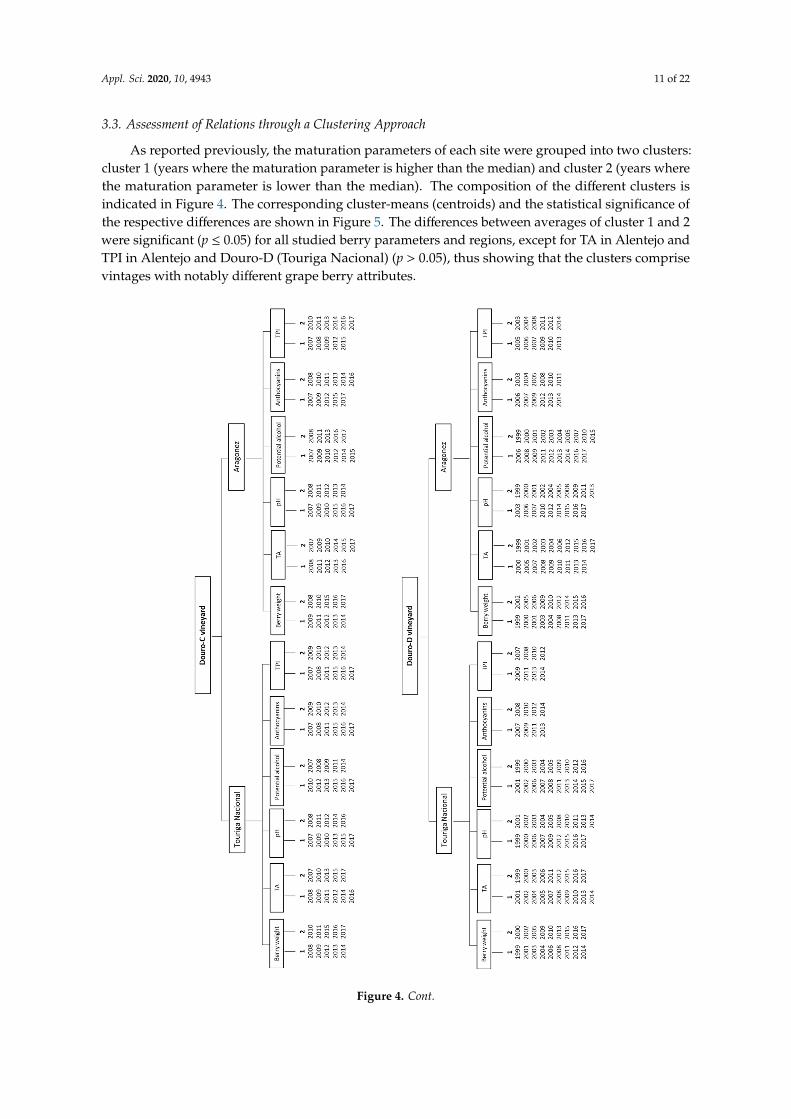
3.3. Assessment of Relations through a Clustering Approach
As reported previously, the maturation parameters of each site were grouped into two clusters:cluster 1 (years where the maturation parameter is higher than the median) and cluster 2 (years wherethe maturation parameter is lower than the median). The composition of the different clusters isindicated in Figure 4. The corresponding cluster-means (centroids) and the statistical significance ofthe respective differences are shown in Figure 5. The differences between averages of cluster 1 and 2were significant (p ≤ 0.05) for all studied berry parameters and regions, except for TA in Alentejo andTPI in Alentejo and Douro-D (Touriga Nacional) (p > 0.05), thus showing that the clusters comprisevintages with notably different grape berry attributes.
Appl. Sci. 2020, 10, x FOR PEER REVIEW 12 of 24
3.3. Assessment of Relations through a Clustering Approach
As reported previously, the maturation parameters of each site were grouped into two clusters: cluster 1 (years where the maturation parameter is higher than the median) and cluster 2 (years where the maturation parameter is lower than the median). The composition of the different clusters is indicated in Figure 4. The corresponding cluster-means (centroids) and the statistical significance of the respective differences are shown in Figure 5. The differences between averages of cluster 1 and 2 were significant (p ≤ 0.05) for all studied berry parameters and regions, except for TA in Alentejo and TPI in Alentejo and Douro-D (Touriga Nacional) (p > 0.05), thus showing that the clusters comprise vintages with notably different grape berry attributes.
Figure 4. Cont.
Appl. Sci. 2020, 10, 4943 12 of 22Appl. Sci. 2020, 10, x FOR PEER REVIEW 13 of 24
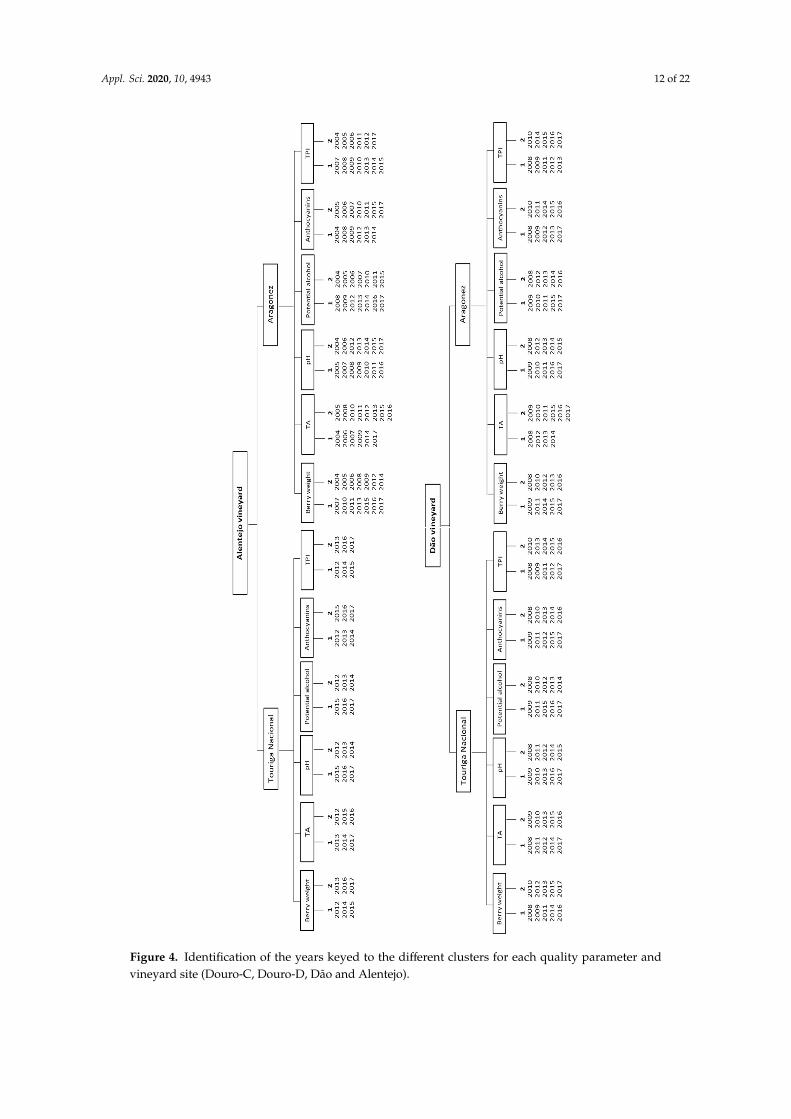
Figure 4. Identification of the years keyed to the different clusters for each quality parameter andvineyard site (Douro-C, Douro-D, Dão and Alentejo).

Appl. Sci. 2020, 10, 4943 13 of 22
Figure 5 also hints at differences in berry composition between cooler and warmer regions.Generally, in warmer regions and with lower annual precipitation (Alentejo and Douro-D, Table 2),berry weight and TA were lower than in cooler regions and with higher annual precipitation (Dão andDouro-C). Conversely, the berry pH was higher in warmer regions. Potential alcohol level at maturitydid not show a clear trend across regions. Even so, the highest potential alcohol level in ARA berrieswas observed in the warmer region (Alentejo) and was significantly different from the lowest levelobserved in the cooler region (Dão). The TPI was very similar in all regions for both clusters, althougha slight decrease (from the warmer to the colder region) was observed for ARA. Anthocyanins atmaturity did not show a clear trend across regions.
The grape berry compositions for Alentejo, Dão and Douro-C were noticeably affected by climaticconditions and will then be analysed in greater detail. For Douro-D, however, no such clear associationswere found, and the respective results are not shown for the sake of succinctness. The differencebetween monthly averages of TG, TX and TN for June, July and August between maturation clusterswas calculated for each site and variety (Tables 4 and 5). This analysis allowed the identification oftemperature differences that may explain the average difference in grape quality attributes betweenclusters. The temperature differences were associated with an increase in the grape quality parameter(cluster 1 – cluster 2).
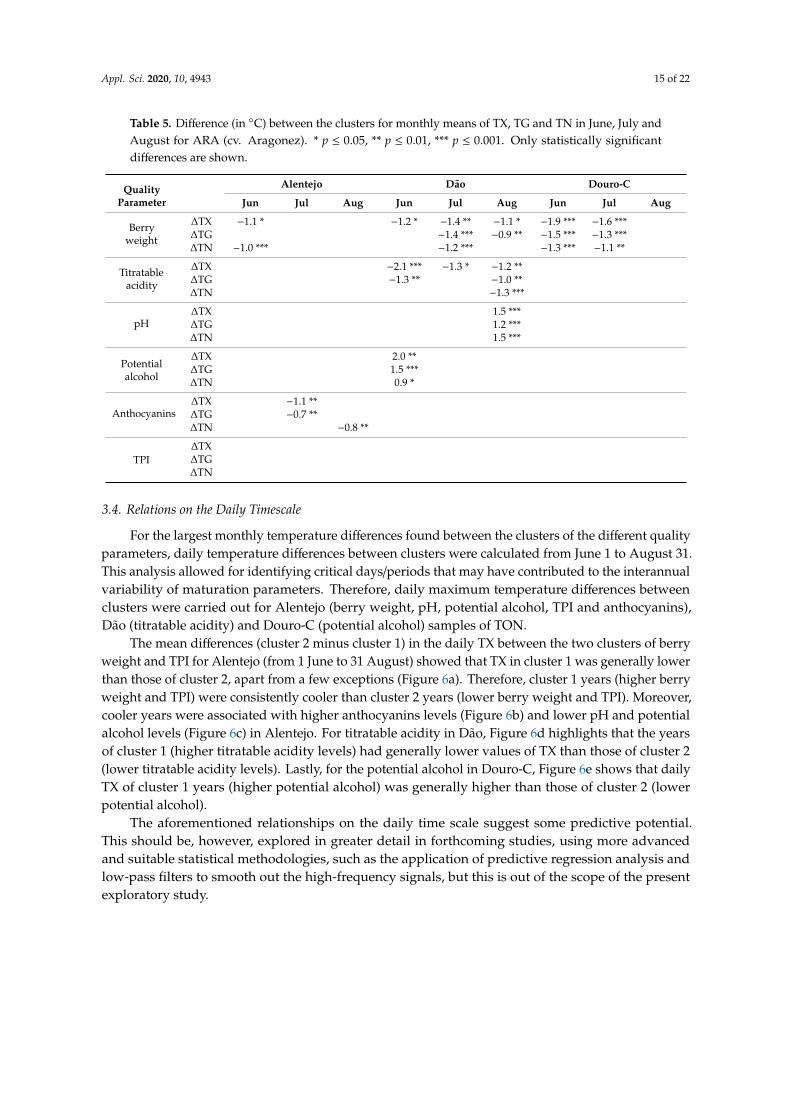
The results confirmed that higher temperature tends to lead to a reduction in berry weight, TA,anthocyanins and TPI (Tables 4 and 5). Conversely, lower temperature often induced a reduction inpH and potential alcohol. In general, significant temperature differences between clusters were lowerfor ARA. At large, higher temperature differences between clusters were found in July TX and forTON. In all studied regions, larger temperature differences between clusters were observed for TONin Alentejo and all parameters but TA. Temperature differences for TA clusters were higher for Dão.In Douro-C, the larger differences were found between potential alcohol clusters.
Table 4. Difference (in ◦C) between the clusters for monthly means of TX, TG and TN in June, July andAugust for TON (cv. Touriga Nacional). * p ≤ 0.05, ** p ≤ 0.01, *** p ≤ 0.001. Only statistically significantdifferences are shown.
QualityParameter
Alentejo Dão Douro-C
Jun Jul Aug Jun Jul Aug Jun Jul Aug
Berryweight
∆TX −2.0 ** −3.0 *** −1.5 ** −1.8 ** −1.8 *** −1.5 ***∆TG −1.0 * −1.3 *** −1.3 * −1.2 ** −1.0 *∆TN −1.0 ** −0.8 * −1.0 ** −1.0 **
Titratableacidity
∆TX −1.4 * −2.1 *** −2.0 *** −1.5 ***∆TG −1.3 *** −1.9 *** −1.8 *** −0.9 * −1.8 *** −0.9 **∆TN −0.8 * −1.0 ** −1.5 *** −1.4 *** −1.0 ** −1.9 *** −0.9 **
pH∆TX 2.7 *** 3.5 *** 2.0 *** 1.6 *** 2.6 *** 1.2 * 1.2 ***∆TG 1.7 ** 1.8 *** 0.8 * 1.4 *** 1.9 *** 1.2 ** 1.2 ** 1.1 ***∆TN 1.1 * 1.0 ** 0.8 * 0.9 * 1.6 *** 1.7 *** 1.2 *** 1.1 **
Potentialalcohol
∆TX 2.7 *** 3.5 *** 2.0 *** 2.0 *** 1.1 ** 3.3 *** 2.1 ***∆TG 1.7 ** 1.8 *** 0.8 * 1.0 * 2.7 *** 1.3 ***∆TN 1.1 * 1.0 ** 0.8 * 1.3 *** 2.9 *** 1.8 ***
Anthocyanin∆TX −2.7 *** −3.5 *** −2.0 *** −1.3 * −1.0 * −1.4 **∆TG −1.7 ** −1.8 *** −0.8 * −1.4 *** −0.9 **∆TN −1.1 * −1.0 ** −0.8 * −1.8 *** −0.6 * −0.8 * −1.0 **
TPI∆TX −2.0 ** −3.0 *** −2.0 *** −1.2 * −1.4 ***∆TG −1.0 * −1.3 *** −2.1 *** −1.0 **∆TN −1.0 ** −2.2 *** −0.8 ** −0.8 * −1.0 **

Appl. Sci. 2020, 10, 4943 14 of 22Appl. Sci. 2020, 10, x FOR PEER REVIEW 15 of 24
Figure 5. Grape berry quality parameters at maturity for TON (left panel) and ARA (right panel). The sites are listed from left to right according to average GST (April to October) in decreasing order. The bars represent the cluster-mean, the whiskers the standard deviation and statistically significant differences between clusters are indicated by asterisks (* p ≤ 0.05, ** p ≤ 0.01, *** p ≤ 0.001). Different letters indicate statistically significant differences between regions (for cluster 1).
Figure 5. Grape berry quality parameters at maturity for TON (left panel) and ARA (right panel).The sites are listed from left to right according to average GST (April to October) in decreasing order.The bars represent the cluster-mean, the whiskers the standard deviation and statistically significantdifferences between clusters are indicated by asterisks (* p ≤ 0.05, ** p ≤ 0.01, *** p ≤ 0.001). Differentletters indicate statistically significant differences between regions (for cluster 1).
Appl. Sci. 2020, 10, 4943 15 of 22
Table 5. Difference (in ◦C) between the clusters for monthly means of TX, TG and TN in June, July andAugust for ARA (cv. Aragonez). * p ≤ 0.05, ** p ≤ 0.01, *** p ≤ 0.001. Only statistically significantdifferences are shown.
QualityParameter
Alentejo Dão Douro-C
Jun Jul Aug Jun Jul Aug Jun Jul Aug
Berryweight
∆TX −1.1 * −1.2 * −1.4 ** −1.1 * −1.9 *** −1.6 ***∆TG −1.4 *** −0.9 ** −1.5 *** −1.3 ***∆TN −1.0 *** −1.2 *** −1.3 *** −1.1 **
Titratableacidity
∆TX −2.1 *** −1.3 * −1.2 **∆TG −1.3 ** −1.0 **∆TN −1.3 ***
pH∆TX 1.5 ***∆TG 1.2 ***∆TN 1.5 ***
Potentialalcohol
∆TX 2.0 **∆TG 1.5 ***∆TN 0.9 *
Anthocyanins∆TX −1.1 **∆TG −0.7 **∆TN −0.8 **
TPI∆TX∆TG∆TN
3.4. Relations on the Daily Timescale
For the largest monthly temperature differences found between the clusters of the different qualityparameters, daily temperature differences between clusters were calculated from June 1 to August 31.This analysis allowed for identifying critical days/periods that may have contributed to the interannualvariability of maturation parameters. Therefore, daily maximum temperature differences betweenclusters were carried out for Alentejo (berry weight, pH, potential alcohol, TPI and anthocyanins),Dão (titratable acidity) and Douro-C (potential alcohol) samples of TON.
The mean differences (cluster 2 minus cluster 1) in the daily TX between the two clusters of berryweight and TPI for Alentejo (from 1 June to 31 August) showed that TX in cluster 1 was generally lowerthan those of cluster 2, apart from a few exceptions (Figure 6a). Therefore, cluster 1 years (higher berryweight and TPI) were consistently cooler than cluster 2 years (lower berry weight and TPI). Moreover,cooler years were associated with higher anthocyanins levels (Figure 6b) and lower pH and potentialalcohol levels (Figure 6c) in Alentejo. For titratable acidity in Dão, Figure 6d highlights that the yearsof cluster 1 (higher titratable acidity levels) had generally lower values of TX than those of cluster 2(lower titratable acidity levels). Lastly, for the potential alcohol in Douro-C, Figure 6e shows that dailyTX of cluster 1 years (higher potential alcohol) was generally higher than those of cluster 2 (lowerpotential alcohol).
The aforementioned relationships on the daily time scale suggest some predictive potential.This should be, however, explored in greater detail in forthcoming studies, using more advancedand suitable statistical methodologies, such as the application of predictive regression analysis andlow-pass filters to smooth out the high-frequency signals, but this is out of the scope of the presentexploratory study.

Appl. Sci. 2020, 10, 4943 16 of 22
Appl. Sci. 2020, 10, x FOR PEER REVIEW 18 of 24
Figure 6. Cluster 2 – Cluster 1 differences in the mean TX (in °C) from 1 June to 31 August (dashed lines) for: (a) berry weight and total phenols index in Alentejo; (b) anthocyanins in Alentejo; (c) pH and potential alcohol in Alentejo; (d) titratable acidity in Dão; (e) potential alcohol in Douro-C. All parameters are for TON. The 11-day moving averages are also outlined (grey shaded areas).
4. Discussion
For the four selected vineyards (Alentejo, Dão, Douro-C and Douro-D), berry weight of TON (Touriga Nacional) and ARA (Aragonez) at maturity was negatively influenced by temperature, while strong positive correlations with precipitation (July to September) were found in Alentejo (TON) and Douro-C (ARA) (Figures 2 and 3). As vine water availability is closely related to temperature, an increase in temperature can lead to water deficit. Some studies have shown that when the vine is exposed to water stress, berry weight decreases [28,48,49], as water deficit generally leads to smaller berries, by inhibiting both cell division and cell expansion [12,50].
Figure 6. Cluster 2 – Cluster 1 differences in the mean TX (in ◦C) from 1 June to 31 August (dashedlines) for: (a) berry weight and total phenols index in Alentejo; (b) anthocyanins in Alentejo; (c) pH andpotential alcohol in Alentejo; (d) titratable acidity in Dão; (e) potential alcohol in Douro-C. All parametersare for TON. The 11-day moving averages are also outlined (grey shaded areas).
4. Discussion
For the four selected vineyards (Alentejo, Dão, Douro-C and Douro-D), berry weight of TON(Touriga Nacional) and ARA (Aragonez) at maturity was negatively influenced by temperature, whilestrong positive correlations with precipitation (July to September) were found in Alentejo (TON)and Douro-C (ARA) (Figures 2 and 3). As vine water availability is closely related to temperature,an increase in temperature can lead to water deficit. Some studies have shown that when the vine is

Appl. Sci. 2020, 10, 4943 17 of 22
exposed to water stress, berry weight decreases [28,48,49], as water deficit generally leads to smallerberries, by inhibiting both cell division and cell expansion [12,50].
For both grapevine varieties (TON and ARA), TA was negatively correlated with all monthlytemperatures (TX, TG and TN) between June to August, while correlations with precipitation weregenerally positive but weak (Figures 2 and 3). Temperature enhances the respiration of tartaric andmalic acids, thus leading to a drop in TA and increased pH [13,14]. The observed positive influence ofprecipitation on TA levels at maturity for Dão and Douro-C is supported by previous studies [14,17,51].However, the negative influence of precipitation in TA for Alentejo and Douro-D (Figures 2 and 3) wasnot originally expected and may be explained by the fact that these two vineyard sites are irrigated.However, future studies should focus on factors other than precipitation, such as atmospheric humidityand soil water holding capacity, since they also determine the vine water status [10].
The correlations between pH and monthly TX, TG and TN were generally positive, also inaccordance with previous studies [14]. The associations between pH and precipitation variables werenegative (more precipitation leads to lower pH), except for Alentejo and Douro-D (April to June),which is in accordance with the correlations with TA (Figures 2 and 3). The fact that the strength ofthe correlations between climate variables and pH is lower than between climate variables and TA(more evident for ARA) is possibly explained by previous results showing that pH is more affectedby the canopy microclimate than TA [52]. Future studies with microclimate data may further clarifythese correlations.
The correlation analysis between climate variables and potential alcohol was dependent on theregions and varieties. In Alentejo and Douro-C (TON) and Dão (ARA), temperature had a strongpositive influence on potential alcohol levels, despite the weak negative influences in Douro-D.Moreover, the strongest correlations were found between PA and monthly temperatures of June andJuly (fruit set/veraison period) (Figures 2 and 3). In agreement with previous reports, these resultsshowed that total soluble solids (TSS, an equivalent measure to PA) accumulation was stimulated byhigh temperatures at veraison and a few days after [20,21]. A strong negative correlation between PAand precipitation was only found in Dão for both varieties studied (rainfed vineyard), while a moderatepositive correlation was found in Alentejo (irrigated vineyard) (Figures 2 and 3). As previouslydescribed, under irrigated conditions, TSS concentration can be decreased by unexpected precipitationdue to the dilution effect caused by greater berry size [17]. Nonetheless, other reports have shown thatthe accumulation of sugar is improved in irrigated vines due to a stimulation of the photosyntheticactivity [22] in semi-arid regions. Thus, based on previous studies, both positive and negativecorrelations between PA and precipitation may occur, depending on the specific site conditions.
The optimum temperature for phenolic accumulation is approximately 25 ◦C [20]. Therefore, boththe positive and negative correlations (Figures 2 and 3) can be explained by the temperature differencesbetween regions. Alentejo is characterized by GST higher than the other regions, which may explainthe observed decrease of total phenols levels with temperature. However, the analysis of the impact ofclimatic variables on TPI is ambiguous since the impact of an environmental factor on each phenoliccompound may be different. Our results showed that TPI can be reduced or increased depending onthe region and precipitation period. It has been shown that the phenolic compound biosynthesis canbe stimulated or inhibited depending on the type of phenolic compound, severity of water deficit andthe period when the water deficit occurs [26]. On the other hand, the positive effect of water stresson phenolics concentration can be explained by the reduced berry size under water limitation [26].Surface area/volume ratio of the berries increases with the decrease of berry size. Then, since phenoliccompounds accumulate in the berry skin, smaller berries have a relatively greater solute to solventratio than larger berries [12].
Results showed that anthocyanins are negatively correlated with all monthly temperatures(TX, TG and TN) from June to August (Figures 2 and 3). Previous reports have shown that hightemperatures negatively affect the content of anthocyanins at harvest due to an impairment ofbiosynthesis [21] and/or accelerated degradation [25]. For both varieties, the TN in July and August
Appl. Sci. 2020, 10, 4943 18 of 22
was the most influential variable in all regions. According to a previous study [30], for nocturnaltemperature above and below 15 ◦C, grape berry anthocyanins are reduced and enhanced, respectively.The correlations between precipitation and anthocyanins (Figures 2 and 3) are different from oneregion to another. Specifically, a moderate positive correlation was found for Alentejo and a moderatenegative correlation for Dão in April–June period (Aragonez). Enhanced water availability early inthe growing season is beneficial, because it promotes vegetative growth and, consequently, berrydevelopment and its composition at later stages [29], thus explaining the positive correlation foundin Alentejo. On the other hand, excessive moisture late in the growing season has been described toreduce anthocyanins content [30], though this effect is not clear in our results.
The analysis of berry quality parameters at maturity across regions showed that the lowest levelsof berry weight and TA occurred more frequently in warmer sites with low annual precipitation(Alentejo and Douro-D). Accordingly, in the cooler sites, with higher annual precipitation (Douro-Cand Dão), berry weight and TA were higher (opposite effect observed with pH). The difference betweenwarmer and cooler regions relative to berry weight, TA and pH was particularly well established.Moreover, berry weight and TA levels were more negatively affected in warmer than in the cooleryears, while pH was more negatively affected in cooler than in warmer years (Figure 5).
Anthocyanins at maturity did not show a clear trend across regions when only the averagetemperature of the growing season was considered. However, precipitation levels influenced berryanthocyanins. Low levels of precipitation in Alentejo may have accounted for high anthocyaninscontent when compared to other regions (even with higher temperatures). Apart from that, in Alentejo,the highest anthocyanins content was in the coolest years and lowest in warmer years. Higherminimum temperatures recorded in Douro-D vineyard can explain lower anthocyanins levels (Figure 5).The positive effect of low minimum temperatures during ripening on anthocyanins accumulation wasalready reported [30].
The highest sugar content was associated with warmer years, and an opposite effect was observedin the coolest years (Figure 5), which is in agreement with previous reports [13]. Water limitation,often associated with heat stress, may affect plant hormonal equilibrium and berry weight, andcompromise sugar accumulation in grape berries [13].
The influence of precipitation on berry composition at maturity varied from one region to anotherand between varieties (Figures 2 and 3). Although some results have shown a role of precipitationduring flowering and maturation period, other variables, such as soil water holding capacity and airrelative humidity, should be considered to guarantee that the associations found with precipitationare not being influenced by other important determinants of the plant water status. On the otherhand, some of the studied vineyards were irrigated for part of the time period studied (Alentejo andDouro-D), which limits the study of precipitation influence on berry composition.
In general, the results showed that grape berry quality parameters of the ARA variety are lessaffected by interannual climatic variability than the TON variety. Thus, ARA seems to be more resilientto climatic variations, which is reflected in their grape berry composition, namely in the studiedgrape berry quality parameters. The physiological response of grapevines to environmental stress iscomplex and not yet completely understood. It depends on the genotype and is largely influenced byboth rootstock and scion traits. Concerning scion traits, leaf stomatal regulation is a key parameterinfluencing plant water relations [53]. Thus, one explanation for the obtained results may arise from thefact that ARA shows isohydric behaviour, while TON shows anisohydric behaviour [54]. These termsare related to stomatal regulation, such that some genotypes display better stomatal regulation underwater stress than others, being classified as isohydric (drought avoiders or ‘pessimistic’). In turn,anisohydric (‘optimistic’) genotypes have less control of stomatal aperture under water stress [53].
In Semillon variety (anisohydric), high stomatal conductance during the day results in anincomplete rehydration before dawn, especially during warm and windy nights, which affected grapeberry composition [55]. A similar behaviour could account for the results obtained in the present studyfor TON. This variety displays a high capacity of heat dissipation via evaporative cooling, which can
Appl. Sci. 2020, 10, 4943 19 of 22
facilitate adaptation to warmer climates under plentiful water supply, such as in irrigated vines [54,56].However, for rainfed TON vineyards, the adaptation to warmer climates by evaporative cooling islimited. Moreover, TON may face early senescence of basal leaves and further leaf drop, with negativeconsequences for berry quality [53]. Therefore, isohydric varieties are more tolerant to drought/waterstress than the anisohydric ones. Whether or not isohydric, some genotypes have different behaviouraccording to growing conditions (e.g., field versus greenhouse) and the degree of stress imposed onvines [57]. However, in this study, a comparison between varieties was carried out in the same regionsand over the same growing conditions, using a plural number of genotypes and a wide range of plantage on each. Hence, the different behaviour of TON and ARA regarding stomatal regulation is likelyan important physiological condition that accounts for the observed results.
In this study, the influences of climate variables on grape berry composition were examined atmaturity (last analysis carried out before harvest, up to two weeks before), so the established commonmaturity level is influenced by the winemaker’s decision to harvest, which could have introduceda variation between samples. This additional source of variation could be minimised by fixing acommon maturity date (e.g., when the crop first reaches 22◦ Brix TSS [14]), but this type of experimentalmethodology is not possible to implement in a study like the one performed here, which was based onmaturity data from different regions and over a large period.
5. Conclusions
For the studied sites in Portugal (Douro, Dão and Alentejo) and their environmental conditions,at berry maturity, high temperatures tend to decrease berry weight, titratable acidity, anthocyaninsand TPI, and increase pH and potential alcohol. Concerning precipitation, its influence was largelydependent on location and variety. Although these outcomes are in line with previous findings andwere thereby expected, this study is unprecedented for Portugal, as it is based on a large systematisedand comprehensive database of grape berry maturity parameters. After identifying the most importantclimatic variables, the development of a model to be used for both operational short-to-mediumrange prediction and climate change impact assessments should be envisioned in future research.The grape maturation database that was prepared in the context of the present study still containscrucial information that can be further exploited to increase the level of knowledge about the influenceof climatic variability on grape composition. In particular, it would be interesting: (i) to searchcorrelations between climatic variables and grape quality parameters not studied in this work, such asmalic acid, and to the varietal aromatic potential; (ii) to extend the study to other regions and varieties;and (iii) to examine the interaction of soil/weather/morphology of the territory.
Author Contributions: Conceptualization and methodology, all authors; software, C.C.; validation, C.C.; formalanalysis, C.C.; investigation, all authors; resources, C.C. and A.G.; data curation, C.C., N.F., M.T. and A.G.;writing—original draft preparation, C.C. and J.A.S. writing—review and editing, all authors; visualization, C.C.;supervision, H.G., A.G. and J.A.S.; project administration, N.F. and A.G.; funding acquisition, J.A.S. All authorshave read and agreed to the published version of the manuscript.
Funding: This study was funded by the Clim4Vitis project—“Climate change impact mitigation for Europeanviticulture: knowledge transfer for an integrated approach”, funded by European Union’s Horizon 2020 Researchand Innovation Programme, under grant agreement no. 810176.
Acknowledgments: This work was supported by the “Contrato-Programa” UIDB/04050/2020 and UIDB/04033/2020funded by national funds through the FCT I.P. The work was also supported by FCT and European Funds(FEDER/POCI/COMPETE2020) through the research projects MitiVineDrought (PTDC/BIA-FBT/30341/2017 andPOCI-01-0145-FEDER-030341). The study was also supported by FCT—Portuguese Foundation for Science andTechnology, under the project UIDB/04033/2020.
Conflicts of Interest: The authors declare no conflicts of interest. The funders had no role in the design of thestudy; in the collection, analyses, or interpretation of data; in the writing of the manuscript, or in the decision topublish the results.

Appl. Sci. 2020, 10, 4943 20 of 22
References
1. Organisation Internationale de la Vigne et du vin. 2019 Statistical Report on World Vitiviniculture; InternationalOrganisation of Vine and Wine: Paris, France, 2019.
2. Fontoin, H.; Saucier, C.; Teissedre, P.-L.; Glories, Y. Effect of pH, ethanol and acidity on astringency andbitterness of grape seed tannin oligomers in model wine solution. Food Qual. Prefer. 2008, 19, 286–291.[CrossRef]
3. Jones, G.; Reid, R.; Vilks, A. Climate, Grapes, and Wine: Structure and Suitability in a Variable and ChangingClimate. In The Geography of Wine; Springer: Dordrecht, The Netherlands, 2012; pp. 109–133. [CrossRef]
4. Bonada, M.; Sadras, V.O. Critical appraisal of methods to investigate the effect of temperature on grapevineberry composition. Aust. J. Grape Wine Res. 2015, 21, 1–17. [CrossRef]
5. Fraga, H.; Santos, J.A.; Moutinho-Pereira, J.; Carlos, C.; Silvestre, J.; Eiras-Dias, J.; Mota, T.; Malheiro, A.C.Statistical modelling of grapevine phenology in Portuguese wine regions: Observed trends and climatechange projections. J. Agric. Sci. 2016, 154, 795–811. [CrossRef]
6. Costa, R.; Fraga, H.; Fonseca, A.; de Cortazar-Atauri, I.G.; Val, M.C.; Carlos, C.; Reis, S.; Santos, J.A. GrapevinePhenology of cv. Touriga Franca and Touriga Nacional in the Douro Wine Region: Modelling and ClimateChange Projections. Agronomy 2019, 9, 210. [CrossRef]
7. Bock, A.; Sparks, T.H.; Estrella, N.; Menzel, A. Climate-Induced Changes in Grapevine Yield and Must SugarContent in Franconia (Germany) between 1805 and 2010. PLoS ONE 2013, 8, e69015. [CrossRef] [PubMed]
8. Santos, J.; Graetsch, S.; Karremann, M.; Jones, G.; Pinto, J. Ensemble projections for wine production in theDouro Valley of Portugal. Clim. Chang. 2013, 117, 211–225. [CrossRef]
9. Mira de Orduña, R. Climate change associated effects on grape and wine quality and production. Food Res. Int.2010, 43, 1844–1855. [CrossRef]
10. Gladstones, J. Viticulture and Environment; Winetitles: Adelaide, Australia, 1992.11. Ashenfelter, O.; Storchmann, K. Wine and Climate Change. Am. Assoc. Wine Econ. 2014, 164854, 319–343.
[CrossRef]12. Conde, C.; Silva, P.; Fontes, N.; Dias, A.; Tavares, R.; Sousa, M.; Agasse, A.; Delrot, S.; Gerós, H. Biochemical
changes throughout Grape Berry development and fruit and wine quality. Food 2007, 1, 1–22.13. Ubalde, J.M.; Sort, X.; Zayas, A.; Poch, R.M. Effects of Soil and Climatic Conditions on Grape Ripening and
Wine Quality of Cabernet Sauvignon. J. Wine Res. 2010, 21, 1–17. [CrossRef]14. Barnuud, N.N.; Zerihun, A.; Gibberd, M.; Bates, B. Berry composition and climate: Responses and empirical
models. Int. J. Biometeorol. 2014, 58, 1207–1223. [CrossRef] [PubMed]15. Buttrose, M.S.; Hale, C.R.; Kliewer, W.M. Effect of Temperature on the Composition of Cabernet Sauvignon
Berries. Am. J. Enol. Vitic. 1971, 22, 71–75.16. Ruffner, H.P.; Hawker, J.S.; Hale, C.R. Temperature and enzymic control of malate metabolism in berries of
Vitis vinifera. Phytochemistry 1976, 15, 1877–1880. [CrossRef]17. Lopez, M.I.; Sanchez, M.T.; Diaz, A.; Ramirez, P.; Morales, J. Influence of a deficit irrigation regime during
ripening on berry composition in grapevines (Vitis vinifera L.) grown in semi-arid areas. Int. J. Food Sci. Nutr.2007, 58, 491–507. [CrossRef]
18. Coombe, B.G. Influence of temperature on composition and quality of grapes. Acta Hortic. 1987, 206, 23–36.[CrossRef]
19. Keller, M. Managing grapevines to optimise fruit development in a challenging environment: A climatechange primer for viticulturists. Aust. J. Grape Wine Res. 2010, 16, 56–69. [CrossRef]
20. Poudel, P.R.; Mochioka, R.; Beppu, K.; Kataoka, I. Influence of temperature on berry composition ofinterspecific hybrid wine grape ‘Kadainou R-1’ (Vitis ficifolia var. ganebu × V. vinifera ‘Muscat ofAlexandria’). J. Jpn. Soc. Hortic. Sci. 2009, 78, 169–174. [CrossRef]
21. Mori, K.; Sugaya, S.; Gemma, H. Decreased anthocyanin biosynthesis in grape berries grown under elevatednight temperature condition. Sci. Hortic. 2005, 105, 319–330. [CrossRef]
22. Bartolomé, M. Respuestas de la vid (Vitis vinifera L.) a Condiciones de Estrés Hídrico: Efectos Sobre las RelacionesAgua-Planta, el Crecimiento, la Producción y la Calidad (cv. Tempranillo); Universidad Politécnica de Madrid:Madrid, Spain, 1993.

Appl. Sci. 2020, 10, 4943 21 of 22
23. Cacho, J.; Fernández, P.; Ferreira, V.; Castells, J.E. Evolution of Five Anthocyanidin-3-Glucosides in the Skinof the Tempranillo, Moristel, and Garnacha Grape Varieties and Influence of Climatological Variables. Am. J.Enol. Vitic. 1992, 43, 244–248.
24. Lorrain, B.; Chira, K.; Teissedre, P.-L. Phenolic composition of Merlot and Cabernet-Sauvignon grapes fromBordeaux vineyard for the 2009-vintage: Comparison to 2006, 2007 and 2008 vintages. Food Chem. 2011, 126,1991–1999. [CrossRef]
25. Mori, K.; Goto-Yamamoto, N.; Kitayama, M.; Hashizume, K. Loss of anthocyanins in red-wine grape underhigh temperature. J. Exp. Bot. 2007, 58, 1935–1945. [CrossRef] [PubMed]
26. Ojeda, H.; Andary, C.; Kraeva, E.; Carbonneau, A.; Deloire, A. Influence of pre- and post-veraison waterdeficit on synthesis and concentration of skin phenolic compounds during berry growth of Vitis Vinifera cv.Shiraz. Am. J. Enol. Vitic. 2002, 53, 261–267.
27. Matthews, M.; Anderson, M.M. Fruit ripening in Vitis vinifera L. responses to seasonal water deficits. Am. J.Enol. Vitic. 1988, 39, 313–320.
28. Castellarin, S.D.; Pfeiffer, A.; Sivilotti, P.; Degan, M.; Peterlunger, E.; Di Gaspero, G. Transcriptional regulationof anthocyanin biosynthesis in ripening fruits of grapevine under seasonal water deficit. Plant Cell Environ.2007, 30, 1381–1399. [CrossRef] [PubMed]
29. Keller, M.; Tarara, J.M.; Mills, L.J. Spring temperatures alter reproductive development in grapevines. Aust. J.Grape Wine Res. 2010, 16, 445–454. [CrossRef]
30. Jackson, D.I.; Lombard, P.B. Environmental and Management Practices Affecting Grape Composition andWine Quality—A Review. Am. J. Enol. Vitic. 1993, 44, 409–430.
31. Cogato, A.; Meggio, F.; Pirotti, F.; Cristante, A.; Marinello, F. Analysis and impact of recent climate trends ongrape composition in north-east Italy. BIO Web. Conf. 2019, 13. [CrossRef]
32. Jones, G.V.; Davis, R.E. Climate influences on grapevine phenology, grape composition, and wine productionand quality for Bordeaux, France. Am. J. Enol. Vitic. 2000, 51, 249–261.
33. Cunha, M.; Abreu, I.; Pinto, P.; Castro, R.d. Airborne Pollen Samples for Early-Season Estimates of WineProduction in a Mediterranean Climate Area of Northern Portugal. Am. J. Enol. Vitic. 2003, 54, 189–194.
34. Santos, J.A.; Fraga, H.; Malheiro, A.C.; Moutinho-Pereira, J.; Dinis, L.-T.; Correia, C.; Moriondo, M.; Leolini, L.;Dibari, C.; Costafreda-Aumedes, S.; et al. A Review of the Potential Climate Change Impacts and AdaptationOptions for European Viticulture. Appl. Sci. 2020, 10, 3092. [CrossRef]
35. Blouin, J.; Peynaud, É. Connaissance et Travail du Vin, 3rd ed.; Dunod: Paris, France, 2001.36. Saint-Cricq, N.; Vivas, N.; Glories, Y. Maturité phénolique: Définition et contrôle. Rev. Française Oenologie
1998, 173, 22–25.37. Fonseca, A.R.; Santos, J.A. High-Resolution Temperature Datasets in Portugal from a Geostatistical Approach:
Variability and Extremes. J. Appl. Meteorol. Clim. 2018, 57, 627–644. [CrossRef]38. Wilks, D.S. Statistical Methods in the Atmospheric Sciences, 4th ed.; Elsevier: Cambridge, MA, USA, 2019.39. Santos, M.; Fonseca, A.; Fraga, H.; Jones, G.V.; Santos, J.A. Bioclimatic conditions of the Portuguese wine
denominations of origin under changing climates. Int. J. Climatol. 2020, 40, 927–941. [CrossRef]40. Fraga, H.; Atauri, I.G.D.; Santos, J.A. Viticultural irrigation demands under climate change scenarios in
Portugal. Agric. Water Manag. 2018, 196, 66–74. [CrossRef]41. Santos, J.A.; Pinto, J.G.; Ulbrich, U. On the development of strong ridge episodes over the eastern North
Atlantic. Geophys. Res. Lett. 2009, 36. [CrossRef]42. Santos, J.; Corte-real, J.; Leite, S. Atmospheric large-scale dynamics during the 2004/2005 winter drought in
Portugal. Int. J. Climatol. 2007, 27, 571–586. [CrossRef]43. Fraga, H.; Atauri, I.G.D.; Malheiro, A.C.; Moutinho-Pereira, J.; Santos, J.A. Viticulture in Portugal: A review
of recent trends and climate change projections. OENO One 2017, 51, 61–69. [CrossRef]44. Santos, M.; Fragoso, M.; Santos, J.A. Regionalization and susceptibility assessment to daily precipitation
extremes in mainland Portugal. Appl. Geogr. 2017, 86, 128–138. [CrossRef]45. Santos, J.A.; Belo-Pereira, M. A comprehensive analysis of hail events in Portugal: Climatology and
consistency with atmospheric circulation. Int. J. Climatol. 2019, 39, 188–205. [CrossRef]46. Fraga, H.; Molitor, D.; Leolini, L.; Santos, J.A. What Is the Impact of Heatwaves on European Viticulture?
A Modelling Assessment. Appl. Sci. 2020, 10, 3030. [CrossRef]47. Santos, J.A.; Costa, R.; Fraga, H. New insights into thermal growing conditions of Portuguese grapevine
varieties under changing climates. Appl. Clim. 2019, 135, 1215–1226. [CrossRef]
Appl. Sci. 2020, 10, 4943 22 of 22
48. Arrizabalaga, M.; Morales, F.; Oyarzun, M.; Delrot, S.; Gomes, E.; Irigoyen, J.J.; Hilbert, G.; Pascual, I.Tempranillo clones differ in the response of berry sugar and anthocyanin accumulation to elevated temperature.Plant Sci. 2018, 267, 74–83. [CrossRef] [PubMed]
49. Van Leeuwen, C.; Trégoat, O.; Choné, X.; Bois, B.; Pernet, D.; Gaudillère, J.-P. Vine water status is a keyfactor in grape ripening and vintage quality for red Bordeaux wine. How can it be assessed for vineyardmanagement purposes? OENO One 2009, 43, 121–134. [CrossRef]
50. Dai, Z.W.; Ollat, N.; Gomès, E.; Decroocq, S.; Tandonnet, J.-P.; Bordenave, L.; Pieri, P.; Hilbert, G.; Kappel, C.;van Leeuwen, C.; et al. Ecophysiological, Genetic, and Molecular Causes of Variation in Grape Berry Weightand Composition: A Review. Am. J. Enol. Vitic. 2011, 62, 413–425. [CrossRef]
51. Salazar-Parra, C.; Aguirreolea, J.; Sánchez-Díaz, M.; Irigoyen, J.; Morales, F. Effects of climate changescenarios on Tempranillo grapevine (Vitis vinifera L.) ripening: Response to a combination of elevated CO2
and temperature, and moderate drought. Plant Soil. 2010, 337, 179–191. [CrossRef]52. Smart, E.R. Principles of grapevine canopy microclimate manipulation with implications for yield and
quality. A review. Am. J. Enol. Vitic. 1985, 36, 230–239.53. Zarrouk, O.; Costa, J.M.; Francisco, R.; Lopes, C.; Chaves, M.M. Drought and water management in
Mediterranean vineyards. In Grapevine in a Changing Environment; Gerós, H., Chaves, M.M., Medrano Gil, H.,Delrot, S., Eds.; John Wiley & Sons: New York, NY, USA, 2016; pp. 38–59.
54. Carvalho, L.C.; Coito, J.L.; Goncalves, E.F.; Chaves, M.M.; Amancio, S. Differential physiological responseof the grapevine varieties Touriga Nacional and Trincadeira to combined heat, drought and light stresses.Plant Biol. 2016, 18, 101–111. [CrossRef]
55. Rogiers, S.Y.; Greer, D.H.; Hutton, R.J.; Landsberg, J.J. Does night-time transpiration contribute to anisohydricbehaviour in a Vitis vinifera cultivar? J. Exp. Bot. 2009, 60, 3751–3763. [CrossRef]
56. Costa, J.M.; Ortuño, M.F.; Lopes, C.M.; Chaves, M.M. Grapevine varieties exhibiting differences in stomatalresponse to water deficit. Funct. Plant Biol. 2012, 39, 179–189. [CrossRef]
57. Chaves, M.M.; Zarrouk, O.; Francisco, R.; Costa, J.M.; Santos, T.; Regalado, A.P.; Rodrigues, M.L.; Lopes, C.M.Grapevine under deficit irrigation: Hints from physiological and molecular data. Ann. Bot. 2010, 105,661–676. [CrossRef]
© 2020 by the authors. Licensee MDPI, Basel, Switzerland. This article is an open accessarticle distributed under the terms and conditions of the Creative Commons Attribution(CC BY) license (http://creativecommons.org/licenses/by/4.0/).
Copyright © 2022 FDOKUMEN