Induced focusing and conversion of a Gaussian beam into an elliptic Gaussian beam
Upload
independentCategory
view
0download
0
T0 be published in Nuclear Instruments and Methods OCR Output
sation of -0.82 is measured with a relative systematic accuracy of 3%.from the energy spectrum of positrons from the decay a+ —> e+ve17,,. A polariSPS, for muon energies of 100 to 200 GeV. The beam polarisation is determinedA muon beam polarimeter has been built for the SMC experiment at the CERN
Abstract
The Spin Muon Collaboration (SMC)
MUON BEAM
MEASUREMENT OF THE POLARISATION OF A HIGH ENERGY bl
Ponniassa
ee Neeeeeee eeee||l|||l\\||l\||\\\||\|\\l|\|||\l|\|\||\\l\\|\|\lllCERN LIBRFIRIEEB GENEVFQ l CERN-PPE/93-201
EUROPEAN ORGANIZATION FOR NUCLEAR RESEARCH
A. Y&f1€Z19, A.M. Zanettim, K. Za.remba24*“‘, J. Zha.06 OCR OutputR. Weinsteing, C. Whittenz, R. Windmoldersu, W. Wislicki", A. Witzmanns,
W. Thiel1*k, S. Trentalangez, Y. Tzamouranisgl, M. Velascow, J. Vogtm, R. Voss4,A. Steinmetzw, H. Stuhrmanne', W. Tlaczala2"*“‘, K.M. Teichertlz, F. Tessarottom,
R. Seitzw, S. Sergeevg, F. Severmj, P. Shanaha.1116, G. Smirnovg, A. Staudeu,A. Sandacz", D. Sanderss, l. Saving, P. Schiavonzl, K.P. Schiiler25*i, R. Segelw,
M. Rodriguezlg, E. R0ndio24, L. Ropelewskix, A. Rosadou, I. Sab02°, J. Saboridolg,H. Postma}4, T. Pussieuxlg, J. Pyrlikg, J.M. Rieubland4, A. Rijllart4, J.B. Robertsu,
D. Peshekhonovg, R. Piegaia"·h, L. Pinskyg, S. Platchkovlg, M. Plow, D. Poseg,J.E.J. Oberskiu, S. Okumim, D.P. Parkss, A. Penzom, G. Perez3’g, F. Perrot-Kunnelg,
J. M0r0misat015, G.S. Mutchler", J. Nassalskiu, L. Naumann4, T.O. Niinik0ski‘*,B. Mayesg, J .S. McCarthy23, G. van Middelkoopu, D. Millerw, J. Mitchel123, K. Morin,
M. Lowell., A. Magn0n4*18, G.K. Mall0t'*·1°, F. Marielg, A. Martinzl, J. Martinolg,Lesquenlg, J. Lichte11stadt2°, T. Lir1dqvist22, M. Litmaathu, S. Lopez-Ponte19·8,
J. Kyyn5.rainen7, M. Lamannazl, U. Landgrafs, K. La.u8, T. Layda.3, F. Leharlg, A. deT.J. Ketelu, A. Kishils, Yu. Kisselevg, L. Klostermannu, V. Krivokhijineg, V. Kukhting,
T. Iwatam, M. de Jongm, E.M. KabuB1°, R. Kaisers, A. Karevg, H.J. Kesslers,N. Hayashim, C.A. Heuscha, N. Horikawaw, V.W. Hughes25, G. Igoz, S. Ishim0t013*f,A. G0mez19*8, G. Gracialg, M. Grosse Perdekampz, D. von Harrachm, T. Hasegawa13·°,
J .A. Garz0n19’8, L. Gatign0n‘*, T. Gaussiran", M. Giorgim, E. von Goelerls,D. Faschingls, F. Feinstein4*d, C. Fernandezmg, B. Froislg, C. Garabatosma,
S. Dhawanzs, C. Dulya2, J. Dupontlg, A. Dyring", S. Eichblattu, J.C. Faivrelg,T. Cuhadar4·°, S. Dalla Torrezl, R. van Dantzigu, D. Day", J.M. Dem0lis4,J. Clement", M. Clocchiattim, M.D. Corcoranu, D. C1·abb23, J. Cranshaw",
A. Brf1ll5, J. Buchananu, S. Biiltmannl, E. Burtinlg, C. Cavata.18, J.P. Chen23,B.E. Bonneru, N. de B0tt0114*18, M. B0utemeur25*b, F. Bradamantezl, A. Bressa.1121,
G. Bauml, P. Berglundu, L. Betevu, I.G. Bird18·“, R. Birsazl, P. Bj6rkh0lm22,B. Adeva.19, S. Ahmad", A. Arvidsonzz, B. Badelek22·24, M.K. Ballintijnu, G. Bardinlg,
Aires, Argentina
University of Buenos Aires, Physics Department, 1428 Buenos OCR Outputh) Permanent address:duras
g) Permanent address: University of Honduras, Physics Department, Tegucigalpa, Hon: KEK, 305 Ibaraki-Ken, Japanf) Permanent address: Miyazaki University, 88921 Miyazaki-Shi, Japane) Permanent address: DAPNIA, CEN Saclay, 91191 Gif—sur-Yvette, Franced) Permanent address: Bogazigi University, Bebek, Istanbul, Turkeyc) Permanent address
b) Now at University of Montreal, PQ, H3C 3J7, Montreal, Canadaa) Now at CERN, 1211 Geneva 23, Switzerland25) Yale University, Department of Physics, New Haven, 06511 CT, USA°24) Warsaw University and Soltan Institute for Nuclear Studies, 00681 Warsaw, Polandu23) University of Virginia, Department of Physics, Charlottesville, 22901 VA, USAF22) Uppsala University, Department of Radiation Sciences, 75121 Uppsala, Sweden21) INFN Trieste and University of Trieste, Department of Physics, 34127 Trieste, Italy20) Tel Aviv University, School of Physics, 69978 Tel Aviv, Israel‘
Spains19) University of Santiago, Department of Particle Physics, 15706 Santiago de Compostela,18) DAPNIA, CEN Saclay, 91191 Gif-sur-Yvette, France17) Rice University, Bonner Laboratory, Houston, 77251-1892 TX, USA°16) Northwestern University, Department of Physics, Evanston, 60208 IL, USA°·15) Northeastern University, Department of Physics, Boston, 02115 MA, USAP14) NIKHEF, FOM and Free University, 1009 AJ Amsterdam, The Netherlands’
Japanq
13) Nagoya University, Department of Physics, Furo—Cho, Chikusa—Ku, 464 Nagoya,12) University of Munich, Physics Department, 80799 Munich, Germany"11) University of Mons, Faculty of Science, 7000 Mons, Belgium10) University of Mainz, Institute for Nuclear Physics, 55099 Mainz, Germany"9) J INR, Laboratory of Super High Energy Physics, Dubna, Russia
for Beam Particle Dynamics, Houston, 77204-5506 TX, USA°*8) University of Houston, Department of Physics, Houston, 77204—5504 TX, and Institute
Finland
7) Helsinki University of Technology, Low Temperature Laboratory, Otakaari 3A, 021506) GKSS, 21494 Geesthacht, Germany“5) University of Freiburg, Physics Department, 79104 Freiburg, Germany"4) CERN, 1211 Geneva 23, Switzerland3) University of California, Institute of Particle Physics, Santa Cruz, 95064 CA, USA2) University of California, Department of Physics, Los Angeles, 90024 CA, USA°1) University of Bielefeld, Physics Department, 33615 Bielefeld 1, Germany“
u) Supported by KBN OCR Outputt) Supported by the US-Israel Binational Science Foundation, Jerusalem, Israels) Supported by Comision Interministerial de Ciencia y Tecnologiar) Supported by the National Science Foundation of the Netherlands (NWO)
Programq) Supported by the Mitsubishi Foundation and Monbusho International Science Researchp) Supported by the National Science Foundation0) Supported by the Department of Energyn) Supported by Bundesministerium fiir Forschung und Technologiem) Now at Warsaw University of Technologyl) Now at University of Virginia, Dept. of Physics, Charlottesville, 22901 VA, USAk) Now at Philips Kommunikations-Industrie AG, 8500 Niirnberg 10, Germanyj) Now at ESRF, 38043 Grenoble, France
Now at SSC Laboratory, Dallas, 75237 TX, USA
momentum range 19-23 GeV was measured to an accuracy of 2 20%.directly in the beam line. The polarisation difference of 0.8 between the two beams in thelead filter, designed to absorb incoming electrons. Positrons were identified by calorimetrythe muon momentum analyzing magnet, the beginning of the decay path was defined by aThe muon beam momentum was measured by a magnetic spectrometer. Downstream ofdecay in flight to measure the polarisation difference for oppositely polarised muon beams.at Serpukov. They used the average value of the positron energy spectrum from muondeep inelastic scattering, Golovkin et al. [7] measured the polarisation of the muon beam
Because of their interest in measuring parity violation in polarised muon-nucleoncompatible with +1 to an accuracy of 30%.scintillators interleaved with the iron foils. The helicity of the muon was shown to bewere identified and their energies were measured in a shower detector consisting of plasticelectrons from a series of iron foils in which the magnetization was reversed. The electronsexperimental technique was to measure the asymmetry in the production of knock-on
the prediction of a helicity +1 for the muon from the decay of a negative pion TheThe first measurement of the polarisation of a muon beam was intended to test
results obtained from experimental runs in 1991 and 1992.
describes the muon decay polarimeter which is now used in the SMC experiment, and themuon-electron scattering It will be described in a forthcoming publication. This paperhas different systematic uncertainties is based on measuring the asymmetry in polarisedfrom the energy spectrum of positrons from muon decay. A complementary method whichTwo methods are used to achieve this goal. The first one determines the beam polarisationit is necessary to measure the muon beam polarisation to an accuracy better than 5%.functions of the proton and the deuteron. To reach the goals of the SMC experiment,experiment is presently being carried out at CERN [4] to measure the spin structuretermined by a Monte Carlo simulation with an estimated accuracy of 7.5% The SMCstructure function g1(:r) with a muon beam, the value of the beam polarisation was deture functions of the nucleon [2, 3]. In the first measurement of the proton spin dependenteffects in the muon—quark interaction [1] and have determined the spin dependent strucpolarised. Experiments using the polarisation of muon beams have measured electroweakflight. Due to the parity violating nature of the weak decay vr —> pu, such beams are
High energy muon beams at proton accelerators are produced by pion decay in
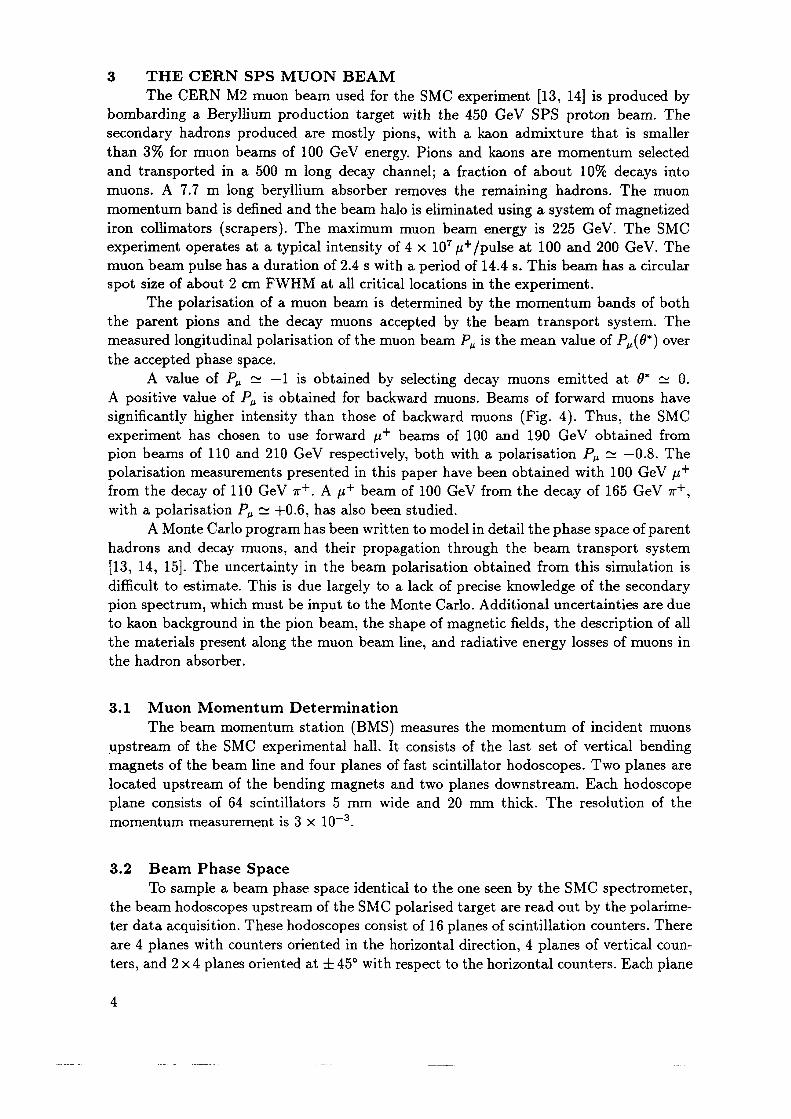
without these corrections would be different by 2 -0.07. OCR Output
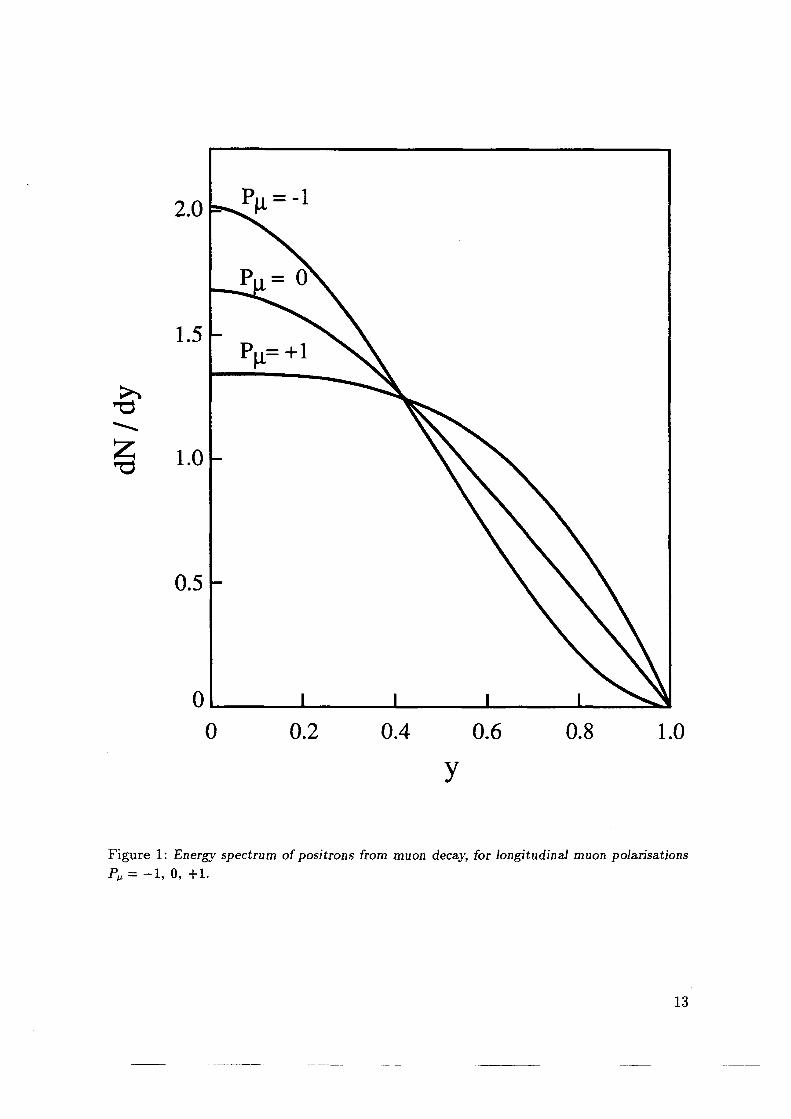
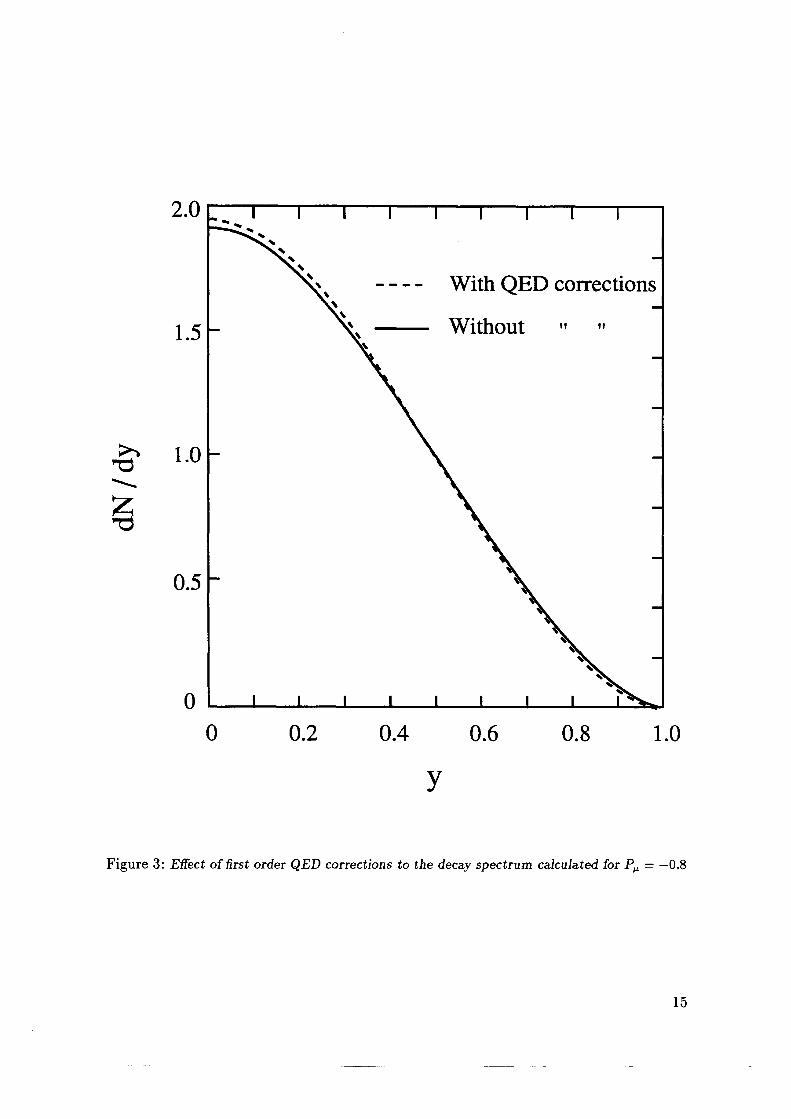
and the decay spectrum with first order corrections included. The polarisation extractedradiative decay p"' —> e+ u¢17,;y (Fig. 2 d,e). Figure 3 shows the decay spectrum of Eq. (4)include first order QED radiative corrections (Fig. 2 a—c) and contributions from the
Radiative corrections modify the shape of the spectrum given by Eq. Thesespectrometer.
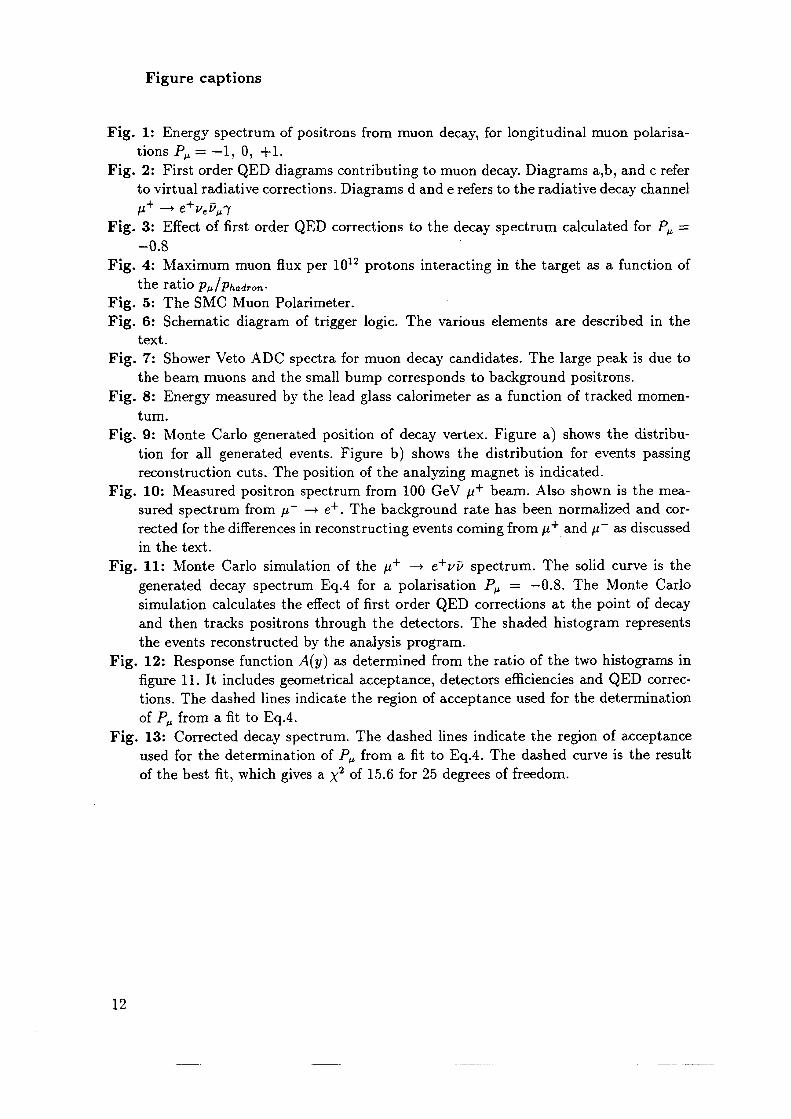
The central part of the spectrum is more easily accessible with a standard magneticthe decay positrons are difficult to separate from the high flux region of the muon beam.Pu. It is particularly sensitive to Pu at large y, but this region is hard to measure, because
Figure 1 shows the positron spectrum for different values of the muon polarisation
and electron momenta.
decays. The determination of the spectrum requires the measurement of both the muon
y is equivalent to the ratio of the momenta of the two particles. N is the number of muonThe variable y = Ec/Eu is the ratio of positron and muon energies. At our energies,
= N·3y+y·"» -3*+ itili? 2i"Cif l
to the polarisation of the muon beam. It is given by the expression [11, 12]Lorentz boost produces an energy distribution in the laboratory system which is sensitivedirection. The positron energy distribution is known as the Michel spectrum [10]. Theframe of a positive muon, the decay positron is preferentially emitted in the muon spinp+ —> e+uc17,,, provides a method to measure the muon beam polarisation. In the rest
The measurement of the energy spectrum of positrons from muon decay in flight,
1 ' (mu/mvr)22 Q i
EIJETV __ (rnfil/TTL7r)2where
M + (mt/m»)(1 — U)P = _u _. (TTL}-L/Tn’7*`)2(]‘ _ lu) “’
variables measured in the laboratory frame, this formula becomes in the relativistic limit:
pion rest frame [9]; p* and E"‘ are the muon momentum and energy. In terms of kinematicwhere Pu is defined in the muon rest frame and all other variables are expressed in the
<1>
at an angle 9* relative to the momentum of the hadron in the laboratory frame is:
The longitudinal polarisation of a positive muon emitted in the hadron rest frame
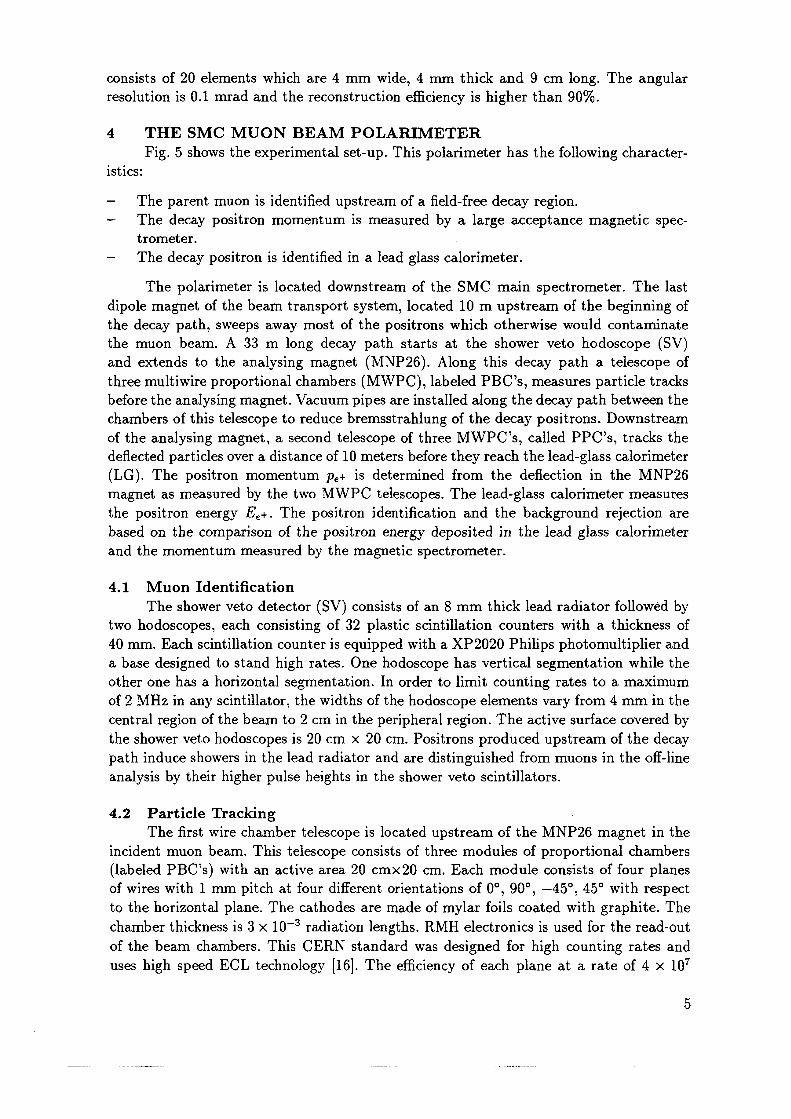
2 EXPERIMENTAL METHOD
phase space and transport system.uncertainty, the measured polarisation agreed with a Monte Carlo simulation of the beamThe overall error on the polarisation was estimated to range from 10 to 15%. Within thiscounter. A large error was due to a 10% uncertainty in the muon flux normalization.to analyse the momentum of the positrons which were identified in a single lead—glassa 300 m decay path. A bending magnet of the muon beam transport system was usedal. They measured the momentum spectrum of the decay positrons produced along
The polarisation of the CERN SPS muon beam was first determined by Bollini et
ters, and 2 >< 4 planes oriented at zh 45° with respect to the horizontal counters. Each plane OCR Outputare 4 planes with counters oriented in the horizontal direction, 4 planes of vertical counter data acquisition. These hodoscopes consist of 16 planes of scintillation counters. Therethe beam hodoscopes upstream of the SMC polarised target are read out by the polarime
To sample a beam phase space identical to the one seen by the SMC spectrometer,3.2 Beam Phase Space
momentum measurement is 3 >< 10`
plane consists of 64 scintillators 5 mm wide and 20 mm thick. The resolution of thelocated upstream of the bending magnets and two planes downstream. Each hodoscopemagnets of the beam line and four planes of fast scintillator hodoscopes. Two planes areupstream of the SMC experimental hall. It consists of the last set of vertical bending
The beam momentum station (BMS) measures the momentum of incident muons
3.1 -Muon Momentum Determination
the hadron absorber.
the materials present along the muon beam line, and radiative energy losses of muons into kaon background in the pion beam, the shape of magnetic fields, the description of allpion spectrum, which must be input to the Monte Carlo. Additional uncertainties are duedifficult to estimate. This is due largely to a lack of precise knowledge of the secondary[13, 14, 15]. The uncertainty in the beam polarisation obtained from this simulation ishadrons and decay muons, and their propagation through the beam transport system
A Monte Carlo program has been written to model in detail the phase space of parentwith a polarisation Pu 2 +0.6, has also been studied.
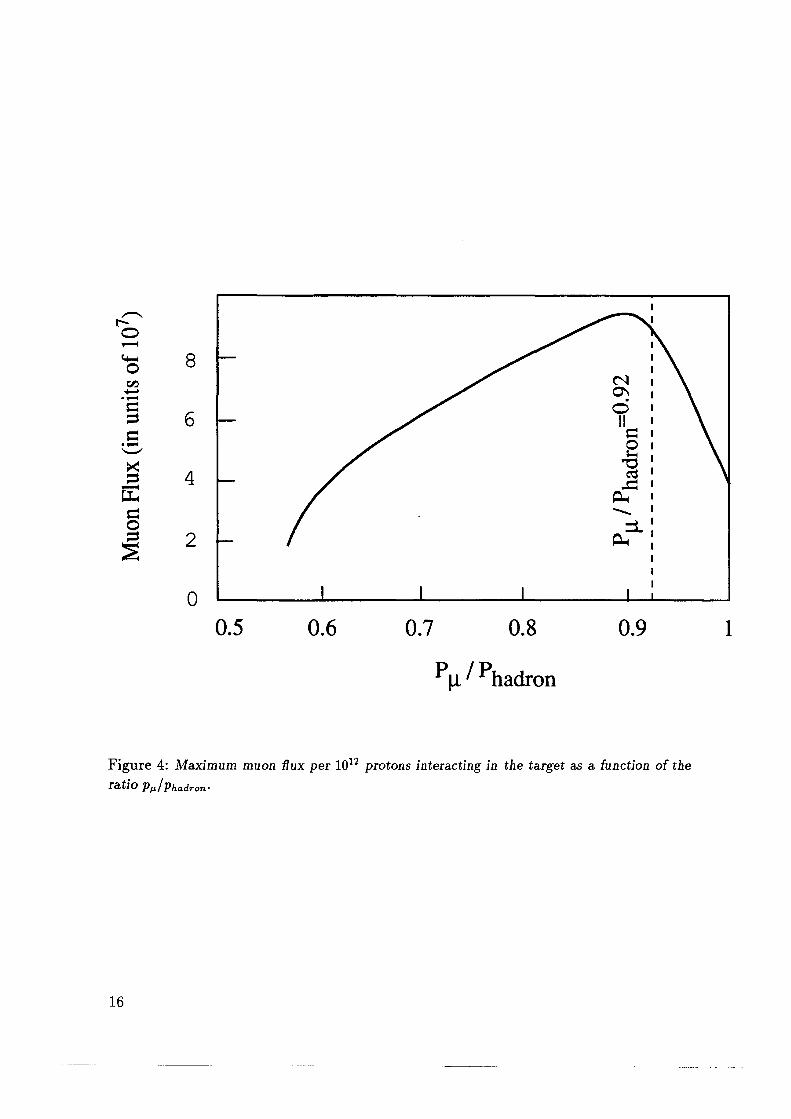
from the decay of 110 GeV vr"’. A ;r+ beam of 100 GeV from the decay of 165 GeV 1r+,polarisation measurements presented in this paper have been obtained with 100 GeV ;t+pion beams of 110 and 210 GeV respectively, both with a polarisation Pu 2 -0.8. Theexperiment has chosen to use forward if beams of 100 and 190 GeV obtained fromsignificantly higher intensity than those of backward muons (Fig. 4). Thus, the SMCA positive value of Pu is obtained for backward muons. Beams of forward muons have
A value of Pu 2 -1 is obtained by selecting decay muons emitted at 0* 2 0.the accepted phase space.measured longitudinal polarisation of the muon beam Pu is the mean value of P,,(0") overthe parent pions and the decay muons accepted by the beam transport system. The
The polarisation of a muon beam is determined by the momentum bands of bothspot size of about 2 cm FWHM at all critical locations in the experiment.muon beam pulse has a duration of 2.4 s with a period of 14.4 s. This beam has a circularexperiment operates at a typical intensity of 4 x 10⁷ if" / pulse at 100 and 200 GeV. Theiron collimators (scrapers). The maximum muon beam energy is 225 GeV. The SMCmomentum band is defined and the beam halo is eliminated using a system of magnetizedmuons. A 7.7 m long beryllium absorber removes the remaining hadrons. The muonand transported in a 500 m long decay channel; a fraction of about 10% decays intothan 3% for muon beams of 100 GeV energy. Pions and kaons are momentum selectedsecondary hadrons produced are mostly pions, with a kaon admixture that is smallerbombarding a Beryllium production target with the 450 GeV SPS proton beam. The
The CERN M2 muon beam used for the SMC experiment [13, 14] is produced by
uses high speed ECL technology [16]. The efficiency of each plane at a rate of 4 >< 107 OCR Outputof the beam chambers. This CERN standard was designed for high counting rates andchamber thickness is 3 >< 10"3 radiation lengths. RMH electronics is used for the read—outto the horizontal plane. The cathodes are made of mylar foils coated with graphite. The
of wires with 1 mm pitch at four different orientations of 0°, 90°, ——45°, 45° with respect(labeled PBC’s) with an active area 20 cm><20 cm. Each module consists of four planesincident muon beam. This telescope consists of three modules of proportional chambers
The first wire chamber telescope is located upstream of the MNP26 magnet in the4.2 Particle Tracking
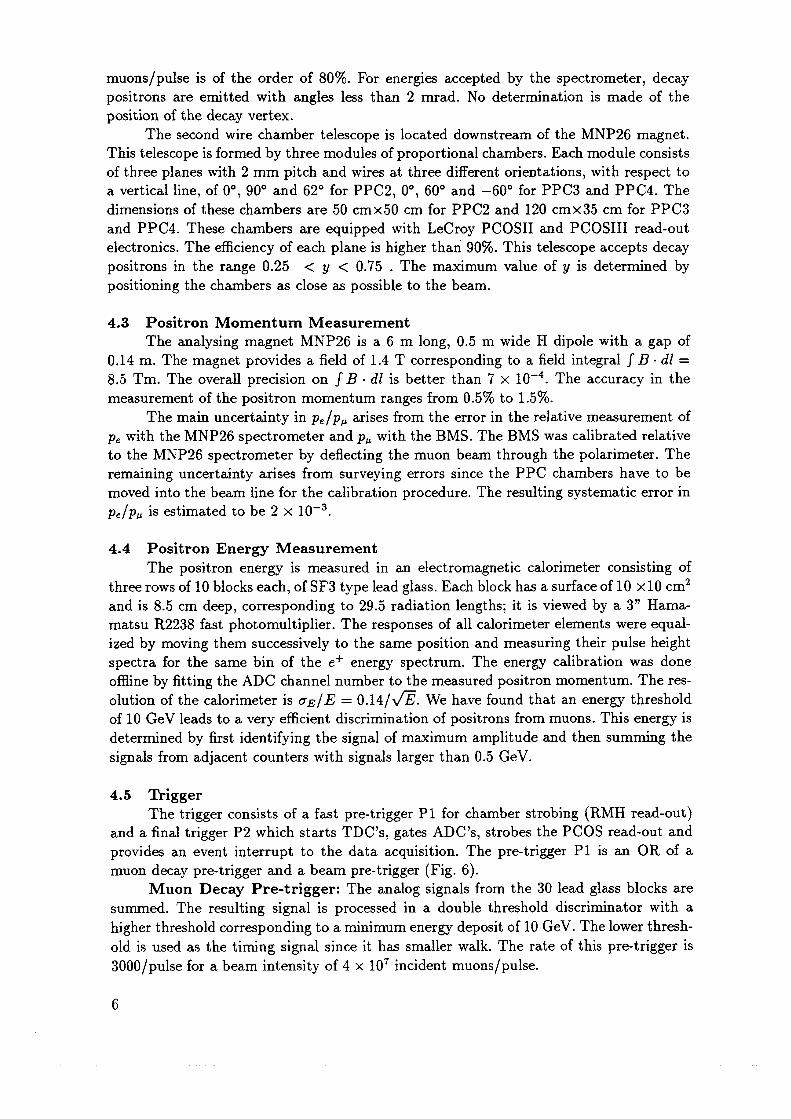
analysis by their higher pulse heights in the shower veto scintillators.path induce showers in the lead radiator and are distinguished from muons in the off-linethe shower veto hodoscopes is 20 cm >< 20 cm. Positrons produced upstream of the decaycentral region of the beam to 2 cm in the peripheral region. The active surface covered byof 2 MHz in any scintillator, the widths of the hodoscope elements vary from 4 mm in theother one has a horizontal segmentation. In order to limit counting rates to a maximuma base designed to stand high rates. One hodoscope has vertical segmentation while the40 mm. Each scintillation counter is equipped with a XP2020 Philips photomultiplier and
two hodoscopes, each consisting of 32 plastic scintillation counters with a thickness ofThe shower veto detector (SV) consists of an 8 mm thick lead radiator followed by
4.1 Muon Identification
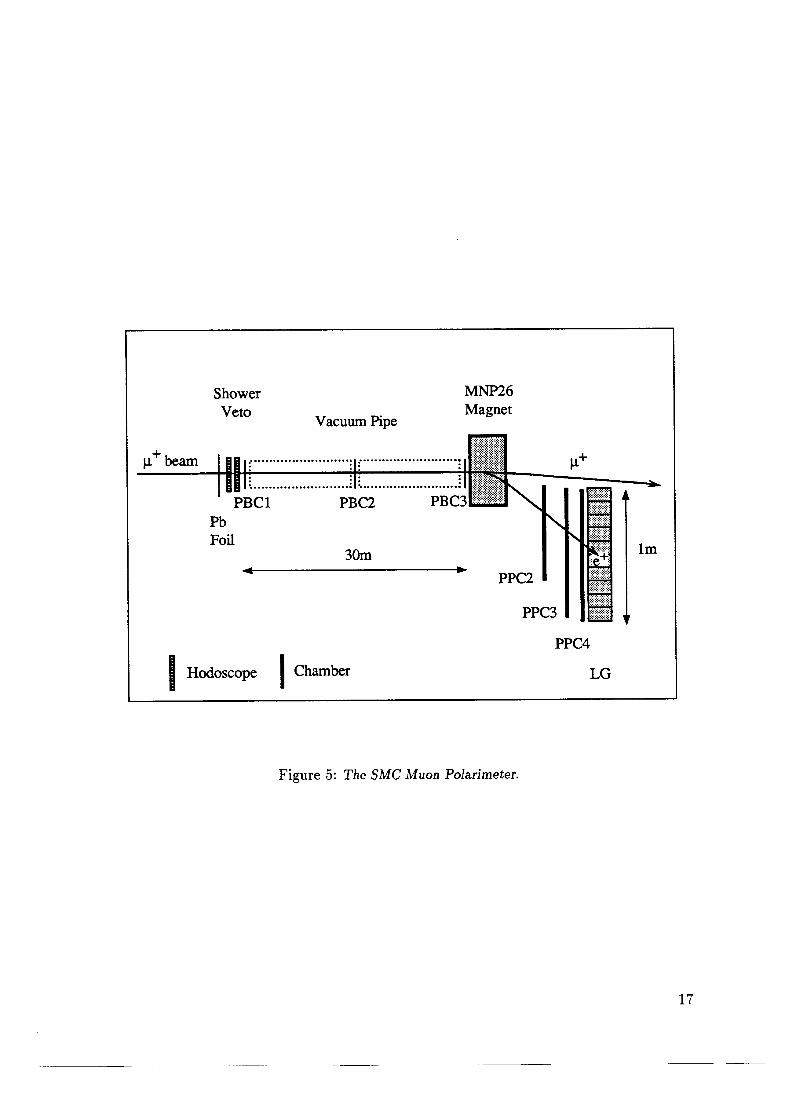
and the momentum measured by the magnetic spectrometer.based on the comparison of the positron energy deposited in the lead glass calorimeterthe positron energy Ed. The positron identification and the background rejection aremagnet as measured by the two MWPC telescopes. The lead·glass calorimeter measures(LG). The positron momentum p_.,+ is determined from the deflection in the MNP26deflected particles over a distance of 10 meters before they reach the lead-glass calorimeterof the analysing magnet, a second telescope of three MWPC’s, called PPC’s, tracks thechambers of this telescope to reduce bremsstrahlung of the decay positrons. Downstreambefore the analysing magnet. Vacuum pipes are installed along the decay path between thethree multiwire proportional chambers (MWPC), labeled PBC’s, measures particle tracksand extends to the analysing magnet (MNP26). Along this decay path a telescope ofthe muon beam. A 33 m long decay path starts at the shower veto hodoscope (SV)the decay path, sweeps away most of the positrons which otherwise would contaminatedipole magnet of the beam transport system, located 10 m upstream of the beginning of
The polarimeter is located downstream of the SMC main spectrometer. The last
The decay positron is identified in a lead glass calorimeter.
trometer.
The decay positron momentum is measured by a large acceptance magnetic specThe parent muon is identified upstream of a field-free decay region.
istics:
Fig. 5 shows the experimental set-up. This polarimeter has the following character
4 THE SMC MUON BEAM POLARIMETER
resolution is 0.1 mrad and the reconstruction efficiency is higher than 90%.consists of 20 elements which are 4 mm wide, 4 mm thick and 9 cm long. The angular
3000 / pulse for a beam intensity of 4 >< 107 incident muons/ pulse. OCR Outputold is used as the timing signal since it has smaller walk. The rate of this pre·trigger ishigher threshold corresponding to a minimum energy deposit of 10 GeV. The lower threshsummed. The resulting signal is processed in a double threshold discriminator with a
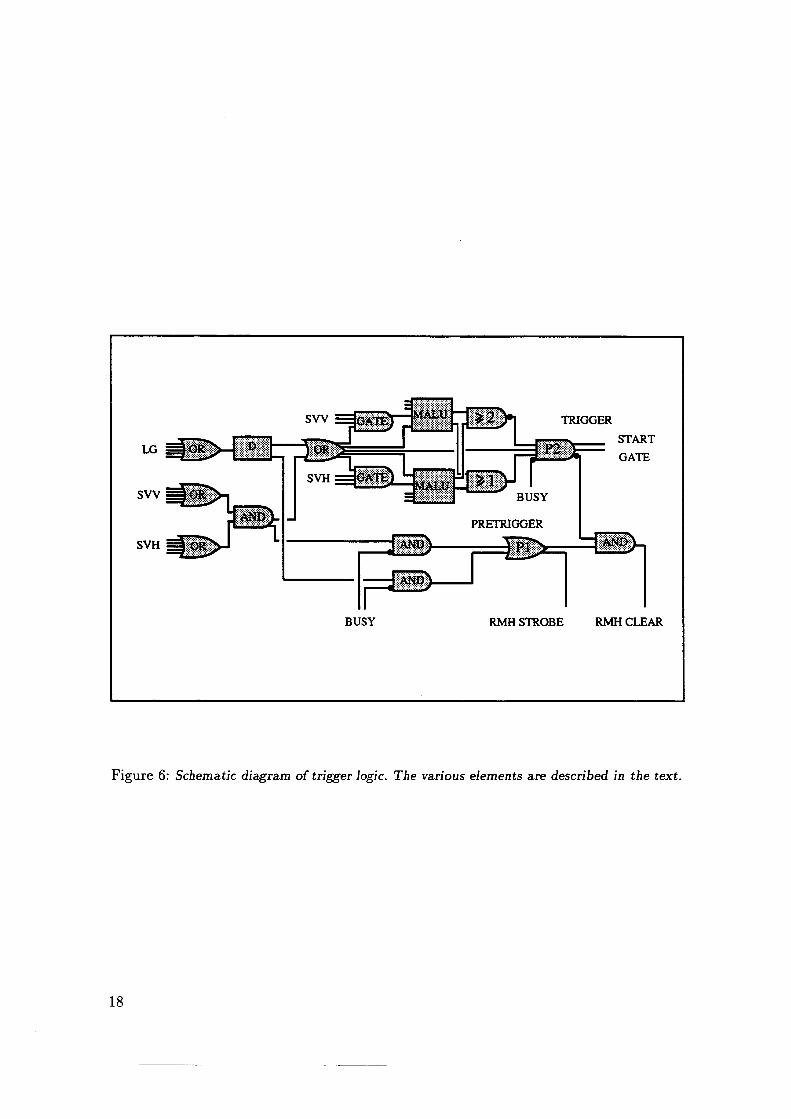
Muon Decay Pre-trigger: The analog signals from the 30 lead glass blocks aremuon decay pre·trigger and a beam pre-trigger (Fig. 6).provides an event interrupt to the data acquisition. The pre-trigger P1 is an OR of aand a final trigger P2 which starts TDC”s, gates ADC’s, strobes the PCOS read—out and
The trigger consists of a fast pre-trigger P1 for chamber strobing (RMH read-out)4.5 Trigger
signals from adjacent counters with signals larger than 0.5 GeV.determined by first identifying the signal of maximum amplitude and then summing theof 10 GeV leads to a very efficient discrimination of positrons from muons. This energy isolution of the calorimeter is UE / E = 0.14/ \/E. We have found that an energy thresholdoffline by fitting the ADC channel number to the measured positron momentum. The resspectra for the same bin of the e+ energy spectrum. The energy calibration was doneized by moving them successively to the same position and measuring their pulse heightmatsu R2238 fast photomultiplier. The responses of all calorimeter elements were equaland is 8.5 cm deep, corresponding to 29.5 radiation lengths; it is viewed by a 3” Hamathree rows of 10 blocks each, of SF3 type lead glass. Each block has a surface of 10 X10 cm2
The positron energy is measured in an electromagnetic calorimeter consisting of4.4 Positron Energy Measurement
pc/pu is estimated to be 2 >< 10"moved into the beam line for the calibration procedure. The resulting systematic error inremaining uncertainty arises from surveying errors since the PPC chambers have to beto the MNP26 spectrometer by deflecting the muon beam through the polarimeter. Thepe with the MNP26 spectrometer and pu with the BMS. The BMS was calibrated relative
The main uncertainty in pe/pu arises from the error in the relative measurement ofmeasurement of the positron momentum ranges from 0.5% to 1.5%.8.5 Tm. The overall precision on f B · dl is better than 7 >< 10"4. The accuracy in the0.14 m. The magnet provides a field of 1.4 T corresponding to a field integral f B · dl =
The analysing magnet MNP26 is a 6 m long, 0.5 m wide H dipole with a gap of
4.3 Positron Momentum Measurement
positioning the chambers as close as possible to the beam.positrons in the range 0.25 < y < 0.75 . The maximum value of y is determined byelectronics. The efliciency of each plane is higher than 90%. This telescope accepts decayand PPC4. These chambers are equipped with LeCroy PCOSH and PCOSIII read—out
dimensions of these chambers are 50 cm><50 cm for PPC2 and 120 cm><35 cm for PPC3
a vertical line, of 0°, 90° and 62° for PPC2, 0°, 60° and —60° for PPC3 and PPC4. Theof three planes with 2 mm pitch and wires at three different orientations, with respect toThis telescope is formed by three modules of proportional chambers. Each module consists
The second wire chamber telescope is located downstream of the MNP26 magnet.position of the decay vertex.positrons are emitted with angles less than 2 mrad. No determination is made of themuons/ pulse is of the order of 80%. For energies accepted by the spectrometer, decay
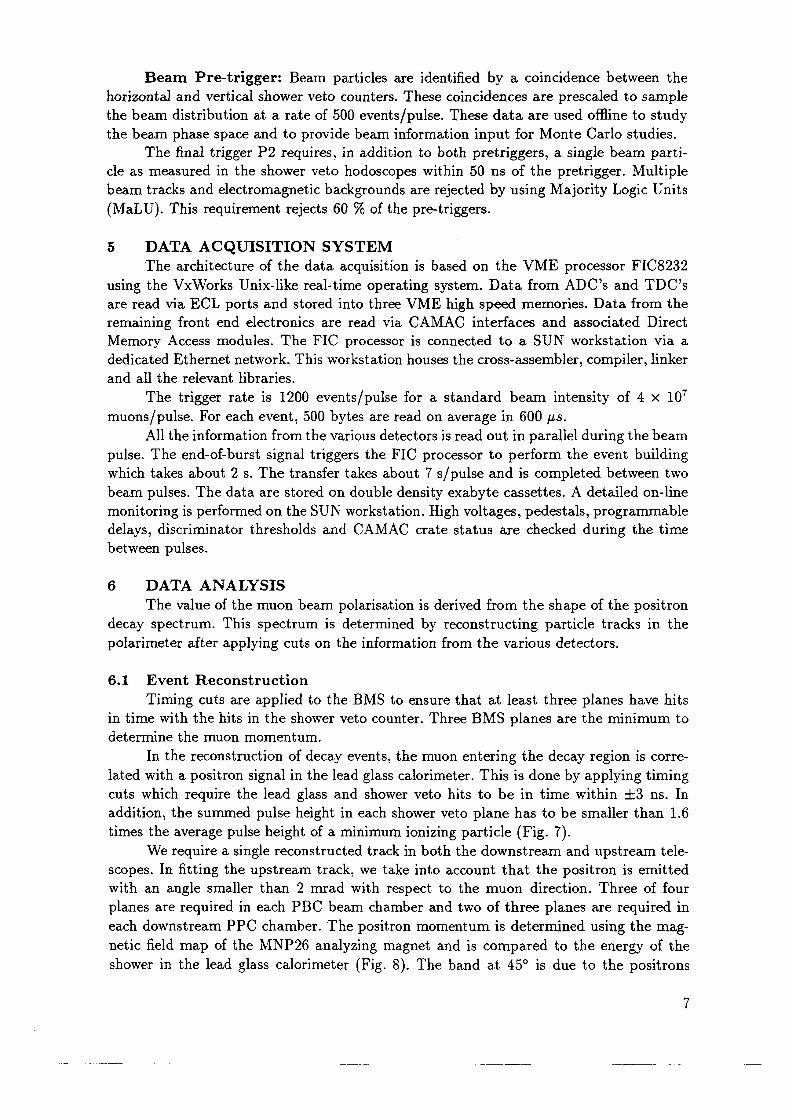
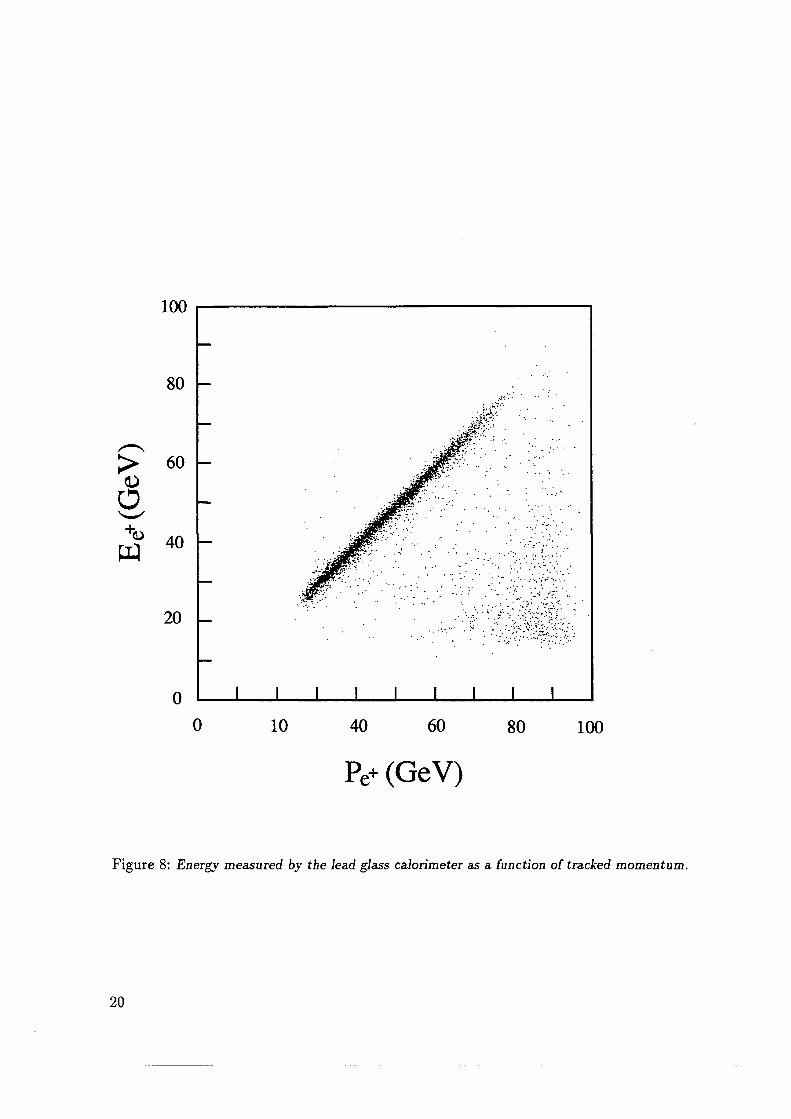
shower in the lead glass calorimeter (Fig. 8). The band at 45° is due to the positrons OCR Outputnetic field map of the MNP26 analyzing magnet and is compared to the energy of theeach downstream PPC chamber. The positron momentum is determined using the magplanes are required in each PBC beam chamber and two of three planes are required inwith an angle smaller than 2 mrad with respect to the muon direction. Three of fourscopes. In fitting the upstream track, we take into account that the positron is emitted
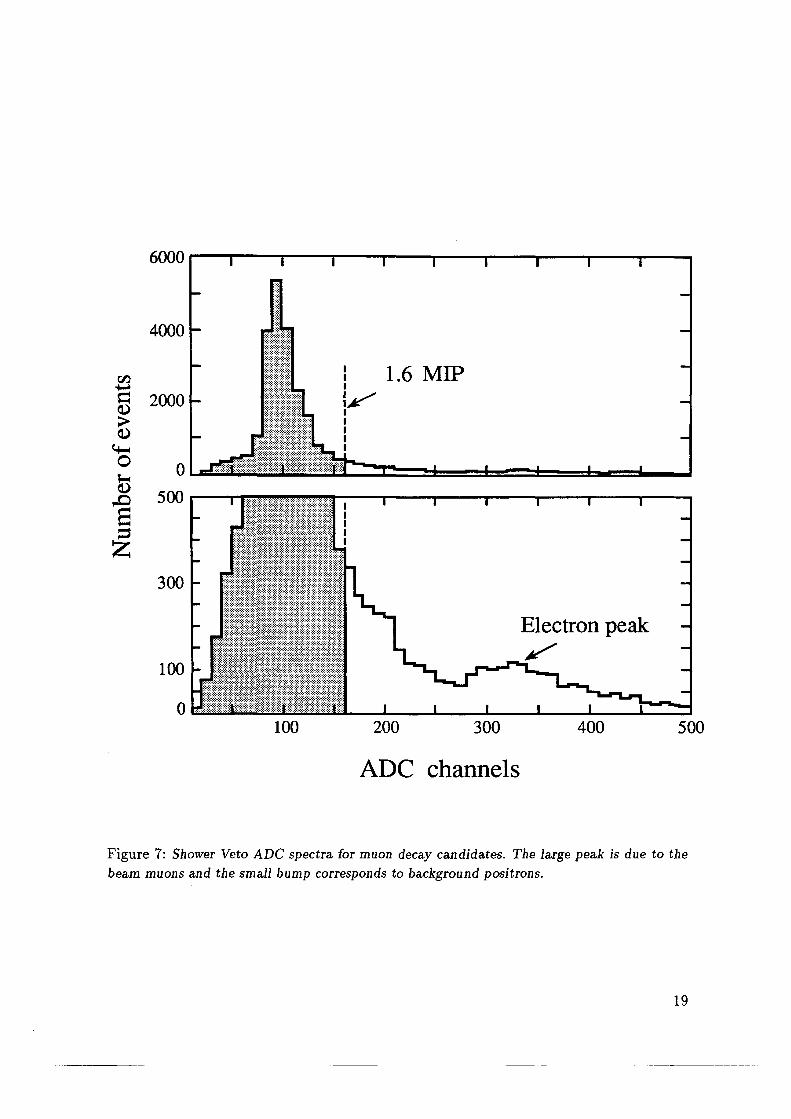
We require a single reconstructed track in both the downstream and upstream teletimes the average pulse height of a minimum ionizing particle (Fig. 7).addition, the summed pulse height in each shower veto plane has to be smaller than 1.6cuts which require the lead glass and shower veto hits to be in time within :b3 ns. Inlated with a positron signal in the lead glass calorimeter. This is done by applying timing
In the reconstruction of decay events, the muon entering the decay region is corre
determine the muon momentum.
in time with the hits in the shower veto counter. Three BMS planes are the minimum toTiming cuts are applied to the BMS to ensure that at least three planes have hits
6.1 Event Reconstruction
polarimeter after applying cuts on the information from the various detectors.decay spectrum. This spectrum is determined by reconstructing particle tracks in the
The value of the muon beam polarisation is derived from the shape of the positron
6 DATA ANALYSIS
between pulses.
delays, discriminator thresholds and CAMAC crate status are checked during the timemonitoring is performed on the SUN workstation. High voltages, pedestals, programmablebeam pulses. The data are stored on double density exabyte cassettes. A detailed on-line
which takes about 2 s. The transfer takes about 7 s/ pulse and is completed between twopulse. The end-of-burst signal triggers the FIC processor to perform the event building
All the information from the various detectors isread out in parallel during the beammuons / pulse. For each event, 500 bytes are read on average in 600 ps.
The trigger rate is 1200 events/ pulse for a standard beam intensity of 4 >< 107and all the relevant libraries.
dedicated Ethernet network. This workstation houses the cross-assembler, compiler, linker
Memory Access modules. The FIC processor is connected to a SUN workstation via aremaining front end electronics are read via CAMAC interfaces and associated Directare read via ECL ports and stored into three VME high speed memories. Data from theusing the VxWorks Unix-like real·time operating system. Data from ADC’s and TDC’s
The architecture of the data acquisition is based on the VME processor FIC82325 DATA ACQUISITION SYSTEM
(MaLU). This requirement rejects 60 % of the pre-triggers.beam tracks and electromagnetic backgrounds are rejected by using Majority Logic Unitscle as measured in the shower veto hodoscopes within 50 ns of the pretrigger. Multiple
The final trigger P2 requires, in addition to both pretriggers, a single beam partithe beam phase space and to provide beam information input for Monte Carlo studies.the beam distribution at a rate of 500 events/ pulse. These data are used offline to studyhorizontal and vertical shower veto counters. These coincidences are prescaled to sample
Beam Pre-trigger: Beam particles are identified by a coincidence between the
bers and scintillation counters is digitised. The output from this Monte Carlo program OCR Outputthe shape of the measured spectrum and are ignored. The hit information on all chamMonte Carlo simulation; inefficiencies in the upstream chambers have negligible effect onthe downstream chambers, which may distort the observed spectrum, are included in theusing the GEANT program [18] and the measured field map. The measured efficiencies ofwhen varying Pu in the range -0.7 to -0.9. The propagation of all particles is simulated0.8, but we have checked that the response function A(y) does not depend on this value
tions discussed in Section 1.2. As a starting value for the muon polarisation we have takento a decay spectrum for a given polarization which includes the first order radiative correcdownstream end of the magnet. Positrons are generated in the muon rest frame accordingmental beam triggers. All muons are forced to decay between the shower veto and the
generated with position, direction, and momentum obtained from reconstructed experiTo determine the overall response function A(y) of the apparatus, beam muons are
trum of the positrons for the simulated response function.polarisation is then determined using Eq. (4), after correcting the measured energy speculation that also includes first order QED corrections to muon decay [17]. The beam
The response function A of the spectrometer is computed from a Monte Carlo sim6.2 Response Function of the Apparatus and Evaluation of Pu
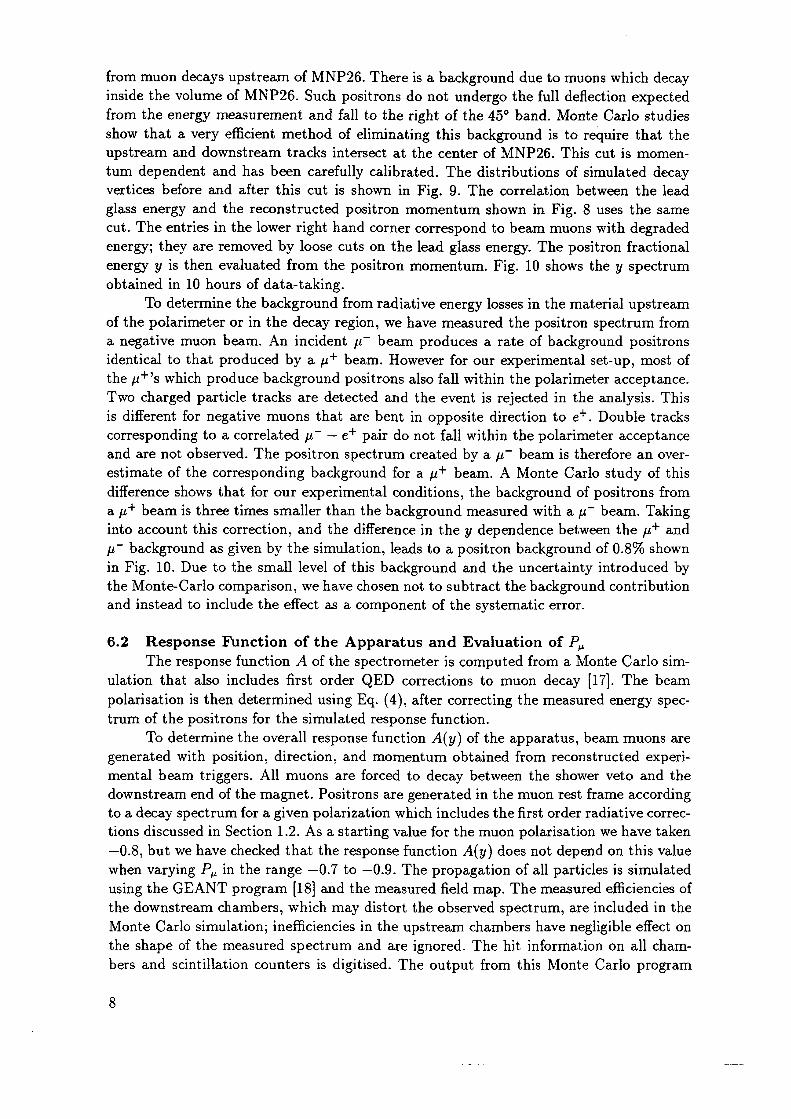
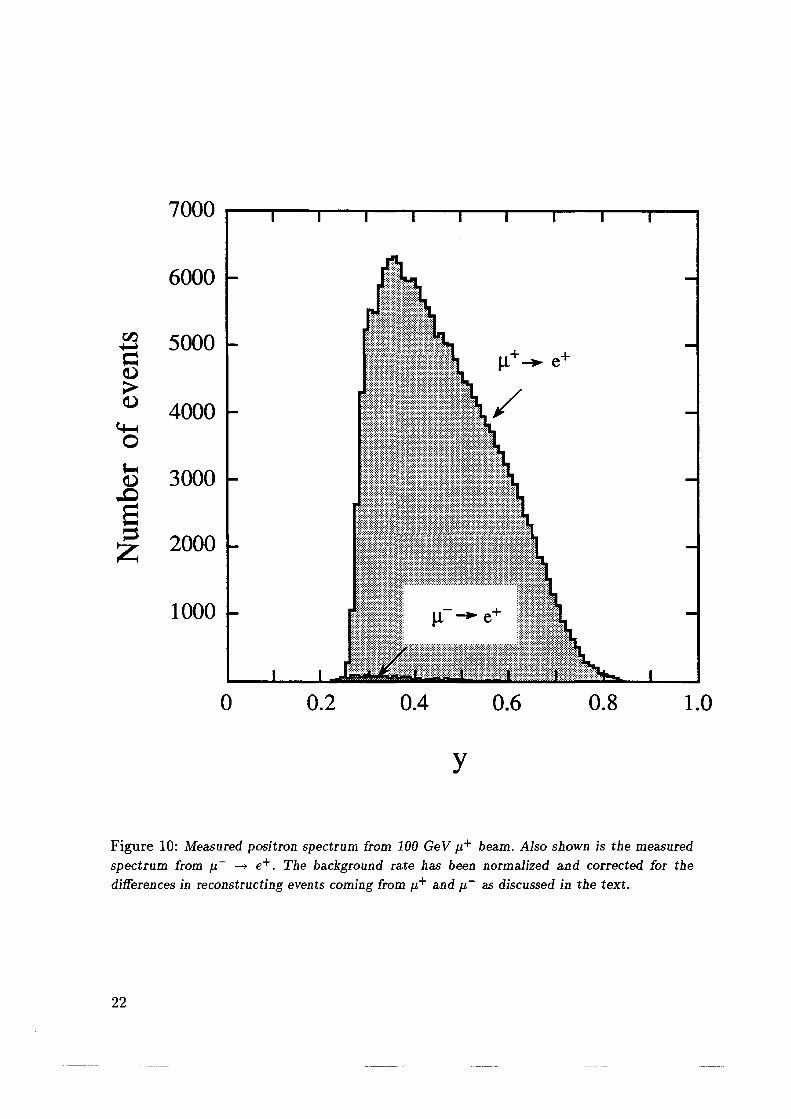
and instead to include the effect as a component of the systematic error.the Monte-Carlo comparison, we have chosen not to subtract the background contributionin Fig. 10. Due to the small level of this background and the uncertainty introduced byp' background as given by the simulation, leads to a positron background of 0.8% showninto account this correction, and the difference in the y dependence between the ;4+ anda ,u"' beam is three times smaller than the background measured with a ;F beam. Takingdifference shows that for our experimental conditions, the background of positrons fromestimate of the corresponding background for a ;i+ beam. A Monte Carlo study of thisand are not observed. The positron spectrum created by a ,u" beam is therefore an overcorresponding to a correlated if —— e"' pair do not fall within the polarimeter acceptanceis different for negative muons that are bent in opposite direction to e+. Double tracksTwo charged particle tracks are detected and the event is rejected in the analysis. Thisthe p+’s which produce background positrons also fall within the polarimeter acceptance.identical to that produced by a ,u+ beam. However for our experimental set-up, most ofa negative muon beam. An incident if beam produces a rate of background positronsof the polarimeter or in the decay region, we have measured the positron spectrum from
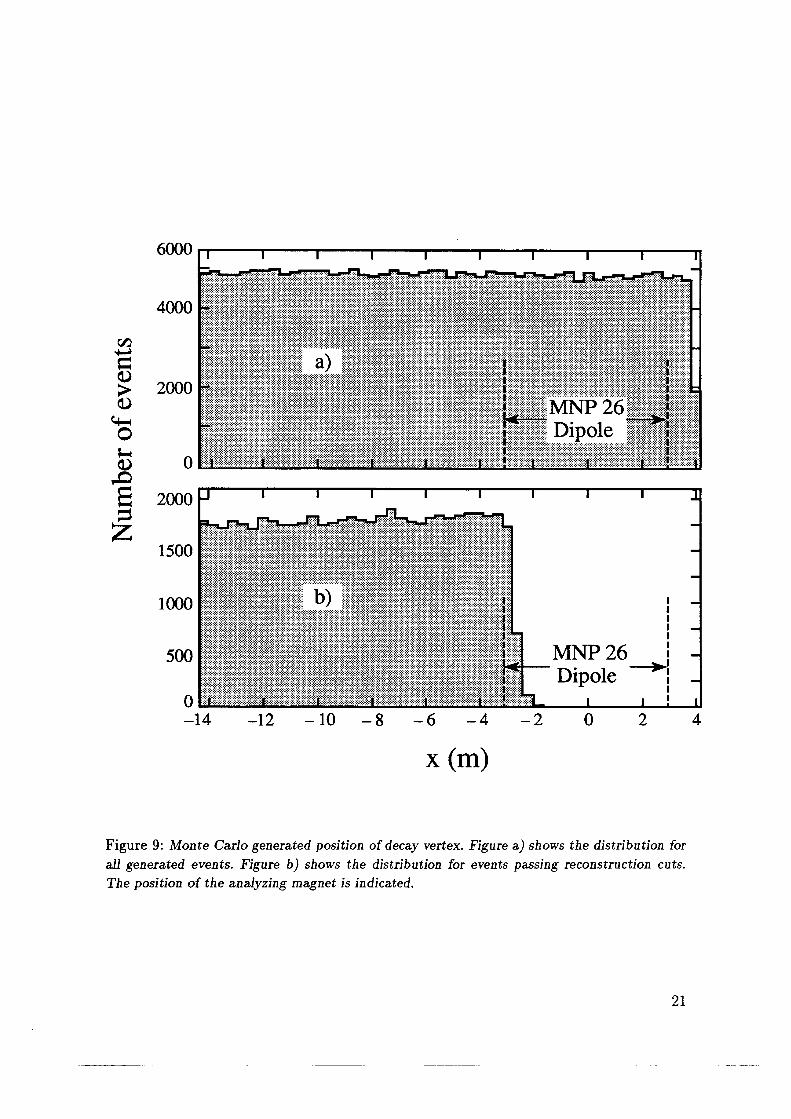
To determine the background from radiative energy losses in the material upstreamobtained in 10 hours of data-taking.energy y is then evaluated from the positron momentum. Fig. 10 shows the y spectrumenergy; they are removed by loose cuts on the lead glass energy. The positron fractionalcut. The entries in the lower right hand corner correspond to beam muons with degradedglass energy and the reconstructed positron momentum shown in Fig. 8 uses the samevertices before and after this cut is shown in Fig. 9. The correlation between the leadtum dependent and has been carefully calibrated. The distributions of simulated decayupstream and downstream tracks intersect at the center of MNP26. This cut is momenshow that a very efficient method of eliminating this background is to require that thefrom the energy measurement and fall to the right of the 45° band. Monte Carlo studiesinside the volume of MNP26. Such positrons do not undergo the full deflection expectedfrom muon decays upstream of MNP26. There is a background due to muons which decay
for the total systematic uncertainty we have made an additional measurement of the OCR Output
Monte Carlo simulation of the beam line. In order to check the accuracy of our estimate
conditions. The results are listed in Table 2. Also listed are the values calculated from a
We have measured the muon beam polarisation for three different experimental6.4 Experimental Results
o‘(P,,) = 0.022 (5)
contributions in quadrature, we find a total systematic error:
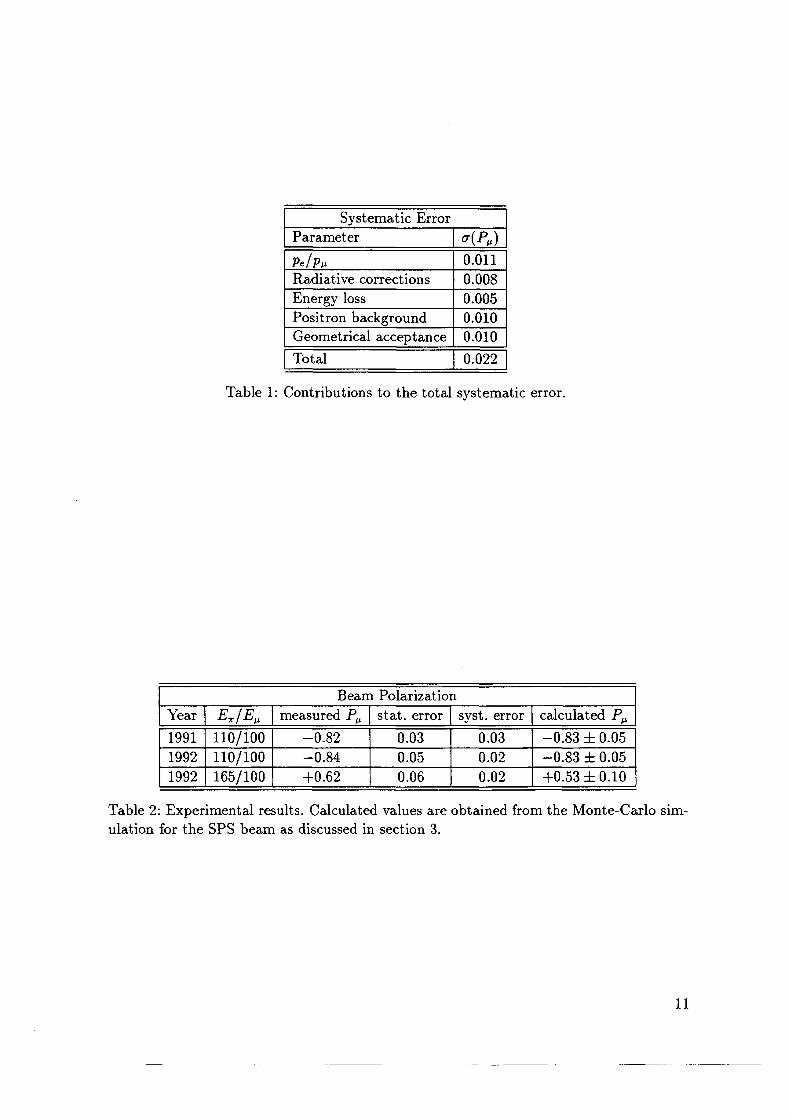
The contributions to the systematic error are summarised in Table 1. Adding thesea(Pu),mcpm,c€ = 0.01 is estimated for this calculation.fit to the spectrum to the region of A(y) 0.34 3 y $ 0.6. A systematic error ofrical acceptance which includes detector eHiciencies is minimised by restricting theThe contribution to the systematic error due to the Monte Carlo calculated geomet6(P,l)E,mgy LOSS = 0.005 to the systematic error.within 10% with our Monte Carlo simulation. Thus, we assume a contribution ofisation by 6P,. = -0.05. We estimate that we can account for these effects totermination of y = Ee/Eu. Ignoring this effect would shift the measured polarEnergy losses of the muons and decay positrons can lead to an error in the detion to the uncertainty due to radiative corrections to be 0(P,,);;,,,;_;·.,,,_ = 0.008.independent of the precise value of the beam polarisation. We estimate the contribupolarised beam. In the region of our measurement radiative corrections are essentiallytions in the case of a negatively polarised muon beam and Pu = +0.5 for a positivelyWe assumed a muon beam polarisation of P, = -0.8 to calculate radiative correc0(P,,)e+ = 0.01.ments and a Monte Carlo simulation and has an uncertainty of the same order6P), = +0.01. This correction is based on a combination of experimental measureThe positron background shown in Fig. 10 increases the measured polarisation byFor the 1991 run, this error turned out to be 0.03 due to a surveying ambiguity.section 2.1 leads to a systematic uncertainty in the polarisation of a(P,,),,c/pp = 0.01.The uncertainty in the determination of the pc/pu ratio of 2 >< 10'3 discussed in
acceptance by Monte Carlo simulation.tainties in pe/pu, positron background, energy loss, radiative corrections and geometrical
We have evaluated the systematic error on our measurement coming from the uncer
6.3 Systematic Uncertainties
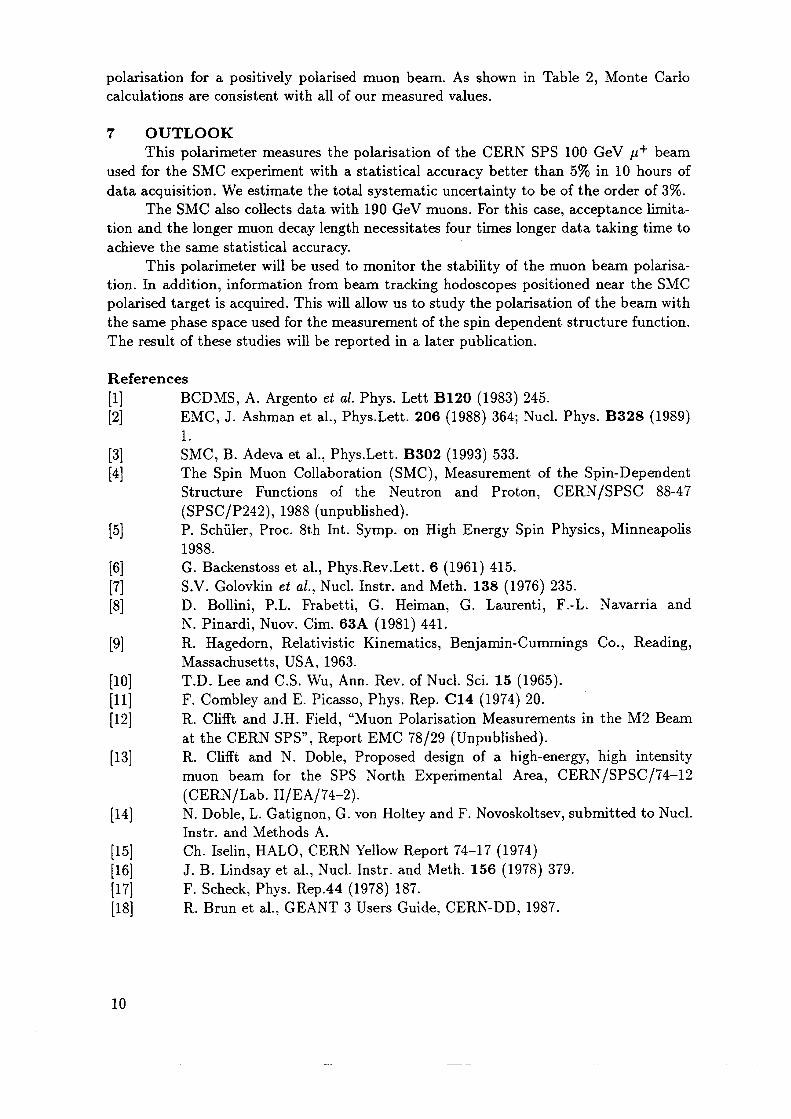
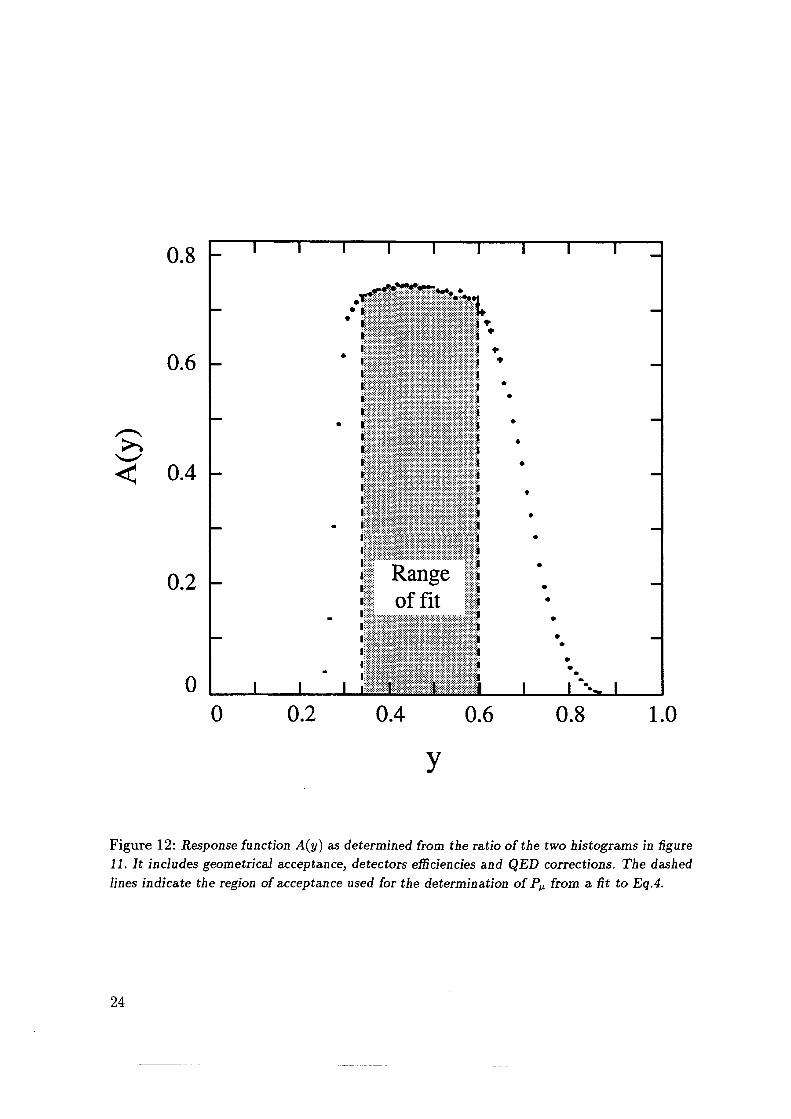
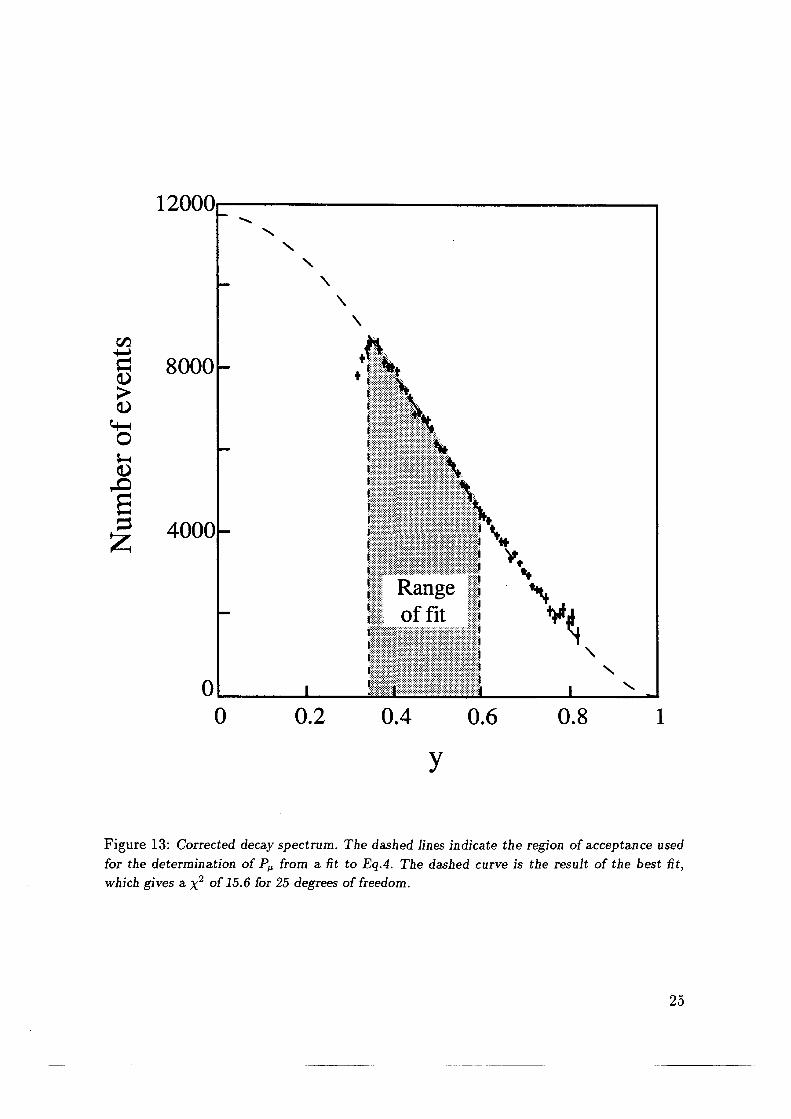
particles in this region fall outside of the downstream proportional chambers.The fall in the response function A(y) on the low-y side of Fig. 13 is due to the fact thatpolarisation of -0.820 zh 0.035 is obtained from the corrected spectrum shown in Fig. 13.the spectrometer which is well described by the Monte·Carlo simulation. (Fig. 12). Aresponse function A(y) 0.34 $ y f 0.6 for which positrons travel through a region ofin Fig. 13 allowing P and N to vary freely. The fit is restricted to the region of the
The muon polarisation Pu is determined by fitting Eq. (4) to the spectrum shownin Fig. 13.
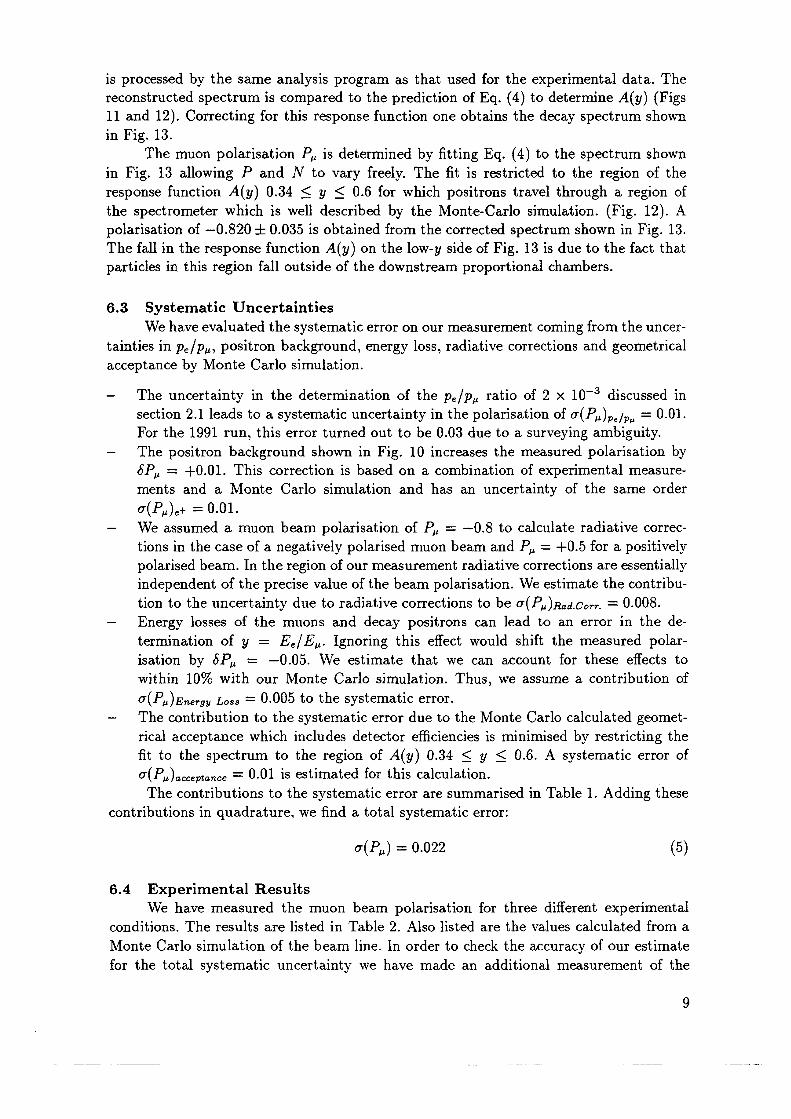
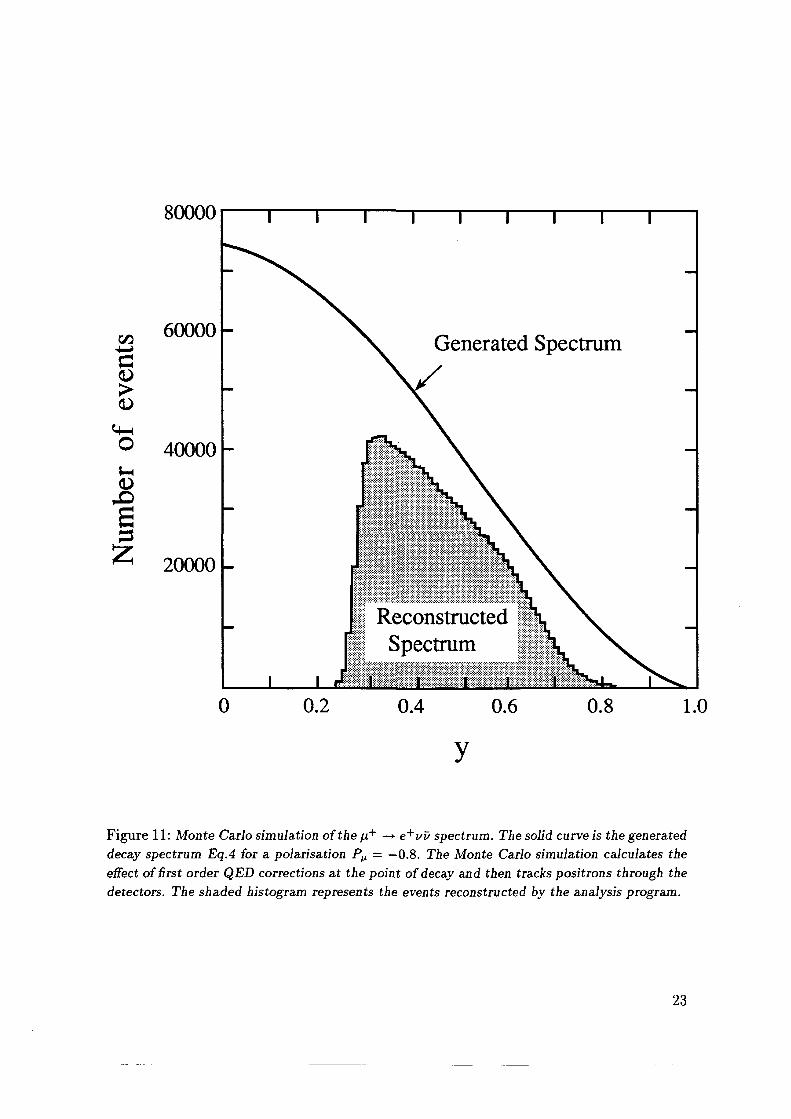
11 and 12). Correcting for this response function one obtains the decay spectrum shownreconstructed spectrum is compared to the prediction of Eq. (4) to determine A(y) (Figsis processed by the same analysis program as that used for the experimental data. The
11 OCR Output
ulation for the SPS beam as discussed in section 3.
Table 2: Experimental results. Calculated values are obtained from the Monte-Carlo sim
1992 I 165/100 I +0.62 I 0.06 I 0.02 I +0.53 i 0.101992 I 110/100 I -0.84 I 0.05 I 0.02 I -0.83 :1:0.051991 I 110/100 I -0.82 I 0.03 I 0.03 I -0.83:k 0.05Year I E.,/Eu I measured Pu I stat. error I syst. error I calculated Pu
Beam Polarization
Table 1: Contributions to the total systematic error.
0.022Total
Geometrical acceptance I 0.010Positron background I 0.010
0.005Energy loss
Radiative corrections I 0.008
0.011pe/pu
Parameter ·0(P,,)
OCR OutputSystematic Error
12
of the best fit, which gives a X2 of 15.6 for 25 degrees of freedom. OCR Outputused for the determination of Pu from a fit to Eq.4. The dashed curve is the result
Fig. 13: Corrected decay spectrum. The dashed lines indicate the region of acceptanceof Pll from a fit to Eq.4.tions. The dashed lines indicate the region of acceptance used for the determinationfigure 11. It includes geometrical acceptance, detectors efficiencies and QED correc
Fig. 12: Response function A(y) as determined from the ratio of the two histograms inthe events reconstructed by the analysis program.
and then tracks positrons through the detectors. The shaded histogram representssimulation calculates the effect of first order QED corrections at the point of decaygenerated decay spectrum Eq.4 for a polarisation Pu = -0.8. The Monte Carlo
Fig. 11: Monte Carlo simulation of the p+ —> e"`uz7 spectrum. The solid curve is the
in the text.
rected for the differences in reconstructing events coming from p+ and if as discussedsured spectrum from p' —> c+. The background rate has been normalized and cor
Fig. 10: Measured positron spectrum from 100 GeV ;r+ beam. Also shown is the meareconstruction cuts. The position of the analyzing magnet is indicated.tion for all generated events. Figure b) shows the distribution for events passing
Fig. 9: Monte Carlo generated position of decay vertex. Figure a) shows the distribu
tum.
Fig. 8: Energy measured by the lead glass calorimeter as a function of tracked momenthe beam muons and the small bump corresponds to background positrons.
Fig. 7: Shower Veto ADC spectra for muon decay candidates. The large peak is due to
text.
Fig. 6: Schematic diagram of trigger logic. The various elements are described in theFig. 5: The SMC Muon Polarimeter.
the ratio Pp/Pnad-WFig. 4: Maximum muon flux per 1012 protons interacting in the target as a function of
-0.8
Fig. 3: Effect of first order QED corrections to the decay spectrum calculated for Pu ::,44—-> 61/,,17u’y+ +
to virtual radiative corrections. Diagrams d and e refers to the radiative decay channelFig. 2: First order QED diagrams contributing to muon decay. Diagrams a,b, and c refer
tions Pu == -1, 0, +1.Fig. 1: Energy spectrum of positrons from muon decay, for longitudinal muon polarisa
Figure captions
13 OCR Output
Pu = -1, 0, +1.
Figure 1: Energy spectrum of positrons from muon decay, for longitudinal muon polarisations
1.00.2 0.4 0.6 0.8
0.5
L1 U ].•0
P1 1: +11.5
Pu = O
14 OCR Output
;i-» eucz7u·y+ `*'
fer to virtual radiative corrections. Diagrams d and e refers to the radiative decay channel
Figure 2: First order QED diagrams contributing to muon decay. Diagrams a,b, and c re
(ci) (c)
(b) Cc)(a)
15 OCR Output
Figure 3: Effect of first order QED corrections to the decay spectrum calculated for Pu : -0.8
1.00.6 0.80.2 0.4
0.5
i>~» ,.¤ 1.0
1.5 Without ····
e- ---- With OED corrections
16 OCR Output
ratio pu/phad·ro·n.·
Figure 4: Maximum muon Hux per 1012 protons interacting in the target as a, function ofthe
p hadronP/ P
0.6 0.80.7 0.90.5
5 6
19 OCR Output
beam muons and the small bump corresponds to background positrons.
Figure 7: Shower Veto ADC spectra for muon decay candidates. The large peak is due to the
ADC channels
100 200 400300 500
·:·¤:?:=:¥:¤:€:¢:¢:¢
Electron peak
300
500
2000
{ 1.6 MIP
4000
OCR OutputOCR Output6000
20 OCR Output
Figure 8: Energy measured by the lead glass calorimeter as a function of tracked momentum.
80 10010 40 60
20 S5*:-·¥·.·¤`&; Y‘ .
. {EY-? : "
.- i.._. i · I60
I ···
. .80
100
22 OCR Output
differences in reconstructing events coming from p`*` and rf as discussed in the text.spectrum from u` —> el'. The background rate has been normalized and corrected for theFigure 10: Measured positron spectrum from 100 GeV p+ beam. Also shown is the measured
(L2 0.6 1.00.80.4
1000
2000 é=E=E$=E=Ei=E=E=E$=E=E=E=E=E=E=Ei=E=E=E=E=E=E¤E=E=E¤E=E=E=E=E5¤E=E=E=%5¤E=E=E=E 2-2-2-2·Z·Z·2·2·Z·2·Z·I·Z·Z·Z·Z·2·Z·Z·Z·Z·2·Z·Z·Z·Z·Z-Z·Z-Z·i-2·i·C·1·Z·2·Z·Z·£·Z·Z·Z·
3000
4000
+—> C+5000
6000
OCR Output7000
23 OCR Output
detectors. The shaded histogram represents the events reconstructed by the analysis program.
effect of first order QED corrections at the point of decay and then tracks positrons through the
decay spectrum Eq.4 for a polarisation Pp ·-= -0.8. The Monte Carlo simulation calculates the
Figure 11: Monte Carlo simulation ofthe ,u+ —> e+v17 spectrum. The solid curve is the generated
0.60.4 0.8 1.00.2
Spectrum
Reconstructed
20000
40000
Generated Spectrum60000
80000
24 OCR Output
lines indicate the region of acceptance used for the determination of Pu from a. fit to Eq.4.
11. It includes geometrical acceptance, detectors eiiiciencies and QED corrections. The dashed
Figure 12: Response function A(y) as determined from the ratio of the two histograms in figure
0.8 1.00.2 0.4 0.6
of tit Iiii;EI;Z;Z;C;1;I;2;Z;Z;I-Z·Z315252gi5Z;2;1·Z·2:2-I·I·271:272;I125Z;Z1Z52;Z;ZyZ·§§l§§’Ran B
•
•
.
.
<[_' 0.4•
0.6+
25 OCR Output
which gives a X2 of 15.6 for 25 degrees of freedom.for the determination of Pu from a fit to Eq.4. The dashed curve is the result of the best fit,
Figure 13: Corrected decay spectrum. The dashed lines indicate the region of acceptance used
0.2 0.4 0.6 0.8
. of f 1tRange T ••i,
'1
.``··
1 2000

Copyright © 2022 FDOKUMEN