A simple non invasive computerized method for the assessment of bone repair within osteoconductive...
10
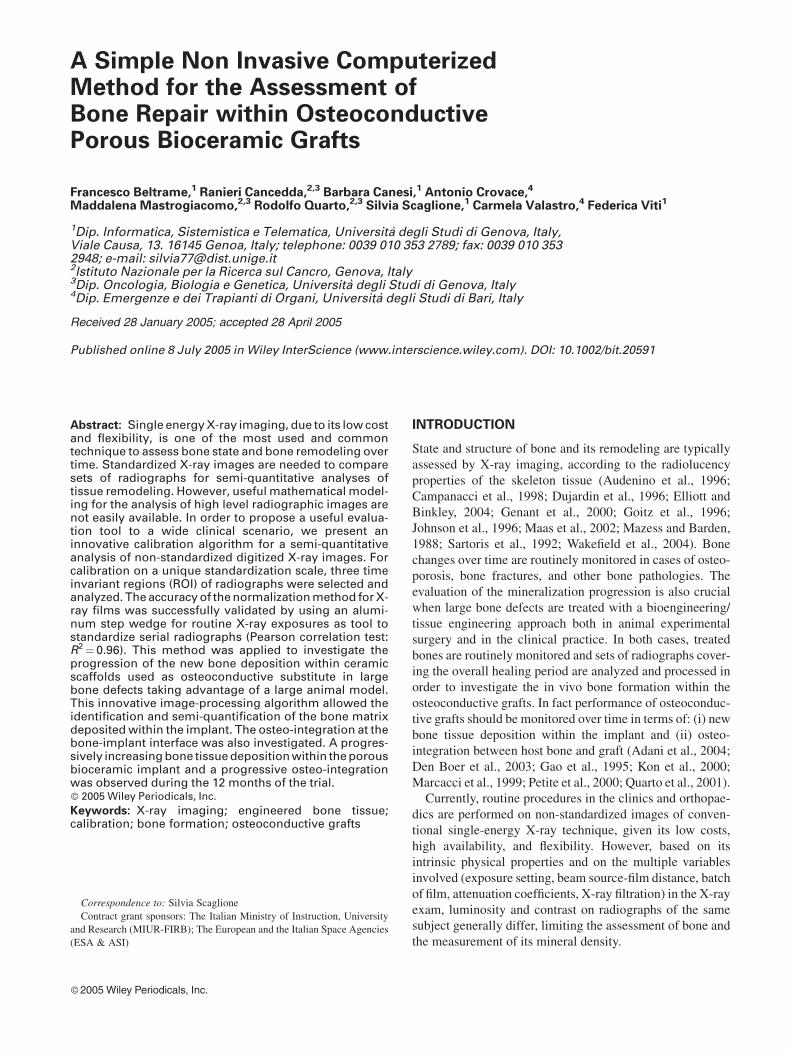
A Simple Non Invasive Computerized Method for the Assessment of Bone Repair within Osteoconductive Porous Bioceramic Grafts Francesco Beltrame, 1 Ranieri Cancedda, 2,3 Barbara Canesi, 1 Antonio Crovace, 4 Maddalena Mastrogiacomo, 2,3 Rodolfo Quarto, 2,3 Silvia Scaglione, 1 Carmela Valastro, 4 Federica Viti 1 1 Dip. Informatica, Sistemistica e Telematica, Universita ` degli Studi di Genova, Italy, Viale Causa, 13. 16145 Genoa, Italy; telephone: 0039 010 353 2789; fax: 0039 010 353 2948; e-mail: [email protected] 2 Istituto Nazionale per la Ricerca sul Cancro, Genova, Italy 3 Dip. Oncologia, Biologia e Genetica, Universita ` degli Studi di Genova, Italy 4 Dip. Emergenze e dei Trapianti di Organi, Universita ` degli Studi di Bari, Italy Received 28 January 2005; accepted 28 April 2005 Published online 8 July 2005 in Wiley InterScience (www.interscience.wiley.com). DOI: 10.1002/bit.20591 Abstract: Single energy X-ray imaging, due to its low cost and flexibility, is one of the most used and common technique to assess bone state and bone remodeling over time. Standardized X-ray images are needed to compare sets of radiographs for semi-quantitative analyses of tissue remodeling. However, useful mathematical model- ing for the analysis of high level radiographic images are not easily available. In order to propose a useful evalua- tion tool to a wide clinical scenario, we present an innovative calibration algorithm for a semi-quantitative analysis of non-standardized digitized X-ray images. For calibration on a unique standardization scale, three time invariant regions (ROI) of radiographs were selected and analyzed. The accuracy of the normalization method for X- ray films was successfully validated by using an alumi- num step wedge for routine X-ray exposures as tool to standardize serial radiographs (Pearson correlation test: R 2 ¼ 0.96). This method was applied to investigate the progression of the new bone deposition within ceramic scaffolds used as osteoconductive substitute in large bone defects taking advantage of a large animal model. This innovative image-processing algorithm allowed the identification and semi-quantification of the bone matrix deposited within the implant. The osteo-integration at the bone-implant interface was also investigated. A progres- sively increasing bone tissue deposition within the porous bioceramic implant and a progressive osteo-integration was observed during the 12 months of the trial. ß 2005 Wiley Periodicals, Inc. Keywords: X-ray imaging; engineered bone tissue; calibration; bone formation; osteoconductive grafts INTRODUCTION State and structure of bone and its remodeling are typically assessed by X-ray imaging, according to the radiolucency properties of the skeleton tissue (Audenino et al., 1996; Campanacci et al., 1998; Dujardin et al., 1996; Elliott and Binkley, 2004; Genant et al., 2000; Goitz et al., 1996; Johnson et al., 1996; Maas et al., 2002; Mazess and Barden, 1988; Sartoris et al., 1992; Wakefield et al., 2004). Bone changes over time are routinely monitored in cases of osteo- porosis, bone fractures, and other bone pathologies. The evaluation of the mineralization progression is also crucial when large bone defects are treated with a bioengineering/ tissue engineering approach both in animal experimental surgery and in the clinical practice. In both cases, treated bones are routinely monitored and sets of radiographs cover- ing the overall healing period are analyzed and processed in order to investigate the in vivo bone formation within the osteoconductive grafts. In fact performance of osteoconduc- tive grafts should be monitored over time in terms of: (i) new bone tissue deposition within the implant and (ii) osteo- integration between host bone and graft (Adani et al., 2004; Den Boer et al., 2003; Gao et al., 1995; Kon et al., 2000; Marcacci et al., 1999; Petite et al., 2000; Quarto et al., 2001). Currently, routine procedures in the clinics and orthopae- dics are performed on non-standardized images of conven- tional single-energy X-ray technique, given its low costs, high availability, and flexibility. However, based on its intrinsic physical properties and on the multiple variables involved (exposure setting, beam source-film distance, batch of film, attenuation coefficients, X-ray filtration) in the X-ray exam, luminosity and contrast on radiographs of the same subject generally differ, limiting the assessment of bone and the measurement of its mineral density. ß 2005 Wiley Periodicals, Inc. Correspondence to: Silvia Scaglione Contract grant sponsors: The Italian Ministry of Instruction, University and Research (MIUR-FIRB); The European and the Italian Space Agencies (ESA & ASI)
-
Upload
independent -
Category
Documents
-
view
4 -
download
0
Transcript of A simple non invasive computerized method for the assessment of bone repair within osteoconductive...
A Simple Non Invasive ComputerizedMethod for the Assessment ofBone Repair within OsteoconductivePorous Bioceramic Grafts
Francesco Beltrame,1 Ranieri Cancedda,2,3 Barbara Canesi,1 Antonio Crovace,4
Maddalena Mastrogiacomo,2,3 Rodolfo Quarto,2,3 Silvia Scaglione,1 Carmela Valastro,4 Federica Viti1
1Dip. Informatica, Sistemistica e Telematica, Universita degli Studi di Genova, Italy,Viale Causa, 13. 16145 Genoa, Italy; telephone: 0039 010 353 2789; fax: 0039 010 3532948; e-mail: [email protected] Nazionale per la Ricerca sul Cancro, Genova, Italy3Dip. Oncologia, Biologia e Genetica, Universita degli Studi di Genova, Italy4Dip. Emergenze e dei Trapianti di Organi, Universita degli Studi di Bari, Italy
Received 28 January 2005; accepted 28 April 2005
Published online 8 July 2005 in Wiley InterScience (www.interscience.wiley.com). DOI: 10.1002/bit.20591
Abstract: Single energyX-ray imaging, due to its lowcostand flexibility, is one of the most used and commontechnique to assess bone state and bone remodeling overtime. Standardized X-ray images are needed to comparesets of radiographs for semi-quantitative analyses oftissue remodeling. However, usefulmathematical model-ing for the analysis of high level radiographic images arenot easily available. In order to propose a useful evalua-tion tool to a wide clinical scenario, we present aninnovative calibration algorithm for a semi-quantitativeanalysis of non-standardized digitized X-ray images. Forcalibration on a unique standardization scale, three timeinvariant regions (ROI) of radiographs were selected andanalyzed. Theaccuracyof thenormalizationmethod forX-ray films was successfully validated by using an alumi-num step wedge for routine X-ray exposures as tool tostandardize serial radiographs (Pearson correlation test:R2¼ 0.96). This method was applied to investigate theprogression of the new bone deposition within ceramicscaffolds used as osteoconductive substitute in largebone defects taking advantage of a large animal model.This innovative image-processing algorithm allowed theidentification and semi-quantification of the bone matrixdepositedwithin the implant. The osteo-integration at thebone-implant interface was also investigated. A progres-sively increasingbone tissuedepositionwithin theporousbioceramic implant and a progressive osteo-integrationwas observed during the 12 months of the trial.� 2005 Wiley Periodicals, Inc.
Keywords: X-ray imaging; engineered bone tissue;calibration; bone formation; osteoconductive grafts
INTRODUCTION
State and structure of bone and its remodeling are typically
assessed by X-ray imaging, according to the radiolucency
properties of the skeleton tissue (Audenino et al., 1996;
Campanacci et al., 1998; Dujardin et al., 1996; Elliott and
Binkley, 2004; Genant et al., 2000; Goitz et al., 1996;
Johnson et al., 1996; Maas et al., 2002; Mazess and Barden,
1988; Sartoris et al., 1992; Wakefield et al., 2004). Bone
changes over time are routinely monitored in cases of osteo-
porosis, bone fractures, and other bone pathologies. The
evaluation of the mineralization progression is also crucial
when large bone defects are treated with a bioengineering/
tissue engineering approach both in animal experimental
surgery and in the clinical practice. In both cases, treated
bones are routinely monitored and sets of radiographs cover-
ing the overall healing period are analyzed and processed in
order to investigate the in vivo bone formation within the
osteoconductive grafts. In fact performance of osteoconduc-
tive grafts should be monitored over time in terms of: (i) new
bone tissue deposition within the implant and (ii) osteo-
integration between host bone and graft (Adani et al., 2004;
Den Boer et al., 2003; Gao et al., 1995; Kon et al., 2000;
Marcacci et al., 1999; Petite et al., 2000; Quarto et al., 2001).
Currently, routine procedures in the clinics and orthopae-
dics are performed on non-standardized images of conven-
tional single-energy X-ray technique, given its low costs,
high availability, and flexibility. However, based on its
intrinsic physical properties and on the multiple variables
involved (exposure setting, beam source-film distance, batch
of film, attenuation coefficients, X-ray filtration) in the X-ray
exam, luminosity and contrast on radiographs of the same
subject generally differ, limiting the assessment of bone and
the measurement of its mineral density.
�2005 Wiley Periodicals, Inc.
Correspondence to: Silvia Scaglione
Contract grant sponsors: The Italian Ministry of Instruction, University
and Research (MIUR-FIRB); The European and the Italian Space Agencies
(ESA & ASI)
Innovative diagnostic imaging techniques, such as dual
energy X-ray absorption (DXA), quantitative ultrasounds
(US), micro-computerized tomography (CT), have been
proposed as useful quantitative approaches for the bone
densitometry (Blake et al., 1997; Elliott and Binkley, 2004;
Genant et al., 2000; Guglielmi et al., 1995; Ibanez, 2003;
Maas et al., 2002; Mazess and Barden, 1988; Sartoris and
Resnick, 1990; Seeman and Martin, 1989; Simonini et al.,
2005; Wakefield et al., 2004).
The use of an X-ray wedge calibration tool has also been
proposed by some researchers groups (Bolander et al., 1990;
De Josselin de Jong et al., 1989; Dornier et al., 2004;
Escarpinati et al., 2002; Haidekker et al., 2004; Martin et al.,
1990; Pearson et al., 2002; Saiki et al., 1993; Symmons,
2004) as a suitable tool to normalize radiographs. Never-
theless up to now in the orthopaedic scenario the assessment
of bone tissue is still monitored by using the single energy
X-ray exam, where no additional device is incorporated
during the routine protocol.
In this paper, we report an innovative calibration algorithm
for the semi-quantitative analysis of non-standardized X-ray
images as an evaluation tool of bone regeneration within
porous biomaterials useful to a wider experimental and
clinical scenario.
This tool has been validated and used on osteoconductive
grafts implanted to replace large bone defects of sheep
within an experimental study. The method was applied to
quantify the progression of the new bone matrix deposition
within the implant during 12 months of observation. The
osteo-integration at the bone-implant interface was also
investigated. Information related to the integrity and perfor-
mance of the implant and to the healing progression were
derived.
MATERIALS AND METHODS
Large Animal Model for Bone Repair
Six-year-old ewes were involved in this study upon proper
approval of competent ethical committees and legal autho-
rities. Surgical procedures were performed essentially as
described in Marcacci et al. (1999) except that an external
fixator type II was used. A large bone segment (4.5 cm of
length) was surgically resected from the central part of the
left tibia of sheep and replaced using a ceramic resorbable
cylinder as osteoconductive graft. In this series of experi-
ments, the scaffoldwas a 100%syntheticCalcium-Phosphate
multiphase biomaterial containing 67% Silicon-stabilized
Tricalcium-Phosphate (Si-TCP) and 33% Hydroxyapatite/
beta Tricalcium-Phosphate (HA/beta-TCP). This scaffold
had a 60%porosity andwas produced byMilleniumBiologix
inc. (Kingston, Ontario, Canada). The external fixator type II
used as orthopaedic device to fix the implant area was
removed 6 months after surgery. The implant region was X-
ray acquired immediately after surgery and thereafter each
month until the animal sacrifice. The anteroposterior (AP)
view was analyzed. To validate the method, an aluminium
step wedge was used, consisting of 11 steps of increasing
thickness (3–33 mm) (EL.SE. S.r.l.).
X-Ray Images Acquisition
The radiograms were acquired with a mobile X-ray unit
(Gilardoni Condensorgil Kv 150� 50 mA s) using Fuji
Medical X-ray Films Super HR-GB 100 NIF (30� 40) and
Fuji G-8 intensifying green fluorescent screens. Film
processing was done automatically with a Cawomat 2000
IR (Cawo).
The X-ray exams were performed in the two orthogonal
projections: caudo-cranial and medio-lateral, with the
following exposure parameters: Kv 55 and 7.5 mA s, focal
distance 100 cm. For the cranio-caudal projection animals
were positioned on the table in left decubitus with extended
right tibia. (The X-ray cassette was kept in vertical position
with a cassette stand andwas leant on the cranial aspect of the
right tibia). For the medio-lateral projection, patients were
positioned in right decubitus.
X-Ray Images Calibration
Radiographs were scanned using transmitted light, digitized
with 400 dpi of resolution, 256 grey levels. An image analysis
software tool was developed in Matlab 6.5 environment, to
calibrate each digitized radiograph on a unique standardiza-
tion scale, using a reference image belonging to the set,
according to its largest grey levels range.
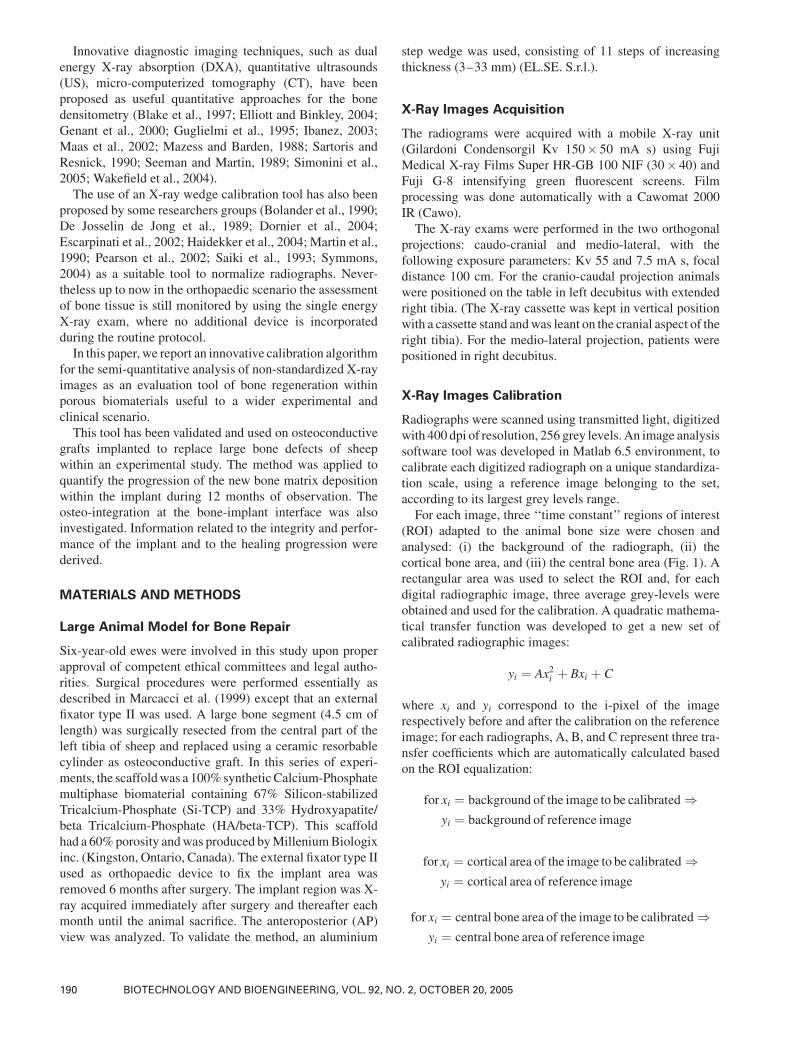
For each image, three ‘‘time constant’’ regions of interest
(ROI) adapted to the animal bone size were chosen and
analysed: (i) the background of the radiograph, (ii) the
cortical bone area, and (iii) the central bone area (Fig. 1). A
rectangular area was used to select the ROI and, for each
digital radiographic image, three average grey-levels were
obtained and used for the calibration. A quadratic mathema-
tical transfer function was developed to get a new set of
calibrated radiographic images:
yi ¼ Ax2i þ Bxi þ C
where xi and yi correspond to the i-pixel of the image
respectively before and after the calibration on the reference
image; for each radiographs, A, B, and C represent three tra-
nsfer coefficients which are automatically calculated based
on the ROI equalization:
for xi ¼ background of the image to be calibrated )yi ¼ background of reference image
for xi ¼ cortical area of the image to be calibrated )yi ¼ cortical area of reference image
for xi ¼ central bone area of the image to be calibrated )yi ¼ central bone area of reference image
190 BIOTECHNOLOGY AND BIOENGINEERING, VOL. 92, NO. 2, OCTOBER 20, 2005
Some radiographs included an aluminium step phantom
for routine X-ray expositions with 11 3-mm-thick steps. In
these images, three different steps of the step phantom were
considered as ‘‘time constant’’ regions.
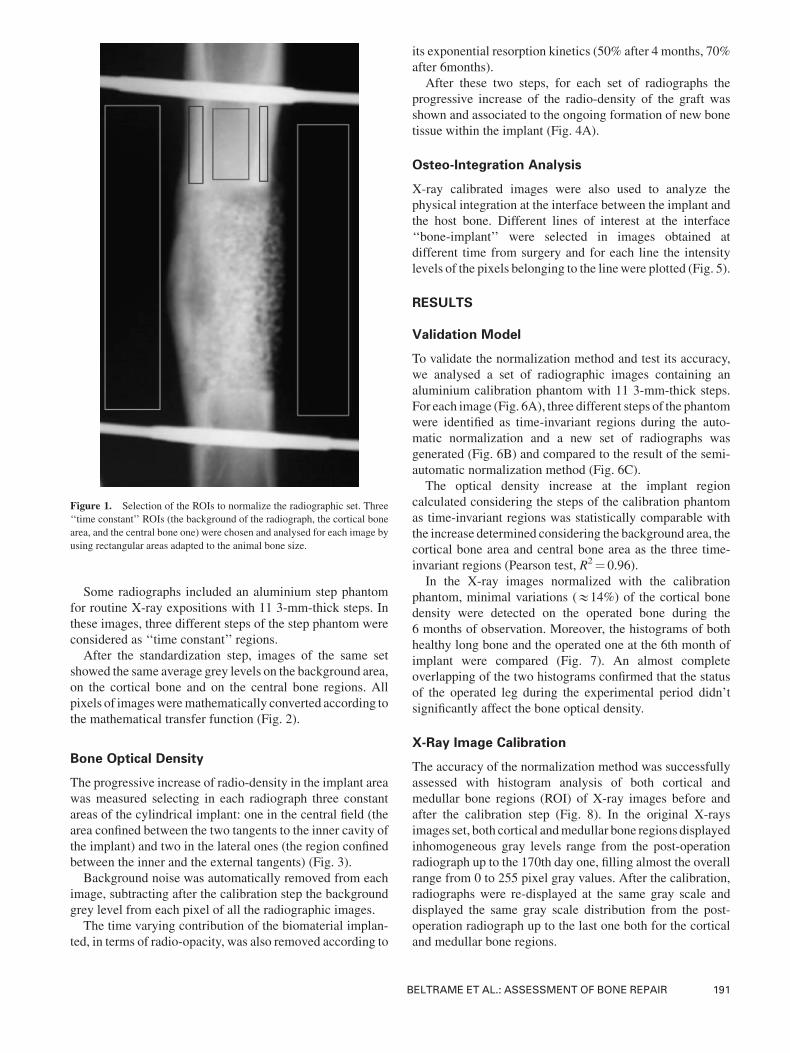
After the standardization step, images of the same set
showed the same average grey levels on the background area,
on the cortical bone and on the central bone regions. All
pixels of imagesweremathematically converted according to
the mathematical transfer function (Fig. 2).
Bone Optical Density
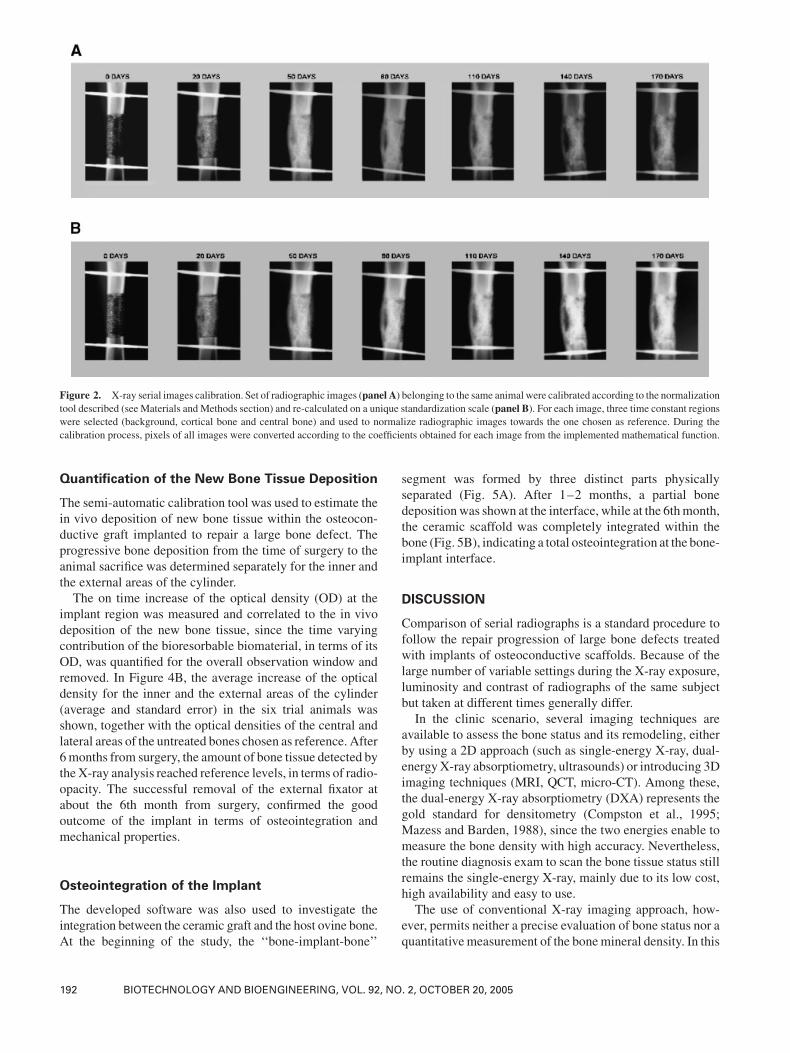
The progressive increase of radio-density in the implant area
was measured selecting in each radiograph three constant
areas of the cylindrical implant: one in the central field (the
area confined between the two tangents to the inner cavity of
the implant) and two in the lateral ones (the region confined
between the inner and the external tangents) (Fig. 3).
Background noise was automatically removed from each
image, subtracting after the calibration step the background
grey level from each pixel of all the radiographic images.
The time varying contribution of the biomaterial implan-
ted, in terms of radio-opacity, was also removed according to
its exponential resorption kinetics (50% after 4 months, 70%
after 6months).
After these two steps, for each set of radiographs the
progressive increase of the radio-density of the graft was
shown and associated to the ongoing formation of new bone
tissue within the implant (Fig. 4A).
Osteo-Integration Analysis
X-ray calibrated images were also used to analyze the
physical integration at the interface between the implant and
the host bone. Different lines of interest at the interface
‘‘bone-implant’’ were selected in images obtained at
different time from surgery and for each line the intensity
levels of the pixels belonging to the linewere plotted (Fig. 5).
RESULTS
Validation Model
To validate the normalization method and test its accuracy,
we analysed a set of radiographic images containing an
aluminium calibration phantom with 11 3-mm-thick steps.
For each image (Fig. 6A), three different steps of the phantom
were identified as time-invariant regions during the auto-
matic normalization and a new set of radiographs was
generated (Fig. 6B) and compared to the result of the semi-
automatic normalization method (Fig. 6C).
The optical density increase at the implant region
calculated considering the steps of the calibration phantom
as time-invariant regions was statistically comparable with
the increase determined considering the background area, the
cortical bone area and central bone area as the three time-
invariant regions (Pearson test, R2¼ 0.96).
In the X-ray images normalized with the calibration
phantom, minimal variations (&14%) of the cortical bone
density were detected on the operated bone during the
6 months of observation. Moreover, the histograms of both
healthy long bone and the operated one at the 6th month of
implant were compared (Fig. 7). An almost complete
overlapping of the two histograms confirmed that the status
of the operated leg during the experimental period didn’t
significantly affect the bone optical density.
X-Ray Image Calibration
The accuracy of the normalization method was successfully
assessed with histogram analysis of both cortical and
medullar bone regions (ROI) of X-ray images before and
after the calibration step (Fig. 8). In the original X-rays
images set, both cortical andmedullar bone regions displayed
inhomogeneous gray levels range from the post-operation
radiograph up to the 170th day one, filling almost the overall
range from 0 to 255 pixel gray values. After the calibration,
radiographs were re-displayed at the same gray scale and
displayed the same gray scale distribution from the post-
operation radiograph up to the last one both for the cortical
and medullar bone regions.
Figure 1. Selection of the ROIs to normalize the radiographic set. Three
‘‘time constant’’ ROIs (the background of the radiograph, the cortical bone
area, and the central bone one) were chosen and analysed for each image by
using rectangular areas adapted to the animal bone size.
BELTRAME ET AL.: ASSESSMENT OF BONE REPAIR 191
Quantification of the New Bone Tissue Deposition
The semi-automatic calibration tool was used to estimate the
in vivo deposition of new bone tissue within the osteocon-
ductive graft implanted to repair a large bone defect. The
progressive bone deposition from the time of surgery to the
animal sacrifice was determined separately for the inner and
the external areas of the cylinder.
The on time increase of the optical density (OD) at the
implant region was measured and correlated to the in vivo
deposition of the new bone tissue, since the time varying
contribution of the bioresorbable biomaterial, in terms of its
OD, was quantified for the overall observation window and
removed. In Figure 4B, the average increase of the optical
density for the inner and the external areas of the cylinder
(average and standard error) in the six trial animals was
shown, together with the optical densities of the central and
lateral areas of the untreated bones chosen as reference. After
6months from surgery, the amount of bone tissue detected by
theX-ray analysis reached reference levels, in terms of radio-
opacity. The successful removal of the external fixator at
about the 6th month from surgery, confirmed the good
outcome of the implant in terms of osteointegration and
mechanical properties.
Osteointegration of the Implant
The developed software was also used to investigate the
integration between the ceramic graft and the host ovine bone.
At the beginning of the study, the ‘‘bone-implant-bone’’
segment was formed by three distinct parts physically
separated (Fig. 5A). After 1–2 months, a partial bone
depositionwas shown at the interface, while at the 6thmonth,
the ceramic scaffold was completely integrated within the
bone (Fig. 5B), indicating a total osteointegration at the bone-
implant interface.
DISCUSSION
Comparison of serial radiographs is a standard procedure to
follow the repair progression of large bone defects treated
with implants of osteoconductive scaffolds. Because of the
large number of variable settings during the X-ray exposure,
luminosity and contrast of radiographs of the same subject
but taken at different times generally differ.
In the clinic scenario, several imaging techniques are
available to assess the bone status and its remodeling, either
by using a 2D approach (such as single-energy X-ray, dual-
energyX-ray absorptiometry, ultrasounds) or introducing 3D
imaging techniques (MRI, QCT, micro-CT). Among these,
the dual-energy X-ray absorptiometry (DXA) represents the
gold standard for densitometry (Compston et al., 1995;
Mazess and Barden, 1988), since the two energies enable to
measure the bone density with high accuracy. Nevertheless,
the routine diagnosis exam to scan the bone tissue status still
remains the single-energy X-ray, mainly due to its low cost,
high availability and easy to use.
The use of conventional X-ray imaging approach, how-
ever, permits neither a precise evaluation of bone status nor a
quantitativemeasurement of the bonemineral density. In this
Figure 2. X-ray serial images calibration. Set of radiographic images (panel A) belonging to the same animal were calibrated according to the normalization
tool described (see Materials and Methods section) and re-calculated on a unique standardization scale (panel B). For each image, three time constant regions
were selected (background, cortical bone and central bone) and used to normalize radiographic images towards the one chosen as reference. During the
calibration process, pixels of all images were converted according to the coefficients obtained for each image from the implemented mathematical function.
192 BIOTECHNOLOGY AND BIOENGINEERING, VOL. 92, NO. 2, OCTOBER 20, 2005
context, two different approaches may be followed: (i) to
introduce a standard calibration method of radiographs, by
using ametal wedge calibrator for X-ray films, (ii) to develop
an innovative procedure of image processing, which does not
require the use the wedge calibrator at the time of the
radiograph exposure.
In the attempt to provide a larger population of
orthopaedics and clinicians with a simple semi-quantitative
method to monitor in vivo bone formation by using the most
common 2D structure image technique, we developed a new
semi-automatic tool to normalize and compare non-standar-
dized X-ray films. This tool has been validated and used on
osteoconductive grafts implanted to replace large bone
defects of sheep within an experimental study. We have
assumed that, within each X-ray images set belonging to the
same animal monitored monthly for 1 year, the background
region of the radiographic films and the healthy bone tissue
Figure 3. Panel A: Selected fields of the osteoconductive implanted graft.
The central fieldwas defined as the area confined between the two tangents to
the inner cavity of the implant parallel to theX-ray beam; the lateral fieldwas
defined as the region confined between the inner and the external tangent of
the circular section. Panel B: Selection of the ROIs at the implant region.
Based on the size of the animal bone, three rectangular area were used to
select in each X-ray image the central region of the implant and the two
lateral regions.
Figure 4. Panel A: Time evolution of the optical density in the implant
area. The progressive increase of the optical densities in the lateral and
central fields (dashed line and solid line respectively) of the implant is shown
for a serial of radiographs. After subtraction of the background noise and of
the optical density attributable to the residual ceramic biomaterial in the
implant area, the trend lines (3rd degree polynomial function) show a
progressive deposition of new bonewithin the grafts.Panel B: Average bonedeposition in the implants performed in all sheeps (n¼ 6). Average values
and their standard error are shown together with the optical density levels of
the central (black line) and lateral areas (grey line) of the untreated bones
chosen as reference. The average OD values were plotted by a trend line
corresponding to a 3rd degree polynomial function. The external fixator was
removed between the 170th and the 200th day after the implant.
BELTRAME ET AL.: ASSESSMENT OF BONE REPAIR 193
region confining the implant remain constant during the
overall healing period.
These areas therefore were used to normalize the overall
set of radiographs on the same grey scale. A quadratic
mathematical transfer function was chosen, since three
boundary conditions were identified.
In order to keep this assumption truthful and to avoid
artifacts due to inflammation or periosteal responses to the
surgery, the calibrationwas done selecting regions of bone far
from the implants.
The accuracy of the normalization method for X-ray films
was successfully validated by using an aluminium step
wedge as tool to standardize serial radiographs.
This result opens awide scenario for the use of our method
in the orthopaedics, radiological, and clinical fields where,
while the X-ray exposure remains one of the most common
diagnostic tools and, the comparison of not-standardized
films for the assessment of bone turnover in case of osteo-
porosis, bone fractures, and other bone pathologies is a
routine procedure.
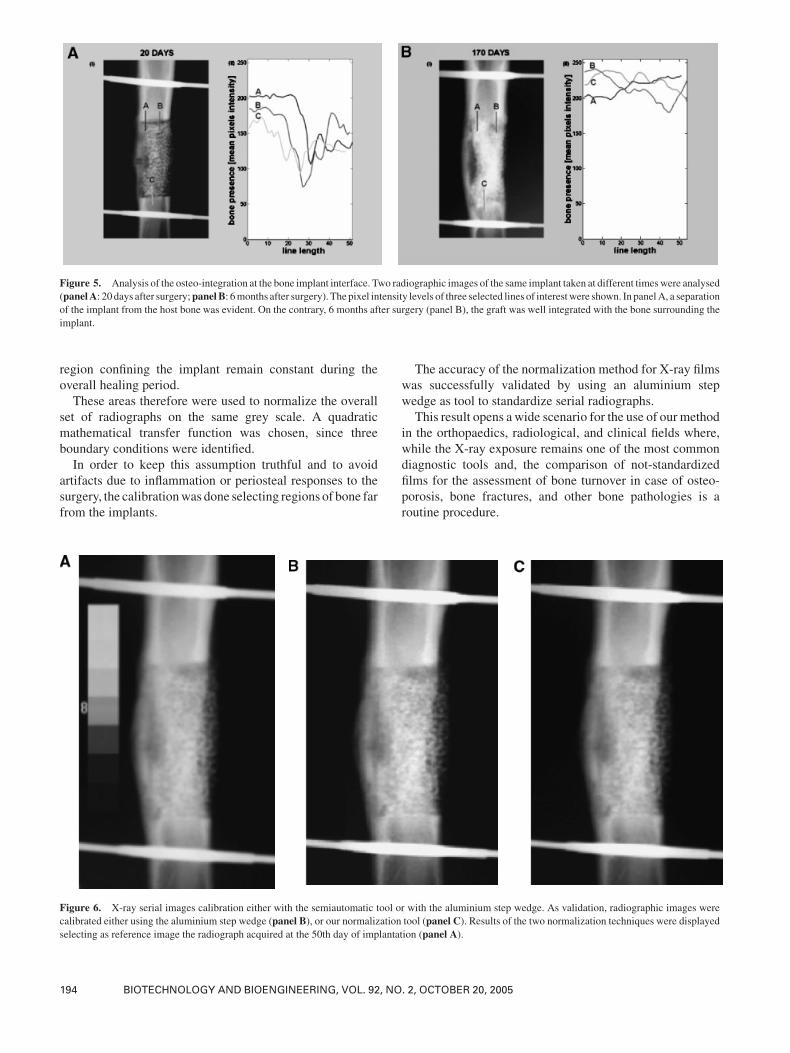
Figure 5. Analysis of the osteo-integration at the bone implant interface. Two radiographic images of the same implant taken at different timeswere analysed
(panelA: 20 days after surgery;panelB: 6months after surgery). The pixel intensity levels of three selected lines of interestwere shown. In panelA, a separation
of the implant from the host bone was evident. On the contrary, 6 months after surgery (panel B), the graft was well integrated with the bone surrounding the
implant.
Figure 6. X-ray serial images calibration either with the semiautomatic tool or with the aluminium step wedge. As validation, radiographic images were
calibrated either using the aluminium step wedge (panel B), or our normalization tool (panel C). Results of the two normalization techniques were displayed
selecting as reference image the radiograph acquired at the 50th day of implantation (panel A).
194 BIOTECHNOLOGY AND BIOENGINEERING, VOL. 92, NO. 2, OCTOBER 20, 2005
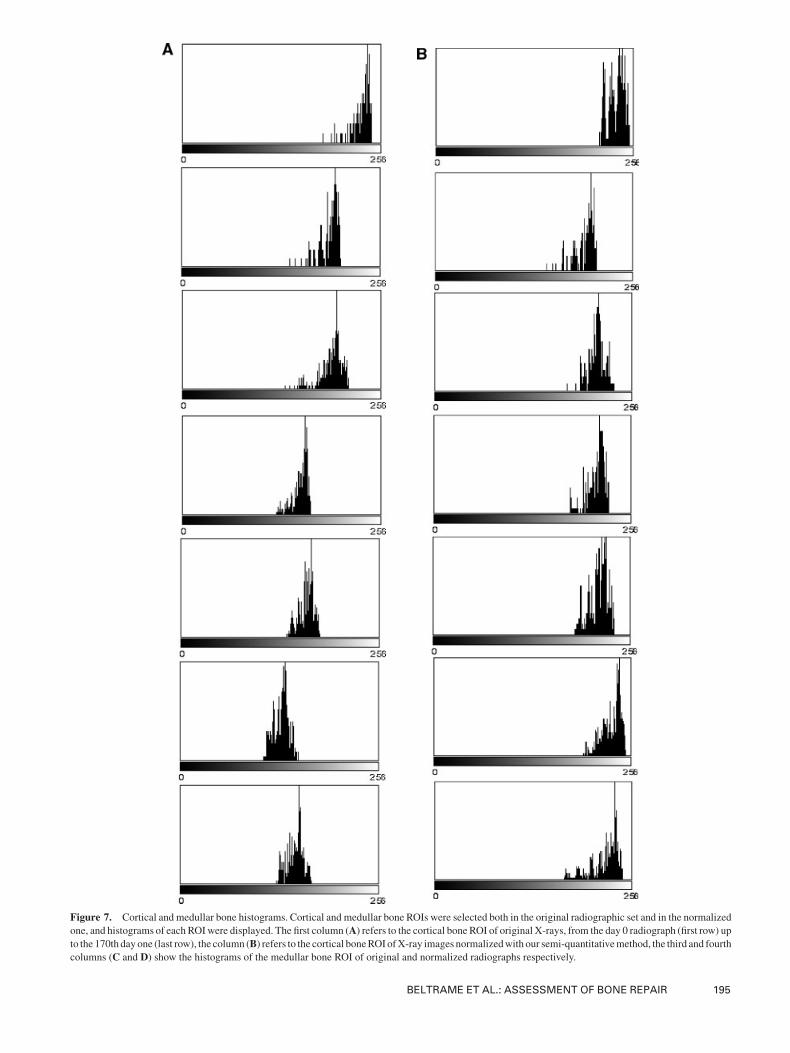
Figure 7. Cortical and medullar bone histograms. Cortical and medullar bone ROIs were selected both in the original radiographic set and in the normalized
one, and histograms of each ROIwere displayed. The first column (A) refers to the cortical bone ROI of original X-rays, from the day 0 radiograph (first row) up
to the 170th day one (last row), the column (B) refers to the cortical boneROI ofX-ray images normalizedwith our semi-quantitativemethod, the third and fourth
columns (C and D) show the histograms of the medullar bone ROI of original and normalized radiographs respectively.
BELTRAME ET AL.: ASSESSMENT OF BONE REPAIR 195
Figure 7. (Continued)
196 BIOTECHNOLOGY AND BIOENGINEERING, VOL. 92, NO. 2, OCTOBER 20, 2005
The tool allowed the investigation of the bone regenerating
ability of a Calcium-Phosphate multiphase osteoconductive
hollow cylinder graft (67% Si-TCP) and 33%HA/beta-TCP)
implanted in sheep animal models. This scaffold presents
specific osteoconductive properties and a structure permis-
sive to vascular invasion. In agreement with our results in a
parallel series of experiments in which the scaffold was
stabilized with a neutralizing plate (Mastrogiacomo et al.,
submitted), a good osteointegration and mechanical perfor-
mance was also obtained in this series of experiments where
the scaffold was stabilized by external fixation. A significant
progressive increasing of optical density was shown at the
implant region and cross-correlated to the neo-bone matrix
deposition. After a linear growth of the optical density during
the first months of observation, physiological levels of bone
optical density were reached at the 6th month from surgery
and maintained on time, as shown by plateau behavior in
Figure 4B.
The possibility of under-evaluating bone formation at the
implant region when using a bioresorbable scaffold was
avoided by introducing within the semi-quantitative tool a
mathematical function plotting the time-resorption values of
the biomaterial.
In principle, the variation of the optical density detected at
the implant area is proportional to the physical mineral
density of the tissues analysed, expressed in g/cm3, as it’s
customary in bone densitometry. In case a precise assessment
of a quantitative bone mineral density indices is required,
either for comparison studies from different groups or for
final diagnosis of skeletal diseases, a proper calibration
standard, such as DXA, quantitativeUS, or tomography axial
computerized (TAC) should be introduced.
Parallel to the continuous bone tissue depositionwithin the
implant during the healing period, a good integration
between the ceramic graft and the host bone enclosing the
graft was also observed. A good osteointegration is an
important prerequisite for an optimal mechanical stability of
the implant. This method should provide to the orthopaedics
a solid tool to determine the correct time window for the
fixator removal and eventually improve the recovery period
of the patients.
In conclusion, we have developed a semi-automatic
algorithm to normalize serial radiographic images related
to the orthopaedic field. The systemwas validated and used to
quantify the continuous deposition of mineralized new bone
within the implant region in a tibia sheep model. Possibly,
this procedure could be extended to wider experimental and
routine orthopaedic scenarios to study bone turnover and
repair.
The authors thankMilleniumBiologix Inc, Kingston, Ontario, Canada
for providing samples of ceramic scaffolds before they were available
on the market.
References
AdaniR,DelcroixL, InnocentiM,Marcoccio I, TaralloL,CelliA,CerusoM.
2004. Reconstruction of large posttraumatic skeletal defects of the
forearm by vascularized free fibular graft. Microsurgery 24:423–429.
Audenino AL, Zanetti EM, Calderale PM. 1996. Radiograph processing for
quantitative assessment of bone remodelling. Med Eng Phys 18:382–
389.
Blake GM, Gluer CC, Fogelman I. 1997. Bone densitometry: Current status
and future prospects. Br J Radiol 70 Spec N:S177–S186.
Bolander ME, Gardiner J, Coyle J, Joyce M, Himmel HH, Thornton BC,
Ruttimann UE. 1990. Detection and measurement of simulated early
rheumatoid lesions of the hand using digital subtraction radiography.
Invest Radiol 25(6):708–713.
CampanacciM,MercuriM,GasbarriniA, Campanacci L. 1998. Thevalue of
imaging in the diagnosis and treatment of bone tumors. Eur J Radiol 27:
S116–S122.
Compston JE, Cooper C, Kanis JA. 1995. Bone densitometry in clinical
practice. Br Med J 310:1507–1510.
De Josselin de Jong E, Ten Bosch JJ, Noordmans J. 1989. Optimised
microcomputer-guided quantitative microradiography on dental miner-
alised tissue slices. Phys Med Biol 32(7):887–899.
Den Boer FC, Wippermann BW, Blokhuis TJ, Patka P, Bakker FC,
Haarman HJ. Th M. 2003. Healing of segmental bone defects with
granular porous hydroxyapatite augmented with recombinant human
osteogenic protein-1 or autologous bone marrow. J Orthop Res 21:
521–528.
Dornier C, Dorsaz-Brossa L, Thevenaz P, Casagni F, Brochut P,Mombelli A,
Vallee J. 2004. Geometric alignment and chromatic calibration of serial
radiographic images. Dentomaxillofac Radiol 33(4):220–225.
Dujardin FH, Bocquet G, Ertaud JY, Thomine JM. 1996. Quantitative
assessment of cortical bone remodelling from routine radiographs of
total hip arthroplasty. Med Eng Phys 18:489–494.
Elliott ME, Binkley N. 2004. Evaluation and measurement of bone mass.
Epilepsy Behav 5(Suppl 2):S16–S23.
Escarpinati MC, Costa Vieira MA, Schiabel H. 2002. Computer technique
for digital radiographic images correction based on the digitizer
characteristic curve. J Digit Imaging 15(Suppl 1):228–230.
Gao TJ, Lindholm TS, Kommonen B, Ragni P, Paronzini A, Lindholm TC.
1995. Microscopic evaluation of bone-implant contact between
hydroxyapatite, bioactive glass and tricalcium phosphate implanted in
sheep diaphyseal defects. Biomaterials 16:1175–1179.
Genant HK, Gordon C, Jiang Y, Link TM, Hans D, Majumdar S, Lang TF.
2000. Advanced imaging of the macrostructure and microstructure of
bone. Horm Res 54(Suppl 1):24–30.
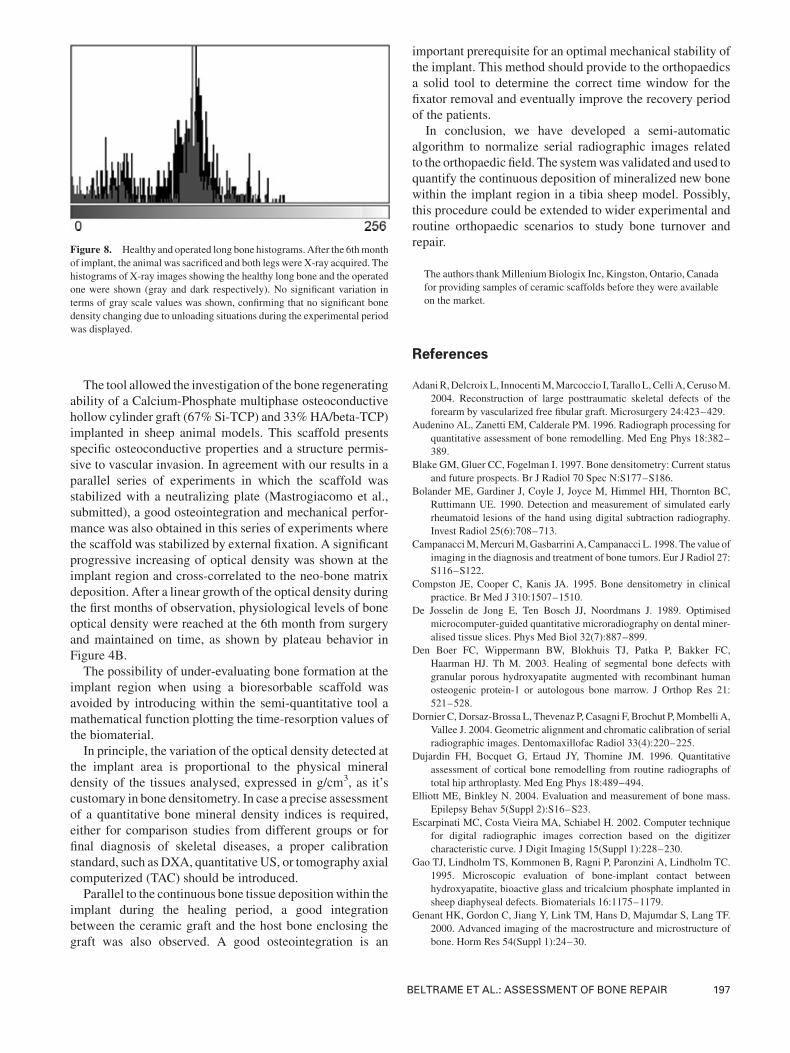
Figure 8. Healthy and operated long bone histograms.After the 6thmonth
of implant, the animal was sacrificed and both legs were X-ray acquired. The
histograms of X-ray images showing the healthy long bone and the operated
one were shown (gray and dark respectively). No significant variation in
terms of gray scale values was shown, confirming that no significant bone
density changing due to unloading situations during the experimental period
was displayed.
BELTRAME ET AL.: ASSESSMENT OF BONE REPAIR 197
Goitz HT, Goitz RJ, Watson JT, Schurman JR, Roth HJ. 1996. Orthopedic
implants: A guide to radiographic analysis. Curr Probl Diagn Radiol 25:
113–168.
Guglielmi G, Gluer CC, Majumdar S, Blunt BA, Genant HK. 1995. Current
methods and advances in bone densitometry. Eur Radiol 5(2):129–139.
Haidekker MA, Stevens HY, Frangos JA. 2004. Computerized methods for
X-ray-based small bone densitometry. Comput Methods Programs
Biomed 73:35–42.
Ibanez R. 2003. Bone mineral density measurement techniques. An Sist
Sanit Navar 26(Suppl 3):19–27.
Johnson KD, Frierson KE, Keller TS, Cook C, Scheinberg R, Zerwekh J,
Meyers L, SciadiniMF. 1996. Porous ceramic as bonegraft substitutes in
long bone defects: A biomechanical, histological, and radiographic
analysis. J Orthop Res 14:351–369.
Kon E, Muraglia A, Corsi A, Bianco P, Marcacci M, Martin I, Boyde A,
Ruspantini I, Chistolini P, RoccaM, Giardino R, Cancedda R, Quarto R.
2000. Autologous bone marrow stromal cells loaded onto porous
hydroxyapatite ceramic accelerate bone repair in critical-size defects of
sheep long bones. J Biomed Mater Res 49:328–337.
Leffler SG, Vaccaro JP. 2000. Bone mineral density assessment. Med Health
R I 83(4):123–126.
Maas M, Poll LW, Terk MR. 2002. Imaging and quantifying skeletal
involvement in Gaucher disease. Br J Radiol 75(Suppl 1):A13–A24.
MarcacciM, Kon E, Zaffagnini S, Giardino R, RoccaM, Corsi A, Benvenuti
A, Bianco P, Quarto R, Martin I, Muraglia A, Cancedda R. 1999.
Reconstruction of extensive long-bone defects in sheep using porous
hydroxyapatite sponges. Calcif Tissue Int 64:83–90.
Martin RB, Papamichos T, Dannucci GA. 1990. Linear calibration of
radiographic mineral density using video-digitizing methods. Calcif
Tissue Int 47(2):82–91.
Mazess RB, Barden HS. 1988. Measurement of bone by dual-photon
absorptiometry (DPA) and dual-energy X-ray absorptiometry (DEXA).
Ann Chir Gynaecol 77(5-6):197–203.
PearsonD, Cawte SA, Green DJ. 2002. A comparison of phantoms for cross-
calibration of lumbar spine DXA. Osteoporos Int 13(12):948–954.
Petite H, Viateau V, Bensaid W, Meunier A, de Pollak C, Bourguignon M,
Oudina K, Sedel L, Guillemin G. 2000. Tissue-engineered bone
regeneration. Nat Biotechnol 18:959–963.
Quarto R, Mastrogiacomo M, Cancedda R, Kutepov SM, Mukhachev V,
Lavroukov A, Kon E, Marcacci M. 2001. Repair of large bone defects
with the use of autologous bonemarrow stromal cells.NEngl JMed344:
385–386.
Saiki T, Yumoto E, Okamura H. 1993. Quantitative evaluation of X-ray
opacity of themaxillary sinus using a digital disposition system. Nippon
Jibiinkoka Gakkai Kaiho 96(11):1907–1914.
Sartoris DJ, Resnick D. 1990. Innovative approaches to noninvasive bone
densitometry. Crit Rev Diagn Imaging 30(1):19–39.
Sartoris DJ, Holmes RE, Resnick D. 1992. Coralline hydroxyapatite
bone graft substitutes: Radiographic evaluation. J Foot Surg 31:
301–313.
SeemanE,Martin TJ. 1989.Non-invasive techniques for themeasurement of
bone mineral. Baillieres Clin Endocrinol Metab 3(1):1–33.
Simonini G, Cimaz R, Falcini F. 2005. Usefulness of bone ultrasound
techniques in pediatric rheumatic diseases. J Rheumatol 32(1):198–
199.
Symmons R. 2004. Digital photodensitometry: A reliable and accessible
method for measuring bone density. J Archaeol Sci 31:711–719.
Wakefield RJ, Conaghan PG, Jarrett S, Emery P. 2004. Non invasive
techniques for assessing skeletal changes in inflammatory arthritis:
Imaging technique. Curr Opin Rheumatol 16(4):435–442.
198 BIOTECHNOLOGY AND BIOENGINEERING, VOL. 92, NO. 2, OCTOBER 20, 2005