
Implementing Computerized Provider Order Entry in Acute ...
53
Working Report Implementing Computerized Provider Order Entry in Acute Care Hospitals in the United States Could Generate Substantial Savings to Society Methodological Appendix Teryl K. Nuckols, Steven M. Asch, Vaspaan Patel, Emmett B. Keeler, Laura Anderson, Melinda Beeuwkes Buntin, Jose J. Escarce RAND HEALTH WR-1108 August 2015 RAND working papers are intended to share researchers’ latest findings and to solicit informal peer review. They have been approved for circulation by RAND Health but have not been formally edited or peer reviewed. Unless otherwise indicated, working papers can be quoted and cited without permission of the author, provided the source is clearly referred to as a working paper. RAND's publications do not necessarily reflect the opinions of its research clients and sponsors. is a registered trademark.
-
Upload
khangminh22 -
Category
Documents
-
view
2 -
download
0
Transcript of Implementing Computerized Provider Order Entry in Acute ...
Working Report
Implementing Computerized Provider Order Entry in Acute Care Hospitals in the United States Could Generate Substantial Savings to Society
Methodological Appendix
Teryl K. Nuckols, Steven M. Asch, Vaspaan Patel, Emmett B. Keeler, Laura Anderson, Melinda Beeuwkes Buntin, Jose J. Escarce
RAND HEALTH
WR-1108
August 2015
RAND working papers are intended to share researchers’ latest findings and to solicit informal peer review. They have been approved for circulation by RAND Health but have not been formally edited or peer reviewed. Unless otherwise indicated, working papers can be quoted and cited without permission of the author, provided the source is clearly referred to as a working paper. RAND's publications do not necessarily reflect the opinions of its research clients and sponsors. is a registered trademark.
Abstract: Background: Computerized provider order entry (CPOE) with clinical decision support is a basic criterion for hospitals' meaningful use of electronic health record systems. A study was conducted to evaluate from the societal perspective the cost-utility of implementing CPOE in acute care hospitals in the United States. Methods: A decision-analytical model compared CPOE with paper ordering among patients admitted to acute care hospitals with > 25 beds. Parameters included start-up and maintenance costs, as well as costs for provider time use, medication and laboratory test ordering, and preventable adverse drug events. Probabilistic analyses produced incremental costs, effectiveness, and cost-effectiveness ratios for hospitals in four bed-size categories (25–72, 72–141, 141–267, 267–2,249). Results: Relative to paper ordering and using typical estimates of implementation costs, CPOE had, on average, > 99% probability of yielding savings to society and improving health. Per hospital in each size category, mean life-time savings —in millions—were $11.6 (standard deviation, $9.30), $34.4 ($21.2), $71.8 ($43.8), and $170 ($119) (2012 dollars), respectively, and quality-adjusted life-years (QALYs) gained were 19.9 (16.9), 53.7 (38.7), 109 (79.6), and 249 (205). Incremental effectiveness and costs were less favorable in certain circumstances, such as high implementation costs. Nationwide, anticipated increases in CPOE implementation from 2009 through 2015 could save $133 billion and 201,000 QALYs. Conclusions: In addition to improving health, implementing CPOE with clinical decision support could yield substantial long-term savings to society in the United States, although results for individual hospitals are likely to vary. The attachment is an appendix supporting the following publication: Nuckols, Teryl K.; Asch, Steven M.; Patel, Vaspaan; Keeler, Emmett; Anderson, Laura; Buntin, Melinda B.; Escarce, José, “Implementing Computerized Provider Order Entry in Acute Care Hospitals in the United States Could Generate Substantial Savings to Society,” The Joint Commission Journal on Quality and Patient Safety, Volume 41, Number 8, August 2015, pp. 341.

Table of Contents Section 1: Overview of Decision Model ................................................................................................................................. 1 Section 2: Creating the Decision Model ............................................................................................................................... 12 Section 3: Searching the Literature ...................................................................................................................................... 14 Section 4: Estimating Medication Error Rates and CPOE Effectiveness............................................................................... 17 Section 5: Estimating CPOE‐related Costs ............................................................................................................................ 20 Section 6: Estimating the Costs and Health Effects of Adverse Drug Events ....................................................................... 38
List of Tables Table 1: Clinical Parameters Used in Decision Model (Parameters that Pertain to Both Clinical Effects and Costs Are
Included) ............................................................................................................................................................................ 4 Table 2: Cost Parameters Used in Decision Model ................................................................................................................ 7 Table 3: Search Terms Used to Identify Articles on Cost‐related Issues within Previous Search Results: .......................... 15 Table 4: PubMed Search Terms for the Costs of Adverse Drug Events ............................................................................... 16 Table 5: Baseline Proportion of Medication Errors Resulting in Preventable Adverse Drug Events (pADEs): Median 0.11,
Range: 0.02 to 0.43 .......................................................................................................................................................... 17 Table 6: Ages of Adult Inpatients Who Experience ADEs (6) ............................................................................................... 18 Table 7: Outcomes among Patients Who Experienced pADEs in Studies of CPOE Effectiveness ........................................ 19 Table 8: One‐time Capital Costs of CPOE Implementation: ................................................................................................. 23 Table 9: Annual Maintenance Costs of CPOE: ...................................................................................................................... 25 Table 10: Annual Cost Offsets to Hospitals from CPOE Implementation through Improvements in Medication and
Laboratory Ordering (13‐15) Median: $40.81, Range $28.83‐$52.78 ........................................................................... 27 Table 11: Effect of CPOE on Workflow of Interns*: Median Change +0.725, Range +0.55 to +1.22 Hours of Work per Day
......................................................................................................................................................................................... 28 Table 12: Effect of CPOE on Workflow of Nurses: Median Change ‐0.83 Hours of Work per Day, Range ‐1.31 to ‐0.33 ... 28 Table 14: Effect of CPOE on Workflow of Physicians*: Median Change +0.77, Range 0.58 to 0.96 Hours of Work per Day
(+/‐ 25%) .......................................................................................................................................................................... 28 Table 15: Number of Orders per Patient per Day: Median 6.1, Range 3.4 to 25.4 ............................................................. 30 Table 16: Parameters Relevant to Estimating Costs of Workflow Changes, Including Wages, Benefits, and Days of Work
per Year for Each Type of Provider .................................................................................................................................. 32 Table 17: Bed Size Distributions Considered for Quintile 5 ................................................................................................. 36 Table 18: Data for Hospitals in Each of Five Different Size Quintiles, for 2009(5) ............................................................... 37 Table 19: Cost of per Adverse Drug Event ........................................................................................................................... 38 Table 20: Derived Population‐Weighted Funeral Cost per pADE, by Age Group ................................................................ 40 Table 21: Assumed Decrements in Health Utility during pADEs .......................................................................................... 40 Table 22: Additional Days Length of Stay in Hospital Due to Adverse Drug Events ............................................................ 42 Table 23: Assumed Durations of pADEs (Days) .................................................................................................................... 42 Table 24: U.S. Population Estimates by Age, Both Sexes, 2009(66) .................................................................................... 43 Table 25: Derived QALYs Lost per Fatal or Disabling pADE Over the Lifetime ..................................................................... 44 Table 26: Hours Spent in Care and Informal Care Giving during Hospitalization ................................................................ 45
Figures Figure 1: Decision Model of CPOE Implementation in an Individual, Hypothetical Hospital ................................................ 2 References ............................................................................................................................................................................ 46

1
Section 1: Overview of Decision Model
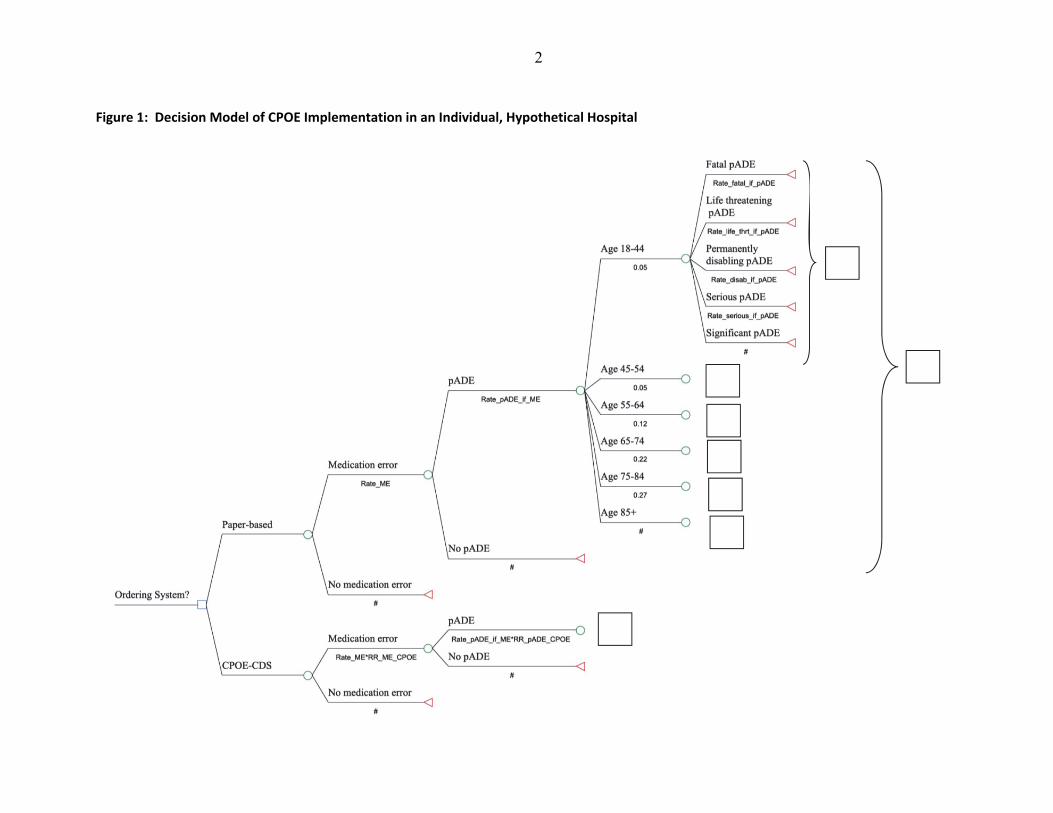
Figure 1 below depicts the structure of the probability (i.e., decision) model, while Tables 2 and 3 list model parameters.
2
Figure 1: Decision Model of CPOE Implementation in an Individual, Hypothetical Hospital
3
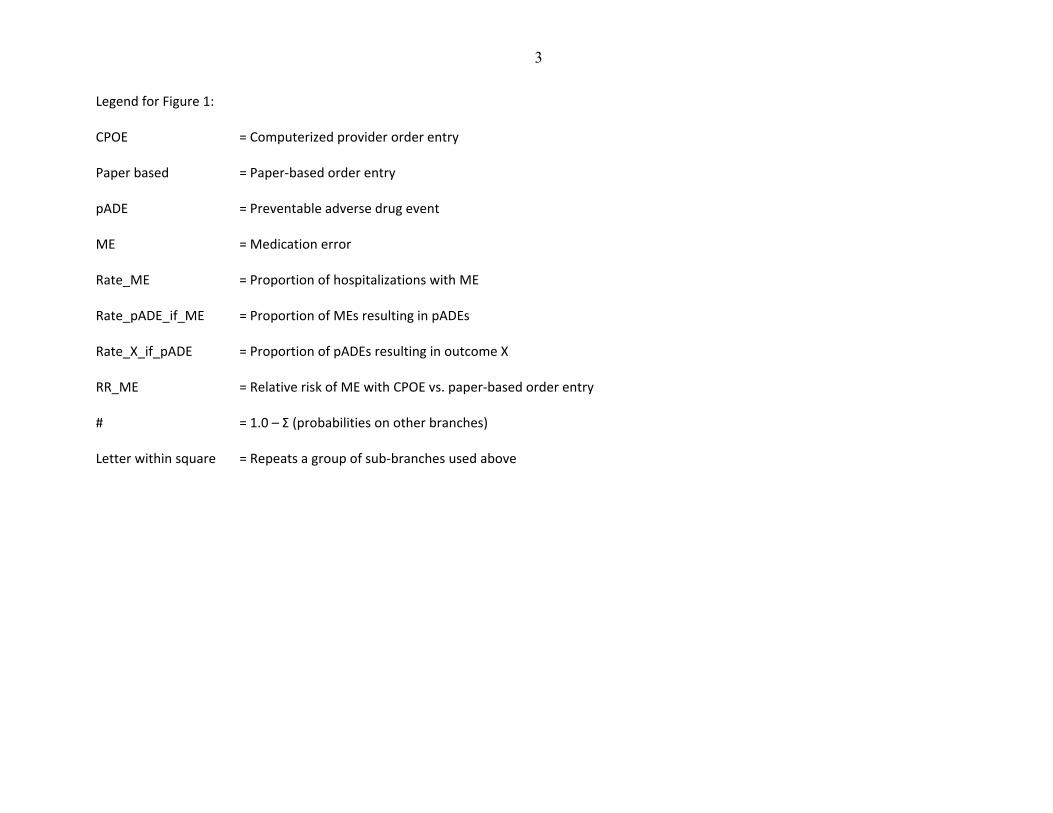
Legend for Figure 1: CPOE = Computerized provider order entry
Paper based = Paper‐based order entry
pADE = Preventable adverse drug event
ME = Medication error
Rate_ME = Proportion of hospitalizations with ME
Rate_pADE_if_ME = Proportion of MEs resulting in pADEs
Rate_X_if_pADE = Proportion of pADEs resulting in outcome X
RR_ME = Relative risk of ME with CPOE vs. paper‐based order entry
# = 1.0 – Σ (probabilities on other branches)
Letter within square = Repeats a group of sub‐branches used above

4
Table 1: Clinical Parameters Used in Decision Model (Parameters that Pertain to Both Clinical Effects and Costs Are Included)
Parameter Distribution Parameter Values Source
Clinical and Cost Parameters
Both Paper and CPOE‐CDS Scenarios
Discount Rate Single value 3% Gold 1996 (1)
Useful Lifespan of CPOE System, years
Triangular (peak, range)
10, 8 to 20 Wu 2007 (2), Spooner 2012 (3)
Willingness to Pay per QALY
Single value $200,000 Braithwaite 2008 (4)
Beds per Hospital American Hospital Association 2010 (5)
Quintile 2 Uniform 25 to 72
Quintile 3 Uniform 72 to 141
Quintile 4 Uniform 141 to 267
Quintile 5 Log Normal (Mean, Standard Deviation)
6.060705005,0.367902539
Admissions per Hospital per Year
Function of another parameter
Admissions = 49.6060*BEDS+(‐0.00411*BEDS2)‐690.2208206
American Hospital Association 2010 (5)
Proportions of Hospitalizations with Medication Errors
Triangular (peak, range)
0.473, 0.049 to 0.999 See text and tables.
Proportion of Medication Errors Resulting in pADEs
Triangular (peak, range)
0.11, 0.02 to 0.43 See text and tables.
Proportion of People Experiencing pADEs in Various Age Categories
Hug 2009 (6)
Age 20‐44 Single value 5%
Age 45‐54 Single value 5%
Age 55‐64 Single value 12%
Age 65‐74 Single value 22%
Age 75‐84 Single value 27%
Age 85+ Single value 28%
Outcomes of pADEs
Proportion of pADEs Fatal
Triangular (peak, range)
0.008, 0.006 to 0.01 See text and tables.
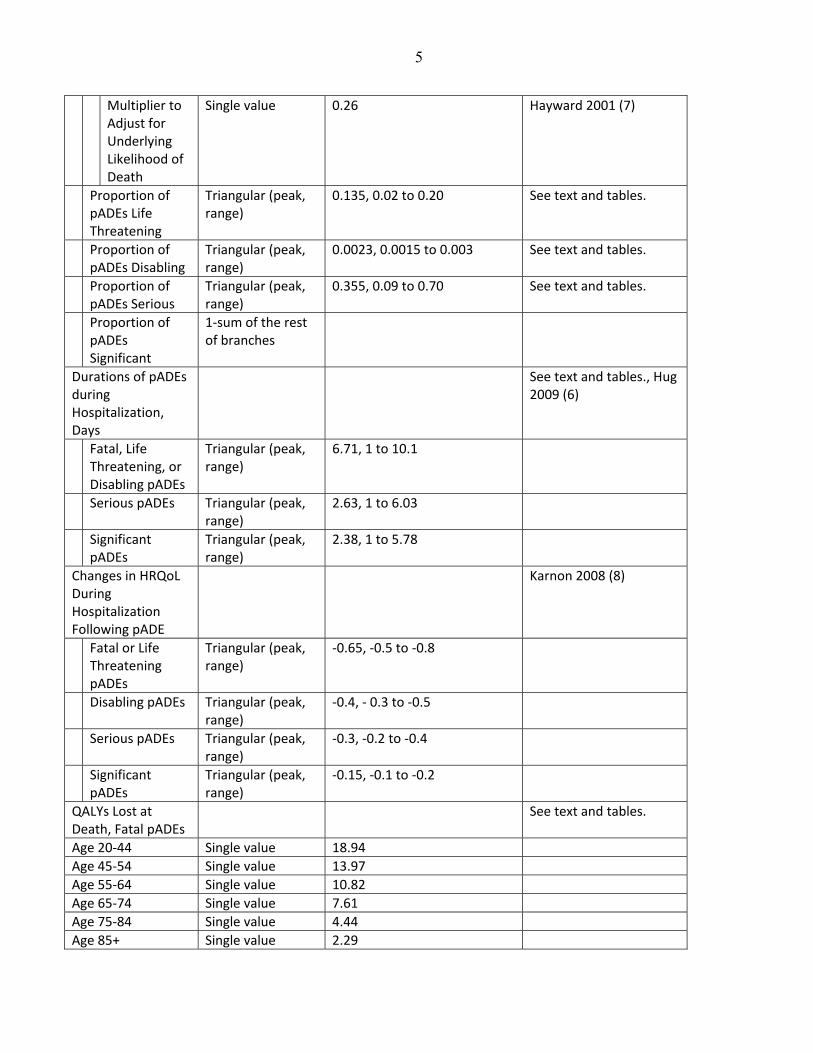
5
Multiplier to Adjust for Underlying Likelihood of Death
Single value 0.26 Hayward 2001 (7)
Proportion of pADEs Life Threatening
Triangular (peak, range)
0.135, 0.02 to 0.20 See text and tables.
Proportion of pADEs Disabling
Triangular (peak, range)
0.0023, 0.0015 to 0.003 See text and tables.
Proportion of pADEs Serious
Triangular (peak, range)
0.355, 0.09 to 0.70 See text and tables.
Proportion of pADEs Significant
1‐sum of the rest of branches
Durations of pADEs during Hospitalization, Days
See text and tables., Hug 2009 (6)
Fatal, Life Threatening, or Disabling pADEs
Triangular (peak, range)
6.71, 1 to 10.1
Serious pADEs Triangular (peak, range)
2.63, 1 to 6.03
Significant pADEs
Triangular (peak, range)
2.38, 1 to 5.78
Changes in HRQoL During Hospitalization Following pADE
Karnon 2008 (8)
Fatal or Life Threatening pADEs
Triangular (peak, range)
‐0.65, ‐0.5 to ‐0.8
Disabling pADEs Triangular (peak, range)
‐0.4, ‐ 0.3 to ‐0.5
Serious pADEs Triangular (peak, range)
‐0.3, ‐0.2 to ‐0.4
Significant pADEs
Triangular (peak, range)
‐0.15, ‐0.1 to ‐0.2
QALYs Lost at Death, Fatal pADEs
See text and tables.
Age 20‐44 Single value 18.94
Age 45‐54 Single value 13.97
Age 55‐64 Single value 10.82
Age 65‐74 Single value 7.61
Age 75‐84 Single value 4.44
Age 85+ Single value 2.29
6
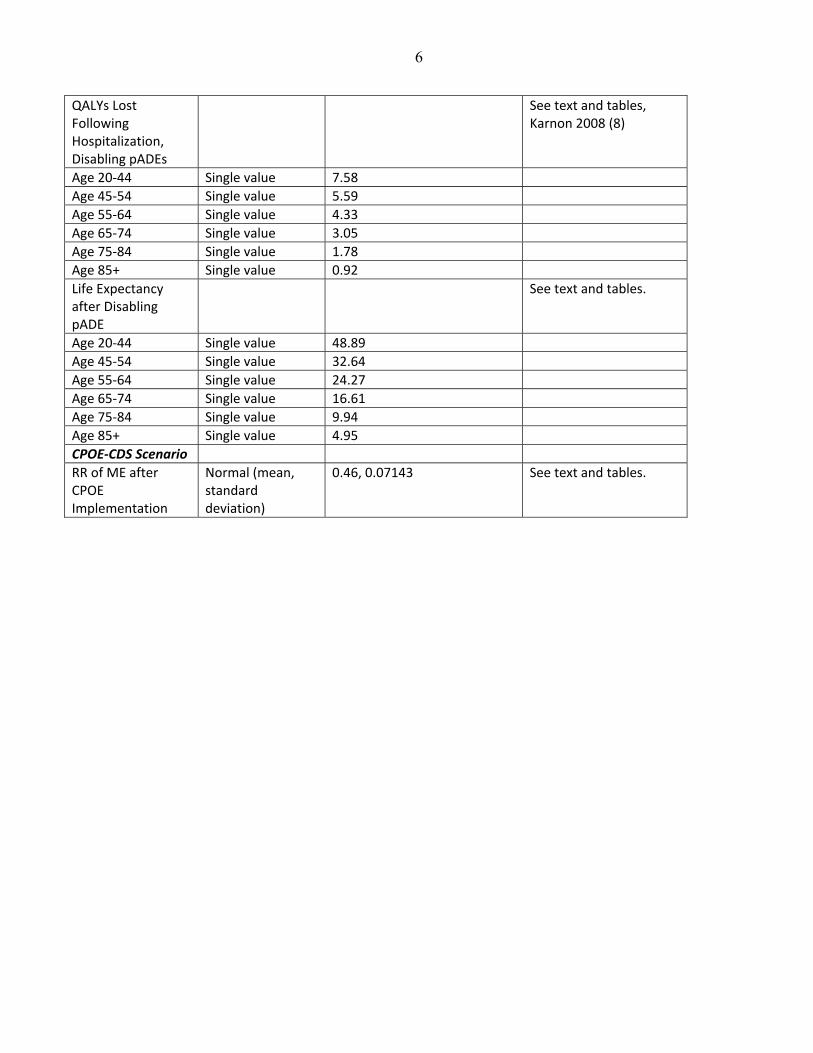
QALYs Lost Following Hospitalization, Disabling pADEs
See text and tables, Karnon 2008 (8)
Age 20‐44 Single value 7.58
Age 45‐54 Single value 5.59
Age 55‐64 Single value 4.33
Age 65‐74 Single value 3.05
Age 75‐84 Single value 1.78
Age 85+ Single value 0.92
Life Expectancy after Disabling pADE
See text and tables.
Age 20‐44 Single value 48.89
Age 45‐54 Single value 32.64
Age 55‐64 Single value 24.27
Age 65‐74 Single value 16.61
Age 75‐84 Single value 9.94
Age 85+ Single value 4.95
CPOE‐CDS Scenario
RR of ME after CPOE Implementation
Normal (mean, standard deviation)
0.46, 0.07143 See text and tables.

7
Table 2: Cost Parameters Used in Decision Model
Variable Distribution Parameter Values Source
Both Paper and CPOE‐CDS Scenarios
Medical Care Resource Use per Medication Error without pADE
Pharmacist Time
Single Value 0.17 hours (10 minutes) Assumption
Physician Time Single Value 0.33 hours (20 minutes) Assumption
Medical Care Costs to Society per pADE
Ratio of Expenditures to Costs for Hospital Care (Aggregate Operating Margin)
Single Value 1.044 American Hospital Association Chartbook 2010 (9)
Costs of pADEs to Hospitals
Fatal, Life Threatening, Disabling
Triangular (peak, range)
$7,307; $270 to $14,343 See text and tables; Hug 2012 (10)
Serious Triangular (peak, range)
$3,282; $282 to $8,294 See text and tables; Hug 2012 (10)
Significant Triangular (peak, range)
$2,987; $282 to $8,294 See text and tables; Hug 2012 (10)
Physician Inpatient Care
Single value Multiply hospitalization costs for each type of pADE by 1.033 to include both hospital care and inpatient physician care costs
Thomas 1999 (11)
Post‐Discharge Care for Disabling pADEs
Triangular (peak, range)
0.78, 0.25 to 1.25 times hospitalization cost for disabling pADEs
Thomas 1999 (11)
Hours of Care by Family Members per Day while in Hospital after pADE
Single value 24
8
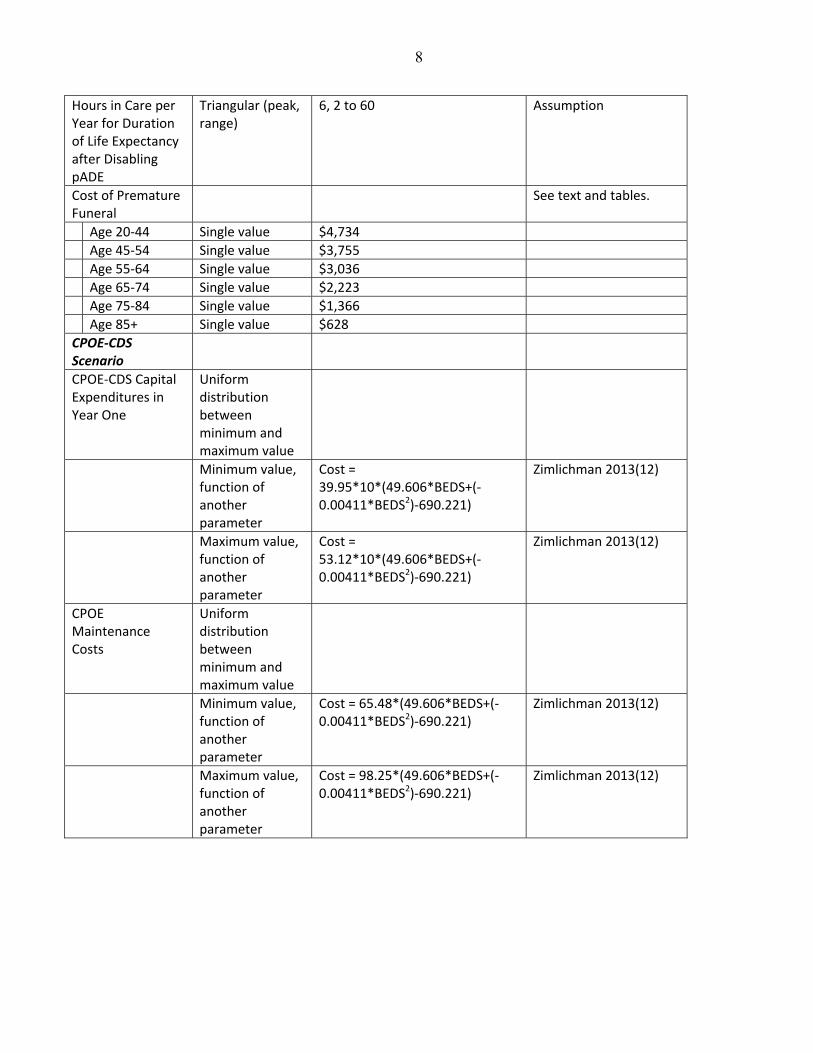
Hours in Care per Year for Duration of Life Expectancy after Disabling pADE
Triangular (peak, range)
6, 2 to 60 Assumption
Cost of Premature Funeral
See text and tables.
Age 20‐44 Single value $4,734
Age 45‐54 Single value $3,755
Age 55‐64 Single value $3,036
Age 65‐74 Single value $2,223
Age 75‐84 Single value $1,366
Age 85+ Single value $628
CPOE‐CDS Scenario
CPOE‐CDS Capital Expenditures in Year One
Uniform distribution between minimum and maximum value
Minimum value, function of another parameter
Cost = 39.95*10*(49.606*BEDS+(‐0.00411*BEDS2)‐690.221)
Zimlichman 2013(12)
Maximum value, function of another parameter
Cost = 53.12*10*(49.606*BEDS+(‐0.00411*BEDS2)‐690.221)
Zimlichman 2013(12)
CPOE Maintenance Costs
Uniform distribution between minimum and maximum value
Minimum value, function of another parameter
Cost = 65.48*(49.606*BEDS+(‐0.00411*BEDS2)‐690.221)
Zimlichman 2013(12)
Maximum value, function of another parameter
Cost = 98.25*(49.606*BEDS+(‐0.00411*BEDS2)‐690.221)
Zimlichman 2013(12)
9
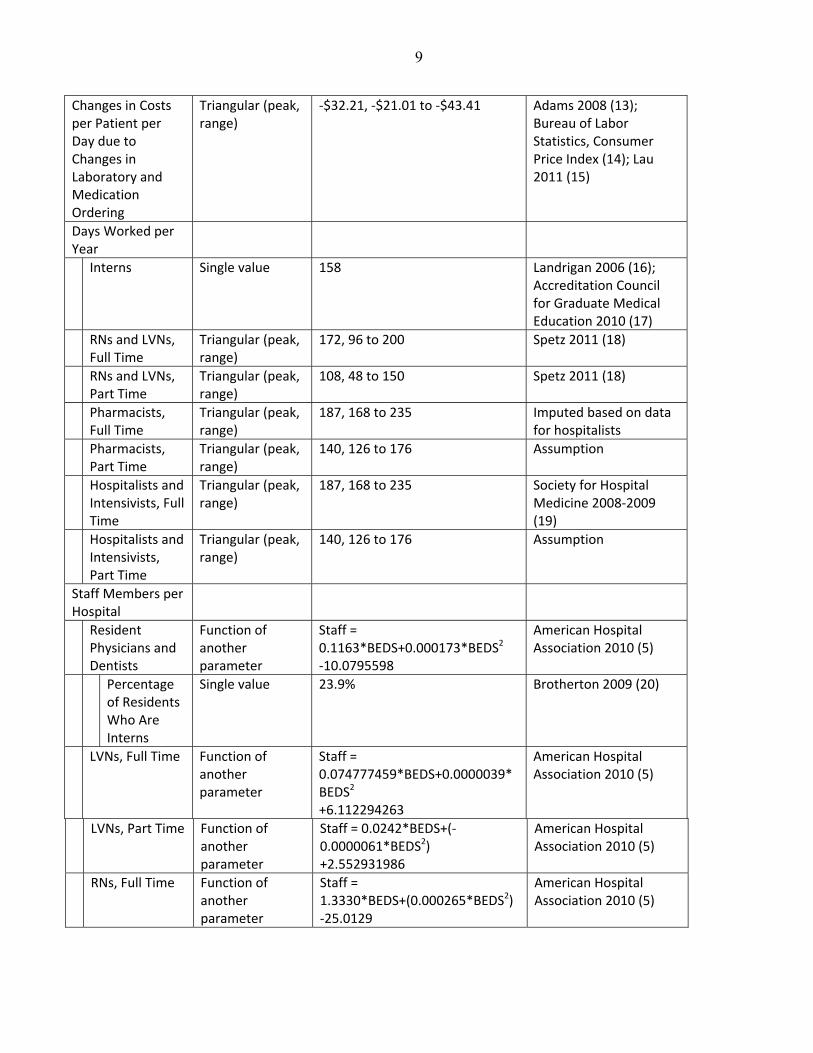
Changes in Costs per Patient per Day due to Changes in Laboratory and Medication Ordering
Triangular (peak, range)
‐$32.21, ‐$21.01 to ‐$43.41 Adams 2008 (13); Bureau of Labor Statistics, Consumer Price Index (14); Lau 2011 (15)
Days Worked per Year
Interns Single value 158 Landrigan 2006 (16); Accreditation Council for Graduate Medical Education 2010 (17)
RNs and LVNs, Full Time
Triangular (peak, range)
172, 96 to 200 Spetz 2011 (18)
RNs and LVNs, Part Time
Triangular (peak, range)
108, 48 to 150 Spetz 2011 (18)
Pharmacists, Full Time
Triangular (peak, range)
187, 168 to 235 Imputed based on data for hospitalists
Pharmacists, Part Time
Triangular (peak, range)
140, 126 to 176 Assumption
Hospitalists and Intensivists, Full Time
Triangular (peak, range)
187, 168 to 235 Society for Hospital Medicine 2008‐2009 (19)
Hospitalists and Intensivists, Part Time
Triangular (peak, range)
140, 126 to 176 Assumption
Staff Members per Hospital
Resident Physicians and Dentists
Function of another parameter
Staff = 0.1163*BEDS+0.000173*BEDS2
‐10.0795598
American Hospital Association 2010 (5)
Percentage of Residents Who Are Interns
Single value 23.9% Brotherton 2009 (20)
LVNs, Full Time Function of another parameter
Staff = 0.074777459*BEDS+0.0000039*BEDS2 +6.112294263
American Hospital Association 2010 (5)
LVNs, Part Time Function of another parameter
Staff = 0.0242*BEDS+(‐0.0000061*BEDS2)
+2.552931986
American Hospital Association 2010 (5)
RNs, Full Time Function of another parameter
Staff = 1.3330*BEDS+(0.000265*BEDS2) ‐25.0129
American Hospital Association 2010 (5)

10
RNs, Part Time Function of another parameter
Staff = 0.72101308*BEDS+(‐0.000204914*BEDS2) ‐13.8234022
American Hospital Association 2010 (5)
Pharmacists, Full Time
Function of another parameter
Staff = 0.0540*BEDS+0.0000159*BEDS2 ‐0.678398195
American Hospital Association 2010 (5)
Pharmacists, Part Time
Function of another parameter
Staff = 0.0200*BEDS+(‐0.00000093*BEDS2) ‐0.035390812
American Hospital Association 2010 (5)
FTE Hospitalists + Intensivists
Function of another parameter
Staff = 0.04513*BEDS+0.000009174*BEDS2+7.205092678
American Hospital Association 2010 (5)
Hourly Wages
Interns Single value $14.17 American Association of Medical Colleges 2008 (21)
LVNs Single value $18.88 Bureau of Labor Statistics, National Compensation Survey 2009 (22)
RNs Single value $32.76 Bureau of Labor Statistics, National Compensation Survey 2009 (22)
Pharmacists Single value $52.49 Bureau of Labor Statistics, National Compensation Survey 2009 (22)
Hospital Physicians
Single value $83.99 Bureau of Labor Statistics, National Compensation Survey 2009 (22)
General Population
Single value $20.99 Bureau of Labor Statistics, National Compensation Survey 2009 (22)
Wage Benefit Multiplier
Interns Single value 1.32 American Association of Medical Colleges 2008 (21)
All Others Single value 1.517 Employer Cost of Employee Compensation 2009 (23)
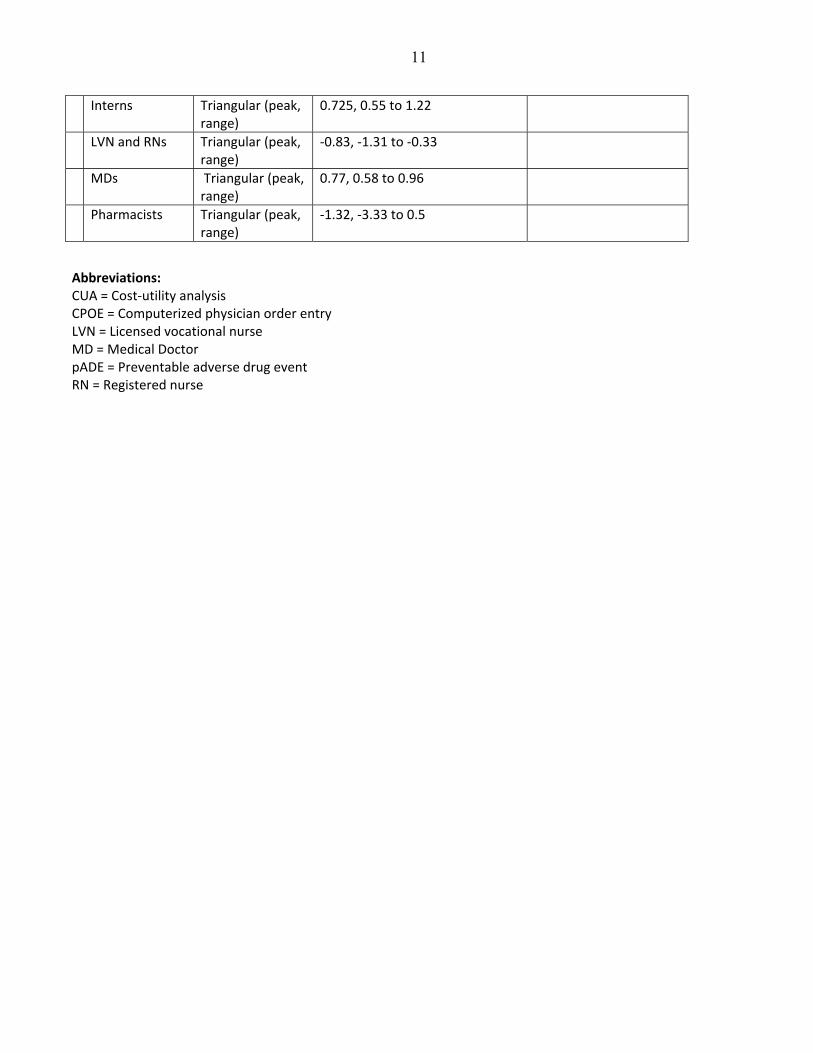
Effects of CPOE on Workflow
See text and tables.
11
Interns Triangular (peak, range)
0.725, 0.55 to 1.22
LVN and RNs Triangular (peak, range)
‐0.83, ‐1.31 to ‐0.33
MDs Triangular (peak, range)
0.77, 0.58 to 0.96
Pharmacists Triangular (peak, range)
‐1.32, ‐3.33 to 0.5
Abbreviations: CUA = Cost‐utility analysis CPOE = Computerized physician order entry LVN = Licensed vocational nurse MD = Medical Doctor pADE = Preventable adverse drug event RN = Registered nurse
12
Section 2: Creating the Decision Model
We developed the decision (probability) model comparing computerized provider order entry (CPOE) with paper ordering systems. Paper ordering systems generally entail having physicians, nurse practitioners, physician assistants, and any other providers who write orders create an order by writing it on paper sheets, placing the sheets into a paper chart (often a notebook format chart) or hand it directly to the unit clerk, who then communicates the existence of the order to the nurse and, if a medication is involved, the pharmacy. The clerk may need to copy (transcribe) the order into a different interface before transmitting it to the pharmacy, or may simply fax the order. For medications, the pharmacist prepares the medication, notifies the nurse when it is ready, and then the nurse administers the medication. Computerized provider order entry involves having providers directly enter orders through the computer rather than writing them on paper. Transcribing the order is generally unnecessary with CPOE. In its most basic form, CPOE eliminates problems with handwriting and its interpretation, and copying errors involved in transcription. New types of errors can occur, however, such as selecting the wrong patient, drug, or dose from electronic menus. Clinical decision support systems are available with various degrees of sophistication. The purpose of these systems is to detect specific types of errors, such as allergies to a medication that a provider is trying to prescribe, drug‐drug interactions, or other contra‐indications to medications. In a recently published systematic review, we found no significant difference in effectiveness between studies with and without clinical decision support.(24) We included parameters reflecting the use of CPOE with clinical decision support (CDS) systems, whenever such data were available, and also used relevant data for CPOE without CDS. The probability model compared the likelihood of medication errors and preventable adverse drug events (pADEs) with paper‐based ordering vs. ordering using CPOE. It focused on the proportion of admitted patients who experience one or more medication errors, the proportion of medication errors resulting in patient harm (i.e., pADEs), and the proportion of patients with adverse drug events who experience various outcomes. Creating model was an iterative process. As we created draft models, we conducted literature searches to identify relevant model parameters. The model is designed so that unit of analysis is the individual hospital admission, or patient. Individual patients enter the model and experience various clinical events with different probabilities. However, multiplying the individual‐level events by the number of hospital admissions per year scales the model to the hospital level. This was appropriate because CPOE often is implemented (or not) on a hospital‐wide basis. In addition, current federal policies are incentivizing hospital‐level purchasing decisions. Consequently, our objective was to model the economic implications of implementing CPOE in individual hospitals. The number of admissions per year or the number of beds in the hospital was the basis for scaling many parameters in the model. We used TreeAge Pro 2012 to develop the probability model. Tables above summarize the parameter values used in the base case analysis, including the distributions of probabilities used in the Monte Carlo analyses. For parameter involving either variability across hospitals or uncertainty about the true value of the parameter, we created a distribution of probabilities. Where feasible, the distribution of probabilities was based on a representative sample, such as a national sample of hospitals. Other parameters were based on assemblages of studies, each offering different values for a particular parameter. In the latter situation, we created a triangular distribution of probabilities for the parameter, where the range was based on the minimum and maximum

13
values offered by the various studies and the peak was based on the median value. Exceptions to this pattern occur on a case‐by‐case basis, as described below. In compiling the various costs and benefits of CPOE, we allocated capital expenditures associated with the purchase of CPOE to the first year (i.e., without discounting). We assumed that the changes in costs that would occur through changes in workflow and laboratory and medication ordering would occur each year. We also assumed that pADE rates would change each year. Maintenance costs were excluded from the first year but were included in each subsequent year.
14
Section 3: Searching the Literature
To identify model parameters, we conducted two reviews of the literature. First, we reviewed the literature on CPOE, including its effectiveness and costs. Second, we reviewed the literature on medication errors and adverse drug events and their associated costs. Searching for Articles on Medication Error Rates and CPOE Effectiveness The systematic review and meta‐analysis associated with this study includes search terms, databases, inclusion criteria, information about eligible studies.(24) To perform this analysis using the probability model described earlier, we needed to obtain data relevant to the following model parameters:
1. For paper‐based order entry, a. Baseline proportion of hospitalized patients experiencing medication errors, b. Baseline proportion of patients with medication errors going on to experience pADE, c. Baseline severities of the outcomes of experienced by patients with pADEs
2. For CPOE, a. Relative risk of medication errors with CPOE vs. paper‐based order entry
The meta‐analysis answers the question of how effective CPOE is at reducing medication errors and preventable adverse drug events. We also identified data relevant to the other parameters above, to the degree possible, from studies addressing the effectiveness of CPOE, including those with and without CDS. Studies conducted outside the context of examining the effectiveness of CPOE are likely to have used different methods for studying these events, and may study a subset of events less relevant to CPOE systems. Using the same set of studies to identify the above model parameters provided greater methodological consistency.
Searching for Information on CPOE‐related Costs Including Capital and Maintenance Costs Using the search strategy as for assessing CPOE effectiveness, we identified articles, reports, and weblinks on costs relevant to CPOE, including: the cost of purchasing, implementing, and maintaining CPOE systems; the effects of CPOE on workflow or efficiency; changes in ordering patterns that affect costs; or any other costs or cost‐offsets associated with CPOE. We sought articles, reports, and web materials meeting the following criteria:
1. Addressed the costs to one or more of the stakeholders associated with the implementation of CPOE, 2. Addressed the effects that CPOE has on the workflow of individuals who work in hospitals, or 3. Addressed cost‐offsets that may occur through the implementation of CPOE.
First, we conducted a PubMed search within our general collection of articles on CPOE, using the search terms in the Table below, to identify potentially relevant articles. Two reviewers independently reviewed each title, followed by abstract and article to identify relevant articles. Second, we reviewed non‐peer‐reviewed reports obtained through the various websites. We included these sources because the business executives leading hospitals may not see a need to publish its findings in the medical literature, but may commission consultant reports or choose to share experiences with other executives through other venues. We selected articles for inclusion in the final analysis, considering the following attributes:
15
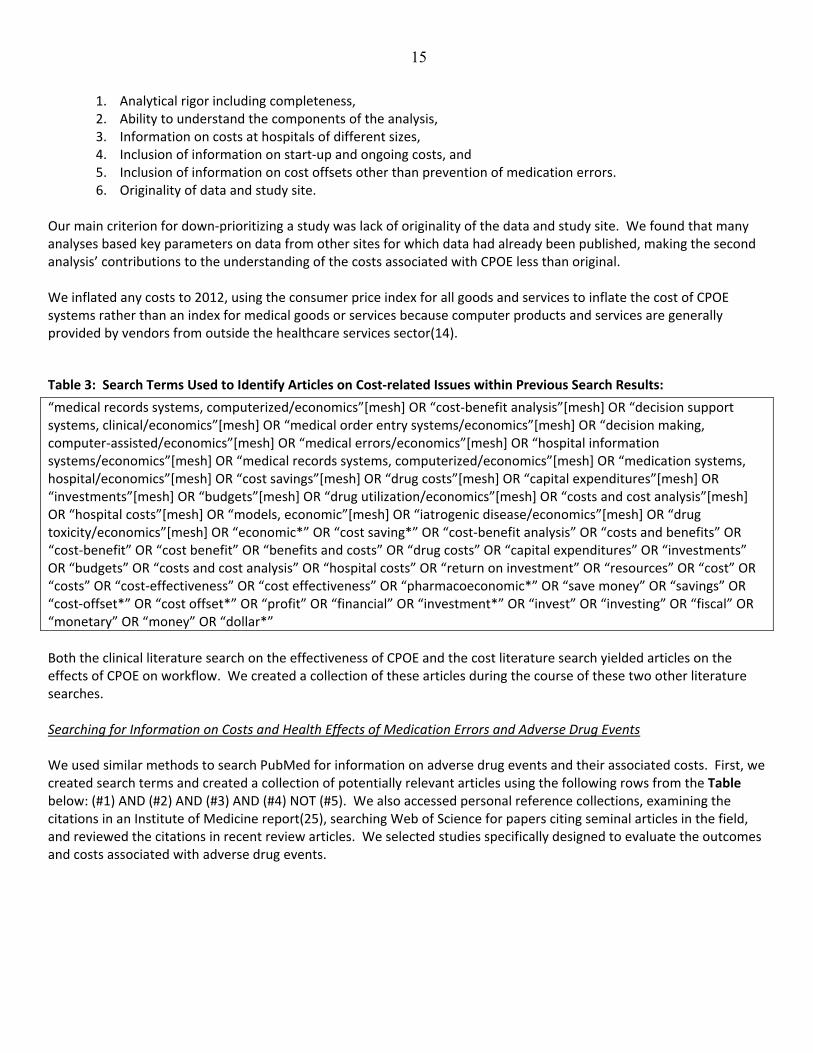
1. Analytical rigor including completeness, 2. Ability to understand the components of the analysis, 3. Information on costs at hospitals of different sizes, 4. Inclusion of information on start‐up and ongoing costs, and 5. Inclusion of information on cost offsets other than prevention of medication errors. 6. Originality of data and study site.
Our main criterion for down‐prioritizing a study was lack of originality of the data and study site. We found that many analyses based key parameters on data from other sites for which data had already been published, making the second analysis’ contributions to the understanding of the costs associated with CPOE less than original. We inflated any costs to 2012, using the consumer price index for all goods and services to inflate the cost of CPOE systems rather than an index for medical goods or services because computer products and services are generally provided by vendors from outside the healthcare services sector(14).
Table 3: Search Terms Used to Identify Articles on Cost‐related Issues within Previous Search Results:
“medical records systems, computerized/economics”[mesh] OR “cost‐benefit analysis”[mesh] OR “decision support systems, clinical/economics”[mesh] OR “medical order entry systems/economics”[mesh] OR “decision making, computer‐assisted/economics”[mesh] OR “medical errors/economics”[mesh] OR “hospital information systems/economics”[mesh] OR “medical records systems, computerized/economics”[mesh] OR “medication systems, hospital/economics”[mesh] OR “cost savings”[mesh] OR “drug costs”[mesh] OR “capital expenditures”[mesh] OR “investments”[mesh] OR “budgets”[mesh] OR “drug utilization/economics”[mesh] OR “costs and cost analysis”[mesh] OR “hospital costs”[mesh] OR “models, economic”[mesh] OR “iatrogenic disease/economics”[mesh] OR “drug toxicity/economics”[mesh] OR “economic*” OR “cost saving*” OR “cost‐benefit analysis” OR “costs and benefits” OR “cost‐benefit” OR “cost benefit” OR “benefits and costs” OR “drug costs” OR “capital expenditures” OR “investments” OR “budgets” OR “costs and cost analysis” OR “hospital costs” OR “return on investment” OR “resources” OR “cost” OR “costs” OR “cost‐effectiveness” OR “cost effectiveness” OR “pharmacoeconomic*” OR “save money” OR “savings” OR “cost‐offset*” OR “cost offset*” OR “profit” OR “financial” OR “investment*” OR “invest” OR “investing” OR “fiscal” OR “monetary” OR “money” OR “dollar*”
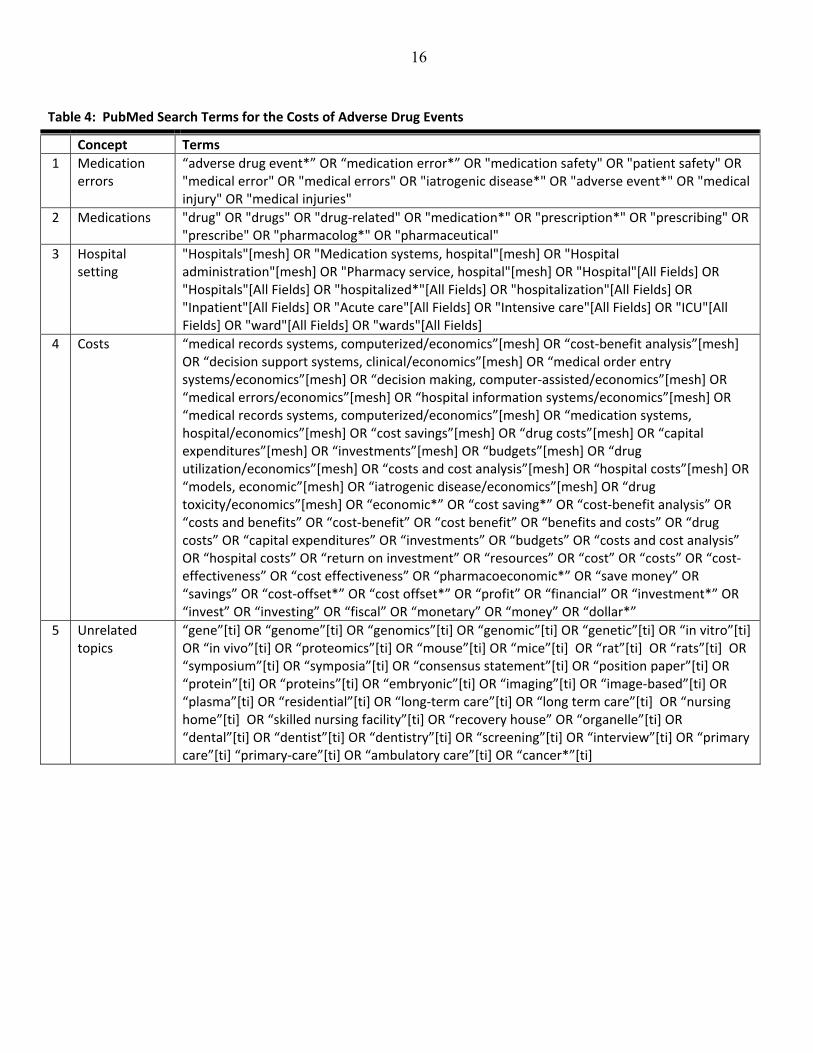
Both the clinical literature search on the effectiveness of CPOE and the cost literature search yielded articles on the effects of CPOE on workflow. We created a collection of these articles during the course of these two other literature searches. Searching for Information on Costs and Health Effects of Medication Errors and Adverse Drug Events We used similar methods to search PubMed for information on adverse drug events and their associated costs. First, we created search terms and created a collection of potentially relevant articles using the following rows from the Table below: (#1) AND (#2) AND (#3) AND (#4) NOT (#5). We also accessed personal reference collections, examining the citations in an Institute of Medicine report(25), searching Web of Science for papers citing seminal articles in the field, and reviewed the citations in recent review articles. We selected studies specifically designed to evaluate the outcomes and costs associated with adverse drug events.
16
Table 4: PubMed Search Terms for the Costs of Adverse Drug Events
Concept Terms
1 Medication errors
“adverse drug event*” OR “medication error*” OR "medication safety" OR "patient safety" OR "medical error" OR "medical errors" OR "iatrogenic disease*" OR "adverse event*" OR "medical injury" OR "medical injuries"
2 Medications "drug" OR "drugs" OR "drug‐related" OR "medication*" OR "prescription*" OR "prescribing" OR "prescribe" OR "pharmacolog*" OR "pharmaceutical"
3 Hospital setting
"Hospitals"[mesh] OR "Medication systems, hospital"[mesh] OR "Hospital administration"[mesh] OR "Pharmacy service, hospital"[mesh] OR "Hospital"[All Fields] OR "Hospitals"[All Fields] OR "hospitalized*"[All Fields] OR "hospitalization"[All Fields] OR "Inpatient"[All Fields] OR "Acute care"[All Fields] OR "Intensive care"[All Fields] OR "ICU"[All Fields] OR "ward"[All Fields] OR "wards"[All Fields]
4 Costs “medical records systems, computerized/economics”[mesh] OR “cost‐benefit analysis”[mesh] OR “decision support systems, clinical/economics”[mesh] OR “medical order entry systems/economics”[mesh] OR “decision making, computer‐assisted/economics”[mesh] OR “medical errors/economics”[mesh] OR “hospital information systems/economics”[mesh] OR “medical records systems, computerized/economics”[mesh] OR “medication systems, hospital/economics”[mesh] OR “cost savings”[mesh] OR “drug costs”[mesh] OR “capital expenditures”[mesh] OR “investments”[mesh] OR “budgets”[mesh] OR “drug utilization/economics”[mesh] OR “costs and cost analysis”[mesh] OR “hospital costs”[mesh] OR “models, economic”[mesh] OR “iatrogenic disease/economics”[mesh] OR “drug toxicity/economics”[mesh] OR “economic*” OR “cost saving*” OR “cost‐benefit analysis” OR “costs and benefits” OR “cost‐benefit” OR “cost benefit” OR “benefits and costs” OR “drug costs” OR “capital expenditures” OR “investments” OR “budgets” OR “costs and cost analysis” OR “hospital costs” OR “return on investment” OR “resources” OR “cost” OR “costs” OR “cost‐effectiveness” OR “cost effectiveness” OR “pharmacoeconomic*” OR “save money” OR “savings” OR “cost‐offset*” OR “cost offset*” OR “profit” OR “financial” OR “investment*” OR “invest” OR “investing” OR “fiscal” OR “monetary” OR “money” OR “dollar*”
5 Unrelated topics
“gene”[ti] OR “genome”[ti] OR “genomics”[ti] OR “genomic”[ti] OR “genetic”[ti] OR “in vitro”[ti] OR “in vivo”[ti] OR “proteomics”[ti] OR “mouse”[ti] OR “mice”[ti] OR “rat”[ti] OR “rats”[ti] OR “symposium”[ti] OR “symposia”[ti] OR “consensus statement”[ti] OR “position paper”[ti] OR “protein”[ti] OR “proteins”[ti] OR “embryonic”[ti] OR “imaging”[ti] OR “image‐based”[ti] OR “plasma”[ti] OR “residential”[ti] OR “long‐term care”[ti] OR “long term care”[ti] OR “nursing home”[ti] OR “skilled nursing facility”[ti] OR “recovery house” OR “organelle”[ti] OR “dental”[ti] OR “dentist”[ti] OR “dentistry”[ti] OR “screening”[ti] OR “interview”[ti] OR “primary care”[ti] “primary‐care”[ti] OR “ambulatory care”[ti] OR “cancer*”[ti]
17
Section 4: Estimating Medication Error Rates and CPOE Effectiveness
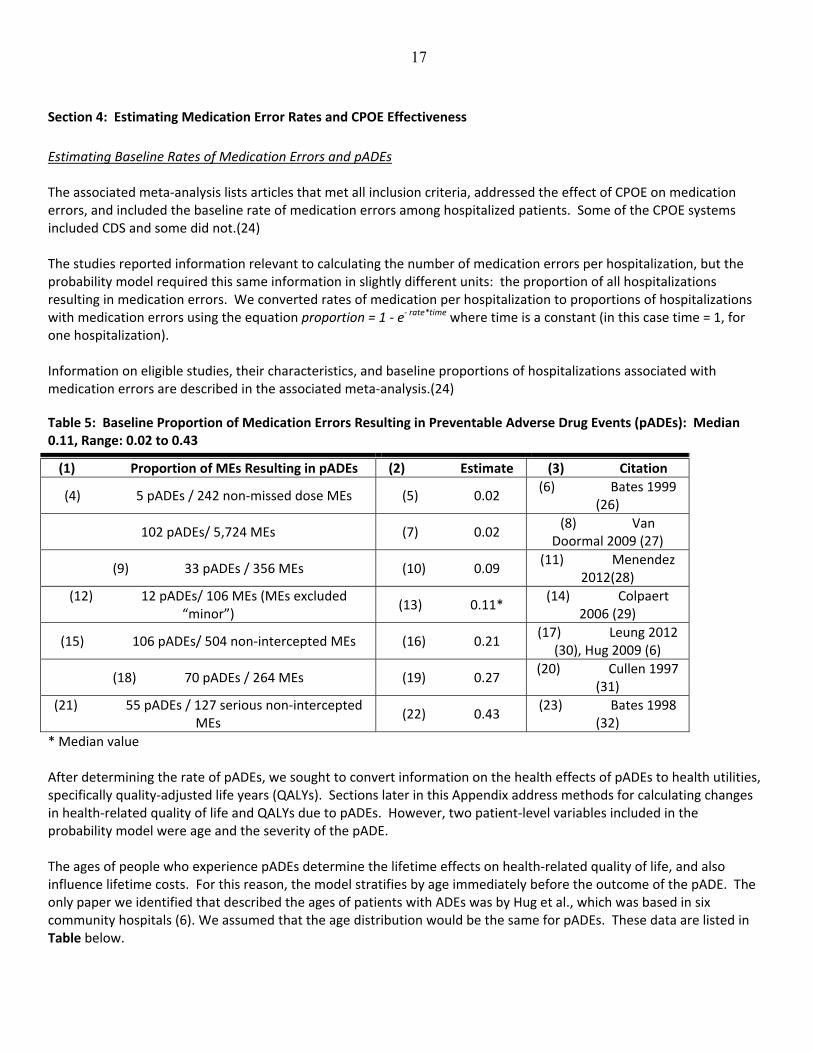
Estimating Baseline Rates of Medication Errors and pADEs The associated meta‐analysis lists articles that met all inclusion criteria, addressed the effect of CPOE on medication errors, and included the baseline rate of medication errors among hospitalized patients. Some of the CPOE systems included CDS and some did not.(24) The studies reported information relevant to calculating the number of medication errors per hospitalization, but the probability model required this same information in slightly different units: the proportion of all hospitalizations resulting in medication errors. We converted rates of medication per hospitalization to proportions of hospitalizations with medication errors using the equation proportion = 1 ‐ e‐ rate*time where time is a constant (in this case time = 1, for one hospitalization). Information on eligible studies, their characteristics, and baseline proportions of hospitalizations associated with medication errors are described in the associated meta‐analysis.(24)
Table 5: Baseline Proportion of Medication Errors Resulting in Preventable Adverse Drug Events (pADEs): Median 0.11, Range: 0.02 to 0.43
(1) Proportion of MEs Resulting in pADEs (2) Estimate (3) Citation
(4) 5 pADEs / 242 non‐missed dose MEs (5) 0.02 (6) Bates 1999
(26)
102 pADEs/ 5,724 MEs (7) 0.02 (8) Van
Doormal 2009 (27)
(9) 33 pADEs / 356 MEs (10) 0.09 (11) Menendez
2012(28)
(12) 12 pADEs/ 106 MEs (MEs excluded “minor”)
(13) 0.11* (14) Colpaert
2006 (29)
(15) 106 pADEs/ 504 non‐intercepted MEs (16) 0.21 (17) Leung 2012
(30), Hug 2009 (6)
(18) 70 pADEs / 264 MEs (19) 0.27 (20) Cullen 1997
(31)
(21) 55 pADEs / 127 serious non‐intercepted MEs
(22) 0.43 (23) Bates 1998
(32)
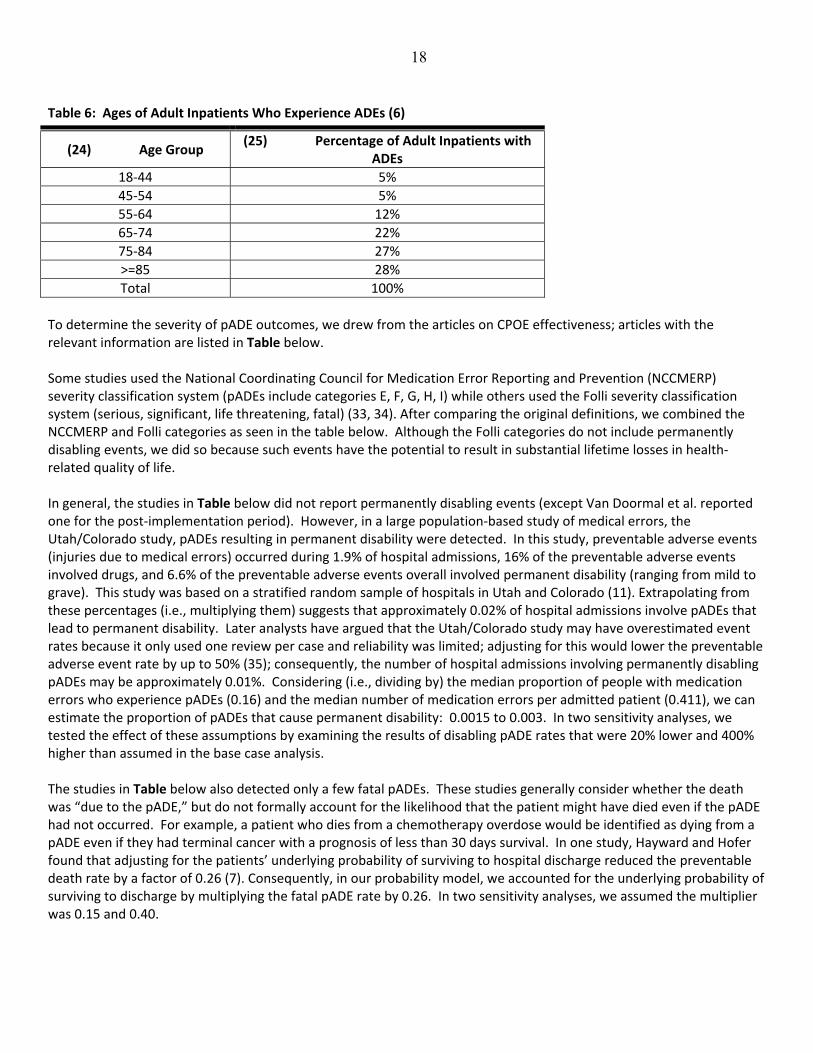
* Median value After determining the rate of pADEs, we sought to convert information on the health effects of pADEs to health utilities, specifically quality‐adjusted life years (QALYs). Sections later in this Appendix address methods for calculating changes in health‐related quality of life and QALYs due to pADEs. However, two patient‐level variables included in the probability model were age and the severity of the pADE. The ages of people who experience pADEs determine the lifetime effects on health‐related quality of life, and also influence lifetime costs. For this reason, the model stratifies by age immediately before the outcome of the pADE. The only paper we identified that described the ages of patients with ADEs was by Hug et al., which was based in six community hospitals (6). We assumed that the age distribution would be the same for pADEs. These data are listed in Table below.
18
Table 6: Ages of Adult Inpatients Who Experience ADEs (6)
(24) Age Group (25) Percentage of Adult Inpatients with
ADEs
18‐44 5%
45‐54 5%
55‐64 12%
65‐74 22%
75‐84 27%
>=85 28%
Total 100%
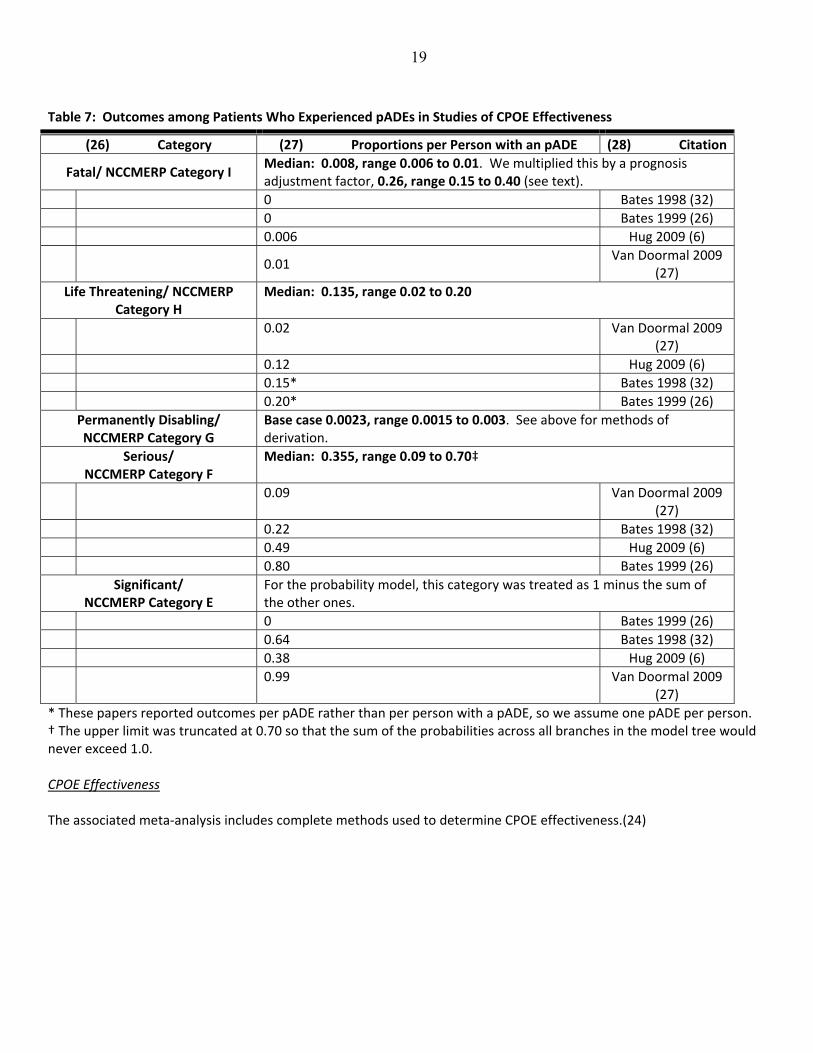
To determine the severity of pADE outcomes, we drew from the articles on CPOE effectiveness; articles with the relevant information are listed in Table below. Some studies used the National Coordinating Council for Medication Error Reporting and Prevention (NCCMERP) severity classification system (pADEs include categories E, F, G, H, I) while others used the Folli severity classification system (serious, significant, life threatening, fatal) (33, 34). After comparing the original definitions, we combined the NCCMERP and Folli categories as seen in the table below. Although the Folli categories do not include permanently disabling events, we did so because such events have the potential to result in substantial lifetime losses in health‐related quality of life. In general, the studies in Table below did not report permanently disabling events (except Van Doormal et al. reported one for the post‐implementation period). However, in a large population‐based study of medical errors, the Utah/Colorado study, pADEs resulting in permanent disability were detected. In this study, preventable adverse events (injuries due to medical errors) occurred during 1.9% of hospital admissions, 16% of the preventable adverse events involved drugs, and 6.6% of the preventable adverse events overall involved permanent disability (ranging from mild to grave). This study was based on a stratified random sample of hospitals in Utah and Colorado (11). Extrapolating from these percentages (i.e., multiplying them) suggests that approximately 0.02% of hospital admissions involve pADEs that lead to permanent disability. Later analysts have argued that the Utah/Colorado study may have overestimated event rates because it only used one review per case and reliability was limited; adjusting for this would lower the preventable adverse event rate by up to 50% (35); consequently, the number of hospital admissions involving permanently disabling pADEs may be approximately 0.01%. Considering (i.e., dividing by) the median proportion of people with medication errors who experience pADEs (0.16) and the median number of medication errors per admitted patient (0.411), we can estimate the proportion of pADEs that cause permanent disability: 0.0015 to 0.003. In two sensitivity analyses, we tested the effect of these assumptions by examining the results of disabling pADE rates that were 20% lower and 400% higher than assumed in the base case analysis. The studies in Table below also detected only a few fatal pADEs. These studies generally consider whether the death was “due to the pADE,” but do not formally account for the likelihood that the patient might have died even if the pADE had not occurred. For example, a patient who dies from a chemotherapy overdose would be identified as dying from a pADE even if they had terminal cancer with a prognosis of less than 30 days survival. In one study, Hayward and Hofer found that adjusting for the patients’ underlying probability of surviving to hospital discharge reduced the preventable death rate by a factor of 0.26 (7). Consequently, in our probability model, we accounted for the underlying probability of surviving to discharge by multiplying the fatal pADE rate by 0.26. In two sensitivity analyses, we assumed the multiplier was 0.15 and 0.40.
19
Table 7: Outcomes among Patients Who Experienced pADEs in Studies of CPOE Effectiveness
(26) Category (27) Proportions per Person with an pADE (28) Citation
Fatal/ NCCMERP Category I Median: 0.008, range 0.006 to 0.01. We multiplied this by a prognosis adjustment factor, 0.26, range 0.15 to 0.40 (see text).
0 Bates 1998 (32)
0 Bates 1999 (26)
0.006 Hug 2009 (6)
0.01 Van Doormal 2009
(27)
Life Threatening/ NCCMERP Category H
Median: 0.135, range 0.02 to 0.20
0.02 Van Doormal 2009
(27)
0.12 Hug 2009 (6)
0.15* Bates 1998 (32)
0.20* Bates 1999 (26)
Permanently Disabling/ NCCMERP Category G
Base case 0.0023, range 0.0015 to 0.003. See above for methods of derivation.
Serious/ NCCMERP Category F
Median: 0.355, range 0.09 to 0.70‡
0.09 Van Doormal 2009
(27)
0.22 Bates 1998 (32)
0.49 Hug 2009 (6)
0.80 Bates 1999 (26)
Significant/ NCCMERP Category E
For the probability model, this category was treated as 1 minus the sum of the other ones.
0 Bates 1999 (26)
0.64 Bates 1998 (32)
0.38 Hug 2009 (6)
0.99 Van Doormal 2009
(27)
* These papers reported outcomes per pADE rather than per person with a pADE, so we assume one pADE per person. † The upper limit was truncated at 0.70 so that the sum of the probabilities across all branches in the model tree would never exceed 1.0. CPOE Effectiveness The associated meta‐analysis includes complete methods used to determine CPOE effectiveness.(24)
20
Section 5: Estimating CPOE‐related Costs
Estimating CPOE Capital and Maintenance Costs We identified several original papers that described the capital and maintenance costs associated with adding CPOE to an existing EHR system, which is, arguably, one way of estimating the marginal cost associated with CPOE. The cost studies did not distinguish between CPOE systems with and without CDS. One study, by Ohsfeldt et al., estimated costs by contacting 74 hospitals and included estimates for several different size hospitals and created equations that enabled the precise estimation of costs for hospitals of various bed sizes; however, this study was based on data from 2001.(36) Ohsfeldt et al. estimated costs for urban, rural, rural referral, and critical access hospitals in Iowa. The authors surveyed the Chief Executive Officer, Chief Information Officer, or Information Technology (IT) department heads of 74 hospitals from all across Iowa. Seventy‐four hospitals completed the survey, which represented a 64% response rate (the survey was sent to 114 hospitals). The size of the hospitals in the survey ranged from 13 beds to 679 beds per hospital. The authors collaborated with an IT vendor to estimate the cost of CPOE based on survey results. The authors considered the possibility that the hospitals had an existing clinical information system (electronic health record) system, and the possibility that they did not. Hospital type, bed size, and the presence or absence of clinical information system was factored in when estimating the capital and operating costs of CPOE. The estimates for hospitals with 100 or fewer beds assume that smaller hospitals would work together as a purchasing cooperative to reduce costs. They created equations estimating costs as a function of beds plus beds‐squared. For hospitals with and hospitals without existing health record systems, they created equations modeling a lower estimate and a higher estimate for capital expenditures and a lower estimate and a higher estimate for annual maintenance costs. Then they conducted sensitivity analyses in which the fixed costs (i.e., capital expenditures) were 50% higher and marginal costs (i.e., annual maintenance costs) were 25% higher than expected, as well as the converse, 50% and 25% lower than expected, respectively (36). We used the first set of equations in our base case analysis, and the latter set in one of our single‐variable sensitivity analyses. A second study by Zimlichman et al. reported costs for implementing CPOE in 4 hospitals with 100‐300 beds and reported cost per admission (12) for two pairs of hospitals. To apply these estimates in the model, we created a weighted average cost per admission, and then used the equation that estimated admissions per year based on hospital bed size. Because this equation included both a beds and beds‐squared term, the equation for estimating CPOE implementation costs did also. Adams et al. represents a report from the Massachusetts Technology Collaborative and the New England Healthcare Institute in collaboration with First Consulting Group. They estimate the cost of implementing CPOE at a 500 bed hospital and provided scaled down costs for 150 and 250 bed hospitals. Cost figures were originally reported in 2003 dollars (37). The authors made a key assumption that the hospital in question has an existing clinical information system in place and no network upgrades are necessary. The three mutually exclusive scenarios for CPOE installation are:
a. The hospital can use the same vendor to install a CPOE system, thereby adding on to its existing clinical information system;
b. The hospital can use a different vendor to add a CPOE module to ‘wraparound’ its existing clinical information system. This solution works whether the existing clinical information system was purchased from an outside vendor or “homegrown” (a system created de novo for an individual hospital).
c. The hospital can purchase a new clinical information system, and with that acquire a CPOE system bundled with the clinical information system. While Adams assumed that this would replace an existing clinical information system, this would be the cost for organizations that have yet to implement a clinical information system (37).
21
It appears that the cost data was collected by studying data from one community and five academic hospitals, on the basis of a separate report published by First Consulting Group in 2003, and citing the same implementation costs for option “a” above (38). A report by the Congressional Budget Office extrapolated from a different 2003 First Consulting Group report that estimated costs in 2001 dollars. First Consulting Group created a model of costs based on experiences at five hospitals, estimating that, at a 500‐bed hospital, capital expenditures would be $7.9 million and maintenance costs $1.35 million per year. At a 250‐bed hospital, capital expenditures would be $3 million and maintenance costs $700,000. (82) On the basis of these estimates, the Congressional Budget Office estimated that capital expenditures were an average of $14,500 per bed, ($18,940 inflated to 2012 dollars) and annual maintenance costs $2,700 ($3527 in 2012 dollars).(14,41) Birkmeyer el al. collaborated with a health IT vendor to obtain cost data for hospitals ranging from 200 beds up to 1000 beds (39), but reported costs for only hospitals of those two sizes. Cost figures were reported in 2000 dollars. The authors did not provide information about the types or locations of the hospitals. The authors explain three mutually exclusive scenarios for CPOE installation, which are described immediately below. The author made several assumptions about the minimum system and IT infrastructure requirements needed to support CPOE installation, based on documents published in 2000 by the Leapfrog Group, which we were unable to locate. The three scenarios, which are somewhat similar to those by Adams et al, include:
a. The hospital has a clinical information system with a CPOE module that is currently inactive and needs to pay the vendor to activate it;
b. The hospital has a clinical information system that lacks a CPOE module. In this case, the hospital will need to be purchased a CPOE system from either the same or different vendor. This is similar to Adams’ scenarios “a” and “b” above;
c. The hospital has no clinical information system at all and will need to purchase a clinical information system with electronic order capabilities. The scenario is most similar to Adams’ scenario “c” above.
The analysis by Kaushal et al. was based on the CPOE system at Brigham and Women’s hospital in Massachusetts, a 720‐bed hospital. Of the four articles, it was the only one that had a homegrown CPOE system already in place. The authors looked at the cost, and benefits, of CPOE implementation over ten years (1992‐2002). Cost data was obtained by reviewing internal documents and interviewing individuals involved in the implementation process. Capital costs were estimated for the first three years of implementation (1992‐1994) with 60 percent of the cost being attributed to the first year alone. Annual operation expenses were estimated from 1993 onwards. While details in calculating the capital costs were same as the other papers, no information was provided regarding the details of the annual operating costs (40). A few specific details about each study are worth noting:
1. Ohsfeldt et al. organized its cost data in four categories: Hardware and software purchase and upgrades, technical support, testing and training staff, and selection process. The authors have calculated the capital and operating costs using these categories (36).
2. In general, Adams, Birkmeyer, and Ohsfeldt appeared fairly consistent in regard to the parameters used to determine capital and ongoing expenditures. Adams et al. and Birkmeyer et al. provided details regarding initial and ongoing expenditure. Hardware and software purchase, licensing, training hospital staff members, technical support, consulting charges were included in initial costs.
3. Adams et al. assumed that the CPOE costs depend on the size of the hospital. The hospital is also assumed to have the necessary IT capabilities in place, i.e. no need for hardware or software upgrades and wireless devices. Costs for wireless network implementation are included (37).

22
4. Birkmeyer et al. also included network upgrades, content development, testing, and ordering catalogue charges as part of initial costs. Ongoing costs include annual maintenance of hardware equipment, maintain network connectivity, software license, and IT/non‐IT staffing (39).
5. Kaushal et al. included costs of hardware, such as computers and printers, software, leadership and training in the capital costs. Costs of clinical data repository and medication administration system are not included. Specific components of annual ongoing costs were not provided (40).
6. None of the studies examined the value of physician time when estimating costs of the system. Studies that included the costs of EHRs did not mention the cost of establishing and maintaining order sets; however, these are not included in all EHR systems. Tables below list capital expenditures, and recurring annual costs. We also looked for information on the useful lifespan of CPOE systems during our literature searches. The only published source we could find was a cost‐effectiveness analysis by Wu et al. (2). We contacted Bill Spooner, Senior Vice President and Chief Information Officer, Sharp HealthCare, San Diego, California, and Member, the College of Healthcare Information Management Executives (CHIME) (3). On the basis of these sources, we used ten years for the base case estimate and a range of eight to 20 years.
23
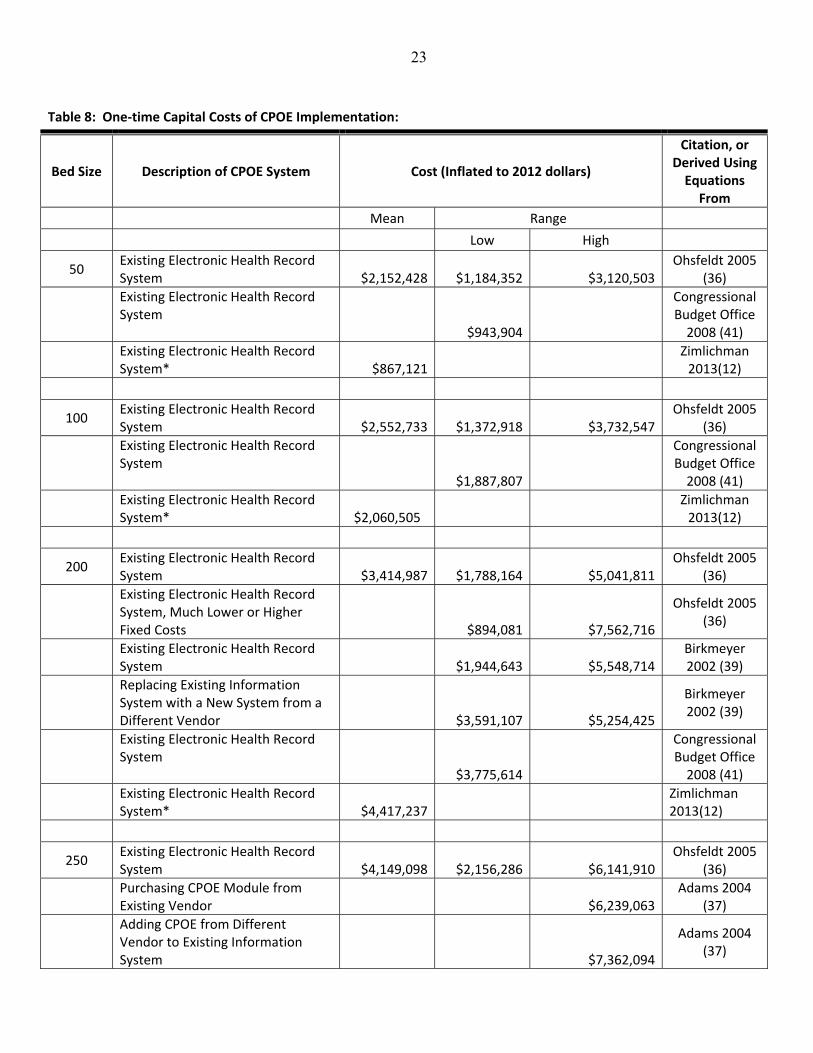
Table 8: One‐time Capital Costs of CPOE Implementation:
Bed Size Description of CPOE System Cost (Inflated to 2012 dollars)
Citation, or Derived Using Equations From
Mean Range
Low High
50 Existing Electronic Health Record System $2,152,428 $1,184,352 $3,120,503
Ohsfeldt 2005 (36)
Existing Electronic Health Record System
$943,904
Congressional Budget Office 2008 (41)
Existing Electronic Health Record System* $867,121
Zimlichman 2013(12)
100 Existing Electronic Health Record System $2,552,733 $1,372,918 $3,732,547
Ohsfeldt 2005 (36)
Existing Electronic Health Record System
$1,887,807
Congressional Budget Office 2008 (41)
Existing Electronic Health Record System* $2,060,505
Zimlichman 2013(12)
200 Existing Electronic Health Record System $3,414,987 $1,788,164 $5,041,811
Ohsfeldt 2005 (36)
Existing Electronic Health Record System, Much Lower or Higher Fixed Costs $894,081 $7,562,716
Ohsfeldt 2005 (36)
Existing Electronic Health Record System $1,944,643 $5,548,714
Birkmeyer 2002 (39)
Replacing Existing Information System with a New System from a Different Vendor $3,591,107 $5,254,425
Birkmeyer 2002 (39)
Existing Electronic Health Record System
$3,775,614
Congressional Budget Office 2008 (41)
Existing Electronic Health Record System* $4,417,237
Zimlichman 2013(12)
250 Existing Electronic Health Record System $4,149,098 $2,156,286 $6,141,910
Ohsfeldt 2005 (36)
Purchasing CPOE Module from Existing Vendor $6,239,063
Adams 2004 (37)
Adding CPOE from Different Vendor to Existing Information System $7,362,094
Adams 2004 (37)

24
Replacing the Existing Information System with a New System from a Different Vendor $11,230,315
Adams 2004 (37)
Existing Electronic Health Record System
$4,719,518
Congressional Budget Office 2008 (41)
Existing Electronic Health Record System* $5,580,586
Zimlichman 2013(12)
460 Existing Electronic Health Record System $6,041,516 $3,105,641 $8,977,389
Ohsfeldt 2005 (36)
Existing Electronic Health Record System
$8,683,913
Congressional Budget Office 2008 (41)
Existing Electronic Health Record System* $10,357,318
Zimlichman 2013(12)
500 Existing Electronic Health Record System $6,950,856 $3,573,207 $10,328,503
Ohsfeldt 2005 (36)
Purchasing CPOE Module from Existing Vendor $9,857,718
Adams 2004 (37)
Adding CPOE from Different Vendor to Existing Information System $11,916,613
Adams 2004 (37)
Replacing the Existing Information System with a New System from a Different Vendor $21,212,809
Adams 2004 (37)
Existing Electronic Health Record System
$9,439,036
Congressional Budget Office 2008 (41)
Existing Electronic Health Record System* $11,247,148
Zimlichman 2013(12)
720 Existing Electronic Health Record System $9,871,174 $5,101,282 $14,641,066
Ohsfeldt 2005 (36)
Existing Electronic Health Record System
$13,592,212
Congressional Budget Office 2008 (41)
Existing Electronic Health Record System* $16,026,676
Zimlichman 2013(12)
* Used in analysis as base case value.

25
Table 9: Annual Maintenance Costs of CPOE:
Bed Size
Type of CPOE System Cost (In 2012 dollars) Citation, or Derived Using Equations from
Mean Range
Low High
50 Existing Electronic Health Record System $383,944 $199,508 $568,380 Ohsfeldt 2005 (36)
Existing Electronic Health Record System $175,761
Congressional Budget Office 2008 (41)
Existing Electronic Health Record System $155,413
Zimlichman 2013(12)
100 Existing Electronic Health Record System $467,064 $241,472 $692,656 Ohsfeldt 2005 (36)
Existing Electronic Health Record System $351,523
Congressional Budget Office 2008 (41)
Existing Electronic Health Record System*
$369,301
Zimlichman 2013(12)
200 Existing Electronic Health Record System $646,373 $332,326 $960,420 Ohsfeldt 2005 (36)
Existing Electronic Health Record System $359,996 $1,053,322 Birkmeyer 2002 (39)
Replacing the Existing Information System with a New System from a Different Vendor $231,998 $623,993 Birkmeyer 2002 (39)
Existing Electronic Health Record System $703,045
Congressional Budget Office 2008 (41)
Existing Electronic Health Record System* $791,694
Zimlichman 2013(12)
250 Existing Electronic Health Record System $794,690 $407,976 $1,181,403 Ohsfeldt 2005 (36)
Purchasing CPOE Module from Existing Vendor $873,468 Adams 2004 (37)
Adding CPOE from Different Vendor to Existing Information System $960,816 Adams 2004 (37)
Replacing the Existing Information System with a New System from a Different Vendor $1,247,813 Adams 2004 (37)

26
Bed Size
Type of CPOE System Cost (In 2012 dollars) Citation, or Derived Using Equations from
Existing Electronic Health Record System $878,807
Congressional Budget Office 2008 (41)
Existing Electronic Health Record System* $1,000,199
Zimlichman 2013(12)
460 Existing Electronic Health Record System $1,194,122 $611,746 $1,776,497 Ohsfeldt 2005 (36)
Existing Electronic Health Record System $1,617,005
Congressional Budget Office 2008 (41)
Existing Electronic Health Record System* $1,856,324
Zimlichman 2013(12)
500 Existing Electronic Health Record System $1,379,321 $706,622 $2,052,021 Ohsfeldt 2005 (36)
Purchasing CPOE Module from Existing Vendor $1,684,547 Adams 2004 (37)
Adding CPOE from Different Vendor to Existing Information System $1,871,719 Adams 2004 (37)
Replacing the Existing Information System with a New System from a Different Vendor $2,495,625 Adams 2004 (37)
Existing Electronic Health Record System $1,757,614
Congressional Budget Office 2008 (41)
Existing Electronic Health Record System* $2,015,807
Zimlichman 2013(12)
* Used in analysis as base case value

27
Examining Cost Offsets from Improved Medication and Laboratory Ordering One advantage of CPOE identified in some of the studies is that the decision support software can be used to suggest less expensive medications that can substitute for more expensive ones, and to suggest conversions to oral medications from intravenous ones, which tend to be more expensive (13, 40). Similarly, CPOE can reduce the ordering of redundant laboratory tests (26). Adams et al. estimated average savings per hospital for all three types of cost‐saving decision support (brand to generic, IV to oral, and intercepting redundant laboratory tests), based on observations of ordering practices at six community hospitals. We selected this source because it included all three types of decision support and was based at multiple hospitals, as opposed to one hospital, which some earlier studies were (26). The authors also reported the mean admissions per studied hospital. This enabled us to calculate the mean cost offset on per admission. We inflated the estimate to 2012 and included it in our model. Table below lists these estimates. Lau also studied the cost savings associated with converting medications from IV to PO, but only studied four medications and one academic tertiary care hospital. The total savings was $1,167,000 for a 982‐bed hospital, or $1,188 per bed per year (2010 dollars) (15). Given, on average, there are 43.9 admissions per bed per year in U.S. hospitals (based on American Hospital Association data discussed later, (5) the Lau estimates suggest a savings of approximately $27.06 per admission ($30.39 inflated to 2012), which is much higher than the estimates from Adams et al. To address this uncertainty, we used a flat distribution for the total costs offsets associated with these decision support features, as listed below. The Congressional Budget Office report reviewed the literature on these topics as well, which produced relatively similar estimates (41).
Table 10: Annual Cost Offsets to Hospitals from CPOE Implementation through Improvements in Medication and Laboratory Ordering (13‐15) Median: $40.81, Range $28.83‐$52.78
Category Mean Annual Cost‐offset per Studied Hospital
(2006 Dollars)
Mean Admissions per Studied Hospital per Year
M‐CPI Mean Cost‐offset per Admission (2012 Dollars)
Medication Ordering
Substitution of Less Expensive Medications
$154,800 11,055 1.473 $20.63
Substitution of Oral for Intravenous Medications
$47,900 11,055 1.473 $6.38‐$30.39
Elimination of Redundant Laboratory Tests
$11,800 11,055 1.473
$1.57
Total $28.58‐$52.78
Obtaining Information about CPOE’s Effects on Workflow CPOE affects staff workflow in both beneficial and non‐beneficial ways. The equation we used to determine the cost of workflow changes was:
Cost of workflow changes = (change in hours of work per year for given type of provider)*(number of providers of that type working at the hospital in 2009)*(hourly wage)*(benefit multiplier)
28
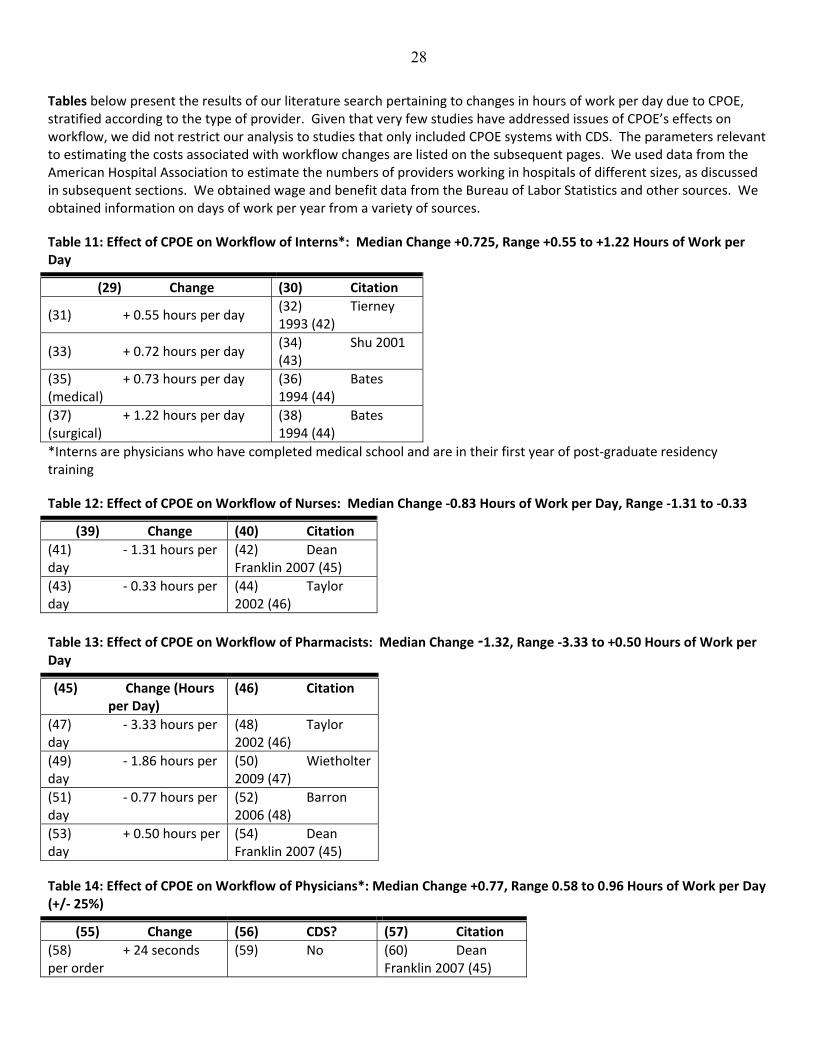
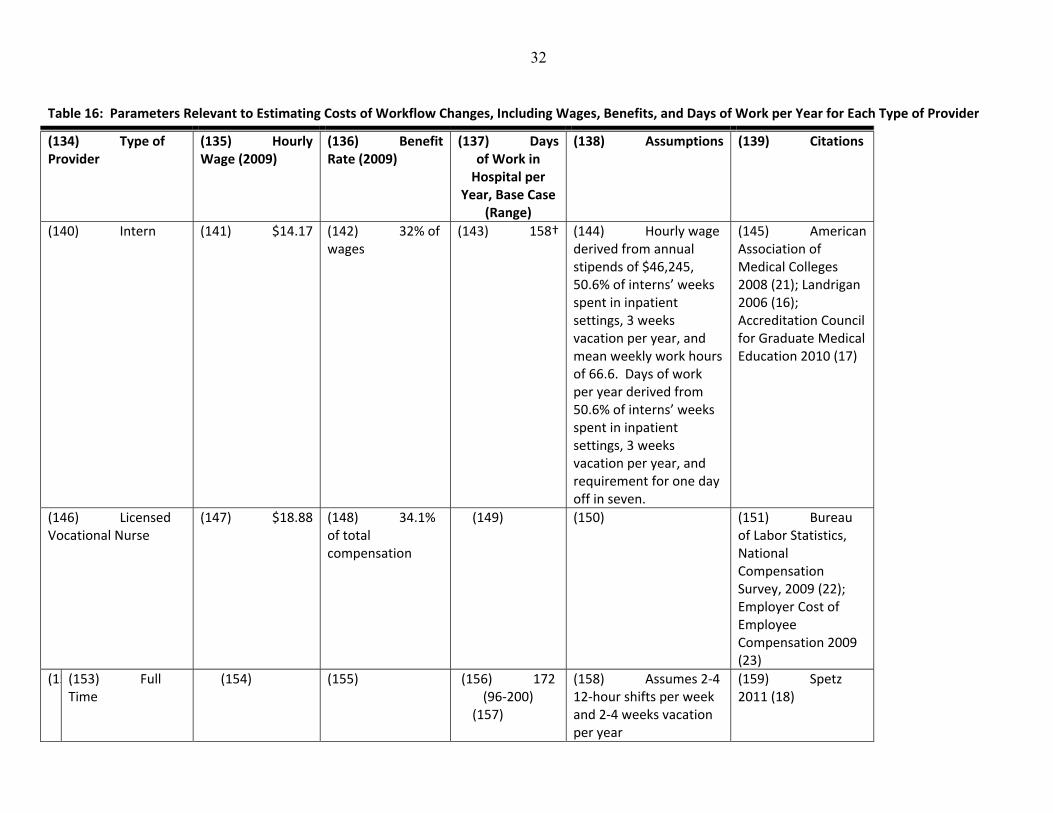
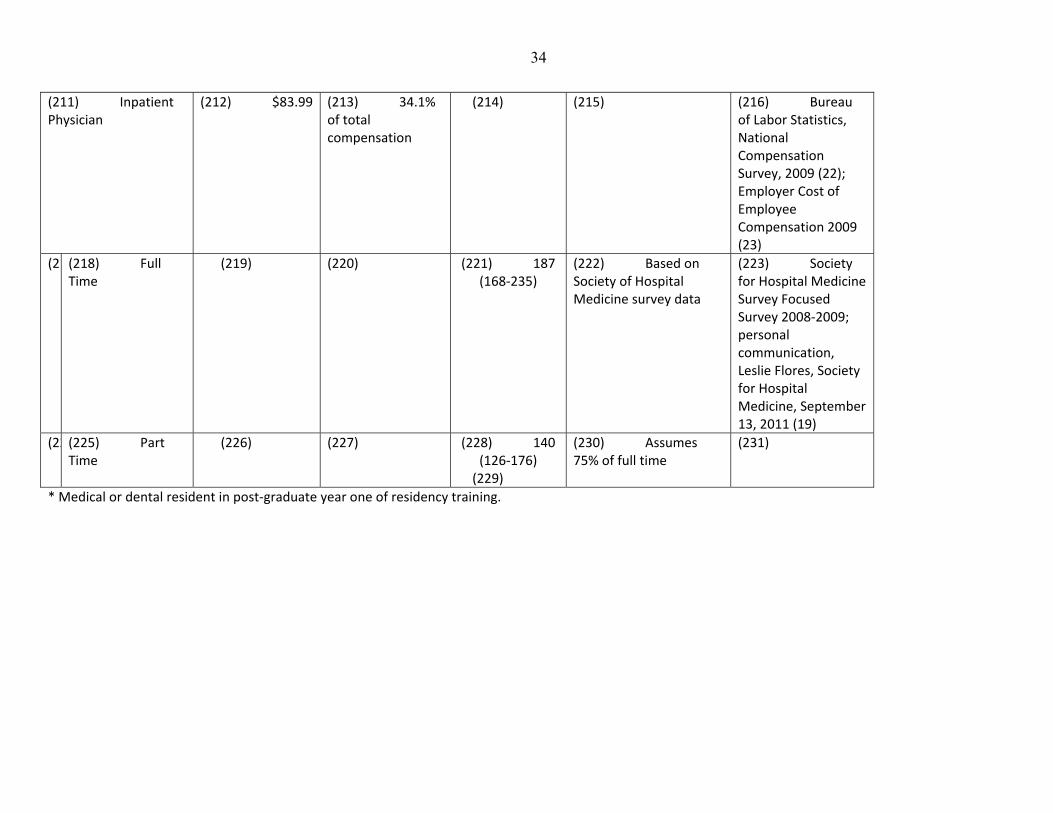
Tables below present the results of our literature search pertaining to changes in hours of work per day due to CPOE, stratified according to the type of provider. Given that very few studies have addressed issues of CPOE’s effects on workflow, we did not restrict our analysis to studies that only included CPOE systems with CDS. The parameters relevant to estimating the costs associated with workflow changes are listed on the subsequent pages. We used data from the American Hospital Association to estimate the numbers of providers working in hospitals of different sizes, as discussed in subsequent sections. We obtained wage and benefit data from the Bureau of Labor Statistics and other sources. We obtained information on days of work per year from a variety of sources.
Table 11: Effect of CPOE on Workflow of Interns*: Median Change +0.725, Range +0.55 to +1.22 Hours of Work per Day
(29) Change (30) Citation
(31) + 0.55 hours per day (32) Tierney 1993 (42)
(33) + 0.72 hours per day (34) Shu 2001 (43)
(35) + 0.73 hours per day (medical)
(36) Bates 1994 (44)
(37) + 1.22 hours per day (surgical)
(38) Bates 1994 (44)
*Interns are physicians who have completed medical school and are in their first year of post‐graduate residency training
Table 12: Effect of CPOE on Workflow of Nurses: Median Change ‐0.83 Hours of Work per Day, Range ‐1.31 to ‐0.33
(39) Change (40) Citation
(41) ‐ 1.31 hours per day
(42) Dean Franklin 2007 (45)
(43) ‐ 0.33 hours per day
(44) Taylor 2002 (46)
Table 13: Effect of CPOE on Workflow of Pharmacists: Median Change‐1.32, Range ‐3.33 to +0.50 Hours of Work per Day
(45) Change (Hours per Day)
(46) Citation
(47) ‐ 3.33 hours per day
(48) Taylor 2002 (46)
(49) ‐ 1.86 hours per day
(50) Wietholter 2009 (47)
(51) ‐ 0.77 hours per day
(52) Barron 2006 (48)
(53) + 0.50 hours per day
(54) Dean Franklin 2007 (45)
Table 14: Effect of CPOE on Workflow of Physicians*: Median Change +0.77, Range 0.58 to 0.96 Hours of Work per Day (+/‐ 25%)
(55) Change (56) CDS? (57) Citation
(58) + 24 seconds per order
(59) No (60) Dean Franklin 2007 (45)

29
(61) + 0.77 hours per day †
(62) Not mentioned
(63) Amusan 2008 (49)
(64) + 35 seconds per order
(65) Very limited
(66) Evans 1998 (50)
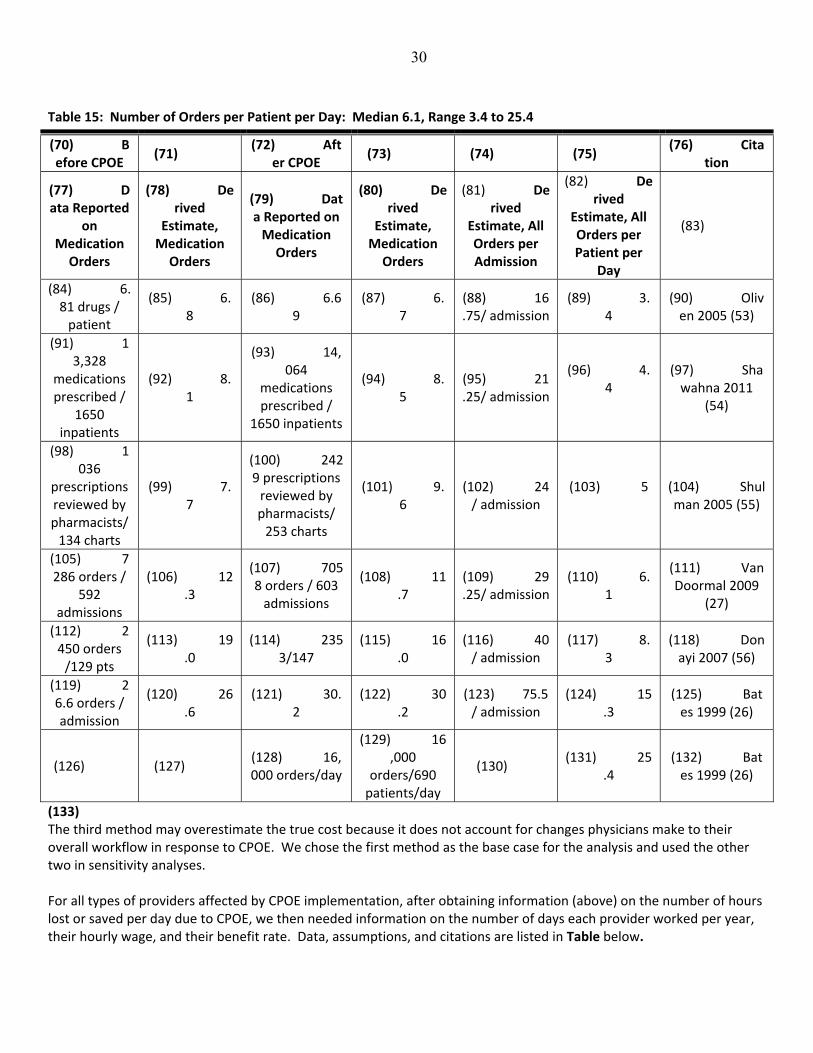
(67) * Physicians have completed residency training. (68) † See discussion below of how estimate differs from other studies. Most of the workflow estimates are reported in hours of work per day, which can be converted to an annual cost by multiplying by the number of days of work per year. The table below provides this information for each of the types of providers discussed above. However, the units used in studies of physician time vary. Therefore, we considered three different methods of estimating the additional hours of physician time spent entering orders via CPOE per hospital per year. The first and second methods were based on studies reporting the number of additional hours per physician per day among hospitalists, which we extrapolated to providers directly responsible for the patients care (i.e., not consultants). These methods assume that the total physician time spent on CPOE per hospital per year is roughly the same at hospitals with and without hospitalists and intensivists. In the first method, we multiplied the hours CPOE requires per physician per day, the projected number of FTE hospitalists and intensivists per hospital (estimated from AHA data), and the days inpatient physicians work per year. We did not have a range based on the literature that used the same units; therefore, we arbitrarily used a range for the probability distribution that was +/‐ 25% of 0.77 hours per physician per day. We assumed that hospitalists and intensivists write most orders and estimated the number of these physicians per hospital using bed size (see below). For hospitals lacking hospitalists and intensivists, we based estimates on hospitals having them. We created a similar regression model estimating full‐time equivalents of hospitalists and intensivists at hospitals having both providers. The probability model used the resulting intercept and coefficients for all hospitals. In the second method, we multiplied the hours CPOE requires per physician per day, and total inpatient days per hospital per year. We then divided the product by the average patient load carried by a hospitalist, and by 365. The average patient load carried by a hospitalist is about 15 patients per day, ranging from the low teens to the mid‐20s (we assumed from 13 to 25), based on statistics from the Society for Hospital Medicine’s annual survey (51). The third method was based on the number of additional seconds required per order, the estimated number of orders per patient per day, and the total inpatient days per hospital per year. In considering the estimated number of orders, we needed to include all orders, not just medication orders, because implementing CPOE means that physicians would need to place diet, activity, do‐not‐resuscitate and other orders via computer as well. However, we were unable to find studies that reported the number of orders of all kinds per patient per day. Several studies did report the number of medication orders per admission or per patient per day (see Table below). Also, Bates et al. reported that 40% of the orders were for medications in a 700‐bed teaching hospital (26). Where necessary to derive total orders per day from studies listed in Table, we assumed a 90‐percent occupancy and an average length of stay in the hospital of 4.8 days (52). (69)
30
Table 15: Number of Orders per Patient per Day: Median 6.1, Range 3.4 to 25.4
(70) Before CPOE
(71) (72) Aft
er CPOE (73) (74) (75)
(76) Citation
(77) Data Reported
on Medication Orders
(78) Derived
Estimate, Medication Orders
(79) Data Reported on Medication Orders
(80) Derived
Estimate, Medication Orders
(81) Derived
Estimate, All Orders per Admission
(82) Derived
Estimate, All Orders per Patient per
Day
(83)
(84) 6.81 drugs / patient
(85) 6.8
(86) 6.69
(87) 6.7
(88) 16.75/ admission
(89) 3.4
(90) Oliven 2005 (53)
(91) 13,328
medications prescribed /
1650 inpatients
(92) 8.1
(93) 14,064
medications prescribed /
1650 inpatients
(94) 8.5
(95) 21.25/ admission
(96) 4.4
(97) Shawahna 2011
(54)
(98) 1036
prescriptions reviewed by pharmacists/ 134 charts
(99) 7.7
(100) 2429 prescriptions reviewed by pharmacists/ 253 charts
(101) 9.6
(102) 24/ admission
(103) 5
(104) Shulman 2005 (55)
(105) 7286 orders /
592 admissions
(106) 12.3
(107) 7058 orders / 603 admissions
(108) 11.7
(109) 29.25/ admission
(110) 6.1
(111) Van Doormal 2009
(27)
(112) 2450 orders /129 pts
(113) 19.0
(114) 2353/147
(115) 16.0
(116) 40/ admission
(117) 8.3
(118) Donayi 2007 (56)
(119) 26.6 orders / admission
(120) 26.6
(121) 30.2
(122) 30.2
(123) 75.5/ admission
(124) 15.3
(125) Bates 1999 (26)
(126) (127) (128) 16,000 orders/day
(129) 16,000
orders/690 patients/day
(130) (131) 25
.4 (132) Bates 1999 (26)
(133) The third method may overestimate the true cost because it does not account for changes physicians make to their overall workflow in response to CPOE. We chose the first method as the base case for the analysis and used the other two in sensitivity analyses. For all types of providers affected by CPOE implementation, after obtaining information (above) on the number of hours lost or saved per day due to CPOE, we then needed information on the number of days each provider worked per year, their hourly wage, and their benefit rate. Data, assumptions, and citations are listed in Table below.

31
For nurses, we conducted two sensitivity analyses, one assuming that they worked 20% more and one assuming that they worked 20% few days per year than in the base case analysis. Most of the studies on workflow assessed the effects of CPOE only a year or so after implementation. Consequently, the effects may not have yet reached a mature, steady state in the hospital during which providers, particularly physicians, would have reached their maximum comfort level with the new systems. We conducted two sensitivity analyses addressing this issue. In one, we eliminated the costs attributable to attending physicians (but not interns, because those change every year). In another, we assumed that the reduction in work experienced by nurses and pharmacists following CPOE would be 20% larger after the first year, reflecting increased efficiency with greater experience.
32
Table 16: Parameters Relevant to Estimating Costs of Workflow Changes, Including Wages, Benefits, and Days of Work per Year for Each Type of Provider
(134) Type of Provider
(135) Hourly Wage (2009)
(136) Benefit Rate (2009)
(137) Days of Work in Hospital per
Year, Base Case (Range)
(138) Assumptions (139) Citations
(140) Intern (141) $14.17 (142) 32% of wages
(143) 158† (144) Hourly wage derived from annual stipends of $46,245, 50.6% of interns’ weeks spent in inpatient settings, 3 weeks vacation per year, and mean weekly work hours of 66.6. Days of work per year derived from 50.6% of interns’ weeks spent in inpatient settings, 3 weeks vacation per year, and requirement for one day off in seven.
(145) American Association of Medical Colleges 2008 (21); Landrigan 2006 (16); Accreditation Council for Graduate Medical Education 2010 (17)
(146) Licensed Vocational Nurse
(147) $18.88 (148) 34.1% of total compensation
(149) (150) (151) Bureau of Labor Statistics, National Compensation Survey, 2009 (22); Employer Cost of Employee Compensation 2009 (23)
(15(153) Full Time
(154) (155) (156) 172 (96‐200)
(157)
(158) Assumes 2‐4 12‐hour shifts per week and 2‐4 weeks vacation per year
(159) Spetz 2011 (18)

33
(16(161) Part Time
(162) (163) (164) 108 (48‐150)
(165) Assumes 50‐75% of full time
(166) Spetz 2011 (18)
(167) Registered Nurse
(168) $32.76 (169)
(170) 34.1% of total compensation
(171) (172) (173) Bureau of Labor Statistics, National Compensation Survey, 2009(22); Employer Cost of Employee Compensation 2009 (23)
(17(175) Full Time
(176) (177) (178) 172 (96‐200)
(179)
(180) Assumes 2‐4 12‐hour shifts per week and 2‐4 weeks vacation per year
(181) Spetz 2011 (18)
(18(183) Part Time
(184) (185) (186) 108 (48‐150)
(187) Assumes 50‐75% of full time
(188) Spetz 2011 (18)
(189) Pharmacist (190) $52.49 (191) 34.1% of total compensation
(192) (193) (194) Bureau of Labor Statistics, National Compensation Survey, 2009 (22); Employer Cost of Employee Compensation 2009 (23)
(19(196) Full Time
(197) (198) (199) 187 (168‐235) (200)
(201) Assumes that pharmacists have similar shift patterns as hospitalists, such as working 7 days on 7 days off
(202)
(20(204) Part Time
(205) (206) (207) 140 (126‐176) (208)
(209) Assumes 75% of full time
(210)
34
(211) Inpatient Physician
(212) $83.99 (213) 34.1% of total compensation
(214) (215) (216) Bureau of Labor Statistics, National Compensation Survey, 2009 (22); Employer Cost of Employee Compensation 2009 (23)
(2 (218) Full Time
(219) (220) (221) 187 (168‐235)
(222) Based on Society of Hospital Medicine survey data
(223) Society for Hospital Medicine Survey Focused Survey 2008‐2009; personal communication, Leslie Flores, Society for Hospital Medicine, September 13, 2011 (19)
(22(225) Part Time
(226) (227) (228) 140 (126‐176) (229)
(230) Assumes 75% of full time
(231)
* Medical or dental resident in post‐graduate year one of residency training.
35
Estimating Hospital Characteristics Based on American Hospital Association Annual Survey We used data from the American Hospital Association (AHA) annual survey of hospitals from fiscal year 2009 for several model parameters related to hospital characteristics. First, we selected general medical and surgical hospitals, thereby excluding facilities that were dedicated to pediatric, long term care, or rehabilitation. Of the 6,335 hospitals listed in the AHA dataset, we included 4,891 (5). We then stratified these hospitals into five mutually exclusive size quintiles according to the number of total facility beds that were set up and staffed at the end of the reporting period. The AHA defines the reporting period for hospitals as the twelve months between January 1, 2009 and December 31, 2009 (5). Based on the parameters required for the analysis of workflow, and the parameters required to scale the estimates of pADE costs up to the hospital level, we needed to estimate the following parameters from the AHA data:
1. Admissions (variable ADMTOT in the AHA survey) 2. Inpatient days and average daily census (which equals inpatient days/365) 3. Numbers of providers in the following categories
a. Registered nurses i. Full time ii. Part time
b. Licensed vocational or practical nurses i. Full time ii. Part time
c. Registered pharmacists i. Full time ii. Part time
d. Resident physicians i. Full time ii. (We assumed no part time resident physicians)
e. Full‐time equivalent hospitalists and intensivists, at the subset of hospitals that had both of those categories of physicians
f. We estimated full‐time equivalents as the sum of full time physicians plus 0.75 times part time physicians across both categories
These parameters need to be estimated at the hospital level, given the cost‐effectiveness model focuses on a hospital‐level intervention. They tend to vary with hospital size, and for that reason they tend to be correlated. We considered estimating these parameters based on the mean and standard deviation for each quintile, but the mean value for a quintile would not accurately reflect conditions at the smallest hospital or the largest one. Consequently, after examining histograms, frequency statistics, and correlations between selected variables, we chose an alternative method of estimating the parameters. We used multiple linear regression to predict each the parameters as functions of beds + beds‐squared. The regression model with the beds‐squared term had a higher R‐squared value than the model without it and the beta for the beds‐squared term was significant at p<0.0001 in almost all cases. For the sake of consistency, we used chose to estimate all parameters as a function of beds plus beds‐squared using the values for the betas and the intercept obtained from the regression models. Thus, the regression models provided us with equations that we could use to estimate each of these parameters, with the only input to the models being the beds variable. This method tailors the parameter to the size of the hospital with much greater precision than using quintile averages would. Correlations between all of the size‐related parameters are now all 1, since all of them are functions of bed size.

36
Taking this approach meant that how we estimated bed size in the TreeAge model was an important issue. We addressed this as follows. First, we examined the range and distribution of beds for each of the four upper quintiles. Quintile 2 included hospitals with 25 to 72 beds, Quintile 3 had 72 to 141 beds, Quintile 4 had 141 to 267 beds, and Quintile 5 had 267 to 2249 beds. Histograms showed flat distributions of bed sizes across Quintiles 2, 3, and 4, and a sharply declining distribution for Quintile 5. For the TreeAge cost‐effectiveness model, we needed to select distributions for the Monte Carlo probabilistic sensitivity analyses. We selected flat distributions for Quintiles 2 through 4, with ranges extending from the lowest to highest values within each respective quintile. For Quintile 5, the two distributions that most closely resembled that of original data were the log normal and exponential distributions. Table below shows frequency statistics for the original data, a log normal distribution, and three iterations of an exponential distribution that we attempted to fit to the data. For the exponential distributions, we used the equation predicted beds = 267* e (λ * rank) where 267 is the size of the first hospital in Quintile 5, λ describes the shape of the exponential function, and rank represents the rank of the hospital within Quintile 5 when hospitals are ranked by bed size from 267 to 2249. To obtain an initial estimate for λ, we derived λ empirically for each hospital in the original data set using the equation λ = Ln(beds/267)/rank where beds equaled the actual number of beds in each hospital. We then averaged λ across the hospitals, obtaining 0.0008799 with a standard deviation of 0.0002068. However, this value for λ (Exponential 1) did not produce a distribution that performed as well as some slightly higher ones that we considered (Exponential 2 and 3). To estimate the log normal distribution, we used Microsoft Excel 2007 to obtain the natural logarithms for each of the bed sizes for hospitals in Quintile 5, then obtained the log normal distribution of that transformed data. The mean of the log normal distribution was 6.060705005, and the standard deviation 0.367902539. Ultimately, we concluded that the log normal distribution had the closest mean, standard deviation, and skewness to the original data so we used the log normal distribution in the model.
Table 17: Bed Size Distributions Considered for Quintile 5
Original Data Log Normal Exponential 1
Exponential 2
Exponential 3
Mean 463.5 461.4 423.3 645.1 452.9
Median 395.5 429.4 410.6 583.9 435.4
SD 222.6 178.0 104.5 285.6 126.8
Skewness 3.0 1.3 0.3 0.5 0.3
Kurtosis 14.2 3.1 ‐1.1 ‐0.9 ‐1.1
Minimum 267 116.8 267.2 267.4 267.3
Maximum 2249 1729 630.8 1274.7 709.3
Lambda n/a n/a 0.0008799 0.0016 0.001
The AHA data did not enable us to distinguish major teaching from non‐teaching hospitals. In addition, many residents rotate at non‐teaching institutions, writing orders there. Consequently, we did not attempt to distinguish these types of hospitals. The AHA data enabled us to estimate the number of resident physicians and dentists, on average, per hospital, as a function of size. Very few of the residents are likely to be dentists, and those who are will be using the CPOE systems as well, so we did not attempt to distinguish dental residents. However, not all residents spend equal amounts of time writing orders—the vast majority of orders are made by interns. Consequently, after estimating the number of resident physicians and dentists per hospital, we multiplied by the percentage of residents who are interns. In 2008‐2009, there were 108,176 physician residents and 25,848 of them were in post‐graduate year 1, indicating that interns represent 23.9% of all physician residents(20). These percentages generally remain stable over time due to caps on residency positions placed by the Balanced Budget Act. We assumed that 23.9% of all residents in the AHA data were interns.

37
Table below lists the various model parameters obtained from the AHA data along with means and standard deviations (these are based on the original data, not the modeled estimates based on bed size). We include these statistics even though the TreeAge model does not incorporate these parameters so that readers can have a sense of the scale of the parameters.
Table 18: Data for Hospitals in Each of Five Different Size Quintiles, for 2009(5)
Model Parameters
Quintile 1 Quintile 2 Quintile 3 Quintile 4 Quintile 5 Overall
Number of Hospitals
978 978 978 978 978 4891
Hospital Size (Number of Beds Set Up and Staffed for Use), Mean (S.D)
21.2 (5.3)
48.3 (13.2)
104 (19.7)
198 (35.5)
463 (222.5) 166.9 (189.5)
Number of Physicians and Dentists on Each Hospital’s Payroll, Mean (S.D)
Full‐time 2.6 (4.6) 8.2 (22.8) 10.9 (30.7) 19.1 (49.5) 63.8 (173.8)
20.9 (85.5)
Part‐time 0.6 (1.6) 1.5 (4.6) 3.01 (9.5) 6.4 (20.5) 21.7 (64.1) 6.6 (31.5)
Licensed Vocational Nurses on Each Hospital’s Payroll, Mean (S.D)
Full‐time 5.7 (5.0) 9.8 (9.4) 14.6 (15.7) 23 (25.5) 41.1 (45.8) 18.8 (27.9)
Part‐time 2.5 (2.9) 3.7 (4.5) 5.3 (6.6) 7.8 (9.8) 11.7 (15.1) 6.20 (9.49)
Number of Registered Nurses on Each Hospital Payroll, Mean (S.D)
Full‐time 23.2 (15.8)
49.4 (36.6)
106.8 (65.8)
226 (114.6)
667 (495)
214.6 (329.8)
Part‐time 13.4 (13.5)
23.7 (25.3)
54.4 (53.0)
111 (101.3)
265 (253.5) 93.4 (155.3)
Number of Licensed Pharmacists on Each Hospital Payroll, Mean (S.D)
Full‐time 0.8 (1.5) 2.5 (4.1) 4.8 (5.5) 10.0 (8.8) 28.5 (25) 9.3 (15.9)
Part‐time 0.6 (1.0) 1.0 (1.5) 1.9 (2.3) 3.6 (3.8) 9.1 (10.1) 3.2 (5.9)
Number of Medical and Dental Residents on Each Hospital Payroll, Mean (S.D)
0.04 (0.5) 0.7 (3.4) 3.4 (26.6) 10.6 (39.0) 87 (184.7) 20.3 (91.6)
Sum of Number of Physicians Affiliated with Each Hospital through Physician Arrangements (i.e., Other than Employment), Mean (S.D)
19.2 (167.3)
18.2 (72.1)
58.7 (246.8)
99.2 (270.8)
293.5 (592.8)
977.7 (337.9)
Admissions per Hospital, Excluding Newborns, Mean (S.D)
693 (451)
1,666 (1,097)
3,991 (2,247)
8,848 (3,737)
21,408 (11,504)
7,324 (9,389)
Inpatient Days, Mean (S.D)
2,818 (1,679.8)
8,858 (4,322)
21,814 (7,937.4)
46,364 (13,667)
119,664 (67,565)
39,920 (52,749)
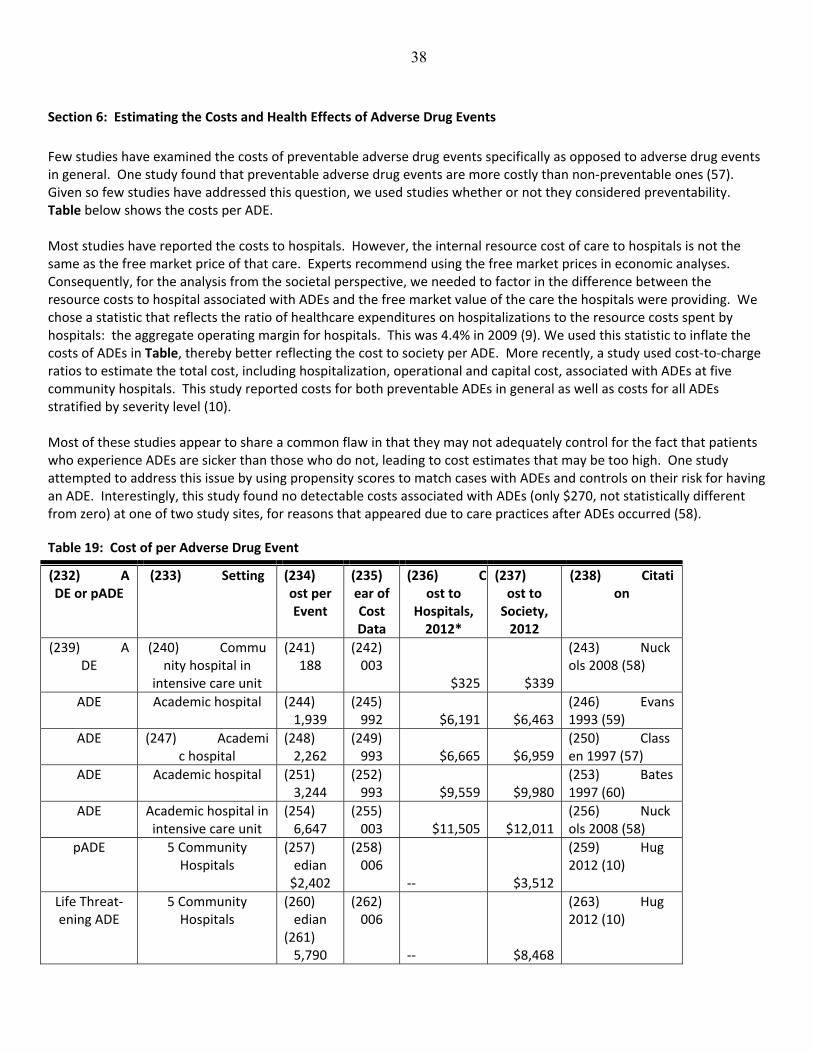
38
Section 6: Estimating the Costs and Health Effects of Adverse Drug Events
Few studies have examined the costs of preventable adverse drug events specifically as opposed to adverse drug events in general. One study found that preventable adverse drug events are more costly than non‐preventable ones (57). Given so few studies have addressed this question, we used studies whether or not they considered preventability. Table below shows the costs per ADE. Most studies have reported the costs to hospitals. However, the internal resource cost of care to hospitals is not the same as the free market price of that care. Experts recommend using the free market prices in economic analyses. Consequently, for the analysis from the societal perspective, we needed to factor in the difference between the resource costs to hospital associated with ADEs and the free market value of the care the hospitals were providing. We chose a statistic that reflects the ratio of healthcare expenditures on hospitalizations to the resource costs spent by hospitals: the aggregate operating margin for hospitals. This was 4.4% in 2009 (9). We used this statistic to inflate the costs of ADEs in Table, thereby better reflecting the cost to society per ADE. More recently, a study used cost‐to‐charge ratios to estimate the total cost, including hospitalization, operational and capital cost, associated with ADEs at five community hospitals. This study reported costs for both preventable ADEs in general as well as costs for all ADEs stratified by severity level (10). Most of these studies appear to share a common flaw in that they may not adequately control for the fact that patients who experience ADEs are sicker than those who do not, leading to cost estimates that may be too high. One study attempted to address this issue by using propensity scores to match cases with ADEs and controls on their risk for having an ADE. Interestingly, this study found no detectable costs associated with ADEs (only $270, not statistically different from zero) at one of two study sites, for reasons that appeared due to care practices after ADEs occurred (58).
Table 19: Cost of per Adverse Drug Event
(232) ADE or pADE
(233) Setting (234) ost per Event
(235)ear of Cost Data
(236) Cost to
Hospitals, 2012*
(237)ost to Society, 2012
(238) Citation
(239) ADE
(240) Community hospital in
intensive care unit
(241) 188
(242)003
$325 $339
(243) Nuckols 2008 (58)
ADE Academic hospital (244) 1,939
(245)992 $6,191 $6,463
(246) Evans 1993 (59)
ADE (247) Academic hospital
(248) 2,262
(249)993 $6,665 $6,959
(250) Classen 1997 (57)
ADE Academic hospital (251) 3,244
(252)993 $9,559 $9,980
(253) Bates 1997 (60)
ADE Academic hospital in intensive care unit
(254) 6,647
(255)003 $11,505 $12,011
(256) Nuckols 2008 (58)
pADE 5 Community Hospitals
(257) edian $2,402
(258)006
‐‐ $3,512
(259) Hug 2012 (10)
Life Threat‐ening ADE
5 Community Hospitals
(260) edian
(261) 5,790
(262)006
‐‐ $8,468
(263) Hug 2012 (10)
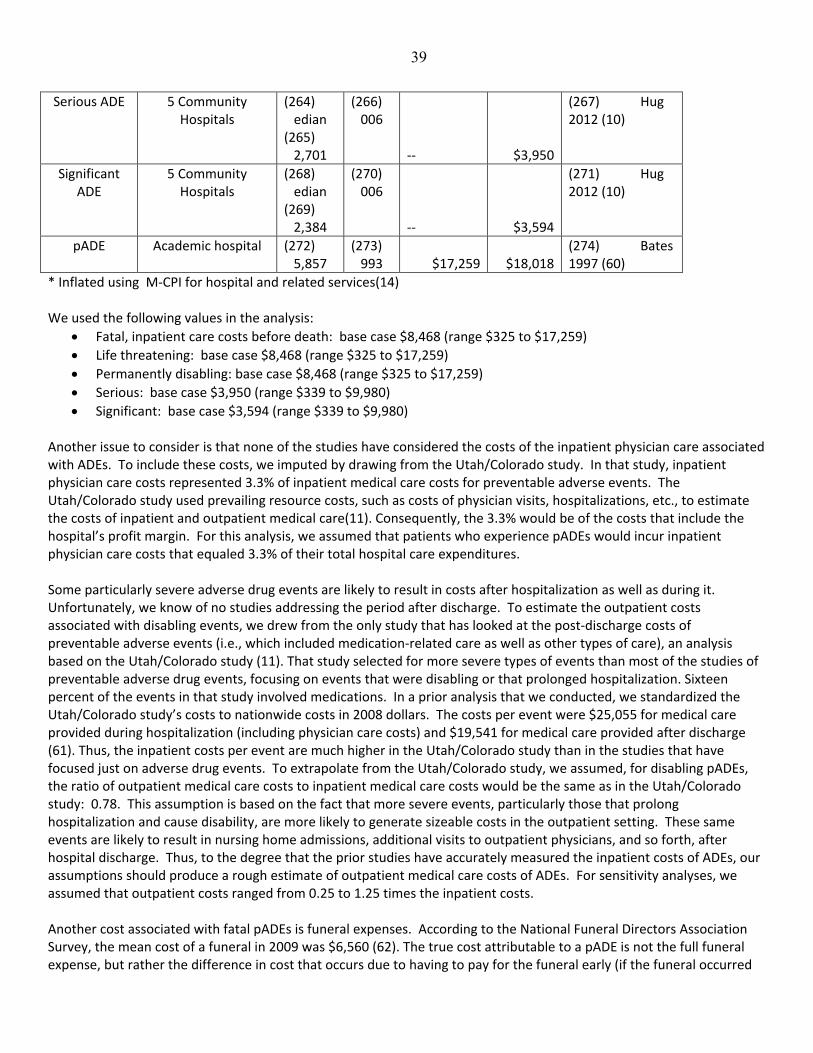
39
Serious ADE 5 Community Hospitals
(264) edian
(265) 2,701
(266)006
‐‐ $3,950
(267) Hug 2012 (10)
Significant ADE
5 Community Hospitals
(268) edian
(269) 2,384
(270)006
‐‐ $3,594
(271) Hug 2012 (10)
pADE Academic hospital (272) 5,857
(273)993 $17,259 $18,018
(274) Bates 1997 (60)
* Inflated using M‐CPI for hospital and related services(14) We used the following values in the analysis:
Fatal, inpatient care costs before death: base case $8,468 (range $325 to $17,259)
Life threatening: base case $8,468 (range $325 to $17,259)
Permanently disabling: base case $8,468 (range $325 to $17,259)
Serious: base case $3,950 (range $339 to $9,980)
Significant: base case $3,594 (range $339 to $9,980) Another issue to consider is that none of the studies have considered the costs of the inpatient physician care associated with ADEs. To include these costs, we imputed by drawing from the Utah/Colorado study. In that study, inpatient physician care costs represented 3.3% of inpatient medical care costs for preventable adverse events. The Utah/Colorado study used prevailing resource costs, such as costs of physician visits, hospitalizations, etc., to estimate the costs of inpatient and outpatient medical care(11). Consequently, the 3.3% would be of the costs that include the hospital’s profit margin. For this analysis, we assumed that patients who experience pADEs would incur inpatient physician care costs that equaled 3.3% of their total hospital care expenditures. Some particularly severe adverse drug events are likely to result in costs after hospitalization as well as during it. Unfortunately, we know of no studies addressing the period after discharge. To estimate the outpatient costs associated with disabling events, we drew from the only study that has looked at the post‐discharge costs of preventable adverse events (i.e., which included medication‐related care as well as other types of care), an analysis based on the Utah/Colorado study (11). That study selected for more severe types of events than most of the studies of preventable adverse drug events, focusing on events that were disabling or that prolonged hospitalization. Sixteen percent of the events in that study involved medications. In a prior analysis that we conducted, we standardized the Utah/Colorado study’s costs to nationwide costs in 2008 dollars. The costs per event were $25,055 for medical care provided during hospitalization (including physician care costs) and $19,541 for medical care provided after discharge (61). Thus, the inpatient costs per event are much higher in the Utah/Colorado study than in the studies that have focused just on adverse drug events. To extrapolate from the Utah/Colorado study, we assumed, for disabling pADEs, the ratio of outpatient medical care costs to inpatient medical care costs would be the same as in the Utah/Colorado study: 0.78. This assumption is based on the fact that more severe events, particularly those that prolong hospitalization and cause disability, are more likely to generate sizeable costs in the outpatient setting. These same events are likely to result in nursing home admissions, additional visits to outpatient physicians, and so forth, after hospital discharge. Thus, to the degree that the prior studies have accurately measured the inpatient costs of ADEs, our assumptions should produce a rough estimate of outpatient medical care costs of ADEs. For sensitivity analyses, we assumed that outpatient costs ranged from 0.25 to 1.25 times the inpatient costs. Another cost associated with fatal pADEs is funeral expenses. According to the National Funeral Directors Association Survey, the mean cost of a funeral in 2009 was $6,560 (62). The true cost attributable to a pADE is not the full funeral expense, but rather the difference in cost that occurs due to having to pay for the funeral early (if the funeral occurred
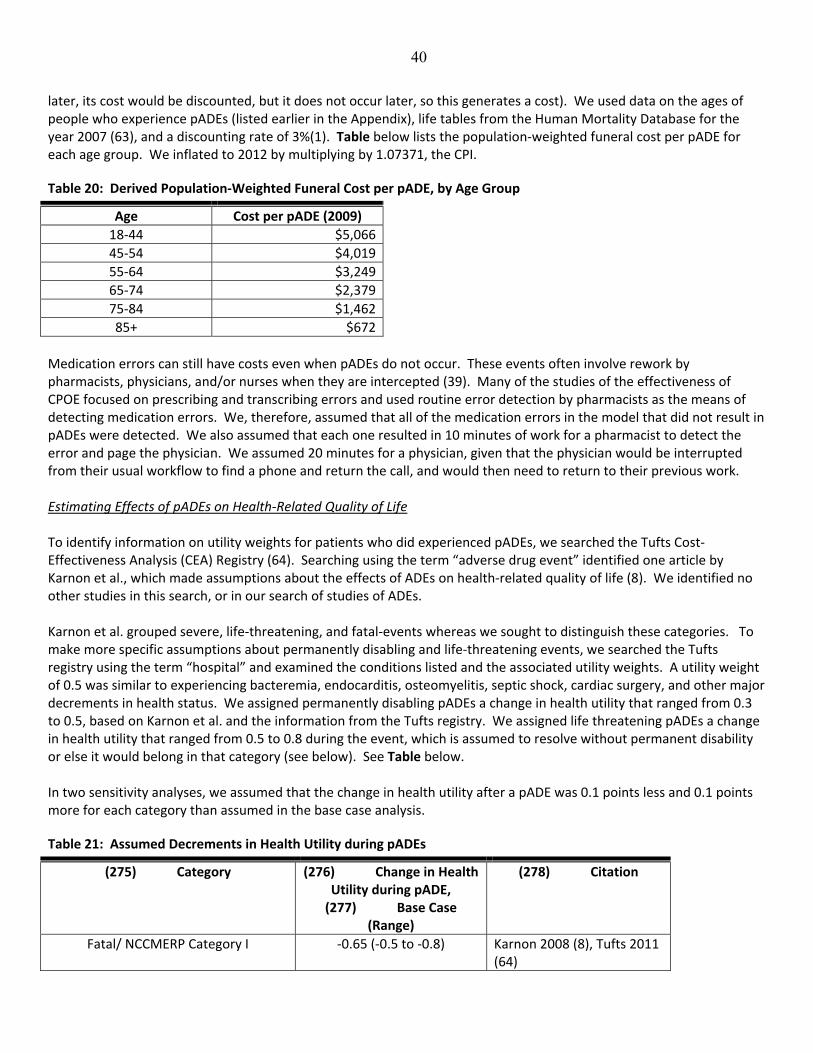
40
later, its cost would be discounted, but it does not occur later, so this generates a cost). We used data on the ages of people who experience pADEs (listed earlier in the Appendix), life tables from the Human Mortality Database for the year 2007 (63), and a discounting rate of 3%(1). Table below lists the population‐weighted funeral cost per pADE for each age group. We inflated to 2012 by multiplying by 1.07371, the CPI.
Table 20: Derived Population‐Weighted Funeral Cost per pADE, by Age Group
Age Cost per pADE (2009)
18‐44 $5,066
45‐54 $4,019
55‐64 $3,249
65‐74 $2,379
75‐84 $1,462
85+ $672
Medication errors can still have costs even when pADEs do not occur. These events often involve rework by pharmacists, physicians, and/or nurses when they are intercepted (39). Many of the studies of the effectiveness of CPOE focused on prescribing and transcribing errors and used routine error detection by pharmacists as the means of detecting medication errors. We, therefore, assumed that all of the medication errors in the model that did not result in pADEs were detected. We also assumed that each one resulted in 10 minutes of work for a pharmacist to detect the error and page the physician. We assumed 20 minutes for a physician, given that the physician would be interrupted from their usual workflow to find a phone and return the call, and would then need to return to their previous work. Estimating Effects of pADEs on Health‐Related Quality of Life To identify information on utility weights for patients who did experienced pADEs, we searched the Tufts Cost‐Effectiveness Analysis (CEA) Registry (64). Searching using the term “adverse drug event” identified one article by Karnon et al., which made assumptions about the effects of ADEs on health‐related quality of life (8). We identified no other studies in this search, or in our search of studies of ADEs. Karnon et al. grouped severe, life‐threatening, and fatal‐events whereas we sought to distinguish these categories. To make more specific assumptions about permanently disabling and life‐threatening events, we searched the Tufts registry using the term “hospital” and examined the conditions listed and the associated utility weights. A utility weight of 0.5 was similar to experiencing bacteremia, endocarditis, osteomyelitis, septic shock, cardiac surgery, and other major decrements in health status. We assigned permanently disabling pADEs a change in health utility that ranged from 0.3 to 0.5, based on Karnon et al. and the information from the Tufts registry. We assigned life threatening pADEs a change in health utility that ranged from 0.5 to 0.8 during the event, which is assumed to resolve without permanent disability or else it would belong in that category (see below). See Table below. In two sensitivity analyses, we assumed that the change in health utility after a pADE was 0.1 points less and 0.1 points more for each category than assumed in the base case analysis.
Table 21: Assumed Decrements in Health Utility during pADEs
(275) Category (276) Change in Health Utility during pADE, (277) Base Case
(Range)
(278) Citation
Fatal/ NCCMERP Category I ‐0.65 (‐0.5 to ‐0.8) Karnon 2008 (8), Tufts 2011 (64)

41
Life Threatening/ NCCMERP Category H ‐0.65 (‐0.5 to ‐0.8) Karnon 2008 (8), Tufts 2011(64)
Permanently Disabling/ NCCMERP Category G
‐0.4 (‐0.3 to ‐0.5) Karnon 2008(8), Tufts 2011 (64)
Serious/ NCCMERP Category F ‐0.3 (‐0.2 to ‐0.4) Karnon 2008 (8)
Significant/ NCCMERP Category E ‐0.15 (‐0.1 to ‐0.2) Karnon 2008 (8)
Most pADEs are temporary events; therefore, we also needed to information about the durations of pADEs to determine how long the decrements in health utility would last. Most studies meeting our inclusion criteria did not describe how long ADEs last, but they did describe by how much ADEs prolonged length of stay. These data are listed in Table below.

42
Table 22: Additional Days Length of Stay in Hospital Due to Adverse Drug Events
(279) (280) Estimate (Days) (281) Citation
(282) ADE (283) ‐0.3* (284) Nuckols 2008 (58)
(285) ADE (286) 1.74 (287) Classen 1997 (57)
(288) ADE (289) 1.94 (290) Evans 1993 (59)
(291) ADE (292) 4.8 (293) Nuckols 2008 (58)
(294) pADE (295) Median 2.36 (296) Hug 2012 (10)
Life Threatening ADE (297) Median 6.71 (of Total LOS 10.1 d)
(298) Hug 2012 (10)
Serious ADE (299) Median 2.63 (of Total LOS 6.03 d)
(300) Hug 2012 (10)
Significant ADE (301) Median 2.38 (of Total LOS 5.78 d)
(302) Hug 2012 (10)
(303) pADE (304) 4.6† (305) Bates 1997 (60)
* Not statistically different from zero. When estimating the duration of pADEs, we created the triangular distribution of probabilities as follows. We assumed that the most likely duration (peak of triangle) would be the same as the additional length of stay attributable to ADEs in Table above. The minimum would be one day. The maximum would be the total length of stay in the hospital (i.e., the pADE occurred on the day of admission, which happens frequently because that is when the greatest number of medications are prescribed). In choosing sources for these estimates, we used data from Hug et al. (2012) because these were stratified by severity. Because the study did not report data for fatal and disabling ADEs, we assumed that the in‐hospital durations of these events were the same as for life‐threatening events. See Table below.
Table 23: Assumed Durations of pADEs (Days)
(306) Category (307) Base Case (Range)
(308)
(309) Citation
Fatal/ NCCMERP Category I
Effects before death 6.71 (1‐10.1) days Hug 2012 (10)
Effects after death ‐‐
Life Threatening/ NCCMERP Category H 6.71 (1‐10.1) days Hug 2012 (10)
Permanently Disabling/ NCCMERP Category G
Effects during hospitalization 6.71 (1‐10.1) days Hug 2012 (10)
Effects after hospitalization Remaining lifespan
Serious/ NCCMERP Category F 2.63 (1‐6.03) days Hug2012 (10)
Significant/ NCCMERP Category E 2.38 (1‐5.78) days Hug2012 (10)
To estimate QALYs lost during hospitalization, we multiplied the decrement in health‐related quality of life that resulted from the pADE and the duration of the pADE during the hospitalization, then divided by 365 to convert to years.
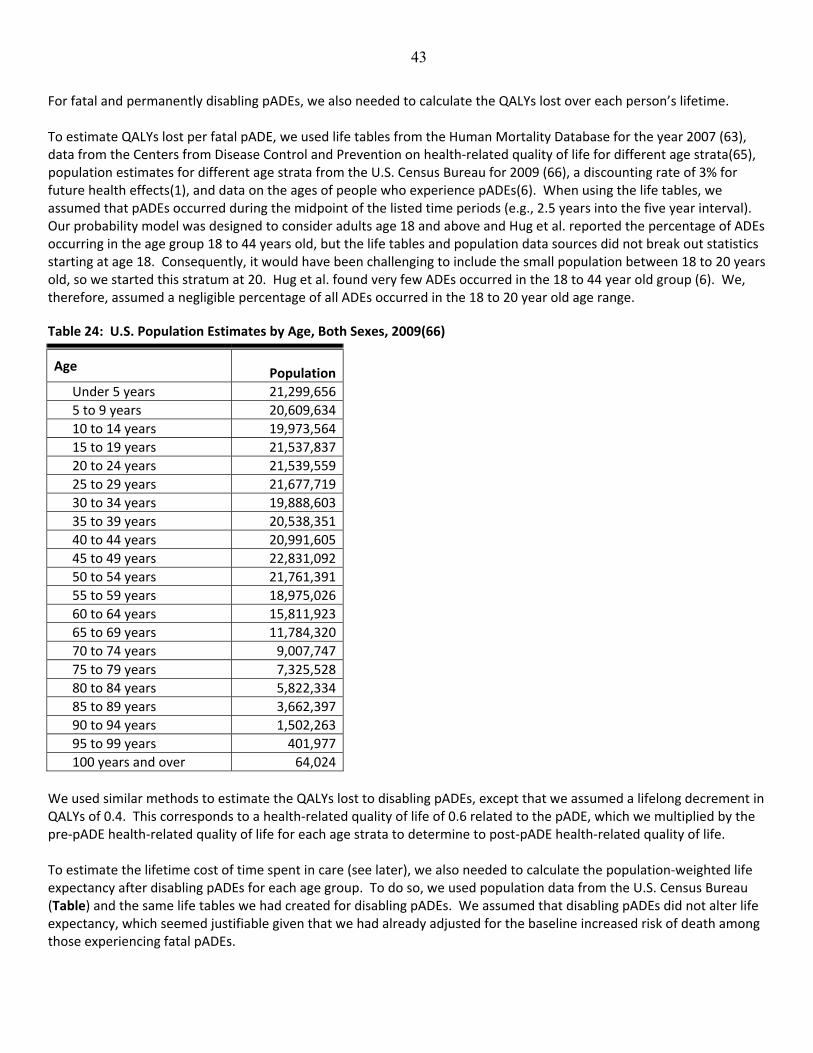
43
For fatal and permanently disabling pADEs, we also needed to calculate the QALYs lost over each person’s lifetime. To estimate QALYs lost per fatal pADE, we used life tables from the Human Mortality Database for the year 2007 (63), data from the Centers from Disease Control and Prevention on health‐related quality of life for different age strata(65), population estimates for different age strata from the U.S. Census Bureau for 2009 (66), a discounting rate of 3% for future health effects(1), and data on the ages of people who experience pADEs(6). When using the life tables, we assumed that pADEs occurred during the midpoint of the listed time periods (e.g., 2.5 years into the five year interval). Our probability model was designed to consider adults age 18 and above and Hug et al. reported the percentage of ADEs occurring in the age group 18 to 44 years old, but the life tables and population data sources did not break out statistics starting at age 18. Consequently, it would have been challenging to include the small population between 18 to 20 years old, so we started this stratum at 20. Hug et al. found very few ADEs occurred in the 18 to 44 year old group (6). We, therefore, assumed a negligible percentage of all ADEs occurred in the 18 to 20 year old age range.
Table 24: U.S. Population Estimates by Age, Both Sexes, 2009(66)
Age Population
.Under 5 years 21,299,656
.5 to 9 years 20,609,634
.10 to 14 years 19,973,564
.15 to 19 years 21,537,837
.20 to 24 years 21,539,559
.25 to 29 years 21,677,719
.30 to 34 years 19,888,603
.35 to 39 years 20,538,351
.40 to 44 years 20,991,605
.45 to 49 years 22,831,092
.50 to 54 years 21,761,391
.55 to 59 years 18,975,026
.60 to 64 years 15,811,923
.65 to 69 years 11,784,320
.70 to 74 years 9,007,747
.75 to 79 years 7,325,528
.80 to 84 years 5,822,334
.85 to 89 years 3,662,397
.90 to 94 years 1,502,263
.95 to 99 years 401,977
.100 years and over 64,024
We used similar methods to estimate the QALYs lost to disabling pADEs, except that we assumed a lifelong decrement in QALYs of 0.4. This corresponds to a health‐related quality of life of 0.6 related to the pADE, which we multiplied by the pre‐pADE health‐related quality of life for each age strata to determine to post‐pADE health‐related quality of life. To estimate the lifetime cost of time spent in care (see later), we also needed to calculate the population‐weighted life expectancy after disabling pADEs for each age group. To do so, we used population data from the U.S. Census Bureau (Table) and the same life tables we had created for disabling pADEs. We assumed that disabling pADEs did not alter life expectancy, which seemed justifiable given that we had already adjusted for the baseline increased risk of death among those experiencing fatal pADEs.

44
Table 25: Derived QALYs Lost per Fatal or Disabling pADE Over the Lifetime
(310) Age Category
Lifetime Decrement in QALYs per Fatal
pADE
Lifetime Decrement in QALYs per
Disabling pADE
Life Expectancy after Event
20‐44 18.94 7.58 48.89
45‐54 13.97 5.59 32.64
55‐64 10.82 4.33 24.27
65‐74 7.61 3.05 16.61
75‐84 4.44 1.78 9.94
>=85 2.29 0.92 4.95

45
Estimating Time in Care and Informal Care Giving The standard for cost‐effectiveness analyses performed from the societal perspective is to include the value of the time that patients spend in care as well as the value of the time that informal care giving by family members. Unfortunately, there is little data to inform these issues with regards to pADEs. Nevertheless, it should be possible to make some reasonable assumptions on the basis of available information on the severities of these events, and the effects of adverse events in general. For the inpatient phase of events, we assumed that the duration of the event represented the additional time patients spend in care. For informal care giving, we assumed that all patients who experienced a pADE would have a family member or friend stay with them in the hospital for the duration of the pADE. We counted 24 hours per day, since patients are in the hospital 24 hours a day and nowadays many hospitals allow family members and friends to stay around the clock. For the outpatient phase of events, we needed to make assumptions about additional time spent in care after discharge among patients with permanently disabling pADEs. No data were available to guide these assumptions, but assuming that this time was zero would not be accurate either, particularly given that outpatient costs represented about a third of all preventable adverse event costs in the Utah/Colorado study(11). Consequently, patients must be spending time in care. We assumed a base case estimate of 6 hours per year and a range of 2 to 60 hours per year for the remainder of their life spans (as in Table above). Table below lists our assumptions of the additional time that patients spend in care as a result of pADEs, as well as the time that informal caregivers spend with them during hospitalization.
Table 26: Hours Spent in Care and Informal Care Giving during Hospitalization
(311) Category (312) Patient’s Additional Time Spent during Hospitalization (Hours per pADE)
(313) Care Giver’s Additional Time Spent during Hospitalization
(314) (Hours per pADE)
(315) Additional Time Patients Spent Post‐Discharge (Hours
per Year)
Fatal/ NCCMERP Category I
6.71 (1‐10.1) days x 24 hours/day
6.71 (1‐10.1) days x 24 hours/day
n/a
Life Threatening/ NCCMERP Category H
6.71 (1‐10.1) days x 24 hours/day
6.71 (1‐10.1) days x 24 hours/day
n/a
Permanently Disabling/ NCCMERP Category G
6.71 (1‐10.1) days x 24 hours/day
6.71 (1‐10.1) days x 24 hours/day
6 (2 to 60) hours per year
Serious/ NCCMERP Category F
2.63 (1‐6.03) days x 24 hours/day
2.63 (1‐6.03) days x 24 hours/day
n/a
Significant/ NCCMERP Category E
2.38 (1‐5.78) days x 24 hours/day
2.38 (1‐5.78) days x 24 hours/day
n/a
(316) To turn these time estimates into costs for both patients and family members, we multiplied by wage and benefit data for the general population. The mean hourly wage of workers in the U.S. in 2009 was $20.99, and benefits were 34.1% of total compensation, for an average hourly cost of $31.85 (22, 23). We inflated these to 2012 by multiplying by the CPI, 1.07371.

46
References 1. Gold MR, Siegel JE, Russell LB, Weinstein MC, eds. Cost‐effectiveness in health and medicine. Oxford and New
York: Oxford University Press; 1996.
2. Wu RC, Laporte A, Ungar WJ, . Cost‐effectiveness of an electronic medication ordering and administration
system in reducing adverse drug events. J Eval Clin Pract. 2007;13(3):440‐8.
3. Spooner W. Senior Vice President and Chief Information Officer, Sharp HealthCare, San Diego, California.
Member, the College of Healthcare Information Management Executives (CHIME). Personal communication;
April 26, 2012.
4. Braithwaite R, Meltzer D, King JJ, Leslie D, Roberts M. What does the value of modern medicine say about the
$50,000 per quality‐adjusted life‐year decision rule? Med Care. 2008;46(4):349‐56.
5. American Hospital Association (AHA). Annual survey database for FY2009. April ed: Health Forum LLC; 2010.
6. Hug B, Witkowski D, Sox C, Keohane C, Seger D, Yoon C, et al. Adverse drug event rates in six community
hospitals and the potential impact of computerized physician order entry for prevention. J Gen Intern Med.
2010;25(1):31‐8.
7. Hayward R, Hofer T. Estimating hospital deaths due to medical errors: preventability is in the eye of the
reviewer. JAMA. 2001;286(4):415–20.
8. Karnon J, McIntosh A, Dean J, Bath P, Hutchinson A, Oakley J, et al. Modelling the expected net benefits of
interventions to reduce the burden of medication errors. J Health Serv Res Policy. 2008;13(2):85‐91
9. American Hospital Association. Trendwatch Chartbook 2010: Trends Affecting Hospitals and Health Systems.
Chigaco, IL: Avalere Health for the American Hospital Association; 2010.
10. Hug B, Keohane C, Seger D, Yoon C, Bates D. The costs of adverse drug events in community hospitals. Jt Comm J
Qual Patient Saf. 2012;38(3):120‐6.
11. Thomas E, Studdert D, Newhouse J. Costs of medical injuries in Utah and Colorado. Inquiry. 1999;36:255‐64.
12. Zimlichman E, Keohane C, Franz C, Everett WL, Seger DL, Yoon C, et al. Return on investment for vendor
computerized physician order entry in four community hospitals: the importance of decision support. Jt Comm J
Qual Patient Saf. 2013;39(7):312‐8.
13. Adams M, Bates DW, Coffman G, Everett W 2008; Accessed at Massachusetts Technology Collaborative. New
England Healthcare Institute at www.nehi.net/uploads/full_report/cpoe20808_final.pdf on October 3, 2012.
14. Bureau of Labor Statistics 2012; Accessed http://www.bls.gov/data/ on June 13 2012.
15. Lau B, Pinto B, Thiemann D, Lehmann C. Budget impact analysis of conversion from intravenous to oral
medication when clinically eligible for oral intake. Clin Ther. 2011;33(11):1792‐6.
47
16. Landrigan C, Barger L, Cade B, Ayas N, Czeisler C. Interns' compliance with accreditation council for graduate
medical education work‐hour limits. JAMA. 2006;296(9):1063‐70.
17. Accreditation Council for Graduate Medical Education 2010; Accessed
http://www.acgme.org/acwebsite/dutyhours/dh‐ComparisonTable2003v2011.pdf on July 1 2011.
18. Spetz J 2011; Accessed at California Board of Registered Nursing at
http://www.rn.ca.gov/pdfs/forms/forecasts2011.pdf on October 3, 2012.
19. Society for Hospital Medicine. Focused Survey 2008‐2009. In: Flores L, ed; 2011.
20. Brotherton S, Etzel S. Graduate Medical Education, 2008‐2009. JAMA. 2009;302(12):1357‐72.
21. American Association of Medical Colleges. AAMC Survey of Resident/Fellow Stipends and Benefits. 2008.
22. Bureau of Labor Statistics 2009; Accessed at http://www.bls.gov/ncs/ncswage2009.htm on July 13, 2011.
23. U.S. Department of Labor: Bureau of Labor Statistics 2009; Accessed http://data.bls.gov on July 1 2011.
24. Nuckols TK, Smith‐Spangler C, Morton SC, Asch SM, Patel VM, Anderson LJ, et al. Factors Influencing the
Effectiveness of Computerized Order Entry at Reducing Medication Errors and Adverse Drug Events in Hospital
Settings: A Systematic Review and Meta‐Analysis. Syst Rev. 2014;3(1):56.
25. Institute of Medicine of the National Academies. 2007; Accessed at
http://www.iom.edu/Reports/2006/Preventing‐Medication‐Errors‐Quality‐Chasm‐Series.aspx on October 3,
2012.
26. Bates DW, Kuperman GJ, Rittenberg E, Teich JM, Fiskio J, Ma'luf N, et al. A randomized trial of a computer‐based
intervention to reduce utilization of redundant laboratory tests. Am J Med. 1999 106(2):144‐50.
27. van Doormaal J, van den Bemt P, Zaal R, Egberts A, Lenderink B, Kosterink J, et al. The influence that electronic
prescribing has on medication errors and preventable adverse drug events: an interrupted time‐series study. J
Am Med Inform Assoc. 2009;16(6):816‐25.
28. Menendez MD, Alonso J, Rancano I, Corte JJ, Herranz V, Vazquez F. Impact of computerized physician order
entry on medication errors. Rev Calid Asist. 2012;27(6):334‐40.
29. Colpaert K, Claus B, Somers A, Vandewoude K, Robays H, Decruyenaere J. Impact of computerized physician
order entry on medication prescription errors in the intensive care unit: a controlled cross‐sectional trial. Crit
Care. 2006 10(1):1‐9.
30. Leung AA, Keohane C, Amato M, Simon SR, Coffey M, Kaufman N, et al. Impact of Vendor Computerized
Physician Order Entry in Community Hospitals. J Gen Intern Med. 2012.
31. Cullen D, BJ S, Bates D, Burdick E, Edmondson A, Leape L. Preventable adverse drug events in hospitalized
patients: a comparative study of intensive care and general care units. Crit Care Med. 1997 25(8):1289‐97.
32. Bates D, Leape L, Cullen D, Laird N, Petersen L, JM T, et al. Effect of computerized physician order entry and a
team intervention on prevention of serious medication errors. JAMA. 1998;280(15):1311‐6.
48
33. National Coordinating Council for Medication Error Reporting and Prevention (NCC MERP) . Accessed at Office of
the Secretariat, United States Pharmacopeia at http://www.nccmerp.org/pdf/taxo2001‐07‐31.pdf on October 3,
2012.
34. Folli H, Poole R, Benitz W, Russo J. Medication error prevention by clinical pharmacists in two children’s
hospitals. Pediatrics. 1987;79:718‐22.
35. Hayward R, Heisler M, Adams J, Dudley R, Hofer T. Overestimating outcome rates: statistical estimation when
reliability is suboptimal. Health Serv Res. 2007;42(4):1718‐38.
36. Ohsfeldt R, Ward M, Schneider J, Jaana M, Miller T, Lei Y, et al. Implementation of hospital computerized
physician order entry systems in a rural state: feasibility and financial impact. J Am Med Inform Assoc.
2005;12(1):20‐7.
37. Adams M, Anderson CR, Austin G, Buck CRJ, Buyse M, Castaldo R, et al. 2004; Accessed at First Consulting Group
for Massachusetts Technology Collaborative and the New England Healthcare Institute at
http://www.nehi.net/publications/21/treatment_plan_high_tech_transfusion_case_statement_for_implementa
tion_of_cpoe_in_all_massachusetts_hospitals on October 3, 2012.
38. First Consulting Group 2003; Accessed at http://www.leapfroggroup.org/media/file/Leapfrog‐
AHA_FAH_CPOE_Report.pdf on October 3, 2012.
39. Birkmeyer CM, Lee J, Bates DW, Birkmeyer JD. Will Electronic Order Entry Reduce Health Care Costs? Effective
Clinical Practice. 2002.
40. Kaushal R, Jha AK, Franz C, Glaser J, Shetty KD, Jaggi T, et al. Return on investment for a computerized physician
order entry system. J Am Med Inform Assoc. 2006;13(3):261‐6.
41. Congress of The United States, Congressional Budget Office. A CBO Paper: Evidence on the Costs and Benefits of
Health Information Technology. No. 2976. 2008.
42. Tierney WM, Miller ME, Overhage JM, McDonald CJ. Physician Inpatient Order Writing on Microcomputer
Workstations: Effects on Resource Utilization. JAMA. 1993;269(3):379‐83.
43. Shu K, Boyle D, Spurr C, Horsky J, Heiman H, O'Connor P, et al. Comparison of time spent writing orders on paper
with computerized physician order entry. Stud Health Technol Inform. 2001;84(Pt 2):1207‐11.
44. Bates D, Boyle D, Teich J. Impact of computerized physician order entry on physician time. Proc Annu Symp
Comput Appl Med Care. 1994:996.
45. Franklin BD, O’Grady K, Donya P, Jacklin A, Barber N. The impact of a closed‐loop electronic prescribing and
administration system on prescribing errors, administration errors and staff time: a before‐and‐after study. Qual
Saf Health Care. 2007;16:279–84.
46. Taylor R, Manzo J, Sinnett M. Quantifying value for physician order‐entry systems: a balance of cost and quality.
Healthc Financ Manage. 2002;56(7):44‐8.
49
47. Wietholter J, Sitterson S, Allison S. Effects of computerized prescriber order entry on pharmacy order‐processing
time. Am J Health Syst Pharm. 2009;66(15):1394‐8.
48. Barron W, Reed R, Forsythe S, Hecht D, Glen J, Murphy B, et al. Implementing computerized provider order entry
with an existing clinical information system. Jt Comm J Qual Patient Saf. 2006 32(9):506‐16.
49. Amusan A, Tongen S, Speedie S, Mellin A. A time‐motion study to evaluate the impact of EMR and CPOE
implementation on physician efficiency. J Healthc Inf Manag. 2008;22(4):31‐7.
50. Evans KD, Benham SW, Garrard CS. A comparison of handwritten and computer‐assisted prescriptions in an
intensive care unit. Crit Care. 1998;2(73):73‐8.
51. Nelson B. HM’s Holy Grail: Appropriate Patient Census. The Hospitalist. 2012;16(2):1.
52. Centers for Disease Control and Prevention. National Hospital Discharge Survey. 2007. Accessed at
http://www.cdc.gov/nchs/nhds/nhds_tables.htm#number on July 14 2011.
53. Oliven A, Michalake I, Zalman D, Dorman E, Yeshurun D, Odeh M. Prevention of prescription errors by
computerized, on‐line surveillance of drug order entry. Int J Med Inform. 2005;74:377‐86.
54. Shawahna R, Rahman N‐U, Ahmad M, Debray M, Yliperttula M, Decleves X. Electronic prescribing reduces
prescribing error in public hospitals. J Clin Nurs. 2011;20(21‐22):3233–45.
55. Shulman R, Singer M, Goldstone J, Bellingan G. Medication errors: a prospective cohort study of hand‐written
and computerised physician order entry in the intensive care unit. Critical Care. 2005;9(5):R516‐R21.
56. Donyai P, O’Grady K, Jacklin A, Barber N, Franklin BD. The effects of electronic prescribing on the quality of
prescribing. Br J Clin Pharmacol. 2007;65(2):230‐7.
57. Classen D, Pestotnik S, Evans R, Lloyd J, Burke J. Adverse drug events in hospitalized patients. Excess length of
stay, extra costs, and attributable mortality. JAMA. 1997;277(4):301‐6.
58. Nuckols TK, Paddock SM, Bower AG, Rothschild JM, Fairbanks RJ, Carlson B, et al. Costs of Intravenous Adverse
Drug Events in Academic and Nonacademic Intensive Care Units. Medical Care. 2008;46(1):17‐24.
59. Evans R, Classen D, Stevens L, Pestotnik S, Gardner R, Lloyd J, et al. Using a hospital information system to assess
the effects of adverse drug events. Proc Annu Symp Comput Appl Med Care. 1993. 161‐5.
60. Bates D, Spell N, Cullen D, Burdick E, Laird N, Petersen L, et al. The costs of adverse drug events in hospitalized
patients. Adverse Drug Events Prevention Study Group. JAMA. 1997;277(4):307‐11.
61. Nuckols T, Escarce J. Cost implications of ACGME's 2011 changes to resident duty hours and the training
environment. J Gen Intern Med. 2012;27(2):241‐9.
62. National Funeral Directors Association 2010; Accessed at http://www.nfda.org/about‐funeral‐service‐/trends‐
and‐statistics.html on July 20, 2011.

50
63. University of California Berkeley Max Planck Institute for Demographic Research (Germany) 2011; Accessed at
Max Planck Institute for Demographic Research (Germany). Human Mortality Database at www.mortality.org on
December 20, 2011.
64. Center for the Evaluation of Value and Risk in Health; Accessed at Tufts Medical Center, Institute for Clinical
Research and Health Policy Studies at https://research.tufts‐
nemc.org/cear4/SearchingtheCEARegistry/FAQs.aspx on August 21 2012.
65. Erickson P, Wilson R, Shannon I April 1995; Accessed at Centers for Disease Control and Prevention National
Center for Health Statistics; No. 7 at http://www.cdc.gov/nchs/data/statnt/statnt07.pdf on October 3, 2012.
66. United States Census Bureau. Population estimates 2009. Accessed at
http://www.census.gov/popest/data/national/asrh/2009/index.html on November 20, 2011.
67. Jha A, DesRoches C, Kralovec P, Joshi M. A progress report on electronic health records in U.S. hospitals. Health
Aff (Millwood). 2010;29(10):1951‐7.