Energy profiling profiling of large of large scale applications ...
Upload
khangminh22Category
view
0download
0
2015
PISA
A Review of International Large-Scale Assessments in Education
ASSESSING COMPONENT SKILLS AND COLLECTING CONTEXTUAL DATA
This report reviews the major international and regional large-scale educational assessments, including international surveys, school-based surveys and household-based surveys. The report compares and contrasts the cognitive and contextual data collection instruments and implementation methods used by the different assessments in order to identify practices that are recognised as being effective. It also identifies assessment practices that are particularly likely to be useful for developing countries.
The findings of this report are being used by the OECD to support its efforts to make PISA more relevant to a wider range of countries, and by the World Bank as part of its on-going dialogue with its client countries regarding participation in international large-scale assessments.
ContentsChapter 1. Overview: Lessons from international large-scale assessments in educationChapter 2. Methodology for the review of international large-scale assessments in educationChapter 3. Component skills and cognitive instruments used in educational assessmentsChapter 4. Contextual data collection instruments used in educational assessmentsChapter 5. Implementation procedures and approaches to including out-of-school children in educational assessmentsChapter 6. Analysis, reporting and use of data from international large-scale assessments in education
Consult this publication on line at: http://dx.doi.org/10.1787/9789264248373-en
This work is published on the OECD iLibrary, which gathers all OECD books, periodicals and statistical databases. Visit www.oecd-ilibrary.org and do not hesitate to contact us for more information.
789264 2483429
ISBN 978-92-64-24834-2 98 2015 04 1P
PIS
A
A
Review
of In
ternatio
nal L
arge
-Scale A
ssessmen
ts in Ed
ucatio
n AS
SE
SS
ING
CO
MP
ON
EN
T S
KILLS
AN
D C
OLLE
CT
ING
CO
NT
EX
TU
AL D
ATA
Programme for International Student Assessment
FOR DEVELOPMENT
PISA
A Review of International Large-Scale Assessments in EducationASSESSING COMPONENT SKILLS AND COLLECTING CONTEXTUAL DATA


PISA
A Review of InternationalLarge-Scale Assessments
in Education
ASSESSING COMPONENT SKILLSAND COLLECTING CONTEXTUAL DATA
John Cresswell, Ursula Schwantnerand Charlotte Waters

The opinions expressed and arguments employed herein are solely those of the authors
and do not necessarily reflect the official views of the OECD, its member countries, the
World Bank, its Board of Executive Directors, or of the governments they represent.
This document and any map included herein are without prejudice to the status of or
sovereignty over any territory, to the delimitation of international frontiers and boundaries
and to the name of any territory, city or area.
ISBN 978-92-64-24834-2 (print)ISBN 978-92-64-24837-3 (PDF)
Series: PISAISSN 1990-8539 (print)ISSN 1996-3777 (online)
The statistical data for Israel are supplied by and under the responsibility of the relevant Israeli authorities. The useof such data by the OECD is without prejudice to the status of the Golan Heights, East Jerusalem and Israelisettlements in the West Bank under the terms of international law.
The names of countries and territories used in this joint publication follow the practice of the OECD.
Photo credits: Cover © Epicurean / iStockphoto © Ian Lishman / Juice Images / Inmagine LTD © Istockphoto / HenkBadenhorst © Steve Debenport / iStockphoto
Corrigenda to OECD publications may be found on line at: www.oecd.org/about/publishing/corrigenda.htm.
© OECD and the International Bank for Reconstruction and Development/The World Bank 2015.
This work is available under the Creative Commons Attribution-NonCommercial-NoDerivatives 3.0 IGO license (CC BY-NC-ND 3.0 IGO)
http://creativecommons.org/licenses/by-nc-nd/3.0/igo/deed.en, you are free to copy and redistribute the material, provided the use is for
non-commercial purposes, under the following conditions: Attribution - Please cite the work as follows: Cresswell, J., U. Schwantner and C.
Waters (2015), A Review of International Large-Scale Assessments in Education: Assessing Component Skills and Collecting Contextual Data, PISA, The
World Bank, Washington, D.C./OECD Publishing, Paris. http://dx.doi.org/10.1787/9789264248373-en. License: Creative Commons Attribution
CC BY-NC-ND 3.0 IGO. Third-party content - The OECD or the World Bank do not necessarily own each component of the content contained
within the work. Therefore, neither the OECD nor the World Bank warrant that the use of any third-party owned individual component or
part contained in the work will not infringe on the rights of those third parties. The risk of claims resulting from such infringement rests
solely with you. If you wish to re-use a component of the work, it is your responsibility to determine whether permission is needed for that
re-use and to obtain permission from the copyright owner. Examples of components can include, but are not limited to, tables, figures, or
images. All requests for commercial use or queries on rights and licenses should be addressed to OECD e-mail: [email protected]. Requests for
permission to photocopy portions of this material for commercial use should be addressed directly to the Copyright Clearance Center (CCC)
at [email protected] or the Centre français d'exploitation du droit de copie (CFC) at [email protected].
Please cite this publication as:Cresswell, J., U. Schwantner and C. Waters (2015), A Review of International Large-Scale Assessments inEducation: Assessing Component Skills and Collecting Contextual Data, PISA, The World Bank,Washington, D.C./OECD Publishing, Paris.http://dx.doi.org/10.1787/9789264248373-en

FOREWORD – 3
A REVIEW OF INTERNATIONAL LARGE-SCALE ASSESSMENTS IN EDUCATION: ASSESSING COMPONENT SKILLS AND COLLECTING CONTEXTUAL DATA © OECD AND THE WORLD BANK 2015
Foreword
In the past two decades there has been a strong emphasis on increasing access to education for children around the globe. The Education for All goals established in Jomtien, Thailand in 1990 reflected a strong commitment by countries to meeting basic learning needs for their children. The commitment to improving “Learning for All” was restated in 2000 in the Dakar Framework for Action, in which Goal 6 emphasised improving the quality of education (UNESCO, 2000). At the same time, the Millennium Development Goal (MDG) 2 also included a focus on all children and youth completing primary school.
While it is true that there has been a significant increase in the number of children attending school, there has also been an increasing concern about the level of learning taking place. The 2012 Education for All Global Monitoring Report estimated that at least 250 million primary school age children around the world are not able to read, write or count well enough to meet minimum learning standards, including those children who have spent at least four years in school (UNESCO, 2012).
In the wake of these concerns there has been a widening of the focus from simply access to education to access plus learning (LMTF, 2013). Indeed, the Sustainable Development Goals (SDG) adopted by the world at the United Nations General Assembly in September 2015 to succeed the MDGs includes an education goal that emphasises inclusive and equitable quality education and lifelong learning for all. In addition, the World Bank’s Strategy 2020 (World Bank, 2011) aims to promote country-level reforms of education systems to achieve “learning for all”. This emphasis on education quality and learning outcomes has led to increased interest in and demand for national, regional and international large-scale learning assessment.
While national assessments collect valuable data on education quality and performance development within a particular system, data from international assessments allow for a comparison across education systems, giving countries the opportunity to share techniques, organisational structures and policies that have proven efficient and successful. “Some countries achieve much higher levels of educational performance, in terms of system operation as well as outcomes, than would be expected based on their incomes. Detailed and internationally comparable information about education systems helps identify these strong performers in specific areas ... while also flagging weaknesses in other areas.” (World Bank, 2011: 32)
International educational assessments have been part of the global scene since 1964, when the International Association for the Evaluation of Educational Achievement (IEA) conducted the first internationally comparative study in mathematics in which 12 countries participated. Since that time there has been a large increase in the number of international global and regional educational assessments. These are aimed at a variety of grade levels, for example, Grade 4 (Progress in International Reading Literacy Study, or PIRLS, and Trends in International Mathematics and Science Study, or TIMSS) and

4 – FOREWORD
A REVIEW OF INTERNATIONAL LARGE-SCALE ASSESSMENTS IN EDUCATION: ASSESSING COMPONENT SKILLS AND COLLECTING CONTEXTUAL DATA © OECD AND THE WORLD BANK 2015
Grade 8 (TIMSS) – and include a number of different subjects to be assessed – for example, reading, mathematics and science (Programme for International Student Assessment, or PISA) and students’ knowledge of civics and citizenship (International Civic and Citizenship Study, or ICCS).
The OECD’s PISA survey has been implemented in a growing number of countries since it was first administered to 28 OECD member countries and 4 partner countries in 2000. In recent years the OECD has launched the PISA for Development project, which aims to increase developing countries’ use of PISA data to monitor progress towards national targets for improvement. It will do this using enhanced PISA survey instruments that are more relevant for the contexts found in developing countries and at the same time produce scores that are comparable to the standard PISA surveys (OECD, 2015).
This report compares and contrasts approaches regarding cognitive and contextual data collection instruments and implementation of the different international learning assessments, to identify assessment practices that are recognised as being effective. The findings will inform the PISA for Development assessment and, at the same time, act as a detailed reference for those involved in educational assessments – national, regional and international.
References
LMTF (2013), Toward Universal Learning: Recommendations from the Learning Metrics Task Force, UNESCO Institute for Statistics and Center for Universal Education at the Brookings Institution, Montreal and Washington DC.
OECD (2015), “PISA for Development”, www.oecd.org/pisa/aboutpisa/pisafordevelopment.htm (accessed 5 August 2015).
UNESCO (2012), EFA Global Monitoring Report 2012: Youth and Skills, Putting Education to Work, UNESCO, Paris, http://unesco.nl/sites/default/files/dossier/2012_gmr.pdf.
UNESCO (2000), Dakar Framework for Action, Education for All: Meeting our Collective Commitments, UNESCO, Paris, www.unesco.at/bildung/basisdokumente/dakar_aktionsplan.pdf.
World Bank (2011), Learning for All: Investing in People's Knowledge and Skills to Promote Development: World Bank Group Education Strategy 2020, World Bank, Washington DC, http://biblioteka-krk.ibe.edu.pl/opac_css/doc_num.php?explnum_id =201.

ACKNOWLEDGEMENTS – 5
A REVIEW OF INTERNATIONAL LARGE-SCALE ASSESSMENTS IN EDUCATION: ASSESSING COMPONENT SKILLS AND COLLECTING CONTEXTUAL DATA © OECD AND THE WORLD BANK 2015
ACKNOWLEDGEMENTS
This report was produced with the support of the World Bank through its Russia Education Aid for Development (READ) Trust Fund programme, as part of its contribution to the PISA for Development project. PISA for Development is an initiative of the OECD, development partners and participating countries that aims to identify how PISA can best support evidence-based policy making in emerging and developing economies and contribute to the UN-led definition of global learning goals for the post-2015 agenda. In addition, the PISA for Development project will help to build country capacity in assessment, analysis and use of results for monitoring and improvement among participating countries.
This report was authored by John Cresswell, Ursula Schwantner and Charlotte Waters of The Australian Council for Educational Research (ACER) as part of the PISA for Development project. The attributed authors of this report were supported by other ACER staff members Petra Lietz, Juliette Mendelovits, Ross Turner, Naoko Tabata, Stephanie Templeton, Mollie Tobin and Mary Kimani.
The authors wish to thank Michael Ward, OECD, and Marguerite Clarke, World Bank, for suggesting this project. Without their support and guidance throughout it would not have been possible. Pablo Zoido, OECD, also provided valuable input and guidance throughout. In addition, the World Bank’s Education Practice Managers provided much appreciated guidance early on in terms of key questions to be addressed by the study. The report also benefitted from the critical comments and suggestions of the staff of the reviewed assessment programmes and would not have been possible without their co-operation.
Editorial and administrative services were provided by Jennifer Cannon and Kelly Makowiecki (OECD) and the layout work was done by Elizabeth Zachary.


TABLE OF CONTENTS – 7
A REVIEW OF INTERNATIONAL LARGE-SCALE ASSESSMENTS IN EDUCATION: ASSESSING COMPONENT SKILLS AND COLLECTING CONTEXTUAL DATA © OECD AND THE WORLD BANK 2015
Table of contents
Abbreviations .................................................................................................................................... 11 Executive summary ........................................................................................................................... 13 Chapter 1 Overview: Lessons from international large-scale assessments in education ............ 17
Component skills and cognitive assessments .................................................................................. 18 Contextual data collection instruments ........................................................................................... 23 Implementation procedures, methods and approaches to include out-of-school children, and use of data .............................................................................................................................................. 29 References ....................................................................................................................................... 35
Chapter 2 Methodology for the review of international large-scale assessments in education .. 37 Methodology ................................................................................................................................... 38 Survey classification ....................................................................................................................... 39 PISA for Development participating countries ............................................................................... 39 References ....................................................................................................................................... 42
Chapter 3 Component skills and cognitive instruments used in educational assessments ......... 43 Assessment frameworks .................................................................................................................. 44 Item development ............................................................................................................................ 51 Test design....................................................................................................................................... 54 Psychometric analyses, scaling, calibration and equating methods ................................................ 59 Cross-country comparability ........................................................................................................... 60 Trends .............................................................................................................................................. 61 Proficiency levels ............................................................................................................................ 62 Translating, adapting and verifying cognitive instruments ............................................................. 63 Field trial and item selection ........................................................................................................... 65 References ....................................................................................................................................... 67
Chapter 4 Contextual data collection instruments used in educational assessments .................. 69 Types of contextual data collection instruments and mode of delivery .......................................... 70 Development of contextual data collection instruments ................................................................. 72 Translating, adapting and verifying contextual data collection instruments ................................... 78 Main factors and variables for PISA-D ........................................................................................... 81 Technical aspects of contextual data collection instruments ........................................................... 95 Socio-economic and poverty-related measures ............................................................................... 99 References ..................................................................................................................................... 106

8 – TABLE OF CONTENTS
A REVIEW OF INTERNATIONAL LARGE-SCALE ASSESSMENTS IN EDUCATION: ASSESSING COMPONENT SKILLS AND COLLECTING CONTEXTUAL DATA © OECD AND THE WORLD BANK 2015
Chapter 5 Implementation procedures and approaches to including out-of-school children in educational assessments ............................................................................................................. 109
Implementation procedures ........................................................................................................... 110 Survey implementation ................................................................................................................. 113 Standardising implementation ....................................................................................................... 121 Methods and approaches to include out-of-school children .......................................................... 125 References ..................................................................................................................................... 130
Chapter 6 Analysis, reporting and use of data from international large-scale assessments in education .......................................................................................................................................... 133
Analytical approaches used for reporting ...................................................................................... 134 Reports and communication of results .......................................................................................... 138 Use of data and results .................................................................................................................. 142 Implications ................................................................................................................................... 145 References ..................................................................................................................................... 147
Annex A General information about the international surveys reviewed ................................. 151 Main characteristics of the surveys ............................................................................................... 157 References ..................................................................................................................................... 171
Annex B Sample items from selected international assessments ................................................ 175 Sample items from PIRLS ............................................................................................................. 175 Sample items from TIMSS ............................................................................................................ 180 Sample items from LAMP ............................................................................................................ 182 Sample item from PIAAC Reading Components .......................................................................... 184
Annex C Overview tables related to cognitive data collection instruments ............................... 185 References ..................................................................................................................................... 200
Annex D Overview tables of contextual data collection instruments ......................................... 203 References ..................................................................................................................................... 236
Tables
Table 2.1 Countries participating in PISA-D according to geographical location, DAC-ODA recipient-status and participation in the international surveys reviewed ........................... 40
Table 3.1 Target distribution of tasks by situation for PISA 2015 ..................................................... 45 Table 3.2 Target distribution of tasks by text format for PISA 2015 ................................................. 45 Table 3.3 Approximate distribution of tasks by aspect for PISA 2015 .............................................. 46 Table 3.4 Approximate distribution of score points by process category for PISA 2015 ................... 48 Table 3.5 Approximate distribution of score points by content category for PISA 2012 ................... 48 Table 3.6 Approximate distribution of score points by context category for PISA 2012 ................... 48 Table 3.7 Major components of the PISA 2015 Framework for Scientific Literacy .......................... 50 Table 3.8 SERCE test and booklet design .......................................................................................... 56 Table 3.9 Literacy and numeracy items in the PIAAC main study .................................................... 57 Table 3.10 Translated languages in other assessments ....................................................................... 64 Table A.1 Overview of the reviewed assessments ............................................................................ 152 Table C.1 Reading frameworks for other assessments ..................................................................... 185 Table C.2 Mathematics frameworks from other assessments ........................................................... 188

TABLE OF CONTENTS – 9
A REVIEW OF INTERNATIONAL LARGE-SCALE ASSESSMENTS IN EDUCATION: ASSESSING COMPONENT SKILLS AND COLLECTING CONTEXTUAL DATA © OECD AND THE WORLD BANK 2015
Table C.3 Science frameworks from other assessments ................................................................... 190 Table C.4 Item development in other assessments ........................................................................... 191 Table C.5 Scaling methodology in other assessments ...................................................................... 193 Table C.6 Cross-country comparability measures in other assessments ........................................... 194 Table C.7 Measuring trends in other assessments ............................................................................ 195 Table C.8 Use of proficiency levels in other assessments ................................................................ 196 Table C.9 Translation procedures in other assessments ................................................................... 197 Table C.10 Field trial processes in other assessments ...................................................................... 198 Table D.1 Type of contextual data collection instruments used in the surveys and their mode of
delivery ............................................................................................................................ 203 Table D.2 Developing contextual data collection instruments: Bodies involved and main steps .... 205 Table D.3 Languages of contextual data collection instruments, and translation, adaptation and
verification ...................................................................................................................... 208 Table D.4 Factors and variables for the seven key topics at individual, family, classroom and
school level: International large-scale surveys ................................................................ 211 Table D.5 Factors and variables for the seven key topics at individual, family, classroom and
school level: School-based surveys ................................................................................. 220 Table D.6 Factors and variables for the seven key topics at individual, family, school and
village level: Household-based surveys (child population) ............................................. 222 Table D.7 Factors and variables regarding the seven key topics at individual level:
Household-based surveys (adult population) .................................................................. 225 Table D.8 Scaling/computing of relevant contextual constructs in international surveys reviewed 227 Table D.9 SES-related measures in the surveys reviewed ................................................................ 233


ABBREVIATIONS – 11
A REVIEW OF INTERNATIONAL LARGE-SCALE ASSESSMENTS IN EDUCATION: ASSESSING COMPONENT SKILLS AND COLLECTING CONTEXTUAL DATA © OECD AND THE WORLD BANK 2015
Abbreviations
ALL Adult Literacy and Life Skills Survey
ACER Australian Council for Educational Research
ASER Annual Status of Education Report
CONFEMEN Conference of the Ministers of Education of French-speaking countries
DAC Development Assistance Committee
EGMA Early Grade Mathematics Assessment
EGRA Early Grade Reading Assessment
ESCS Economic, social and cultural status
ETS Educational Testing Service
GDP Gross domestic product
HISEI Highest International Social and Economic Index
IALS Adult Literacy Survey
ICCS International Civic and Citizenship Study
IEA International Association for the Evaluation of Educational Achievement
IIEP International Institute for Educational Planning
IRT Item response theory
ISCED International Standard Classification of Education
ISCO International Standard Classification of Occupations
ISEI International Socio-Economic Index
LAMP Literacy Assessment and Monitoring Programme
LLECE Latin American Laboratory for Assessment of the Quality of Education
NPM National project manager
NRC National research co-ordinator
ODA Official development assistance
OREALC Regional Bureau of Education for Latin America and the Caribbean
PASEC CONFEMEN Programme for the Analysis of Education Systems

12 – ABBREVIATIONS
A REVIEW OF INTERNATIONAL LARGE-SCALE ASSESSMENTS IN EDUCATION: ASSESSING COMPONENT SKILLS AND COLLECTING CONTEXTUAL DATA © OECD AND THE WORLD BANK 2015
PERCE First Regional Comparative and Explanatory Study
PGB PISA Governing Board
PIAAC Programme for the International Assessment of Adult Competencies
PIRLS Progress in International Reading Literacy Study
PISA Programme for International Student Assessment
PISA-D PISA for Development
PPS Probability proportional to size
PRELAC Regional Education Project for Latin America and the Caribbean
PSU Primary sampling unit
RTI Research Triangle Institute
SACMEQ The Southern and Eastern Africa Consortium for Monitoring Educational Quality
SERCE Second Regional Comparative and Explanatory Study
SES Socio-economic status
SSME Snapshot of School Management Effectiveness
STEP Skills Toward Employment and Productivity
TERCE Third Regional Comparative and Explanatory Study
TIMSS Trends in International Mathematics and Science Study
UIS UNESCO Institute for Statistics
UNESCO United Nations Educational, Scientific and Cultural Organization
USAID United States Agency for International Development
WEI-SPS World Education Indicators’ Survey of Primary Schools

EXECUTIVE SUMMARY – 13
A REVIEW OF INTERNATIONAL LARGE-SCALE ASSESSMENTS IN EDUCATION: ASSESSING COMPONENT SKILLS AND COLLECTING CONTEXTUAL DATA © OECD AND THE WORLD BANK 2015
Executive summary
The OECD has initiated PISA for Development (PISA-D) in response to the rising need of developing countries to collect data about the performance of their education systems and the capacity of their student bodies and in the context of the Education 2030 agenda which emphasises improved learning outcomes. This report has been commissioned by the OECD and the World Bank to inform the development and implementation of PISA-D but it also serves a wider interest in the experiences and lessons from the major international, regional and national large-scale educational assessments.
This report reviews the major large-scale learning assessments, including school-based surveys and household-based surveys. It aims to compare and contrast approaches regarding the instruments that are used to collect data on (a) component skills and cognitive instruments, (b) contextual frameworks, and (c) the implementation of the different international assessments, as well as approaches to include children who are not at school, and the ways in which data are used. It then seeks to identify assessment practices in these three areas that will be useful for the OECD and developing countries. For each of the issues discussed, there is a description of the prevailing international situation, followed by a consideration of the issue for developing countries and then a description of the relevance of the issue to PISA-D. A summary of the main characteristics of the reviewed surveys is given in Annex A.
The study makes many recommendations, particularly in respect of PISA-D, and the main ones are summarised as follows.
Component skills and cognitive assessment
• Assessment frameworks: For developing countries, it will be essential that any assessment has an agreed framework which has been arrived at through a process of discussion and negotiation, guided by experts in the field and by the countries participating in the assessment.
• Item development: Across the major international assessments there is a well-established procedure for the creation of new items. The procedure for item development in developing countries should follow this process.
• Test design: PISA-D should use a rotated booklet design allowing different students to be assessed on different parts of the framework.
• Psychometric analyses, scaling, calibration and equating methods: In developing countries, item response theory will deliver an accurate picture of student capacity across a wide range of item difficulties. It is recommended that the parameters used in scaling regular PISA should be adopted for PISA-D.

14 – EXECUTIVE SUMMARY
A REVIEW OF INTERNATIONAL LARGE-SCALE ASSESSMENTS IN EDUCATION: ASSESSING COMPONENT SKILLS AND COLLECTING CONTEXTUAL DATA © OECD AND THE WORLD BANK 2015
• Cross-country comparability: A differential item functioning process is usually undertaken at the field trial stage to identify any items that give an advantage or disadvantage to a particular country. It is recommended that PISA-D undertake a similar process.
• Trends: It will be important for developing countries to be able to quantify improvements by using assessments which include some of the same items from one test administration to the next.
• Proficiency levels: In PISA-D, an appropriately targeted test and the subsequent division of students into the various proficiency levels will provide extremely valuable information to the education ministries in the participating countries.
• Translation, adaptation and verification of cognitive instruments: It is recommended that the PISA-D project adopts the highest standards now operating in global assessments: that is, the double translation method.
Contextual data collection instruments
• Types of contextual data collection instruments and mode of delivery: PISA-D should give careful consideration to the types of questionnaires implemented, in order to collect the most essential contextual information in the most efficient way. It will be important to calculate a cost/value ratio for various contextual data collection instruments.
• Translating, adapting and verifying contextual data collection instruments: It is important to consider which languages are the most appropriate ones for the different groups of respondents. Questionnaires are preferably translated into the languages in which students, teachers, principals and parents are expected to be proficient.
• Main factors and variables: Regarding early learning opportunities, the PIRLS and TIMSS Learning to Read Survey (for parents), the LLECE questions about early reading and how often someone at home reads aloud to the child, and the questions about out-of-school status from ASER and Uwezo may all be of interest to PISA-D. Regarding language at home and school, a number of assessments contain items that may be relevant for PISA-D. For example, PIRLS and TIMSS contain questions about the frequency of speaking the language of the test at home and the language spoken by the student before school enrolment. PIRLS and TIMSS also ask if the books at home (“books at home” as used as an indicator for socio-economic status) are mainly in the test language.
• Technical aspects of contextual data collection instruments: Regarding question formats, PISA-D should include item formats that allow for an adjustment of self-reported measures. PISA-D should also undertake analyses to examine the extent of different patterns of response styles in participating countries.
• Socio-economic status and poverty-related measures: The surveys reviewed contain several good examples for socio-economic status (SES) and poverty-related measures relevant to PISA-D. SACMEQ, PASEC and LLECE include SES-related indices. SACMEQ and WEI-SPS include school and classroom measures that are related to SES.

EXECUTIVE SUMMARY – 15
A REVIEW OF INTERNATIONAL LARGE-SCALE ASSESSMENTS IN EDUCATION: ASSESSING COMPONENT SKILLS AND COLLECTING CONTEXTUAL DATA © OECD AND THE WORLD BANK 2015
Implementation procedures, methods and approaches to include out-of-school children, and use of data
• Sampling: Some countries do not maintain complete and up-to-date lists of schools. PISA-D will need to construct a school sampling frame that satisfies PISA’s technical standards in these countries.
• Data collection: PISA-D should consider interview sessions to collect contextual data from respondents other than students. These respondents might include principals and teachers. It may be useful to implement: a tablet-based data collection tool to eliminate recording errors; cognitive test administration over multiple days; permitting extra time to complete cognitive assessments; establishing on-site test administrator checks of student booklets to reduce the incidence of missing/discrepant data; and sourcing test administrators who are local to the sites of test administration as a means of securing community engagement and buy-in.
• Standardising implementation: Articulation of standards could be included in memoranda of understanding or project implementation plans, as well as in a dedicated standards document. Including the standards in documents that are specific to each participating country, rather than general documents, may assist each country to be fully aware of its responsibilities with respect to the standards. A description of standards could be used as an opportunity to reflect the project’s underlying values and ideology in a way that will help to secure local commitment to the project and acceptance of its results.
• Methods and approaches to include out-of-school children: Input should be sought from ASER and Uwezo and perhaps the other household-based assessments about how often they encounter problems with outdated sampling frames and how these are dealt with.
• Analysis, reporting and use of data: The use of benchmarks in the reviewed surveys should be examined. PISA-D should consider whether benchmarks might be incorporated into PISA-D analysis and reporting. Benchmarks that define minimum expected levels of performance may become increasingly relevant in the context of the post-2015 development goals and targets for education quality.


CHAPTER 1 – OVERVIEW: LESSONS FROM INTERNATIONAL LARGE-SCALE ASSESSMENTS IN EDUCATION – 17
A REVIEW OF INTERNATIONAL LARGE-SCALE ASSESSMENTS IN EDUCATION: ASSESSING COMPONENT SKILLS AND COLLECTING CONTEXTUAL DATA © OECD AND THE WORLD BANK 2015
Chapter 1
Overview: Lessons from international large-scale assessments in education
The purpose of this chapter is to provide an overview of the main findings of the review of international large-scale learning assessments. In particular, the chapter summarises the practices of these assessments that are recognised as being effective, especially in the context of developing countries and draws lessons from them for the benefit of the PISA for Development (PISA-D) initiative. These findings and lessons are identified and presented in three main areas: i) component skills and cognitive assessments; ii) contextual data collection instruments; and iii) implementation procedures, methods and approaches to include out-of-school children, and the use of data.

18 – CHAPTER 1 – OVERVIEW: LESSONS FROM INTERNATIONAL LARGE-SCALE ASSESSMENTS IN EDUCATION
A REVIEW OF INTERNATIONAL LARGE-SCALE ASSESSMENTS IN EDUCATION: ASSESSING COMPONENT SKILLS AND COLLECTING CONTEXTUAL DATA © OECD AND THE WORLD BANK 2015
This report is the product of a review of a number of large-scale international learning assessments, including school-based surveys and household-based surveys.
The review covered all aspects of the surveys’ approaches for assessing and reporting on component skills, from assessment frameworks and item development, through test design and mode of delivery, to analysis and reporting proficiency. Translation, field trialling and final item selection were also covered.
The review also looked at all aspects of the surveys’ approaches to collecting and reporting contextual information, including the development of contextual data collection instruments, their translation and adaptation, the main factors and variables used, question formats, scaling, relevant constructs and cross-country comparability.
The review also considered how the surveys were implemented, methods and approaches for including out-of-school children, and the analysis, reporting and use of data.
The review has endeavoured to identify the approaches in these surveys that may be instructive for PISA for Development (PISA-D). The following subsections present the main findings and options for each of the three areas of the review.
Component skills and cognitive assessments
Assessment frameworks The major international assessments produce clear frameworks to describe the
philosophy, content, test design and response styles of their tests. These frameworks not only guide the creation of items (questions or tasks in a test paper) for the test, but also act as a way of communicating information about the assessment to the broader community.
• The majority of the international school-based assessments described in this report have a strong curricular focus, as opposed to the Programme for International Student Assessment (PISA) approach of preparedness for the future. This may also be a reflection of the target group – in PISA it is at the end of compulsory schooling in most OECD countries, whereas most of the other assessments are given at an earlier time in a student’s educational career, giving the opportunity to implement remedial interventions where appropriate. It is possible that PISA-D countries might find a curricular approach more suitable to their needs.
• There may be a higher proportion of students not in school at age 15 in the PISA-D countries than in OECD countries. PISA-D could opt to do an assessment at an earlier age, not only to increase the coverage of students, but also to give the opportunity to implement improvements before the end of students’ education.
• The inclusion of science as an area of assessment occurs only in a minority of assessments. It may be worth limiting the PISA-D assessment to language and mathematics.
• A collaborative approach to the development of the assessment frameworks is a characteristic of many of the assessments. If PISA-D were to adopt such an approach, it may lead to a more relevant assessment and encourage better engagement by countries.
CHAPTER 1 – OVERVIEW: LESSONS FROM INTERNATIONAL LARGE-SCALE ASSESSMENTS IN EDUCATION – 19
A REVIEW OF INTERNATIONAL LARGE-SCALE ASSESSMENTS IN EDUCATION: ASSESSING COMPONENT SKILLS AND COLLECTING CONTEXTUAL DATA © OECD AND THE WORLD BANK 2015
Item development Across the major international assessments there is a well-established procedure for
creating new items for a major assessment. This generally follows the steps of item generation, item panelling, cognitive trialling, field trialling and main study selection. Items are reviewed throughout the process by participating countries, but especially before and after the field trial, as preparations are made to choose which items will be included in the main study.
While there will be no new item development in PISA-D, we recommend adopting the process described for any future process to create items. While items could be imported from other assessments, it is important to realise that their characteristics can only by assessed by testing them with the specific target populations for which they are intended. An item that is suitable in one context will not necessarily be suitable in another.
• The established process in PISA and many assessments involves the steps of item generation, item panelling, cognitive trialling, field trial and main study selection. PISA-D should follow this process when creating new items.
• While items from other assessments were not made available for this review, such as Progress in International Reading Literacy Study (PIRLS), Trends in International Mathematics and Science Study (TIMSS) and the Southern and Eastern Africa Consortium for Monitoring Educational Quality (SACMEQ), items’ characteristics can only by assessed by testing them with the specific target populations for which they are intended. An item that is suitable in one context is not necessarily going to be suitable in another.
• A collaborative approach to item development is a characteristic of many of the assessments. If PISA-D were to adopt such an approach, it may lead to a greater commitment on the part of the countries in the assessments.
Test design The assessment frameworks developed by the assessments reviewed tend to cover a
very wide range of material: more than can be included in one test per student. To cover this range, it has been necessary to incorporate a test design in which each student is assessed on only part of that framework. This has led to a “rotated” booklet design, with common items across the booklets allowing scaling to take place to generate an overall view of student capacity. At this point in time, the assessments are still delivered mostly by paper and pencil, although a move to computer-delivered tests will take place in the next few years in many assessments.
In developing countries assessment frameworks are also expected to cover a wide range of material. This would suggest that PISA-D should also use a rotated booklet design, allowing different students to be assessed on different parts of the framework. While paper-and-pencil tests are more widely accepted and easily administered, the advantages of delivering tests by electronic tablets are also worth considering. Experience has shown that tablets can be used in populations totally unfamiliar with this technology. Delivery via tablet has the advantages of increasing student interest and eliminating expensive data-entry procedures. However, the disadvantages are that there may be extra set-up costs and that strict uniformity across countries is required – which can sometimes be difficult given that countries may be at different stages of technological development.

20 – CHAPTER 1 – OVERVIEW: LESSONS FROM INTERNATIONAL LARGE-SCALE ASSESSMENTS IN EDUCATION
A REVIEW OF INTERNATIONAL LARGE-SCALE ASSESSMENTS IN EDUCATION: ASSESSING COMPONENT SKILLS AND COLLECTING CONTEXTUAL DATA © OECD AND THE WORLD BANK 2015
One of the main attractions of PISA-D is its immediate link to regular PISA. Any difference in the mode of delivery will make this link much more difficult or impossible to establish.
• A large range of item types and difficulties needs to be included in the test.
• This will be best done with a multi-booklet approach that includes some common items, to allow linking between the booklets.
• Regard should be given to the mode of delivery of the test. Many of the tests examined here are paper-and-pencil tests. However, the Australian Council for Educational Research (ACER) has recently successfully implemented tests using tablet computers, in Lesotho, Afghanistan and remote Indigenous communities in Australia. This form of test delivery is worth considering. There are advantages to this approach:
Students are more stimulated by the test experience.
Students easily master the equipment, even when they have never seen a tablet before.
Innovations such as sound can be easily introduced, thereby accommodating students with sight difficulty.
Student responses are captured instantly, alleviating the need for an expensive data-entry process.
Data-entry errors are eliminated.
Data management is much easier and more secure; data loss is reduced; and data can be uploaded whenever administrators have a reliable Internet connection.
Tablets can be re-used many times.
Psychometric analyses, scaling, calibration and equating methods Major international assessments have adopted “item response theory” scaling as the
means of analysing student responses to an assessment. This theory, built on the Rasch model,1 allows a clear picture of student capacity to be drawn, see the details provided in section 3.4. In developing countries, item response theory will deliver an accurate picture of student capacity across a wide range of item difficulties.
It is recommended that the parameters used in scaling standard PISA should be adopted for PISA-D. This will allow countries to compare their own results with PISA more easily.
• Item response theory scaling is the preferred method of analysing student data. This type of scaling is based on continuous interaction between the student’s capacity and an item’s difficulty. This gives a clear picture of the students’ capacity.
• Item response theory scaling allows one test to be linked to another test by including common items in both. This can be done over successive years to gain an accurate picture of a student’s educational growth.

CHAPTER 1 – OVERVIEW: LESSONS FROM INTERNATIONAL LARGE-SCALE ASSESSMENTS IN EDUCATION – 21
A REVIEW OF INTERNATIONAL LARGE-SCALE ASSESSMENTS IN EDUCATION: ASSESSING COMPONENT SKILLS AND COLLECTING CONTEXTUAL DATA © OECD AND THE WORLD BANK 2015
• PISA uses a one-parameter model based on the item difficulty. The International Association for the Evaluation of Educational Achievement (IEA) in PIRLS and TIMSS employs a three-parameter model. Use of a one-parameter model in PISA-D would facilitate comparisons to PISA.
Cross-country comparability To be able to establish the student capacity of one country – and then for that country
to be able to compare results with other countries – is a central aim of the large-scale assessments. This allows countries to share information and techniques to improve learning for their students. A “differential item functioning process” is usually undertaken at the field trial stage to identify any item-by-country interactions. This will identify any items that work to a particular country’s advantage or disadvantage. How confident a country is to get involved in the process may depend on how fairly they feel they are being treated. When developing countries get involved in internationally comparable assessments they must be confident that their students are being compared in an unbiased manner to all the other countries in the assessment.
• We recommend undertaking a differential item functioning process in PISA-D to identify any item-by-country interactions, in a similar way to the process used in PISA. This will identify any items that work to a particular country’s advantage or disadvantage. How confident a country is to become involved in the process depends on the perception that they are being treated fairly.
Trends The different assessments use a variety of approaches to measure change over time.
In PIRLS, a number of blocks of items are used from one assessment to another. PISA keeps most items secure from one survey to the next so that they can be re-used.
The PISA-D countries will be able to access the normal PISA measurement of trends if the surveys are administered regularly.
• One of the biggest attractions to countries wanting to participate is being able to monitor changes over time. PISA-D will need to include a selection of the same items from one survey administration to the next. This has implications for maintaining security for those items, which if they enter the public domain cannot be used confidently for this purpose.
Proficiency levels Student results reported as a single number or grade do little to describe the capacity
of the student population. Closely examining the items that a student can do will provide a much more accurate and useful measure of the individual’s capacity. Nearly all the global and regional assessments undertake the process of dividing the students into a number of different levels of proficiency so that participating countries will obtain a better picture of their own students’ strengths and weaknesses. The profile of percentages of students at the different levels gives valuable direction to the countries in deciding between possible intervention strategies. Arriving at described proficiency levels involves examining the items grouped according to their difficulty and then describing the tasks that are needed to complete these items.
22 – CHAPTER 1 – OVERVIEW: LESSONS FROM INTERNATIONAL LARGE-SCALE ASSESSMENTS IN EDUCATION
A REVIEW OF INTERNATIONAL LARGE-SCALE ASSESSMENTS IN EDUCATION: ASSESSING COMPONENT SKILLS AND COLLECTING CONTEXTUAL DATA © OECD AND THE WORLD BANK 2015
For developing countries, an appropriately targeted test will give them much more information than a test that is poorly targeted and contains too many difficult items for their students. This can lead to a situation where a substantial percentage of their students are below the lowest described proficiency level. If the test is appropriately targeted then the countries will receive valuable information about their students’ capabilities and where they need to focus resources to bring about improvements.
• It is highly desirable to define students’ proficiency levels as well as assigning them a numerical value for their results. Described proficiency levels are based on the items’ level of difficulty and the tasks associated with the items. Proficiency levels highlight students’ strengths and weaknesses.
Translation, adaptation and verification of cognitive instruments There are a variety of approaches to translating test material across the different
assessments. Approaches include single translation, back translation and double translation. In back translation the material is translated from one language to another, then translated back to the original language, and the two versions compared and validated. The double translation method means that two source versions of the test in one (or, preferably, two) languages will first be translated within the country separately, then those versions reconciled, and the resulting version verified by an independent international expert language organisation.
For all countries, including developing countries, the biggest challenge is often to find people with sufficiently high skills in both the language of the source version of the test and the language the test is administered in.
• To maintain the highest standards for translation it is recommended that the PISA-D project adopt a two-source-version approach. This involves independent translations of each source version and verification of that process by an expert language organisation. This process will also give better comparability with results from existing PISA surveys.
Field trial and item selection Most of the international assessments reviewed in this report employ a field trial,
which is done after item development has taken place but before the main study. The field trial item analysis data gives valuable information about the quality of the translations used.
For developing countries without previous experience in international assessments, the field trial provides essential practice, not only for assessing the logistical needs of the assessment, but also in how to manage the review and translation of the cognitive and contextual instruments.
Each of the countries participating in PISA-D have had international experience in either the Conference of the Ministers of Education of French speaking countries (CONFEMEN) Programme for the Analysis of Education Systems (PASEC), Latin American Laboratory for Assessment of the Quality of Education (LLECE) or SACMEQ. This is excellent experience for those countries, provided that the personnel involved are still available.
• A field trial should take place to test the suitability of the items for the target sample and to see if the participating country has the capacity to implement the

CHAPTER 1 – OVERVIEW: LESSONS FROM INTERNATIONAL LARGE-SCALE ASSESSMENTS IN EDUCATION – 23
A REVIEW OF INTERNATIONAL LARGE-SCALE ASSESSMENTS IN EDUCATION: ASSESSING COMPONENT SKILLS AND COLLECTING CONTEXTUAL DATA © OECD AND THE WORLD BANK 2015
assessment. A large number of items are usually discarded following the field trial.
• It is vital that the countries participating in PISA-D gain as much experience as possible in the procedures associated with international testing, and this is best done with a field trial.
Contextual data collection instruments
Types of contextual data collection instruments and mode of delivery With regard to the questionnaire type, Willms and Tramonte (2014: 20) underline the
importance of discerning the best informant or respondent for measuring the relevant constructs (the conceptual element that is being measured). All surveys reviewed collect contextual data. International large-scale surveys use questionnaires for students, teachers and principals. In addition, some surveys collect data from parents.
Most of the questionnaires and interviews used for contextual data collection in the surveys reviewed are administered in paper-and-pencil mode. Electronic means could be considered, as discussed in the section above. Such an option would allow “spoken” and “visual” language components to be incorporated for struggling readers.
Regarding a teacher questionnaire, it is not clear how the information collected at the classroom level will relate to student achievement in PISA-D. It is worth noting that performance in PISA is seen as an accumulation of the student’s educational experience and that PISA does not sample from intact or whole student classes. For a parent questionnaire, an interview approach could be considered in PISA-D.
• PISA-D should give careful consideration to the types of questionnaires implemented, in order to collect the most essential contextual information in the most efficient way. It will be important to calculate a cost/value ratio for various contextual data collection instruments.
• PISA-D should consider implementing a parent questionnaire as a core instrument in its assessment. Implementing a parent questionnaire will require significant effort, for example, through an interview approach or other methods to secure response rates. Student contextual questionnaires may be able to collect some of the desired data. Comparisons between student and parent questionnaire responses in PISA have shown that students are a reliable source of data about family-related topics such as language use, parental occupation and education.
• Similarly, we recommend considering the benefits of a teacher questionnaire, compared to collecting the aggregated school-level data through the principal questionnaire. At present, it is not clear how factors captured in a teacher questionnaire will be analysed. It may not be appropriate to relate information collected at the classroom level to student achievement, especially because performance in PISA is seen as an accumulation of the student’s educational experience, and the sample does not use intact classes.
• The benefits of principal and teacher contextual questionnaires should also be weighed against the possibility of using system-level, administrative or agency-collected data. If some contextual data can be garnered at the system level, it will reduce contextual data collection through teachers and principals

24 – CHAPTER 1 – OVERVIEW: LESSONS FROM INTERNATIONAL LARGE-SCALE ASSESSMENTS IN EDUCATION
A REVIEW OF INTERNATIONAL LARGE-SCALE ASSESSMENTS IN EDUCATION: ASSESSING COMPONENT SKILLS AND COLLECTING CONTEXTUAL DATA © OECD AND THE WORLD BANK 2015
(and most likely through students). For example, questions about instruction time could be administered at system level.
Development of contextual data collection instruments Most large-scale international surveys follow a very similar questionnaire
development process as PISA. The process defines policy priorities and/or research questions, and constructs a context framework. The context framework provides the theoretical underpinning of the context variables and factors implemented in the survey, as well as how they relate to achievement. This process is used in PISA, PIRLS and TIMSS, World Education Indicators’ Survey of Primary Schools (WEI-SPS) and the Programme for the International Assessment of Adult Competencies (PIAAC). Alternatively, some surveys (such as SAQMEC and LLECE) construct analytical models to describe the relationship between the surveyed contextual factors and achievement.
In constructing context indices, items should be in a format that allows self-reported measures to be adjusted, to further explore and potentially increase cross-country comparability. Also, PISA-D should analyse the extent of different patterns of response styles in developing countries.
It is of utmost importance for PISA-D to field trial contextual questionnaires in all participating countries, in order to gain data for item statistics, validate new questionnaire items and constructs and test contextual data collection procedures.
Data analyses after field trial and the main study need to capture the validity of questionnaire items across countries and ensure that items work in the same way in all countries. This is relevant for cognitive as well as contextual items.
• It is crucial that PISA-D participating countries be involved in all phases of the contextual questionnaire development process, including framework development. It is also crucial that the countries be involved on different levels, including school, teacher and operational levels. Countries should also be involved in education policy, such as participation on the PISA Governing Board (PGB), and especially with respect to identifying and addressing the main education policy. Country involvement in education research could include: participation in the Questionnaire Expert Group; identifying and addressing questions for developing country contexts as part of the framework development; and development and review of specific questionnaire items.
• In regards to capacity building, PISA-D participating countries should be actively involved in item development activities to enable them to create and implement items of specific national interest.
• It is of utmost importance for all PISA-D countries to participate in: field trialling of contextual questionnaires in order to gain data for item statistics; validation of new questionnaire items and constructs; and testing contextual data collection procedures.
Translating, adapting and verifying contextual data collection instruments In relation to translation, adaptation and verification, country involvement in all
stages of reviewing the context framework and questionnaires is essential for checking the “face-validity” (or face value) and cultural appropriateness of the content, as well as for identifying possible issues with translation.

CHAPTER 1 – OVERVIEW: LESSONS FROM INTERNATIONAL LARGE-SCALE ASSESSMENTS IN EDUCATION – 25
A REVIEW OF INTERNATIONAL LARGE-SCALE ASSESSMENTS IN EDUCATION: ASSESSING COMPONENT SKILLS AND COLLECTING CONTEXTUAL DATA © OECD AND THE WORLD BANK 2015
Standardised procedures are provided in most of the international large-scale surveys, as well as the household-based surveys that aim for international comparison. Most surveys acknowledge the importance of adapting questionnaires to match national contexts, to provide key elements for analysis and, therefore, to accomplish the goals set at the national level.
• In regard to languages, it is important to consider which languages are the most appropriate ones for the different groups of respondents. Questionnaires are preferably translated into the languages in which students, teachers, principals and parents are expected to be proficient. This may not always match with the defined “language of assessment” (for example, the languages most often spoken at home for the parent questionnaire).
• The issues around language of instruction are very well documented for prePIRLS in South Africa. Results show that in most languages used in prePIRLS, achievement was significantly higher when children wrote in their home language as opposed to the language of instruction (Howie et al., 2012: 31). We suggest considering language issues during field trial analyses, to rule out discrimination based on the language of assessment.
• Translation, adaptation and verification procedures are already highly elaborate for PISA and comply with very high standards. PISA-D needs to ensure that PISA-D countries can satisfy these standards. A capacity needs analysis might reveal what is necessary in this regard. It is also necessary to enable national centres to: perform adequate adaptations and to document accurately; to understand and interpret field trial analyses; and to create national options. PISA-D needs to build capacity around methodology of contextual data collection instruments. This will enable participating countries to create national questionnaire options.
Main factors and variables Most of the international surveys articulated a theoretical underpinning of the context
factors collected and understood the relationship between these factors and achievement. This combines educational research questions based on a model of learning and policy questions. The surveys offer a wide range of factors and variables that are relevant, including early learning opportunities, language at home and at school, socio-economic measures, quality of instruction, learning time, school resources, family and community support, and health and wellbeing.
In developing countries this range of variables would provide valuable information for policymakers and practitioners.
The PISA-D questionnaires should contain similar content to the standard PISA questionnaires to allow a genuine comparison. However, some modifications will be needed according to the prevailing conditions in each of the participating countries.
• Regarding early learning opportunities, the PIRLS and TIMSS Learning to Read Survey (for parents), the LLECE questions about early reading and how often someone at home reads aloud to the child, and the questions about out-of-school status from the Annual Status of Education Report (ASER) and Uwezo may all be of interest to PISA-D.

26 – CHAPTER 1 – OVERVIEW: LESSONS FROM INTERNATIONAL LARGE-SCALE ASSESSMENTS IN EDUCATION
A REVIEW OF INTERNATIONAL LARGE-SCALE ASSESSMENTS IN EDUCATION: ASSESSING COMPONENT SKILLS AND COLLECTING CONTEXTUAL DATA © OECD AND THE WORLD BANK 2015
• Regarding language at home and school, a number of assessments contain items that may be relevant for PISA-D. The PISA 2012 educational career questionnaire contains language-related questions. PIRLS and TIMSS contain questions about the frequency of speaking the language of the test at home and the language spoken by the student before school enrolment. PIRLS and TIMSS also ask if the books at home (“books at home” as used as an indicator for socio-economic status) are mainly in the test language. Questions from Skills Toward Employment and Productivity (STEP) and the Literacy Assessment and Monitoring Programme (LAMP) may also be useful to help PISA-D gain a full picture of language use, because these questions differentiate between language that is spoken and language that is read and written. For a teacher questionnaire, PISA-D should consider questions about the language spoken by the teacher, from PASEC. Additionally, teachers could be asked to estimate how many students have difficulties understanding the spoken language of the test, as done in PIRLS and TIMSS. Questions to address language of instruction should also be included at the school level, such as those from PISA 2009, PIRLS and TIMSS. Questions from LLECE about language of instruction (for partial or all instruction) and indigenous language services and resources may also be of interest. It may be useful to ask about the official time used for teaching the language of instruction, as for example in WEI-SPS, as well as about the languages in which textbooks are provided, as in Uwezo.
• Socio-economic status indicators relevant to children living in poverty cover areas of parental education, home facilities and possessions, educational materials and resources, and main source of income. Relevant questions are included in SACMEQ, PASEC, LLECE, Early Grade Reading Assessment (EGRA) and Early Grade Mathematics Assessment (EGMA), ASER and Uwezo. STEP employs a particular asset index (Pierre et al., 2014: 15) that may be useful for PISA-D. Together STEP, LAMP, ASER and Uwezo provide a pool of items about household characteristics that PISA-D can draw from. This will allow PISA-D to identify and use relevant variables for extending the PISA index of economic, social and cultural status and for developing poverty-related measures. Employment information as captured in LAMP, STEP or PIAAC may be of interest for the PISA parent questionnaire, in regard to extending existing measures of the parents’ employment status. For example, STEP module 4 obtains basic employment information, such as the labour force status (employed, unemployed or inactive; including self-employed – with and without pay; underemployed or holding low-productivity jobs).
• Regarding quality of instruction, the reviewed surveys cover a range of topics of particular interest to PISA-D. These concern general aspects of quality of instruction, including pedagogical practices, teacher limitations, assessing and monitoring academic progress, classroom organisation and management, homework, evaluation and professional development of teachers. The surveys also cover domain-related aspects of quality of instruction, including strategies for reading instruction, and training for specific subject teaching.
• Regarding learning time, PASEC and LLECE student questionnaires ask about working outside of school. Topics include the type of work, such as whether work is in the household, in agriculture or in retail; whether work occurs in or outside the home; and if the students are paid for working. Topics also cover the amount

CHAPTER 1 – OVERVIEW: LESSONS FROM INTERNATIONAL LARGE-SCALE ASSESSMENTS IN EDUCATION – 27
A REVIEW OF INTERNATIONAL LARGE-SCALE ASSESSMENTS IN EDUCATION: ASSESSING COMPONENT SKILLS AND COLLECTING CONTEXTUAL DATA © OECD AND THE WORLD BANK 2015
of work, measured in days per week and hours per day, and whether working hinders learning or school attendance, or causes fatigue during instruction.
• Regarding school resources, relevant factors relate to basic services, didactic facilities and didactic resources. Basic services include the conditions of the school building and school infrastructure; the availability of electricity, toilets and water sources; and the provision of school meals, transportation and medical and clothing programmes. Didactic facilities include the teachers’ workspace, classroom resources and infrastructure, such as tables and chairs, blackboard, chalk, pen, notebook and adequate lighting in classroom. Didactic resources include teaching resources such as: television, photocopier or computer; availability and quality of educational material; availability of a library; and student learning materials such as textbooks, pencils and other writing materials. Relevant questions were found in SACMEQ, PASEC, EGRA and EGMA, ASER and Uwezo. Other relevant topics are school safety, teacher satisfaction (including factors such as travel distance, if teacher housing is provided and level of salary), staff stability, and issues regarding funding and grants.
• Regarding family and community support, information about parental involvement is captured on all levels: student, parent, teacher and school level. Factors about parents’ involvement that may be relevant for PISA-D are found in PIRLS and TIMSS, SACMEQ, LLECE, WEI-SPS, PASEC and EGRA and EGMA. Information about community support is mainly captured through the principal. Useful factors and variables can be found in SACMEQ, WEI-SPS, PIRLS and TIMSS and PASEC. Specific measures of cultural and social capital, which are of relevance for PISA-D, are included in PIAAC and LAMP.
• Factors measuring health and wellbeing that may be of particular interest for PISA-D are included in several surveys. Uwezo asks about health and other services, such as the presence of a nurse, the main health issue keeping children out of school, provision of sanitary items for girls, availability of drinking water and the presence of feeding services. PASEC asks about wellbeing at school. LAMP asks about personal wellbeing and health-related literacy.
Technical aspects of contextual data collection instruments A number of different question formats were used across all contextual data
collection instruments in the surveys reviewed. These included:
• dichotomous questions: mostly yes/no; particularly in ASER, Uwezo
• nominal variables
• Likert scales: three, four, five and ten-point scales
• open-ended questions: also largely used in ASER and Uwezo, but not very cost or time-effective for data capture, analyses and aggregation, and information grouping
• rankings: for example, the Uwezo household survey sheet includes a ranking item about major issues facing the community; the respondent is asked to choose three of nine options and rank the three chosen ones in order of importance.
Including a wide range of appropriate formats will enhance the quality of information derived from the questionnaires.
28 – CHAPTER 1 – OVERVIEW: LESSONS FROM INTERNATIONAL LARGE-SCALE ASSESSMENTS IN EDUCATION
A REVIEW OF INTERNATIONAL LARGE-SCALE ASSESSMENTS IN EDUCATION: ASSESSING COMPONENT SKILLS AND COLLECTING CONTEXTUAL DATA © OECD AND THE WORLD BANK 2015
In regard to scaling and computing relevant context constructs, there are generally two kinds of indices created from context questionnaires. These are simple indices, created through transforming and/or recoding, and scale indices, which are constructed by scaling multiple items.
Developing countries could pursue the same combination of methods, and for PISA-D it would be logical to use the same scaling technology – item response theory scaling – as standard PISA.
PISA contains context constructs relevant for PISA-D. Other relevant context constructs can be found in PIRLS and TIMSS for early learning opportunities, quality of instruction and school resources. LLECE includes indices for educational opportunity, accessibility of basic school services and school infrastructure. The SACMEQ school community contribution factor is also considered valuable for developing countries.
• Regarding question formats, PISA-D should include item formats that allow for an adjustment of self-reported measures. This will allow analyses to further explore and potentially increase cross-country comparability. PISA-D could undertake, for example, correlation analyses at the between-country level between adjusted measures and scales or indices other than performance, in order to examine the impact of such adjustments in terms of construct validity. PISA-D should also undertake analyses to examine the extent of different patterns of response styles in participating countries.
• Regarding scaling and computing of relevant contextual constructs, including socio-economic measures, PISA-D should follow the procedures used for the scaling of context questionnaires in PISA. These procedures employ item response theory scaling methodology (for example, see OECD, 2009). PIRLS and TIMSS context questionnaire scaling could be of particular interest for PISA-D. Given that PIRLS and TIMSS have used Conquest, the algorithm underlying this particular scaling would probably be similar to what’s been done in PISA.
• Relevant context constructs from international surveys of interest for PISA-D can be found in PIRLS and TIMSS in regards to early learning opportunities, quality of instruction and school resources. LLECE uses indices of educational opportunity, accessibility of basic school services and school infrastructure that may be of interest to PISA-D. The SACMEQ school community contribution factor may also be valuable for PISA-D.
Socio-economic status and poverty-related measures The review of international surveys shows that measures of socio-economic status
applied in international surveys conducted in developing country contexts commonly include indicators relevant to children living in poverty, but do not measure them distinctly from socio-economic status (SES). Such indicators are mainly based on home resources, household characteristics, and possessions and assets. Developing countries will need to draw on other countries’ experiences for their own variables to measure socio-economic status. Already, some countries participating in PISA-D have a history of effective data collection on socio-economic status in their cultural and geographical contexts.
• The surveys reviewed contain several good examples for SES and poverty-related measures relevant to PISA-D. SACMEQ, PASEC and LLECE include

CHAPTER 1 – OVERVIEW: LESSONS FROM INTERNATIONAL LARGE-SCALE ASSESSMENTS IN EDUCATION – 29
A REVIEW OF INTERNATIONAL LARGE-SCALE ASSESSMENTS IN EDUCATION: ASSESSING COMPONENT SKILLS AND COLLECTING CONTEXTUAL DATA © OECD AND THE WORLD BANK 2015
SES-related indices. SACMEQ and WEI-SPS include school and classroom measures that are related to SES.
• PISA-D should consider constructing an asset index, such as that created for STEP (Pierre et al., 2014: 15). Given the breadth of the countries participating in PISA-D, the challenge would be to find assets that differentiate levels of possessions equally well across these countries.
• PISA-D should also consider options for a finer differentiation of socio-economic status. One approach would be to ask, not just whether or not respondents have an item, but also whether the respondents would actually like to have an item they do not own.
• PISA-D also can draw on experiences of different countries regarding their own variables for measuring socio-economic status. Countries participating in PISA-D have a history of data collection and valuable experience on how to effectively assess socio-economic status in their cultural and geographical contexts.
• In regards to cross-cultural comparability, three aspects have been identified as crucial:
In relation to translation, adaptation and verification, country involvement in review of context framework and questionnaires is essential to check the face-validity of face value and cultural appropriateness of the content and identify possible issues with translation.
With respect to constructing context indices, it will be useful for PISA-D to include item formats that allow for an adjustment of self-reported measures to further explore and potentially increase cross-country comparability. PISA-D should undertake analyses to examine the extent of different patterns of response styles in participating countries.
Data analyses after the field trial and main study needs to capture the validity of questionnaire items across countries and ensure that items work in the same way in all countries. This applies to cognitive as well as contextual items. Country involvement is crucial in this regard.
Implementation procedures, methods and approaches to include out-of-school children, and use of data
Implementation procedures Generally the international institutional arrangements for the reviewed large-scale
international assessments involve a governing group, or steering committee, to set overarching policies and priorities, and one or more groups to provide technical guidance.
• The role and mandate of the PISA-D International Advisory Group is broad and varied. PISA-D needs to consider how it can accommodate the interests of the different stakeholder groups represented on it.
• The capacity-building and peer-to-peer learning emphases of PISA-D should be formalised in the institutional arrangements at the international and national levels. For example, partnerships could be established between PISA-D countries and PISA countries that have similar capacity needs. PISA-D countries should be

30 – CHAPTER 1 – OVERVIEW: LESSONS FROM INTERNATIONAL LARGE-SCALE ASSESSMENTS IN EDUCATION
A REVIEW OF INTERNATIONAL LARGE-SCALE ASSESSMENTS IN EDUCATION: ASSESSING COMPONENT SKILLS AND COLLECTING CONTEXTUAL DATA © OECD AND THE WORLD BANK 2015
encouraged to establish their national centres to maximise capacity-building support.
• The OECD should clearly describe the roles and responsibilities of the national committee and guide each participating country to ensure that a productive relationship is established between the national committee and the national centre.
• The OECD should be prepared to encounter a variety of national level arrangements, from full responsibility concentrated on one group to a range of activities being outsourced. National centres should be supported to manage in-country relationships. Quality assurance requirements should be effectively communicated so that, in the case of some in-country outsourcing, all involved parties understand their responsibilities.
Survey implementation
Sampling All the reviewed surveys employ a multi-stage sampling methodology. This involves
choosing a school sample first, and then selecting students from the school. This happens in a variety of ways across the assessments, including sampling subsets of children across all classes in the target grades of sample schools (SACMEQ); sampling one classroom for each target grade (PASEC, Third Regional Comparative and Explanatory Study [TERCE]); and sampling intact classes from the target grades in sample schools (PIRLS, TIMSS). PISA, on the other hand, samples 15-year-old students in Grade 7 and above. The household-based surveys sample households and then select a sample from individuals within the target population in the sampled households.
In PISA-D, it is worth considering how to construct a school sampling frame that satisfies PISA’s technical standards in countries that do not maintain a complete list of schools. Additionally, if up-to-date and complete lists of students are difficult to obtain from schools in advance, alternative methods for sampling students should be considered (for example, the SACMEQ and PASEC approach of sampling children on the day of testing).
• PISA-D should consider subnational arrangements to enable participation by countries with stable and unstable areas.
• Some countries do not maintain complete and up-to-date lists of schools. PISA-D will need to construct a school sampling frame that satisfies PISA’s technical standards in these countries.
• We recommend considering whether PISA’s approach to student sampling is appropriate in contexts where schools do not maintain complete and up-to-date lists of students. SACMEQ’s approach – where children are sampled on the day of testing – may be worth exploring.
Data collection In terms of cognitive data collection, the reviewed surveys can be broadly
categorised. In several surveys, the cognitive assessment is a paper-based instrument that is administered in schools to groups of children, and each respondent completes the assessment independently by reading questions and recording responses on paper. Surveys that fit this category are PIRLS and prePIRLS, TIMSS, LLECE, SACMEQ and

CHAPTER 1 – OVERVIEW: LESSONS FROM INTERNATIONAL LARGE-SCALE ASSESSMENTS IN EDUCATION – 31
A REVIEW OF INTERNATIONAL LARGE-SCALE ASSESSMENTS IN EDUCATION: ASSESSING COMPONENT SKILLS AND COLLECTING CONTEXTUAL DATA © OECD AND THE WORLD BANK 2015
PASEC Grade 6. In other surveys, the cognitive assessment is a paper-based or computer-based instrument that is administered one-on-one, either in households or in schools. Surveys that fit this category are ASER, EGRA, EGMA, STEP, LAMP, Uwezo and PASEC Grade 2. Similarly, for collecting contextual data, some ask respondents to complete questionnaires – LLECE, PASEC Grade 6, PIAAC, prePIRLS, PIRLS, SACMEQ, TIMSS, WEI-SPS; and for others, data collectors interview the respondents – ASER, EGRA, EGMA, STEP, LAMP, Uwezo, PASEC Grade 2.
• PISA-D should consider interview sessions to collect contextual data from respondents other than students. These respondents might include principals and teachers. It may be useful to implement:
A tablet-based data collection tool to eliminate recording errors.
Cognitive test administration over multiple days.
Permitting extra time to complete cognitive assessments.
Establishing on-site test administrator checks of student booklets to reduce the incidence of missing/discrepant data.
Sourcing test administrators who are local to the sites of test administration as a means of securing community engagement and buy-in.
Data processing In regard to coding, or marking students’ responses with codes once tests are
complete, the reviewed surveys devote considerable time and resources to coder training and coding itself – including the steps taken to confirm that coding is being undertaken with acceptable reliability. In PIRLS, prePIRLS and TIMSS, comprehensive coder training is provided including actual responses from children. In LLECE, coder training is provided centrally to national representatives, who then return to their countries and replicate the training with their national coding teams. Responses to constructed response items (items requiring a written response rather than choosing from a set of options) are sometimes coded twice.
In EGRA and EGMA, coding is undertaken at the time of test administration, and coding training forms part of test administrator training. In PIAAC, participating countries that used a paper-based assessment were required to undertake in-country reliability studies in both the field trial and the main survey. In these studies, a second coder coded a predefined number of responses, and the level of agreement had to be at least 95%. Cross-country reliability studies were also conducted to identify any systematic coding bias across countries.
Services such as the PISA Coder Enquiry Service would be very useful for developing countries. This service entitles a country that has expended all efforts to arrive at an agreed code, but has failed to agree one, to write to the contractor, whose advice will then be recorded for all countries to see.
In PISA-D, constructed response items will be coded within the participating countries. Coding quality will be ensured by different procedures, including coding verification by expert coders and a coder reliability study across all participating countries (OECD, 2014: 43).

32 – CHAPTER 1 – OVERVIEW: LESSONS FROM INTERNATIONAL LARGE-SCALE ASSESSMENTS IN EDUCATION
A REVIEW OF INTERNATIONAL LARGE-SCALE ASSESSMENTS IN EDUCATION: ASSESSING COMPONENT SKILLS AND COLLECTING CONTEXTUAL DATA © OECD AND THE WORLD BANK 2015
• For coding, PISA-D should consider services such as the PISA Coder Enquiry Service.
• For data capture, PISA-D should consider data entry application. It will need to be of adequate rigour, but it should not be so complex or unusual that it does not really serve the project’s articulated aims about sustainable capacity development. PISA-D should consider more stringent requirements for double data entry than are currently implemented in PISA.
• For data cleaning, PISA-D should consider undertaking validation steps before the test administrators leave the schools (as is done in SACMEQ). Including these steps may simplify processes and reduce subsequent data cleaning activities.
Standardising implementation In most of the reviewed surveys, standards are typically articulated through specific
standards documentation, or through the instructional materials that are prepared to guide implementation. Standards should be included in a project implementation plan as well as in a dedicated standards document.
Some of the reviewed assessments have highlighted the difficulty of establishing standardised procedures when the participating countries are geographically, culturally and economically diverse. They also refine the standardised processes after a field trial.
PISA has a range of technical and operational standards that are articulated in a specific standards document. These standards cover aspects of implementation that have a direct impact on data quality, management standards that address operational objectives, and national involvement standards. To ensure comparability with standard PISA, it will be necessary for PISA-D countries to adhere to the accepted PISA standards.
All the large-scale international assessments produce manuals and use training meetings to familiarise the participating countries with the standard processes, and with the international and national quality monitors for monitoring assessment implementation.
• Articulation of standards could be included in memoranda of understanding or project implementation plans, as well as in a dedicated standards document. Including the standards in documents that are specific to each participating country, rather than general documents, may assist each country to be fully aware of its responsibilities with respect to the standards. A description of standards could be used as an opportunity to reflect the project’s underlying values and ideology in a way that will help to secure local commitment to the project and acceptance of its results.
• With respect to training and quality assurance, the methods and processes of the reviewed large-scale international assessments should be explored in more detail. In particular, information should be sought about measures taken to ensure the quality of test administration.
Methods and approaches to include out-of-school children Of the reviewed surveys, only PIAAC, STEP, LAMP, ASER and Uwezo include
out-of-school children. They achieve this by having target population definitions that are age-based and make no reference to the enrolment or schooling status of individuals.

CHAPTER 1 – OVERVIEW: LESSONS FROM INTERNATIONAL LARGE-SCALE ASSESSMENTS IN EDUCATION – 33
A REVIEW OF INTERNATIONAL LARGE-SCALE ASSESSMENTS IN EDUCATION: ASSESSING COMPONENT SKILLS AND COLLECTING CONTEXTUAL DATA © OECD AND THE WORLD BANK 2015
All five of these assessments sample households. STEP samples households in urban areas only; LAMP, PIAAC and Uwezo sample households across the participating countries (both urban and rural); and ASER samples households in rural districts only. In ASER households are sampled on the same day that tests are administered. In urban slum areas it may be difficult to establish a household list because it may be not be easy to distinguish between households. Uwezo tests children in urban areas, some of which would qualify as informal settlements or slums.
The language of the assessment is of critical importance when testing out-of school children. In ASER, for example, out-of-school children are allowed to choose which language they complete the reading assessment in, and in Uwezo, all children are allowed to receive the instructions for the mathematics test in whichever language they are most comfortable using.
• Input should be sought from ASER and Uwezo, and perhaps the other household-based assessments about how often they encounter problems with outdated sampling frames and how these are dealt with.
• Input should be sought from ASER (and perhaps Uwezo) about how to deal with multiple-occupancy households, as well as how to approach children who might be shy because they cannot read and children who are perhaps considered adults in their households.
• PISA-D should review the ways ASER and Uwezo obtain local buy-in to the survey. Some of these approaches may be applicable for the PISA-D out-of-school children strand.
• PISA-D should pursue an adaptive design for testing out-of-school children. Training and quality assurance measures will need to account for the additional burden adaptive design places on test administrators.
Analysis, reporting and use of data It may be worth incorporating benchmarks in PISA-D analysis and reporting.
Benchmarks that define minimum expected levels of performance may become increasingly relevant in the context of the post-2015 development goals and targets for education quality.
Countries may need considerable support in preparing national results reports. PISA-D should consider supporting participating countries to develop dissemination plans. Without the preparation and dissemination of national-level material that decision makers judge to be useful and relevant, a survey can only ever have a limited impact.
Data should be freely available to allow secondary analysis to take place. Ministry staff’s active involvement in implementing research can be the key to linking results and actions.
• The use of benchmarks in the reviewed surveys should be examined. PISA-D should consider whether benchmarks might be incorporated into PISA-D analysis and reporting. Benchmarks that define minimum expected levels of performance may become increasingly relevant in the context of the post-2015 development goals and targets for education quality.
• Steps should be taken to ensure that questionnaire scales developed and used in reporting are considered relevant to policy in the participating countries.

34 – CHAPTER 1 – OVERVIEW: LESSONS FROM INTERNATIONAL LARGE-SCALE ASSESSMENTS IN EDUCATION
A REVIEW OF INTERNATIONAL LARGE-SCALE ASSESSMENTS IN EDUCATION: ASSESSING COMPONENT SKILLS AND COLLECTING CONTEXTUAL DATA © OECD AND THE WORLD BANK 2015
• In regard to analytical approaches used for reporting, national-level reports from relevant countries may be useful. PISA-D should examine national level reports from countries that have participated in the reviewed large-scale assessments (such as South Africa in prePIRLS and PIRLS 2011, the SACMEQ countries) to get a sense of the kinds of analysis and reporting options that these countries have deemed relevant for their contexts.
• Regarding reports and communicating results, it may be valuable for PISA-D to present information on participating country contexts. The TIMSS and PIRLS encyclopaedias provide an example.
• The OECD and the international contractors for Strand A and Strand B of PISA-D should be prepared to offer considerable support to countries for the important work of preparing national results reports.
• PISA-D should consider supporting participating countries to develop and implement dissemination plans. National level material must be useful and relevant for decision makers if the survey is to have a significant impact.
• Regarding use of data and results, observations from SACMEQ highlight that active involvement of ministry staff in the research implementation is key to linking results and actions. We recommend considering how to ensure that government buy-in leads to similar success with PISA-D.
Notes
1. See www.oecd.org/pisa/pisafaq/.

CHAPTER 1 – OVERVIEW: LESSONS FROM INTERNATIONAL LARGE-SCALE ASSESSMENTS IN EDUCATION – 35
A REVIEW OF INTERNATIONAL LARGE-SCALE ASSESSMENTS IN EDUCATION: ASSESSING COMPONENT SKILLS AND COLLECTING CONTEXTUAL DATA © OECD AND THE WORLD BANK 2015
References
Howie, S. et al. (2012), PIRLS 2011: South African Children’s Reading Literacy Achievement, Summary Report, Centre for Evaluation and Assessment, University of Pretoria, Pretoria, www.up.ac.za/media/shared/Legacy/sitefiles/file/publications/2013/pirls_2011_report_12_dec.pdf.
OECD (2014), “OECD list of ODA recipients”, www.oecd.org/dac/stats/daclistofodarecipients.htm (accessed 4 August 2014).
OECD (2009), PISA 2006 Technical Report, OECD Publishing, Paris, http://dx.doi.org/10.1787/9789264048096-en.
Pierre, G. et al. (2014), STEP Skills Measurement Surveys: Innovative Tools for Assessing Skills, working paper, World Bank Human Development Network, Washington DC.
Willms, J.D. and L. Tramonte (2014), “Towards the development of contextual questionnaires for the PISA for development study”, OECD Education Working Papers, No. 118, OECD Publishing, Paris, http://dx.doi.org/10.1787/5js1kv8crsjf-en.

CHAPTER 2 – METHODOLOGY FOR THE REVIEW OF INTERNATIONAL LARGE-SCALE ASSSESSMENTS IN EDUCATION – 37
A REVIEW OF INTERNATIONAL LARGE-SCALE ASSESSMENTS IN EDUCATION: ASSESSING COMPONENT SKILLS AND COLLECTING CONTEXTUAL DATA © OECD AND THE WORLD BANK 2015
Chapter 2
Methodology for the review of international large-scale assessments in education
This chapter describes the methodology used for the review of the large-scale assessments. The chapter explains how the three main objectives of PISA for Development (PISA-D) were used as a framework for analysing the different surveys and extracting key principles, guidelines, approaches and lessons from the reviewed surveys’ experiences, professional testing practices and approaches to provide recommendations and guidance for the PISA-D project.
38 – CHAPTER 2 – METHODOLOGY FOR THE REVIEW OF INTERNATIONAL LARGE-SCALE ASSSESSMENTS IN EDUCATION
A REVIEW OF INTERNATIONAL LARGE-SCALE ASSESSMENTS IN EDUCATION: ASSESSING COMPONENT SKILLS AND COLLECTING CONTEXTUAL DATA © OECD AND THE WORLD BANK 2015
Methodology
The review focused on the component skills assessed and contextual data collection used in relevant international assessments. Its methodology, like this resulting expert paper, has four main components:
1. A literature review of relevant literature on the international assessments, including reference materials specified in the terms of reference for this project, and the expert papers on technical strands:
a. cognitive instruments (Adams and Cresswell, 2014)
b. contextual questionnaires (Willms and Tramonte, 2014)
c. out-of-school 15-year-olds (Carr-Hill, 2015).
2. Personal communication with assessment agencies, to receive assessment material and information about procedures that are not publicly available (for example, test items and booklets, context questionnaires, details of the translation process). In accordance with the terms of reference, all communication was facilitated by the OECD and depended on the collaboration of the agencies and people addressed.
3. Analysing the review results and identifying the main findings according to the objectives of PISA-D.
4. Drafting options for PISA-D survey development and fieldwork based on the findings of the review.
The following three areas are a key part of the international assessments review:
1. Component skills and cognitive instruments, comprising: assessment frameworks (evolution and development, including main responsibility and participating countries’ involvement, definitions of the domains), item development, test design (organisation, domain and framework coverage, item difficulty, test targeting and mode of delivery), psychometric analyses, scaling, calibration and equating methods, cross-country comparability, trends, proficiency levels, translation, adaptation and verification (including language of assessment, translated languages), field trial and item selection.
2. Contextual data collection instruments, comprising: evolution and development (including main responsibility, involvement of participating countries), content and question types (types of questionnaires, main theoretical constructs, variables, indices and scales, question formats, mode of delivery), questionnaire scales and technical aspects (including scale calibration methods and methods to ensure cross-cultural validity), translation, adaptation and verification process, field trial and item selection.
3. Implementation, methods and approaches to include out-of-school children, and use of data, comprising: implementation (institutional arrangements, survey operations and standardisation), methods and approaches for including out-of-school children (population and sampling, other considerations), and use of data (reports and communication of findings, use of results).
In addition to these key areas, the assessments’ main characteristics were included in the review to get an understanding of each assessment programme’s overall purpose and nature, but these will not be part of the analysis.

CHAPTER 2 – METHODOLOGY FOR THE REVIEW OF INTERNATIONAL LARGE-SCALE ASSSESSMENTS IN EDUCATION – 39
A REVIEW OF INTERNATIONAL LARGE-SCALE ASSESSMENTS IN EDUCATION: ASSESSING COMPONENT SKILLS AND COLLECTING CONTEXTUAL DATA © OECD AND THE WORLD BANK 2015
Survey classification
The international surveys were organised into three categories for the purpose of this report: large-scale international surveys, school-based surveys and household-based surveys.
The “large-scale international surveys” category covers international assessments and surveys that aim to produce internationally comparable datasets. To ensure international comparability, large-scale international surveys are highly standardised for all phases of the study, ranging from framework and instrument development, translation and verification procedures, test design, sample design, field operations, scaling methodology, data processing and management to quality assurance. PISA, which serves as a reference for this review, can be regarded as a typical example of a large-scale international survey. The surveys placed in this category for the review are therefore similar to PISA, especially in their level of standardisation. Large-scale international surveys included in this review are: PIRLS and prePIRLS, TIMSS and TIMSS Numeracy, SACMEQ, PASEC, LLECE and WEI-SPS. PrePIRLS and TIMSS Numeracy are specifically targeted at primary school children in developing countries and may provide valuable aspects for PISA-D.
Two school-based surveys were reviewed: EGRA and EGMA. Both surveys build on centrally developed expert frameworks, a toolkit and guidance notes for planning and implementation on the national level. The main aim is to measure the most basic literacy and mathematics skills in the early grades. Assessment tools are developed for each country context separately, and therefore EGRA and EGMA only allow limited comparison across countries. The surveys are carried out orally and in one-on-one settings in schools. In regard to their focus on the national level, EGRA and EGMA are similar to some of the surveys classed as household-based; however, their target population is students in schools and the tests are solely administered in schools.
The household-based surveys reviewed are PIAAC, STEP, LAMP, ASER and Uwezo. PIAAC, STEP and LAMP yield data that can be used on a national level as well as for international comparison – and therefore require a high level of standardisation, similar to international large-scale surveys. ASER and Uwezo focus on a national or district level. LAMP, ASER and Uwezo are administered to individuals in face-to-face interviews using mainly pencil and paper. The target population and sampling approaches of these surveys may contain valuable information for including the out-of-school population in PISA-D.
A summary of the main characteristics of the reviewed international surveys is given in Annex A.
PISA for Development participating countries
The countries that have agreed to participate in PISA-D as of November 2014 are Cambodia, Ecuador, Guatemala, Paraguay, Senegal and Zambia. Table 2.1 shows the current PISA-D countries by geographical location, status as official development assistance (ODA) recipients according to the OECD Development Assistance Committee (DAC), and participation in the international surveys reviewed.
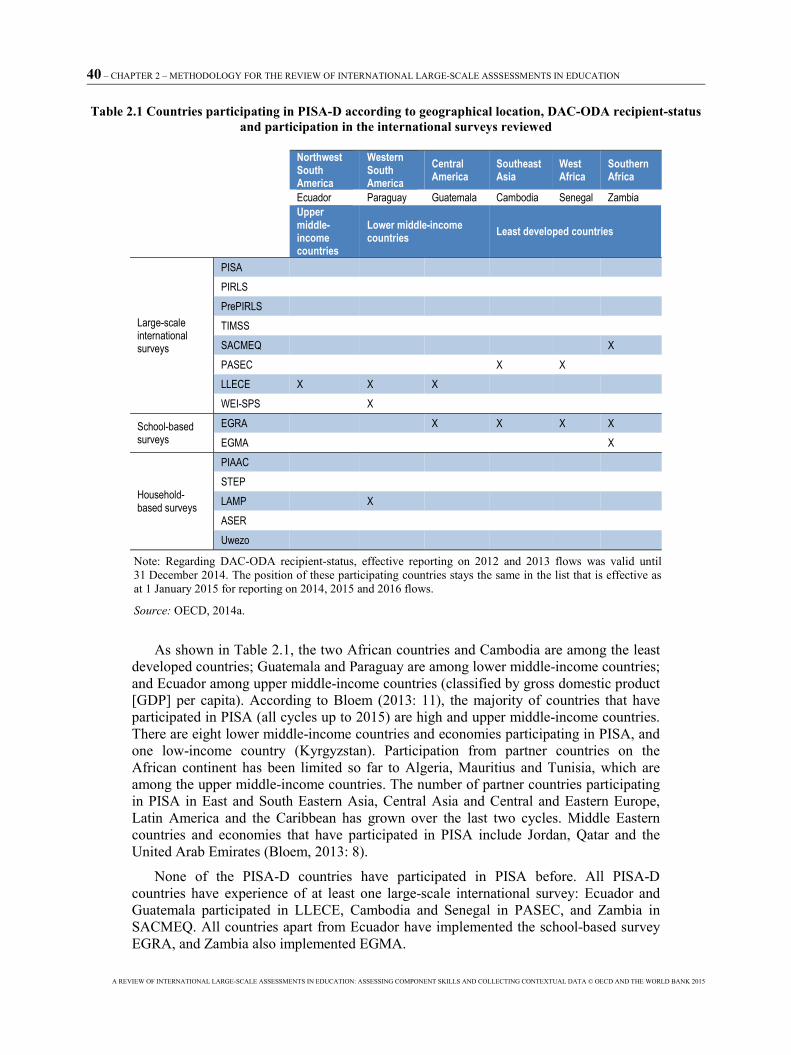
40 – CHAPTER 2 – METHODOLOGY FOR THE REVIEW OF INTERNATIONAL LARGE-SCALE ASSSESSMENTS IN EDUCATION
A REVIEW OF INTERNATIONAL LARGE-SCALE ASSESSMENTS IN EDUCATION: ASSESSING COMPONENT SKILLS AND COLLECTING CONTEXTUAL DATA © OECD AND THE WORLD BANK 2015
Table 2.1 Countries participating in PISA-D according to geographical location, DAC-ODA recipient-status and participation in the international surveys reviewed
Northwest South America
Western South America
Central America
Southeast Asia
West Africa
Southern Africa
Ecuador Paraguay Guatemala Cambodia Senegal Zambia Upper
middle-income countries
Lower middle-income countries Least developed countries
Large-scale international surveys
PISA PIRLS PrePIRLS TIMSS SACMEQ X PASEC X X LLECE X X X WEI-SPS X
School-based surveys
EGRA X X X X EGMA X
Household-based surveys
PIAAC STEP LAMP X ASER Uwezo
Note: Regarding DAC-ODA recipient-status, effective reporting on 2012 and 2013 flows was valid until 31 December 2014. The position of these participating countries stays the same in the list that is effective as at 1 January 2015 for reporting on 2014, 2015 and 2016 flows.
Source: OECD, 2014a.
As shown in Table 2.1, the two African countries and Cambodia are among the least developed countries; Guatemala and Paraguay are among lower middle-income countries; and Ecuador among upper middle-income countries (classified by gross domestic product [GDP] per capita). According to Bloem (2013: 11), the majority of countries that have participated in PISA (all cycles up to 2015) are high and upper middle-income countries. There are eight lower middle-income countries and economies participating in PISA, and one low-income country (Kyrgyzstan). Participation from partner countries on the African continent has been limited so far to Algeria, Mauritius and Tunisia, which are among the upper middle-income countries. The number of partner countries participating in PISA in East and South Eastern Asia, Central Asia and Central and Eastern Europe, Latin America and the Caribbean has grown over the last two cycles. Middle Eastern countries and economies that have participated in PISA include Jordan, Qatar and the United Arab Emirates (Bloem, 2013: 8).
None of the PISA-D countries have participated in PISA before. All PISA-D countries have experience of at least one large-scale international survey: Ecuador and Guatemala participated in LLECE, Cambodia and Senegal in PASEC, and Zambia in SACMEQ. All countries apart from Ecuador have implemented the school-based survey EGRA, and Zambia also implemented EGMA.

CHAPTER 2 – METHODOLOGY FOR THE REVIEW OF INTERNATIONAL LARGE-SCALE ASSSESSMENTS IN EDUCATION – 41
A REVIEW OF INTERNATIONAL LARGE-SCALE ASSESSMENTS IN EDUCATION: ASSESSING COMPONENT SKILLS AND COLLECTING CONTEXTUAL DATA © OECD AND THE WORLD BANK 2015
The participation of developing countries in PISA presents a number of challenges to both the countries and PISA. Examples of these challenges concern funding, lack of institutional capacity and other issues regarding national implementation (due to the target population or the language of the test), performance coverage, relevance of performance results and “fear of bad performance”, lack of analytical capacity, use of results and diverging policy priorities, lack of capacity for a full international participation in international meetings, and training (Bloem, 2013: 18).
PISA-D looks for ways to overcome these challenges and to provide an assessment for developing countries that they can build on to improve their education system. PISA-D countries therefore require an assessment that (OECD, 2014b):
• Reports results on the PISA scale and supports comparability with international PISA results.
• Allows students to demonstrate the full range of proficiency levels.
• Provides policy-relevant information on students at the lower ends of proficiency levels.
• Adheres to PISA standards and identifies aspects that may be adjusted, while ensuring robustness of international comparability of results.
These requirements will strongly inform the following discussion of the review’s main findings for international assessments, and the options derived for PISA-D.

42 – CHAPTER 2 – METHODOLOGY FOR THE REVIEW OF INTERNATIONAL LARGE-SCALE ASSSESSMENTS IN EDUCATION
A REVIEW OF INTERNATIONAL LARGE-SCALE ASSESSMENTS IN EDUCATION: ASSESSING COMPONENT SKILLS AND COLLECTING CONTEXTUAL DATA © OECD AND THE WORLD BANK 2015
References
Adams, R., and J. Cresswell (2014), PISA for Development Technical Strand 2: Enhancement of PISA Cognitive Instruments, OECD, Paris, www.oecd.org/callsfortenders/Annex D - Cognitive Instruments.pdf.
Bloem, S. (2013), “PISA in low and middle income countries”, OECD Education Working Papers, No. 93, OECD, Paris, http://dx.doi.org/10.1787/5k41tm2gx2vd-en.
Carr-Hill, R. (2015), “PISA for Development Technical Strand C: Incorporating out-of-school 15- year-olds in the assessment”, OECD Education Working Papers, No. 120, OECD Publishing, Paris, http://dx.doi.org/10.1787/5js0bsln9mg2-en.
OECD (2014a), “OECD list of ODA recipients”, www.oecd.org/dac/stats/daclistofodarecipients.htm (accessed 4 August 2014).
OECD (2014b), Call for Tender 100000990 - PISA for Development Strand A and Strand B, OECD, Paris, http://tinyurl.com/prjry24.
Willms, J.D. and L.Tramonte (2014), “Towards the development of contextual questionnaires for the PISA for development study”, OECD Education Working Papers, No. 118, OECD Publishing, Paris, http://dx.doi.org/10.1787/5js1kv8crsjf-en.

CHAPTER 3 – COMPONENT SKILLS AND COGNITIVE INSTRUMENTS USED IN EDUCATIONAL ASSESSMENTS – 43
A REVIEW OF INTERNATIONAL LARGE-SCALE ASSESSMENTS IN EDUCATION: ASSESSING COMPONENT SKILLS AND COLLECTING CONTEXTUAL DATA © OECD AND THE WORLD BANK 2015
Chapter 3
Component skills and cognitive instruments used in educational assessments
This chapter looks at the frameworks used in PISA and other surveys to assess reading, mathematics and science. In the case of each of the reviewed assessments the chapter outlines the approach used for the following: i) item development; ii) test design; iii) psychometric analyses; iv) cross-country comparability; v) trends; vi) proficiency levels; vii) translation, adaptation and verification of cognitive instruments; and viii) field trials and item selection. Under each of these areas, the implications and lessons for PISA for Development (PISA-D) are discussed.

44 – CHAPTER 3 – COMPONENT SKILLS AND COGNITIVE INSTRUMENTS USED IN EDUCATIONAL ASSESSMENTS
A REVIEW OF INTERNATIONAL LARGE-SCALE ASSESSMENTS IN EDUCATION: ASSESSING COMPONENT SKILLS AND COLLECTING CONTEXTUAL DATA © OECD AND THE WORLD BANK 2015
Assessment frameworks
An assessment framework is the foundation on which an assessment is based. It provides a clear articulation of what components and subjects make up the assessment, at whom the assessment is targeted, the mode of delivery of the assessment and the length of time the assessment will take to complete.
Different assessments focus on different domains; for example, PIRLS solely focuses on reading, while PISA assesses reading, mathematics, science and problem-solving. This section of the report looks first at reading, mathematics and science domains. For each domain, we look at PISA’s assessment frameworks, and then the frameworks of other assessments.
Reading
PISA’s reading frameworks Reading literacy was the major domain tested by PISA in 2000 and 2009. The
description of reading literacy was updated for the 2009 test. The PISA definition of reading literacy goes beyond simply understanding text, to include educational and social engagement: “Reading literacy is understanding, using, reflecting on and engaging with written texts, in order to achieve one’s goals, to develop one’s knowledge and potential, and to participate in society” (OECD, 2010).
Reading literacy will be a minor domain in PISA 2015. As such, it will not be assessed as comprehensively as it was in 2009.
For PISA 2015, computer-based assessment will be the primary mode of delivery for all domains, including reading literacy. However, paper-based assessment instruments will continue to be provided for countries choosing not to test their students by computer.
The reading literacy component for both the computer-based and paper-based instruments will comprise the same intact clusters of reading trend items. The number of trend items in both minor domains will be increased, thereby increasing the construct coverage while reducing the number of students responding to each question. This design is intended to both reduce potential bias and stabilise and improve measurement of the trend.
The 2009 report provided separate scales for print reading and digital or electronic reading, although digital reading was not assessed in all participating countries in 2009, and it was not scaled as part of the overall concept of reading literacy. PISA 2015 reporting will not include digital reading scales.
The PISA reading literacy assessment framework is built on three major task characteristics:
• situation – the range of broad contexts or purposes for which reading takes place
• aspect – the cognitive approach that determines how readers engage with a text
• text – the range of material that is read.
In PISA the situation in which reading takes place is categorised as personal, public, occupational or educational.

CHAPTER 3 – COMPONENT SKILLS AND COGNITIVE INSTRUMENTS USED IN EDUCATIONAL ASSESSMENTS – 45
A REVIEW OF INTERNATIONAL LARGE-SCALE ASSESSMENTS IN EDUCATION: ASSESSING COMPONENT SKILLS AND COLLECTING CONTEXTUAL DATA © OECD AND THE WORLD BANK 2015
Aspect refers to the mental strategies, approaches or purposes that readers use to negotiate their way into, around and between texts. These aspects are:
• access and retrieve
• integrate and interpret
• reflect and evaluate.
The text is the reading material. In an assessment, that material – a text (or a set of texts) related to a particular task – must be coherent within itself. That is, the text must be able to stand alone without requiring additional material to make sense to the proficient reader. There are many different kinds of texts and any assessment should include a broad range. PISA classifies texts by:
• text format – continuous, non-continuous, mixed and multiple
• text type – description, narration, exposition, argumentation, instruction and transaction
• text display space
• environment, such as authored or message-based.
The addition of digital reading in the 2009 framework made text classification more complex. The 2009 reading literacy assessment used a text classification of “medium: print and electronic”. With the move to computer-based delivery for 2015, however, this is a potential source of confusion. For 2015 the terminology has been updated to “fixed text” and “dynamic text” to distinguish between delivery mode and the space in which the text is displayed, regardless of whether it is printed or onscreen. Additionally, the “environment” classification was a new variable for the PISA 2009 reading framework, but as it applies only to dynamic texts, it will not be discussed in the 2015 PISA framework. It is important to note that, despite changes to terminology, the constructs of the 2009 framework remain unchanged.
Table 3.1 Target distribution of tasks by situation for PISA 2015
Situation Percentage of total tasks Personal 30 Educational 25 Occupational 15 Public 30
Source: OECD, 2013a.
Table 3.2 Target distribution of tasks by text format for PISA 2015
Text format Percentage of total tasks print Continuous 60 Non-continuous 30 Mixed 5 Multiple 5
Source: OECD, 2013a.

46 – CHAPTER 3 – COMPONENT SKILLS AND COGNITIVE INSTRUMENTS USED IN EDUCATIONAL ASSESSMENTS
A REVIEW OF INTERNATIONAL LARGE-SCALE ASSESSMENTS IN EDUCATION: ASSESSING COMPONENT SKILLS AND COLLECTING CONTEXTUAL DATA © OECD AND THE WORLD BANK 2015
Table 3.3 Approximate distribution of tasks by aspect for PISA 2015
Aspect Percentage of total tasks Access and retrieve 25 Integrate and interpret 50 Reflect and evaluate 25
Source: OECD, 2013a.
One of the greatest challenges for designing assessments is to create a framework and associated items that cover a very wide range of student capacity so that information can be gained about all students participating in the assessment. In PISA 2000, 2003 and 2006 it was noted that, while the level of proficiency of students can be located accurately, there is a shortage of descriptive information about what students at the extremes – particularly at the lower end of the distribution – know and can do as readers. This is because the majority of PISA items tested for skills and knowledge at the proficiency levels relevant to the majority of students. There were still significant numbers of students, however, performing outside these middle proficiency bands: either at a level much lower or much higher than the OECD average. There were few existing PISA tasks at the very easy end and the challenging end of the spectrum of task difficulty. In developing tasks for PISA 2009, therefore, there was an emphasis on including some very easy and some very difficult items. In addition to enhancing the descriptive power of the scale, better matching of the item difficulties to the student achievement distributions in each country improved the reliability of the population parameter estimates. Moreover, the test experience for individual students, particularly those performing at very low levels, has become more tolerable.
Developing items for the lower levels of proficiency was achieved by manipulating elements from PISA’s descriptive framework as follows:
• using shorter and simpler texts
• ensuring a closer literal match of terms between the item and the text
• providing more direction to find the relevant information in the text to solve the item
• addressing personal and familiar experiences in reflecting on and evaluating content items, rather than remote, abstract issues
• addressing concrete features in reflecting on and evaluating form items.
Other assessments’ reading frameworks There is a diverse range of approaches used in creating assessment frameworks in
reading across the international assessments considered in this report (see Annex C).
Some express a component of future uses of reading. SACMEQ adopted the same definition of reading literacy as PIRLS, which defines reading literacy as: “… the ability to understand and use those written language forms required by society and/or valued by the individual. Readers can construct meaning from texts in a variety of forms. They read to learn, to participate in communities of readers in school and everyday life, and for enjoyment” (Mullis and Martin, 2013: 14).

CHAPTER 3 – COMPONENT SKILLS AND COGNITIVE INSTRUMENTS USED IN EDUCATIONAL ASSESSMENTS – 47
A REVIEW OF INTERNATIONAL LARGE-SCALE ASSESSMENTS IN EDUCATION: ASSESSING COMPONENT SKILLS AND COLLECTING CONTEXTUAL DATA © OECD AND THE WORLD BANK 2015
The STEP reading literacy assessment has been developed specifically for developing country contexts, and it includes sets of questions taken from PIAAC. This overlap allows countries participating in the STEP programme to compare their literacy results with other countries. STEP defines literacy as “understanding, evaluating, using and engaging with written texts to participate in society, to achieve one’s goals, and to develop one’s knowledge and potential” (Pierre et al., 2014).
Several assessments have a clear list of the different domains of reading that should be included. PASEC lists the domains as comprehension of words, comprehension of sentences, reading/writing, conjugation, grammar and comprehension of text. EGRA, which focuses on the early grades, lists essential components of reading as phonemic awareness, phonics, fluency, vocabulary and comprehension. ASER and Uwezo, both citizen-led assessments, focus on letter recognition, word recognition and passage reading.
Mathematics
PISA’s mathematics frameworks For the purposes of PISA 2015, mathematical literacy is defined as follows:
Mathematical literacy is an individual’s capacity to formulate, employ, and interpret mathematics in a variety of contexts. It includes reasoning mathematically and using mathematical concepts, procedures, facts and tools to describe, explain and predict phenomena. It assists individuals to recognise the role that mathematics plays in the world and to make the well-founded judgments and decisions needed by constructive, engaged and reflective citizens (OECD, 2013b).
The PISA mathematical literacy framework is built on three interrelated aspects:
• processes, comprising:
formulating situations mathematically
employing mathematical concepts, facts, procedures and reasoning
interpreting, applying and evaluating mathematical outcomes
• content, comprising:
change and relationships
space and shape
quantity
uncertainty and data
• and context, comprising:
personal, related to one’s self, family or peer group
occupational, related to the world of work, such as measuring, costing and ordering materials for building, payroll or accounting, quality control, scheduling or inventory, design or architecture and job-related decision making

48 – CHAPTER 3 – COMPONENT SKILLS AND COGNITIVE INSTRUMENTS USED IN EDUCATIONAL ASSESSMENTS
A REVIEW OF INTERNATIONAL LARGE-SCALE ASSESSMENTS IN EDUCATION: ASSESSING COMPONENT SKILLS AND COLLECTING CONTEXTUAL DATA © OECD AND THE WORLD BANK 2015
societal, related to one’s community (whether local, national or global), such as voting systems, public transport, government, public policies, demographics, advertising, national statistics and economics
scientific, related to the application of mathematics to the natural world and issues and topics related to science and technology.
Table 3.4 Approximate distribution of score points by process category for PISA 2015
Process category Percentage of score points Formulating situations mathematically Approximately 25 Employing mathematical concepts, facts, procedures Approximately 50 Interpreting, applying and evaluating mathematical outcomes Approximately 25
Source: OECD, 2013b.
Table 3.5 Approximate distribution of score points by content category for PISA 2012
Content category Percentage of score points Change and relationships Approximately 25 Space and shape Approximately 25 Quantity Approximately 25 Uncertainty and data Approximately 25
Source: OECD, 2013b.
Table 3.6 Approximate distribution of score points by context category for PISA 2012
Context category Percentage of score points Personal Approximately 25 Occupational Approximately 25 Societal Approximately 25 Scientific Approximately 25
Source: OECD, 2013b.
Other assessments’ mathematics frameworks SACMEQ has a focus on practical application of the knowledge gained through
study. It defines mathematics literacy as “the capacity to understand and apply mathematical procedures and make related judgements as an individual and as a member of the wider society” (Ross et al., 2004). LLECE similarly adopts a literacy approach. It defines mathematics literacy as enabling students “to develop their potential, face situations, make decisions using the available information, solve problems, defend and argue their point of view … to integrate into society as full citizens who are critical and responsible” (SERCE, 2009).
The TIMSS definition of mathematics includes a cognitive dimension of “knowing, applying and reasoning”. TIMSS 2015 also has a mathematics assessment called TIMSS Numeracy which assesses fundamental mathematical knowledge, procedures and problem-solving strategies by asking students to answer questions and work out problems
CHAPTER 3 – COMPONENT SKILLS AND COGNITIVE INSTRUMENTS USED IN EDUCATIONAL ASSESSMENTS – 49
A REVIEW OF INTERNATIONAL LARGE-SCALE ASSESSMENTS IN EDUCATION: ASSESSING COMPONENT SKILLS AND COLLECTING CONTEXTUAL DATA © OECD AND THE WORLD BANK 2015
similar to TIMSS, except with easier numbers and more straightforward procedures. TIMSS Numeracy is designed for countries where most children are still developing fundamental mathematics skills.
The PASEC definition is a list of the domains of interest for both the Grade 2 and Grade 6 populations. EGMA lists the core areas of interest as number identification, number discrimination (which numeral represents a numerical value greater than another), number pattern identification (a precursor to algebra), and addition and subtraction (including word problems).
Most assessments include in their assessment frameworks some notion of numbers, measurement and geometry. Assessments at the higher grades also tend to include algebra and data.
Science
PISA’s science framework Science was the major domain in PISA 2006 and will be the major domain again in
PISA 2015.
The PISA definition of scientific literacy outlines what 15-year-old students should know, value and be able to do in order to be “prepared for life in modern society” (OECD, 2013c).
Central to the definition and assessment of scientific literacy are the competencies that characterise science and scientific enquiry. Students’ ability to make use of these competencies depends on their scientific knowledge: both their content knowledge of the natural world and their procedural and epistemic knowledge. In addition, it depends on a willingness to engage with science-related topics.
The PISA 2015 framework describes and illustrates the scientific competencies and knowledge that will be assessed, the contexts for test items, and the range of items’ “cognitive demand” (their level of difficulty). Test items will be grouped into units, each unit beginning with stimulus material that establishes the context for items. A combination of item types will be used. Computer-based delivery for 2015 offers the opportunity for several novel item formats, including animations and interactive simulations. This will improve the validity of the test and the ease of scoring.
The ratio of items assessing students’ content knowledge of science to items assessing procedural and epistemic knowledge of science will be about 3:2. Approximately 50% of the items will test students’ competency to explain phenomena scientifically, 30% their competency to interpret data and evidence scientifically, and 20% their competency to evaluate and design scientific enquiry. The cognitive demand of items will consist of a range of low, medium and hard. The combination of these weightings and a range of items of varying cognitive demand will enable proficiency levels to be constructed to describe performance in the three competencies that define scientific literacy.
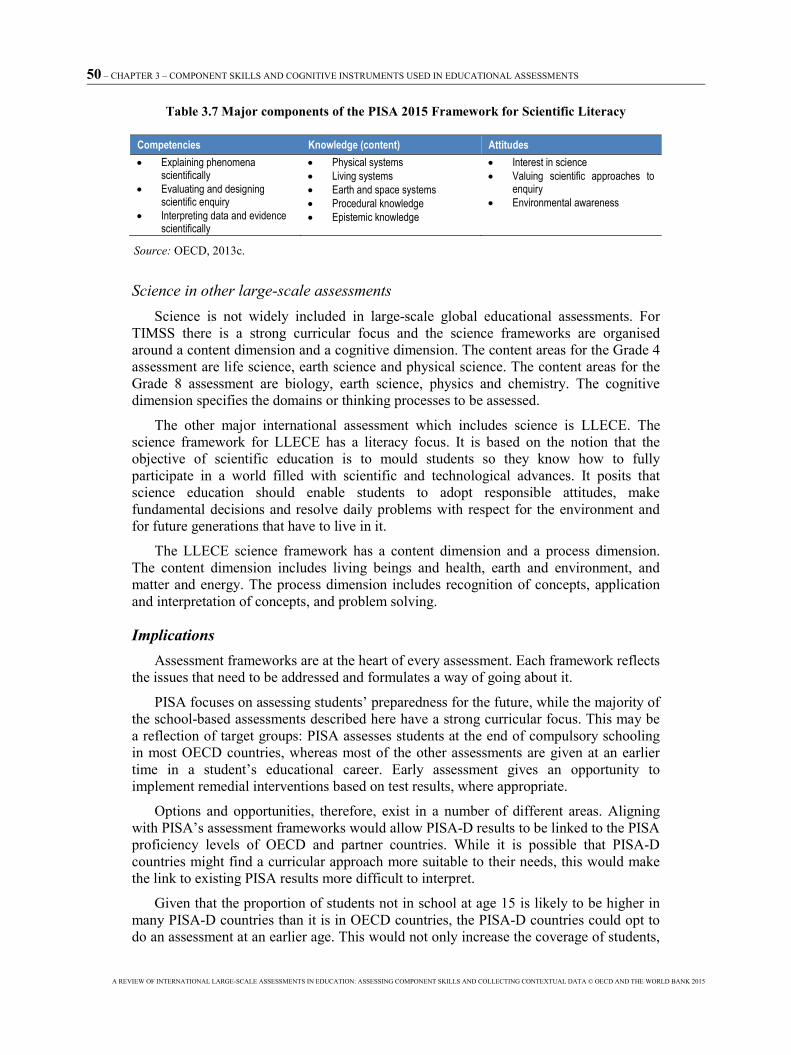
50 – CHAPTER 3 – COMPONENT SKILLS AND COGNITIVE INSTRUMENTS USED IN EDUCATIONAL ASSESSMENTS
A REVIEW OF INTERNATIONAL LARGE-SCALE ASSESSMENTS IN EDUCATION: ASSESSING COMPONENT SKILLS AND COLLECTING CONTEXTUAL DATA © OECD AND THE WORLD BANK 2015
Table 3.7 Major components of the PISA 2015 Framework for Scientific Literacy
Competencies Knowledge (content) Attitudes • Explaining phenomena
scientifically • Evaluating and designing
scientific enquiry • Interpreting data and evidence
scientifically
• Physical systems • Living systems • Earth and space systems • Procedural knowledge • Epistemic knowledge
• Interest in science • Valuing scientific approaches to
enquiry • Environmental awareness
Source: OECD, 2013c.
Science in other large-scale assessments Science is not widely included in large-scale global educational assessments. For
TIMSS there is a strong curricular focus and the science frameworks are organised around a content dimension and a cognitive dimension. The content areas for the Grade 4 assessment are life science, earth science and physical science. The content areas for the Grade 8 assessment are biology, earth science, physics and chemistry. The cognitive dimension specifies the domains or thinking processes to be assessed.
The other major international assessment which includes science is LLECE. The science framework for LLECE has a literacy focus. It is based on the notion that the objective of scientific education is to mould students so they know how to fully participate in a world filled with scientific and technological advances. It posits that science education should enable students to adopt responsible attitudes, make fundamental decisions and resolve daily problems with respect for the environment and for future generations that have to live in it.
The LLECE science framework has a content dimension and a process dimension. The content dimension includes living beings and health, earth and environment, and matter and energy. The process dimension includes recognition of concepts, application and interpretation of concepts, and problem solving.
Implications Assessment frameworks are at the heart of every assessment. Each framework reflects
the issues that need to be addressed and formulates a way of going about it.
PISA focuses on assessing students’ preparedness for the future, while the majority of the school-based assessments described here have a strong curricular focus. This may be a reflection of target groups: PISA assesses students at the end of compulsory schooling in most OECD countries, whereas most of the other assessments are given at an earlier time in a student’s educational career. Early assessment gives an opportunity to implement remedial interventions based on test results, where appropriate.
Options and opportunities, therefore, exist in a number of different areas. Aligning with PISA’s assessment frameworks would allow PISA-D results to be linked to the PISA proficiency levels of OECD and partner countries. While it is possible that PISA-D countries might find a curricular approach more suitable to their needs, this would make the link to existing PISA results more difficult to interpret.
Given that the proportion of students not in school at age 15 is likely to be higher in many PISA-D countries than it is in OECD countries, the PISA-D countries could opt to do an assessment at an earlier age. This would not only increase the coverage of students,

CHAPTER 3 – COMPONENT SKILLS AND COGNITIVE INSTRUMENTS USED IN EDUCATIONAL ASSESSMENTS – 51
A REVIEW OF INTERNATIONAL LARGE-SCALE ASSESSMENTS IN EDUCATION: ASSESSING COMPONENT SKILLS AND COLLECTING CONTEXTUAL DATA © OECD AND THE WORLD BANK 2015
but also give the opportunity to implement improvements before the end of students’ education.
The inclusion of science as an area of assessment occurs only in a minority of assessments. It may be worth limiting the PISA-D assessment to language and mathematics.
Item development
Organisation and process The item development process for PISA follows the assessment framework and
involves collaboration with participating countries. The development process comprises a number of steps.
The first step in the process is item generation. Many items are created within the categories of the assessment framework. An excess of items is created because many will be dropped during the review and improvement process. To create around 120 items needed for a PISA major domain, the item writers would develop around 480 items to start the process.
Next is the panelling of items. Fellow item writers will review the newly created items and suggest amendments or deletion.
In the cognitive trial, or pilot, the items are tested with a small sample of the target audience. The trial sample will make comments and give feedback on the items’ level of language and comprehensibility. Around 240 items will be chosen to go through to the field trial.
In the field trial, all remaining items will be tested in every participating country so that the developers can gain an idea of the items’ cultural, geographic or ethnic bias.
Finally, items will be selected for the main study. Following the field trial, the required 120 items will be selected, taking into account coverage of the framework, and ensuring a range of difficulties and item response types are included.
In the creation of test items some of the assessments use a more centrally focused method, while others tend to draw widely. SACMEQ tests, for example, are developed by a panel of subject specialists drawn from all the 15 participating school systems, whereas PASEC tends to create the items centrally and finalise them in association with participating countries. Items are trialled in each of the countries and results analysed.
LLECE uses an approach in which a group of experts creates items, and also calls for submission of items, which are then refined at national co-ordinators’ meetings. TERCE is based on a published curriculum analysis, which guided the creation of specification tables, which in turn ensured item development followed the curriculum. Item development was done, in principle, in a participatory fashion, involving specialists from almost all countries.
For EGRA and EGMA, for which results are not internationally comparable, each implementing country develops new versions of the EGRA/EGMA subtasks for its specific implementation. The Research Triangle Institute (RTI) provides guidelines for subtask development, but does not itself supervise or control the quality of the development. In a similar fashion, the ASER reading assessment is developed separately in each of the different assessment languages. The Hindi reading tool is developed at the

52 – CHAPTER 3 – COMPONENT SKILLS AND COGNITIVE INSTRUMENTS USED IN EDUCATIONAL ASSESSMENTS
A REVIEW OF INTERNATIONAL LARGE-SCALE ASSESSMENTS IN EDUCATION: ASSESSING COMPONENT SKILLS AND COLLECTING CONTEXTUAL DATA © OECD AND THE WORLD BANK 2015
ASER Centre in New Delhi, and the reading tools in all other languages are developed by the Pratham and ASER Centre state teams.
The collaborative item development process undertaken by the OECD for PISA, the IEA for PIRLS and TIMSS, and the LLECE for TERCE can lead to a greater commitment on the part of the countries in the assessments.
The degree of centralisation is not related to the quality of the items produced, but more to the purpose of the instrument.
Example items relevant for PISA-D Secure items from the PIRLS, TIMSS, PASEC and SACMEQ assessments have not
been made available for this review. While considering items from other assessments may have been interesting, it is important to realise that items’ characteristics can only be assessed by testing them with the specific target populations for which they are intended. An item that is suitable in one context will not necessarily be suitable in another. This is because there will be differences in assessment framework definitions and in the assessment’s philosophy. As discussed above, some assessments are curriculum-based, while PISA is future-focused; and even within curriculum-based assessments, items may not be transferable due to differences between the curricula of the countries for whom the item was designed. There will also be differences in the time allowed for the test and differences in response type.
Some assessment programmes, however, publicly release items so that readers can gain an idea of the style of items and their difficulty.
ASER, for example, is designed to give a rapid and global assessment of basic reading skills. Given its orientation to precursor skills for reading literacy that do not include comprehension in any guise, it is judged to not be well aligned for integration with the PISA construct and framework for reading.
Following administration of each PIRLS survey a number of items are released (IEA, 2013a) along with associated item statistics, framework coverage and performance of individual countries (IEA, 2013b).
An example of such an item, ‘Fly Eagle Fly’, can be seen in Annex B (IEA, 2013a). This item is made up of a stimulus containing text and illustrations, followed by a number of questions. The first question, R21E01M, is a multiple-choice question about what the farmer in the passage was looking for. There were four alternatives. The proportion of students per country who chose the correct answer varied from 58% to 97% (IEA, 2013b). The process of comprehension being assessed in this item was described as “focus on and retrieve explicitly stated information”.
The subsequent questions for this PIRLS item vary in their difficulty level. The hardest question was R21E07C, which had percentages for correct responses ranging from 9% in one country to 66% in the highest performing country (IEA, 2013b). The process of comprehension being assessed in this item was “interpret and integrate ideas and information”, which is a more demanding task.
Items are also released to illustrate the TIMSS assessment (see Annex B).
In TIMSS 2011 there is an item about fractions (ID: M032166) which was categorised in the content domain of “number” and in the cognitive domain of “knowing”. It is a multiple choice item with an average correct rate of 57%. In the highest

CHAPTER 3 – COMPONENT SKILLS AND COGNITIVE INSTRUMENTS USED IN EDUCATIONAL ASSESSMENTS – 53
A REVIEW OF INTERNATIONAL LARGE-SCALE ASSESSMENTS IN EDUCATION: ASSESSING COMPONENT SKILLS AND COLLECTING CONTEXTUAL DATA © OECD AND THE WORLD BANK 2015
performing country, Singapore, 92% of the students answered the item correctly, while in the lowest performing country, Ghana, 26% of the students were correct.
One of the most difficult TIMSS items was M032760B, which is in the content domain of “algebra” and the cognitive domain of “reasoning” with the topic area of “patterns”. For this item 20% of students across all countries scored correctly. The highest correct rate was 65% in Singapore and the lowest was 3% in Ghana.
The LAMP assessment items shown in Annex B illustrate a prose item – asking students to read a label on a medicine and extract important information; and a numeracy item – asking students to calculate the total number of bottles shown in a diagram. LAMP is aimed at a population of those 15 years and older in developing countries. The items are developed with realistic context.
A sample item from the PIAAC Reading Components assessment is shown in Annex B.
Item developers for PISA-D will be able to use such information to guide the selection of suitable items.
A factor hampering the inclusion of items directly into PISA-D is that the scoring method may not be in line with PISA scoring methods. New response scoring algorithms would need to be developed for the items to be analysed alongside standard PISA items. For example, each element of a multi-part task could be scored in two parts, with some provision for treatment of elements not answered within the time period of the test.
The notion of framework coverage and alignment with existing PISA frameworks is important. When EGMA items, for example, are considered within the PISA framework, all items fit in the “quantity” content category; most fit in the “employ process” category (with only a few in “formulate”); and most of them are presented without any context, whereas context is a key characteristic of PISA items.
Implications Key points of relevance to PISA-D are that a collaborative item development process
can lead to a greater commitment among countries to the assessments, and that a centralised approach (with country input) allows for items to be more efficiently developed to reflect a given assessment framework.
In terms of using existing items from other assessments in PISA-D, the approach used in TIMSS Numeracy and prePIRLS Reading is relevant. TIMSS Numeracy asks students to answer questions and work out problems similar to TIMSS, except with easier numbers and more straightforward procedures.
Where a clear link to existing PISA assessments is required, items will need to fit into the framework structure of PISA, and be implemented in a similar way to PISA. In addition, care needs to be taken that the scoring procedures adopted in the items match that of PISA. PISA uses multiple choice and open or constructed and short response items. Response items are scored according to a two-point (0, 1), three-point (0, 1, 2) or, rarely, four-point (0, 1, 2, 3,) categorisation scheme.

54 – CHAPTER 3 – COMPONENT SKILLS AND COGNITIVE INSTRUMENTS USED IN EDUCATIONAL ASSESSMENTS
A REVIEW OF INTERNATIONAL LARGE-SCALE ASSESSMENTS IN EDUCATION: ASSESSING COMPONENT SKILLS AND COLLECTING CONTEXTUAL DATA © OECD AND THE WORLD BANK 2015
Test design
Organisation, item difficulty, test targeting and mode of delivery When designing a test to adequately ensure coverage over a range of difficulty levels,
the item pool must contain many more items than could fit into a single test. As a result, not every student will sit the same test. Each student is exposed to a part of the total item pool. For this reason it is necessary to construct different booklets. PISA tests have traditionally been constructed in booklets composed of four clusters of items, which could include reading, mathematics or science items. For scaling to take place, some items must be common across the booklets. PISA focuses on one major domain and two minor domains each iteration, cycling through the domains from one survey implementation to the next. Every booklet will include at least one cluster of the major domain.
The basic PISA design had 13 booklets, enhanced by including items at the lower and upper extremes to a further 13 booklets. Countries opt to do just one of the sets of booklets.
Across the clusters there is a variety of items with different difficulty levels and modes of response.
In PISA the main contractor has been responsible for proposing the design to the PGB for approval.
PIRLS In both TIMSS and PIRLS, approximately half the items are constructed response and
half are multiple-choice (Mullis et al., 2012: 10).
Each multiple choice question is worth one point. Constructed response questions are worth one, two or three points, depending on the depth of understanding required. In the development of comprehension questions, the decision to use either a multiple choice or a constructed response format is based on the process being assessed, and on which format best enables test takers to demonstrate their reading comprehension.
Multiple choice questions provide students with four response options, of which only one is correct. For students who may be unfamiliar with this test question format, the instructions given at the beginning of the test include a sample multiple choice item that illustrates how to select and mark an answer (Mullis and Martin, 2013: 62).
Each constructed response question has an accompanying scoring guide that describes the essential features of appropriate and complete responses. Scoring guides focus on evidence of the type of comprehension the questions assess. The guides describe evidence of partial understanding and evidence of complete or extensive understanding. In addition, sample student responses at each level of understanding provide important guidance to scoring staff. In scoring students’ responses to constructed response questions, the focus is solely on students’ understanding of the text, not on their ability to write well. Also, scoring takes into account the possibility of various interpretations that may be acceptable, given appropriate textual support. Consequently, a wide range of answers and writing ability may appear in the responses that receive full credit for any one question (Martin, Mullis and Foy, 2013a: 63).
Significantly for the PISA-D initiative, the prePIRLS items use multiple choice and constructed response formats, as in PIRLS, but with several differences to accommodate the lower proficiency levels of the test takers. Constructed response items usually are

CHAPTER 3 – COMPONENT SKILLS AND COGNITIVE INSTRUMENTS USED IN EDUCATIONAL ASSESSMENTS – 55
A REVIEW OF INTERNATIONAL LARGE-SCALE ASSESSMENTS IN EDUCATION: ASSESSING COMPONENT SKILLS AND COLLECTING CONTEXTUAL DATA © OECD AND THE WORLD BANK 2015
worth only one or two points. However, there is a slightly higher percentage of constructed response items in the prePIRLS assessment, comprising up to 60% of the total score points. This decision was made because constructed response items that require a very short response often are easier for early readers due to the lighter reading demand, as compared with multiple choice items that require students to read and evaluate four response options. In addition, multiple choice items may lose some of their effectiveness in passages as short as those used in prePIRLS, because there are fewer plausible distracters that can be drawn from the text (Martin, Mullis and Foy, 2013a: 66).
Each domain contains items representing a full range of difficulty (Jones, Wheeler and Centurino, 2013: 55)
In educational measurement, analysis is most informative when the difficulty of the items used to assess student achievement matches the ability of the students taking the assessment. In the context of assessing mathematics/science achievement, measurement is most efficient when there is a reasonable match between the mathematics/science ability level of the student population being assessed and the difficulty of the assessment items. The greater the mismatch, the more difficult it becomes to achieve reliable measurement. In particular, when the assessment tasks are much too challenging for most students, to the extent that many students are responding at chance level, it is extremely difficult to achieve acceptable measurement quality.
PIRLS and prePIRLS are currently paper-and-pencil assessments.
TIMSS The TIMSS assessments primarily use multiple choice and constructed response
items. At least half of the total number of points represented by all the items will come from multiple choice items. Each multiple choice item is worth one score point. Constructed response items generally are worth one or two score points, depending on the nature of the task and the skills required to complete it. In developing assessment items, the choice of item format depends on the mathematics or science being assessed, and the format that best enables students to demonstrate their proficiency (Martin, Mullis and Foy, 2013b: 92).
In the context of assessing mathematics/science achievement, measurement is most efficient when there is a reasonable match between the mathematics/science ability level of the student population being assessed and the difficulty of the assessment items.
The mode of test delivery for TIMSS has been paper-and-pencil.
SACMEQ SACMEQ tests were developed by a panel of subject specialists drawn from all the
15 SACMEQ school systems to identify those elements of curriculum outcomes that were considered important and which were to be assessed in the tests. The subject specialists also reviewed the test items to ensure that they conformed to the national syllabuses of SACMEQ countries (Hungi, 2011: 3).
SACMEQ is a paper-and-pencil assessment.
PASEC The PASEC Grade 2 assessment is administered at the beginning of the school year.
There are no rotated booklets but only one booklet: all the students have the same items.

56 – CHAPTER 3 – COMPONENT SKILLS AND COGNITIVE INSTRUMENTS USED IN EDUCATIONAL ASSESSMENTS
A REVIEW OF INTERNATIONAL LARGE-SCALE ASSESSMENTS IN EDUCATION: ASSESSING COMPONENT SKILLS AND COLLECTING CONTEXTUAL DATA © OECD AND THE WORLD BANK 2015
Tests are taken individually with the assistance of a test administrator in charge of oral instructions and coding. The administrator is given a notebook for each student. Each notebook contains instructions and correction tables. The administrator directly corrects each student’s answers in that student’s notebook after the administration of the exercise. For most exercises, the administrator provides the students with a student support resource, containing images, letters and words grids and texts that students must browse and read in order to answer the various exercises. In mathematics, students are also given a slate and chalk to help them solve operations and problems.
Students can answer questions with very brief answers, by pointing to an image or an item with their finger on the student support, by reading letters, numbers, words or sentences aloud or by showing their written answer on their slate. Some examples are given at the beginning of each exercise to ensure that all students understand the meaning of the question.
The full PASEC test is administered to Grade 6 students. The 2014 PASEC test used an item pool of 92 reading items, divided into four blocks; and 81 mathematics items, also in four blocks. These items were then arranged into four test booklets (booklet A/B/C/D). Each booklet contained two blocks of reading items and two blocks of maths items. Each student only answers 46 reading items and 40 mathematics items.
Each block is found twice in the four booklets (A/B/C/D). A total of eight blocks (four in reading: “L” and four in mathematics: “M”) are located in the four booklets so that each block appears once at the beginning and once at the end. The eight blocks are located in the four booklets as follows:
Booklet A Block 1 L Block 2 L Block 1 M Block 2 M
Booklet B Block 2 L Block 3 L Block 2 M Block 3 M
Booklet C Block 3 L Block 4 L Block 3 M Block 4 M
Booklet D Block 4 L Block 1 L Block 4 M Block 1 M
PASEC is a paper-and-pencil delivered assessment.
LLECE A UNESCO panel of experts developed the test and booklet design. There are six
clusters of items per domain and two clusters are used per booklet.
The Second Regional Comparative and Explanatory Study (SERCE) and TERCE were paper-and-pencil tests.
Table 3.8 SERCE test and booklet design
Grade Domain Multiple choice items Open items Total items
3 Reading 11, in each cluster 0 11
Maths 10, in clusters 2, 4 and 612, in clusters 1, 3 and 5 2, in clusters 2, 4 and 6 12
6
Reading 16, in each clusters 0 16
Maths 13, in clusters 2, 4 and 616, in clusters 1, 3 and 5 3 in clusters 1, 3 and 5 16
Science 14, in each clusters 1, in all clusters 15
Source: SERCE, 2010.

CHAPTER 3 – COMPONENT SKILLS AND COGNITIVE INSTRUMENTS USED IN EDUCATIONAL ASSESSMENTS – 57
A REVIEW OF INTERNATIONAL LARGE-SCALE ASSESSMENTS IN EDUCATION: ASSESSING COMPONENT SKILLS AND COLLECTING CONTEXTUAL DATA © OECD AND THE WORLD BANK 2015
PIAAC The set of items for the PIAAC main study was balanced in terms of construct
representation, based on the overall distributions recommendations in the framework. A total of 58 items was selected for literacy and numeracy, with the distribution across linking and new paper and computer versions shown in Table 3.9 (Louise and Tamassia, 2013: 24). The test design for PIAAC was based on a variant of matrix sampling (using different sets of items, multi-stage adaptive testing and different assessment modes) where each respondent was administered a subset of items from the total item pool. Different groups of respondents therefore answered different sets of items.
PIAAC can be taken as a paper-based survey or as a computer-based survey.
Table 3.9 Literacy and numeracy items in the PIAAC main study
Literacy Numeracy Linking New Linking New
Paper-based 18 6 19 6
Computer-based 30 (including computer versions of the 18 above linking items)
22 28 (including computer versions of 14 of the above linking items)
22 (including computer versions of 3 of the above linking items)
Source: Louise and Tamassia, 2013: 25.
LAMP LAMP is one of the few assessments that includes an adaptive process – one that
filters or directs students on the basis of previous responses.
Students first sit a filter test. This is a brief booklet intended to establish if the respondent would most likely possess lower or higher levels of literacy skills. It therefore helps in deciding what sort of instruments should be used to gain a more in-depth picture of the respondent’s skills.
Students with relatively low filter test results are given the module for those with lower performance. This module is composed of two instruments. One instrument supplements the information produced by the filter test with more detail and establishes more precisely where the respondent stands in relation to the lower skill levels. The other enables an in-depth exploration of the operations (reading components) that might be preventing the respondent from achieving a better performance.
Students with relatively high filter test results are given a module for those with higher performance. This module comprises one booklet (in two versions) that supplements the information produced by the filter test with more detail and establishes more precisely where the respondent stands in relation to the higher skill levels.
LAMP is a paper-and-pencil delivered assessment.
ASER Each year there are four test forms for each domain. There are no common items
across any two forms and no systematic method for rotating forms during test administration.

58 – CHAPTER 3 – COMPONENT SKILLS AND COGNITIVE INSTRUMENTS USED IN EDUCATIONAL ASSESSMENTS
A REVIEW OF INTERNATIONAL LARGE-SCALE ASSESSMENTS IN EDUCATION: ASSESSING COMPONENT SKILLS AND COLLECTING CONTEXTUAL DATA © OECD AND THE WORLD BANK 2015
Regarding form rotation during test administration, ASER Centre says:
The test administers are instructed not to use the sample form for the children from the same household; especially if they are around each other as the test is being administered. In rural household settings, it is often the case that the siblings of the child hang around out of curiosity, while [the child] is being tested. To avoid imitation of responses from one child to another, this instruction was incorporated. (Banerji, R., personal communication, 27 April 2014)
In ASER the test is designed so that there are a given number of items per task in each domain. For example, in the reading domain, for the task for ‘letters’, any five letters from a set of ten letters are selected and read aloud. Items are selected to cover the other tasks of “words” (five items), “paragraph” (reading text of four sentences) and “story” (reading aloud seven to ten sentences).
Similarly in the mathematics domain, five items are included for each task of “number recognition (1 to 9)” and “number recognition (10 to 99)”, two items for “subtraction” and one item for “division”.
There are varying degrees of difficulty.
ASER is a paper-and-pencil delivered assessment.
Uwezo Each year there are four test forms for each domain. There are no common items
across any two forms.
In literacy, the tests include items about letter/syllable recognition, reading aloud and comprehension. In numeracy the tests include items about counting, number recognition and understanding of terms such as “greater than“ as well as knowledge of the operations, addition, subtraction, multiplication and division.
There is no systematic method for rotating forms at the time of test administration, but the Uwezo standards state that to avoid familiarity a different set of tests should be administered to each child in a household (Uwezo, 2012: 8).
Implications To cater for the expected wide range of student capacity, a test design must include
sufficient items across all levels of difficulty. Experience with PISA has shown that, in the context of developing countries, the tests can be too hard for the majority of the students. In some countries over 50% of the students score below Proficiency Level 1, meaning that there is no description of the capacity of these students. This is despite the fact that from 2009 onwards PISA tests have been extended to include a greater number of easy items.
A large range of item types and difficulties needs to be included in the test. This will be best done with a multi booklet approach. The booklets should include some common items to allow linking between them.
Regard should be given to the mode of delivery of the test. Many of the tests examined here are paper-and-pencil tests. However, ACER has recently successfully implemented tests using tablet computers, in Lesotho, Afghanistan and remote Indigenous communities in Australia. This form of test delivery is worth considering. There are advantages to this approach:

CHAPTER 3 – COMPONENT SKILLS AND COGNITIVE INSTRUMENTS USED IN EDUCATIONAL ASSESSMENTS – 59
A REVIEW OF INTERNATIONAL LARGE-SCALE ASSESSMENTS IN EDUCATION: ASSESSING COMPONENT SKILLS AND COLLECTING CONTEXTUAL DATA © OECD AND THE WORLD BANK 2015
• Students are more stimulated by the test experience.
• Students easily master the equipment, even when they have never seen a tablet before.
• Innovations such as sound can be easily introduced, thereby accommodating students with sight difficulty.
• Student responses are captured instantly, alleviating the need for an expensive data-entry process.
• Data-entry errors are eliminated.
• Data management is much easier and more secure; data loss is reduced; and data can be uploaded whenever administrators have a reliable Internet connection.
• Tablets can be re-used many times.
At the same time it should be acknowledged there are some potential obstacles to the introduction of tablets. ACER’s experience suggests a number of challenges:
• The design processes for the platform and the app could be costly and time-consuming, especially if starting from scratch.
• Translation processes could be difficult. (Translation is built into ACER’s existing translation management system.)
• It may be difficult to ensure all countries use the same model tablet. If they do not, the app and directions will generally have to change for each model. (This would not be a significant issue if only simple multiple choice items were used.)
• Some countries may face problems with theft; a tablet is a more attractive item than a standard test booklet.
Using tablets would also be in line with PISA’s latest implementation, a mostly computer-based test. However, this technology is not currently widely used by the assessments included in this report.
Psychometric analyses, scaling, calibration and equating methods
For scaling, PISA employs “item response theory” in the form of a one-parameter Rasch model. Open student responses (as opposed to multiple choice) are coded by trained coders to ensure consistency across countries. The codes for the responses to both open and multiple choice items are entered into a custom designed software package by trained data entry personnel.
TIMSS, PIRLS, SACMEQ, LLECE, PIAAC and STEP all use item response theory.
PASEC provides an interesting example of scaling methodology evolution. They had employed classic test theory, but used an item response theory analysis (Rasch measurement) from 2012. This item response theory analysis was initially for cognitive tests only in Mali, Vietnam, Cambodia and PDR Lao, but is now being extended to both tests and contextual data.
For EGRA, the situation is different in each country, so there is no overall international scaling. However, item response theory is sometimes used to analyse field

60 – CHAPTER 3 – COMPONENT SKILLS AND COGNITIVE INSTRUMENTS USED IN EDUCATIONAL ASSESSMENTS
A REVIEW OF INTERNATIONAL LARGE-SCALE ASSESSMENTS IN EDUCATION: ASSESSING COMPONENT SKILLS AND COLLECTING CONTEXTUAL DATA © OECD AND THE WORLD BANK 2015
trial data (to ensure, for example, that the reading passages cover the whole ability range and discriminate well between different ability levels).
While item response theory is not the only method employed, it is widely used in scaling and is the preferred method of all the assessments under review, as discussed below.
Implications Item response theory scaling is the preferred method for analysing student results of
all the assessments under review. This type of scaling is based on a continuous interaction between the student’s capacity and an item’s difficulty, and gives a clear picture of students’ capacity.
It also allows a particular test to be linked to any other test by including common items in both. This can be done over successive years to gain an accurate picture of a student’s educational growth.
PISA has used a one-parameter model based on item difficulty, and will be modifying the approach slightly for PISA 2015. PIRLS and TIMSS each employ a three-parameter model.
Given the wide range of student capacity across the countries, PISA-D might incorporate a process to determine what type of test would be most appropriate for particular students to do. Some form of adaptive testing may be considered. This would be done with the aim of targeting tests at students’ level of skill. The approach used in PIAAC is relevant for PISA-D. PIAAC’s test design is based on a variant of matrix sampling (using different sets of items, multi-stage adaptive testing, and different assessment modes) with each respondent administered a subset of items from the total item pool. Different groups of respondents therefore answer different sets of items, making it inappropriate to use any scaling system based on the number of correct responses.
Cross-country comparability
The first step in establishing cross-country comparability in PISA takes place during the item development process, when each participating country is given the opportunity to review the items to ensure that they are relevant to their student body.
A further step involves an analysis of countries’ results on all items from the field trial and comparing performance on each item with the expected performance. Any deviation – that is, where the item appears to be too easy or too hard – is investigated, to see if the cause is the translation, the presentation of the item or some cultural or geographic factor that changes the expected difficulty. This is known as differential item functioning. In PISA this is done both for the field trial and the main study.
In assessments such as PIRLS, TIMSS, PIAAC and LAMP, where cross-country comparisons are routinely made, item-by-country interactions are analysed. It is essential that the items do not behave in an incongruous manner from one country to another.
Until 2014, PASEC did not have a focus on international comparisons, but from 2014 it will undertake a study of item-by-country interaction.
No such measures are needed in assessments such as EGRA or EGMA, where comparisons are not made, nor in ASER which is focused on one country only.

CHAPTER 3 – COMPONENT SKILLS AND COGNITIVE INSTRUMENTS USED IN EDUCATIONAL ASSESSMENTS – 61
A REVIEW OF INTERNATIONAL LARGE-SCALE ASSESSMENTS IN EDUCATION: ASSESSING COMPONENT SKILLS AND COLLECTING CONTEXTUAL DATA © OECD AND THE WORLD BANK 2015
Uwezo, which is based on ASER, occurs across three countries. The tests are not identical because they are based on curriculum expectations of the respective countries. Including results from questions seen as equivalents across the countries achieves a measure of comparability.
Implications PISA-D should undertake a differential item functioning process to identify any
item-by-country interactions. This will identify any items that may advantage or disadvantage a particular country. How confident a country is to become involved in the process depends on their perception of being treated fairly.
This is best done in a two-step approach using the results from a field trial to identify any problems in cross-country comparability, and then acting to remove these problems for the main study. Following the main study, analysis should take place again to verify the cross-country comparability of the assessment.
Trends
One of the most important uses of assessment data for countries is to observe any changes occurring over time. Changes over time, or trends, give a measure of growth and improvement in student capacity. To facilitate this process it is necessary to include a proportion of the same items from one survey administration to the next; to measure change in results all other variables must remain fixed, such as the method of measurement.
Growth is measured when the same cohort is measured at different stages of their educational career. For most assessments it is not feasible to test the same students, but a measure of growth can be obtained if a representative sample is taken of the same cohort in a country as that cohort moves through the education system. TIMSS achieves this to a degree, by assessing students at both Grade 4 and at Grade 8.
Improvement (or declining performance) is indicated when there is an increase (or decrease) in student capacity at the same level in successive administrations of the survey – so change can be indicated for a country when comparing student performance in PISA 2003 and PISA 2012, for example.
In each PISA cycle, items are kept secure for future use and are deployed as link items appearing in a number of different survey cycles. This allows a measure of change to be calculated.
Change calculations include an estimate of error in linking from one survey cycle to the next. This estimate, known as the linking error, is built into the calculation of standard errors associated with the difference between the results of two PISA surveys.
The different assessments use a variety of approaches to measure change over time. In PIRLS, six of the ten 40-minute blocks of items were included in previous PIRLS assessments: two in all three assessments (2001, 2006 and 2011), two in both PIRLS 2006 and PIRLS 2011, and two in PIRLS 2011 only. Four new blocks will be developed for use for the first time in the 2016 assessment.
SACMEQ includes not only items from past implementations of its test, but also includes some items from other assessments such as TIMSS and PIRLS. The data from the combination of these items can be used to analyse change over time. In the first phase

62 – CHAPTER 3 – COMPONENT SKILLS AND COGNITIVE INSTRUMENTS USED IN EDUCATIONAL ASSESSMENTS
A REVIEW OF INTERNATIONAL LARGE-SCALE ASSESSMENTS IN EDUCATION: ASSESSING COMPONENT SKILLS AND COLLECTING CONTEXTUAL DATA © OECD AND THE WORLD BANK 2015
of PASEC, each country had been tested with the same booklets. Results from PASEC 2014, and from the next cycle in 2018, will be directly comparable.
The first two administrations of the LLECE assessments, namely the First Regional Comparative and Explanatory Study (PERCE) and SERCE, are not comparable because SERCE introduced a series of modifications resulting from the experience and knowledge gained from the implementation of PERCE. Some of the changes are related to sampling, test design, target population and knowledge domains covered by the assessment. However, by aligning the methodology, SERCE and the third implementation (TERCE) are considered comparable studies. There will be two scales: a comparable scale (already published), and a TERCE scale, to be used as the baseline from now on.
In ASER, care is taken to ensure that one year’s reading tool is comparable with previous years’ tools in terms of word count, sentence count, types of words and conjoint letters in words. They don’t necessarily use the same items from one year to the next.
In Uwezo, an attempt is made to ensure that the level of difficulty and comparability across the years is retained. In each year one new aspect will be added, while keeping the core the same to enable comparability across years.
Implications One key to attracting participants for a large-scale educational assessment such as
PISA-D will be to allow countries to monitor changes to educational standards over time, such as what proportion of students are achieving at a given level from one administration to the next. The assessments will need to include a selection of the same items from one survey administration to the next. This will allow the scaling process to link the two test cycles. This has implications for maintaining security of those items; if they enter the public domain they cannot be used confidently for this purpose. Items’ security is paramount if a reliable measure of trends is to be achieved.
In addition, it is also likely that countries will want some measure of the growth of students’ skills and knowledge as each cohort progresses in their education. This is done by administering the test to different year levels, but using some common items, so that the results can be mapped on the same scale.
Proficiency levels
A numerical student score, while providing a basis for comparison to other students, does not provide a guide to the student’s strengths and weaknesses. This can be done by examining the test items that the student is capable of and those that the student finds too difficult. Item response theory gives a means of doing this by dividing students into like groups and describing the characteristics of those groups. These characteristics are known as described proficiency levels.
In PISA, creating proficiency levels involves statistical processes and examination of item content. Following the main study, student results are scaled and items are divided into proficiency levels according to how many students answered each item correctly. The items are then examined for content and descriptions are created for each of the proficiency levels based on the tasks that are included in the items.
In PISA there are typically six levels, from Level One (the most basic), to Level Six (the most advanced). The proportion of students in each level provides valuable information to the participating countries about their students. If a country has a large

CHAPTER 3 – COMPONENT SKILLS AND COGNITIVE INSTRUMENTS USED IN EDUCATIONAL ASSESSMENTS – 63
A REVIEW OF INTERNATIONAL LARGE-SCALE ASSESSMENTS IN EDUCATION: ASSESSING COMPONENT SKILLS AND COLLECTING CONTEXTUAL DATA © OECD AND THE WORLD BANK 2015
proportion of students in the lower levels, for example, this might inspire the country to implement policy interventions aimed at remediation in an attempt to help the students catch up.
On the other hand, a country may have the vast bulk of students in the middle levels with few at the extremes. This might suggest that the students at the top end of the scale need strategies to extend their skills.
TIMSS and PIRLS have identified four points along the achievement scales to use as international benchmarks of achievement – Advanced International Benchmark (625), High International Benchmark (550), Intermediate International Benchmark (475), and Low International Benchmark (400). With each successive assessment, TIMSS and PIRLS work with the expert international committees to describe student competencies at the benchmarks. Experts then summarise the detailed list of item competencies in a brief description of achievement at each international benchmark.
For SACMEQ proficiency levels are created for reading and mathematics. Rasch item response theory was used to establish the difficulty value for each test item, national research co-ordinators subjected each test item to an intensive “skills audit”, and then wrote descriptive accounts of the competencies associated with each cluster of test items by using terminology that was familiar to ordinary classroom teachers.
Similar processes have been in used in LLECE assessments and in PIAAC, STEP and LAMP.
Defining proficiency levels has not been a feature of the ASER, EGRA/EGMA and Uwezo surveys.
The different assessments use a range of different strategies when describing the proficiencies of the students – some assessments use a process not dissimilar to the one described for PISA above, while others do not report proficiency levels at all.
Implications It is highly desirable to define the proficiency levels of the students in addition to
assigning them a numerical value for their results. Described proficiency levels based on the level of difficulty of the items and the tasks associated with the items give a better idea of students’ strengths and weaknesses.
Translating, adapting and verifying cognitive instruments
For a test to be taken across different countries in different languages, a systematic method of translation needs to be established to ensure that the test is a true reflection of student capacity and not a reflection of the language in which the test is administered.
The standard PISA survey is administered in more than 65 countries in approximately 44 languages.

64 – CHAPTER 3 – COMPONENT SKILLS AND COGNITIVE INSTRUMENTS USED IN EDUCATIONAL ASSESSMENTS
A REVIEW OF INTERNATIONAL LARGE-SCALE ASSESSMENTS IN EDUCATION: ASSESSING COMPONENT SKILLS AND COLLECTING CONTEXTUAL DATA © OECD AND THE WORLD BANK 2015
Table 3.10 Translated languages in other assessments
Assessment Number of translated languages
Large-scale international surveys
PIRLS 48
TIMSS 58
SACMEQ 3
PASEC 15
LLECE 2
School-based surveys EGRA 70
Household-based surveys
PIAAC 20
STEP 8
LAMP 15
ASER 18
Uwezo 6
Source: Author’s analysis of the technical manuals of each assessment.
In PISA, test items are created originally in English and then a second parallel version in French is prepared. Countries are supplied with these two source versions of every item, which they then organise for translation into their own language. In some countries this can be more than one language – for example in Switzerland, the assessment is administered in French, German and Italian. The test is administered in the language of instruction. In some countries this can be more than one language – for example, in Luxembourg there are different languages for different subjects. The same applies in Qatar where an extra complication arises because the languages (English and Arabic) are read in different directions – English is left to right and Arabic is right to left.
The two versions of the test emanating from the two source languages are then reconciled to ensure that they are the same. Following this a linguistic quality company will verify that the translated test is indeed the same as the one intended, so that the students receive no advantage nor disadvantage by undergoing the test in their own language.
In SACMEQ independent translations are made by at least two different expert translators familiar with age-appropriate linguistic demands. In cases of disagreement, consensus is achieved either by direct negotiation between the two translators or by a third expert making the final choice.
In PIRLS, TIMSS and PASEC, procedures also follow double independent translation plus external reconciliation. In PASEC the translation process is outsourced to specialised consultants and overseen by the PASEC technical team.
Translation processes for WEI-SPS and PIAAC were based on the materials and procedures used in PISA; that is, two independent translations from source versions followed by reconciliation and verification.
For the LLECE assessments, Spanish is the common language for all participating countries except for Brazil, where the test is in Portuguese. LLECE uses the back translation process: the Spanish source version is translated into Portuguese and then

CHAPTER 3 – COMPONENT SKILLS AND COGNITIVE INSTRUMENTS USED IN EDUCATIONAL ASSESSMENTS – 65
A REVIEW OF INTERNATIONAL LARGE-SCALE ASSESSMENTS IN EDUCATION: ASSESSING COMPONENT SKILLS AND COLLECTING CONTEXTUAL DATA © OECD AND THE WORLD BANK 2015
translated back into Spanish. The source Spanish version and back-translated version are compared and validated before the test.
For EGRA and EGMA there is no specified translation process.
For ASER and Uwezo the tools are developed independently in the separate languages.
Assessments where international comparisons are of prime importance usually undertake a double translation process with an independent verifier.
Implications To maintain the highest standards for translation, an assessment should adopt a
two-source version approach with independent translations of each source version, which are then reconciled and verified by an expert language organisation.
Field trial and item selection
In PISA, a field trial is administered in all participating countries in the year before the main study takes place. A country cannot participate in the main study if it has not done the field trial. Generally about 1 000 students of the target population undertake the field trial.
There are two main purposes of a field trial.
The first is to test the suitability of the item pool. Generally speaking, each newly created item needs to be administered to a minimum of 200 students per country so that the characteristics of the item can be fully described. This includes the item’s difficulty level, discrimination, point biserial1 (a figure which indicates if the better students are getting the more difficult questions right) and an indicator of how closely the item fits a model proposed by the Rasch analysis. This also establishes whether the item performs differently for boys and girls.
The second purpose of a field trial is to test the country’s logistical capacity to carry out the assessment. The administration of a large-scale international assessment is a complex task. The field trial allows the country to test the various procedures that are necessary: for example, sampling the students, contacting schools, and training test administrators, coders and data-entry personnel.
There are other benefits of a field trial: for example, the coding guide for some items may need to be modified or extended slightly based on the field trial results. In PISA generally, twice as many items are field trialled than are needed for the main study. Final item selection is based on ensuring framework coverage, a diverse range of difficulty levels appropriately targeted at the student sample, different item response formats, minimal cultural bias, including items which take the appropriate amount of time allocated and ensuring that there is a balance of gender effects. This doesn’t mean that all items need to be gender-neutral, but that there should be a balance of items that tend to favour both boys and girls. In this way the different response patterns can be explored.
All global assessments reviewed undertook some form of field trial or pilot study before the main study. Most assessments use the field trial to select the most appropriate items to go forward to the main study, keeping in mind the need to ensure that a wide range of difficulty and response types are included.

66 – CHAPTER 3 – COMPONENT SKILLS AND COGNITIVE INSTRUMENTS USED IN EDUCATIONAL ASSESSMENTS
A REVIEW OF INTERNATIONAL LARGE-SCALE ASSESSMENTS IN EDUCATION: ASSESSING COMPONENT SKILLS AND COLLECTING CONTEXTUAL DATA © OECD AND THE WORLD BANK 2015
In PIRLS and TIMSS the field trial sample size is approximately 30 schools in each country, yielding at least 200 student responses to each item. To lessen the load on schools, the samples for the field trial and the main study are drawn simultaneously, using the same random sampling procedures. This ensures that field trial sample closely approximates the main study samples, and that a school is selected for either the field trial or the main study, but not both.
The PASEC field trial sample is around 20 schools per country.
In the WEI-SPS, field trial analysis looked at the feasibility and cross-cultural validity of questions across the countries.
In TERCE, item behaviour in the pilot study was analysed based on an analytical plan by the implementation partner.
In EGRA, countries are encouraged to do a field trial to ensure the tool is accurately measuring what children know in the specific context and language(s) of assessment. It also allows verification of the validity and reliability of the instruments and gives the EGRA team an opportunity to address technical issues before the main study.
In LAMP, the field trial involves administering the entire battery of survey instruments to a carefully selected sample (not random) of roughly 500 adults in each test language.
In Uwezo, pre-tests involving six sample forms for each domain are conducted in several districts with different geographical characteristics. During pre-tests the test administrators note the tasks that are difficult for the children. After each pre-test there is a revision meeting in which feedback from test administration is shared. Revisions are made based on this feedback and recorded in the test tracking tool. The forms are then sent into the next pre-test. At the pre-testing stage, the data collected to inform test development are anecdotal data from the test administrators, whereas at the district-wide pilot stage assessment data are collected and analysed as they are in the main administration.
Implications In the vast majority of assessments, some form of field trial takes place to ensure that
the instrument is appropriately targeted. Most of the assessments also use the field test to examine the procedures needed to carry out the assessment.
For PISA-D, a field trial should take place to test the items’ suitability for the target sample and to see if each participating country has the capacity to implement the assessment. It is normal for a large number of items to be discarded following the field trial.
None of the countries to be undertaking PISA-D has participated previously in PISA. It is also possible that future participants may not have taken part in any international assessments and may not have well-developed national assessments. It is vital, therefore, that they gain as much experience as possible in the procedures associated with international testing, and this is best done with a field trial.
A field trial is also needed to ensure that the items used in the assessment are effectively targeted at the participating countries.
CHAPTER 3 – COMPONENT SKILLS AND COGNITIVE INSTRUMENTS USED IN EDUCATIONAL ASSESSMENTS – 67
A REVIEW OF INTERNATIONAL LARGE-SCALE ASSESSMENTS IN EDUCATION: ASSESSING COMPONENT SKILLS AND COLLECTING CONTEXTUAL DATA © OECD AND THE WORLD BANK 2015
Notes
1. Biserial correlation is a measure of association between a continuous variable and a binary variable. It is constrained to be between -1 and +1. The point biserial correlation is positive when large values of X are associated with Y=1 and small values of X are associated with Y=0.
References
Hungi, N. (2011), Accounting for Variations in the Quality of Primary School Education, SACMEQ, Paris, www.sacmeq.org/?q=publications.
IEA (2013a), PIRLS 2011 User Guide for the International Database: PIRLS Released Passages and Items, TIMSS and PIRLS International Study Center, Boston College, Chestnut Hill, MA, and International Association for the Evaluation of Educational Achievement (IEA), Amsterdam.
IEA (2013b), PIRLS 2011 User Guide for the International Database: PIRLS Percent Correct Statistics for the Released Items, TIMSS and PIRLS International Study Center and IEA, Chestnut Hill, MA and Amsterdam.
Jones, L.R., G. Wheeler, and V.A.S. Centurino (2013), “TIMSS 2015 science framework”, in I.V.S. Mullis and M.O. Martin (eds.), TIMSS 2015 Assessment Frameworks, TIMSS and PIRLS International Study Center and IEA, Chestnut Hill, MA and Amsterdam, pp. 29-58.
Louise, M. and C. Tamassia (2013), “Chapter 2: The development of the PIAAC cognitive instruments”, Technical report of the Survey of Adult Skills (PIAAC), pre-publication copy, OECD, Paris.
Martin, M.O., I.V.S. Mullis and P. Foy (2013a), “PIRLS 2016 assessment design and specifications”, in I. V. S. Mullis and M. O. Martin (eds.) PIRLS 2016 Assessment Frameworks, TIMSS and PIRLS International Study Center and IEA, Chestnut Hill, MA and Amsterdam, pp. 57-69.
Martin, M.O., I.V.S. Mullis and P. Foy (2013b), “TIMSS 2015 assessment design”, in I.V.S. Mullis and M.O. Martin (eds.), TIMSS 2015 Assessment Frameworks, TIMSS and PIRLS International Study Center and IEA, Chestnut Hill, MA and Amsterdam.
Mullis, I.V.S. et al. (2012), “Assessment framework and instrument development”, in M.O. Martin and I.V.S. Mullis (eds.), Methods and Procedures in TIMSS and PIRLS 2011, TIMSS and PIRLS International Study Center, Chestnut Hill, MA.
Mullis, I.V.S. and M.O. Martin (eds.) (2013), PIRLS 2016 Assessment Framework, TIMSS and PIRLS International Study Center and IEA, Chestnut Hill, MA and Amsterdam.
OECD (2013a), PISA 2015 Draft Reading Literacy Framework, www.oecd.org/pisa/pisaproducts/Draft%20PISA%202015%20Reading%20Framework%20.pdf.

68 – CHAPTER 3 – COMPONENT SKILLS AND COGNITIVE INSTRUMENTS USED IN EDUCATIONAL ASSESSMENTS
A REVIEW OF INTERNATIONAL LARGE-SCALE ASSESSMENTS IN EDUCATION: ASSESSING COMPONENT SKILLS AND COLLECTING CONTEXTUAL DATA © OECD AND THE WORLD BANK 2015
OECD (2013b), PISA 2015 Draft Mathematics Framework, www.oecd.org/pisa/pisaproducts/Draft%20PISA%202015%20Mathematics%20Framework%20.pdf.
OECD (2013c), PISA 2015 Draft Science Framework, www.oecd.org/pisa/pisaproducts/Draft%20PISA%202015%20Science%20Framework%20.pdf.
OECD (2010), PISA 2009 Assessment Framework: Key Competencies in Reading, Mathematics and Science, PISA, OECD Publishing, Paris, http://dx.doi.org/10.1787/9789264062658-en
Pierre, G. et al. (2014), STEP Skills Measurement Surveys: Innovative Tools for Assessing Skills, working paper, World Bank Human Development Network, Washington DC.
Ross, K. et al. (2004), “Chapter 2: Methodology for SACMEQ II Study”, IIEP, UNESCO, Paris.
SERCE (2010), Segundo Estudio Regional Comparativo y Explicativo: Compendio de los manuales, S. Block (ed.), A. Atorresi, C. Pardo, D. Glejberman, G. Espinosa, L. Toranzos, M. Rocha, M. Castro, Santiago: UNESCO/OREALC.
SERCE (2009), Segundo Estudio Regional Comparativo y Explicativo: Aportes para la enseñanza de la matemática, L. Bronzina, G. Chemello, M. Agrasar, Santiago: UNESCO/OREALC.
Uwezo (2012), Standards Manual, Uwezo, Nairobi.

CHAPTER 4 – CONTEXTUAL DATA COLLECTION INSTRUMENTS USED IN EDUCATIONAL ASSESSMENTS – 69
A REVIEW OF INTERNATIONAL LARGE-SCALE ASSESSMENTS IN EDUCATION: ASSESSING COMPONENT SKILLS AND COLLECTING CONTEXTUAL DATA © OECD AND THE WORLD BANK 2015
Chapter 4
Contextual data collection instruments used in educational assessments
This chapter looks at the frameworks and instruments for collecting contextual data used by PISA and other large-scale assessments. In the case of each of the reviewed assessments, the chapter outlines the approach used for the following: types of contextual data collection instruments used; mode of delivery; development of contextual data collection instruments; translation, adaptation, verification; main factors and variables used; technical aspects of contextual data collection instruments, such as question formats and scaling and computing of relevant contextual constructs. In each of these areas the implications and lessons for PISA for Development (PISA-D) are identified and discussed.

70 – CHAPTER 4 – CONTEXTUAL DATA COLLECTION INSTRUMENTS USED IN EDUCATIONAL ASSESSMENTS
A REVIEW OF INTERNATIONAL LARGE-SCALE ASSESSMENTS IN EDUCATION: ASSESSING COMPONENT SKILLS AND COLLECTING CONTEXTUAL DATA © OECD AND THE WORLD BANK 2015
Chapter 3 of this report reviewed student assessments used by PISA and other programmes. This chapter will review contextual surveys.
One of the main objectives of PISA is to gain data about individual, pedagogical, institutional and systemic factors to describe and compare the contexts of learning, and to investigate the relationships between these contexts and student performance. PISA offers countries the opportunity to collect contextual information from parents (from 2006) and teachers (starting in 2015). Together with the student and school questionnaires, the parent and teacher questionnaires are part of the core instruments for PISA-D (OECD, 2014a: 23).
The purpose of this chapter is to review contextual data collection instruments, at the level of student, parent, teacher and school, implemented by other international and regional surveys – with a view to observing implications for developing countries and in particular for the PISA-D contextual questionnaires.1 It will also consider the expert paper on context questionnaires by Willms and Tramonte (2014).
This chapter includes the following sections:
• types of contextual data collection instruments used
• mode of delivery
• development of contextual data collection instruments
• translation, adaptation, verification
• main factors and variables, with focus on the seven topics identified as priorities by the participating countries and development partners
• technical aspects of contextual data collection instruments, such as question formats and scaling and computing of relevant contextual constructs.
Types of contextual data collection instruments and mode of delivery
Table D.1 in Annex D gives an overview of the types of contextual data collection instruments used in the international surveys reviewed and their mode of delivery.
PISA uses questionnaires to collect contextual data at the student and school levels. Since PISA 2006, countries can opt to implement a parent questionnaire, and in 2015 an optional teacher questionnaire will be made available to countries. PISA-D intends to implement context questionnaires for students, principals, parents and teachers as core instruments (OECD, 2014a: 23). The mode of delivery envisaged for PISA-D is paper-and-pencil (OECD, 2014a: 37).
The type of contextual data collection tool is largely informed by the survey category (international large-scale, school-based and household-based), which is mainly related to the setting used for the cognitive assessment: group or one-on-one (see Table D.1).
All surveys reviewed collect contextual data. International large-scale surveys use questionnaires for students, teachers and principals. Data from parents are also collected in PIRLS, TIMSS (in 2011) and LLECE. WEI-SPS, which collects contextual data only, uses questionnaires for teachers, principals and curriculum experts. A curriculum questionnaire is also implemented in PIRLS, TIMSS and PASEC.
The school-based surveys EGRA and EGMA, as well as all household-based surveys, are administered in one-on-one settings, allowing the use of interviews for contextual data

CHAPTER 4 – CONTEXTUAL DATA COLLECTION INSTRUMENTS USED IN EDUCATIONAL ASSESSMENTS – 71
A REVIEW OF INTERNATIONAL LARGE-SCALE ASSESSMENTS IN EDUCATION: ASSESSING COMPONENT SKILLS AND COLLECTING CONTEXTUAL DATA © OECD AND THE WORLD BANK 2015
collection. EGRA and EGMA provide optional interviews with students, teachers and principals, as well as classroom observation. Household-based surveys focus on individuals in the household, mainly the participant; except ASER and Uwezo where the head of the household is interviewed. ASER and Uwezo combine interviews with observations made in the school or home environment, collecting information from the local government primary school (interview with head teacher) and the village (ASER uses observation only, while in Uwezo the observation is combined with an interview of the local council chairperson or village chief).
Most of the questionnaires and interviews used for contextual data collection in the surveys reviewed are administered in paper-and-pencil mode, while delivery of questionnaires in PISA will be largely online from 2015 onwards (except for PISA-D and countries using the paper-and-pencil assessment option). Of the other assessments reviewed, only PIRLS and TIMSS offer an online questionnaire option for teachers and parents. PIAAC and STEP are the only household-based surveys that use computer-assisted interviews.
Implications In regard to the questionnaire type, Willms and Tramonte (2014: 20) underline the
importance of discerning the best informant for measuring the relevant constructs. The authors argue that implementing a parent questionnaire would be a useful option to collect data on family issues for PISA-D. The comparison of international surveys shows that parent questionnaires are mainly used in large-scale international surveys with younger student populations (Grade 4 in PIRLS and TIMSS; Grades 3 and 6 in LLECE) as well as in the household-based surveys ASER and Uwezo, where the head of the household is interviewed in a one-on-one setting. In this regard Willms and Tramonte (2014: 20) suggest to consider an interview approach for parents in PISA-D, which would be valuable to assess parent’s literacy skills and employment, similar to the approach of household-based surveys with an international focus (LAMP, STEP, PIAAC).
While Willms and Tramonte have highlighted the importance of discerning the best informant, a major consideration is the cost-benefit ratio of parent questionnaires, given the effort needed to carry them out. This is especially relevant of an interview approach, as securing response rates through one-on-one interviews is a financial burden. This must be weighed against the benefit of such data. Comparisons between student and parent questionnaire responses to family-related questions in PISA have shown that students are a reliable source of information for family-related questions such as parents’ occupation, occupational status, language, parental education and so on.
A teacher questionnaire is carried out in all large-scale international surveys as well as in most EGRA and EGMA administrations, regardless of whether students are sampled from intact classes in schools (PIRLS, TIMSS, LLECE, EGRA, PASEC) or randomly within schools (PISA, SACMEQ, PASEC, EGMA). A teacher questionnaire is used throughout international surveys to assess the following key areas: quality of instruction, school resources, language at home and in school, and learning time.
Willms and Tramonte (2014: 20) support the use of a teacher questionnaire if many of the classroom and school constructs could be better addressed by teachers than by students or principals. For developing countries, a teacher questionnaire has potential benefits, compared to collecting the more aggregated school-level data through the principal questionnaire. For PISA-D, it is worth remembering that the student sample in PISA is not class-based: PISA is seen as an accumulation of the student’s educational

72 – CHAPTER 4 – CONTEXTUAL DATA COLLECTION INSTRUMENTS USED IN EDUCATIONAL ASSESSMENTS
A REVIEW OF INTERNATIONAL LARGE-SCALE ASSESSMENTS IN EDUCATION: ASSESSING COMPONENT SKILLS AND COLLECTING CONTEXTUAL DATA © OECD AND THE WORLD BANK 2015
experience. Drawing conclusions about teacher background and strategies is more difficult for PISA than for a class-based assessment.
Regarding the mode of delivery, electronic means such as tablets are worth considering, as noted in the discussion of test design in Chapter 3 of this report. This option would allow spoken and visual language components to be incorporated for struggling readers. Electronic delivery offers a potentially wider range of options for collecting contextual data, as well as for handling and processing data.
Development of contextual data collection instruments
Table D.2 in Annex D gives an overview of the main bodies involved and the main steps in the process of developing the different contextual data collection instruments, including review options and piloting/field trialling. Translation, adaptation and verification processes, also key elements of the development process, are described separately.
Theoretical conception of contextual data collection instruments Questionnaire development in PISA is based on a context framework. This outlines
the theoretical and scientific background of the questionnaire content to be measured, and of the interactions and relationships between certain factors and student achievement, as well as important non-cognitive learning outcomes. The PISA context framework (OECD, 2013a, n.d.-a) is based on two approaches: i) a model of learning by Carroll (1963); and ii) a policy framework that addresses questions of relevance to participating countries (Willms and Tramonte, 2014: 4).
The factors defined in the framework are structured in a two-dimensional taxonomy of educational outcomes and predictive factors (OECD, 2013a: 175). This taxonomy is based on research in educational effectiveness of input, process and outcome measures at the system, school, classroom and student levels. The basic structure of this taxonomy is derived from the “input-process-outcome model” that was developed in the 1960s for the IEA (Purves, 1987). In PISA this model has been expanded with the different levels on which contextual factors affect student learning (system level, school level, classroom level and student level).
The factors can further be classified as domain-independent or domain-related measures. The domain-independent measures include (Willms and Tramonte, 2014: 3, 4):
• student-level inputs, such as grade, gender, parent occupation and education and migration background
• classroom instructional processes, such as learning time, disciplinary climate and teacher support
• school-level contexts, such as school type, school size, class size, school resources and learning environment, human resources, school location and community size
• school-level processes, such as school climate, teaching practices, assessment and evaluation policies, and professional development
• non-cognitive outcomes, such as truancy, engagement and sense of belonging.

CHAPTER 4 – CONTEXTUAL DATA COLLECTION INSTRUMENTS USED IN EDUCATIONAL ASSESSMENTS – 73
A REVIEW OF INTERNATIONAL LARGE-SCALE ASSESSMENTS IN EDUCATION: ASSESSING COMPONENT SKILLS AND COLLECTING CONTEXTUAL DATA © OECD AND THE WORLD BANK 2015
Domain-related measures include, for example, attitudes towards mathematics, reading or science, motivation and self-concept in mathematics, reading or science, and instructional practices in these subjects, some of which are classified as processes (such as instructional practices) and some as outputs (such as attitudes).
PISA-D aims to extend existing constructs and scales derived from these factors in a way that makes them more relevant for contexts found in economically developing countries. Section 4.3 of this report discusses the main factors relevant for this review.
Theoretical conception of contextual data collection instruments varies across the other assessments reviewed. Most of the international surveys reviewed state a theoretical underpinning of the context factors collected, as well as their relationship of these factors with achievement. This theoretical underpinning combines both educational research questions based on a model of learning and policy questions.
Large-scale international surveys The context frameworks for PISA (OECD, 2013a), WEI-SPS (Zhang, Postlethwaite
and Grisay, 2008) and PIRLS and TIMSS (Hooper, Mullis and Martin, 2013) are highly elaborated. As mentioned above, the primary theoretical conception in OECD and IEA-led studies is based on the input-process-outcome model (Purves, 1987), where input, process and outcome factors are located on student, classroom, school, and system level – representing a two-dimensional taxonomy of educational outcomes and predictive factors.
More specifically, PIRLS and TIMSS classify context factors for national and community contexts, school contexts, classroom contexts, and student characteristics and attitudes. PrePIRLS and TIMSS-Numeracy are consistent with the PIRLS and TIMSS frameworks (and use the same context questionnaires).
In WEI-SPS, the principal indicators are organised into: contexts (the environments in which individual schools operate); inputs (material and human resources available to schools); and processes (indicators/processes outlined at both the school and classroom levels) (UIS, 2009a). The context frameworks for PISA, PIRLS and TIMSS and WEI-SPS (embedded in the UIS (2009) technical report) are publicly available.
The large-scale international surveys SAQMEC, PASEC and LLECE use analytical models to describe the context factors collected and the expected relationships with achievement. Similarly the analytical models consider different levels: student and family, classroom, school, and system/national/community level. These models are usually described in technical or results reports or technical documentations (CONFEMEN, 2012; Dolata, 2005; LLECE, 2009).
In SACMEQ, the context questionnaires use a general two-level model, which is based on existing literature on student learning, especially Carroll’s model of school learning (Carroll, 1963) and Creemers’ model of effective classrooms (Creemers, 1994; Hungi, 2011a: 5). The model was hypothesised for factors influencing student achievement in reading and mathematics, with students located on level one and schools on level two (students within schools) (Hungi, 2011a). Three categories of variables were hypothesised to directly influence achievement at the student level: individual characteristics, personalised learning support and home environment. Four categories of variables were hypothesised to directly influence achievement at the school level: teacher characteristics, classroom environment, school head characteristics and school environment (Hungi, 2011a, 2011b).

74 – CHAPTER 4 – CONTEXTUAL DATA COLLECTION INSTRUMENTS USED IN EDUCATIONAL ASSESSMENTS
A REVIEW OF INTERNATIONAL LARGE-SCALE ASSESSMENTS IN EDUCATION: ASSESSING COMPONENT SKILLS AND COLLECTING CONTEXTUAL DATA © OECD AND THE WORLD BANK 2015
PASEC reports educational indicators at three levels: the socio-economic background of students, teaching conditions and policy guidelines. These indicators are matched with students’ competencies (CONFEMEN, 2013). The analysis scheme involves individual and familial student background characteristics as well as early learning opportunities as antecedents (see, for example, the national report for Chad (CONFEMEN, 2012: 88). In addition to these, the following factors are expected to affect student achievement: personal schooling conditions (for example, owning school books), profile of the school principal, school characteristics (such as electricity, rural or urban location), profile of the teacher (such as qualifications, years of teaching experience, gender), class characteristics (such as class size) and pedagogical organisation (such as multi-grade, double shifts).
Questionnaire development in LLECE broadly emphasises factors associated with student achievement that can be directly affected by education systems. The macro conceptualisation is guided by five strategic aims of the Regional Education Project for Latin America and the Caribbean (PRELAC), an association of education ministries, in order to support progress towards Education for All (LLECE, 2009: 35). Three principal theoretical domains are covered by the questionnaires: socio-cultural characteristics, educational opportunities, and academic achievement. The questionnaires also cover the transversal domain of educational equity (LLECE, 2009). SERCE questionnaire development also considered findings from SACMEQ, PISA and TIMSS for important context factors that are expected to affect achievement.
School-based surveys Contextual data collection instruments in EGRA and EGMA are developed by RTI
and are based on the Snapshot of School Management Effectiveness instrument (SSME) (Crouch, 2009). The SSME instrument is in turn based on reviewed literature (Lockheed and Verspoor, Henneveld, Schiefelbein and Wolff, Moura Castro – Crouch, 2008). SSME comprises five major domains: i) pedagogical leadership and management; ii) class and classroom management; iii) school management; iv) parent and community involvement in the school; and v) district and system-level support and supervision. The factors are located at student/family, teacher/classroom, school and community level. Implementation of the SSME contextual instruments is optional for each EGRA/EGMA implementation, and in some instances countries do no implement any questionnaires from SSME at all.
Household-based surveys The household-based adult literacy and skills studies PIAAC, STEP and LAMP focus
on factors related to adult literacy as well as work-related skill acquisition and use.
Contextual data collection in PIAAC is based on three main policy questions that are further theoretically underpinned: i) how skills are distributed; ii) why skills are important; and iii) what factors are related to skill acquisition and decline. PIAAC collects a range of information on the factors which influence the development and maintenance of key skills, such as education and training, current status and work history, current work and last job (for those currently employed or self-employed, who have worked in the last five years), social background, language, engagement with literacy, numeracy and information and communication technologies (OECD, n.d.-b) (Allen et al., 2013: 42). Additionally the background questionnaire includes a module called the “job requirements approach”. This module collects a range of information on the reading and numeracy-related activities and technology use of respondents at work and in everyday
CHAPTER 4 – CONTEXTUAL DATA COLLECTION INSTRUMENTS USED IN EDUCATIONAL ASSESSMENTS – 75
A REVIEW OF INTERNATIONAL LARGE-SCALE ASSESSMENTS IN EDUCATION: ASSESSING COMPONENT SKILLS AND COLLECTING CONTEXTUAL DATA © OECD AND THE WORLD BANK 2015
life, and on the generic skills required of individuals in their work. Respondents are also asked whether their skills and qualifications match their work requirements and whether they have autonomy over key aspects of their work (OECD, 2013b: 40).
STEP aims to provide data about skill stocks and job demands in low- and middle-income country contexts and focuses on work-related skill acquisition, use, and distribution. STEP uses “a multidimensional concept of skills that goes beyond educational attainment to capture human capital more comprehensively” (Pierre et al., 2014: 7). The STEP survey consists of a household survey and an employer survey. Both contain detailed measures of required education and experience and of the required skills in reading, writing, math, problem-solving, interpersonal and socio-emotional traits, technology use, and manual work required by jobs (Pierre et al., 2014: 2, 9). The household survey contains seven modules of contextual data collection instruments. Module 1 comprises a household roster and dwelling characteristics, and aims at getting a full picture of the household and its members that could influence the outcome of interest (such as obtaining a job) for the individual who will later respond to the full questionnaire. The section about dwelling characteristics includes household assets, from which an asset index is constructed to be used as a proxy for wealth (Pierre et al., 2014: 14). Modules 2 to 7 are part of the individual questionnaire and collect data on education and training, health, employment, self-reported cognitive skills and job-relevant skills, personality, behaviour and preferences, and language and family background. A detailed description of the questions module-by-module is available in Pierre et al. (2014).
Contextual data collection in LAMP focuses on more general factors influencing adult literacy skills. To direct the contextual data collection, research questions cover five major areas that are of interest to policymakers: population distribution of literacy skills, antecedents of literacy skills, relationship of literacy skills to social environment, relationship of literacy to other proxy variables and monitoring trends in literacy skills (UIS, 2006). The background factors are structured into classification variables (used to identify subpopulations), relationship variables (such as expected relationship with literary levels, skills acquisition, enhancement and maintenance) and profiling variables (to statistically profile groups with particular levels of skills acquisition) (UIS, 2006).
For ASER, it is reported that household indicators are recorded “in order to link education status of the child with the household’s economic conditions” (ASER Centre, 2014: 21). Moreover, ASER implements the Right to Education indicators; the “4A-framework” of Right to Education is closely linked to international human rights law and covers availability, accessibility, acceptability and adaptability (ASER Centre, n.d.). In any discussion about ASER tools, it is important to keep the basic objective of the exercise in mind. ASER is primarily an attempt by citizens to understand the status of schooling and basic learning of the children in their district. The tools are aligned to achieving this objective. The biggest challenge in ASER is to make the tool as simple as possible without sacrificing rigour (Banerji and Bobde, 2013).
For Uwezo, no documentation is publicly available of the theoretical background for contextual data collection and expected relationships with achievement.
Development process and main bodies involved
Development process Most large-scale international surveys follow a very similar questionnaire
development process as PISA. In most cases policy priorities and/or research questions
76 – CHAPTER 4 – CONTEXTUAL DATA COLLECTION INSTRUMENTS USED IN EDUCATIONAL ASSESSMENTS
A REVIEW OF INTERNATIONAL LARGE-SCALE ASSESSMENTS IN EDUCATION: ASSESSING COMPONENT SKILLS AND COLLECTING CONTEXTUAL DATA © OECD AND THE WORLD BANK 2015
are defined, then further outlined in a “context framework” that provides theoretical underpinning of the context variables and factors implemented in the survey, as well as their relation to achievement. This is the process used by PISA, PIRLS, TIMSS, WEI-SPS and PIAAC. Alternatively, SAQMEC and LLECE construct analytical models to describe the relationships of contextual factors surveyed and achievement. PASEC’s models are not explanatory but rather descriptive.
New items are developed based on these priorities and research questions. Generally throughout the surveys, the contextual data collection instruments are updated from one cycle to the next, to include topics of high (policy) relevance. In large-scale international surveys such as PISA, TIMSS and PIRLS, this is a balancing act between maintaining consistency with former measurements to report on trends and considering recent developments and current policy priorities. Sometimes where a large amount of new and additional material would considerably increase the response burden for participants, existing questionnaire items are retired to make way for the new; thus, not increasing the total amount of material. This has happened in PIRLS and TIMSS (Mullis et al., 2012a: 3).
The development of contextual questionnaires follows a typical sequence. First, developers revise existing material, such as frameworks, analytical conceptions and items. New material is created, through consortia, expert groups and policy input. This is followed by a review phase, through governing authorities, donors, participating countries and national experts. Revisions are made, through consortia and expert groups. Field trialling and data analysis take place, with ensuing revisions and reviews. All this input is reflected in the final decisions about questionnaire design and item selection for the main survey. Review activities ensure appropriate coverage of the topics specified in the contextual frameworks and analytical conceptions, the analytic potential of the items and reporting scales, the clarity of the items, and suitability of the items in the respective national context. These processes are similar for all international large-scale surveys as well as the household-based surveys PIAAC, STEP and LAMP.
A key element of the contextual data collection instrument development process is piloting or field trialling of (new) items, questionnaire designs and administration procedures. A pilot is considered as a pre-study to a field trial, with a smaller sample and often with a focus on specific research questions – as opposed to a field trial, which usually is to test the whole assessment, including instruments and item functioning, as well as procedures.
Piloting or field trialling of contextual instruments is a main part of all large-scale international surveys as well as the household-based surveys PIAAC, STEP and LAMP.
In EGRA and EGMA two pilots were conducted to validate the Snapshot of School Management Effectiveness instrument developed by RTI (Crouch, 2009). The report for an EGRA and EGMA implementation from Morocco in 2011 states:
Each instrument was pretested in eight schools within the region of Doukkala Abda. (These schools were not included in the sample used for final assessment.) The SSME instrument was then reviewed in light of the pretesting experience, any phrasing of questions that led to misunderstandings was clarified, and problematic questions were removed or modified. (Messaoud-Galusi et al., 2012: 27)

CHAPTER 4 – CONTEXTUAL DATA COLLECTION INSTRUMENTS USED IN EDUCATIONAL ASSESSMENTS – 77
A REVIEW OF INTERNATIONAL LARGE-SCALE ASSESSMENTS IN EDUCATION: ASSESSING COMPONENT SKILLS AND COLLECTING CONTEXTUAL DATA © OECD AND THE WORLD BANK 2015
For ASER, a small pilot during test administrator training is conducted, but no information is available about revisions of contextual data collection instruments resulting from this pilot.
For Uwezo, the regional office undertakes tool development and then the national offices review the tools to ensure the items’ relevance. For example, the annual plan and budget document for 2013 for Uganda refers to a survey tools review meeting during which country-specific adaptations to the tools were to be reviewed and adopted (Uwezo, 2013: 28). The Uwezo survey tools are involved in piloting activities in all three countries. An inspection of the pilot report for 2013 for Uganda shows, for example, questions that were frequently incorrectly coded by test administrators; such as where administrators ticked an open question instead of writing a number.
Main bodies involved The review of international surveys found that for all of them, various bodies are
involved in questionnaire development (see Table D.2 in Annex D). The extent to which the different bodies have an influence on the development – and during which phases (especially during the theoretical and/or analytical conception) – could not be determined during the review of international surveys.
Involvement at a policy level similar to the PGB, or stakeholder level, is explicitly reported for PIAAC (Board of Participating Countries), SACMEQ (country ministers of education), PASEC (CONFEMEN), LLECE (supporting the aims of PRELAC, an association of education ministries in Latin American and the Caribbean) and WEI-SPS (stakeholders, project steering committee). For STEP and LAMP, the World Bank/UNESCO Institute for Statistics (UIS) define overall priorities and participating countries may contribute specific priorities. Contextual instrument development in PIRLS and TIMSS as well as EGRA and EGMA is primarily based on research (learning theories and models). In the case of PIRLS and TIMSS, “policy interests” are integrated through national research co-ordinators as the main reference source for framework development; similar to EGRA/EGMA, where specific interests of RTI and donors such as the United States Agency for International Development (USAID) and the World Bank (in the case of EGRA) may have an influence. For ASER and Uwezo there is little documentation of the bodies involved in contextual data collection instrument development. Broadly the content seems to be based on common assumptions about relationships between specific contextual variables and achievement. Specific interests of the assessment centres and/or donors may play a role in the development of contextual data collection.
There is a questionnaire expert group, similar to PISA’s, for PIRLS and TIMSS, SACMEQ, LLECE (for TERCE, labelled a high-level technical advisory board), WEI-SPS (OECD-led), EGRA and EGMA, PIAAC (OECD-led) and STEP.
On the operational level, participating countries are involved generally through the national centres responsible for the implementation of the survey in the country (such as through national project managers in PISA, national research co-ordinators in PIRLS and TIMSS, country co-ordinators in LLECE) and national experts. Similar to PISA, these country representatives review the questionnaires and give feedback on specific content and its fit with the context of the national education system.
78 – CHAPTER 4 – CONTEXTUAL DATA COLLECTION INSTRUMENTS USED IN EDUCATIONAL ASSESSMENTS
A REVIEW OF INTERNATIONAL LARGE-SCALE ASSESSMENTS IN EDUCATION: ASSESSING COMPONENT SKILLS AND COLLECTING CONTEXTUAL DATA © OECD AND THE WORLD BANK 2015
Implications Building on more than 15 years of experience with framework and questionnaire
development, the processes and theoretical concepts applied in PISA are highly elaborate. In regard to options for PISA-D, the main consideration is to underline the importance of involving participating countries at the policy level, research level, as well as the operational level. On the policy level, country representatives (including government, non-government and donor representatives) need to be involved in order to ensure that relevant national education policy issues are identified and covered in the data collection. In addition to that, national education experts (researchers, teacher trainers, school principals and teachers) need to be involved in order to identify questions of particular education research interest. The comparison of contextual frameworks shows that policy interests and research interests complement each other and need to be considered when conceptualising background contextual questionnaire development.
Education experts and national project managers also need to be involved in reviewing and adapting the questionnaire constructs to make them meaningful for the country context. This is of particular importance for the seven priorities identified for the context questionnaires (Willms and Tramonte, 2014), and specifically for measures of socio-economic status and school resources (see section 4.3).
With respect to extending existing questionnaire scales and introducing new constructs that are of relevance to developing countries, PISA-D needs to find a good balance between “core” and “new” content, in order to not increase response time and thereby the response burden on participants.
It is also important to provide options and assistance to PISA-D countries to cover topics that are of particular national interest – and that would otherwise not be considered in the international PISA questionnaire – in national questionnaires or other national context data collection instruments.
Field trialling of context questionnaires is a standard procedure for any PISA administration. A field trial will be essential to PISA-D to allow for improvements as necessary to new questionnaire constructs, extended scales and implementation procedures.
Translating, adapting and verifying contextual data collection instruments
In the literature reviewed for the international surveys, the process of translation and adaptation is mainly described for the cognitive instruments and these processes of translation, adaptation and verification apply as well for the contextual data collection instruments. The process is therefore only briefly described in this section.
Table D.3 in Annex D gives an overview about the source version and translated languages for the contextual data collection instruments, and the translation, adaptation and verification procedures applied in the different surveys.
Languages Usually the language of assessment is used for the contextual data collection
instruments. In the surveys reviewed, most of the contextual questionnaires are developed in English. Surveys with the most diverse and the greatest number of languages are PIRLS and TIMSS (58 languages; with 11 languages alone in South Africa), PISA

CHAPTER 4 – CONTEXTUAL DATA COLLECTION INSTRUMENTS USED IN EDUCATIONAL ASSESSMENTS – 79
A REVIEW OF INTERNATIONAL LARGE-SCALE ASSESSMENTS IN EDUCATION: ASSESSING COMPONENT SKILLS AND COLLECTING CONTEXTUAL DATA © OECD AND THE WORLD BANK 2015
(46 languages including right-to-left and top-to-bottom script), and PIAAC (about 30 languages). LAMP, STEP and WEI-SPS also cover a broad range of languages.
Specific information was available for WEI-SPS on the language of contextual data collection instruments. In countries where one language is primarily used in the education system, surveys were translated into that language only. In countries where more than one language of instruction is used in primary grades, either throughout a country or even within a school, the questionnaire needed to be delivered in a language in which the school principals and teachers would be proficient (that is, the language used in teacher training) – which does not necessarily match the language in which the students are taught. For multilingual countries, surveys were therefore translated into the national language, and into languages in which teachers and principals were expected to be proficient (UIS, 2009).
In PIRLS and TIMSS it is reported that in some countries where the language of instruction differs from the language used at home, countries translate the parents’ questionnaire into one or more additional languages (the languages most commonly spoken in the home), to allow parents to fill out the questionnaire in the language they feel most comfortable using (Yu and Ebbs, 2012: 4). In PIRLS/prePIRLS in South Africa, the teacher and the principal questionnaires were administered in Afrikaans or English only (not in all 11 official languages), based on the assumption that most teachers and school principals would have been able to speak, write and understand these languages, as required by their teacher training qualifications (Howie et al., 2012: 24).
Language (language of instruction and language spoken at home) as an important context factor is discussed in more detail in section 4.4.2.
Translating, adapting and verifying Generally among the surveys a source version is provided for translation. Often this is
in English, but not always: French in PASEC; Spanish in LLECE; English and French in PISA; English, French and Spanish in LAMP. In PISA a double independent translation (either from the English and French source version or from the English source version), followed by a third independent reconciliation, is used. This procedure is also used in PASEC and SACMEQ (reconciliation can be carried out by the two translators or a third person), WEI-SPS, PIAAC and STEP. PIRLS and TIMSS use a similar regulation, indicating that the translation is considered correct if more than one translator is used. LLECE uses a three-step translation of Spanish into Portuguese, then the Portuguese version is back-translated into Spanish, and is then compared and validated.
Guidelines for translation usually include rules for adaptations and verification. Standardised procedures are provided in most of the international large-scale surveys as well as the household-based surveys that aim for international comparison (PIAAC, STEP and LAMP). In EGRA/EGMA, ASER and Uwezo the countries are responsible for translating, adapting and verifying local versions, and only little information is available about the procedures.
Most surveys acknowledge the importance of national adaptations for questionnaires to match national contexts, as described for example in LAMP: “The adaptation of the background questionnaire is of utmost importance as it will provide key elements for analysis and, therefore, for accomplishing the goals set at the national level” (UIS, 2009b: 37).
80 – CHAPTER 4 – CONTEXTUAL DATA COLLECTION INSTRUMENTS USED IN EDUCATIONAL ASSESSMENTS
A REVIEW OF INTERNATIONAL LARGE-SCALE ASSESSMENTS IN EDUCATION: ASSESSING COMPONENT SKILLS AND COLLECTING CONTEXTUAL DATA © OECD AND THE WORLD BANK 2015
Usually any adaptations need to be documented and approved by the responsible authority. Adaptation can be highly complex, as noted for PIRLS:
Adapting the questionnaires to specific educational contexts is quite complex, particularly for countries that administer the survey in multiple languages or at a different grade than the internationally defined target grade ... Verifiers received detailed instructions and information on each country’s participation configuration to ensure appropriate review and relevant feedback on the national materials. (Yu and Ebbs, 2012: 2)
This shows how important it is to establish clear guidelines for adaptations and a thorough verification process.
No other specific translation or adaptation issues that would be of particular relevance for contextual data collection instruments in PISA-D were reported or identified during the literature review. Some of the documents reviewed contained general information about country adaptations to questionnaires, which are comparable to those made during the common PISA translation and adaptation process (see, for example, Foy, Arora and Stanco, 2013; UIS, 2009a: 129-153).
With respect to national adaptations, options for including specific national questions play an important role. National questions can help deepen specific areas of interest that would otherwise – in an international context – not be included. Surveys that explicitly encourage countries to include national options in the contextual data collection instruments are PISA, PIRLS, TIMSS and LAMP. The number of questions of national interest to the questionnaires however is limited, to not put an additional burden on the respondents (especially students). EGRA/EGMA, ASER and Uwezo also allow for adding questions of national interest.
Implications For multilingual countries, it is important to consider which languages are the most
appropriate for the different groups of respondents. Questionnaires are preferably translated into languages in which students, teachers, principals and parents are expected to be proficient; these languages do not always match with the defined “language of assessment”. Identifying the appropriate language can be a challenge, especially in multilingual countries, where the language of instruction differs from the language most commonly spoken at home. We suggest collaborating closely with national centres of PISA-D countries to carefully assess the language situation for the different groups of respondents and to determine the most appropriate languages for each group. One example is PIRLS and TIMSS, where the parent questionnaires are translated into the languages most commonly spoken in the home.
In relation to translation, standardised guidelines and procedures play a crucial role for ensuring high quality of translations and hence comparability across languages. PISA has established high standards for translation, adaptation and verification and is constantly improving these processes. In PISA 2012, instruments were translated into 46 languages (for 98 national versions) including right-to-left scripts (Arabic) and top-to bottom scripts (Chinese traditional and simplified script). This testifies to the wide range of translation experience that has already been gained in PISA.
In order to best accommodate national contexts, national adaptations are of particular importance to contextual data collection instruments. Procedures that ensure international comparability of adapted content are a key element of the translation process. PISA has

CHAPTER 4 – CONTEXTUAL DATA COLLECTION INSTRUMENTS USED IN EDUCATIONAL ASSESSMENTS – 81
A REVIEW OF INTERNATIONAL LARGE-SCALE ASSESSMENTS IN EDUCATION: ASSESSING COMPONENT SKILLS AND COLLECTING CONTEXTUAL DATA © OECD AND THE WORLD BANK 2015
highly developed and well established procedures to achieve this. Key elements of the adaptation and verification process that are typical for large-scale international surveys are:
• highlighting content that requires adaptation in the draft versions of the questionnaires
• accurately documenting adaptations
• verifying that national adaptations are appropriate
• verifying the quality of the translation in regard to mistranslations, undocumented deviations, and linguistic equivalence to the source versions.
In addition to verification procedures, field trial analyses (such as frequency reports and scale functioning within and across a country) help to detect translation and adaptation issues early, and to revise items and scales for the administration in the main survey.
The review of international surveys shows clearly that the translation, adaptation and verification procedures applied in PISA comply with very high standards.
In order to best accommodate national interests, it is important to facilitate national options – allowing countries to include specific questions concerning policy priorities and other topics that are of particular importance to a country, and that would otherwise – in the international context – not be covered.
Main factors and variables for PISA-D
The PISA context framework defines and explains the content to be measured with the PISA context questionnaires (see, for example, OECD, 2013a). In order to make PISA more relevant for contexts found in developing countries, Willms and Tramonte (2014) identified seven key topics in which the PISA context questionnaires should be enhanced for PISA-D. These seven topics are based on the two approaches of the PISA context questionnaire framework (model of learning by Carroll (1963), policy framework; see section 3.1.1) as well as on consultations with the participating PISA-D countries:
1. early learning opportunities – details such as whether students attended an early years learning or care programme or repeated a grade during their early years
2. language at home and school – information on students’ familiarity with the language of the test
3. family and community support – measures of parental involvement, social capital and cultural capital; measures that focus directly on the role and involvement of other community members in the school, including in relation to school safety and security, and descriptive variables regarding types of community
4. quality of instruction – extent to which class time is spent in independent activities, such as working in workbooks, versus small group activity and whole-class teacher-centred instruction
5. learning time – students’ learning time in and out of school; school attendance and students’ participation in the labour market

82 – CHAPTER 4 – CONTEXTUAL DATA COLLECTION INSTRUMENTS USED IN EDUCATIONAL ASSESSMENTS
A REVIEW OF INTERNATIONAL LARGE-SCALE ASSESSMENTS IN EDUCATION: ASSESSING COMPONENT SKILLS AND COLLECTING CONTEXTUAL DATA © OECD AND THE WORLD BANK 2015
6. student socio-economic status – extending the current indicators of the PISA index of economic, social and cultural status to include more items at the lower end of the socio-economic scale; ‘poverty-related’ measures
7. school resources – quality of school environment, school infrastructure, student and staff safety.
These seven key topics have been included in the terms of reference of the PISA-D call for tender (OECD, 2014a) for context questionnaires. The themes were also discussed during the PISA-D technical workshop in Washington in April 2014, and participating countries and partners agreed on suggestions for enhancement and modification (OECD, 2014a: 52).
The following comparison of main factors and variables in international surveys focuses on these seven key areas. This comparison does not discuss other core factors and variables that have been included in PISA and that are not likely to require much modification for PISA-D (such as student demographics including age, gender, and migration background) (Willms and Tramonte, 2014).
Table D.4, Table D.5, Table D.6 and Table D.7 in Annex D give an overview of the factors used in international surveys relevant to PISA-D and discussed in this section. The sources used to identify the main factors for each survey (questionnaire frameworks, technical and other reports, specific context questionnaires) are stated in the respective tables’ footnotes. The detailed references are listed in the references at the end of each chapter and annex of the report. All questionnaire material used – as well as specific items referred to – are publicly available, and therefore no example items have been added to the annex.
Early learning opportunities Students’ performance captured in PISA represents the cumulative result of children’s
learning experiences in school and outside of school, in the family and community. Gathering information about the early learning opportunities of students is important for PISA-D in order to obtain a broad picture how this may have informed teenagers’ learning experiences. Wills and Tramonte (2014: 5, 8) argue that children’s early learning experiences differ substantially within the partner countries and compared to OECD countries, and are likely to play a more dominant role in economically developing countries than in OECD member countries, especially in rural areas.
Information about students’ early learning experiences is collected in PISA through student and parent questionnaires.
PISA collects information about students’ attendance during early education, age at the beginning of primary education, and grade repetition during primary and lower and upper secondary education. The latter is also captured in the parent questionnaire.
Most other large-scale international surveys also collect data on early learning. (The exception is WEI-SPS, which only collects data from teachers and schools.) PIRLS and TIMSS collect data on early learning from parents; SACMEQ from students; PASEC from students; and LLECE from students and parents. EGRA and EGMA collect information from students; ASER and Uwezo from heads of households; and STEP from respondents in the target population only.
An interesting supplement for PISA-D would be the PIRLS and TIMSS home questionnaire, the Learning to Read Survey. This survey is directed to parents and

CHAPTER 4 – CONTEXTUAL DATA COLLECTION INSTRUMENTS USED IN EDUCATIONAL ASSESSMENTS – 83
A REVIEW OF INTERNATIONAL LARGE-SCALE ASSESSMENTS IN EDUCATION: ASSESSING COMPONENT SKILLS AND COLLECTING CONTEXTUAL DATA © OECD AND THE WORLD BANK 2015
includes information about reading activities before primary school, early literacy and numeracy activities, as well as reading and quantitative readiness at the beginning of primary school (Martin, Mullis and Foy, 2013: 67, 68).
LLECE also asks about early reading, and how often someone at home reads aloud to the child. The respective questions are administered to students in Grades 3 and 6 as well as to parents.
ASER and Uwezo collect information about the pre-school status (for children under five) and school status of the child in the interview with the head of household. Of particular interest to PISA-D may be the inclusion of questions about “out-of-school-status”. This refers to children aged 5 to 16 who are currently not enrolled. Data is collected about whether the child was never enrolled or dropped out; and if the latter, that schooling status when the child left the school, and the year they dropped out.
Language at home and school Language at home and school is an important indicator in regard to equality. In
several economically developing countries students are taught in a different language than their first language. Also, in some countries, the language of instruction changes between different levels of education (such as between third and fourth Grade) (Willms and Tramonte, 2014: 8).
All international surveys reviewed include questions about language.
In the PISA student questionnaire, the language spoken at home is one of the core variables. Additional questions about language were included in the educational career questionnaire in PISA 2012, and in the school questionnaire in PISA 2009. These questions related to students in the national modal grade, which is the year level attended by most 15-year-olds in a country. These questions collected data on the proportion of students in the national modal grade that had a first language other than the test language; and options for students in the national modal grade whose first language was not the test language. The main aim of these questions was to gain more detailed information about students whose first language differs from the language of assessment (which for PISA is the language of instruction).
PIRLS and TIMSS ask the students about the frequency of speaking the test language at home. In addition, the parent questionnaire asks about the language most often used at home, and the language spoken by the child before starting school. Of note is that PIRLS and TIMSS ask if the books at home are mainly in the test language. (PISA collects data about students’ books at home as an indicator for socio-economic status.)
On classroom level, PIRLS and TIMSS ask the teacher about the number of students that have difficulties in understanding the test language as it is spoken. At the school level, PIRLS and TIMSS collect data about the proportion of students for whom the test language is their native language, and provisions for reading instructions in their mother tongue for students with a different mother tongue to the language of the test.
PIAAC asks about the language most often used at home, and any second language learned.
STEP and LAMP provide a full picture of the languages that dominate in the household. These language questions focus on the languages that respondents speak, read and write to a level that would enable them to use the language in a job. Questions are about mother tongue (the first language the person learned), the language that is mainly

84 – CHAPTER 4 – CONTEXTUAL DATA COLLECTION INSTRUMENTS USED IN EDUCATIONAL ASSESSMENTS
A REVIEW OF INTERNATIONAL LARGE-SCALE ASSESSMENTS IN EDUCATION: ASSESSING COMPONENT SKILLS AND COLLECTING CONTEXTUAL DATA © OECD AND THE WORLD BANK 2015
spoken in the house, the total number of people in the household that speak any of the official country languages (speaking does not necessarily include reading or writing), languages in which the respondents speak, and in which they read and write well enough to work in a job that requires that language (Pierre et al., 2014: 33, 34).
Other assessments focus more on language use at school. PASEC asks about the languages spoken by the teacher. Similarly, EGRA and EGMA ask about the native language of the teacher. LLECE collects data on whether the language of instruction is used for partial or all of instruction; and about indigenous language services and resources. WEI-SPS asks about the official time used for teaching the language of instruction. Uwezo includes questions about the number of textbooks provided for language instruction in English and Kiswahili.
Socio-economic status Measures of SES are included in every survey. Various assessments use a range of
factors and variables, frequently including education and occupation, to construct SES-and poverty-related measures. The derived constructs and scales to measure SES and/or poverty are described in more detail in section 4.6.
Socio-economic measures in PISA include factors such as parental education, occupation, employment status, home possessions and home educational resources, including books at home. These factors are captured on the student level. In the parent questionnaire, parents are asked about their education, occupation, the annual household income and parents’ educational expectations for their child.
Similar factors are used in PIRLS and TIMSS (focusing on the parent questionnaire for Grade 4 students). On the school level, PIRLS and TIMSS include a question about the SES of the school’s immediate area (high, medium or low).
Specific indicators relevant to children living in poverty are included in SACMEQ, PASEC, LLECE, EGRA and EGMA, ASER and Uwezo.
The SACMEQ student-level data collection includes questions about number of siblings, number of meals per week, household tasks, learning culture at home, if the parents are alive, if the child is living with parents or relatives, and about the home environment.
In PASEC, students are asked about their standard of living (poor, intermediate, rich) and if mother and father are literate (able to read and write).
LLECE includes questions about parental education, such as whether the student’s mother and father can read and write. Measures of home utilities include availability of electricity, water and sewage services; the construction materials of the home; and the availability of a phone and cable or Internet.
EGRA and EGMA, ASER and Uwezo all use similar variables for home possessions/facilities. Additionally, EGRA and EGMA include questions about the type of toilets, method for cooking, and water source for washing. ASER includes questions about parental education, asking about school attendance and status of completed education, and also asks about the availability of reading material and if anyone in the household knows how to use a computer. Uwezo additionally captures the main source of household income; if lighting is available in the house; the number of meals per day; about possessions such as a radio, TV, computer or mobile phone; about livestock such as
CHAPTER 4 – CONTEXTUAL DATA COLLECTION INSTRUMENTS USED IN EDUCATIONAL ASSESSMENTS – 85
A REVIEW OF INTERNATIONAL LARGE-SCALE ASSESSMENTS IN EDUCATION: ASSESSING COMPONENT SKILLS AND COLLECTING CONTEXTUAL DATA © OECD AND THE WORLD BANK 2015
cattle, donkeys, camels, sheep or goats; and about transport such as a bicycle, motorbike or cart.
Indicators for socio-economic status in household-based surveys focusing on the adult population (PIAAC, STEP and LAMP) are mainly based on household characteristics and facilities such as quality of housing, equipment available in the household, a common set of assets, and land and livestock ownership. In STEP, a particular asset index (Pierre, et al., 2014: 15) is used as a proxy for wealth. In LAMP, information about household facility and living environment is used to create measures of SES, which are then classified into four socio-economic groups: affluent or well-off, comfortable, poor, or subsistence level.
PIAAC, STEP and LAMP obtain basic information about employment, such as the labour force status (employed, unemployed, or inactive; including self-employed – with and without pay; underemployed, or holding low-productivity jobs). For those who work, STEP inquires in detail about their occupation, earning, hours worked, and so on. Pierre et al. (2014: 22) indicate that a large proportion of the labour force in developing countries is self-employed, underemployed or holding low-productivity jobs. For the self-employed (with and without paid work), the survey therefore asks a series of specific questions that help determine the overall success of their businesses and to find out the extent to which such work is voluntary (such as by asking about the preference for wage jobs versus self-employment). Questions related to education and training in STEP are aimed at obtaining a full picture of the acquisition of skills throughout the respondent’s lifetime. The module does this by asking questions related to formal education, lifelong learning, and other types of training and certificates (Pierre, et al., 2014: 16).
UNESCO’s International Standard Classification of Education (ISCED) is used to classify education in PISA, PIRLS and TIMSS, WEI-SPS, PIAAC, LAMP and STEP.
The International Standard Classification of Occupations (ISCO) is used to classify occupation in PISA and PIAAC (ISCO 2008), PIRLS, TIMSS, LAMP and STEP.
Quality of instruction Quality of instruction is important to PISA-D as it varies widely from OECD and
partner countries, especially in rural schools (Willms and Tramonte, 2014: 8). Measurements of classroom context and quality of instruction in PISA are mainly related to time spent on activities in connection with “direct instruction” and cognitive activation (Klieme et al. 2009, in Willms and Tramonte, 2014: 11). Wills and Tramonte (2014: 11) assume that for the context of PISA-D, measuring more basic instructional activities may be useful.
Measures for quality of instruction are included in all large-scale international surveys, in EGRA and EGMA, and in ASER. These measures can be categorised as general aspects and domain-related aspects of quality of instruction.
From the surveys reviewed, a number of general aspects of the quality of education are considered relevant for the context of PISA-D:
• The PASEC teacher questionnaire asks about pedagogical practices. PIRLS and TIMSS teacher questionnaires cover instructions to engage students in learning. WEI-SPS asks teachers about active learning. EGRA and EGMA ask students how teachers respond to correct and incorrect responses.

86 – CHAPTER 4 – CONTEXTUAL DATA COLLECTION INSTRUMENTS USED IN EDUCATIONAL ASSESSMENTS
A REVIEW OF INTERNATIONAL LARGE-SCALE ASSESSMENTS IN EDUCATION: ASSESSING COMPONENT SKILLS AND COLLECTING CONTEXTUAL DATA © OECD AND THE WORLD BANK 2015
• PIRLS and TIMSS ask teachers about teaching limitations, including students’ nutrition and if they get enough sleep.
• PIRLS and TIMSS ask teachers and principals about the emphasis on academic success, while WEI-SPS asks teachers about school goals and achievement expectations. EGRA and EGMA ask teachers and principals about their expectations of learning levels.
• Assessing and monitoring learning progress, school reports and frequency of tests are addressed in the SACMEQ teacher data collection. Other surveys cover types of formative assessment (LLECE teacher and principal levels); student assessment at classroom level (WEI-SPS teacher level); and monitoring each child’s progress (EGRA and EGMA teacher and principal levels).
• Questions about classroom organisation and management, grouping of students and multi-grade instruction are included in PIRLS, TIMSS, PASEC, LLECE and WEI-SPS teacher instruments. The SAQMEC student instrument and the WEI-SPS teacher instrument also ask about personalised learning support and internal differentiation.
• A number of surveys include questions about homework (SACMEQ student, LLECE teacher and principal, EGRA/EGMA student).
• PIRLS and TIMSS ask principals about the evaluation of teacher practice. EGRA and EGMA ask teachers and principals specifically about supervision and classroom visits. WEI-SPS asks principals about professional development.
From the surveys reviewed, a number of domain-related aspects of the quality of education are considered relevant for the context of PISA-D:
• PIRLS and TIMSS ask teachers about reading instruction strategies, assessment practices for reading, use of different reading material, teacher support to develop reading comprehension skills, dealing with reading difficulties, remedial instruction and options for advanced readers, and reading homework. The school-level instruments ask about the emphasis on reading and literacy skills.
• WEI-SPS includes questions about active teaching in reading and mathematics.
• SAQMEQ asks teachers about training for specific subjects and about subject-matter knowledge.
Learning time Learning time is an important indicator in regard to schooling in developing
countries, not only in regard to enrolment, but also in relation to attendance and absence, child labour and class time devoted to the language of instruction, mathematics and science (Willms and Tramonte, 2014: 8, 9). Learning time needs to be captured for learning undertaken both in and out of school (Willms and Tramonte, 2014: 11, 12).
In PISA, information about learning time is collected on student and school levels and covers domain-related learning time (through the student questionnaire), attendance and truancy (through student and school questionnaires), and enrolment and attrition (school questionnaire).
The surveys reviewed also use a number of other in-school indicators of learning time that may be of interest for PISA-D. The LLECE teacher questionnaire notes student

CHAPTER 4 – CONTEXTUAL DATA COLLECTION INSTRUMENTS USED IN EDUCATIONAL ASSESSMENTS – 87
A REVIEW OF INTERNATIONAL LARGE-SCALE ASSESSMENTS IN EDUCATION: ASSESSING COMPONENT SKILLS AND COLLECTING CONTEXTUAL DATA © OECD AND THE WORLD BANK 2015
attendance across school shifts (morning, afternoon, intermediate or complete day). The SACMEQ teacher and principal questionnaires measure teaching hours per week. The SAQMEQ principal questionnaire also asks about school days “lost”, while the EGRA/EGMA principal questionnaire asks about unofficial school closures during a given year.
PIRLS and TIMSS teacher questionnaires ask about the time students spend on homework.
Indicators of out-of-school factors focus on the impact of child labour on learning time. PASEC and LLECE student questionnaires ask about: types of work (in the household, in agriculture, retail; in/outside the home); amount of work (days per week and hours per day); if students are paid for working; and if working hinders learning, school attendance or causes fatigue during instruction.
Children’s participation in the labour force can also be seen as an indicator related to both learning time and to socio-economic status. However, including this topic under socio-economic measures may unnecessarily complicate the measurement of family SES. Variables about children’s working can be implemented alongside SES measures (Willms and Tramonte, 2014: 17).
School resources PISA includes a number of measures in relation to school resources, captured in the
school questionnaire. These measures include:
• the size, structure and organisation of the school, including its student and teacher bodies, human resources, and responsibility for specific decision-making
• funding sources
• school resources, including didactic material and facilities, student/computer ratio, school buildings and facilities
• school location, including the size of community.
The PISA 2015 teacher questionnaire will include questions about human resources and teaching conditions, such as teachers’ employment status, job experience, workplace selection, subjects studied, and if teachers are teaching in the modal grade for 15-year-old students.
Measures of school resources in developing country contexts need to encompass very low levels of school resources. In many cases, developing countries may lack the resources that would be taken for granted in high-income countries.
Willms and Tramonte distinguish four groups of school resources: material resources, schooling processes, teachers’ working conditions and human resources. They posit that PISA-D might usefully extend the “regular” PISA measures of school resources to include a small set of questions relating to material resources. In particular, these questions should focus on basic services, didactic facilities and didactic resources in developing countries (Willms and Tramonte, 2014: 12, 21).
A number of international surveys collect data on basic services, didactic facilities and didactic resources. Relevant questions are concentrated in teacher and principal data collection instruments in SACMEQ, PASEC, EGRA and EGMA, ASER and Uwezo. A fourth category, “other”, was added to include topics that are also considered relevant for

88 – CHAPTER 4 – CONTEXTUAL DATA COLLECTION INSTRUMENTS USED IN EDUCATIONAL ASSESSMENTS
A REVIEW OF INTERNATIONAL LARGE-SCALE ASSESSMENTS IN EDUCATION: ASSESSING COMPONENT SKILLS AND COLLECTING CONTEXTUAL DATA © OECD AND THE WORLD BANK 2015
PISA-D in regard to school resources – safety at school, teacher satisfaction, staff stability, and funding/grants.
Data collected about basic services relates to:
• school size, including the total number of students in the school's biggest shift (in PASEC and SACMEQ principal questionnaires)
• quality and condition of school buildings (in PASEC and SACMEQ principal questionnaires); with specific items about the cleanliness of the school and surrounds, any major repairs required, and the presence of playgrounds, walls and security guards (in EGRA and EGMA school observations, ASER school facilities observation, and Uwezo principal questionnaire)
• school infrastructure, such as the availability of electricity and telephones, the availability and condition of school resources and school facilities, and whether school facilities are shared between more than one school (various items across PASEC and WEI-SPS principal questionnaires, and EGRA and EGMA school observations and principal questionnaires)
• student/toilet ratio (in the SACMEQ principal questionnaire), the number of functioning toilets in total and for girls (PASEC, EGRA and EGMA school observation, and ASER school facilities observation)
• the presence and functioning condition of a water source (EGRA and EGMA school observation, ASER school facilities observation, and Uwezo principal questionnaire)
• the availability, timing and cost of school meals, the availability of cooking facilities at school (in SACMEQ and ASER principal questionnaires)
• food, transportation, medical and clothing programmes (in LLECE principal questionnaire).
Data collected about didactic facilities is collected across the SACMEQ, PASEC and WEI-SPS teacher questionnaires, the ASER and Uwezo principal questionnaires, and the EGRA and EGMA classroom observations. This data about didactic facilities relates to:
• workspaces, meaning whether there are spaces for students to sit and to write, and where students are seated
• classroom infrastructure, furniture and equipment, such adequate number of seats, adequate lighting in classroom, availability of a blackboard
• classroom resources and teachers’ materials, such as boards, chalk, pen, notebook, teacher manuals, teacher lesson plan books and so on.
Data is also collected about didactic resources across many of the reviewed survey instruments. For example, an item about library resources was included in each of the PIRLS and TIMSS teacher questionnaires, PASEC, LLECE and Uwezo principal questionnaires, EGRA/EGMA principal questionnaire and school observation, and the ASER school facilities observation.
Similarly, the availability, quality and frequency of use of pedagogical resources, including teaching resources, educational material, classroom texts and resources for reading instruction were addressed in various items across the PIRLS, TIMSS, SACMEQ and LLECE teacher questionnaires, and the PASEC principal questionnaire.

CHAPTER 4 – CONTEXTUAL DATA COLLECTION INSTRUMENTS USED IN EDUCATIONAL ASSESSMENTS – 89
A REVIEW OF INTERNATIONAL LARGE-SCALE ASSESSMENTS IN EDUCATION: ASSESSING COMPONENT SKILLS AND COLLECTING CONTEXTUAL DATA © OECD AND THE WORLD BANK 2015
Surveys also addressed student learning materials, such as:
• whether students own textbooks, and whether students can borrow textbooks from school (in SACMEQ student and principal questionnaires)
• the distribution of textbooks for particular subjects, such as French and Mathematics (PASEC student questionnaire)
• the presence and number of books other than textbooks for reading (EGRA and EGMA classroom observations; EGRA/EGMA, ASER and Uwezo principal questionnaires)
Additional questions relating to didactic resources included:
• the availability or shortage of resources and technology (in the PIRLS and TIMSS principal questionnaires)
• specific resources, such as televisions and photocopiers (LLECE principal questionnaire)
• if computers are available for the use of children (ASER school facilities observation)
• the availability of writing materials, the number of students with pencils, and the display of students’ work and instructional material on classroom walls (EGRA and EGMA classroom observations and principal questionnaires).
Data about other material resources that may be relevant to PISA-D relates to:
• safety, school violence and the presence of a security guard (PIRLS, TIMSS, LLECE, EGRA and EGMA teacher and principal questionnaires)
• teacher satisfaction, including the impact of travel distance, if teacher housing is provided and the quality of it, salary levels, quality of educational material, professional development (SACMEQ teacher questionnaire)
• staff stability, in terms of the proportion of teachers at the school for five years or more (WEI-SPS principal questionnaire)
• funding sources (LLECE), school-grant information and repairs, purchases and expenditures (ASER and Uwezo principal questionnaires).
Family and community support In the context of economically developing countries, family and community support
may have an impact on the learning of children living in poverty (Willms and Tramonte, 2014: 8).
Measures of family and community support have been implemented in PISA before, capturing communication with parents, cultural capital, and family involvement. The PISA 2012 school questionnaire included questions about parental expectations towards school and parents’ participation in school activities. The parent questionnaire looked at cost of educational services, attitudes to the child’s school, parental support for learning in the home and parents’ participation in school activities.
Willms and Tramonte (2014: 11, 13) argue that the measures used in PISA should be enhanced in order to create scales that distinguish between parental involvement, social capital and cultural capital, and that are of relevance for PISA-D countries. During the
90 – CHAPTER 4 – CONTEXTUAL DATA COLLECTION INSTRUMENTS USED IN EDUCATIONAL ASSESSMENTS
A REVIEW OF INTERNATIONAL LARGE-SCALE ASSESSMENTS IN EDUCATION: ASSESSING COMPONENT SKILLS AND COLLECTING CONTEXTUAL DATA © OECD AND THE WORLD BANK 2015
review of international surveys, relevant questions in regard to family and community support were identified from PIRLS and TIMSS, SACMEQ, LLECE, PASEC, EGRA and EGMA, ASER and Uwezo as well as PIAAC, STEP and LAMP. Questions are included on student/respondent, parent/head of household, teacher and school level.
Data collected about family support relates to tuition, home study support by parents, parents’ involvement in the child’s education, parents’ opinion about the child’s school, and other parental support, such as providing a meal for the child before school or having knowledge about performance.
Several questions in the Uwezo instruments seem to address both family and community support, such as parents’ sense of how much their opinions about education are heard by local and national officials, parent’s views of the most pressing issues facing the community, and parents’ awareness about the Uwezo assessment itself.
International survey data collected about community support relates to school community contribution factors and school community problems, community infrastructures and the average income level of the school’s immediate area (high, medium or low). These issues are addressed across various items in PIRLS, TIMSS, PASEC, SACMEQ and WEI-SPS principal questionnaires and ASER and Uwezo village observations.
Moreover, PIAAC includes specific measures about cultural capital, household composition and parental home. LAMP looks at human and social capital. Questions cover social context and the literacy levels in the environment, as well as household characteristics and structure, such as the number of individuals living in the household, classified by their relationship to the head of the household, age, sex, and highest level of education.
Health and wellbeing An eighth category, “health and wellbeing”, was added as it was considered relevant
for PISA-D during the review of international assessments. Health indicators are considered important for people of all ages because health affects the ability to learn and work. At the same time, the kind of work an individual does affects his or her health status (Pierre, et al., 2014: 21). Also Willms argues that physical and mental health is a key outcome of education, similar to achievement and engagement, and that “health, achievement and engagement affect each other in an interactive process that begins during the primary grades and continues through to adulthood” (Willms and Tramonte, 2014: 5). PIRLS results show that “teachers reported limiting instruction because about one-quarter of the students were suffering from lack of basic nutrition and nearly half from not enough sleep” (Mullis et al., 2012b: 201).
Health and wellbeing factors are covered in several international surveys.
PASEC collects data from students, teachers and principals on wellbeing at school as a factor of the school environment.
Uwezo asks principals about health services such as the presence of a nurse, provision of sanitary items for girls, availability of drinking water and food programmes. It also asks principals to identify the main health issue keeping children out of school, with options of malaria, diarrhoea, cough/flu or other.
PIAAC uses a single item on subjective health: “In general, would you say your health is excellent, very good, good, fair, or poor?” (OECD, n.d.-c: 106).

CHAPTER 4 – CONTEXTUAL DATA COLLECTION INSTRUMENTS USED IN EDUCATIONAL ASSESSMENTS – 91
A REVIEW OF INTERNATIONAL LARGE-SCALE ASSESSMENTS IN EDUCATION: ASSESSING COMPONENT SKILLS AND COLLECTING CONTEXTUAL DATA © OECD AND THE WORLD BANK 2015
STEP collects information about a number of key health indicators: height (in centimetres), weight (kilogrammes), level of life satisfaction, existence and kind of health insurance, and number of days the individual was prevented from working during the last four weeks due to sudden illness, accident or chronic illness.
LAMP asks about personal wellbeing and health-related literacy. Respondents are asked about their health condition and if they can perform basic functions like filling in medical forms, reading medical labels and food labels.
Implications The range of important measures is quite extensive. PISA-D contextual
questionnaires should be highly focused in order to accommodate the limited time and to reduce the burden on respondents, and particularly given the likely relatively low reading ability of the intended target population of PISA-D (students as well as parents).
As outlined in the terms of reference for PISA-D, the student and school questionnaires should address policy issues of interest to participating countries, and take about 30 to 35 minutes to be completed (OECD, 2014a). On the student level, PISA-D should collect information with two components:
• a core component with basic demographic information, with key questions from the previous PISA cycles for PISA-D
• a focused component through which in-depth information on one or more specific policy issues identified by the participating countries is collected.
The focused component should be designed specifically for PISA-D in order to address policy issues of interest to the participating countries as per the themes identified in this section.
Early learning opportunities The PIRLS and TIMSS Learning to Read Survey (2011) may be a useful component
for the PISA-D parent questionnaire. It includes information about language spoken in the home, preschool experiences, homework activities, home-school involvement, books in the home, and parents’ education and occupation. In addition, this questionnaire collects information on early literacy and numeracy activities, reading and quantitative readiness, and parents’ reading activities and attitudes toward reading. Together with information collected from the students, parents’ responses will provide a more complete picture of an important context for learning to read and numeracy. The questionnaire is designed to take 10 to 15 minutes to complete (Martin, Mullis and Foy, 2013: 67, 68). Depending on whether or not a parent questionnaire will be implemented in PISA-D countries, it will be worth considering if some of the questions about early reading and numeracy could be included in the student questionnaire. If a parent questionnaire is not considered, we recommended implementing the respective questions on student level to find out whether they can be reliably answered by 15-year olds in PISA-D. Additionally, existing parent questionnaires could be used in the field trial to compare student and parent responses to questions about early learning opportunities.
Questions from LLECE (SERCE Grade 3 and 6 student questionnaires and parent questionnaire) about early reading and how often someone at home reads aloud to the child may also be of interest to PISA-D.

92 – CHAPTER 4 – CONTEXTUAL DATA COLLECTION INSTRUMENTS USED IN EDUCATIONAL ASSESSMENTS
A REVIEW OF INTERNATIONAL LARGE-SCALE ASSESSMENTS IN EDUCATION: ASSESSING COMPONENT SKILLS AND COLLECTING CONTEXTUAL DATA © OECD AND THE WORLD BANK 2015
Of particular interest to PISA-D may be questions about the out-of-school status of 15-year-olds, as implemented in ASER and Uwezo. This should be considered if a (household-based) component to reach out-of-school-children is introduced in PISA-D.
Language of home and school In regard to language at home and in school, it may be worth including
language-related questions from the PISA 2012 educational career questionnaire. Of particular interest would be the questions about the first language learned at home, age when test language was learned, the language usually spoken with different groups of people such as parents and friends, and the language used for different activities. These questions would reveal a broader picture of students’ familiarity with the test language, which is important (Willms and Tramonte, 2014: 11). In addition, questions about the frequency of speaking the test language at home and the language spoken by the student before school enrolment (both from PIRLS and TIMSS), would be worth including. The PIRLS and TIMSS approach of asking if the books at home are mainly in the test language is also relevant for PISA-D.
Questions used in STEP and LAMP also have potential for PISA-D in providing a full picture of the languages at home, and differentiating between languages that respondents speak, read and write.
One option for the PISA-D teacher questionnaire is to include a question about the languages spoken by the teacher, as for example in PASEC. This would show any correlations between the language of instruction and the language spoken at home at the teacher level. Additionally, teachers could be asked to estimate the number of students that have difficulties understanding the spoken test language (as is done in PIRLS and TIMSS).
PISA-D should also include broader questions about the language of instruction (Willms and Tramonte, 2014: 11). Questions from PISA 2009, PIRLS and TIMSS that may be relevant for PISA-D relate to the proportion of students that have a first or native language, or mother tongue, that is not the test language. The availability of additional instruction for students with a first language other than the test language may also be an issue.
At the school level, questions from LLECE about the language(s) of instruction and indigenous language services and resources may also be of interest to PISA-D. It would be useful for PISA-D to ask about the official time used for teaching the language of instruction, as in WEI-SPS, and about languages in which textbooks are provided, as in Uwezo.
Socio-economic status PISA-D requires a combined approach of extending the current indicators of the PISA
index of economic, social and cultural status to include items at the lower end of the socio-economic scale, and developing new poverty-related measures. The review of international surveys provides valuable information for both options.
Indicators relevant to children living in poverty are included in SACMEQ, PASEC, LLECE, EGRA and EGMA, ASER and Uwezo, and can be summarised as follows:
• parental education, such as if parents can read and write; if parents attended school and the status of their completed education; if parents never attended

CHAPTER 4 – CONTEXTUAL DATA COLLECTION INSTRUMENTS USED IN EDUCATIONAL ASSESSMENTS – 93
A REVIEW OF INTERNATIONAL LARGE-SCALE ASSESSMENTS IN EDUCATION: ASSESSING COMPONENT SKILLS AND COLLECTING CONTEXTUAL DATA © OECD AND THE WORLD BANK 2015
school (additional questions from LAMP and STEP about formal and non-formal education may be useful to fully capture parent’s education)
• main source of the income and occupation, with options to include unemployed, wage employee (office), transfers (from other people), farming or animal production, wage employee (casual labour), home maker, own business, other
• home facilities, in terms of the structural features of the dwelling, including electricity, water, construction material of the home, type of house, availability of and type of toilet, lighting, method for cooking, water source for washing, number of meals per day
• home possessions, in terms of material possessions in the household as well as personal material possessions of the respondent, including radio, TV, (mobile) phone, computer, internet, cattle, donkeys, camels, sheep or goats, bicycle, motorbike, cart
• educational resources in the household, including educational materials, number of books, reading material (books and newspapers), and whether anyone in the household knows how to use a computer.
STEP, LAMP, ASER and Uwezo, all implemented in developing country contexts, provide a well-established pool of variables for household characteristics. PISA-D can draw from this pool, using relevant variables to extend the index of economic, social and cultural status scale, as well as to develop new poverty-related measures. In STEP, a particular asset index (Pierre, et al., 2014: 15) was created, that bears potential for PISA-D. The STEP asset index is further discussed in the examination of socio-economic and poverty-related measures in section 4.4.2).
Employment information as captured in LAMP, STEP or PIAAC may be of interest for the PISA parent questionnaire, in regard to extending existing measures of the parents’ employment status. For example STEP module 4 obtains basic employment information, such as the labour force status (employed, unemployed or inactive; including self-employed – with and without pay; underemployed or holding low-productivity jobs).
Quality of instruction The international surveys reviewed offer a wide range of factors indicating quality of
instruction – both in general as well as domain-related – at the student, teacher and school levels.
PISA measures of general aspects of quality of instruction could be extended for use in PISA-D. Of particular interest are specific pedagogical practices, limitations of teaching (including students nutrition and if they get enough sleep), emphasis on academic success and achievement expectations, assessing and monitoring learning progress, classroom organisation and management (such as multi-grade instruction, grouping of students and personalised learning), homework, evaluation of teacher practice and professional development.
Domain-related aspects of quality of instruction that are of particular relevance for PISA-D are reading instruction strategies, including options for advanced readers and students dealing with reading difficulties, and teacher training for specific subjects, including teachers’ subject matter knowledge.

94 – CHAPTER 4 – CONTEXTUAL DATA COLLECTION INSTRUMENTS USED IN EDUCATIONAL ASSESSMENTS
A REVIEW OF INTERNATIONAL LARGE-SCALE ASSESSMENTS IN EDUCATION: ASSESSING COMPONENT SKILLS AND COLLECTING CONTEXTUAL DATA © OECD AND THE WORLD BANK 2015
It is important to consider whether PISA-D could sufficiently address these aspects at the school and student level, or whether a teacher questionnaire is necessary. The comparison of international surveys shows that some of the relevant factors are currently collected on both classroom teacher and school principal questionnaires.
Learning time Learning-time factors include enrolment and school attendance of both students and
teachers, as well as time for instruction. These topics are covered in the PISA questionnaire on student and school levels.
PISA-D should include measures of learning-time factors specific to developing countries, especially the impact of child labour. Questions about working outside school are captured in PASEC and LLECE student questionnaires, which ask about the type of work (in the household, in agriculture, retail; inside/outside the home); if the students are paid for working; the amount of work (days per week and hours per day); and if working hinders learning or school attendance, or causes fatigue during instruction.
School resources Wills and Tramonte (2014: 12, 21) suggest including a small set of questions in
PISA-D relating to material resources, focusing on basic services, didactic facilities and didactic resources. Relevant factors were mainly found in those surveys addressing student or child populations in economically developing countries. Relevant questions were found in SACMEQ, PASEC, EGRA and EGMA, ASER and Uwezo.
Factors relating to basic services mainly include conditions of the school building and school infrastructure such as the availability of electricity, toilets, drinking water sources and provision of school meals, transportation and medical and clothing programmes. The main informant for questions related to basic services is the principal. Information is also captured through school observation.
Factors relating to didactic facilities include information about teachers’ workspace, classroom resources and infrastructure such as tables, chairs and other furniture, blackboard, chalk, pen, notebook, and adequate lighting in classroom. Main informants for didactic facilities are students and teachers, but also principals and classroom observation.
Factors relating to didactic resources cover teaching resources such as television, photocopier, or computer, availability and quality of educational material, availability of a library, student learning materials such as textbooks, pencils and other writing materials. Quality and frequency of use is mainly captured through the teacher; students are asked about use and ownership of material. For library resources the principal seems to be the main informant.
Other relevant topics that have been identified during the review of international surveys and that are of relevance for PISA-D are school safety, teacher satisfaction (including factors such as travel distance, if teacher housing is provided, or level of salary), staff stability, and issues regarding funding and grants. In respect to receipt and spending of grants the ASER Centre indicates that these items have become more and more detailed over the years. The rationale behind this is that it is important to have information about allocation of resources to the right activities, people responsible for decision-making, flow of funds and if the money reaches where it is supposed to (ASER Centre, 2014: 12-13). School safety, staff stability and issues of funding have mainly

CHAPTER 4 – CONTEXTUAL DATA COLLECTION INSTRUMENTS USED IN EDUCATIONAL ASSESSMENTS – 95
A REVIEW OF INTERNATIONAL LARGE-SCALE ASSESSMENTS IN EDUCATION: ASSESSING COMPONENT SKILLS AND COLLECTING CONTEXTUAL DATA © OECD AND THE WORLD BANK 2015
been addressed at school level, whereas information about teacher satisfaction has been captured from the teachers.
Family and community support Information about parental involvement is captured at all levels – student, parent,
teacher and school level. Surveys that include relevant factors for parents’ involvement for PISA-D are PIRLS and TIMSS, SACMEQ, LLECE, WEI-SPS and EGRA and EGMA.
Information about community support is mainly captured through the principal. Useful factors and variables can be found in SACMEQ, WEI-SPS, PIRLS and TIMSS and PASEC.
Specific measures of cultural and social capital, which are of relevance for PISA-D, are included in PIAAC and LAMP.
Health and wellbeing Health and wellbeing are considered important outcomes of education and are of
particular relevance to economically developing countries, where students have to deal with malnutrition and the availability of basic health services cannot be assumed. Factors measuring health and wellbeing should therefore be included in the PISA-D context questionnaires. The relevant information can be properly addressed at the student and school level.
A number of international surveys measure factors about health and wellbeing that may be of particular interest for the inclusion in PISA-D.
Uwezo asks principals about health services such as the presence of a nurse, provision of sanitary items for girls, availability of drinking water and food programmes. It also asks principals to identify the main health issue keeping children out of school, with options of malaria, diarrhoea, cough/flu or other.
LAMP asks about personal wellbeing and health-related literacy. Respondents are asked about their health and if they can perform basic functions like filling in medical forms, reading medical labels and food labels.
A health-related literacy component may be of interest to PISA in general, for example as an accompanying questionnaire option in the context of the science literacy assessment.
Technical aspects of contextual data collection instruments
Question formats In regard to question formats, PISA uses Likert scale (a method of ascribing
quantitative value to qualitative data, to make it amenable to statistical analysis) and open response questions. Since the PISA 2012 assessment, formats such as “forced choice”, “situational judgement tests”, “overclaiming techniques” and “anchoring vignettes” have been introduced and are discussed below.
In the surveys reviewed, across all contextual data collection instruments, the following question formats were used:

96 – CHAPTER 4 – CONTEXTUAL DATA COLLECTION INSTRUMENTS USED IN EDUCATIONAL ASSESSMENTS
A REVIEW OF INTERNATIONAL LARGE-SCALE ASSESSMENTS IN EDUCATION: ASSESSING COMPONENT SKILLS AND COLLECTING CONTEXTUAL DATA © OECD AND THE WORLD BANK 2015
• dichotomous questions, mostly with yes/no responses, used particularly in ASER and Uwezo
• nominal variables
• Likert scales, including three, four, five and ten-point scales
• open-ended questions
• rankings.
An example of rankings is found in an Uwezo household survey item about major issues facing the community. The respondent is asked to choose three of nine options and rank the three chosen options in order of importance.
Open-ended questions, which were largely used in ASER and Uwezo, are not very cost or time-effective for data capture, analyses and aggregation, and grouping of information.
Scaling of contextual constructs Table D.8 in Annex D provides an overview of scaling methodologies applied in the
different international surveys for contextual constructs. The right column describes context constructs relevant to PISA-D. Socio-economic measures (as one of the seven priorities) are described in Table D.9.
Scaling/computing of relevant contextual constructs In PISA two kinds of indices are created from context questionnaire constructs.
Simple indices are constructed through arithmetic transformation or recoding. Scale indices are constructed through scaling of multiple items, using a weighted likelihood estimate, and in most cases using a one-parameter item response model (a partial credit model was used in the case of items with more than two categories) (OECD, 2014b).
For scale indices, in general, the scaling is done in three stages. First, the item parameters are estimated from equal-sized subsamples of students from all participating countries and economies. Second, the estimates are computed for all students and all schools by anchoring the item parameters obtained in the preceding step. Third, the indices are then standardised so that the mean of the index value for the OECD student population is 0 and the standard deviation is 1 (with countries being given equal weight in the standardisation process) (OECD, 2014c: 260).
The combination of item response theory scaling methodology and computation of simple indices is commonly used in large-scale international studies, as well as in the household-based studies PIAAC and LAMP.
In STEP, the mostly simple indices are derived from Likert scales (Pierre et al., 2014: 69).
In PIRLS and TIMSS each context scale (derived from item response theory scaling) was divided into regions, corresponding to high, middle and low values on the construct. The cutpoints between the regions were defined in terms of response categories to facilitate interpretation of the regions (Martin et al., 2012).
No methodological guidelines for processing of contextual constructs are provided in EGRA and EGMA, ASER and Uwezo. Usually some simple computations are carried out to aggregate or average variables, or to create ratios (such as teacher/student ratio).
CHAPTER 4 – CONTEXTUAL DATA COLLECTION INSTRUMENTS USED IN EDUCATIONAL ASSESSMENTS – 97
A REVIEW OF INTERNATIONAL LARGE-SCALE ASSESSMENTS IN EDUCATION: ASSESSING COMPONENT SKILLS AND COLLECTING CONTEXTUAL DATA © OECD AND THE WORLD BANK 2015
Relevant context constructs from international surveys The following context constructs used in international surveys are of particular
relevance for PISA-D. These constructs are organised according to the seven key areas of focus identified by Willms and Tramonte (see section 4.3).
Early learning opportunities Children’s early literacy activities before beginning primary school are measured in
PIRLS. The scale is based on the parent’s report of how often they do nine activities, such as reading books, telling stories, singing songs and playing word games.
Children’s early numeracy activities before beginning primary school are measured in TIMSS. The scale is based on the parent’s report of how often they do six activities, such as saying counting rhymes or singing counting songs, counting different things, playing with building blocks or construction toys.
PIRLS also collects data on whether children could do early literacy tasks at the beginning of primary school. The scale is based on parents’ responses to how well their children could do five tasks, including recognising most of the letters of the alphabet, reading some words, reading some sentences.
TIMSS considers whether children could do early numeracy tasks at the beginning of primary school. The scale is based on parents’ responses to six statements, such as whether children count independently or recognise different shapes.
Language of home and instruction PISA’s language background construct indicates whether a students’ language at
home is the same as the language of assessment or a different language than the language of assessment.
Quality of instruction PIRLS and TIMSS principal and teacher report constructs include a scale of school
emphasis on academic success. This scale considers five aspects, including teachers’ understanding of the school’s curricular goals and teachers’ expectations for student achievement.
PIRLS includes a scale of emphasis in early grades on reading skills and strategies, based on principals’ responses about the earliest grade at which each of eleven reading skills and strategies were emphasised.
PIRLS and TIMSS include a scale of collaboration to improve teaching. The construct is based on teachers’ responses to how often they interacted with other teachers in each of five teaching areas. The areas include discussing how to teach a particular topic and visiting another classroom to learn more about teaching.
PIRLS and TIMSS include a scale on instructions to engage students in learning. The construct is based on teachers’ responses to how often they used each of six instructional practices. Practices listed include summarising what students should have learned from the lesson and praising students for good effort.
LLECE includes an index of educational opportunity. The construct is based on measures of classroom time, learning resources, school library resources, financial resources, school infrastructure, and teacher and leader quality. The index also considers

98 – CHAPTER 4 – CONTEXTUAL DATA COLLECTION INSTRUMENTS USED IN EDUCATIONAL ASSESSMENTS
A REVIEW OF INTERNATIONAL LARGE-SCALE ASSESSMENTS IN EDUCATION: ASSESSING COMPONENT SKILLS AND COLLECTING CONTEXTUAL DATA © OECD AND THE WORLD BANK 2015
processes that mediate pedagogy, such as curriculum coverage, language of instruction, school autonomy, use of teaching materials, homework and school climate. Analyses are conducted at the classroom, school and education system levels.
School resources PIRLS and TIMSS include a number of constructs about school resources.
They include scales of the extent to which instruction is affected by resource shortages (in reading and mathematics respectively). The constructs are based on principals’ responses concerning the availability of general and subject-specific resources in the school and classroom.
They also include a teachers’ working conditions scale. The construct is based on teachers’ responses concerning five potential problem areas: school buildings needing significant repair; classrooms being overcrowded; teachers having too many teaching hours; teachers not having adequate workspace; and teachers not having adequate instructional materials and supplies.
A scale for the safety and order of the school is based on teachers’ degree of agreement with five statements. Statements include: this school is located in a safe neighbourhood; I feel safe at this school; and the students behave in an orderly manner.
The principal questionnaire includes a school discipline and safety scale. The scale is based on principals’ responses concerning ten potential school problems, including students arriving late at school, unjustified absenteeism, vandalism, and so on.
LLECE includes an index of accessibility of basic school services in the principal (census) questionnaire. The construct is based on five items requiring yes/no answers, if the following exists in the school: electricity/lights; drinkable water; sewage system; phone; sufficient number of bathrooms.
The LLECE index of school infrastructure is based on 15 items the principal questionnaire. The items ask whether the school has: a principal’s office; additional offices (secretary/administration); staff room; sports field/court/oval; science room; gym; school garden; computer room; auditorium; kitchen’ cafeteria; art/music room; medical office; speech-psychology services; school library.
Family and community support SACMEQ includes a school community contribution factor. The construct is based on
the sum of the presence of community contributions towards nine school activities. Activities include construction and maintenance of school buildings; construction and repair of school furniture; provision of school meals; buying of textbooks, stationery and supplies; payment of teacher salaries; and extra-curriculum activities.
Implications
Question formats PISA questionnaires include a number of self-reported measures. These include
motivation, self-concept, engagement and enjoyment. Analyses of these measures often show a correlation between performance and attitudes (for example, interest in mathematics and mathematics performance). There are also concerns about the cross-cultural comparability of self-reported measures. However, these can be addressed

CHAPTER 4 – CONTEXTUAL DATA COLLECTION INSTRUMENTS USED IN EDUCATIONAL ASSESSMENTS – 99
A REVIEW OF INTERNATIONAL LARGE-SCALE ASSESSMENTS IN EDUCATION: ASSESSING COMPONENT SKILLS AND COLLECTING CONTEXTUAL DATA © OECD AND THE WORLD BANK 2015
– in PISA the scales that were adjusted for differences in response behaviours by means of anchoring vignettes were shown to have a positive correlation with mathematics performance. Anchoring vignettes provide a comparatively inexpensive way of creating an anchor within the survey context itself. The idea is to compare respondents’ self-assessments to the respondents’ assessments of hypothetical people described in short vignettes that have known characteristics, and to use the latter to adjust the former.
It will certainly be of interest for PISA-D to include item formats that allow for an adjustment of self-reported measures to further explore and potentially increase cross-country comparability. We recommend undertaking analyses to examine the extent of different patterns of response styles in the countries participating in PISA-D.
Scaling of contextual constructs We recommend that PISA-D follow the procedures used in PISA to scale context
questionnaire scales. This includes employing item response theory scaling methodology (for example, see OECD, 2009: 7-9). This scaling technique is robust for comparisons across different samples and over time.
PIRLS and TIMSS context questionnaire scaling could be of particular interest for PISA-D. Given that PIRLS, TIMSS and PISA have all used ConQuest item response modelling software, the algorithm underlying this particular scaling would probably be similar across these assessments.
Questionnaire scales of relevance for PISA-D are mainly from PIRLS and TIMSS. Of particular interest are the scales for early literacy and numeracy activities before beginning primary school and for early literacy tasks at the beginning of primary school (early learning opportunities), as well as the scale for instructions to engage students in learning (quality of instruction).
Relevant indices identified from LLECE are educational opportunity, relating to learning time, learning resources, school resources and infrastructure, quality of instruction; accessibility of basic school services and school infrastructure.
The SACMEQ school community contribution factor could also be valuable for PISA-D.
Socio-economic and poverty-related measures
As mentioned earlier, it is envisaged that PISA-D will extend the current indicators of the PISA index of economic, social and cultural status to include items at the lower end of the socio-economic scale, as well as develop new poverty-related measures.
PISA uses a number of SES-related measures. The measure for parents’ occupational status involves recoding ISCO codes into International Socio-Economic Index (ISEI) occupational status codes. The measure for parents’ educational level has used the 1997 version of UNESCO’s International Standard Classification of Education (ISCED 97), but will use ISCED 11 for PISA 2015. Other measures include wealth (based on home possessions), home educational resources (including books at home) and cultural possessions. PISA’s index of economic, social and cultural status (ESCS) is derived from indices of all these measures (for details see Table in Annex D).
International surveys do include indicators relevant to children living in poverty, but do not measure them distinctly from socio-economic status.

100 – CHAPTER 4 – CONTEXTUAL DATA COLLECTION INSTRUMENTS USED IN EDUCATIONAL ASSESSMENTS
A REVIEW OF INTERNATIONAL LARGE-SCALE ASSESSMENTS IN EDUCATION: ASSESSING COMPONENT SKILLS AND COLLECTING CONTEXTUAL DATA © OECD AND THE WORLD BANK 2015
Home resources, possessions and assets Characteristically, measures that include indicators relevant to children living in
poverty are mainly based on home resources, characteristics of the household, and possessions and assets. Surveys that are of interest to PISA-D are SACMEQ, LLECE, EGRA and EGMA, ASER and Uwezo, as well as STEP and LAMP. For details of the SES-related scales see Table in Annex D. For an interesting discussion of SACMEQ’s poverty-related measures, see Dolata (2005).
In SACMEQ a student socio-economic status factor is derived from 18 items. Items about home possessions ask whether the household has books, newspapers, magazines, radio, television, VCR, cassette player, telephone, refrigerator, car, piped water, a table to write on. Parental education items cover mother’s education and father’s education. Other items include home quality (floor, roof, outside walls) and lighting to read (Dolata, 2005: 40).
The household resources measures in EGRA/EGMA, ASER and Uwezo are very similar. They include variables such as type of house, electricity connection, availability of toilet, type of toilet, method for cooking food, presence of a water source, number of meals per day. Household possessions in ASER and Uwezo also include availability of possessions such as a radio, TV, mobile phone and reading material (books and daily newspapers); cattle, donkeys, camels, sheep/goats, bicycle, motorbike, cart. In addition, ASER and Uwezo collect data on parents’ educational background; ASER asks if anyone in the household knows how to use a computer, attended school and status of completed education, never attended school, and if mother and father can read.
For the Uwezo regional report an SES indicator was created. Households in the survey are categorised into three socio-economic groups according to durable assets owned, access to electricity and/or clean water, and mother’s formal education level (Uwezo, 2014: 16). Children are then categorised into three groups: non-poor, poor and ultra-poor.
Similar indices are created in PASEC and LAMP. PASEC uses standard of living categories of poor, intermediate and rich. In LAMP respondents are classified into four socio-economic groups – affluent (well-off), comfortable, poor or subsistence level – based on the structure of the household and the available equipment.
Interesting for PISA-D is the asset index constructed in STEP for urban areas, based on the information on dwelling characteristics and household assets (see section 3.1.1). The asset index is used as a proxy for wealth. Since the focus of the survey is to obtain detailed information at the individual level, the household-level information is kept to a minimum (Pierre, et al., 2014: 14).
This STEP asset index was constructed using factor analysis over a set of indicator variables for the different types of assets and dwelling characteristics (Pierre, et al., 2014: 15). All national-level estimations were weighted using each country’s sample weights, “in order to reflect underlying measures of welfare” (Pierre, et al., 2014: 15). Therefore, during the selection of the variables, variables with extremely skewed distributions (with means across assets and dwelling characteristics below 0.02 and above 0.98) were excluded from the analysis. Deliberation was made over the inclusion of agricultural assets, which were considered productive assets and not an indication of wealth per se (Pierre, et al., 2014: 15). Moreover, variables with low factor loading (less than 0.1) on the un-rotated first factor of the overall asset index were excluded for the final asset index (Pierre, et al., 2014: 15).

CHAPTER 4 – CONTEXTUAL DATA COLLECTION INSTRUMENTS USED IN EDUCATIONAL ASSESSMENTS – 101
A REVIEW OF INTERNATIONAL LARGE-SCALE ASSESSMENTS IN EDUCATION: ASSESSING COMPONENT SKILLS AND COLLECTING CONTEXTUAL DATA © OECD AND THE WORLD BANK 2015
The asset index itself was constructed on a country-by-country basis according to the following process (Pierre, et al., 2014: 15):
1. An indicator variable was created for each of the dwelling characteristics and assets available in Module 1b of the STEP household questionnaire.
2. The variables that did not comply with the first selection criteria were dropped.
3. An overall asset index was generated using factor analysis and it included all the available asset and dwelling-related variables. In this stage, the factors with an Eigen value of more than 1 were selected. Eigen value is a scalar associated with a given linear transformation of a vector space and having the property that there is some nonzero vector which when multiplied by the scalar is equal to the vector obtained by letting the transformation operate on the vector; especially : a root of the characteristic equation of a matrix
4. A varimax rotation is used to simplify the expression of a particular sub-space in terms of just a few major items each and was employed using the selected factors from the previous step.
5. A Cronbach’s alpha (or scale reliability coefficient) was estimated for this overall asset index.
6. Indexes for each domain (dwelling characteristics, primary assets, and secondary assets) were constructed by following the same procedure from steps 3 to 5.
7. A pairwise correlation was estimated for each of the domain indexes compared to the overall asset index to determine the level of association.
8. Variables that did not meet the third selection criteria were dropped.
9. A final asset index was constructed based on the factors with an Eigen value of more than 1.
Given that assets play an important role in regards to poverty-related measures, the asset index created in STEP may be a valuable resource for PISA-D.
In LLECE an index of socio-economic and cultural background is created, which includes children’s wellbeing and cultural access at local, regional and global levels. The index also emphasises home assets, assuming that these facilitate access to culture and learning. LLECE also includes an index of educational home environment, which considers parental involvement in education as well as current and early childhood education.
School and classroom resources In addition to home resources, possessions and assets, school and classroom resources
are also related to socio-economic and poverty-related measures.
SACMEQ includes both a classroom resources factor and a school resources factor. The classroom resource factor is computed from the sum of the existence of eight items in the classroom: writing board, chalk/marker, wall chart, cupboard, bookshelves, classroom library or book corner, teacher table, and teacher chair. The school resources factor was computed in two ways. The first is a sum of the existence of 22 school resource items in the school including a school library, school meeting hall, staff room, separate office for school head, sports area, water, electricity, telephone, fax machine, overhead projector, radio, TV set, photocopier and computer. The second way calculates a Rasch score

102 – CHAPTER 4 – CONTEXTUAL DATA COLLECTION INSTRUMENTS USED IN EDUCATIONAL ASSESSMENTS
A REVIEW OF INTERNATIONAL LARGE-SCALE ASSESSMENTS IN EDUCATION: ASSESSING COMPONENT SKILLS AND COLLECTING CONTEXTUAL DATA © OECD AND THE WORLD BANK 2015
involving school resources items as well as classroom resource items, such as teacher table, teacher chair, sitting places, cupboard and bookshelves (Hungi, 2011a).
WEI-SPS uses indices of social advantage that are of relevance for PISA-D. The index of social advantage of school intake is based on principals’ responses about the number of students (none, most, all) whose parents are educated and the number who receive food or clothing programmes, and on the SES of the school intake compared to national GDP per capita. The social advantage of classroom intake index has been computed based on teacher’s responses on the number of students (none, most, all) who undertake child labour or who have family health problems, among other issues (UIS, 2009a: 70, Appendix III).
Implications Willms and Tramonte (2014) concluded that the current PISA measure of
socio-economic status does not include a sufficient number of items at the lower end of the scale to adequately describe the populations of students in the PISA-D countries (OECD, 2014: 56-57). The expert paper presents two options for addressing this issue:
1. extending the current indictors of the PISA index of economic, social and cultural status to include more items at the lower end of the SES scale
2. developing new poverty-related measures.
Willms and Tramonte recommend pursuing the first option as a starting point. This may have limitations, in that the resulting scale will not be uni-dimensional and the new items will differ in their relationship to achievement for low and high-SES students. The authors argue that a combined approach could be pursued, with attention to the goals of international comparability and maintaining a link to the current PISA framework (OECD, 2014a: 56-57).
A measure of socio-economic status for PISA-D should be:
• a reliable and valid measurement of SES within each country
• a tool for accurate assessment of low levels of SES and poverty within each country and across countries
• a comparable measure of SES and its variability across the participating countries (OECD, 2014a: 56-57).
The review of international surveys shows that SES-related measures applied in international surveys conducted in developing country contexts commonly include indicators relevant to children living in poverty, but do not measure them distinctly from SES. Such indicators tend to be mainly based on home resources, characteristics of the household and possessions and assets. A good source for factors related to household resources and possessions are EGRA/EGMA, ASER, Uwezo and LAMP. The factors can be used to categorise responses from households and children, as for example in Uwezo, PASEC or LAMP.
The asset index created for STEP is based on information on dwelling characteristics and household assets (Pierre, et al., 2014: 15). Despite being at the lower end of a global SES range, there is a breath of levels of economic development within and across the countries participating in PISA-D. The challenge in creating an asset index for PISA-D would be to find assets that function as indicators to differentiate meaningfully between different levels of SES equally well across all countries.

CHAPTER 4 – CONTEXTUAL DATA COLLECTION INSTRUMENTS USED IN EDUCATIONAL ASSESSMENTS – 103
A REVIEW OF INTERNATIONAL LARGE-SCALE ASSESSMENTS IN EDUCATION: ASSESSING COMPONENT SKILLS AND COLLECTING CONTEXTUAL DATA © OECD AND THE WORLD BANK 2015
A number of indices from other international surveys are considered particularly relevant for PISA-D:
• the student socio-economic status factor computed in SACMEQ (Dolata, 2005: 40) based on measures of home possessions, home quality and parental education
• the index of socio-economic and cultural background created in LLECE, which includes home assets, but also children’s wellbeing and cultural access at local, regional and global levels
• the index of educational home environment created in LLECE, which considers parental involvement in education as well as current and early childhood education.
In addition to home resources, school and classroom resources can also be SES indicators. Relevant for PISA-D are the classroom resource factor and school resource factor created in SACMEQ, and the social advantage of school intake index and social advantage of classroom intake index created for WEI-SPS.
Poverty-related measures often ask if respondents have a particular resource, such as textbooks or a television. Meaningful results can also be gained by also asking whether the respondents would actually like to have an item they do not own. In other words, the response options would be: I have this; I do not have this but would like it; and I do not have this and I do not want or need it. Such a response scale could be explored further in the context of PISA-D.
There is a need for PISA-D to capture different countries’ experiences with their own variables for measuring socio-economic status. Countries participating in PISA-D have a history of data collection and valuable experience on how to effectively assess socio-economic status in their specific cultural and geographical contexts.
PISA-D should look for options to ensure cross-cultural comparison. Three aspects are crucial:
• translating, adapting and verifying
• constructing context indices
• data analyses.
Cross-country and cultural comparability greatly depend on translation and adaptation procedures, including standardisation and verification. Country involvement is vital, and facilitation by national centres, project managers and experts. Country involvement includes reviewing context questionnaire frameworks and questionnaire items. This process ensures the face-validity (or face value) and cultural appropriateness of the content, and reduces the potential for translation issues.
PISA has well established procedures for translating, adapting and verifying questionnaire materials which should also be followed in PISA-D to ensure the rigour of this part of the assessment. Still, it may be worth incorporating translatability assessments to reduce the cost associated with this process (cApStAn, 2015).
Cross-country comparability also depends on the construction of context indices. PISA-D should include anchoring vignettes (as described above) and overclaiming techniques (these require respondents to rate their familiarity with a list of general knowledge items, such as persons, places, things). PISA-D should also explore further the application of forced choice content and format. This format was only partly pursued in

104 – CHAPTER 4 – CONTEXTUAL DATA COLLECTION INSTRUMENTS USED IN EDUCATIONAL ASSESSMENTS
A REVIEW OF INTERNATIONAL LARGE-SCALE ASSESSMENTS IN EDUCATION: ASSESSING COMPONENT SKILLS AND COLLECTING CONTEXTUAL DATA © OECD AND THE WORLD BANK 2015
PISA 2012 due to the ethical considerations of forcing students to make a choice where, in reality, such a choice would not have to occur: for example, forcing students to theoretically choose between a career in science or mathematics when, in reality, careers in those areas frequently involve both mathematics and science. PISA-D should also explore further the situational judgement test format, which was developed for the problem-solving approaches in PISA 2012, but ultimately found to have unsatisfactory levels of reliability. These formats may be productively pursued through development and cognitive testing of such items in PISA-D countries.
Finally, PISA-D should ensure data analyses after field trialling and after the main study focus on cross-country comparability. Data analyses need to capture the validity of questionnaire items across countries and to check that items work in the same way in all countries. This is essential for cognitive as well as contextual items. It is essential that countries review these analyses. Data adjudication ensures that data are valid, reliable and objective. This is done by all international large-scale assessments. PISA has already established highly elaborate standards in this regard. PISA has introduced measures to adjust relevant context questionnaire scales (self-reported measures) to ensure cross-cultural comparability. This hasn’t been found in any of the other surveys reviewed.
PIRLS and TIMSS do provide evidence that the context questionnaire scales provide comparable measurement across countries. These surveys compute reliability coefficients for each scale for every country and benchmarking participant. A principal components analysis of the scale items is conducted (Martin et al., 2012: 6). This analysis looks for a positive relationship between indicators of an effective learning environment and indicators of achievement. A strong correlation, across all countries, is seen as evidence of the validity of the context questionnaire scales (Martin et al., 2012: 9)
As has been done in the major international large-scale assessments, analyses should be aimed at examining the extent to which scales, and hence the constructs they intend to measure, have consistent dimensionality and validity across participating countries. This should be done particularly at the field trial stage to ensure that the most valid measures will be selected for the main study.
Confirmatory factor analyses and multi-group confirmatory analyses can be used to examine the dimensionality of scales within and across countries. While it cannot be expected that correlations between the same constructs are exactly the same across countries, a similarity of patterns could be expected.

CHAPTER 4 – CONTEXTUAL DATA COLLECTION INSTRUMENTS USED IN EDUCATIONAL ASSESSMENTS – 105
A REVIEW OF INTERNATIONAL LARGE-SCALE ASSESSMENTS IN EDUCATION: ASSESSING COMPONENT SKILLS AND COLLECTING CONTEXTUAL DATA © OECD AND THE WORLD BANK 2015
Notes
1. In addition to contextual data at student, classroom and school level, data at the system level play an important role within PISA, and will also be of particular importance for PISA-D. System-level data collection in PISA is conducted through OECD NESLI (INES Network for the Collection and Adjudication of System-Level Descriptive Information on Educational Structures, Policies and Practices). For PISA-D, a separate paper on “System-Level Data Collection” has been jointly commissioned by the OECD and the World Bank from the UIS to investigate the current status of system-level data collection and availability of participating countries in PISA-D.

106 – CHAPTER 4 – CONTEXTUAL DATA COLLECTION INSTRUMENTS USED IN EDUCATIONAL ASSESSMENTS
A REVIEW OF INTERNATIONAL LARGE-SCALE ASSESSMENTS IN EDUCATION: ASSESSING COMPONENT SKILLS AND COLLECTING CONTEXTUAL DATA © OECD AND THE WORLD BANK 2015
References
Allen, J. et al. (2013), “The development of the PIAAC background questionnaires” in Technical Report of the Survey of Adult Skills (PIAAC), OECD, Paris.
ASER Centre (2014), Annual Status of Education Report (Rural) 2013, ASER Centre, New Delhi.
ASER Centre (n.d.), How Far has India Come in Guaranteeing Education? The Right to Education Act and ASER Findings 2010-2012, ASER Centre, New Delhi, http://img.asercentre.org/docs/Publications/aser6pageronstatusofrteimplementation_30thmar2013.pdf.
Banerji, R. and S. Bobde (2013), “Evolution of the ASER English Tool” in V. Berry (ed.), English Impact Report: Investigating English Language Learning Outcomes at the Primary School Level in Rural India, British Council, London.
cApStAn (2015), “cApStAn Linguistic Quality Control, Inc.”, www.capstan.be/content/translatability_assessment.html (accessed 23 May 2015).
Carroll, J. (1963), “A model of school learning”, Teachers College Record 64(4), Teachers College, Columbia University, New York, pp.722-723.
CONFEMEN (2013), CONFEMEN Programme for the Analysis of Education Systems: PASEC, CONFEMEN, Dakar.
CONFEMEN (2012), Améliorer la Qualité de l’Education au Tchad : Quels sont les Facteurs de Réussite? Évaluation Diagnostique PASEC-CONFEMEN 2e et 5e du Primaire Année Scolaire 2009/2010, CONFEMEN, Dakar.
Creemers, B.P.M. (1994), The Effective Classroom, Cassell, London.
Crouch, L. (2009), The Snapshot of School Management Effectiveness: Report on Pilot Applications, RTI International, North Carolina.
Crouch, L. (2008), “Snapshot of school management effectiveness aims, initial development, instruments, methods”, presentation, SSME workshop, Washington DC, 18 December 2008, www.eddataglobal.org/management/index.cfm?fuseaction=pubDetailandID=164.
Dolata, S. (2005), “Construction and validation of pupil socio-economic status index for SACMEQ education systems”, conference paper, International Invitational Educational Policy Research Conference, Paris, 28 September to 2 October 2005.
Foy, P., A. Arora and G.M. Stanco (2013), TIMSS 2011 User Guide for the International Database, Supplement 2: National Adaptations of International Background Questionnaires, Lynch School of Education, Boston College, Massachusetts.
Hooper, M., I.V.S. Mullis and M.O. Martin (2013), “PIRLS 2016 context questionnaire framework”, in I.V.S. Mullis and M.O. Martin (eds.), PIRLS 2016 Assessment

CHAPTER 4 – CONTEXTUAL DATA COLLECTION INSTRUMENTS USED IN EDUCATIONAL ASSESSMENTS – 107
A REVIEW OF INTERNATIONAL LARGE-SCALE ASSESSMENTS IN EDUCATION: ASSESSING COMPONENT SKILLS AND COLLECTING CONTEXTUAL DATA © OECD AND THE WORLD BANK 2015
Framework, TIMSS and PIRLS International Study Center, Lynch School of Education, Boston College and International Association for the Evaluation of Educational Achievement, Massachusetts, pp. 33-55.
Howie, S. et al. (2012), PIRLS 2011: South African Children’s Reading Literacy Achievement, Summary Report, Centre for Evaluation and Assessment, University of Pretoria, Pretoria, www.up.ac.za/media/shared/Legacy/sitefiles/file/publications/2013/pirls_2011_report_12_dec.pdf.
Hungi, N. (2011a), Accounting for Variations in the Quality of Primary School Education, SACMEQ, Paris, www.sacmeq.org/?q=publications.
Hungi, N. (2011b), “Characteristics of Grade 6 pupils, their homes and learning environments”, SACMEQ Working Paper, SACMEQ, Paris.
LLECE (2009), SERCE: Segundo Estudio Regional Comparativo y Explicativo: Los Aprendizajes de los Estudiantes de América Latina y el Caribe; Reporte Técnico, (Second International Comparative Study of Student Learning in Latin American and the Caribbean: Technical Report), Office Santiago and Regional Bureau for Education in Latin America and the Caribbean, LLECE, Santiago.
Martin, M.O. et al. (2012), “Creating and interpreting the TIMSS and PIRLS 2011 context questionnaire scales”, in M.O. Martin and I.V.S. Mullis (eds.), Methods and Procedures in TIMSS and PIRLS 2011, TIMSS and PIRLS International Study Center, Chestnut Hill, MA.
Martin, M.O., I.V.S. Mullis and P. Foy (2013), “PIRLS 2016 assessment design and specifications”, in I. V. S. Mullis and M. O. Martin (eds.) PIRLS 2016 Assessment Frameworks, TIMSS and PIRLS International Study Center and IEA, Chestnut Hill, MA and Amsterdam, pp. 57-69.
Messaoud-Galusi, S. et al. (2012), Student Performance in Reading and Mathematics, Pedagogic Practice, and School Management in Doukkala Abda, Morocco, RTI International, North Carolina.
Mullis, I.V.S. et al. (2012a), “Assessment framework and instrument development”, in M.O. Martin and I.V.S. Mullis (eds.), Methods and Procedures in TIMSS and PIRLS 2011, TIMSS and PIRLS International Study Center, Chestnut Hill, MA.
Mullis, I.V.S., et al. (2012b), PIRLS 2011 International Results in Reading, TIMSS and PIRLS International Study Center and IEA, Chestnut Hill, MA and Amsterdam.
OECD (2014a), Call for Tender 100000990 - PISA for Development Strand A and Strand B, OECD, Paris, http://tinyurl.com/prjry24.
OECD (2014b), PISA 2012 Technical Report, OECD Publishing, Paris, www.oecd.org/pisa/pisaproducts/PISA-2012-technical-report-final.pdf.
OECD (2014c), PISA 2012 Results: What Students Know and Can Do (Volume I, Revised edition, February 2014): Student Performance in Mathematics, Reading and Science, OECD Publishing, Paris, http://dx.doi.org/10.1787/9789264208780-en.
OECD (2013a), PISA 2012 Assessment and Analytical Framework: Mathematics, Reading, Science, Problem Solving and Financial Literacy, OECD Publishing, Paris, http://dx.doi.org/10.1787/9789264190511-en.

108 – CHAPTER 4 – CONTEXTUAL DATA COLLECTION INSTRUMENTS USED IN EDUCATIONAL ASSESSMENTS
A REVIEW OF INTERNATIONAL LARGE-SCALE ASSESSMENTS IN EDUCATION: ASSESSING COMPONENT SKILLS AND COLLECTING CONTEXTUAL DATA © OECD AND THE WORLD BANK 2015
OECD (2013b), The Survey of Adult Skills: Reader's Companion, OECD Publishing, Paris, http://dx.doi.org/10.1787/9789264204027-en.
OECD (2009), PISA 2006 Technical Report, OECD Publishing, Paris, http://dx.doi.org/10.1787/9789264048096-en.
OECD (n.d.-a), “PISA 2015 draft questionnaire framework”, www.oecd.org/pisa/pisa products/PISA-2015-draft-questionnaire-framework.pdf (accessed 5 August 2015).
OECD (n.d.-b), “OECD Skills Surveys: PIAAC: Main elements of the survey”, www.oecd.org/site/piaac/mainelementsofthesurveyofadultskills.htm (accessed (20 November 2014).
OECD (n.d.-c), “PIAAC Background Questionnaire: MS version 2.1 d.d. 15-12-2010,” OECD, Paris.
Pierre, G. et al. (2014), STEP Skills Measurement Surveys: Innovative Tools for Assessing Skills, working paper, World Bank Human Development Network, Washington DC.
Purves, A. C. (1987), “The evolution of the IEA: A memoir”, Comparative Education Review 31(1), University of Chicago Press, Chicago, pp. 10–28.
UIS (2009a), WEI Survey of Primary Schools: Technical Report, UNESCO Institute for Statistics, Montreal.
UIS (2009b), The Next Generation of Literacy Statistics: Implementing the Literacy Assessment and Monitoring Programme (LAMP), UNESCO Institute for Statistics, Montreal.
UIS (2006), Literacy Assessment and Monitoring Programme (LAMP) Background Questionnaire (BQ), UNESCO Institute for Statistics, Montreal.
Uwezo (2014), Are Our Children Learning? Literacy and Numeracy across East Africa 2013, Uwezo and Hivos/Twaweza, Nairobi.
Uwezo (2013), Uwezo 2013 Annual Plan and Budget, Uwezo, Nairobi.
Willms, J.D. and L. Tramonte (2014), “Towards the development of contextual questionnaires for the PISA for development study”, OECD Education Working Papers, No. 118, OECD Publishing, Paris, http://dx.doi.org/10.1787/5js1kv8crsjf-en.
Yu, A., and D. Ebbs (2012), “Translation and translation verification”, in M.O. Martin and I.V.S. Mullis (eds.), Methods and Procedures in TIMSS and PIRLS 2011, TIMSS and PIRLS International Study Center, Chestnut Hill, MA.
Zhang, Y., T.N. Postlethwaite and A. Grisay (eds.) (2008), A View Inside Primary Schools: A World Education Indicators (WEI) Cross-National Study, UNESCO Institute for Statistics, Montreal.

CHAPTER 5 – IMPLEMENTATION PROCEDURES AND APPROACHES TO INCLUDING OUT-OF-SCHOOL CHILDREN IN ASSESSMENTS – 109
A REVIEW OF INTERNATIONAL LARGE-SCALE ASSESSMENTS IN EDUCATION: ASSESSING COMPONENT SKILLS AND COLLECTING CONTEXTUAL DATA © OECD AND THE WORLD BANK 2015
Chapter 5
Implementation procedures and approaches to including out-of-school children in educational assessments
This chapter looks at two aspects of large-scale assessments. First, the implementation procedures used by PISA and other assessments, in particular institutional arrangements, sampling methods, data collection, data processing, and standardisation of implementation. In the case of each of the reviewed assessments, the chapter highlights any lessons that may be relevant for PISA for Development (PISA-D). Second, the chapter examines the methods and approaches that some of the reviewed surveys use to include out-of-school children in the assessments and highlights some lessons for PISA-D in this regard.

110 – CHAPTER 5 – IMPLEMENTATION PROCEDURES AND APPROACHES TO INCLUDING OUT-OF-SCHOOL CHILDREN IN ASSESSMENTS
A REVIEW OF INTERNATIONAL LARGE-SCALE ASSESSMENTS IN EDUCATION: ASSESSING COMPONENT SKILLS AND COLLECTING CONTEXTUAL DATA © OECD AND THE WORLD BANK 2015
Implementation procedures
This section discusses the ways the reviewed assessments are implemented, with a view to highlighting any lessons that may be valuable for PISA-D.
Implementation is covered with reference to three different aspects:
• institutional arrangements
• survey implementation (including sampling, and data collection and processing)
• standardisation of survey implementation (including quality assurance).
International institutional arrangements Different assessments employ different structures to support the implementation of
the assessment. In PISA, the PGB is made up of representatives from OECD member countries and countries that have associate status. Generally, representatives from countries that are not OECD members and do not have associate status attend PGB meetings as observers, although countries with long-standing experience in PISA can apply for full membership. The PGB determines PISA’s policy priorities and ensures that these priorities are respected during each implementation.
For IEA studies there is a General Assembly, which provides overall direction for the development and implementation of the assessments. There are also meetings of national research co-ordinators, who guide the operational processes of the assessment.
SACMEQ is run by a consortium of education ministers from the participating countries. The consortium works with the UNESCO International Institute for Educational Planning (IIEP). The IIEP helps the countries design and implement the assessment and analyse the data it produces.
TERCE is organised and co-ordinated LLECE, a network of national education quality assessment directors across Latin America and the Caribbean. LLECE contributes to the global actions adopted by the UNESCO Regional Bureau of Education for Latin America and the Caribbean. These actions aim to ensure the right of all students in the region to have access to quality education. The TERCE pilot test was carried out in 2012 and the main study in 2013. All stakeholders worked together to develop the research tools and training to allow capacity building and the correct use of data.
Generally, the international institutional arrangements for the reviewed large-scale international assessments involve a governing group or steering committee to set overarching policies and priorities, and one or more groups to provide technical guidance.
The household-based surveys also follow this model. One key difference between these surveys is the extent to which external organisations as a whole are enlisted to assist with the more technical aspects of design and implementation. STEP and LAMP both made use of external organisations as a whole (the Educational Testing Service in STEP’s case, and the Educational Testing Service and Statistics Canada for LAMP). ASER and Uwezo prefer to draw on networks of experts and consultants.
For PISA-D, its international institution arrangements will include having observer status on the PGB (OECD, 2014a: 26). PISA-D may also receive advice from other PISA-affiliated boards and groups.

CHAPTER 5 – IMPLEMENTATION PROCEDURES AND APPROACHES TO INCLUDING OUT-OF-SCHOOL CHILDREN IN ASSESSMENTS – 111
A REVIEW OF INTERNATIONAL LARGE-SCALE ASSESSMENTS IN EDUCATION: ASSESSING COMPONENT SKILLS AND COLLECTING CONTEXTUAL DATA © OECD AND THE WORLD BANK 2015
The other international groups in PISA are the Technical Advisory Group, the Subject Matter Expert Groups (SMEGs – one for each cognitive assessment domain), and the Questionnaire Expert Group. Members for these groups are nominated by the international contractors for PISA. The Technical Advisory Group advises on all technical matters, and the Subject Matter Expert Groups and Questionnaire Expert Group prepare the theoretical frameworks.
The existing PISA Technical Advisory Group, with the addition of experts in assessment in developing contexts and in the area of out-of-school youths, will serve as the body that gives technical advice for PISA-D (OECD, 2014a: 28-29).
The Subject Matter Expert Groups and Questionnaire Expert Group for PISA will support PISA-D in a framework and instrument development process facilitated by the OECD Secretariat and the international contractor for the project (OECD, 2014a: 28).
The new international body established to particularly serve PISA-D is called the International Advisory Group. It will be made up of representatives from participating countries, development partners, institutional partners and the OECD. Some experts will also be part of this group. The International Advisory Group’s responsibilities reflect its varied membership. The group will advise the OECD and the PGB on priorities for PISA-D. It will give input into the selection of international contractors for the project and guide project implementation. By representing the interests of the different constituent stakeholders, the International Advisory Group will contribute substantive expertise to the project. It will also be responsible for assessing progress and reviewing expenditure (OECD, 2014a: 28-29).
It would appear that none of the international institutional arrangements for the reviewed assessments include a group with a brief as varied as PISA-D’s International Advisory Group. It is possible that the group’s role may be made even more complex by the fact that a number of separate one-to-one relationships might exist between its different members – individual relationships between development partners and participating countries, for example.
Building capacity in participant countries, and peer-to-peer learning with non-OECD countries that participate in PISA are described as key features of PISA-D (OECD, 2014a: 61). These features will most likely influence the institutional arrangements at the international level.
The international contractor for PISA-D and the International Advisory Group will need to facilitate capacity-building activities. This may require the formation of additional groups or partnerships, perhaps even across PISA and PISA-D boundaries.
National institutional arrangements In PISA, each participating country establishes a national centre, usually within a
government department, university or other research institution. PISA-D is adopting the same model. In addition to establishing a national centre led by a national project manager, PISA-D participating countries will be expected to convene a national committee of experts in assessment and individuals drawn from the education and scientific communities. In each participating country, the national committee will be expected to advise the country representative on the International Advisory Group and the national project manager about the suitability of the data collection instruments, quality control issues and national reporting and dissemination.

112 – CHAPTER 5 – IMPLEMENTATION PROCEDURES AND APPROACHES TO INCLUDING OUT-OF-SCHOOL CHILDREN IN ASSESSMENTS
A REVIEW OF INTERNATIONAL LARGE-SCALE ASSESSMENTS IN EDUCATION: ASSESSING COMPONENT SKILLS AND COLLECTING CONTEXTUAL DATA © OECD AND THE WORLD BANK 2015
All of the reviewed assessments that are undertaken in multiple countries also have a national-level group in their institutional arrangements. There are few instances of an equivalent to the proposed PISA-D national centre. Instead, in each country there is just one national-level group, and this group communicates directly with the country’s representative in the international-level groups.
In several of the reviewed assessments, the national-level division of activities and responsibilities varied from one participating country to the next. For example, in WEI-SPS, in some countries survey operations were outsourced in their entirety to private companies; in other countries staff from ministries or other educational institutions conducted survey operations; and in other countries again the national-level implementation centre hired and trained personnel to undertake survey operations (UIS, 2009a: 55). PISA-D may need to be prepared to accommodate a similar variety of national-level arrangements. There was also some variation in national-level arrangements in LAMP. The LAMP evaluation states that making the different national-level partnerships operational was one of the challenges faced by the national project teams (UIS, 2008).
As mentioned above, the call for tender for the international contractor of Strand A and Strand B of PISA-D emphasises the capacity-building aspect of the project. At the national level, the results of the capacity needs analysis and the capacity-building plan will most likely inform the establishment and scope of work of the national centres.
Implications None of the reviewed surveys included an overall governing body whose composition
and described role is as broad and varied as that envisaged for the PISA-D International Advisory Group. Careful consideration will be needed so that the International Advisory Group can fulfil its broad and varied role and accommodate the interests from the distinctly different stakeholder groups of which it is composed. For example, meetings of subgroups of the International Advisory Group may need to be scheduled to address different stakeholder interests.
PISA-D will need to consider how to best formalise the capacity-building and peer-to-peer learning emphases in institutional arrangements at the international and national levels. For example, partnerships could be established between PISA-D participating countries and PISA countries that have similar capacity needs. PISA-D countries should be encouraged to establish their national centres with a view to getting the most value out of any capacity-building support that is provided.
The roles and responsibilities of the national committee will need to be clearly described, and each participating country given guidance, to ensure that a productive relationship is established between the national committee and the national centre.
In several of the reviewed assessments, the national-level division of activities and responsibilities varied from one participating country to the next. A LAMP evaluation stated that making the different national-level partnerships operational was one of the challenges that countries faced in their implementation. There are likely to be a variety of management arrangements for PISA-D. These might range from full outsourcing of some activities to national centre staff handling everything. PISA-D should consider: how to support national centres to manage in-country relationships; and how to effectively communicate quality assurance requirements so all involved parties understand them.

CHAPTER 5 – IMPLEMENTATION PROCEDURES AND APPROACHES TO INCLUDING OUT-OF-SCHOOL CHILDREN IN ASSESSMENTS – 113
A REVIEW OF INTERNATIONAL LARGE-SCALE ASSESSMENTS IN EDUCATION: ASSESSING COMPONENT SKILLS AND COLLECTING CONTEXTUAL DATA © OECD AND THE WORLD BANK 2015
Survey implementation
Sampling
Target population definition The definition of target population varies across the international assessments
reviewed, depending on the priorities of the assessment as expressed through assessment frameworks. Once the level of education is decided (for example lower secondary, upper primary, lower primary) the population then needs to be defined operationally. The main decision is whether to sample students by age or by grade. Apart from PISA, all the large-scale international surveys reviewed define target populations by grade, with the lowest grade being Grade 2 for PASEC, and the highest grade being Grade 8 for TIMSS. A grade-based population definition is thought to be more appropriate for these surveys, because they are strongly curriculum referenced.
At the same time, the household-based surveys define target populations by age, with the narrowest age range being 6 to 16 years old for Uwezo, and the widest age range being 15 years old and older for LAMP.
PISA aims to test children approaching the end of compulsory schooling. The target population definition is 15-year-old students in Grade 7 or higher who attend educational institutions full-time or part-time, vocational training programmes or other related types of educational programmes, or foreign schools.
PISA includes some countries in which school is not compulsory for 15-year-olds. In some of these countries (such as Croatia and Korea), many 15-year-old children who have not continued in traditional schooling beyond the age at which it ceases to be compulsory can be covered by the PISA target population definition through its interpretation of “school” as including institutions that offer part-time education and vocational education programmes. In other countries (such as Brazil and Mexico), many 15-year-olds are not covered by the definition because they did not continue with any form of education beyond the age of compulsory schooling.
PISA-D will use the same target population definition as PISA. Across the six PISA-D participating countries, school is compulsory until the age of 16 in Senegal; 15 in Cambodia; and 14 in Ecuador, Guatemala, Paraguay and Zambia (OECD, 2014a: 18).
The situation in the PISA-D pilot countries may be similar to that in Brazil and Mexico, in that beyond the age of compulsory schooling there is a notable number of children who are not receiving any kind of education, whether full-time, part-time or vocational. Some of these children may, of course, be covered by PISA-D’s attempts to sample out-of-school children.
An age-based target population definition in PISA-D will have to take into account the grade distribution of 15-year-old children and the age distribution of children in the “national modal grade” for 15-year-olds, both within one participating country and across all participating countries. The national modal grade is the year level attended by most 15-year-olds in a country.
In PISA-D, participating countries may choose to assess 15-year-old students in grades below Grade 7 and out-of-school children, but if countries do choose to assess these populations, the results will not be included in the national results that are reported on the PISA scales – the aim will be to develop an approach and methodology for

114 – CHAPTER 5 – IMPLEMENTATION PROCEDURES AND APPROACHES TO INCLUDING OUT-OF-SCHOOL CHILDREN IN ASSESSMENTS
A REVIEW OF INTERNATIONAL LARGE-SCALE ASSESSMENTS IN EDUCATION: ASSESSING COMPONENT SKILLS AND COLLECTING CONTEXTUAL DATA © OECD AND THE WORLD BANK 2015
assessing these populations rather than to obtain nationally representative results for them (OECD, 2014a: 51). Methods and approaches to include out-of-school children are discussed in section 5.2 of this report.
Sampling approach PISA employs a two-stage stratified sampling methodology. Schools are sampled
first, and within-school units – either classes or students – are sampled second. School exclusions and within-school exclusions are permitted for political, organisational or operational reasons, as long as they do not exceed set limits.
PISA offers flexibility in sampling options so participating countries can investigate in more depth the performance of particular subpopulations of interest. This may be of interest to PISA-D participant countries, who may want to test children who are not 15 years old but who are in the national modal grade for 15-year-olds, if there is a significant number of them.
In PISA, schools are sampled centrally by an organisation contracted by the OECD. Within-school sampling is undertaken by the national centres using software specifically developed for this purpose. To achieve this second-stage sampling, sampled schools are required to submit to accurate and complete lists of children who are eligible to be sampled.
All the reviewed surveys employ a multi-stage sampling methodology. Of the large-scale international surveys:
• SACMEQ samples schools, then sample subsets of children across all classes in the target grades of sampled schools.
• PASEC samples schools, then one classroom (of each grade) is selected among the available classrooms of a particular Grade (2 or 6), and finally students are selected from the list of all students of the classroom.
• LLECE has in the past sampled all children in the target grades in sampled schools, but for TERCE, sampled one classroom per school per grade.
• The IEA studies PIRLS, prePIRLS and TIMSS sample schools, then samples intact classes from the target grades in sampled schools.
• Of the other school-based surveys and the household-based surveys:
EGRA and EGMA sample schools, and sample subsets of students from sampled schools
the household-based surveys sample households, and then sample from individuals within the target population in the sampled households.
It is unclear from the call for tender for the international contractor for PISA-D whether this project will aim to adhere to all of the PISA technical standards that relate to sampling. If PISA-D intends to follow all these technical standards, several questions will need to be addressed for all current and potential PISA-D participating countries:
• Will security issues mean that in some instances a desired target population is not able to cover the entire country?
• Will up-to-date and complete lists of schools be available to form the basis of the school sampling frame?
CHAPTER 5 – IMPLEMENTATION PROCEDURES AND APPROACHES TO INCLUDING OUT-OF-SCHOOL CHILDREN IN ASSESSMENTS – 115
A REVIEW OF INTERNATIONAL LARGE-SCALE ASSESSMENTS IN EDUCATION: ASSESSING COMPONENT SKILLS AND COLLECTING CONTEXTUAL DATA © OECD AND THE WORLD BANK 2015
• Will schools be able to supply complete and up-to-date student lists so the national centres can draw the student samples?
With respect to the impact of security issues on target populations, it’s possible that a country may only be accepted to participate in PISA-D if its security situation is considered stable. This may mean that interested countries with unstable areas cannot be involved. At the same time, participation in PISA is a multi-year process, and situations can change quite dramatically over such a period of time.
With respect to the currency and completeness of lists of schools ASER provides a relevant example. While ASER is a household-based assessment, it also includes a component where test administrators visit schools to record information about facilities and resources and to observe a class. The test administrator is instructed to visit the school attended by most of the children in the village. One of the reasons that schools are not sampled before the testing day is because a complete, up-to-date and official list of schools is not available in India. In particular, many low-cost private schools are not recognised by government.
SACMEQ provides another example of dealing with the issue of currency and completeness of school lists. In SAQMEQ, children are sampled on the day of the test by data collectors (SACMEQ, 2007a). This means that the test administrators can double-check the list on the testing day, but it does place an additional burden on the data collectors.
One of the main reasons ASER tests children in households rather than in schools is because it aims to test all children within the target age range, and testing in school is not the way to access a sample of all children; some children have dropped out of school, others attend but only irregularly, and some have never been enrolled (ASER Centre, 2014). If the situation in some PISA-D countries is similar to that described by ASER in India, the OECD may need to consider the terminology and phrasing it uses to discuss the results from its school-based assessment. Implying that the results give a picture of what all 15-year-olds can do may not be appropriate.
Data collection In PISA, the cognitive assessments are paper-based and computer-based. They are
administered in schools to groups of children, but each child completes the assessment independently. The questionnaires are also paper-based and computer-based. PISA is in the process of transitioning to completely computer-based data collection. The call for tender for the international contractor for Strand A and Strand B of PISA-D states that in this project the instruments will be paper-based (OECD, 2014a: 32).
In terms of how cognitive data are collected, the reviewed surveys can be broadly categorised:
• In several surveys, the cognitive assessment is a paper-based instrument that is administered in schools to groups of children, and each respondent completes the assessment independently by reading questions and recording responses on paper. Surveys that fit this category are PIRLS and prePIRLS, TIMSS, LLECE, SACMEQ and PASEC Grade 6.
• In other surveys, the cognitive assessment is a paper-based or computer-based instrument that is administered one-on-one, either in households or in schools. Within this category, there are:

116 – CHAPTER 5 – IMPLEMENTATION PROCEDURES AND APPROACHES TO INCLUDING OUT-OF-SCHOOL CHILDREN IN ASSESSMENTS
A REVIEW OF INTERNATIONAL LARGE-SCALE ASSESSMENTS IN EDUCATION: ASSESSING COMPONENT SKILLS AND COLLECTING CONTEXTUAL DATA © OECD AND THE WORLD BANK 2015
surveys in which the respondent completes the cognitive assessment independently of the data collector, by independently reading questions and recording responses on paper or entering them into the computer; LAMP, PIAAC and STEP fit this subcategory
surveys in which the data collector delivers the cognitive assessment orally and the respondent gives most, if not all, of his or her answers orally. EGRA, EGMA, ASER, Uwezo and PASEC Grade 2 fit this subcategory. In some administrations of EGRA and EGMA, the student has a paper-based test, but the test administrator collects data using a tablet-based application called Tangerine™.1
These different administration methods for cognitive assessments suit different survey aims and purposes. Group administration is most convenient if members of the target population are expected to be proficient enough to complete an assessment independently, and easily located in naturally occurring groups (such as in schools). Household-based administration may be required if naturally occurring groups of members of the target population cannot be effectively accessed to facilitate group administration. One-on-one oral administration is necessary if some respondents are expected not to be proficient enough to complete an assessment independently. If one-on-one oral administration is used, a tablet-based data collection application such as Tangerine™ is an effective way to reduce recording errors.
In terms of how contextual data are collected, the reviewed surveys can be broadly categorised as:
• surveys in which respondents are asked to complete questionnaires, including PIRLS and prePIRLS, TIMSS, LLECE, SACMEQ, WEI-SPS and PASEC Grade 6; and
• surveys in which respondents are interviewed by data collectors, including EGRA, EGMA, STEP, LAMP, ASER, Uwezo and PASEC Grade 2.
Contextual data collection by interview is less cost-efficient since interviews must be conducted one-on-one, but it is generally considered to lead to lower incidences of missing data and non-response.
With respect to data collection overall, whether this process involves the use of computers or paper-based instruments has implications beyond the test administration. If computers are used, then the subsequent data capture step is not required (as discussed further below).
The process for sourcing individuals to be involved in data collection varies across the reviewed surveys. In the IEA surveys prePIRLS, PIRLS and TIMSS, the sampled schools or the national research co-ordinators appoint school co-ordinators, and the school co-ordinators identify suitable test administrators (Johansone, 2012). In the other reviewed surveys, our understanding is that selecting test administrators is the responsibility of the national centres, their regional delegates, or the local contractor responsible for data collection. An important aspect of ASER and Uwezo is the use of local volunteers for test administration. It has been found that volunteers carry out the tasks assigned to them very effectively (Results for Development, 2015). Sourcing adequate numbers of volunteers is facilitated by partnerships between the national ASER and Uwezo offices and local organisations.2
CHAPTER 5 – IMPLEMENTATION PROCEDURES AND APPROACHES TO INCLUDING OUT-OF-SCHOOL CHILDREN IN ASSESSMENTS – 117
A REVIEW OF INTERNATIONAL LARGE-SCALE ASSESSMENTS IN EDUCATION: ASSESSING COMPONENT SKILLS AND COLLECTING CONTEXTUAL DATA © OECD AND THE WORLD BANK 2015
There are some particular elements of the data collection approaches of SACMEQ and LLECE that may be instructive for PISA-D.
In both surveys, data collection in a school happens over a number of days, with the cognitive and contextual sessions on different days (LLECE, 2010: 37; SACMEQ, 2007b: 58).
SACMEQ III had a student homework form, containing questions that were previously included in the student questionnaire but that children might be better able to answer with the help of family members. This form included questions about parental level of education, home possessions, time taken to get to school, whether or not biological parents were alive and so on. Students took this form home on the first night of the survey administration and were expected to bring it back the next day. This method considerably reduced the number of missing values in the SACMEQ III study compared with previous SACMEQ studies (Hungi, 2011a: 4) .
In LLECE, test administrators have a suggested time for the cognitive sessions, but they are permitted to allow up to ten minutes of additional time if necessary (LLECE, 2010: 37). However, this is no longer the case for TERCE. In SACMEQ, data collectors are also given a suggested time for the testing sessions. They are not obliged to keep to it, however, and it is stated that they can reasonably allow an additional 50% of the actual session time as extra time (SACMEQ, 2007a, 2007b: 57).
At the end of each cognitive session and contextual session, SACMEQ test administrators check each student booklet, and if they see any items that have not been completed, they ask the student to complete them (SACMEQ, 2007a: 23).
In SACMEQ I, Zambia had significant non-response rates, for reasons that were not always clear from the records submitted by the test administrators. In the Luapula region, for example, 4 of the 15 schools selected in the sample either refused to participate or were not visited by the data collectors. Further non-response occurred in Luapula because 10% of the pupils in the remaining 11 schools were absent on the day of testing (Nkamba and Kanyika, 1998). In SACMEQ III there were major data losses due to the loss of data collection instruments. In the end, information was only obtained from 61% of selected schools (Musonda and Kaba, 2011). These rates of non-response and data loss were not reflected in other SACMEQ countries.
Data processing
Coding In PISA-D, coding for constructed response items will be undertaken within the
participating countries. Different procedures will ensure coding quality, including coding verification by expert coders and a coder reliability study across all participating countries (OECD, 2014a: 43).
PISA is not only careful to ensure coding quality for cognitive data, but also for occupation data. In past PISA cycles, countries have been given the option of incorporating double coding of occupation data in their internal training processes.
In regard to coding, the reviewed surveys appear to expend considerable time and resources on coding training and coding itself, including the steps taken to confirm that coding is being undertaken with acceptable reliability.

118 – CHAPTER 5 – IMPLEMENTATION PROCEDURES AND APPROACHES TO INCLUDING OUT-OF-SCHOOL CHILDREN IN ASSESSMENTS
A REVIEW OF INTERNATIONAL LARGE-SCALE ASSESSMENTS IN EDUCATION: ASSESSING COMPONENT SKILLS AND COLLECTING CONTEXTUAL DATA © OECD AND THE WORLD BANK 2015
In PIRLS, prePIRLS and TIMSS, comprehensive coder training is provided. Responses to use in coder training are obtained from real children. In prePIRLS, the responses were obtained from children in Botswana, South Africa and the United States of America. The IEA studies use a qualification database that includes responses from previous cycles of the assessment and the codes assigned to those responses. The current year’s coders are required to code these responses from previous years. They cannot begin coding current year responses until a specified level of agreement with the codes assigned to responses from previous years has been achieved. Studies of coding reliability within the current year and across previous years are conducted in each participating country. Cross-country reliability studies are also conducted. All of these studies use software developed specifically for the purpose by IEA’s Data Processing and Research Centre.
In LLECE, coder training is provided centrally to national representatives, who are then expected to replicate the training with their national coding teams in their own countries. Responses to constructed response items are coded twice.
In EGRA and EGMA, coding is undertaken at the time of test administration, and coding training forms part of test administrator training. Organisations implementing EGRA and EGMA are advised to investigate and improve inter-rate reliability during the training (RTI International and International Rescue Committee, 2011).
In PIAAC, participating countries that used a paper-based assessment were required to undertake in-country reliability studies in both the field trial and the main survey. In these studies, a predefined number of responses were coded by a second coder, and the level of agreement had to be at least 95%. Cross-country reliability studies were also conducted to identify any systematic coding bias across countries. In these studies, bilingual coders coded responses in source booklets in English and in the national language booklets. Codes were compared across languages and also to the scores assigned to the same responses by master coders (OECD, 2013a: 59).
STEP employs similar systems as PIAAC for training in coding and for coding evaluation (Pierre et al., 2014: 61).
In LAMP, the UIS trained a chief coder for each country, and this coder trained all national coders (UIS, 2004: 38). UIS also specified amounts of material that had to be double coded within countries. One hundred per cent of tests had to be double coded during the field trial. In addition, a sample of responses from each country was coded by an international coder to ensure no bias at the country level (UIS, 2009b: 40).
In PASEC, this operation is performed by a group of coder and data entry clerks that are recruited and trained by the national team with support from PASEC technical advisors in the country. The technical advisor presents the patterns of the responses for each instrument to the data entry clerks. A manual of all coding instructions for all multiple choice questions is given to the data entry clerks.
The manual for the national research co-ordinator for SACMEQ III (see SACMEQ, 2007b) does not mention coding at all, which suggests that this survey has opted to not include test or questionnaire items that require human coding.
Data capture In regard to data capture, if the reviewed surveys use paper-based administration,
human data entry is undertaken at the country level using a standard application

CHAPTER 5 – IMPLEMENTATION PROCEDURES AND APPROACHES TO INCLUDING OUT-OF-SCHOOL CHILDREN IN ASSESSMENTS – 119
A REVIEW OF INTERNATIONAL LARGE-SCALE ASSESSMENTS IN EDUCATION: ASSESSING COMPONENT SKILLS AND COLLECTING CONTEXTUAL DATA © OECD AND THE WORLD BANK 2015
developed specifically for the purpose. For surveys that use computer-based administration, there is no separate data capture step following test administration. One exception to this is EGRA and EGMA, in which the test instrument is paper-based, but in many administrations the data collectors record children’s responses using a tablet-based application (as mentioned above).
For the surveys that use human data entry, there is some variation among types of data entry software. PIRLS, prePIRLS and TIMSS all use IEA’s own WinDEM software application (Johansone, 2012: 14-15). In WEI-SPS, countries were also encouraged to use WinDEM (UIS, 2009a: 63). LLECE and ASER both use Access-based data entry applications (LLECE, 2010: 45; W. Wadhwa, personal communication, 8 August 2014). Uwezo uses Stata (Uwezo, 2013a: 1). The guidelines for planning and implementing EGRA suggest programmes such as Excel, Access, CS Pro and FileMaker can be used for data entry. These guidelines recommend that implementing organisations consider the balance between, on the one hand, giving local personnel longer-lasting and more applicable skills, which may be better achieved with simpler data entry processes developed in common software such as Excel; and, on the other hand, applying an adequate level of rigour to data entry, which may be better achieved using a more complex software but one that local personnel might have difficulty using and might never be required to use again (RTI International and International Rescue Committee, 2011: 62-63).
None of the surveys that make use of paper-based data collection appear to use scanning rather than human data entry.
All of the reviewed large-scale international surveys require some percentage of data to be entered twice as a means of verifying the quality of data entry. With respect to this data verification step, in PIRLS, participating countries and benchmarking entities are required to double-enter 5% of their data, but in the case of South Africa’s participation in PIRLS 2011, this amount was increased to 100%, based on experience in previous studies (Howie et al., 2012: 26). SACMEQ requires 100% of data from tests and questionnaires to be entered twice (SACMEQ, 2007b: 63).
The call for tender for the international contractor for Strand A and Strand B of PISA-D suggests that this project will follow a similar model to PISA for data capture. That is, this activity will be the responsibility of in-country teams, but they will use software developed by the international contractor and they will be trained by the international contractor to use this software (OECD, 2014a: 44). The call for tender does not mention whether there will be any requirements for double data entry in PISA-D.
Data cleaning If PISA-D follows the same model as PISA, participating countries will complete
some initial data validation before submitting their data to the international contractor. The international contractor will then undertake data cleaning according to standardised procedures. In PISA, data cleaning is a comprehensive iterative process that can involve several weeks of backwards and forwards communication between the international contractor and the national centre of a participating country.
In regard to data validation and cleaning, from the available information it appears that for many of the reviewed surveys these activities also follow a similar model to PISA. In this model, preliminary data validation is undertaken at the country level, and more comprehensive data cleaning is undertaken centrally.

120 – CHAPTER 5 – IMPLEMENTATION PROCEDURES AND APPROACHES TO INCLUDING OUT-OF-SCHOOL CHILDREN IN ASSESSMENTS
A REVIEW OF INTERNATIONAL LARGE-SCALE ASSESSMENTS IN EDUCATION: ASSESSING COMPONENT SKILLS AND COLLECTING CONTEXTUAL DATA © OECD AND THE WORLD BANK 2015
For a number of the reviewed surveys that use paper-based data collection, data validation checks are built into the standardised data entry application. This step actually begins before human data entry, when data collection sheets are checked for completeness and correctness at the time of or immediately after administration.
In SACMEQ, data collectors are expected to spend some time checking all test booklets and questionnaires for missing and discrepant data, and make attempts to rectify any issues before leaving the school. The SACMEQ III data collector’s manual describes the required checks. The full set of checks is quite considerable, and includes not only checks for missing data, invalid values and discrepant combinations of values within particular instruments, but also checks across different instruments (SACMEQ, 2007a: 43-50).
PASEC technical advisors build some macros to check the patterns of the responses, duplicates, the way the filter questions have been filled in, the expected values for the variables, and the concordance of students’ participation between students tracking forms and tests data. This step usually leads to more data entry at the national level. A procedures manual has been developed and provides all the details of data cleaning. At this step, the sampling coverages are calculated, together with other indicators such as the weighted and non-weighted participation rates. PASEC uses the rules of PISA to classify countries regarding the reliability of the data collected. Replicate weights (a series of variables that contain the information necessary for correctly computing (via the replicate weight method) the standard errors of point estimates when analysing survey data) are also generated at the end of this process.
Implications We suggest that the OECD should consider subnational participation arrangements so
that countries with stable and unstable areas might be able to participate in PISA-D.
Deliberation will be needed to work out how a school sampling frame that satisfies PISA’s technical standards will be constructed in countries where complete and up-to-date lists of schools are not maintained. Of note is that among the surveys reviewed, ASER eschews school sampling because such complete and up-to-date lists of schools do not exist.
The OECD could consider whether PISA’s approach to student sampling is appropriate in contexts where schools do not maintain complete and up-to-date lists of students. Notably among the surveys reviewed, SACMEQ has test administrators sample students on the day of the assessment, which gives them an opportunity to double-check the student list on the testing day.
In terms of data collection, we suggest that the OECD considers whether any of the following approaches may be appropriate to incorporate into PISA-D:
• interview sessions to collect contextual data from respondents other than students (such as principals and teachers), perhaps using a tablet-based data collection tool to eliminate recording errors
• cognitive test administration over multiple days (as done in LLECE and SACMEQ)
• permitting extra time to complete cognitive assessments (as done in LLECE and SACMEQ)

CHAPTER 5 – IMPLEMENTATION PROCEDURES AND APPROACHES TO INCLUDING OUT-OF-SCHOOL CHILDREN IN ASSESSMENTS – 121
A REVIEW OF INTERNATIONAL LARGE-SCALE ASSESSMENTS IN EDUCATION: ASSESSING COMPONENT SKILLS AND COLLECTING CONTEXTUAL DATA © OECD AND THE WORLD BANK 2015
• establishing on-site test administrator checks of student booklets to reduce the incidence of missing data (as done in SACMEQ)
• sourcing test administrators who are local to test administration sites as a means of securing community engagement and buy-in (as done in ASER and Uwezo).
If the OECD intends to confirm coding reliability within and across PISA-D countries, it may be useful to follow the approach used by IEA, in which responses and their codes are pre-loaded into a database.
The platform and complexity of the data capture software that is provided to participating countries will be central to ensuring that data capture activity adequately serves the project’s aims for sustainable capacity development. The guidelines for planning and implementing EGRA raise this issue (see RTI International and International Rescue Committee, 2011: 62-63).
We suggest considering more stringent requirements for double data entry than are currently implemented in PISA. SACMEQ requires all countries to double-enter 100% of test and questionnaire data. The most recent PIRLS cycle required South Africa to double-enter 100% of its data.
In relation to data cleaning, it may be advantageous for PISA-D to include data validation steps for test administrators to carry out before they leave the schools, as is done in SAQMEQ. Including these steps may simplify processes and reduce subsequent data cleaning activities.
Standardising implementation
Articulation of standards PISA has a range of technical and operational standards that are articulated in a
specific standards document. These standards cover aspects of implementation that have a direct impact on data quality, management standards that address operational objectives, and national involvement standards (OECD, n.d.: 4-5). PISA also produces comprehensive manuals to support countries to conduct survey operations in adherence to the standards.
In most of the reviewed surveys, standards are also typically articulated through specific standards documentation, or through the instructional materials prepared to guide implementation. The following details may be of particular interest to PISA-D.
The WEI-SPS technical report highlights the difficulty in establishing standardised procedures when the participating countries are geographically, culturally and economically diverse. The report states that the WEI-SPS standardised processes were refined after the pilot, and that countries were still able to deviate from them with approval (UIS, 2009a). This flexibility may be something that PISA-D will need to consider.
In LAMP, standards were articulated in the memorandum of understanding that each participating country signed with UIS (UIS, 2009b). In STEP, the standards are articulated in the National Survey Design Planning Report that each participating country was required to complete (for example, see World Bank, 2013). These documents are specific to each participating country rather than general to all participating countries. Incorporating at least some of the standards into a memorandum of understanding or

122 – CHAPTER 5 – IMPLEMENTATION PROCEDURES AND APPROACHES TO INCLUDING OUT-OF-SCHOOL CHILDREN IN ASSESSMENTS
A REVIEW OF INTERNATIONAL LARGE-SCALE ASSESSMENTS IN EDUCATION: ASSESSING COMPONENT SKILLS AND COLLECTING CONTEXTUAL DATA © OECD AND THE WORLD BANK 2015
survey implementation plan may be an effective way to ensure that participating countries are fully aware of their responsibilities with respect to the standards.
Uwezo publishes a standards document online that covers survey implementation and also behavioural standards for the different roles in the initiative (see Uwezo, 2012). This document is a distillation not only of the “nuts and bolts” of the survey, but also of its underlying values.
Training In PISA, national representatives are trained at international training sessions, and
where necessary, these national representatives then train their in-country personnel. The call for tender for the international contractor for Strand A and Strand B of PISA-D suggests that PISA-D will follow the same approach as PISA.
With respect to training, all the reviewed surveys follow some kind of cascade training model similar to that used in PISA. In the case of the large-scale international surveys, the institution with overall responsibility for the survey trains national co-ordinators centrally. These national co-ordinators or administrators take on the role of trainers for others at the national level as required.
At the international level, training typically covers everything from coding and data management, to translation and adaptation (if applicable), test design and development, sampling, and analysing national data.
Angola’s Ministry of Education is participating in SACMEQ IV as an observer (SACMEQ, 2013). Representatives from this ministry attend international-level SACMEQ training.
SACMEQ and PASEC have delivered a number of workshops for participants (SACMEQ, 2015a). The International Institute for Educational Planning has also prepared training modules (SACMEQ, 2015b). These training modules are a useful general resource – new SACMEQ participants could use them to become familiar with the key aspects of survey design and implementation before they delve into the more specific details of the SACMEQ project.
In the reviewed surveys, the number of tiers of training at the national level varies. This depends on features of the survey, including the sample size (and therefore required number of data collectors), geographical scope and languages of test administration. In regard to data collection training in particular, the SACMEQ adopts a training approach in which regional research co-ordinators and team leaders are hired and trained centrally. These regional research co-ordinators then host training for data collectors within their respective regions (SACMEQ, 2007b). LLECE also has a broad capacity development programme.
The household-based surveys ASER and Uwezo also incorporate multiple levels of training below the national level. In ASER, the national ASER Centre staff are trained through a national workshop. These staff members go on to train master trainers at state workshops. The master trainers then train volunteer data collectors at district workshops (ASER Centre, 2014). In Uwezo, key facilitators are trained at the national level. Key facilitators are responsible for training master trainers, who themselves train district co-ordinators, who train volunteer data collectors (Uwezo, 2012). These two household-based assessments incorporate multiple levels of training below the national level for the reasons given above (sample size, geographical scope and languages of test

CHAPTER 5 – IMPLEMENTATION PROCEDURES AND APPROACHES TO INCLUDING OUT-OF-SCHOOL CHILDREN IN ASSESSMENTS – 123
A REVIEW OF INTERNATIONAL LARGE-SCALE ASSESSMENTS IN EDUCATION: ASSESSING COMPONENT SKILLS AND COLLECTING CONTEXTUAL DATA © OECD AND THE WORLD BANK 2015
administration), but also because the surveys aim to always use local volunteers to collect data at each survey administration site.
In Uwezo, representatives from each of the three countries (Kenya, Tanzania and Uganda) observe and participate in cross-country training, as a way of ensuring that best practices are shared (Uwezo, 2012: 13).
For many of the reviewed surveys, data collectors and supervisors are given the opportunity – during training or during a field trial – to participate in in-the-field practice of the elements of survey administration in which they play a role. Elements might include, for example, sampling children or households, administering the survey or completing data collection sheets. Offering this practice in the field is an important step in ensuring the data collectors fully understand their responsibilities and have been adequately trained in executing them. Ideally, the data collectors should be supervised during this in-the-field practice and given an opportunity to debrief, so that any difficulties or issues that were encountered can be fully discussed.
In SACMEQ, the in-the field practice itself follows the cascade model: at the national training, experienced regional research co-ordinators demonstrate test administration at the trial schools, and team leaders and other regional research co-ordinators observe and take notes. At the regional training, experienced team leaders then demonstrate test administration and the data collectors observe and take notes. The SACMEQ regional training sessions typically occur in the week immediately before the main data collection (SACMEQ, 2007b: 52-53).
In most of the reviewed international large-scale surveys there are two levels of instructional documentation: one level for the national co-ordinator of the assessment, and another level for the data collectors. Both levels of documentation are generally prepared by the institution with overall responsibility for the survey and translated for national use if necessary.
The IEA PIRLS and TIMSS studies present national-level instructional material in units. For the surveys in 2011, there were seven separate units for sampling, field trialling, contacting schools and sampling classes, preparing materials for data collection, collecting data, scoring, and creating data files. The units are released at key points in the survey timeline. Some units were supplemented by other manuals (such as for test administrators) or IEA-developed software (Martin and Mullis, 2012). Releasing instructional materials in units may make the large quantity of information more easily digestible, while still enabling national-level staff to get a sense of the coherent whole.
The manual for the national research co-ordinator for SACMEQ III contains a comprehensive and easy-to-read timetable of activities. This timetable gives a clear overview of the full range of responsibilities at the national level (see SACMEQ, 2007b: 9-13).
Uwezo prepares manuals to support trainers of test administrators, as well as manuals and workbooks for test administrators themselves (see, for example, Uwezo, 2013b). Much like Uwezo’s standards document (mentioned above), these materials serve an informational purpose but also reflect the survey’s underlying values and ideology in an effective way.
PASEC is preparing a procedure manual for 2016.

124 – CHAPTER 5 – IMPLEMENTATION PROCEDURES AND APPROACHES TO INCLUDING OUT-OF-SCHOOL CHILDREN IN ASSESSMENTS
A REVIEW OF INTERNATIONAL LARGE-SCALE ASSESSMENTS IN EDUCATION: ASSESSING COMPONENT SKILLS AND COLLECTING CONTEXTUAL DATA © OECD AND THE WORLD BANK 2015
Quality assurance The call for tender for the international contractor for Strand A and Strand B of
PISA-D refers to the “stringent quality-assurance mechanisms that are applied to test design, translation, sampling and data collection” in PISA (OECD, 2014a: 18). Monitoring activities, outcomes and outputs against the articulated standards is a central part of this quality assurance.
Most of the reviewed surveys have at least some quality assurance mechanisms in place. The mechanisms related to translation and adaptation, coding, and data management have been discussed in earlier parts of this document. One other key aspect of quality assurance is the monitoring of the data collection activities.
In the reviewed surveys, the quality of the data collection activities is monitored via the following avenues:
• Selected survey administrations are monitored by international quality monitors appointed by the institution with overall responsibility for the survey – prePIRLS, PIRLS, TIMSS, LLECE.
• Selected survey administrations are monitored by national quality monitors associated with or employed by the national project team – prePIRLS, PIRLS, TIMSS, SACMEQ, LLECE, PASEC.
• Monitoring supervisors complete administration reports that highlight any observed deviations from standardised administration – prePIRLS, PIRLS, TIMSS, SACMEQ, LLECE, PASEC.
• Data are checked soon after administration, and re-survey is undertaken in instances where issues are identified – ASER, Uwezo.
• National project teams summarise information from monitoring supervisors and include the summary in documents submitted to the institution with overall responsibility for the survey – prePIRLS, PIRLS, TIMSS, SACMEQ, LLECE, PASEC.
The quality of data collection is most effectively monitored by individuals who are familiar with the survey and the context in which it operates, but who have some level of independence from the survey administration team.
If quality issues are identified during or soon after data collection through a rigorous and independent monitoring process, then the survey has the best possible opportunity to take the necessary remediation steps.
Another key aspect of quality assurance is maintaining the security of the test materials. This appears to be of particular concern for SACMEQ and PASEC. The manuals for the national research co-ordinator and the data collectors include numerous “warning boxes” reminding readers of the importance of maintaining the materials’ security. Steps to maintain this security include (SACMEQ, 2007a, 2007b):
• advising national centre staff that the test should not be distributed to printers when requesting quotes for printing
• encouraging regional research co-ordinators to collect their own bundles of materials from the national centre

CHAPTER 5 – IMPLEMENTATION PROCEDURES AND APPROACHES TO INCLUDING OUT-OF-SCHOOL CHILDREN IN ASSESSMENTS – 125
A REVIEW OF INTERNATIONAL LARGE-SCALE ASSESSMENTS IN EDUCATION: ASSESSING COMPONENT SKILLS AND COLLECTING CONTEXTUAL DATA © OECD AND THE WORLD BANK 2015
• reminding the national research co-ordinators that it is ultimately their responsibility to track any packages that have been dispatched from their offices
• impressing on data collectors that after test administration all materials must be taken away from schools, and that if tests are left in the hands of teachers at schools, they will most likely be used in class
• impressing on data collectors that they cannot let anyone copy the test materials.
Implications In relation to standards articulation, we suggest that the PISA-D should carefully
consider whether at least some standards should be articulated in a memorandum of understanding or project implementation plan as well as in a dedicated standards document. Including the standards in documents that are specific to each participating country, rather than general documents, may be effective as a means of ensuring that each country is fully aware of its responsibilities with respect to the standards. LAMP and STEP both articulate their standards within the national project implementation plans.
We also suggest that the OECD considers how the description of standards can be used as an opportunity to reflect PISA-D’s underlying values and ideology in a way that will help to secure local commitment to the project and acceptance of its results. Of note among the surveys reviewed, Uwezo does this effectively.
In relation to training, the reviewed large-scale international surveys accommodate a variety of country capacities within a standardised international-level training module. Generally, this information is not available in the public documentation for the surveys, so further questioning of the institutions responsible for the surveys may be required. PISA-D training processes will need to balance this standardised training with specific targeted training that is tailored based on the findings of the capacity needs analyses.
In relation to quality assurance, further information is required from SACMEQ, PASEC and LLECE about their quality assurance processes, particularly those related to assuring the quality of test administration. These surveys may be able to highlight common risks and pitfalls that will be instructive for PISA-D.
Methods and approaches to include out-of-school children
PISA makes no attempt to assess out-of-school children. The summary record from the first meeting of PISA-D’s International Advisory Group states that PISA-D will not aim to complete a system-wide assessment of out-of-school children, but will “explore approaches to addressing out-of-school 15-year-olds, including building on existing initiatives and piloting sampling methods, test items and background questionnaires on smaller convenience samples” (OECD, 2014b: 5).
In preparing this section, the Technical Strand 3 expert paper (see Carr-Hill, 2015) and the presentations from the subsequent workshop in October 2014 (see OECD, 2014a, 2014b, 2014c, 2014d, 2014e, 2014f) have been taken as the most complete description of the point reached in the planning for how out-of-school children will be accommodated in PISA-D.
The Technical Strand 3 expert paper and the presentations from the October workshop address issues of:
• counting and locating out-of-school children

126 – CHAPTER 5 – IMPLEMENTATION PROCEDURES AND APPROACHES TO INCLUDING OUT-OF-SCHOOL CHILDREN IN ASSESSMENTS
A REVIEW OF INTERNATIONAL LARGE-SCALE ASSESSMENTS IN EDUCATION: ASSESSING COMPONENT SKILLS AND COLLECTING CONTEXTUAL DATA © OECD AND THE WORLD BANK 2015
• finding and identifying out-of-school children
• sampling out-of-school children, persuading them to participate and administering the test
• the design and development of appropriate instruments.
This section uses the same structure, but several subtopics have been merged.
Counting, locating, finding, identifying and sampling out-of-school children As mentioned above, PISA makes no attempt to include out-of-school children, and
PISA-D is adopting an exploratory approach to this aspect of the project.
Of the reviewed surveys, only PIAAC, STEP, LAMP, ASER and Uwezo include out-of-school children. They achieve this by having target population definitions that are age-based and make no reference to the enrolment/schooling status of individuals.
All five of these assessments sample households. STEP samples households in urban areas only. LAMP, PIAAC and Uwezo sample households across the participating countries, in both urban and rural areas. ASER samples households in rural districts only. In ASER, households are sampled on the day of testing by the test administrators.
Of note from the reviewed surveys is information about how often problems occur with outdated sampling frames, and how these problems are dealt with. These frames may be at the household level or be of sampling units above household level, such as villages, as in the case of ASER.
Note that each of the reviewed household surveys has a reasonably broad age range in the population definition. The narrowest range is Uwezo, with an age definition of 6 to 16 years old. This means that most sampled households will include a respondent within the target age range.
Since the reviewed household-based surveys all sample households and have broad age ranges in their target population definitions, none of them really faces the methodological issues that will be faced by PISA-D as it tries to include children who are both out-of-school and 15 years old. One presentation from the workshop on out-of-school children suggests that PISA-D should adopt direct and indirect aspects. For the direct aspect, an attempt will be made to develop household lists from which 15-year-old out-of-school children can be sampled. For the indirect aspect, attempts will be made to access 15-year-old out-of-school children by contacting employers (OECD, 2014f).
The presentations from the workshop on out-of-school children note that in urban slum areas it may be difficult to establish a household list because it may be difficult to distinguish between households. In this regard, Uwezo tests children in urban areas, some of which would qualify as informal settlements or slums.
Regarding an approach that involves sampling households and testing children in households, as mentioned in the Strand 3 Technical Paper, ASER’s procedures are relevant. ASER has specific instructions for test administrators about how to deal with a physical house that seems to house more than one family (as indicated by multiple kitchens). ASER also includes instructions on how to access children who may be shy because they cannot read, and even how to access older children who may not be considered children within their families (see ASER Centre, 2014: 17, 19). This information may be useful for PISA-D.

CHAPTER 5 – IMPLEMENTATION PROCEDURES AND APPROACHES TO INCLUDING OUT-OF-SCHOOL CHILDREN IN ASSESSMENTS – 127
A REVIEW OF INTERNATIONAL LARGE-SCALE ASSESSMENTS IN EDUCATION: ASSESSING COMPONENT SKILLS AND COLLECTING CONTEXTUAL DATA © OECD AND THE WORLD BANK 2015
It may be possible for PISA-D to develop an efficient and effective way to access 15-year-old out-of-school children in households. However, if the survey administration is limited to households (according to the traditional notion), then the project’s stated aim of inclusiveness may not be adequately satisfied. This is because any household-based sampling methodology will not reach the most vulnerable and marginalised out-of-school children, because these children are typically not found in households. This issue is addressed in the Strand 3 Technical Paper for PISA-D, which discusses the subpopulations that are omitted from household surveys by design and in practice. Subpopulations omitted by design include: institutionalised populations and displaced populations living in, for example, refugee camps; the homeless; and mobile, nomadic or pastoralist populations. Subpopulations that are under-represented in practice include individuals in fragile, disjointed or multiple occupancy households; urban slum populations; populations living in areas that pose a security risk to visit; and individuals who are marginalised in their households because of illegality or stigma (Carr-Hill, 2015). If PISA-D wishes to collect information about any of these out-of-school children who are typically not found in households, then an alternative method to a traditional household sampling method will need to be employed.
Surveys such as the UNICEF-UIS Out-of-School Children Initiative may be helpful in suggesting approaches to locating, finding, identifying and sampling out-of-school 15-year-olds for PISA-D (OECD, 2014c).
Persuading out-of-school children to participate The Strand 3 Technical Paper emphasises the fact that obtaining a sample is only one
of the steps that PISA-D will need to consider if it is going to attempt to include out-of-school children in the survey. After out-of-school children have been found, identified and sampled, they must be persuaded to take part in the assessment, and the assessment must be appropriately targeted and appropriately administered.
This fact is also highlighted by the OECD’s depiction of the out-of-school aspect of PISA-D as exploratory not only in terms of sampling, but also in terms test and questionnaire administration.
In each of PIAAC, STEP, LAMP, ASER and Uwezo, the survey is administered one-on-one to individuals in each sampled household. None of these surveys offers participation incentives; incentives may be required for PISA-D (OECD, 2014c). One way ASER and Uwezo keep administrative costs down is by using volunteer test administrators. It would most likely not be appropriate to offer incentives to respondents and to use volunteer test administrators.
Survey administration needs to occur at the time at which children are most likely to be available. ASER and Uwezo administer their surveys on the weekends, and PIAAC, STEP and LAMP administer their surveys in the evenings.
It is necessary that administrators obtain the buy-in of parents and children to the survey. At the beginning of an EGRA/EGMA administration, the test administrator reads the child some information about the survey and requests consent. The administration does not go ahead if the child does not give verbal consent (RTI International and International Rescue Committee, 2011). As noted previously, ASER and Uwezo use local volunteers who are more familiar with the area and are better at gaining the trust of the respondents and their families (ASER Centre, 2014; Uwezo, 2014). Uwezo and ASER both impress on their volunteers the importance of approaching the households politely
128 – CHAPTER 5 – IMPLEMENTATION PROCEDURES AND APPROACHES TO INCLUDING OUT-OF-SCHOOL CHILDREN IN ASSESSMENTS
A REVIEW OF INTERNATIONAL LARGE-SCALE ASSESSMENTS IN EDUCATION: ASSESSING COMPONENT SKILLS AND COLLECTING CONTEXTUAL DATA © OECD AND THE WORLD BANK 2015
and giving the household members adequate information about their work before requesting to test children (ASER Centre, 2014; Uwezo Kenya, 2013). Additionally, Uwezo volunteers report children’s results back to parents – in a sensitive way – immediately after the assessment (Uwezo Kenya, 2013).
As discussed in earlier sections, the language of the test administration is significant. In ASER, out-of-school children are allowed to choose the language in which to complete the reading assessment. In Uwezo, all children are allowed to receive the instructions for the mathematics test in whichever language they are most comfortable using.
Administering appropriate test and questionnaire instruments It will be essential for PISA-D to use test and questionnaire instruments that are
appropriate for out-of-school children. In the context of using appropriate cognitive instruments, a number of points from the reviewed surveys are relevant. EGRA, EGMA, ASER, Uwezo run tests orally and one-on-one, which means that the testee cannot skip tasks. PIAAC, STEP and LAMP all use adaptive testing. In PIAAC, the computer-based assessment is adaptive. In STEP, the second element of the reading test acts as a screening test, and the assessment terminates if the respondent does not pass the screening test. LAMP uses a filter test, which diverts respondents with lower performance and respondents with higher performance to different modules of the main test. ASER and Uwezo also use adaptive testing, but on a much simpler level. In these assessments the administrations starts at a task of middle difficulty, then progresses either up or down depending on how the child performs on that first task. PIAAC, STEP, LAMP, ASER, Uwezo, EGRA and EGMA all include at least some items to test foundational literacy skills and, if they form part of the assessment, numeracy skills as well.
One of the presentations from the workshop on out-of-school children describes how tests used for the out-of-school 15-year-old population need to be targeted at both children who have completed primary school and at children who have never been to school. SACMEQ and PASEC items may be appropriate for children who completed primary school. Items oriented to testing more foundational skills (such as items from ASER or Uwezo) may be appropriate for children who have never been to school. Even more basic pictorial-type items should also be considered for children who have never been to school. A set of channels or gateways will need to be applied to reduce the risk of over-burdening the volunteer test administrators (OECD, 2014e).
In regard to using appropriate contextual instruments, it is relevant that many of the reviewed surveys collect contextual data via interview and observation rather than by leaving the respondent to complete a questionnaire independently. This may be an option worth considering for PISA-D, not only because it may reduce the incidence of missing data, but also because it may be particularly appropriate if questionnaire respondents have limited literacy. In this regard, ASER and Uwezo include questions that address children’s out-of-school status. Also of note is Jangandoo, a survey that was not included in the reviewed assessments but that may be of interest to PISA-D. Jangandoo is a household-based assessment in the ASER model administered in Senegal. Jangandoo includes questions about out-of-school children (asked to their parents).3
Implications We suggest that the OECD seeks input from ASER and Uwezo, and perhaps the other
household-based assessments, to discuss how often they encounter problems with outdated sampling frames and how these problems are dealt with.

CHAPTER 5 – IMPLEMENTATION PROCEDURES AND APPROACHES TO INCLUDING OUT-OF-SCHOOL CHILDREN IN ASSESSMENTS – 129
A REVIEW OF INTERNATIONAL LARGE-SCALE ASSESSMENTS IN EDUCATION: ASSESSING COMPONENT SKILLS AND COLLECTING CONTEXTUAL DATA © OECD AND THE WORLD BANK 2015
We also suggest that the OECD seeks input from ASER (and perhaps Uwezo) about how to deal with multiple-occupancy households, and how to approach children who might be shy because they cannot read, and children who are perhaps considered adults in their households.
In regard to persuading out-of-school children to participate, it would be instructive to review the ways ASER and Uwezo obtain local buy-in to the survey and to consider whether any of their approaches may be applicable for the PISA-D out-of-school children strand.
In regard to administering appropriate test and questionnaire instruments, it would be appropriate for the OECD to investigate an adaptive design for testing out-of-school children; but adaptive test administration can place more demands on test administrators.
Notes
1. See www.tangerinecentral.org/home.
2. For ASER, many of these partnerships are with district institutes for education and training (ASER Centre, 2014). For Uwezo, the partnerships are with all kinds of institutions that have an interest in education, a belief in citizen agency and a presence in the districts in which the districts in which they will be administering the survey (S. Ruto, personal communication, 31 August 2014).
3. The Jangandoo household questionnaire can be downloaded from www.lartes-ifan.gouv.sn/lartes/pdf/__Questionnaire_Mu00E9nage_enfants MARS 2014 REMPLI.pdf. Questions about out-of-school children are on page 8.

130 – CHAPTER 5 – IMPLEMENTATION PROCEDURES AND APPROACHES TO INCLUDING OUT-OF-SCHOOL CHILDREN IN ASSESSMENTS
A REVIEW OF INTERNATIONAL LARGE-SCALE ASSESSMENTS IN EDUCATION: ASSESSING COMPONENT SKILLS AND COLLECTING CONTEXTUAL DATA © OECD AND THE WORLD BANK 2015
References
ASER Centre (2014), Annual Status of Education Report (Rural) 2013, ASER Centre, New Delhi.
Carr-Hill, R. (2015), “PISA for Development Technical Strand C: Incorporating out-of-school 15- year-olds in the assessment”, OECD Education Working Papers, No. 120, OECD Publishing, Paris, http://dx.doi.org/10.1787/5js0bsln9mg2-en.
Hungi, N. (2011a), Accounting for Variations in the Quality of Primary School Education, SACMEQ, Paris, www.sacmeq.org/?q=publications.
Johansone, I. (2012), “Operations and quality assurance”, in M.O. Martin and I.V.S. Mullis (eds.), Methods and procedures in TIMSS and PIRLS 2011, TIMSS and PIRLS International Study Center, Chestnut Hill, MA.
LLECE (2010), Compendio de los Manuales del SERCE (SERCE Manuals Compendium), LLECE and OREALC/UNESCO Santiago, Santiago.
Martin, M.O. and I.V.S. Mullis (eds.) (2012), Methods and Procedures in TIMSS and PIRLS 2011, TIMSS and PIRLS International Study Center, Chestnut Hill, MA.
Musonda, B. and A. Kaba (2011), The SACMEQ III Project in Zambia: A Study of the Conditions of Schooling and the Quality of Education, IIEP, UNESCO, Paris.
Nkamba, M. and J. Kanyika (1998), The Quality of Primary Education: Some Policy Suggestions Based on a Survey of Schools: Zambia: An Interim Report, IIEP, UNESCO, Paris.
OECD (2014a), Call for Tender 100000990 - PISA for Development Strand A and Strand B, OECD, Paris, http://tinyurl.com/prjry24.
OECD (2014b), “First meeting of the International Advisory Group (IAG) for the PISA for Development project”, summary record, OECD, Paris.
OECD (2014c), “Approach to sampling and surveying”, presentation at the PISA for Development Technical Workshop on Out-of-School 15-year-olds, Montreal, Canada, 1-2 October 2014.
OECD (2014d), “Contextual questionnaires”, presentation at the PISA for Development Technical Workshop on Out-of-School 15-year-olds, Montreal, Canada, 1-2 October 2014.
OECD (2014e), “Developing an assessment framework”, presentation at the PISA for Development Technical Workshop on Out-of-School 15-year-olds, Montreal, Canada, 1-2 October 2014.
OECD (2014f), “Finding and identifying 15-year-olds”, presentation at the PISA for Development Technical Workshop on Out-of-School 15-year-olds, Montreal, Canada, 1-2 October 2014.
OECD (2013a), The Survey of Adult Skills: Reader's companion, OECD Publishing, Paris, http://dx.doi.org/10.1787/9789264204027-en.

CHAPTER 5 – IMPLEMENTATION PROCEDURES AND APPROACHES TO INCLUDING OUT-OF-SCHOOL CHILDREN IN ASSESSMENTS – 131
A REVIEW OF INTERNATIONAL LARGE-SCALE ASSESSMENTS IN EDUCATION: ASSESSING COMPONENT SKILLS AND COLLECTING CONTEXTUAL DATA © OECD AND THE WORLD BANK 2015
OECD (n.d.), “PISA 2015 technical standards”, www.oecd.org/callsfortenders/Annex H-Technical-Standards.pdf (accessed 5 August 2015).
Pierre, G. et al. (2014), STEP Skills Measurement Surveys: Innovative Tools for Assessing Skills, working paper, World Bank Human Development Network, Washington DC.
Results for Development (2015), Bringing Learning to Light: The Role of Citizen-Led Assessments in Shifting the Education Agenda, Results for Development Institute, Washington DC, http://tinyurl.com/p9oe8wp.
RTI International and International Rescue Committee (2011), Guidance Notes for Planning and Implementing EGRA, RTI International, North Carolina.
SACMEQ (2015a), “SACMEQ training workshops”, www.sacmeq.org/training-workshops (accessed 4 August 2015).
SACMEQ (2015b), “SACMEQ training modules”, www.sacmeq.org/training-modules (accessed 4 August 2015).
SACMEQ (2013), “SACMEQ”, www.sacmeq.org (accessed 31 October 2013).
SACMEQ (2007a), SACMEQ III: Main Study: Manual for Data Collectors, SACMEQ, Paris.
SACMEQ (2007b), SACMEQ III: Manual for National Research Co-ordinators: Main Study, SACMEQ, Paris.
UIS (2009a), WEI Survey of Primary Schools: Technical Report, UNESCO Institute for Statistics, Montreal.
UIS (2009b), The Next Generation of Literacy Statistics: Implementing the Literacy Assessment and Monitoring Programme (LAMP), UNESCO Institute for Statistics, Montreal.
UIS (2008), “Evaluation of the Literacy Assessment and Monitoring Programme (LAMP) / UNESCO Institute for Statistics (UIS)”, UNESCO Institute for Statistics, Montreal, www.unesco.org/new/en/unesco/about-us/how-we-work/accountability/internal-oversight-service/evaluation/evaluation-reports/single-view/news/evaluation_of_literacy_assessment_and_monitoring_programme_lamp_unesco_institute_for_statistics_uis/#.VhvCabRVhBd.
UIS (2004), “Literacy Assessment and Monitoring Programme (LAMP): International planning report” (draft), UNESCO Institute for Statistics, Montreal.
Uwezo (2014), Are Our Children Learning? Literacy and Numeracy across East Africa 2013, Uwezo and Hivos/Twaweza, Nairobi.
Uwezo (2013a), Uwezo Data Cleaning Protocol, Uwezo, Nairobi, www.uwezo.net/wp-content/uploads/2012/08/Data-cleaning-and-usage-NOTES1.pdf.
Uwezo (2013b), “2012/2013 Preparation and training manual – Kenya”, www.uwezo.net /assessment/training (accessed 10 March 2014).
Uwezo (2012), Standards Manual, Uwezo, Nairobi.
Uwezo Kenya (2013), “Volunteer workbook - Kenya”, www.uwezo.net/assessment /training (accessed 11 March 2014).
World Bank (2013), National Survey Design Planning Report: Skills Toward Employment and Productivity (STEP): Georgia, World Bank, Washington DC.


CHAPTER 6 – ANALYSIS, REPORTING AND USE OF DATA FROM INTERNATIONAL LARGE-SCALE ASSESSMENTS IN EDUCATION – 133
A REVIEW OF INTERNATIONAL LARGE-SCALE ASSESSMENTS IN EDUCATION: ASSESSING COMPONENT SKILLS AND COLLECTING CONTEXTUAL DATA © OECD AND THE WORLD BANK 2015
Chapter 6
Analysis, reporting and use of data from international large-scale assessments in education
This last chapter looks at how the data from the reviewed large-scale assessments are analysed, reported and used. In particular, the chapter examines analytical approaches used for reporting, reports and communication of results, and use of data and results. In the case of each of the reviewed assessments, the chapter highlights any lessons that may be relevant for PISA for Development (PISA-D).

134 – CHAPTER 6 – ANALYSIS, REPORTING AND USE OF DATA FROM INTERNATIONAL LARGE-SCALE ASSESSMENTS IN EDUCATION
A REVIEW OF INTERNATIONAL LARGE-SCALE ASSESSMENTS IN EDUCATION: ASSESSING COMPONENT SKILLS AND COLLECTING CONTEXTUAL DATA © OECD AND THE WORLD BANK 2015
This chapter examines how the data from the reviewed surveys are analysed, reported and used, and considers the extent to which there is evidence that the data inform better teaching and learning.
It is divided into three subsections:
• analytical approaches used for reporting
• reports and communication of results
• use of data and results.
Note that more detail about the analytical approaches in general can be found in earlier sections of this document.
Analytical approaches used for reporting
The call for tender for the international contractor for Strand A and Strand B of PISA-D states that the contractor for Strand A should propose a methodology for scaling cognitive data that ensures comparability to PISA scales. It also states that data products and analytical outputs should include verified national datasets, a verified and adjudicated international dataset, and country-specific analytical outputs. Some of these outputs may be defined by the OECD for all PISA-D countries, and some may be defined in consultation with national project managers from individual countries (OECD, 2014: 44).
In PISA, cognitive data are scaled using a one-parameter item response theory model. Contextual data are used to create simple indices and scaled indices. The scaled contextual indices are also created using a one-parameter item response theory model. The scaled cognitive data are used to develop described proficiency scales. The proficiency scales consist of numeric PISA scores divided into segments or “levels”, and substantive descriptions of the skills and abilities that correspond to each level. That is, proficiency levels are not an indication of students’ performance relative to one another. Each proficiency level describes what students performing at that level know and can do. The substantive descriptions are developed based on inspection of the content and process demands of the items.
The IEA studies prePIRLS, PIRLS and TIMSS also develop proficiency scales for their cognitive data. PIRLS and TIMSS report achievement results for participating countries and benchmarking entities overall, as well as for the separate processes (for PIRLS), or cognitive/content domains (for TIMSS). These surveys compare means and distributions of student performance on the relevant subdomains to performance on the domain overall. Both PIRLS and TIMSS analyse trends in performance overall and trends in performance of different genders. Because TIMSS tests at both Grade 4 and Grade 8, it is also able to conduct cohort comparisons; that is, TIMSS compares the fourth grade results of the previous cycle and the eighth grade results of the current cycle to examine cohort progress over time. (For examples of analysis used in reporting for PIRLS and TIMSS, see Martin et al., 2012; Mullis et al., 2012a; Mullis et al., 2012b.)
One key aspect of the analysis and reporting of performance data from these surveys is the use of benchmarks. The benchmarks are unchanging points along the achievement scale: the advanced international benchmark (at 625 points on the scale), the high international benchmark (at 550 points), the intermediate international benchmark (at 475 points) and the low international benchmark (at 400 points). A scale anchoring exercise is employed each assessment cycle to describe student competencies at each of the

CHAPTER 6 – ANALYSIS, REPORTING AND USE OF DATA FROM INTERNATIONAL LARGE-SCALE ASSESSMENTS IN EDUCATION – 135
A REVIEW OF INTERNATIONAL LARGE-SCALE ASSESSMENTS IN EDUCATION: ASSESSING COMPONENT SKILLS AND COLLECTING CONTEXTUAL DATA © OECD AND THE WORLD BANK 2015
benchmarks (Mullis, 2012). Benchmarks are not an indication of students’ performance relative to one another; it is theoretically possible for all students to reach or exceed a given benchmark. The benchmarks are linked to proficiency levels: for example, the high international benchmark maps to proficiency levels for each domain, and the levels describe what students generally must know and be able to do to be considered to be performing at a high standard. For each country, analyses are conducted to report on percentages of students reaching each international benchmark and trends in percentages of children reaching them.
When it comes to linking performance and contextual factors, the IEA studies explore contextual factors in themes that draw on data from the different questionnaires. In addition, for the first time in 2011, TIMSS and PIRLS developed policy-relevant scales covering areas including resources available at home for learning and education, resources available at school, teacher working conditions, school climate and students’ attitudes towards learning. The surveys compared locations on these policy-relevant scales to performance (Mullis et al., 2012c).
The prePIRLS and PIRLS 2011 national level report for South Africa may be of interest to PISA-D (Howie et al., 2012). The analyses in this report are restricted to computing mean performance and comparing differences in mean performance over time and between groups divided by contextual variables of interest. No correlations, variance analyses, regression analyses or multivariate analyses are conducted.
In SACMEQ, the performance of students and teachers is analysed using Rasch model item response theory. In one working paper that presents international results for SACMEQ III, mean scaled scores are calculated and compared across countries, genders, and socio-economic status derived from a scaled SES indicator. Scores are also reported in relation to the eight competency levels that have been identified for each of the domains of reading and mathematics (Hungi et al., 2010). In another working paper that presents international results, multi-level analyses have been conducted to identify key student and school-level factors that influence achievement, to explore within-school and between-school variations in achievement, and to examine how social and gender differences in achievement compare after controlling for other factors that influence achievement (Hungi, 2011a). Other working papers from SACMEQ III calculate frequencies for contextual variables of interest, but do not connect these contextual factors to performance (see, for example, Hungi, 2011b; Hungi, et al., 2011). In the national-level SACMEQ reports, mean achievement scores are calculated for groups divided by contextual variables of interest such as region, sex, school location (rural/urban), and socio-economic status (low/high) (for example, see Monyaku and Mmereki, 2011). Changes in mean scaled scores across multiple implementations of SACMEQ are also calculated, as are percentages of scores falling within the eight competency levels defined for each of the two domains.
LLECE reports assessment results using a single continuous scale for each domain obtained from the application of the Rasch model item response theory. LLECE uses hierarchical linear modelling to analyse factors associated with student achievement, in order to contextualise results. Hierarchical linear modelling is a complex form of ordinary least squares (OLS) regression that is used to analyse variance in the outcome variables when the predictor variables are at varying hierarchical levels; for example, students in a classroom share variance according to their common teacher and common classroom
LLECE’s strategy for analysis and reporting consists of two stages. In the first stage, LLECE publishes a report with the overall results for the region and each country,

136 – CHAPTER 6 – ANALYSIS, REPORTING AND USE OF DATA FROM INTERNATIONAL LARGE-SCALE ASSESSMENTS IN EDUCATION
A REVIEW OF INTERNATIONAL LARGE-SCALE ASSESSMENTS IN EDUCATION: ASSESSING COMPONENT SKILLS AND COLLECTING CONTEXTUAL DATA © OECD AND THE WORLD BANK 2015
focusing on comparing the average scores of countries and variance in each of the assessed grades and subjects.
In this first stage, results are also analysed in terms of performance levels describing what students can do. LLECE has four performance levels for each grade. These levels are specified simultaneously for each content domain and cognitive process that is assessed, and reflect progressive levels of difficulty. Countries are compared based on the percentage of students reaching each of these levels (LLECE, 2008).
In the second stage, normally two or three years after the assessment has been completed, LLECE publishes a report on associated factors, aiming to explore the relationship between student and school variables (obtained from the context questionnaires) and student achievement (for example, see Treviño et al., 2010). The purpose of the second stage of analysis and reporting is not only to relate contextual factors to student performance, but also to identify influential factors that could be modified by educational policy, particularly at the school level.
WEI-SPS uses several analytical approaches to survey data. These include: calculating proportions; correlations between variables and indices; analysis of variance by categories such as region and school type; mean values of indices; differences between mean values reported as effect sizes; and factor analyses. Even though surveys were administered to school leaders and teachers only, student weights were applied to leader and teacher data in order to report at the student level (Zhang, Postlethwaite and Grisay, 2008).
For EGRA and EGMA, implementing organisations choose the analyses that best serve their purposes. The guidance notes on planning and implementing EGRA provide some examples of the kinds of analysis and reporting options that implementing countries might choose (RTI International and International Rescue Committee, 2011).
• The letters, words and non-words subtasks and the phonemic awareness subtask analyse mean score per minute, disaggregated by groups (such as grade, gender and region).
• The listening comprehension subtask analyses the percentage of questions answered correctly disaggregated by groups.
• The oral reading fluency with comprehension subtask analyses: mean number of connected text words per minute disaggregated by groups; percentage of zero scores (a zero score is a child who can read no words in the oral reading passage correctly within the allocated time for the task); average percentage of correct answers; and percentage of children reading with at least 80% comprehension (a Fast Track Initiative indicator).
To give an example of the analytical options chosen for specific country implementation of EGMA, the baseline report from Kenya’s Primary Math and Reading Project has the following (RTI International, 2012):
• The number identification subtask analyses the mean number of correct numbers identified disaggregated by cohort, location, sex and grade.
• The number discrimination subtask and missing number/pattern subtask analyse the mean percentage correct, disaggregated by cohort, location, sex and grade.
• Addition levels 1 and 2 analyse mean scores disaggregated by cohort, location, sex, grade, and percentage of students with zero scores.

CHAPTER 6 – ANALYSIS, REPORTING AND USE OF DATA FROM INTERNATIONAL LARGE-SCALE ASSESSMENTS IN EDUCATION – 137
A REVIEW OF INTERNATIONAL LARGE-SCALE ASSESSMENTS IN EDUCATION: ASSESSING COMPONENT SKILLS AND COLLECTING CONTEXTUAL DATA © OECD AND THE WORLD BANK 2015
• Subtraction levels 1 and 2 analyse mean scores disaggregated by cohort, location, sex, and grade, and percentage of students with zero scores.
• Word problems analyse the percentage correct, disaggregated by cohort, location, sex and grade.
Regarding the household-based surveys, PIAAC used item response theory to create proficiency scales and then defined proficiency levels for those scales. Six proficiency levels were defined for literacy and numeracy (Levels 1 through 5, plus below Level 1) and four for problem-solving in technology-rich environments (Levels 1 through 3, plus below Level 1). Differences in proficiency were compared across countries and across key socio-demographic factors (such as gender, educational qualifications, socio-economic status and occupation). Proficiency was also explored with reference to wages, labour market status and social outcomes (OECD, 2013).
In STEP, data presented in the reports include pass/fail information for the core assessment, the reading component score(s) and timing data, and information on the target population’s reading literacy level, which is provided on the same five-level scale as used in the PIAAC literacy assessment (Pierre et al., 2014: 44).
In LAMP, performance data are analysed using item response theory to obtain proficiency scales. Three described proficiency levels were developed for the three domains (the prose domain, the document domain and the numeracy domain). In the national reports of LAMP results (for example, see UIS et al., 2013), frequency analyses are conducted to report on percentages in each proficiency level on overall data and on data disaggregated by gender, age and level of education.
In ASER, data are not analysed using item response theory. Each child receives a score that indicates the highest level he or she attained in the reading or maths test. These scores constitute the performance data. Performance is then analysed via frequency analyses to report the percentage of children attaining each level in the reading and mathematics assessments. Performance frequency analyses are conducted for reading and maths separately on data disaggregated by age and school type (see, for example, ASER Centre, 2014). The lowest level at which results are reported is the district. Performance trend analyses examine changes in the percentages of children in different grades attaining particular performance levels over time. The 2013 annual report also described changes in percentages of children attaining particular performance levels by tuition status. Little is done to link performance to family background, and no attempt is made to connect the results on the reading and mathematics assessments to any school characteristics except school type.
In Uwezo, as in ASER, data are not analysed using item response theory, and each child receives a score indicating the highest level he or she attained in the test. At the regional level (see, for example, Hoogeveen and Andrew, 2011; Uwezo, 2012a, 2014), analysis consists of comparing “pass” rates between countries and districts. A child is said to have passed the test if he or she got all attempted tasks correct. Test pass rates are also compared across socio-economic groups, with the index of socio-economic status calculated as a simple sum of responses to questions about durable assets owned, access to electricity and clean water, and mother’s level of education (Uwezo, 2012a: 18). Trend analysis consists of comparing pass rates and frequency of children completing each task over time. At the national level (see, for example, Uwezo Kenya, 2011, 2013a; Uwezo Tanzania, 2010, 2011, 2013; Uwezo Uganda, 2010, 2011, 2013a), analyses focus on differences in performance between districts and regions within the country, in terms of

138 – CHAPTER 6 – ANALYSIS, REPORTING AND USE OF DATA FROM INTERNATIONAL LARGE-SCALE ASSESSMENTS IN EDUCATION
A REVIEW OF INTERNATIONAL LARGE-SCALE ASSESSMENTS IN EDUCATION: ASSESSING COMPONENT SKILLS AND COLLECTING CONTEXTUAL DATA © OECD AND THE WORLD BANK 2015
the percentage of students successfully completing each task. The relation between contextual variables and performance is not consistently investigated across countries or across years.
PASEC uses proficiency scales for cognitive data. Results are reported for participating countries and benchmarking entities overall and for the separate processes or cognitive and content domains. Means and distributions of student performance on the relevant subdomains are compared to performance on the domain overall. For each country, analyses are conducted to report on percentages of students reaching each international benchmark and trends in percentages of children reaching each international benchmark. Performance on specific items is explored. Score differences are presented with reference to schools, teachers and students factors. Time benchmarking will be proposed across PASEC’s cycles.
Reports and communication of results
The call for tender for the international contractor for Strand A and Strand B of PISA-D discusses a technical report that will be prepared by the contractor, an international report that summarises overall international results that will be prepared by the OECD Secretariat, and national-level results reports. Regarding the preparation of national reports, the international contractor for Strand A is expected to provide analytical outputs, provide feedback and suggestions about analytical outputs, support the OECD Secretariat and participating countries during the development of the national reports, and review and provide comment on the draft national reports. The call for tender refers to the OECD PISA series Strong Performers and Successful Reformers in Education as giving examples of the types of analysis and reporting approaches that might be used for PISA-D national reports. (OECD, 2014).
For PISA, the OECD also prepares policy-oriented notes in a series called PISA in Focus (OECD, 2015). Shorter documents of the same kind are not mentioned in the call for tender international contractors for Strand A and Strand B of PISA-D.
Regarding the reviewed large-scale international surveys, the IEA studies prePIRLS, PIRLS and TIMSS communicate results through international reports prepared by the TIMSS and PIRLS International Study Center. The study centre also compiles the TIMSS and PIRLS encyclopaedias. The encyclopaedias present data from the curriculum questionnaires answered by national centre representatives from participating countries. These data are not analysed, but simply presented in a way that enables easy comparison. In addition, for the encyclopaedias, each country prepares a chapter summarising the structure of its education system, the language and reading curriculum in the primary grades, and overall policies related to reading instruction (such as teacher education, instructional materials and assessment) (Mullis and Martin, 2013: 6). IEA also produces technical reports that describe in detail all technical aspects of its assessments. These technical reports are published online.
The TIMSS results, reports, encyclopaedias, technical reports, assessment frameworks and other documentation for all cycles can be downloaded from the website of the TIMSS and PIRLS International Study Center.1 The international databases for all cycles, and accompanying user guides, can be downloaded from the TIMSS and PIRLS website.2

CHAPTER 6 – ANALYSIS, REPORTING AND USE OF DATA FROM INTERNATIONAL LARGE-SCALE ASSESSMENTS IN EDUCATION – 139
A REVIEW OF INTERNATIONAL LARGE-SCALE ASSESSMENTS IN EDUCATION: ASSESSING COMPONENT SKILLS AND COLLECTING CONTEXTUAL DATA © OECD AND THE WORLD BANK 2015
IEA’s Data Processing Center has developed the IEA International Database Analyser and IEA Data Visualiser software applications to facilitate the analysis and visualisation of data from IEA studies. These applications can be downloaded from IEA’s website.3
Participating countries publish national reports to disseminate findings to a wide range of audiences within those countries, including government officials, policymakers, researchers and educators. These reports present national results in an international context, highlighting issues of special interest in the specific education system.
In SACMEQ, the students’ reading and mathematics achievement scores for each of the three SACMEQ studies (I, II and III) are shown by country on the SACMEQ’s website. Mean scores and standard errors for each of the subjects are disaggregated by region and other subgroups (gender, school location and SES).4 All types of reports and data files from the three SACMEQ projects are also publicly available on SACMEQ’s website.
The SACMEQ Coordinating Centre releases a number of international working papers with cross-national comparison and descriptions of technical aspects of the SACMEQ studies. For example, the topics of the SACMEQ III study working papers include: pupil achievement levels in reading and mathematics; performance levels and trends in school resources among SACMEQ school systems; characteristics of Grade 6 pupils, their homes and learning environments; characteristics of Grade 6 teachers; characteristics of school heads and their schools; trends in the magnitude and direction of gender differences in learning outcomes; and accounting for variations in the quality of primary school education.
Each SACMEQ participating country issues a policy brief and a detailed country report. Within the country report, sections are devoted to describing the background of the education system, the administration of the study, contextual information, the performance of students and teachers, and policy recommendations (SACMEQ, n.d.). It appears that the SACMEQ Coordinating Centre provides participating countries with considerable assistance in writing national reports. For example, a source version of a chapter for inclusion in a SACMEQ national report is available for download from SACMEQ’s website. It is written by members of the SACMEQ Scientific Committee and staff from the International Institute for Educational Planning. Most of the participating countries seem to have used the source version in their national reports with few adaptations. Moreover, the three SACMEQ III workshops in 2009, 2010 and 2011, were all devoted to some aspect of national report preparation.5 PISA-D participating countries might require similar levels of support in national report preparation.
When it comes to dissemination activities beyond the main reports, each SACMEQ country convenes research results dissemination forums for different groups of stakeholders, ranging from high-level policymakers and senior management of education ministry to donor agencies and regional and local level decision-makers (Nzomo and Makuwa, 2006).
LLECE’s strategy for reporting results consists of two stages – an overall report is produced in the first stage and a report that explores contextual factors associated with performance in more depth is produced in the second stage. An important aim of the second-stage report is to identify factors that are both influential and might be modified by changes in educational policy.
WEI-SPS has produced a report that presents overall findings by theme, and then presents country profiles at the end of each theme section (see Zhang, Postlethwaite and

140 – CHAPTER 6 – ANALYSIS, REPORTING AND USE OF DATA FROM INTERNATIONAL LARGE-SCALE ASSESSMENTS IN EDUCATION
A REVIEW OF INTERNATIONAL LARGE-SCALE ASSESSMENTS IN EDUCATION: ASSESSING COMPONENT SKILLS AND COLLECTING CONTEXTUAL DATA © OECD AND THE WORLD BANK 2015
Grisay, 2008). There is also a WEI-SPS technical report (see UIS, 2009a). WEI-SPS data have been incorporated into the database compilation available on the UIS website.6
With respect to the other school-based surveys, EGRA and EGMA dissemination is done via the EdData website as well as, in the majority of cases, in-country seminars and discussions with key stakeholders.7 Implementing organisations are expected to share their reports and instruments with RTI so they can be posted on this website.
In EGRA and EGMA, reporting and communication varies from implementation to implementation. The guidelines for planning and implementing EGRA discuss the different potential audiences at different levels (international, national, regional, community, school) and how dissemination activities can be targeted to these different audiences. The example dissemination products and activities the guidelines describe are: policy dialogue workshop; policy brief; social mobilisation campaign; project revision meeting; events with schools or communities; and teacher professional development (see RTI International and International Rescue Committee, 2011: 78-87).
Regarding the reviewed household-based surveys, PIAAC has a range of materials that are made publicly available on the OECD website.8 In addition to a first results report that summarises international findings, there are interactive datasets and country notes, and links to national reports if they have been prepared.
STEP data, technical documents and national-level reports are available for download from the World Bank’s data website.9 The brochure for STEP states that national and international technical seminars will be organised to discuss the findings with national experts, including government officials, leading academic scholars, industry leaders, labour representatives and development partners (World Bank, 2012).
LAMP materials prepared by UIS suggest that an international database is available for download on the website.10 The draft international planning report states that after analysis the UIS and the national teams must together undertake to develop statistical products and services that address the needs of different stakeholders, and formulate dissemination and communication strategies (UIS, 2004: 43-44). It also states that national teams will be expected to produce at least a national results report, a national technical report and a national micro dataset.
ASER prepares an annual results report and press statements. The release is televised. The ASER Centre website provides a lot of information related to the survey.11 Some examples of what is available include: sample assessment tools; information about sampling; technical papers related to the survey; descriptions of sampling and the steps taken to ensure data quality; annual reports; tables of state- and district-level estimates; text from and links to articles discussing the survey from newspapers, magazines and online publications; information about the way ASER has featured in government policy and planning documents; lists and links to external publications that have made use of data from the survey; and a data query facility that presents state-level summary enrolment data and performance results for each year.
As mentioned above, Uwezo prepares regional and national reports. These materials are available for download from the Uwezo website.12 The regional reports include frequency tables and graphs and charts comparing pass rates per country, divided by domain (English, numeracy and Kiswahili), age group and socio-economic level, and comparing trends over time. There are also district ranking tables that give districts with the highest pass rates and districts with the lowest pass rates, and an overall ranking table listing all districts in the three countries according their pass rates. There is no separate

CHAPTER 6 – ANALYSIS, REPORTING AND USE OF DATA FROM INTERNATIONAL LARGE-SCALE ASSESSMENTS IN EDUCATION – 141
A REVIEW OF INTERNATIONAL LARGE-SCALE ASSESSMENTS IN EDUCATION: ASSESSING COMPONENT SKILLS AND COLLECTING CONTEXTUAL DATA © OECD AND THE WORLD BANK 2015
technical report for Uwezo. The regional report includes some technical details, but the real emphasis is the main findings.
In the Uwezo national reports, frequency tables and charts giving the percentage of children able to complete each task are presented. Results are disaggregated by grade level, gender, age group and districts or regions. The emphasis of the reports depends on within-country decisions. The national reports include more explanation on the characteristics of the survey (such as sampling and test administration), but the level of detail varies across the three countries.
Uwezo has a well-articulated strategy for communicating results (Uwezo, 2012b). Of note is that the first step occurs during test administration; when test administrators give feedback to children and parents immediately after the test has been administered. At this point, test administrators also supply materials with practical steps that can be taken to improve learning (Uwezo Kenya, 2013b; Uwezo Uganda, 2013b; Uwezo, 2011, 2013a, 2013b).
In PASEC, the PASEC Centre is in charge of producing international reports (one per grade) while countries are in charge of their national report. Scores are the responsibility of PASEC Centre. International reports focus on international comparison and factors analysis. Technical documentations, framework and procedures are produced by PASEC Centre. While overall results are provided to meetings of PASEC and CONFEMEN, the PASEC Centre provides each country with its own database and scores, and each country prepares its own national report.
Among the reviewed surveys, there are efforts to explore innovative approaches to raising awareness and disseminating results to different constituencies.
The ASER Centre has its own capacity-building unit (ASER, 2015) that offers courses in basic descriptive statistics, Stata software and monitoring and research design. While these courses are intended to be general in nature, the ASER survey acts as the lens through which they are delivered. In that sense, they serve as a means of familiarising more researchers with the survey and its results.
Uwezo has identified radio as its preferred medium for reaching out to teachers and parents, and briefings have featured on a number of key radio stations in the region in which the survey is conducted.
IEA holds research conferences every few years (IEA, 2015) and a number of presentations at these conferences deal with PIRLS and TIMSS data.
In 2013, PASEC established a network of policymakers and technicians from the CONFEMEN countries. One aim of this network is to promote the use of assessment data in planning in the education sector. This network held a meeting for policymakers in 2014 (for a summary, see CONFEMEN, 2014).
In SERCE, a series of documents for teachers was prepared called ‘Aportes para la enseñanza’, ‘Contributions to teaching’. The series included one document for each domain that was assessed: reading, mathematics, writing and sciences. The aim of this series was to provide teachers with guidelines to improve their teaching strategies in the domains.13
UNESCO Santiago has a YouTube channel that hosts videos about the results from TERCE.14
142 – CHAPTER 6 – ANALYSIS, REPORTING AND USE OF DATA FROM INTERNATIONAL LARGE-SCALE ASSESSMENTS IN EDUCATION
A REVIEW OF INTERNATIONAL LARGE-SCALE ASSESSMENTS IN EDUCATION: ASSESSING COMPONENT SKILLS AND COLLECTING CONTEXTUAL DATA © OECD AND THE WORLD BANK 2015
Use of data and results
Given the large number of participating countries and the international renown of the OECD, PISA is arguably one of the most publicised and influential assessments in the world.
Representatives of participant countries often indicate that PISA has been used as a point of reference to modify national curricula or the focus of national assessment systems (Breakspear, 2012; Hopkins et al., 2008). In a number of countries, PISA results have even served to justify the introduction of or legitimise mass standardised testing procedures – not just for students but also for teachers – promoting the use of test results for public accountability (Froese-Germain, 2010).
In particular countries, PISA has influenced public policy differently. In countries that perform well (Finland and New Zealand, for example), PISA has not received excessive media coverage – governments have used results mainly as an external legitimisation for the organisation of their education systems or for justifying recent or upcoming educational reforms (Froese-Germain, 2010; Grek, 2009; Martens et al., 2010).
In countries performing below the national expectations, PISA results have caught the interest of public opinion. Two well-known cases of countries that have experienced what is known as the ‘PISA shock’ are Germany and Norway (Grek, 2009; Hopfenbeck et al., 2013; Martens et al., 2010).
The most documented cases about the use of PISA data to inform educational policy are from high-income countries with technical capacity and resources to handle project implementation and ensure that results feed into policymaking. Not all PISA countries have such capacity or resources. The OECD’s working paper on PISA in low- and middle-income countries discusses two participating countries that do not fit into this category – Tunisia and Kyrgyzstan. The paper quotes Tunisia as giving “lack of political will and know-how” as the reason why better use is not made of PISA national data. In Kyrgyzstan, limited local capacity and a sense that the national education has been shaped by external interests mean that PISA and its results are largely unknown by the general public and national education stakeholders (Bloem, 2013).
Regarding the reviewed large-scale international surveys, countries use PIRLS and TIMSS achievement data for system-level monitoring in a global context, and monitoring progress in achievement over time (Mullis et al., 2012d, 2013).
The PIRLS 2011 encyclopaedia states that countries with low performance compared to other countries have initiated educational reforms in response to the results, and that countries with declining performance have sometimes formulated new goals and policies to drive improvement. The PIRLS 2011 encyclopaedia also highlights that the surveys encourage many countries to make special efforts to address any equity issues that are revealed by the results, and that the surveys often motivate countries to improve classroom instruction as well (Mullis et al., 2012d: 17-18). The TIMSS encyclopaedia describes a similar situation (Mullis et al., 2013: 25-26).
South Africa’s response to the PIRLS 2006 results may be of interest to PISA-D. A cluster of initiatives appears to have been influenced by the PIRLS 2006 results, based on the time at which they were implemented. Initiatives ranged from increased library funding, to the development of a national reading strategy, to handbooks for teachers. The PIRLS data from 2006 function as a baseline level against which the success of these initiatives can be monitored (Howie et al., 2012: 15-16).

CHAPTER 6 – ANALYSIS, REPORTING AND USE OF DATA FROM INTERNATIONAL LARGE-SCALE ASSESSMENTS IN EDUCATION – 143
A REVIEW OF INTERNATIONAL LARGE-SCALE ASSESSMENTS IN EDUCATION: ASSESSING COMPONENT SKILLS AND COLLECTING CONTEXTUAL DATA © OECD AND THE WORLD BANK 2015
SACMEQ research results have been playing an important role in informing dialogue and decisions related to the education systems of the member countries (Leste, 2005; Nzomo and Makuwa, 2006; Sayed and Kanjee, 2013). When SACMEQ I was completed, for example, the project reports featured in major policy documentation such as: presidential and national commissions on education in Kenya, Namibia and Zimbabwe; a prime ministerial and cabinet review of educational policy in Zanzibar; national education sector studies in Malawi and Zambia; and a review of a national education master plan in Mauritius (Murimba, 2002).
Moreover, the influence of SACMEQ research results can be observed not only in policy documentation, but also in the actual direction of policy and practice reforms in some countries. In Kenya, for example, SACMEQ findings on lower-than-expected levels of achievement have prompted the government, in collaboration with other key stakeholders and development partners, to implement a school-based teacher development programme. Donors have also begun to support the provision of textbooks to all public primary schools when findings showed there was an inadequate supply of them (Nzomo and Makuwa, 2006).
Another example is Namibia, where findings from the SACMEQ research revealed that the northern regions had the most difficulty in providing adequate educational resources and achieving minimum levels of student learning outcomes. With the support of development partners, multiple levels of the education sectors in these regions – from teachers to regional education officers – have now been targeted for assistance. Schools have been divided into clusters for administrative and support services. This arrangement enables a cluster of schools to share educational resources, good practice, and valuable expertise, which can benefit struggling schools in the region (Nzomo and Makuwa, 2006).
In both examples from SACMEQ, active involvement by ministry of education staff in the research implementation was key in linking results and action (Nzomo and Makuwa, 2006).
It is difficult to determine the extent to which LLECE results and data have influenced efforts to improve teaching and learning in participating countries. Though LLECE reports always conclude with a chapter on recommendations for education policy development (see, for example, LLECE, 2013), no information is available about whether these recommendations have triggered any changes in policy or practice. A study on this topic is envisaged in the LLECE Strategic Plan for 2015–2019 (M. Bilagher, personal communication, February 2014). LLECE is now developing a methodology to use study data for policy development at the micro and at the macro level.
Results from WEI-SPS provide a descriptive portrait of reported teaching practices in fourth grade literacy and mathematics in the participating countries, but since no cognitive assessments were administered, these practices cannot be evaluated against learning outcomes. Knowing what is occurring in their own and other countries can better help education reform stakeholders (policymakers, jurisdictional authorities and educators) identify possible gaps between planning and programme formulation and actual service delivery.
With respect to the other school-based surveys, EGRA and EGMA are often used to evaluate the impact of an initiative (baseline and endline studies are undertaken). In these instances the results can be said to inform teaching and learning because they can help to

144 – CHAPTER 6 – ANALYSIS, REPORTING AND USE OF DATA FROM INTERNATIONAL LARGE-SCALE ASSESSMENTS IN EDUCATION
A REVIEW OF INTERNATIONAL LARGE-SCALE ASSESSMENTS IN EDUCATION: ASSESSING COMPONENT SKILLS AND COLLECTING CONTEXTUAL DATA © OECD AND THE WORLD BANK 2015
show that some practice leads to improved outcomes or show that the practice makes no difference.
There are other examples of how EGRA data have been used to inform teaching and learning. In 2008, Nicaragua undertook a national level diagnostic assessment of reading using EGRA. The aim was to analyse the reading ability outcomes of children in the early grades and to examine the contextual factors that may be responsible for the observed outcomes. After the EGRA results were analysed, Nicaragua’s ministry took immediate, positive steps to address the quality of instruction, and also refocused its attention and efforts on quality improvements in the early grades (Gove and Wetterberg, 2011).
Additionally, in 2009, Liberia used EGRA as the primary source of data to inform instruction and to gauge efficacy of reading instruction at the individual, classroom, school, family and community levels. A modified, curriculum-specific EGRA was used as a classroom tool for continuous assessment. This classroom assessment tool facilitated setting reading performance goals and provided a benchmark for teachers, schools, administrators, families and other community stakeholders could use to evaluate classroom reading instruction. EGRA tools also provided a link to instruction as teachers could assume that students’ scores on the EGRA measures were directly related to the general reading outcome goals, and that increased scores meant that the reading instruction contributed to students’ learning. If there was no increase in student scores over time, then teachers understood that they needed to modify instruction (Gove and Wetterberg, 2011).
Regarding the reviewed household-based assessments, the STEP results have not been released for long, so there has most likely not been enough time for evidence to be produced about how they are influencing efforts to improve teaching and learning. The results are being incorporated into World Bank reports and policy discussions.
The guidelines for implementing LAMP discuss some ways it is envisaged that the survey data will feed into efforts to raise literacy levels. In particular, the survey data will support the design of literacy programmes and the improvement in educational policies by identifying the skills of the population (UIS, 2009b: 41).
In ASER, the ASER Centre website addresses the impact of the survey with a page that presents an archive of all state, national and international media coverage the survey has received. This page contains references that can be viewed by date or type of coverage. This widespread attention would undoubtedly raise awareness in the general public about children’s learning levels. The website also lists when the findings of the survey and the issue of learning outcomes in general have featured in education policy and planning discussions, and refers to how many district level teacher training institutes supply volunteer field investigators for the survey. The website also has a page that gives brief information about the assessments introduced in other countries that are based on ASER principles and methodology. The ASER Centre has played an important role in supporting these initiatives.
In addition to the material available on the ASER Centre website, our attention has been drawn to an initiative in Jehanabad district in Bihar. In this initiative, the ASER tools were used to determine children’s reading levels and to support teachers in targeting teaching to these reading levels rather than above them, as the curriculum might dictate. This approach was subsequently scaled up to cover other areas in the state of Bihar (R. Banerji, personal communication, 19 June 2014).

CHAPTER 6 – ANALYSIS, REPORTING AND USE OF DATA FROM INTERNATIONAL LARGE-SCALE ASSESSMENTS IN EDUCATION – 145
A REVIEW OF INTERNATIONAL LARGE-SCALE ASSESSMENTS IN EDUCATION: ASSESSING COMPONENT SKILLS AND COLLECTING CONTEXTUAL DATA © OECD AND THE WORLD BANK 2015
There is little information available about how the Uwezo approach and results are used in efforts to improve teaching and learning. There are, however, two instances of interest. In one instance, the Ikhoba Girls Primary School in Masindi district in Kenya redoubled their efforts to improve learning levels after poor district level results in Uwezo 2011. In another instance, a district co-ordinator in Homa Bay Town in Kenya used connections established through Uwezo to form village education committees to facilitate better communication between families, school management staff and teachers about local education issues (S. Ruto, personal communication, 31 August 2014).
The impact of Uwezo is considered in a study undertaken in two rural Kenyan districts by researchers at Princeton University and Massachusetts Institute of Technology. The study found that two of the most valued Uwezo strategies – the instant feedback provided to parents regarding their children’s competencies, and the provision of support materials to improve learning – had no impact on increasing citizen activism. Based on a series of measures of citizen activism, the study concluded that parents who received the instant feedback and the support materials were not more likely to act to improve the quality of their children’s schooling or to adopt behaviours at home that might improve learning than parents who did not receive the information (Lieberman, Posner and Tsai, 2013). Although discouraging, the researchers suggest that their findings may indicate that Uwezo’s provision of information is failing to trigger behavioural change due to other more general factors influencing the causal relationship between information provision and action. These factors may include the ability to understand the information that is being received, the level of responsibility that the audience feels regarding the information, and the level of belief people have that their actions will generate results.
Implications
Analytical approaches used for reporting We suggest that the OECD examines the use of benchmarks in the reviewed surveys
and considers whether benchmarks might be incorporated into PISA-D analysis and reporting. Benchmarks that define minimum expected levels of performance may become increasingly relevant in the context of the post-2015 development goals and targets for education quality.
We also suggest that the OECD makes sure that questionnaire scales developed and used in PISA-D reporting are considered relevant to policy in the participating countries.
Additionally, we suggest that the OECD refers to national level reports from relevant countries that have participated in the reviewed large-scale assessments (such as South Africa in prePIRLS and PIRLS 2011, the SACMEQ countries). These reports provide a sense of the kinds of analysis and reporting options that these countries have deemed relevant for their contexts, and that may be relevant for PISA-D.
Reports and communicating results We suggest that the OECD considers whether a presentation of participating country
contexts such as that given by the TIMSS and PIRLS encyclopaedias may be valuable for PISA-D. Other surveys or monitoring efforts may already have systems in place to capture at least some of this information.

146 – CHAPTER 6 – ANALYSIS, REPORTING AND USE OF DATA FROM INTERNATIONAL LARGE-SCALE ASSESSMENTS IN EDUCATION
A REVIEW OF INTERNATIONAL LARGE-SCALE ASSESSMENTS IN EDUCATION: ASSESSING COMPONENT SKILLS AND COLLECTING CONTEXTUAL DATA © OECD AND THE WORLD BANK 2015
We suggest that the OECD and the international contractors for Strand A and Strand B of PISA-D should be prepared to offer considerable support to countries for the important work of preparing national results reports.
We also suggest that the OECD considers supporting participating countries to develop and implement dissemination plans. In many of the reviewed assessments, there was very little national level material available. Without national level material that is judged by decision makers as useful and relevant, a survey can only ever have a limited impact.
Use of data and results We suggest that the OECD takes note of the observation from SACMEQ that active
involvement of ministry staff in the research implementation is the key to linking results and actions, and considers how to ensure that government buy-in leads to similar success with PISA-D.
Notes
1. See http://timssandpirls.bc.edu/isc/publications.html.
2. See http://timss.bc.edu.
3. See www.iea.nl/data.html.
4. See www.sacmeq.org/sacmeq-projects/sacmeq-iii/readingmathscores. 5. See www.sacmeq.org/training-workshops – one workshop was about accessing and
analysing data files for national reporting, another was about preparing draft chapters for national reports, and another was about sharing, reviewing and improving draft chapters for national reports.
6. See http://data.uis.unesco.org.
7. See www.eddataglobal.org/index.cfm.
8 See www.oecd.org/site/piaac.
9. See http://microdata.worldbank.org/index.php/catalog/step.
10. See www.uis.unesco.org.
11. See www.asercentre.org/ - 6dwi6.
12. See www.uwezo.net.
13. See www.unesco.org/new/es/santiago/education/education-assessment-llece/second-regional-comparative-and-explanatory-study-serce.
14. See www.youtube.com/user/UNESCOSantiago.

CHAPTER 6 – ANALYSIS, REPORTING AND USE OF DATA FROM INTERNATIONAL LARGE-SCALE ASSESSMENTS IN EDUCATION – 147
A REVIEW OF INTERNATIONAL LARGE-SCALE ASSESSMENTS IN EDUCATION: ASSESSING COMPONENT SKILLS AND COLLECTING CONTEXTUAL DATA © OECD AND THE WORLD BANK 2015
References
ASER (2015), “ASER Centre capacity building”, https://sites.google.com/site/asercentrecapacitybuilding (accessed 23 May 2015).
ASER Centre (2014), Annual Status of Education Report (Rural) 2013, ASER Centre, New Delhi.
Bloem, S. (2013), “PISA in low and middle income countries”, OECD Education Working Papers No. 93, OECD, Paris, http://dx.doi.org/10.1787/5k41tm2gx2vd-en.
Breakspear, S. (2012), “The policy impact of PISA: An exploration of the normative effects of international benchmarking in school system performance”, OECD Education Working Papers No. 71, http://dx.doi.org/10.1787/5k9fdfqffr28-en.
CONFEMEN (2014), “Subregional workshop on the role and place of assessment in education systems’ steering and reform: Policymakers workshop”, summary report, CONFEMEN, Dakar, Senegal.
Froese-Germain, B. (2010), The OECD, PISA and the Impacts on Educational Policy, Canadian Teacher’s Federation, Ottawa.
Gove, A. and A. Wetterberg (eds.) (2011), The Early Grade Reading Assessment: Applications and Interventions to Improve Basic Literacy, RTI International, North Carolina.
Grek, S. (2009), “Governing by numbers: The PISA ‘effect’ in Europe”, Journal of Education Policy 24(1), Routledge, London, pp. 23-37.
Hoogeveen, H. and D. Andrew (2011), Are Our Children Learning? Numeracy and Literacy across East Africa 2011, Uwezo, Nairobi.
Hopfenbeck, T. et al. (2013), “Balancing trust and accountability? The Assessment for Learning Programme in Norway: A governing complex education systems case study”, OECD Education Working Papers, No. 97, http://dx.doi.org/10.1787/5k3txnpqlsnn-en.
Hopkins, D. et al. (2008), The Global Evaluation of the Policy Impact of PISA, OECD, Paris.
Howie, S. et al. (2012), PIRLS 2011: South African Children’s Reading Literacy Achievement, Summary Report, Centre for Evaluation and Assessment, University of Pretoria, Pretoria, www.up.ac.za/media/shared/Legacy/sitefiles/file/publications/2013/pirls_2011_report_12_dec.pdf.
Hungi, N. (2011a), Accounting for Variations in the Quality of Primary School Education, SACMEQ, Paris, www.sacmeq.org/?q=publications.
Hungi, N. (2011b), “Characteristics of Grade 6 pupils, their homes and learning environments”, SACMEQ Working Paper, SACMEQ, Paris.

148 – CHAPTER 6 – ANALYSIS, REPORTING AND USE OF DATA FROM INTERNATIONAL LARGE-SCALE ASSESSMENTS IN EDUCATION
A REVIEW OF INTERNATIONAL LARGE-SCALE ASSESSMENTS IN EDUCATION: ASSESSING COMPONENT SKILLS AND COLLECTING CONTEXTUAL DATA © OECD AND THE WORLD BANK 2015
Hungi, N. et al. (2011), “SACMEQ III project results: Levels and trends in school resources among SACMEQ school systems”, SACMEQ Working Document, SACMEQ, Paris.
Hungi, N. et al. (2010), SACMEQ III Project Results: Pupil Achievement Levels in Reading and Mathematics, SACMEQ, Paris.
IEA (2015), “IEA International Research Conference”, www.iea.nl/irc.html (accessed 23 May 2015).
Leste, A. (2005), “Streaming in Seychelles: From SACMEQ research to policy reform”, paper presented at International Invitational Educational Policy Research Conference, SACMEQ, Paris.
Lieberman, E., D. Posner and L. Tsai (2013), “Does information lead to more active citizenship? Evidence from an education information intervention in rural Kenya”, MIT Political Science Department Research Paper, No. 2013-2, http://ssrn.com/abstract=2228900.
LLECE (2013), Diseño Muestral Tercer Estudio Regional Comparativo y Explicativo (TERCE) (Sampling Framework for the Third Regional Comparative and Explanatory Study (TERCE), LLECE, Santiago.
LLECE (2008), Segundo Estudio Regional Comparativo de los Aprendizajes de los Estudiantes de América Latina y El Caribe. Primer Reporte (Second International Comparative Study of Student Learning in Latin American and the Caribbean. First Report), Latin American Laboratory for Assessment of the Quality of Education (LLECE) / UNESCO-Santiago, Santiago.
Martens, K. et al. (2010), Transformation of Education Policy, Palgrave, Basingstoke, New York.
Martin, M. O. et al. (2012), TIMSS 2011 International Results in Science, TIMSS and PIRLS International Study Center, Chestnut Hill, MA.
Monyaku, B. and O.A. Mmereki (2011), The SACMEQ III Project in Botswana: A Study of the Conditions of Schooling and the Quality of Education, Botswana Ministry of Education and Skills Development, Division of Planning Statistics and Research, Gabarone.
Mullis, I.V.S. (2012), “Using scale anchoring to interpret the TIMSS and PIRLS 2011 achievement scales”, in M.O. Martin and I.V.S. Mullis (eds.), Methods and Procedures in TIMSS and PIRLS 2011, TIMSS and PIRLS International Study Center, Chestnut Hill, MA.
Mullis, I.V.S. et al. (eds.) (2013), TIMSS 2011 Encyclopedia: Education Policy and Curriculum in Mathematics and Science, Volume 1: A–K, TIMSS and PIRLS International Study Center, Chestnut Hill, MA.
Mullis, I.V.S., et al. (2012a), TIMSS 2011 International Results in Mathematics, TIMSS and PIRLS International Study Center and IEA, Chestnut Hill, MA and Amsterdam.
Mullis, I.V.S., et al. (2012b), PIRLS 2011 International Results in Reading, TIMSS and PIRLS International Study Center and IEA, Chestnut Hill, MA and Amsterdam.

CHAPTER 6 – ANALYSIS, REPORTING AND USE OF DATA FROM INTERNATIONAL LARGE-SCALE ASSESSMENTS IN EDUCATION – 149
A REVIEW OF INTERNATIONAL LARGE-SCALE ASSESSMENTS IN EDUCATION: ASSESSING COMPONENT SKILLS AND COLLECTING CONTEXTUAL DATA © OECD AND THE WORLD BANK 2015
Mullis, I.V.S. et al. (2012c), “Assessment framework and instrument development”, in M.O. Martin and I.V.S. Mullis (eds.), Methods and Procedures in TIMSS and PIRLS 2011, TIMSS and PIRLS International Study Center, Chestnut Hill, MA.
Mullis, I.V.S. et al. (eds.) (2012d), PIRLS 2011 Encyclopedia: Education Policy and Curriculum in Reading, Volume 1: A–K, TIMSS and PIRLS International Study Center, Chestnut Hill, MA.
Mullis, I.V.S. and M.O. Martin (eds.) (2013), PIRLS 2016 Assessment Framework, TIMSS and PIRLS International Study Center and IEA, Chestnut Hill, MA and Amsterdam.
Murimba, S. (2002), “SACMEQ education ministers review progress and future plans”, IIEP Newsletter, Vol. XX, No.1, January-March, International Institute of Educational Planning, UNESCO, Paris.
Nzomo, J. and D. Makuwa (2006), “How can countries move from cross-national research results to dissemination, and then to policy reform? (Case studies from Kenya and Namibia)” in K. Ross and I.J. Genevois (eds.), Cross-National Studies of the Quality of Education IIEP, UNESCO, Paris, pp. 213-228.
OECD (2015), “PISA in Focus”, www.oecd.org/pisa/pisaproducts/pisainfocus.htm (accessed 4 August 2015).
OECD (2014), Call for Tender 100000990 - PISA for Development Strand A and Strand B, OECD, Paris, http://tinyurl.com/prjry24.
OECD (2013), OECD skills outlook 2013: First results from the Survey of Adult Skills: OECD Publishing, Paris, http://dx.doi.org/10.1787/9789264204256-en.
Pierre, G. et al. (2014), STEP Skills Measurement Surveys: Innovative Tools for Assessing Skills, working paper, World Bank Human Development Network, Washington DC.
RTI International (2012), The Primary Math and Reading (PRIMR) Initiative Baseline Report, RTI International, North Carolina.
RTI International and International Rescue Committee (2011), Guidance Notes for Planning and Implementing EGRA, RTI International, North Carolina.
SACMEQ (n.d.), “SACMEQ projects” www.sacmeq.org/sacmeq-projects (accessed on 11 April 2014).
Sayed, Y. and A. Kanjee (2013), “Assessment in sub-Saharan Africa: Challenges and prospects”, Assessment in Education: Principles, Policy and Practice, 20(4), Routledge, London, pp. 373-384.
Treviño, E. et al. (2010), Factores asociados al logro cognitivo de los estudiantes de América Latina y el Caribe (Factors associated with student achievement in Latin America and the Caribbean), UNESCO-OREAL Santiago and LLECE, Santiago.
UIS et al. (2013), LAMP: Country Summary for Paraguay, UNESCO Institute for Statistics, Montreal, www.uis.unesco.org/literacy/Documents/LAMP%20Country%20Summaries/literacy-statistics-summary-paraguay.pdf.
UIS (2009a), WEI Survey of Primary Schools: Technical Report, UNESCO Institute for Statistics, Montreal.

150 – CHAPTER 6 – ANALYSIS, REPORTING AND USE OF DATA FROM INTERNATIONAL LARGE-SCALE ASSESSMENTS IN EDUCATION
A REVIEW OF INTERNATIONAL LARGE-SCALE ASSESSMENTS IN EDUCATION: ASSESSING COMPONENT SKILLS AND COLLECTING CONTEXTUAL DATA © OECD AND THE WORLD BANK 2015
UIS (2009b), The Next Generation of Literacy Statistics: Implementing the Literacy Assessment and Monitoring Programme (LAMP), UNESCO Institute for Statistics, Montreal.
UIS (2004), “Literacy Assessment and Monitoring Programme (LAMP): International planning report” (draft), UNESCO Institute for Statistics, Montreal.
Uwezo (2014), Are Our Children Learning? Literacy and Numeracy across East Africa 2013, Uwezo and Hivos/Twaweza, Nairobi.
Uwezo (2013a), “2012/2013 Preparation and training manual – Kenya”, www.uwezo.net /assessment/training (accessed 10 March 2014).
Uwezo (2013b), “2013 Preparation and training manual - Uganda”, www.uwezo.net /assessment/training (accessed 11 March 2014).
Uwezo (2012a), Are our Children Learning? Literacy and Numeracy across East Africa 2012, Twaweza, Nairobi.
Uwezo (2012b), Standards Manual, Uwezo, Nairobi.
Uwezo (2011), “Improving learning outcomes in East Africa 2009-2013: Strategy update”, www.uwezo.net/strategies.
Uwezo Kenya (2013a), Are Our Children Learning? Annual Learning Assessment Report 2012, Uwezo and Women Educational Researchers of Kenya (WERK), Nairobi.
Uwezo Kenya (2013b), “Volunteer workbook - Kenya”, www.uwezo.net/assessment /training (accessed 11 March 2014).
Uwezo Kenya (2011), Are our Children Learning? Annual Learning Assessment Report 2011, Uwezo, WERK, Nairobi.
Uwezo Tanzania (2013), Are Our Children Learning? Annual Learning Assessment Report 2012, Uwezo and Tanzania Education Network (TEN/MET), Dar es Salaam.
Uwezo Tanzania (2011), Are Our Children Learning? Annual Learning Assessment Report 2011, Uwezo, TEN/MET, Dar es Salaam.
Uwezo Tanzania (2010), Are Our Children Learning? Annual Learning Assessment Report 2010, Uwezo, TEN/MET, Dar es Salaam.
Uwezo Uganda (2013a), Are Our Children Learning? Annual Learning Assessment Report 2012, Uwezo Uganda, Kampala
Uwezo Uganda (2013b), “Volunteer workbook - Uganda”, www.uwezo.net/assessment /training (accessed 11 March 2014).
Uwezo Uganda (2011), Are Our Children Learning? Annual Learning Assessment Report 2011, Uwezo and Uganda National NGO Forum, Kampala.
Uwezo Uganda (2010), Are our Children Learning? Annual Learning Assessment Report 2010, Uwezo and Uganda National NGO forum, Kampala.
World Bank (2012), “STEP Skills Measurement Study” (brochure), World Bank, Washington DC.
Zhang, Y., T.N. Postlethwaite and A. Grisay (eds.) (2008), A View Inside Primary Schools: A World Education Indicators (WEI) Cross-National Study, UNESCO Institute for Statistics, Montreal.

ANNEX A – GENERAL INFORMATION ABOUT THE INTERNATIONAL SURVEYS REVIEWED – 151
A REVIEW OF INTERNATIONAL LARGE-SCALE ASSESSMENTS IN EDUCATION: ASSESSING COMPONENT SKILLS AND COLLECTING CONTEXTUAL DATA © OECD AND THE WORLD BANK 2015
Annex A
General information about the international surveys reviewed
This annex presents general information about the main characteristics of the reviewed large-scale assessments. A summary table is presented first, and more detailed descriptions are provided in the sections that follow the table.

152 – ANNEX A – GENERAL INFORMATION ABOUT THE INTERNATIONAL SURVEYS REVIEWED
A REVIEW OF INTERNATIONAL LARGE-SCALE ASSESSMENTS IN EDUCATION: ASSESSING COMPONENT SKILLS AND COLLECTING CONTEXTUAL DATA © OECD AND THE WORLD BANK 2015
Table A.1 Overview of the reviewed assessments
Years Countries Target Population Sampling (size and design)
Contextual data collection instruments
Cognitive Assessments Mode of delivery
Large-Scale International Surveys
PISA OECD
2000, 2003, 2006, 2009, 2012, 2015
65, including all 34 OECD-countries
15-year-old students (min. grade 7)
Minimum 4 500 students per country Two-stage stratified: (1) schools sampled with probability proportional to size (PPS); (2) students randomly sampled.
Questionnaires for students, principals; optional for parents and teachers (2015)
Reading, Mathematics, Science; optional computer based assessment: CBAS 2006, ERA 2009, CBR/CBM/CPS 2012, computer delivery from 2015 for all new science and collaborative problem-solving items
Questionnaire: Paper-and-pencil (up to 2012), computer-based from 2015 Cognitive: Paper and pencil (up to 2012), CBAS 2006, ERA 2009, CBR/CBM/CPS 2012, computer delivery from 2015 for all new science and collaborative problem-solving items, group setting
PIRLS/ PrePIRLS/ IEA
PIRLS: 2001, 2006, 2011, 2016 PrePIRLS: 2011, 2016
PrePIRLS: 3 (South Africa, Botswana, Colombia) PIRLS 2011: 49
PIRLS: Students (grade 4); PrePIRLS: Students (grades 4, 5 or 6)
Minimum 150 schools with 4 000 students per country Three-stage stratified cluster sampling: (1) schools sampled with PPS; (2) classes randomly sampled; (3) all students within the sampled classes
Questionnaires for students, parents, teachers, principals, national curriculum
Literacy Questionnaire: paper-and pencil; optional online for teacher and principal Cognitive: Paper-and-pencil, group setting

ANNEX A – GENERAL INFORMATION ABOUT THE INTERNATIONAL SURVEYS REVIEWED – 153
A REVIEW OF INTERNATIONAL LARGE-SCALE ASSESSMENTS IN EDUCATION: ASSESSING COMPONENT SKILLS AND COLLECTING CONTEXTUAL DATA © OECD AND THE WORLD BANK 2015
Years Countries Target Population Sampling (size and design)
Contextual data collection instruments
Cognitive Assessments Mode of delivery
Large-Scale International Surveys (cont.)
TIMSS/ TIMSS-Numeracy IEA
TIMSS: 1995, 1999, 2003, 2007, 2011 TIMSS Numeracy: 2015
77 countries, states and school systems in 2011
TIMSS: Students (grades 4 and 8, or grade 11 for advanced module) TIMSS Numeracy: Students (grades 4, 5 or 6)
Minimum 150 schools with 4 000 students per country Three-stage stratified cluster sampling: (1) schools sampled with PPS; (2) classes randomly sampled; (3) all students within the sampled classes
Questionnaires for students, parents (2011), teachers, principals, national curriculum
Mathematics and Science
Questionnaire: paper-and pencil; optional online for teacher and principal Cognitive: Paper-and-pencil, group setting
SACMEQ SACMEQ, UNESCO-IIEP
1999, 2004, 2011, 2014
SACMEQ III: 15 Southern and Eastern African countries, including Tanzania and Zambia
Students (grade 6), teachers
Minimum 25 students per selected school. Two-stage stratified: (1) schools sampled with PPS; (2) students randomly sampled.
Questionnaires for students, teachers, principals
Literacy, numeracy, health
Questionnaire: Paper-and-pencil Cognitive: Paper-and-pencil, group setting
PASEC CONFEMEN
Every year between 1993 and 2010; 2014
10 (Benin, Burkina Faso, Burundi, Cameroon, Ivory Coast, Congo, Niger, Senegal, Chad, Togo) in 2014. Prior to 2014, Senegal took part in 1995, 1998 and 2006. Cambodia participated in 2012. (See CONFEMEN, 2014.)
Students (grades 2, 5/6)
Two-stage stratified: (1) schools sampled with PPS; (2) students randomly sampled within the same classroom (also randomly selected from the available classroom).
Questionnaires for students, teachers, principals
Literacy, numeracy
Questionnaire: Paper-and-pencil Cognitive: Paper-and-pencil, group setting
LLECE UNESCO-OREALC
PERCE: 1997, SERCE: 2006, TERCE: 2013
PERCE: 13SERCE: 16 TERCE: 15 (Guatemala and Ecuador took part in SERCE and TERCE)
Students(grades 3 and 6)
Two-stage stratified: (1) schools sampled with PPS; (2) intact classes randomly sampled
Questionnaires for students, teachers, principals, parents
Literacy, numeracy, natural sciences SERCE: Reading, mathematics, sciences, writing
Questionnaire: Paper-and-pencil Cognitive: Paper-and-pencil, group setting

154 – ANNEX A – GENERAL INFORMATION ABOUT THE INTERNATIONAL SURVEYS REVIEWED
A REVIEW OF INTERNATIONAL LARGE-SCALE ASSESSMENTS IN EDUCATION: ASSESSING COMPONENT SKILLS AND COLLECTING CONTEXTUAL DATA © OECD AND THE WORLD BANK 2015
Years Countries Target Population Sampling (size and design)
Contextual data collection instruments
Cognitive Assessments Mode of delivery
Large-Scale International Surveys (cont.)
WEI-SPS OECD, UNESCO-UIS
2005, 2006 11 (Argentina, Brazil, Chile, India, Malaysia, Paraguay, Peru, the Philippines, Sri Lanka, Tunisia and Uruguay)
Primary schools with students in grade 4, teachers
Minimum 400 schools per country. Single-stage stratified (India used two-stage stratified). Schools sampled from a list of eligible schools.
Questionnaires for teachers, principals, national curriculum
ONLY CONTEXTUAL
Questionnaire: Paper-and-pencil
School-based Surveys
EGRA/ EGMA RTI
EGRA: started in 2007; EGMA: started in 2009
EGRA: 59 as of August 2014, including Cambodia, Guatemala, Senegal, Tanzania and Zambia Table 1. EGMA: 22 as of March 2014, including Tanzania and Zambia
EGRA and EGMA: Students (grades 1–3)
EGRA: Typically three-stage sampling (1) schools sampled; (2) classes selected; (3) students selected. EGMA: Typically three-stage sampling (1) regions selected; (2) schools sampled; (3) students selected.
Optional interview with student, teacher, principal, and classroom observation
EGRA: reading; EGMA: numeracy
Paper-and-pencil Interview and observation Cognitive: Oral, in an one-on-one setting
Household-based Surveys
PIAAC OECD
2011,2012, 2014
23 in 2011/12 Adults (16–65) Minimum 5 000 respondents per country Stratified multi-stage clustered area sampling
Interview with the participant (individual in the household).
Literacy (including reading components), numeracy, problem-solving in technology-rich environments
Computer-assisted personal interview Cognitive: Computer-based-assessment (paper-and-pencil as an option), one-on-one

ANNEX A – GENERAL INFORMATION ABOUT THE INTERNATIONAL SURVEYS REVIEWED – 155
A REVIEW OF INTERNATIONAL LARGE-SCALE ASSESSMENTS IN EDUCATION: ASSESSING COMPONENT SKILLS AND COLLECTING CONTEXTUAL DATA © OECD AND THE WORLD BANK 2015
Years Countries Target Population Sampling (size and design)
Contextual data collection instruments
Cognitive Assessments Mode of delivery
Household-based Surveys (cont.)
STEP World Bank
2011, 2012, 2014
6 (Armenia, Azerbaijan, Georgia, Ghana, Kenya, Macedonia) in 2012
Adults (15–64)
Household survey: Minimum 6 000 households. Three-stage sampling: (1) small territorial areas, (2) households ; (3) random selection of the main respondent Employer survey: 300 to 500 workplaces.
Interview with the participant (individual in the household; employer)
Reading literacy (as part of the household survey)
Household survey: Paper-and-pencil or computer-assisted personal interview Employer survey: Paper-and-pencil Interview Cognitive: Paper-and-pencil, in an one-on-one setting
LAMP UNESCO-UIS
2003 Mongolia (2010), Jordan (2011), Palestinian autonomous territories (2011), Paraguay (2011), and Lao PDR (2014)
Adults (15+) Typically two-stage sampling: (1) household (2) individual in the household.
Interview with the participant (individual in the household)
Literacy, numeracy Paper-and-pencilInterview Cognitive: Oral, in an one-on-one setting
ASER Pratham
Annually since 2005
India Children and teenagers living in rural areas in India, ages 3–16 for enrolment and background information, ages 5–16 for assessment
Two-stage sampling: (1) 30 villages per rural district; (2) 20 households sampled from each village. All children in the target population in a sampled household are assessed.
Interview and observation. Household survey sheet (interview with head of household), school survey sheet (interview with head master), village observation sheet
Reading, arithmetic Paper-and-pencilInterview and observation Cognitive: Oral, in an one-on-one setting

156 – ANNEX A – GENERAL INFORMATION ABOUT THE INTERNATIONAL SURVEYS REVIEWED
A REVIEW OF INTERNATIONAL LARGE-SCALE ASSESSMENTS IN EDUCATION: ASSESSING COMPONENT SKILLS AND COLLECTING CONTEXTUAL DATA © OECD AND THE WORLD BANK 2015
Years Countries Target Population Sampling (size and design)
Contextual data collection instruments
Cognitive Assessments Mode of delivery
Household-based Surveys (cont.)
UWEZO Twaweza, supported by the Humanist Institute for Cooperation (Hivos)
2009, 2010, 2011, 2012, 2013
3 (Kenya, Tanzania, Uganda)
Children and teenagers (6–16)
Three-stage sampling: (1) districts randomly sampled; (2) villages selected with PPS; (3) 30 households selected from each sampled village. Within the household all children in the target population are surveyed.
Interview and observation. Household survey sheet (interview with head of household), school survey sheet (interview with head of teachers), village survey sheet (interview with local council chairperson/ village chief)
Literacy, numeracy Paper-and-pencilInterview and observation Cognitive: Oral, in an one-on-one setting

ANNEX A – GENERAL INFORMATION ABOUT THE INTERNATIONAL SURVEYS REVIEWED – 157
A REVIEW OF INTERNATIONAL LARGE-SCALE ASSESSMENTS IN EDUCATION: ASSESSING COMPONENT SKILLS AND COLLECTING CONTEXTUAL DATA © OECD AND THE WORLD BANK 2015
Main characteristics of the surveys
Large-scale international surveys
PISA The Programme for International Student Assessment (PISA) was initiated in 1997
by the OECD and its member countries in order to obtain internationally comparable data about the quality of the education systems in the member countries. Since the first main study in 2000, over 65 countries worldwide have participated in PISA.
Purpose The main purpose of PISA is to measure and internationally compare student
achievement near the end of their period of compulsory schooling, in three domains of literacy – reading, mathematics and science – to gain regular data about the quality of education systems. The combination of high quality assessments and contextual information at the student and school level helps to describe the relationship between students’ performance and their contexts, thus identifying the different systems’ strengths and weaknesses.
Target population and sampling PISA’s target population is 15-year-old students at grade 7 or higher. To be
eligible for inclusion in the international database, data on at least 4 500 students per country need to be collected (if a country is smaller, a census is tested).
PISA uses a two-stage stratified sampling design to obtain a representative sample. In stage 1, schools are sampled with PPS (probability proportional to size) within country-defined strata. In stage 2, eligible students are randomly selected within schools (OECD, 2014a).
Administration PISA was originally designed as a paper-and-pencil assessment. Since the year
2006, computer-based components were included in the assessment in response to the increasing relevance of new information and communication technologies for education. This started with a computer-based science assessment in 2006, followed by an electronic reading assessment in 2009, which was carried forward in 2012 together with a computer-based assessment of mathematics and problem-solving, and online administration of the school questionnaire. 2015 will see the first complete computer-based PISA assessment, including computer-based administration of the student and school questionnaires. A paper-based option with items that are linked to former PISA cycles is available for countries where a complete electronic assessment is not feasible. However, the newly developed items in science and collaborative problem solving are only part of the computer-based assessment.
Cycle and participating countries PISA has been administered in a triennial cycle since the first main study in 2000.
The 2015 assessment will be the sixth administration, with more than 65 countries participating worldwide (34 OECD countries plus partner countries and economies).

158 – ANNEX A – GENERAL INFORMATION ABOUT THE INTERNATIONAL SURVEYS REVIEWED
A REVIEW OF INTERNATIONAL LARGE-SCALE ASSESSMENTS IN EDUCATION: ASSESSING COMPONENT SKILLS AND COLLECTING CONTEXTUAL DATA © OECD AND THE WORLD BANK 2015
PIRLS/prePIRLS and TIMSS/TIMSS Numeracy Progress in International Reading Literacy Study (PIRLS) and Trends in
International Mathematics and Science Study (TIMSS) are studies by the International Association for the Evaluation of Educational Achievement (IEA).
Purpose The aim of PIRLS and TIMSS is to collect internationally comparable data by
administering cognitive assessments in reading and mathematics (TIMSS and PIRLS International Study Center and IEA, n.d.), and contextual questionnaires to assist participating countries in making informed choices to improve reading, mathematics and science teaching and learning. The context questionnaires collect information from students, parents (TIMSS did this for the first time in 2011, administered jointly with PIRLS), teachers, school principals, and curriculum experts. Information on a national and community level is also collected and reported in the PIRLS and TIMSS encyclopaedias.
PrePIRLS was introduced in 2011, and can be described as a pre-stage to participating in PIRLS for developing countries. It provides a way to assess basic reading skills at the end of the primary school cycle that are a prerequisite for success in PIRLS. PrePIRLS reflects the same conception of reading as PIRLS, except it is shorter and less difficult (Mullis and Martin, 2013: 4). Thus prePIRLS permits learners from lower achieving countries to be measured more precisely than was the case on a longer and harder assessment such as PIRLS (Howie, et al., 2012: 22).
Introduced with the upcoming assessment cycle, TIMSS 2015 also has a new, less difficult mathematics assessment called TIMSS Numeracy, for countries where most children are still developing fundamental mathematics skills. TIMSS Numeracy assesses fundamental mathematical knowledge, procedures, and problem-solving strategies that are prerequisites for success on TIMSS. TIMSS Numeracy asks students at the end of the primary school cycle to answer questions and work out problems similar to TIMSS, except with easier numbers and more straightforward procedures (Mullis and Martin, 2013: 7-8).
Together with IEA’s prePIRLS reading assessment, TIMSS Numeracy is intended to respond to the needs of the global education community and efforts to work towards universal learning for all children. The contextual questionnaires are the same as in regular PIRLS and TIMSS.
Target population and sampling PIRLS and TIMSS define their international target populations in terms of the
amount of schooling students have received. The number of years of formal schooling is the basis of comparison among participating countries. Thus, the international target population for PIRLS and TIMSS at the lower grade is all students in their fourth year of formal schooling, and for TIMSS at the upper grade, all students in their eighth year of formal schooling. Both studies recommend assessing the next higher grade if, for fourth grade students, the average age at the time of testing would be less than 9.5 years and, for eighth grade students, less than 13.5 years (Mullis and Martin, 2013: 4) (Joncas and Foy, 2012: 3-4).
PrePIRLS and TIMSS Numeracy are designed for students at the end of the primary school cycle. Depending on a country’s educational development, prePIRLS can be given at the fourth, fifth, or sixth grade (Mullis and Martin, 2013: 7-8).

ANNEX A – GENERAL INFORMATION ABOUT THE INTERNATIONAL SURVEYS REVIEWED – 159
A REVIEW OF INTERNATIONAL LARGE-SCALE ASSESSMENTS IN EDUCATION: ASSESSING COMPONENT SKILLS AND COLLECTING CONTEXTUAL DATA © OECD AND THE WORLD BANK 2015
Sampling designs for PIRLS and TIMSS require the participation of at least 150 schools with the assessment of 4 000 students (Joncas and Foy, 2012). A three-stage stratified cluster sampling design is employed in both studies. During the first stage, schools were sampled with PPS, while during the second stage classrooms were randomly selected; all students within a classroom form the third sampling unit (Joncas and Foy, 2012).
Administration PIRLS and TIMSS are administered in paper-and-pencil form. Since 2011,
countries can elect to complete the teacher and school questionnaires either via paper and pencil or online (Mullis et al., 2012: 15-16). In 2016, a computer-based assessment of online reading (ePIRLS) will be available for participating countries as an extension to PIRLS.
Cycle and participating countries TIMSS follows a four-year cycle, and was first conducted in 1995. 2015 will mark
the sixth TIMSS implementation. PIRLS follows a five-year interval with assessments in 2001, 2006, 2011 and 2016. PrePIRLS was first conducted in 2011, and TIMSS Numeracy starts in 2015. In 2011 PIRLS and TIMSS were administered together.
PIRLS 2011 had 49 participating countries, and Botswana, Colombia and South Africa took part in prePIRLS. In TIMSS 2011, 77 countries participated.
SACMEQ The Southern and Eastern Africa Consortium for Monitoring Educational Quality
(SACMEQ) carries out large-scale cross-national research studies in member countries in southern and eastern Africa (SACMEQ, n.d.-a).
Purpose SACMEQ aims to assess schooling conditions and performance levels of students
and teachers in the areas of literacy and numeracy in southern and eastern Africa (SACMEQ, n.d.-a). In addition to the cognitive assessment in reading and mathematics for students and teachers, contextual information is collected from students, teachers and school principals. SACMEQ’s data are used for in-country and cross-country analyses of results.
Target population and sampling SACMEQ’s target population are students in Grade 6.
The sample is stratified and drawn in two stages. In stage 1, schools are sampled with PPS within country-defined strata. In stage 2, students are randomly selected from each school on site by the test administrator. The minimum number of students per selected school is 25 in SACMEQ III (SACMEQ, 2007a).
For the assessment of teachers, those teachers who teach relevant subjects in the three largest Grade 6 classes are selected by the test administrator from each selected school (SACMEQ, 2007a).
The approximate sample size of each SACMEQ project was as follows: SACMEQ I – 1 000 schools, 20 000 students, 3 000 teachers; SACMEQ II – 2 000 schools,

160 – ANNEX A – GENERAL INFORMATION ABOUT THE INTERNATIONAL SURVEYS REVIEWED
A REVIEW OF INTERNATIONAL LARGE-SCALE ASSESSMENTS IN EDUCATION: ASSESSING COMPONENT SKILLS AND COLLECTING CONTEXTUAL DATA © OECD AND THE WORLD BANK 2015
40 000 students, 5 300 teachers, and SACMEQ III – 2 800 schools, 61 000 students, 8 000 teachers (SACMEQ, n.d.-b).
Administration SACMEQ is administered in paper-and-pencil mode in a group setting at school.
Cycle and participating countries To date, the SACMEQ Consortium has completed three cycles at five to six-year
intervals – SACMEQ I (1995-1999), SACMEQ II (1998-2004) and SACMEQ III (2005-2010). The fourth cycle is currently being implemented. Zambia, a PISA for Development (PISA-D) country, is among the countries participating in SACMEQ (SACMEQ, n.d.-a).
PASEC The CONFEMEN Programme for the Analysis of Education Systems (PASEC)
was established by the Conference of the Ministers of Education of French-speaking countries (CONFEMEN) in 1991 (CONFEMEN, 2013).
Purpose PASEC’s main aim is to inform member countries of the French-speaking
community on the development of their education systems, to provide inspiration on topics of common interest and reforms, and to facilitate dialogue between ministers and experts to support policy development in education (CONFEMEN, 2013).
PASEC assesses students in primary education (and the end of lower secondary, as of 2016) in reading, writing and numeracy. Contextual information is collected from students, teachers and school principals (CONFEMEN, 2012).
PASEC’s data allow for in-country and cross-country analyses (CONFEMEN, 2013).
Target population and sampling Prior to 2014, PASEC’s target population was children at the start of primary
school (Grade 2) and the end (Grade 5). From 2014, the target population is children at the start of primary school (Grade 2), at the end (Grade 6) and, as of 2016, at the end of lower secondary.
The sample is stratified and drawn in two stages. From 2014, in stage 1, schools are sampled with PPS within defined explicit strata (administrative division and school type, for example). Implicit strata are used to make sure that the sample is representative. In stage 2, 10 students are selected randomly from one Grade 2 class, and 20 students are selected from one Grade 6 class (if there is more than one Grade 2 or Grade 5 class, then one class is sampled randomly prior to sampling students) (CONFEMEN, 2012).
Administration PASEC is administered in written format, in a group setting in school, twice for
both target grades: at the beginning and at the end of the school year.

ANNEX A – GENERAL INFORMATION ABOUT THE INTERNATIONAL SURVEYS REVIEWED – 161
A REVIEW OF INTERNATIONAL LARGE-SCALE ASSESSMENTS IN EDUCATION: ASSESSING COMPONENT SKILLS AND COLLECTING CONTEXTUAL DATA © OECD AND THE WORLD BANK 2015
Cycle and participating countries PASEC was first implemented in the Central African Republic, the Democratic
Republic of the Congo, Djibouti, Mali and Senegal from 1993 to 1995. Since then it has been implemented in more than twenty education systems in Africa, the Indian Ocean and Southeast Asia.
In 2012, PASEC undertook a major review and changes will take place in its implementation. The new wave of PASEC assessments are expected to take place every four to five years, with the first major assessment in this new wave in 2014 (CONFEMEN, n.d.).
LLECE The Latin American Laboratory for Assessment of the Quality of Education
(LLECE) has been established in 1994 by the ministers of education in the region, and is co-ordinated by UNESCO’s regional office (the Regional Bureau for Education in Latin America and the Caribbean – OREALC) (UNESCO, 2013).
Purpose LLECE’s main purpose is to provide data on the quality of education within and
across countries in Latin America, and to guide decision making in public education policies (UNESCO, 2013).
LLECE consists of a curriculum-based assessment in reading, mathematics, science and writing. Contextual information is collected from students, teachers, school principals and parents (ACER, 2014).
Target population and sampling LLECE’s target population are students in Grade 3 (reading, mathematics and
writing) and in Grade 6 (reading, mathematics, writing, and science) (M. Bilagher, personal communication, 11 November 2013).
A representative sample of students is tested in each country, using a two-stage stratified sampling design. In stage 1, schools are sampled with PPS within two strata (school location and type). In stage 2, one intact class per grade is randomly selected from each sampled school (LLECE, 2010, 2013).
Administration LLECE is administered in written format, in a group setting in school (ACER,
2014).
Cycle and participating countries
LLECE was first implemented in 13 Latin American countries in 1997 (the First Regional Comparative and Explanatory Study – PERCE), followed by the Second Regional Comparative and Explanatory Study (SERCE) in 2006 and the Third Regional Comparative and Explanatory Study (TERCE) in 2013. As of November 2013, there is no defined frequency for LLECE assessments. Due to substantial changes after the first cycle, SERCE and TERCE are not comparable with PERCE (ACER, 2014).

162 – ANNEX A – GENERAL INFORMATION ABOUT THE INTERNATIONAL SURVEYS REVIEWED
A REVIEW OF INTERNATIONAL LARGE-SCALE ASSESSMENTS IN EDUCATION: ASSESSING COMPONENT SKILLS AND COLLECTING CONTEXTUAL DATA © OECD AND THE WORLD BANK 2015
WEI-SPS The World Education Indicators-Survey of Primary Schools (WEI-SPS) was
founded in 2002 as a special project within the context of the World Education Indicators (WEI) programme that was established jointly by the UIS and OECD in 1997 to consolidate and collect data on basic education statistics. WEI-SPS was designed and implemented jointly by the OECD and the UIS, supported by a network of consultants and international experts. All international survey costs and quality control costs were born by the OECD and the UIS, with financial support from the World Bank (UIS, 2009a: 7).
Purpose WEI-SPS focuses on education quality and equitable distribution among students
by collecting internationally comparable data on indicators in primary education on a system, school and classroom level, to support changes in education systems and the communities they serve (UIS, 2009a: 7). Data were obtained through questionnaires for national curriculum experts (system level), primary school principals (school level) and Grade 4 mathematics/arithmetic or reading teachers (classroom level) about school functioning, teaching, instructional environment as well as opportunities to learn, learning conditions, and available resources (UIS, 2009a). Items from other surveys that had already been tested and validated in international contexts were sourced where possible, specifically from IEA, OECD, the School Achievement Indicators Program (Canada), the Schools and Staffing Survey (United States), SACMEQ, ZEBO (Self-Evaluation in Primary Education, the Netherlands), the Victorian Department of Education (Australia) and the Assessment Research Centre (Australia). Questions that could not be sourced from other surveys were created especially for WEI-SPS (UIS, 2009a). All survey instruments and operations were highly standardised to secure international comparability.
Target population and sampling The target population of WEI-SPS comprises two survey units: schools with pupils
enrolled in the fourth grade, and teachers. A school was defined as an administrative unit or a school site (UIS, 2009a: 28). In some cases, for reasons of cost, it was decided to exclude remote schools (not to exceed 5% of the pupil population) (Zhang, Postlethwaite and Grisay, 2008: 21). The teacher target population includes all teachers within the school target population who teach the main language of instruction and/or mathematics/arithmetic to Grade 4 pupils UIS, 2009a: 29).
The WEI-SPS study employed a stratified systematic sample design. All participating countries (except India) used a single-stage procedure, where the sample of schools was selected directly from a list of eligible schools that covered the entire country. India used a two-stage procedure with school districts in four states as primary sampling units (PSU), followed by the selection of sample schools from the list of eligible PSU schools. In each selected school, every teacher teaching language/reading and/or mathematics/arithmetic to Grade 4 students was included in the sample.
The effective sample size had to cover at least 400 schools, as well as a minimum standard for response rates on school and teacher level, set to 85% (Zhang, Postlethwaite and Grisay, 2008: 21).

ANNEX A – GENERAL INFORMATION ABOUT THE INTERNATIONAL SURVEYS REVIEWED – 163
A REVIEW OF INTERNATIONAL LARGE-SCALE ASSESSMENTS IN EDUCATION: ASSESSING COMPONENT SKILLS AND COLLECTING CONTEXTUAL DATA © OECD AND THE WORLD BANK 2015
One or more national curriculum experts per country completed the curriculum questionnaire.
Administration WEI-SPS implementation is highly standardised to secure international
comparability. The survey material was distributed and collected by surveyors, who also ensured that data were correct and complete. The questionnaires were designed to be completed in less than one hour (UIS, 2009a: 9).
Cycle and participating countries WEI-SPS has been implemented in 11 out of 19 WEI countries (Argentina, Brazil,
Chile, India, Malaysia, Paraguay, Peru, Philippines, Sri Lanka, Tunisia and Uruguay) over the years 2005 and 2006 towards the end of the school year (UIS, 2009a: 9). To date, there have been no other cycles of administration.
School-based surveys
EGRA and EGMA The Early Grade Reading Assessment (EGRA) and the Early Grade Mathematics
Assessment (EGMA) were developed by RTI through funding provided USAID and the World Bank (EGRA only) (Gove and Wetterberg, 2011), in addition to resources provided by RTI.
Purpose EGRA and EGMA aim to assess children’s acquisition of basic literacy and
numeracy skills in developing countries. EGRA and EGMA frameworks have been developed by RTI in consultation with various experts. Each implementing country adapts each of the EGRA/EGMA subtasks for its specific implementation, based on the EGRA and EGMA toolkits, and may add or remove one or two of the subtasks – typically not the ones considered most critical (RTI International, 2009, 2014). Collecting contextual information is optional, and it can be obtained from students, teachers, and school principals or by classroom observation. RTI provides guidelines for planning and implementing EGRA (RTI International and International Rescue Committee, 2011).
Target population and sampling The target population is students in Grades 1 to 3. Sampling follows a specific
research design. For EGRA this is typically a three-stage sampling, consisting of: 1) schools selected; 2) classes selected from sampled schools; and 3) students selected from sampled classes. A typical three-stage sampling design for EGMA comprises: 1) regions or zones selected; 2) schools selected from sampled regions/zones; and 3) students selected from sampled schools. The sample size varies between the countries and the surveys.
Administration EGRA and EGMA are carried out orally and one-on-one in schools, and responses
are scored at the time of the test administration. It takes about 15 to 20 minutes to administer EGRA or EGMA.
164 – ANNEX A – GENERAL INFORMATION ABOUT THE INTERNATIONAL SURVEYS REVIEWED
A REVIEW OF INTERNATIONAL LARGE-SCALE ASSESSMENTS IN EDUCATION: ASSESSING COMPONENT SKILLS AND COLLECTING CONTEXTUAL DATA © OECD AND THE WORLD BANK 2015
Cycle and participating countries EGRA was first implemented in the Gambia and Senegal in 2007 and has been
implemented in more than 60 countries and in 100 languages to date. EGMA was first implemented in Kenya in 2009, and has been carried out in 14 countries to date. The administration cycle varies, depending on the country – countries choose when and how often they carry out EGRA/EGMA. Out of the countries involved in PISA-D, Cambodia, Guatemala, Senegal and Zambia participated in EGRA, while Zambia also participated in EGMA.
Household-based surveys
PIAAC The Programme for the International Assessment of Adult Competencies (PIAAC)
has been established by the OECD and implemented in 24 countries (OECD, n.d.-a). Further rounds of PIAAC are taking place. PIAAC is the latest in a series of adult competency assessments, going back to the International Adult Literacy Survey (IALS) in the 1990s.
Purpose PIAAC aims to collect and analyse data that assist governments in assessing,
monitoring and analysing the level and distribution of skills among their adult populations as well as the utilisation of skills in different contexts (OECD, n.d.-a).
PIAAC consists of three elements: 1) a cognitive assessment that evaluates the skills of adults in three fundamental domains – literacy, numeracy and problem-solving in technology-rich environments; 2) a background questionnaire that collects a range of information regarding the factors which influence the development and maintenance of skills such as education, social background, language, engagement with literacy, numeracy and ICTs; and 3) a module on skills use, which is part of the background questionnaire, and which asks adults about a number of generic skills they use in the workplace (OECD, n.d.-b).
For the purpose of PISA-D, PIAAC is not only relevant in terms of household-based sampling, but also because it is very similar to international large-scale surveys in conception, design and standardisation, with both surveys being established and managed by the OECD.
Target population and sampling PIAAC’s target population are adults, aged 16 to 65 (inclusive). Adults are to be
included regardless of citizenship, nationality or language (OECD, 2014b: 35).
According to the PIAAC Technical Standards and Guidelines, the minimum sample size requirement is 5 000 completed cases (or respondents) per reporting language for the target population. PIAAC’s standard sampling design is a stratified multi-stage clustered area sampling, but the Technical Standards and Guidelines allow each country to choose a sample design and selection approach that is optimal and the most cost effective, as long as the sample design applies full selection probability methods. Such a general approach is taken to allow for flexibility in the sampling design and to be adaptable to each country’s best sampling scenario (OECD, 2014b: 43).

ANNEX A – GENERAL INFORMATION ABOUT THE INTERNATIONAL SURVEYS REVIEWED – 165
A REVIEW OF INTERNATIONAL LARGE-SCALE ASSESSMENTS IN EDUCATION: ASSESSING COMPONENT SKILLS AND COLLECTING CONTEXTUAL DATA © OECD AND THE WORLD BANK 2015
For example, the number of sampling stages during the first PIAAC implementation, from 2008 to 2013, ranged from one to four. With one-stage sampling designs, there was only one sample unit: persons. With two-stage sampling designs, the sampling units of stage 1 could be households, towns or municipalities while “persons” was always the sampling unit for stage 2. With three-stage sampling designs, municipalities or districts were the typical sampling units for stage 1, households as the sampling unit for stage 2, and persons for stage 3. With four-stage sampling designs, example sampling units for stage 1, 2, 3 and 4 could be: regions, settlements, dwelling units and persons, respectively. Sample selection methods varied, but most countries used either simple random sampling or systematic random sampling to choose respondents for the household survey (OECD, 2013a).
Administration The survey is administered under the supervision of trained interviewers in the
respondent’s home. The background questionnaire is administered in a computer-aided personal interview format by the interviewer. The time taken to complete the questionnaire ranges between 30 and 45 minutes.
Following completion of the background questionnaire, the respondent undertakes the cognitive assessment either using the computer provided by the interviewer or by completing printed test booklets. On average, the respondents took 50 minutes to complete the cognitive assessment (OECD, 2013b: 26; OECD, 2013c: 55).
Cycle and participating countries Participants in PIAAC round 1 (2008–2013) include (* indicates OECD partner
countries): Australia, Austria, Belgium (Flanders), Canada, Czech Republic, Denmark, Estonia, Finland, France, Germany, Ireland, Italy, Japan, Korea, Netherlands, Norway, Poland, Russian Federation,* Slovak Republic, Spain, Sweden, United Kingdom (England and Northern Ireland) and United States.
Countries implementing PIAAC round 2 (2012–2016): Chile, Greece, Indonesia,* Israel, Lithuania,* New Zealand, Singapore,* Slovenia and Turkey.
PIAAC round 3 is planned to take place between 2014 and 2018 (OECD, n.d.-c).
STEP Skills Towards Employability and Productivity (STEP) is a skills measurement
programme by the World Bank, tailored to low and middle-income country contexts.
Purpose STEP provides data about skill stocks and job demands in low and middle-income
country contexts on both the national and international level, to identify policy and institutional implications in order to improve the effectiveness of education and training, and to help reduce mismatches between skills supply and demand.
The programme consists of household and employer surveys which both contain detailed measures of required education and experience and of the required skills in reading, writing, mathematics, problem-solving, interpersonal/socio-emotional traits, technology use, and manual work required by jobs (Pierre et al., 2014: 2, 9). Technical standards ensure a highly standardised implementation and ensure international comparability.

166 – ANNEX A – GENERAL INFORMATION ABOUT THE INTERNATIONAL SURVEYS REVIEWED
A REVIEW OF INTERNATIONAL LARGE-SCALE ASSESSMENTS IN EDUCATION: ASSESSING COMPONENT SKILLS AND COLLECTING CONTEXTUAL DATA © OECD AND THE WORLD BANK 2015
The STEP reading literacy assessment was developed by the Educational Testing Service (ETS) and the World Bank and is based on the PIAAC literacy scale. Items were either taken from the PIAAC paper-based assessment or were adapted from the PIAAC computer-based instruments; or had been administered in the IALS or the Adult Literacy and Life Skills Survey (ALL), which were linked to the PIAAC literacy scale. Apart from these common instruments, other measures ensured that the STEP literacy scale would be comparable to the PIAAC literacy scale: target populations – STEP as a subset of the adult population, ages 16-65, is included in the total population of PIAAC national samples; survey operations – test administration through an interviewer face-to-face at home or at a place most convenient for the respondent; and identical psychometric principles (Pierre et al., 2014: 45, 61).
Target population and sampling The targeted population of STEP is urban adults aged 15 to 64, whether employed
or not (World Bank, 2013: 49).1 Sample sizes for the household survey vary from country to country and were determined, based on the scope of the survey and literacy rates, to ensure that a sufficient number of reading literacy booklets would be completed (Pierre et al., 2014: 61). According to the STEP Technical Standards, a preferred sample design consists of at least 6 000 households (such as a 3 000 initial sample and 3 400 reserve sample) and will be selected in three stages: 1) 200 small territorial areas or PMUs (see above); 2) systematic selection of 15 households in each selected PSU, plus 15 households as the reserve sample in each selected PSU; and 3) random selection of the main respondent in each visited household from among all household members aged 15 to 64 years (World Bank, 2013: 63).
For the survey of employers, firm registries were used as a sampling frame (Pierre et al., 2014: 64); sample size varies from about 300 to 500 workplaces. Response rates are low, ranging from 38% to 51%. According to Pierre et al. (2014: 67), employers lack time but are also wary of providing potentially sensitive information about their business to outsiders.
Administration The household questionnaire was administered through paper and pencil based on
face-to-face interview in all countries except Colombia and Kenya, where computer-assisted personal interviews were carried out. The reading literacy assessment was administered as a paper-and-pencil test. The respondent was asked to sit alone and complete the assessment without any help from the interviewer (Pierre, et al., 2014: 34, 59).
The employer survey was carried out using paper and pencil (Pierre et al., 2014: 66).
Cycle and participating countries STEP was implemented in a first wave of seven countries in 2012: Bolivia,
Colombia (household survey only), and a second wave of six countries in 2013: Armenia,
Georgia, Macedonia; Ghana, Kenya – household survey only; Azerbaijan – employer survey only) (Pierre et al., 2014: 7, 8). Wave 3 started in 2014 (Acosta, 2014).

ANNEX A – GENERAL INFORMATION ABOUT THE INTERNATIONAL SURVEYS REVIEWED – 167
A REVIEW OF INTERNATIONAL LARGE-SCALE ASSESSMENTS IN EDUCATION: ASSESSING COMPONENT SKILLS AND COLLECTING CONTEXTUAL DATA © OECD AND THE WORLD BANK 2015
LAMP The Literacy Assessment and Monitoring Programme (LAMP) is a
household-based assessment of adults’ reading and numeracy skills, developed by the UIS.
Purpose The main purpose of LAMP is to regularly provide data on the distribution of
reading and numeracy skills within the youth and adult populations of a country, in order to effectively plan and monitor initiatives to improve literacy skills. LAMP provides a global methodological standard for the assessment, to allow comparisons across countries at different stages of development and linguistic contexts (UIS, 2009b: 43). However, the focus lies on customised national implementation (country ownership of the programme) and on enabling countries to regularly generate and use LAMP data for monitoring.
The UIS has the main responsibility for the developmental work and the methodology. In addition, the UIS plays an important role in implementing LAMP on the national level. For example, it provides technical support to countries during implementation, through establishing technical advisory bodies in each region of the world to establish, monitor and guarantee quality standards (UIS, 2009b: 44, 45).
The LAMP framework is adapted from IALS/ALL. One third of the test items are from IALS and ALL (and belong to ETS/Statistics Canada), and participating countries also developed LAMP-specific items (B. Tay-Lim, personal communication, 13 November 2014). The LAMP source instruments are provided by the UIS.
LAMP consists of a background questionnaire adapted to the country context, and three adaptive literacy assessment components: 1) a filter test to establish if the respondent shows lower or higher levels of literacy skills; 2) a module for those with higher performance, supplementing the information produced by the filter test and establishing more precisely where the respondent stands in relation to the higher skill levels; and 3) a module for those with lower performance, composed of two instruments. The locator test supplements the information produced by the filter test and establishes more precisely where the respondent stands in relation to the lower skill levels. The reading components provide an in-depth exploration of the operations that might be preventing the respondent from achieving a better performance. Reading components are provided in English; however, each country implementing LAMP will develop a set of component measures unique to its language, script and culture, based on the guidelines specified in the reading component framework (UIS, 2009b). An unsolved question is how to link the reading components to each other and to the higher order skills (B. Tay-Lim, personal communication, 13 November 2014).
Target population and sampling LAMP’s target population covers the whole population of adults aged 15 and over
residing in a particular country. Every country makes its own sampling design (as part of the National Planning Report), which is validated by an independent consultant (Westat). Most countries choose a two-stage sampling design with 1) household; and 2) individual in the household. Mongolia chose a three-stage design including province (B. Tay-Lim, personal communication, 13 November 2014).

168 – ANNEX A – GENERAL INFORMATION ABOUT THE INTERNATIONAL SURVEYS REVIEWED
A REVIEW OF INTERNATIONAL LARGE-SCALE ASSESSMENTS IN EDUCATION: ASSESSING COMPONENT SKILLS AND COLLECTING CONTEXTUAL DATA © OECD AND THE WORLD BANK 2015
Administration LAMP is administered in paper-and-pencil mode by an interviewer.
Cycle and participating countries There is no common implementation cycle for LAMP. As a general rule, UIS
advises countries to implement LAMP in cycles of five to ten years, unless circumstances change in a way that would have a significant impact on the “stock” of abilities among youth and adults (UIS, 2009b: 43).
To date, five countries have implemented LAMP as a main survey: Mongolia (2010), Jordan (2011), Palestinian autonomous territories (2011), Paraguay (2011), and Lao PDR (2014) (B. Tay-Lim, personal communication, 10 December 2014). El Salvador, Kenya, Morocco, and Niger participated in a pilot only (B. Tay-Lim, personal communication, 13 November 2014).
ASER The Annual Status of Education Report (ASER) survey is a household-based
survey of school-aged children in all rural districts in India. The ASER Centre in New Delhi, an autonomous unit within the Pratham network (a non-governmental organisation), is responsible for instrument development and implementation.
Purpose ASER’s main purpose is to obtain reliable estimates of the status of children’s
schooling and basic learning in reading and mathematics at the national and state level, and to measure the change in these basic learning and school statistics over time. Results can be compared across states.
The ASER assessment tools measure basic skills in reading and arithmetic. Their development was informed by the findings of an analysis of language and mathematics text books for early grades across all major Indian states in 2005 (ASER Centre, 2014: 45).
The reading assessment is developed separately in each of the different assessment languages – there were 20 languages in 2013 (R. Banerji, personal communication, 27 April 2014). The Hindi reading tool is developed at the ASER Centre in New Delhi, and the reading tools in all other languages are developed by the Pratham and ASER Centre state teams (ASER Centre, 2013; R. Banerji, personal communication, 27 April 2014). The development of the reading tool follows guidelines prepared in-house (R. Banerji, personal communication, 19 November 2013).
The arithmetic tool is developed at the ASER Centre in New Delhi and translated into other assessment languages where required (that is, where different languages use different numeral representations) (R. Banerji, personal communication, 19 November 2013).
The cognitive tools are adaptive, starting with a middle-difficulty task and moving either up or down depending on whether or not the child successfully completes that initial task.
Contextual information is collected about households, one government school in each sampled village, and the conditions of sampled villages.

ANNEX A – GENERAL INFORMATION ABOUT THE INTERNATIONAL SURVEYS REVIEWED – 169
A REVIEW OF INTERNATIONAL LARGE-SCALE ASSESSMENTS IN EDUCATION: ASSESSING COMPONENT SKILLS AND COLLECTING CONTEXTUAL DATA © OECD AND THE WORLD BANK 2015
Target population and sampling ASER’s target population are children living in rural areas in India, ages 3 to 16
for enrolment and background information (both assessed in the contextual survey sheets), ages 5 to 16 for the assessment. ASER uses two-stage sampling; Stage 1 consists of a panel of 30 villages per rural district, which is replenished each year (ten new villages are selected by probability proportional to size, while ten villages are removed from the previous selection). Stage 2 consists of 20 households sampled from each village on site by a test administrator. All children in the target population in a sampled household are assessed.
Administration ASER is administered in homes using an oral and one-on-one setting.
Cycle and participating countries ASER has been implemented annually since it was first carried out in India in
2005. Since 2008 it has been implemented by the ASER centre (a unit in the Pratham network).
Uwezo Uwezo, meaning “capability” in Kiswahili, is a household survey to measure the
basic literacy and numeracy skills of school-aged children in Kenya, Tanzania and Uganda. Currently, Uwezo is housed and managed by Twaweza, a citizen-centred organisation in East Africa legally managed by the Humanist Institute for Cooperation with Developing countries (Hivos) at SNV, the Netherlands Development Organisation (Twaweza, 2008; Uwezo, 2011a).2 The work of Uwezo and Twaweza is funded by a consortium of donors including the William and Flora Hewlett Foundation, the UK Department for International Development, the Swedish International Development Agency, Hivos, the World Bank, and the Children’s Investment Fund Foundation (Uwezo, 2014a).
Purpose The main aim of Uwezo is to obtain information about the basic literacy and
numeracy skills of school-aged children in Kenya, Tanzania and Uganda in order to encourage changes in educational policy and practice, and as such contribute to the improvement of education quality (Twaweza, 2013; Uwezo, 2009, 2011b, 2014a).
Uwezo’s methodology is based on ASER, but adapted to the East African context. Uwezo’s literacy and numeracy assessments are aligned with the Grade 2 curriculum. As in ASER, the cognitive tools are adaptive, starting with a middle-difficulty task and moving either up or down depending on whether or not the child successfully completes that initial task. In addition to the assessment, Uwezo collects contextual information about children, households, villages and schools. The results are published via a report at the regional level (for East Africa) and reports at the national level, for districts and regions within the country.
Target population and sampling Uwezo’s target population are children aged 6 to 16 living in urban and rural areas
in Kenya, Tanzania and Uganda. There are contradictory statements about the lower age bound in the definition of the target population for Tanzania, ranging from 5 to 7

170 – ANNEX A – GENERAL INFORMATION ABOUT THE INTERNATIONAL SURVEYS REVIEWED
A REVIEW OF INTERNATIONAL LARGE-SCALE ASSESSMENTS IN EDUCATION: ASSESSING COMPONENT SKILLS AND COLLECTING CONTEXTUAL DATA © OECD AND THE WORLD BANK 2015
years (Uwezo, 2012: 4); (Uwezo, 2014b). In all the references we have seen, the upper bound is consistently given as 16 years old. Uwezo uses a three-stage sampling approach. At stage 1 a random sample of districts is selected; at stage 2 villages are selected with PPS from sampled districts, and at stage 3, 30 households are selected from each sampled village. Within the household all children in the target population are tested, whether they are in school or not.
Administration Like ASER, Uwezo is administered in homes, orally and one-on-one.
Cycle and participating countries Uwezo started in 2009/2010 with a pilot, and has been conducted annually since
2011.
Notes
1. Georgia’s National Survey Design Planning Report (NSDPR) is cited here because the STEP Technical Standards are embedded in the report. In fact, the STEP Technical Standards are embedded in all other NSDPRs for both Wave 1 and 2 countries, rather than being a stand-alone document. NSDPRs of Wave 2 countries will be cited throughout this review when referring to the STEP Technical Standards, as Wave 2 STEP surveys have been implemented more recently.
2. Twaweza plans to become a legally independent entity in 2014 (Twaweza, 2008, 2011)..
ANNEX A – GENERAL INFORMATION ABOUT THE INTERNATIONAL SURVEYS REVIEWED – 171
A REVIEW OF INTERNATIONAL LARGE-SCALE ASSESSMENTS IN EDUCATION: ASSESSING COMPONENT SKILLS AND COLLECTING CONTEXTUAL DATA © OECD AND THE WORLD BANK 2015
References
ACER (2014), The Latin-American Laboratory for Assessment of the Quality of Education: Measuring and Comparing Educational Quality in Latin America: Assessment GEMs 3, Australian Council for Educational Research, Melbourne.
Acosta, P. (2014), “STEP skills measurement: Overview of initial results”, presentation at World Bank Social Protection Plenary, Istanbul, 7 May 2014, www.worldbank.org/content/dam/Worldbank/Event/social-protection/Plenary 3 Pablo Acosta.pdf.
ASER Centre (2014), Annual Status of Education Report (Rural) 2013, ASER Centre, New Delhi.
ASER Centre (2013), Guidelines for Development of ASER Tools, ASER Centre, New Delhi.
CONFEMEN (2014), “Subregional workshop on the role and place of assessment in education systems' steering and reform: Policymakers workshop”, summary report, CONFEMEN, Dakar, Senegal.
CONFEMEN (2013), CONFEMEN Programme for the Analysis of Education Systems: PASEC, CONFEMEN, Dakar.
CONFEMEN (2012), Améliorer la Qualité de l’Education au Tchad : Quels sont les Facteurs de Réussite? Évaluation Diagnostique PASEC-CONFEMEN 2e et 5e du Primaire Année Scolaire 2009/2010, CONFEMEN, Dakar.
CONFEMEN (n.d.), PASEC - Evaluations Devoted to Quality Education for All, CONFEMEN, Dakar.
Gove, A. and A. Wetterberg (eds.) (2011), The Early Grade Reading Assessment: Applications and Interventions to Improve Basic Literacy, RTI International, North Carolina.
Howie, S. et al. (2012), PIRLS 2011: South African Children’s Reading Literacy Achievement, Summary Report, Centre for Evaluation and Assessment, University of Pretoria, Pretoria, www.up.ac.za/media/shared/Legacy/sitefiles/file/publications/2013/pirls_2011_report_12_dec.pdf.
Joncas, M. and P. Foy (2012), “Sample design in TIMSS and PIRLS”, in M.O. Martin and I.V.S. Mullis (eds.), Methods and procedures in TIMSS and PIRLS 2011, TIMSS and PIRLS International Study Center, Chestnut Hill, MA.
LLECE (2013), Diseño Muestral Tercer Estudio Regional Comparativo y Explicativo (TERCE) (Sampling Framework for the Third Regional Comparative and Explanatory Study (TERCE), LLECE, Santiago.
LLECE (2010), Compendio de los Manuales del SERCE (SERCE Manuals Compendium), LLECE and OREALC/UNESCO Santiago, Santiago.

172 – ANNEX A – GENERAL INFORMATION ABOUT THE INTERNATIONAL SURVEYS REVIEWED
A REVIEW OF INTERNATIONAL LARGE-SCALE ASSESSMENTS IN EDUCATION: ASSESSING COMPONENT SKILLS AND COLLECTING CONTEXTUAL DATA © OECD AND THE WORLD BANK 2015
Mullis, I.V.S. et al. (2012), “Assessment framework and instrument development”, in M.O. Martin and I.V.S. Mullis (eds.), Methods and Procedures in TIMSS and PIRLS 2011, TIMSS and PIRLS International Study Center, Chestnut Hill, MA.
Mullis, I.V.S. and M.O. Martin (eds.) (2013), PIRLS 2016 Assessment Framework, TIMSS and PIRLS International Study Center and IEA, Chestnut Hill, MA and Amsterdam.
OECD (2014a), PISA 2012 Technical Report, OECD Publishing, Paris, www.oecd.org/pisa/pisaproducts/PISA-2012-technical-report-final.pdf.
OECD (2014b), PIAAC Technical Standards and Guidelines, OECD, Paris, http://tinyurl.com/njuvvy2.
OECD (2013a), “Technical report of the Survey of Adult Skills (PIAAC)”, pre-publication copy, OECD, Paris.
OECD (2013b), OECD skills outlook 2013: First results from the Survey of Adult Skills: OECD Publishing, Paris, http://dx.doi.org/10.1787/9789264204256-en.
OECD (2013c), The Survey of Adult Skills: Reader's companion, OECD Publishing, Paris, http://dx.doi.org/10.1787/9789264204027-en.
OECD (n.d.-a), “OECD Skills Survey” www.oecd.org/site/piaac (accessed 25th November 2014).
OECD (n.d.-b), “OECD Skills Surveys: PIAAC: Main elements of the survey”, www.oecd.org/site/piaac/mainelementsofthesurveyofadultskills.htm (accessed (20 November 2014).
OECD (n.d.-c), “OECD Skills Surveys: About the Survey of Adult Skills (PIAAC), www.oecd.org/site/piaac/surveyofadultskills.htm (accessed 25 November 2014).
Pierre, G. et al. (2014), STEP Skills Measurement Surveys: Innovative Tools for Assessing Skills, working paper, World Bank Human Development Network, Washington DC.
RTI International (2014), Early Grade Mathematics Assessment (EGMA) Toolkit, Research Triangle Institute International, North Carolina.
RTI International (2009), Early Grade Reading Assessment Toolkit, RTI International, North Carolina.
RTI International and International Rescue Committee (2011), Guidance Notes for Planning and Implementing EGRA, RTI International, North Carolina.
SACMEQ (2007a), SACMEQ III: Main Study: Manual for Data Collectors, SACMEQ, Paris.
SACMEQ (n.d.-a), “Origins”, www.sacmeq.org/origins (accessed on 11 April 2014).
SACMEQ (n.d.-b), “SACMEQ projects” www.sacmeq.org/sacmeq-projects (accessed on 11 April 2014).
TIMSS and PIRLS International Study Center and IEA (n.d.), TIMSS 2011 Test Administrator Manual, TIMSS and PIRLS International Study Center and IEA, Chestnut Hill, MA and Amsterdam, www.rie.ir/uploads/T11_Test Administrator Manual.pdf.
Twaweza (2013), “Twaweza“, www.twaweza.org (accessed 13 March 2014).

ANNEX A – GENERAL INFORMATION ABOUT THE INTERNATIONAL SURVEYS REVIEWED – 173
A REVIEW OF INTERNATIONAL LARGE-SCALE ASSESSMENTS IN EDUCATION: ASSESSING COMPONENT SKILLS AND COLLECTING CONTEXTUAL DATA © OECD AND THE WORLD BANK 2015
Twaweza (2008), Twaweza! Fostering an Ecosystem of Change in East Africa through Imagination, Citizen Agency and Public Accountability, Twaweza, Dar es Salaam.
UIS (2009a), WEI Survey of Primary Schools: Technical Report, UNESCO Institute for Statistics, Montreal.
UIS (2009b), The Next Generation of Literacy Statistics: Implementing the Literacy Assessment and Monitoring Programme (LAMP), UNESCO Institute for Statistics, Montreal.
UNESCO (2013), “Latin American Laboratory for Assessment of the Quality of Education (LLECE)”, http://tinyurl.com/pmq9om9 (accessed 13 October 2013).
Uwezo (2014a), “Uwezo”, www.uwezo.net (accessed on 11 March 2014).
Uwezo (2014b), “Sampling and data comparison across JUBA countries: Case of Uwezo”, presentation, Uwezo, Nairobi.
Uwezo (2012), Standards Manual, Uwezo, Nairobi.
Uwezo (2011a), “Improving learning outcomes in East Africa 2009-2013: Strategy update”, www.uwezo.net/strategies (accessed 13 March 2014).
Uwezo (2011b), “Improving learning outcomes in East Africa 2009-2013”, www.uwezo .net/strategies (accessed on 11 March 2014).
Uwezo (2009), “Uwezo! Promoting learning in East Africa”, www.uwezo.net/strategies (accessed on 11 March 2014).
World Bank (2013), National Survey Design Planning Report: Skills Toward Employment and Productivity (STEP): Georgia, World Bank, Washington DC.
Zhang, Y., T.N. Postlethwaite and A. Grisay (eds.) (2008), A View Inside Primary Schools: A World Education Indicators (WEI) Cross-National Study, UNESCO Institute for Statistics, Montreal.


ANNEX B SAMPLE ITEMS FROM SELECTED INTERNATIONAL ASSESSMENTS – 175
A REVIEW OF INTERNATIONAL LARGE-SCALE ASSESSMENTS IN EDUCATION: ASSESSING COMPONENT SKILLS AND COLLECTING CONTEXTUAL DATA © OECD AND THE WORLD BANK 2015
Annex B
Sample items from selected international assessments
Sample items from PIRLS

176 – ANNEX B – SAMPLE ITEMS FROM SELECTED INTERNATIONAL ASSESSMENTS
A REVIEW OF INTERNATIONAL LARGE-SCALE ASSESSMENTS IN EDUCATION: ASSESSING COMPONENT SKILLS AND COLLECTING CONTEXTUAL DATA © OECD AND THE WORLD BANK 2015

ANNEX B SAMPLE ITEMS FROM SELECTED INTERNATIONAL ASSESSMENTS – 177
A REVIEW OF INTERNATIONAL LARGE-SCALE ASSESSMENTS IN EDUCATION: ASSESSING COMPONENT SKILLS AND COLLECTING CONTEXTUAL DATA © OECD AND THE WORLD BANK 2015

178 – ANNEX B – SAMPLE ITEMS FROM SELECTED INTERNATIONAL ASSESSMENTS
A REVIEW OF INTERNATIONAL LARGE-SCALE ASSESSMENTS IN EDUCATION: ASSESSING COMPONENT SKILLS AND COLLECTING CONTEXTUAL DATA © OECD AND THE WORLD BANK 2015

ANNEX B SAMPLE ITEMS FROM SELECTED INTERNATIONAL ASSESSMENTS – 179
A REVIEW OF INTERNATIONAL LARGE-SCALE ASSESSMENTS IN EDUCATION: ASSESSING COMPONENT SKILLS AND COLLECTING CONTEXTUAL DATA © OECD AND THE WORLD BANK 2015
Source: P. Foy and K. Drucker (eds.) (2013), PIRLS 2011 User Guide for the International Database: PIRLS Released Passages and Items, TIMSS and PIRLS International Study Center, and IEA, Chestnut Hill, MA, and Amsterdam.
A corrigendum has been issued for this page. See: http://www.oecd.org/about/publishing/Corrigendum-Review-International-Large-Scale-Assessments-Education.pdf

180 – ANNEX B – SAMPLE ITEMS FROM SELECTED INTERNATIONAL ASSESSMENTS
A REVIEW OF INTERNATIONAL LARGE-SCALE ASSESSMENTS IN EDUCATION: ASSESSING COMPONENT SKILLS AND COLLECTING CONTEXTUAL DATA © OECD AND THE WORLD BANK 2015
Sample items from TIMSS
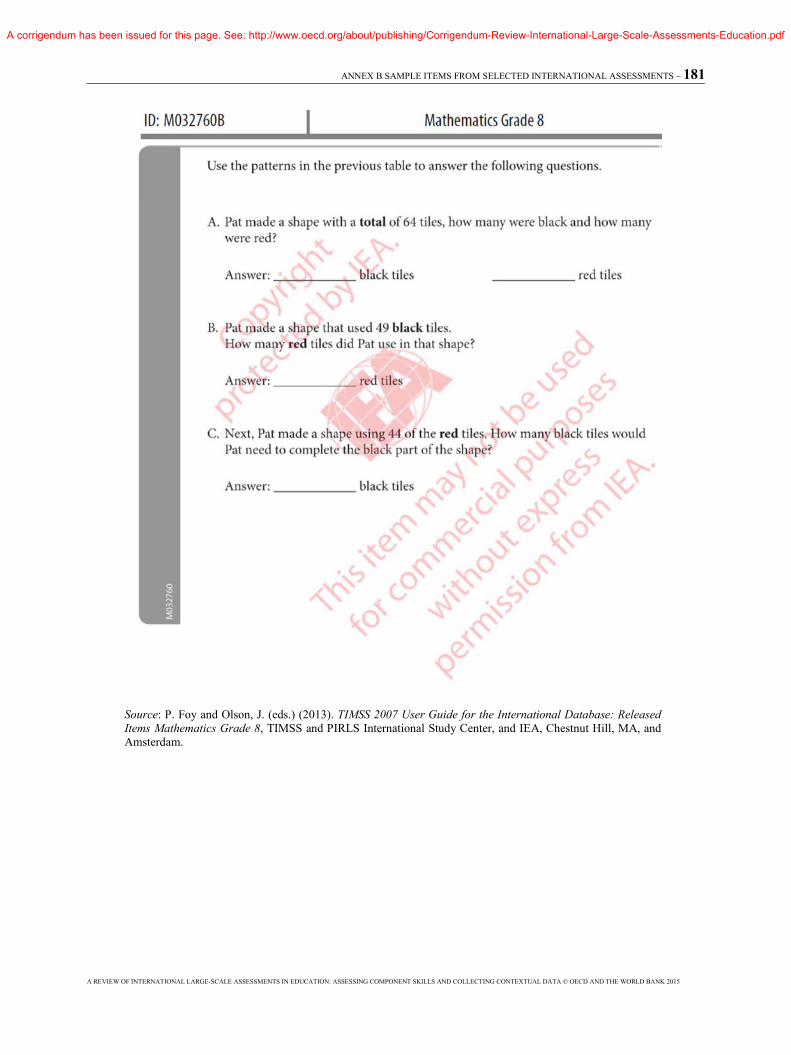
ANNEX B SAMPLE ITEMS FROM SELECTED INTERNATIONAL ASSESSMENTS – 181
A REVIEW OF INTERNATIONAL LARGE-SCALE ASSESSMENTS IN EDUCATION: ASSESSING COMPONENT SKILLS AND COLLECTING CONTEXTUAL DATA © OECD AND THE WORLD BANK 2015
Source: P. Foy and Olson, J. (eds.) (2013). TIMSS 2007 User Guide for the International Database: Released Items Mathematics Grade 8, TIMSS and PIRLS International Study Center, and IEA, Chestnut Hill, MA, and Amsterdam.
A corrigendum has been issued for this page. See: http://www.oecd.org/about/publishing/Corrigendum-Review-International-Large-Scale-Assessments-Education.pdf
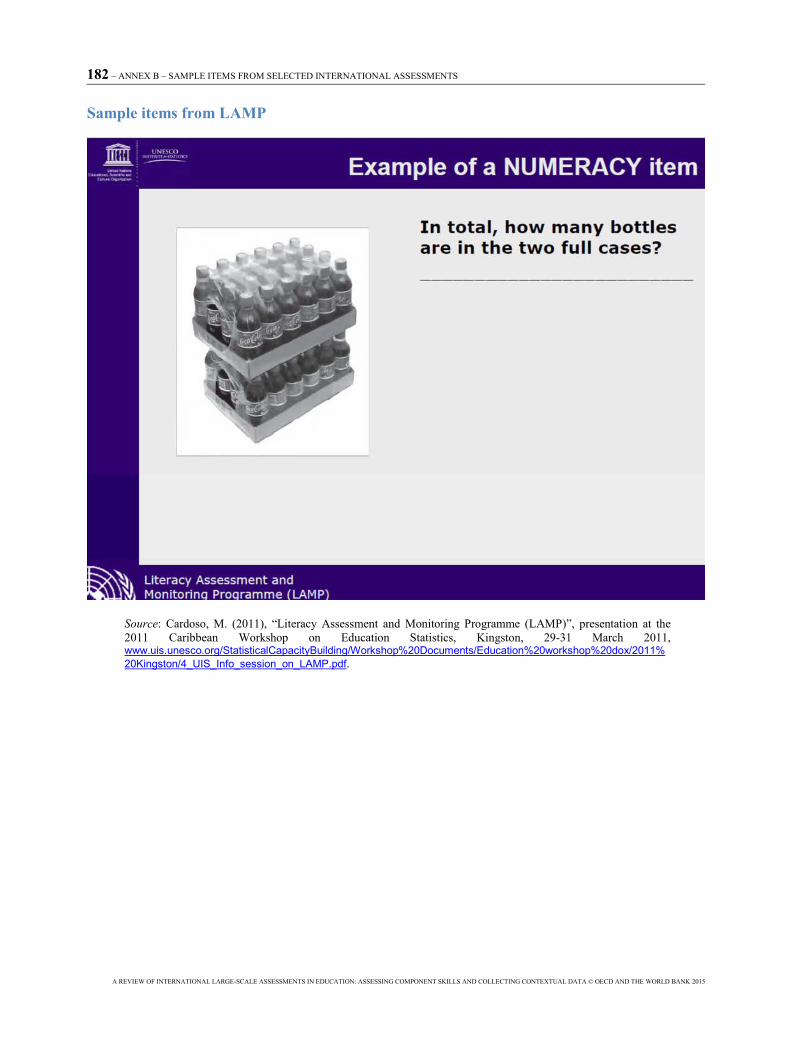
182 – ANNEX B – SAMPLE ITEMS FROM SELECTED INTERNATIONAL ASSESSMENTS
A REVIEW OF INTERNATIONAL LARGE-SCALE ASSESSMENTS IN EDUCATION: ASSESSING COMPONENT SKILLS AND COLLECTING CONTEXTUAL DATA © OECD AND THE WORLD BANK 2015
Sample items from LAMP
Source: Cardoso, M. (2011), “Literacy Assessment and Monitoring Programme (LAMP)”, presentation at the 2011 Caribbean Workshop on Education Statistics, Kingston, 29-31 March 2011, www.uis.unesco.org/StatisticalCapacityBuilding/Workshop%20Documents/Education%20workshop%20dox/2011%20Kingston/4_UIS_Info_session_on_LAMP.pdf.

ANNEX B SAMPLE ITEMS FROM SELECTED INTERNATIONAL ASSESSMENTS – 183
A REVIEW OF INTERNATIONAL LARGE-SCALE ASSESSMENTS IN EDUCATION: ASSESSING COMPONENT SKILLS AND COLLECTING CONTEXTUAL DATA © OECD AND THE WORLD BANK 2015
Source: Cardoso, M. (2011), “Literacy Assessment and Monitoring Programme (LAMP)”, presentation at the 2011 Caribbean Workshop on Education Statistics, Kingston, 29-31 March 2011, http://www.uis.unesco.org/StatisticalCapacityBuilding/Workshop%20Documents/Education%20workshop%20dox/2011%20Kingston/4_UIS_Info_session_on_LAMP.pdf.
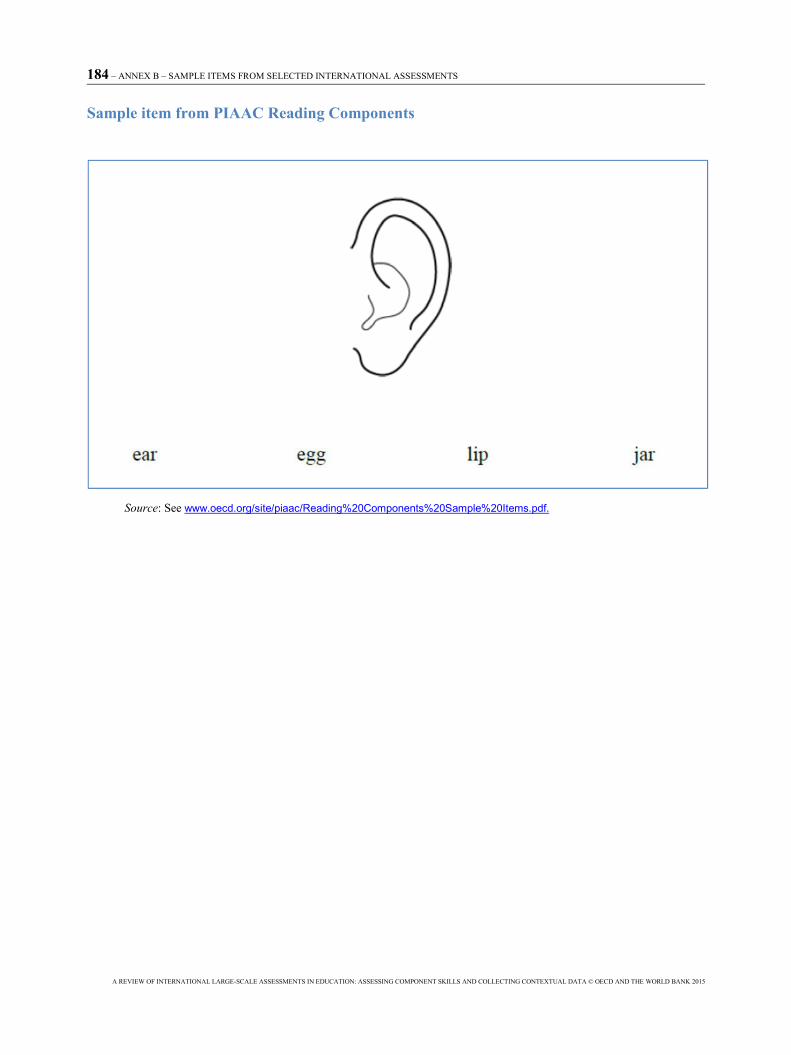
184 – ANNEX B – SAMPLE ITEMS FROM SELECTED INTERNATIONAL ASSESSMENTS
A REVIEW OF INTERNATIONAL LARGE-SCALE ASSESSMENTS IN EDUCATION: ASSESSING COMPONENT SKILLS AND COLLECTING CONTEXTUAL DATA © OECD AND THE WORLD BANK 2015
Sample item from PIAAC Reading Components
Source: See www.oecd.org/site/piaac/Reading%20Components%20Sample%20Items.pdf.

ANNEX C – OVERVIEW TABLES RELATED TO COGNITIVE DATA COLLECTION INSTRUMENTS – 185
A REVIEW OF INTERNATIONAL LARGE-SCALE ASSESSMENTS IN EDUCATION: ASSESSING COMPONENT SKILLS AND COLLECTING CONTEXTUAL DATA © OECD AND THE WORLD BANK 2015
Annex C
Overview tables related to cognitive data collection instruments
Table C.1 Reading frameworks for other assessments
Assessment Reading definition
Large-scale international surveys
PIRLS Currently, the PIRLS definition of reading literacy is (Mullis, Martin, and Sainsbury, 2013: 13): “the ability to understand and use those written language forms required by society and/or valued by the individual. Readers can construct meaning from texts in a variety of forms. They read to learn, to participate in communities of readers in school and everyday life, and for enjoyment” (Mullis et al., 2013: 14). PIRLS assesses students’ reading achievement within the two overarching purposes for reading that account for most of the reading done by young students both in and out of school: • reading for literary experience • reading to acquire and use information. The prePIRLS 2016 assessment reflects the same conception of reading as PIRLS 2016, except it is less difficult and is designed to test basic reading skills that are a prerequisite for PIRLS. The reading passages are shorter, with easier vocabulary and syntax. Students’ ability to read and answer questions about these passages can provide valuable information about their strengths and weaknesses in reading comprehension (Mullis and Martin, 2013: 8).
TIMSS Not relevant – mathematics and science only.
SACMEQ Reading literacy is defined as: “the ability to understand and use those written language forms required by society and/or valued by the individual.”Narrative prose: Continuous texts in which the writer aims to tell a story – whether this be fact or fiction. Expository prose: Continuous text in which the writer aims to describe, explain, or otherwise convey factual information or opinion to the reader. Documents: Structured information organised by the writer in a manner that requires the reader to search, locate, and process selected facts, rather than to read every word of a continuous text (Ross et al., 2004: 46).

186 – ANNEX C – OVERVIEW TABLES RELATED TO COGNITIVE DATA COLLECTION INSTRUMENTS
A REVIEW OF INTERNATIONAL LARGE-SCALE ASSESSMENTS IN EDUCATION: ASSESSING COMPONENT SKILLS AND COLLECTING CONTEXTUAL DATA © OECD AND THE WORLD BANK 2015
Assessment Reading definition
Large-scale international surveys (cont.)
PASEC The 2014 PASEC international assessment puts forward a new methodological framework, taking into consideration:• scientific research in reading, reading comprehension and mathematics • internationally shared common skills standards in reading and mathematics • students’ skills level in reading mathematics, but also the environmental context of the countries assessed and the effective curricula of these countries • international standards for measuring reading comprehension and mathematics. Grade 2: skills assessed in the language of instruction are used to measure students’ abilities at an early stage of learning to read. Oral comprehension: understand vocabulary, recognise vocabulary and word families, understand a text. Familiarisation with writing, phonological awareness and reading decoding: read invented words, read letters, recognise syllables, read words, recognise invented words. Reading comprehension: decode the meaning of words, read and understand sentences, understand a text. Grade 6: levels of decoding and reading comprehension should be assessed, for the diagnostic of students’ daily reading abilities (in and out of school), in order for them to learn, understand and entertain themselves. The tests focus on two major domains of reading competencies: decoding words and isolated sentences and texts comprehension (extract explicit information, make simple inferences, interpret and combine information).
LLECE Reading: Correctly interpret and resolve communicative problems based on written information contained in various authentic texts. Authentic texts could be news articles, encyclopaedia articles, fiction, entertainment, educational, functional and others.
Domain content Process
Reading Reading of paragraphs and textsReading of statements and words
LiteralSimple inference Complex inference
WEI There are no cognitive items in this assessment
School-based surveys
EGRA In the EGRA toolkit, five essential components of effective reading are listed:• Phonemic awareness • Phonics • Fluency • Vocabulary • Comprehension

ANNEX C – OVERVIEW TABLES RELATED TO COGNITIVE DATA COLLECTION INSTRUMENTS – 187
A REVIEW OF INTERNATIONAL LARGE-SCALE ASSESSMENTS IN EDUCATION: ASSESSING COMPONENT SKILLS AND COLLECTING CONTEXTUAL DATA © OECD AND THE WORLD BANK 2015
Household-based surveys
PIAAC Task characteristics (categorising texts)The following variables have been used to categorise texts for the purposes of the PIAAC assessment: • Medium (print and digital) • Format (continuous and non-continuous) • Type (rhetorical stance) • Physical layout (type of matrix organisation) • Features unique to digital texts • Social context (OECD, 2013: 20). Reading components PIAAC includes a component test intended to provide more information on the abilities of those with low levels of literacy (OECD, 2013: 27). The PIAAC components assessment includes test of print vocabulary, sentence processing and basic passage comprehension. In skilled reading, these components are integrated to support literacy performance. During acquisition, even by adults, they may be measured separately, with different profiles having implications for learning, instruction and policy (OECD, 2013: 28).
STEP Reading literacy assessmentThe STEP reading literacy assessment has been developed specifically for use in the context of developing countries, and it includes sets of questions taken from PIAAC, the International Adult Literacy Survey, and the Adult Literacy and Life Skills Survey. This overlap allows countries participating in the STEP programme to compare their literacy results with those of over 30 other countries (Pierre et al., 2014: 35). Definition of literacy: “Understanding, evaluating, using and engaging with written texts to participate in society, to achieve one’s goals, and to develop one’s knowledge and potential” (PIAAC Literacy Framework, Pierre et al., 2014: 36).
LAMP • Alphanumeric perceptual knowledge and familiarity • Word recognition • Decoding and sight recognition • Sentence processing • Passage reading
ASER • Letter recognition • Word recognition • Passage reading (4 sentences, approx. 19 words) • Passage reading (7-10 sentences, approx. 60 words)
Uwezo The framework retained the levels used by ASER in literacy and numeracy and was informed by the EGRA design. This framework documents the various competencies to be tested, levels of competencies and steps to be used in developing the tests. It also lays out the rules governing each test. The framework was first developed in 2008/9 and critiqued and improved in 2010” (Uwezo, 2011: 17).

188 – ANNEX C – OVERVIEW TABLES RELATED TO COGNITIVE DATA COLLECTION INSTRUMENTS
A REVIEW OF INTERNATIONAL LARGE-SCALE ASSESSMENTS IN EDUCATION: ASSESSING COMPONENT SKILLS AND COLLECTING CONTEXTUAL DATA © OECD AND THE WORLD BANK 2015
Table C.2 Mathematics frameworks from other assessments
Assessment Mathematics definition
Large-scale international surveys
TIMSS and TIMSS Numeracy
There is no specific definition for mathematics, because it is somewhat dependent on the curricula of the participating countries. At each grade the mathematics framework is organised around two dimensions: a content dimension specifying the subject matter to be assessed and a cognitive dimension specifying the thinking processes to be assessed. The Grade 4 content dimension includes number, geometry and data display, while the Grade 8 content dimension includes number, algebra, geometry and data and chance. The cognitive dimension includes knowing, applying and reasoning. TIMSS 2015 also has a new, less difficult mathematics assessment called TIMSS Numeracy. TIMSS Numeracy assesses fundamental mathematical knowledge, procedures, and problem-solving strategies that are prerequisites for success on TIMSS. TIMSS Numeracy asks students to answer questions and work problems similar to TIMSS, except with easier numbers and more straightforward procedures. TIMSS Numeracy is designed to assess mathematics at the end of the primary school cycle (Grades 4, 5 or 6) for countries where most children are still developing fundamental mathematics skills (Mullis and Martin, 2013: 7, 8).
SACMEQ Mathematics literacy is defined as “the capacity to understand and apply mathematical procedures and make related judgements as an individual and as a member of the wider society”. Mathematics subdomains: Number: operations and number line, square roots, rounding and place value, significant figures, fractions, percentages, and ratios. Measurement: measurements related to distance, length, area, capacity, money, and time. Space-data: geometric shapes, charts (bar, pie, and line), and tables of data (Ross et al., 2004: 49).
PASEC The 2014 PASEC international assessment puts forward a new methodological framework, taking into consideration:• scientific research in reading, reading comprehension and mathematics • internationally shared common skills standards in reading and mathematics • students’ skills level in reading mathematics, but also the environmental context of the countries assessed and the effective curricula of these countries • international standards for measuring reading comprehension and mathematics. Grade 2: PASEC tests are used to measure students’ knowledge and competencies in their early stages of learning mathematics. Arithmetic: Count to 100, recognise numbers, count objects, determine quantities, sort numbers, continue sequences of numbers 1, continue sequences of numbers 2, add and subtract, solve problems. Geometry: space and measures: recognise geometric shapes, situate oneself in space, evaluate sizes. Grade 6: • Arithmetic (numbers and operations): • whole numbers, factions and decimals • the 4 operations • sentences and numerical models (numerical sentences, operation signs, sequences of operations). Measurement: Measurement units and properties learnt in primary school (perimeter, calculations of surfaces, etc.). Spatial geometry: 2 or 3-dimensional geometric figures learnt in primary school.

ANNEX C – OVERVIEW TABLES RELATED TO COGNITIVE DATA COLLECTION INSTRUMENTS – 189
A REVIEW OF INTERNATIONAL LARGE-SCALE ASSESSMENTS IN EDUCATION: ASSESSING COMPONENT SKILLS AND COLLECTING CONTEXTUAL DATA © OECD AND THE WORLD BANK 2015
Assessment Mathematics definition
Large-scale international surveys (cont.)
LLECE
Definition of mathematical literacy: “a permanent process throughout existence that includes such knowledge, technical skills, abilities, principles, values and attitudes necessary to include in the mathematics school curriculum so that Latin American students learn to develop their potential, face situations, make decisions using the available information, solve problems, defend and argue their point of view amongst many other key aspects that enable them to integrate into society as full citizens who are critical and responsible” Page 14 (12) of maths results report (SERCE, 2009).
Domain content ProcessNumbers, geometry, measurement, statistics, change.
Recognition of objects and elements Solving simple problems Solving complex problems
School-based surveys
EGRA/ EGMA
The Core EGMA measures foundational mathematical skills.Mathematical subdomains in the core EGMA: • number identification • number discrimination (which numeral represents a numerical value greater than another) • number pattern identification (a precursor to algebra) • addition and subtraction (including word problems).
Household-based surveys
PIAAC The ability to access, use, interpret and communicate mathematical information and ideas, in order to engage in and manage the mathematical demands of a range of situations in adult life. Definition of numerate behaviour: “Numerate behaviour involves managing a situation or solving a problem in a real context, by responding to mathematical content/information/ideas represented in multiple ways” (OECD, 2013: 34).
LAMP The LAMP defines numeracy skills as skills that enable individuals to perform short mathematical tasks that required computing; estimating; and understanding notions of shape, length, volume, currency and other measures.
ASER ASER defines numeracy skills in the following ways:Number recognition (1-digit numbers) Number recognition (2-digit numbers) Subtraction (2-digit by 2-digit with borrowing) Division (3-digit by 1-digit with carry over)
Uwezo Numeracy: number recognition, place value and operations shall be tested in the numeracy tests. The highest level of number operations in Kenya and Uganda shall be divisions, while in Tanzania multiplication.

190 – ANNEX C – OVERVIEW TABLES RELATED TO COGNITIVE DATA COLLECTION INSTRUMENTS
A REVIEW OF INTERNATIONAL LARGE-SCALE ASSESSMENTS IN EDUCATION: ASSESSING COMPONENT SKILLS AND COLLECTING CONTEXTUAL DATA © OECD AND THE WORLD BANK 2015
Table C.3 Science frameworks from other assessments
Assessment Science definition
Large-scale international surveys
TIMSS The TIMSS science assessment is based on a comprehensive framework for each domain, developed collaboratively with the participating countries. At each grade the science frameworks are organised around two dimensions: a content dimension specifying the domains or subject matter to be assessed within science, and a cognitive dimension specifying the domains or thinking processes to be assessed. The content domains and the topic areas within the domains are described separately for the fourth and eighth grades, with each topic area elaborated with specific objectives (Martin et al., 2012: 11). TIMSS 2015-Science also assesses science practices. There is a strong curricular focus. At Grade 4 the content areas are Life Science, Earth Science and Physical Science. At Grade 8 the content areas are Biology. Earth Science, Physics and Chemistry.
LLECE Science: the basic objective of science education is to mould students – future citizens – to know how to fully participate in a world filled with scientific and technological advances, and so they can adopt responsible attitudes, make fundamental decisions and resolve daily problems with a view to respecting others, the environment and future generations that have to live in the environment. For this, questions need to be asked that orient the student towards science for life and for the citizen.
Domain content ProcessLiving beings and healthEarth and environment Matter and energy
Recognition of conceptsApplication and interpretation of concepts Problem-solving
ANNEX C – OVERVIEW TABLES RELATED TO COGNITIVE DATA COLLECTION INSTRUMENTS – 191
A REVIEW OF INTERNATIONAL LARGE-SCALE ASSESSMENTS IN EDUCATION: ASSESSING COMPONENT SKILLS AND COLLECTING CONTEXTUAL DATA © OECD AND THE WORLD BANK 2015
Table C.4 Item development in other assessments
Assessment Item development
Large-scale international surveys
PIRLS TIMSS
The TIMSS and PIRLS International Study Center at Boston College uses a collaborative process to develop the new items needed for the mathematics, science, and reading achievement tests and questionnaires for each cycle. To provide a broad overview, the process includes the following: • updating the frameworks for the upcoming assessment • for PIRLS, identifying and selecting appropriate reading passages • developing items and their scoring guides in accordance with the frameworks • conducting a full-scale field test • selecting the assessment items based on the frameworks, field test results, and existing items from previous cycles • conducting training in how to reliably score responses to constructed response items (i.e. questions to which students provide a written response rather than
choosing from a set of options).
SACMEQ Main responsibility and involvement of participating countries: the SACMEQ tests were developed by a panel of subject specialists drawn from all the 15 SACMEQ school systems, to identify those elements of curriculum outcomes that were considered important and which were to be assessed in the tests. The subject specialists also reviewed the test items to ensure that they conformed to the national syllabuses of SACMEQ countries (Hungi, 2011: 3).
PASEC For PASEC 2014, items were generated at the PASEC centre with the support of specialists, and finalised in close association with the countries. Items receive final approval from the Scientific Committee. Items are calibrated thanks to a trial test in each country.
LLECE UNESCO formed expert groups for each domain, consisting of UNESCO specialists and consultants as well as some members invited from the country technical teams.Using the submitted items as a base, each expert group selected some of these items to include in the test as well as developing their own new items to ensure that the framework specifications were met. The first set of items was presented to the national co-ordinators at a meeting in Havana. At this meeting, it was decided that the “language” domain should be split in two – reading and writing. A second set of items was presented to national co-ordinators at a meeting in Managua 6 months later. Countries had 3 weeks to review the items and provide comment. For an item to be removed from the pool, at least 70% of countries needed to reject it. TERCE is based on a published curriculum analysis. Using this basis, specification tables were developed to form a blueprint for the item development phase. Item development was done in a participatory fashion, in principle, involving specialists from almost all countries.
WEI OECD led the questionnaire development, with support from UIS and international experts, and OECD incorporated the experience from other large-scale surveys/questionnaires. Numerous consultations took place with OECD, UIS, international experts and countries. Once a draft list of indicators was created, it was sent to national project managers, who rated indicators by priority and relevance to their national contexts. This was done in 2003 and taken into account over the course of several more meetings with stakeholders, and with the project steering committee until the questionnaire frameworks, with draft questionnaires finalised by November 2003. OECD decided to try to use items from other surveys where possible, in order to source items that had already been tested and validated in international contexts. Specifically, items were drawn from the IEA.

192 – ANNEX C – OVERVIEW TABLES RELATED TO COGNITIVE DATA COLLECTION INSTRUMENTS
A REVIEW OF INTERNATIONAL LARGE-SCALE ASSESSMENTS IN EDUCATION: ASSESSING COMPONENT SKILLS AND COLLECTING CONTEXTUAL DATA © OECD AND THE WORLD BANK 2015
Assessment Item development
School-based surveys
EGRA EGMA
There is no one item development process – each implementing country develops new versions of the EGRA/EGMA subtasks for its specific implementation.RTI provides guidelines for subtask development in various documentation, but does not itself supervise or control the quality of the development.
Household-based surveys
PIAAC The selection of items from IALS and ALL to serve as linking items in literacy and numeracy and the development of new items took place in parallel with the development of the frameworks. Final selection of items for the Field Test took place in March 2009 (Kirsch and Thorn, 2013: 11).
LAMP • Each item in the test poses a task for the individual to perform. • These tasks are developed taking into account the following criteria, which also happen to translate into the expected difficulty level of each item. Task classification for prose, document and numeracy: • Tasks are developed in relation to a specific context and content that is relevant to a particular situation. These include home and family issues; health and safety
issues; community and citizenship; consumer economic situations; work-related situations; and leisure and recreation.
ASER The reading assessment is developed separately in each of the different assessment languages. The Hindi reading tool is developed at the ASER Centre in New Delhi, and the reading tools in all other languages are developed by the Pratham and ASER Centre state teams (ASER Centre, 2013; R. Banerji, personal communication, 27 April 2014). In all cases the reading tools are developed by people who have spent considerable time in teaching and learning activities in reading with children (R. Banerji, personal communication, 27 April 2014).
Uwezo According to the Uwezo standards, “Test item development will be guided by the following principles” (Uwezo Uganda, 2010):• The Uwezo approach is to develop and use assessment tools that are effective, low cost, simple and easy to use to ensure that the sampled households are at
ease with the assessment. • Three different panels will be constituted to develop the three areas of assessment, namely: English, local language and numeracy tests. • All items should be constructed to the level found in the Primary 2 curriculum and recommended text books for Primary 2 in Ugandan schools. • Every test item should address a specific competence. • Every item shall stand alone and not be dependent on an understanding of a previous item. • Items should not be lifted directly from textbooks, especially for literacy, in order to make the assessment fair. • Items should take into consideration concerns with environment, gender, culture and religious biases.

ANNEX C – OVERVIEW TABLES RELATED TO COGNITIVE DATA COLLECTION INSTRUMENTS – 193
A REVIEW OF INTERNATIONAL LARGE-SCALE ASSESSMENTS IN EDUCATION: ASSESSING COMPONENT SKILLS AND COLLECTING CONTEXTUAL DATA © OECD AND THE WORLD BANK 2015
Table C.5 Scaling methodology in other assessments
Assessment Scaling methodology
Large-scale international surveys
PIRLS/TIMSS TIMSS and PIRLS rely on item response theory (IRT) scaling to describe student achievement on the assessments and to provide accurate measures of trends. As each student responds to only a part of the assessment item pool, the TIMSS and PIRLS scaling approach uses multiple imputation – or “plausible values” – methodology to obtain proficiency scores in reading (for PIRLS) and in mathematics and science (for TIMSS) for all students.
SACMEQ During the SACMEQ II study, the Rasch scores on the final pupil reading and mathematics tests were transformed to have a mean of 500 and a standard deviation of 100 (for the pooled data with equal weight given to each country). During the SACMEQ III study, Rasch measurement procedures were employed to equate the SACMEQ II and SACMEQ III scores (Hungi, 2011: 3).
PASEC PASEC used classic test theory until 2012; since then it uses IRT analysis (Rasch measurement). This IRT analysis has been used for the Mali, Vietnam, Cambodia and PDR Lao studies (tests only) and is being used for the first international assessment (tests and contextual data). PASEC’s scaling approach will use plausible values and multidimensional methodology to obtain proficiency scores in reading and in mathematics (main domain and subdomains) for all students.
LLECE LLECE reports assessment results using a single continuous scale obtained from applying the Rasch model or IRT approach for each subject.The Rasch model is used with complementary IRT models of 2 and 3 parameters. Subscales – reported as percentage correct.
Household-based surveys
PIAAC The test design for PIAAC was based on a variant of matrix sampling (using different sets of items, multi-stage adaptive testing, and different assessment modes) where each respondent was administered a subset of items from the total item pool. That is, different groups of respondents answered different sets of items, making it inappropriate to use any scaling system based on the number of correct responses. Differences in total scores (or statistics based on them) among respondents who took different sets of items may be due to variations in difficulty in the adaptively administered test forms. Unless one makes very strong assumptions – for example, that the different test forms are perfectly parallel – the performance of the two groups assessed in a matrix sampling arrangement cannot be directly compared using total score statistics. To overcome the limitations of conventional scoring methods, and to increase the accuracy of the cognitive measurement, PIAAC used plausible values (which are multiple imputations) drawn from a posterior distribution, by combining the IRT scaling of the cognitive items with a latent regression model using information from the background questionnaire in a population model (Yamamoto, Khorramdel and Davier, 2013a: 1).
STEP Once the data had been cleaned and weighted, ETS undertook the IRT scaling of the reading literacy data to provide the estimation of item parameters and theproficiency distribution of the population. The latter was then used to calculate a posterior distribution together with the household questionnaire variables, using latent regression. From this distribution, plausible values (multiple imputations) were obtained to provide a more accurate and reliable proficiency estimation than the proficiency estimation of the IRT scaling alone. Similar to the approach used by PIAAC, STEP used the two-parameter logistic model for dichotomously scored responses (Pierre et al., 2014: 60).
LAMP • Traditional item statistics to identify initial problems in comparability, particularly printing and translation errors. • Factor analysis to check unidimensionality of scales • Within each country, IRT scaling is compared with across-country scaling • Differential item functioning used for questions across participating countries. Tasks not operating in the same way in all participating countries are
excluded in summary statistics.

194 – ANNEX C – OVERVIEW TABLES RELATED TO COGNITIVE DATA COLLECTION INSTRUMENTS
A REVIEW OF INTERNATIONAL LARGE-SCALE ASSESSMENTS IN EDUCATION: ASSESSING COMPONENT SKILLS AND COLLECTING CONTEXTUAL DATA © OECD AND THE WORLD BANK 2015
Table C.6 Cross-country comparability measures in other assessments
Assessment Cross-country comparability
Large-scale international surveys
PIRLS PIRLS undertakes a study of item-by-country interaction.
TIMSS TIMSS undertakes a study of item-by-country interaction.
PASEC Up to 2014, international comparisons were not emphasised. A tentative comparison is provided in Chapter 6 of the national reports (before 2012) and in the synthesis of PASEC reports, using classical test theory. From 2014, PASEC will undertake a study of item-by-country interaction.
WEI The UIS produced tables containing univariate statistics for each variable, broken down by country. These tables were verified at the UIS for any exceptional results, which were addressed in close co-operation with the national programme manager. In a few cases, the exceptional results were due to ambiguous translations or concepts that were not well understood by teachers or school heads. In such cases, the variable was recoded as “not applicable”. Any such occurrences were documented in the national deviations database.
School-based Surveys
EGRA EGMA
Assessments are not designed for cross-country comparability.
Household-based surveys
PIAAC PIAAC undertakes a study of item-by-country interaction.
Uwezo With respect to test comparability across the three countries:The 2013 regional report states that tests are not identical because they are based on curriculum expectations of the respective countries, but that to aid comparability across countries, results only include those questions that are “equivalent” across the countries (Uwezo, 2014).
LAMP • First steps in LAMP implementation involves a discussion on how the operational definition of literacy relates to the conceptions in a particular country given its language(s) and cultural characteristics.
• Traditional item statistics are used to identify initial problems in comparability, especially those that might occur due to printing or translation errors. • Factor analysis is used to check for the unidimensionality of proposed scales. • Within each country, IRT scaling is compared with across-country scaling in order to check that measures are comparable among countries or language groups. Differential item functioning techniques are used to see if any questions are operating differently (e.g. they are unusually hard or easy, compared to other items) across participating countries. Tasks that are not operating in the same way in all participating countries are not included in summary statistics. This is item-by-country interaction.

ANNEX C – OVERVIEW TABLES RELATED TO COGNITIVE DATA COLLECTION INSTRUMENTS – 195
A REVIEW OF INTERNATIONAL LARGE-SCALE ASSESSMENTS IN EDUCATION: ASSESSING COMPONENT SKILLS AND COLLECTING CONTEXTUAL DATA © OECD AND THE WORLD BANK 2015
Table C.7 Measuring trends in other assessments
Assessment Measuring trends
Large-scale international surveys
PIRLS Test design: six of the ten 40-minute blocks were included in previous PIRLS assessments: two in all three assessments (2001, 2006, and 2011), two in both PIRLS 2006 and PIRLS 2011, and two in PIRLS 2011 only. These “trend” blocks provide a foundation for measuring trends in reading achievement. Four new blocks will be developed for use for the first time in the 2016 assessment (Martin, Mullis, and Foy, 2013a: 60).
TIMSS In most booklets two of the blocks contain trend items from 2011 and two contain items newly developed for TIMSS 2015 (Martin, Mullis, and Foy, 2013b: 89, 90).
SACMEQ The SACMEQ II tests for pupils and teachers included linked items selected from five earlier studies: the Zimbabwe Indicators of the Quality of Education Study (Ross, 1995), the SACMEQ I and SACMEQ II projects, the IEA’s Third International Mathematics and Science Study (TIMSS) (Mullis et al., 2001), and the IEA’s International Study of Reading Literacy (PIRLS) (Elley, 1992). These “overlaps”, when combined with Rasch item analysis and test scoring techniques, made it possible to make valid comparisons among the following groups of respondents: pupils with teachers in the SACMEQ II project, pupils in the SACMEQ I project with pupils in the SACMEQ II project, and pupils in both SACMEQ projects with pupils in the IEA’s TIMSS and IRL studies. See tables below for the test items that were used for calibrating test items.
PASEC In PASEC’s previous national assessment, each country was tested with the same booklets. PASEC 2014 has only had one implementation; it will link with the next cycle scheduled for 2018.
LLECE PERCE and SERCE are not comparable, because SERCE introduced a series of modifications resulting from the experience and knowledge gained from implementing PERCE. Some of the changes are related to sampling, test design, target population and knowledge domains covered by the assessment. However, by aligning methodology, SERCE and TERCE are comparable studies. In fact, there will be two scales: a comparable scale (already published) and a TERCE scale, to be used as the baseline from now on.
Household-based surveys
PIAAC To date PIAAC has only had one implementation.
ASER The ASER Centre takes care to ensure that assessment tools are comparable in the same language across different years; one year’s reading tool is comparable with previous years’ tools in terms of “word count, sentence count, type of word and conjoint letters in words” (ASER Centre, 2014: 22).
Uwezo Uwezo tries to ensure that the level of difficulty and comparability across the years is retained. In each year one new aspect will be considered, while keeping the core the same, to enable cross-country comparability across years” (Uwezo, 2011: 17).

196 – ANNEX C – OVERVIEW TABLES RELATED TO COGNITIVE DATA COLLECTION INSTRUMENTS
A REVIEW OF INTERNATIONAL LARGE-SCALE ASSESSMENTS IN EDUCATION: ASSESSING COMPONENT SKILLS AND COLLECTING CONTEXTUAL DATA © OECD AND THE WORLD BANK 2015
Table C.8 Use of proficiency levels in other assessments
Assessment Proficiency levels
Large-scale international surveys
PIRLS TIMSS
TIMSS and PIRLS have identified four points along the achievement scales to use as international benchmarks of achievement: Advanced International Benchmark (625), High International Benchmark (550), Intermediate International Benchmark (475), and Low International Benchmark (400). With each successive assessment, TIMSS and PIRLS work with expert international committees (the Science and Mathematics Item Review Committee for TIMSS and the Reading Development Group for PIRLS) to conduct a scale anchoring analysis in order to describe student competencies at the benchmarks. Experts then summarise the detailed list of item competencies in a brief description of achievement at each international benchmark. Thus, the scale anchoring procedure yields a content-referenced interpretation of the achievement results that can be considered in light of the TIMSS and PIRLS frameworks for assessing mathematics, science, and reading (Mullis, 2012).
SACMEQ SACMEQ has created proficiency levels for reading and mathematics. Four main steps were used in the SACMEQ II project to define levels of competence: 1) Rasch item response theory was used to establish the difficulty value for each test item; 2) national research co-ordinators (NRCs) subjected each test item to an intensive “skills audit” in order to identify the required problem-solving mechanisms for each item “through a Grade 6 pupil’s eyes”; 3) the items were clustered into eight groups or “levels” that had similar difficulties and that required similar skills; 4) the NRCs wrote descriptive accounts of the competencies associated with each cluster of test items, using terminology that was familiar to ordinary classroom teachers (Ross et al., 2004: 18).
PASEC Results were not reported according to proficiency levels until 2012; proficiency levels were constructed for the last four national assessments. PASEC 2014 will define proficiency levels for each grade and domain. PASEC will also define levels, after examining the items and carrying out statistical processes.
LLECE A group of items was selected with the lowest anchor point and the lowest skill level, as described in the framework. All other items were given an anchor point that corresponded to the point on the scale where students had a probability equal to or greater than 0.6 of responding correctly. To establish the second anchor point, items were selected for which the probability of responding correctly was equal to or greater than 0.6, and in the previous anchor point, the probability of responding correctly was less than 0.5 and the difference of the probabilities was more than 0.2. For a panel of experts to establish items for each anchor point and to describe these points within the framework, the skill level of each student was obtained. A student was assigned a high skill level when the probability of correctly responding to items in this point was equal to or greater than 0.6. For TERCE, these levels were redefined using the bookmark methodology.
School-based surveys
EGRA EGMA
No proficiency levels.Results are generally reported separately for each task.
Household-based surveys
PIAAC The proficiency scale in each of the domains assessed can be described in relation to the items located at different points on a scale according to difficulty. To help interpret the results, the reporting scales have been divided into “proficiency levels” defined by particular score-point ranges. Six proficiency levels are defined for literacy and numeracy (Levels 1-5, plus below Level 1) and four for problem solving in technology-rich environments (Levels 1-3, plus below Level 1).
STEP Six literacy scale proficiency levels are defined, provided on the same five-level scale as PIAAC (Pierre et al., 2014: 44, 83).
LAMP Levels are created by ETS; LAMP item difficulty levels are defined by countries developing the items, and later on verified and/or adjusted by ETS.
ASER No proficiency levels.Children’s proficiency is understood in terms of the highest level task they completed successfully.
Uwezo No proficiency levels.

ANNEX C – OVERVIEW TABLES RELATED TO COGNITIVE DATA COLLECTION INSTRUMENTS – 197
A REVIEW OF INTERNATIONAL LARGE-SCALE ASSESSMENTS IN EDUCATION: ASSESSING COMPONENT SKILLS AND COLLECTING CONTEXTUAL DATA © OECD AND THE WORLD BANK 2015
Table C.9 Translation procedures in other assessments
Assessment Translation procedure
Large-scale international surveys
PIRLS TIMSS
The TIMSS and PIRLS International Study Center prepares an international version of all the assessment instruments for TIMSS and PIRLS in English. The test and questionnaire instruments are then translated by participating countries into their languages of instruction; the goal is to create high quality translations that are appropriately adapted for the national context, and at the same time are internationally comparable.
SACMEQ SACMEQ suggests that independent translations should be made by at least two different expert translators familiar with age-appropriate linguistic demands. In cases of disagreement, consensus should be achieved either by direct negotiation between the two translators or by a third expert making the final choice (SACMEQ, 2007: 29).
PASEC Tests are developed in French.Procedures follow double independent group translation plus external reconciliation. The translation process is outsourced to specialist consultants and overseen by the PASEC technical team with control of the Scientific Committee.
LLECE Spanish is the language most commonly used for LLECE materials. A back-translation process was used to create the Portuguese version: the Spanish source was translated into Portuguese, which was then translated back into Spanish. The source Spanish version and back-translated version were compared and validated before the test.
WEI The WEI-SPS translation processes were based on materials and procedures used in OECD’s PISA assessment. WEI-SPS outlines procedures for translating into the language of administration for the national context, and for the process of making adaptations. The UIS instructed countries to submit translations and adaptations to them for approval before the survey was administered (i.e. before the questionnaires were printed for administration). As Spanish is a language commonly used for assessments, a “standard” version was produced by UNESCO Santiago, then adapted for individual countries. Assessments were administered in Tamil in two countries, but no standard version developed.
School-based surveys
EGRA EGMA
Translation procedures depend to a degree on the way that the assessment is implemented. Since EGRA is in the public domain it can be borrowed and adapted at will. When RTI implements it, however, it applies a great deal of quality control during a one-week adaptation workshop.
Household-based surveys
PIAAC Participating countries were responsible for translating the assessment instruments and the background questionnaire. Any national adaptations of either theinstruments or the questionnaire was subject to strict guidelines, and to review and approval by the international consortium. The recommended translation procedure was for a double translation from the English source version by two independent translators, followed by reconciliation by a third translator. All national versions of the instruments were subject to a full verification before the field test.
STEP Two independent translators separately translated the household questionnaire and reading literacy assessment, before a third translator reconciled, and documented, any discrepancies. The STEP team and ETS checked the translations and worked closely with the survey firms to finalise the instruments. In English-speaking countries, the instruments were adapted to reflect local idioms (Pierre et al., 2014: 58).

198 – ANNEX C – OVERVIEW TABLES RELATED TO COGNITIVE DATA COLLECTION INSTRUMENTS
A REVIEW OF INTERNATIONAL LARGE-SCALE ASSESSMENTS IN EDUCATION: ASSESSING COMPONENT SKILLS AND COLLECTING CONTEXTUAL DATA © OECD AND THE WORLD BANK 2015
Assessment Translation procedure
Household-based surveys (cont.)
LAMP The UIS provides a set of instruments in English, French or Spanish (eventually this will be available in other languages, if the countries that originally produced those versions kindly authorise their use), which might need to be translated and adapted to the particular characteristics of each country and its language usage. After the cognitive instruments are adapted, a verification process is required to ensure that what is being measured reflects the original design. Typically, verification is a two-stage process that allows for a detailed discussion of changes and ends with an agreement on the final version of every instrument. The adaptation of the background questionnaire is of utmost importance as it will provide key elements for analysis and, therefore, for accomplishing the goals set at the national level (UIS, 2009: 37).
ASER Translation procedures are not really applicable – reading tools are developed separately in each language and the maths tool is so simple that is does not really require translation as such.
Uwezo No “translation” as such – tests are developed separately in each language.
Table C.10 Field trial processes in other assessments
Assessment Field trial process
Large-scale international surveys
PIRLS TIMSS
The field test is designed to yield at least 200 student responses to each reading, mathematics, and science item, as well as sufficient data to evaluate the validity and reliability of the various questionnaire scales. The field test sample size is approximately 30 schools in each country. Generally, the samples for the field test and the assessment are drawn simultaneously, using the same random sampling procedures. This ensures that field test samples closely approximate assessment samples, and that a school is selected for either the field test or the assessment, but not both. For example, if 150 schools are needed for the assessment and another 30 for the field test, then a larger sample of 180 schools is selected and a systematic sample of 30 schools is selected from the 180 schools (Mullis et al., 2012: 18).
SACMEQ SACMEQ II: the data from the trial-testing phase were subjected to both Rasch and classical item analyses in order to detect items that did not “fit” the relevant scales, or that were “behaving differently” across subgroups of respondents defined by gender and country. The poor quality test items were rejected – keeping in mind the need to prepare a “balanced” test across skill levels and domains (Ross et al., 2004: 52). There is a similar description for SACMEQ III in Hungi (2011: 3).
PASEC Test instruments are systematically trialled on a sample of 20 schools in each country. Trial testing confirms the quality of the tests and questionnaires and the relevance of the procedures.
LLECE In SERCE, expert groups met to discuss the findings, to select the best performing items that match the framework, and to design the clusters and booklets for the main survey. Expert groups also adjusted coding guides for open-ended maths and science items, according to the field trial results and the reliability between coders and supervisors. The language expert group also had to assess the level of consistency in the coding for writing, considering the difficulties in the range of rating criteria and the limited experience in the region of such large-scale writing evaluations. There was at least one domain expert, one assessment expert and one psychometrics expert at each meeting. In TERCE, item behaviour in the pilot study was analysed based on an analytical plan by the implementation partner.
WEI Field trial analysis looked at the feasibility and cross-cultural validity of questions across the countries. The type of questions that raised cross-cultural validity concerns were mostly in the Opportunity to Learn questionnaire.

ANNEX C – OVERVIEW TABLES RELATED TO COGNITIVE DATA COLLECTION INSTRUMENTS – 199
A REVIEW OF INTERNATIONAL LARGE-SCALE ASSESSMENTS IN EDUCATION: ASSESSING COMPONENT SKILLS AND COLLECTING CONTEXTUAL DATA © OECD AND THE WORLD BANK 2015
Assessment Field trial process
School-based surveys
EGRA EGMA
Implementing countries are encouraged to field trial the cognitive instruments they develop for their specific implementations, but there is not much information about this in the specific implementation reports. From the guidelines for planning and implementing EGRA (see RTI International and International Rescue Committee, 2011), the pilot test will help to ensure the tool is accurately measuring what children know in the specific context and language(s) of assessment. It will also allow verification of the validity and reliability of the instrument(s) and give the EGRA team an opportunity to address technical issues before the cost-intensive data collection phase. The main issue is that in the lower grades, the orthographic transparency of the language matters a great deal in how quickly children develop skills. Thus, the assessments are not translated but adapted to reflect orthography. In later grades, quality of instruction trumps (to a very large degree) orthographic transparency. This is also a reason why technicians working on EGRA tend to discourage inter-language comparisons of summary measures such as oral reading fluency.
Household-based surveys
PIAAC The field test addressed three main areas: 1) operational (in terms of feasibility); 2) instrumentation; and 3) scaling and psychometric characteristics. It was important for the successful implementation of the main study, especially given that the PIAAC results had to be linked to previous assessments, while also being implemented in both PBA and CBA modes (including an adaptive aspect) (Yamamoto, Khorramdel and Davier, 2013b: 1).
STEP Once a final proposal was complete, pilots were conducted in several countries by the World Bank to identify administration problems and suggest item wording calibration. Feedback from these pilots led to several important adjustments, particularly in the rewording of items that had proven to be difficult for participants to understand, and the general reframing of all items as questions instead of statements.
LAMP The field test involves administering the entire battery of survey instruments to a carefully selected sample (not probability/random) of roughly 500 adults in each test language.
ASER Qualitative and quantitative data are collected during the pilot, and refinements may be made to the instructions for administering the tools. Quantitative data are presented to the district in which a pilot is conducted as a “block report card” (R. Banerji, personal communication, 27 April 2014).
Uwezo Pre-tests involving six sample forms for each domain are conducted in several districts with different geographical characteristics. During pre-tests the test administrators note the tasks that are difficult for the children. After each pre-test there is a revision meeting in which feedback from test administration is shared. Revisions are made based on this feedback and recorded in the test-tracking tool. The forms are then sent into the next pre-test. At the pre-testing stage, the data collected to inform test development are anecdotal data from the test administrators, whereas at the district-wide pilot stage assessment data are collected and analysed as they are in the main administration.

200 – ANNEX C – OVERVIEW TABLES RELATED TO COGNITIVE DATA COLLECTION INSTRUMENTS
A REVIEW OF INTERNATIONAL LARGE-SCALE ASSESSMENTS IN EDUCATION: ASSESSING COMPONENT SKILLS AND COLLECTING CONTEXTUAL DATA © OECD AND THE WORLD BANK 2015
References
ASER Centre (2014), Annual Status of Education Report (Rural) 2013, ASER Centre, New Delhi.
ASER Centre (2013), Guidelines for Development of ASER Tools, ASER Centre, New Delhi.
Elley, W. (1992), How in the World Do Students Read? IEA Study of Reading Literacy, IEA, Amsterdam.
Hungi, N. (2011), Accounting for Variations in the Quality of Primary School Education, SACMEQ, Paris, www.sacmeq.org/?q=publications.
Kirsch, I. and W. Thorn (2013), “Foreword: The Programme for International Assessment of Adult Competencies - an overview”, in Technical report of the Survey of Adult Skills (PIAAC), OECD, Paris.
Martin, M. O. et al. (2012), TIMSS 2011 International Results in Science, TIMSS and PIRLS International Study Center, Chestnut Hill, MA.
Martin, M.O., I.V.S. Mullis and P. Foy (2013a), “PIRLS 2016 assessment design and specifications”, in I. V. S. Mullis and M. O. Martin (eds.), PIRLS 2016 Assessment Frameworks, TIMSS and PIRLS International Study Center and IEA, Chestnut Hill, MA and Amsterdam, pp. 57-69.
Martin, M.O., I.V.S. Mullis and P. Foy (2013b), “TIMSS 2015 assessment design”, in I.V.S. Mullis and M.O. Martin (eds.), TIMSS 2015 Assessment Frameworks, TIMSS and PIRLS International Study Center and IEA, Chestnut Hill, MA and Amsterdam.
Mullis, I.V.S. (2012), “Using scale anchoring to interpret the TIMSS and PIRLS 2011 achievement scales”, in M.O. Martin and I.V.S. Mullis (eds.), Methods and Procedures in TIMSS and PIRLS 2011, TIMSS and PIRLS International Study Center, Chestnut Hill, MA.
Mullis, I.V.S. et al. (eds.) (2013), TIMSS 2011 Encyclopedia: Education Policy and Curriculum in Mathematics and Science, Volume 1: A–K, TIMSS and PIRLS International Study Center, Chestnut Hill, MA.
Mullis, I.V.S. et al. (2001), The Mathematics Benchmarking Report, TIMSS and PIRLS International Study Center and IEA, Chestnut Hill, MA, and Amsterdam.
Mullis, I.V.S. and M.O. Martin (eds.) (2013), PIRLS 2016 Assessment Framework, TIMSS and PIRLS International Study Center and IEA, Chestnut Hill, MA and Amsterdam.
Mullis, I.V.S., Martin, M.O. and Sainsbury, M. (2013), “PIRLS 2016 reading framework”, in I.V.S. Mullis and M. O. Martin (eds.), PIRLS 2016 Assessment Framework, TIMSS and PIRLS International Study Center and IEA, Chestnut Hill, MA and Amsterdam, pp. 13-31.

ANNEX C – OVERVIEW TABLES RELATED TO COGNITIVE DATA COLLECTION INSTRUMENTS – 201
A REVIEW OF INTERNATIONAL LARGE-SCALE ASSESSMENTS IN EDUCATION: ASSESSING COMPONENT SKILLS AND COLLECTING CONTEXTUAL DATA © OECD AND THE WORLD BANK 2015
OECD (2013), Literacy, Numeracy and Problem Solving in Technology-Rich Environments: Framework for the OECD Survey of Adult Skills, OECD Publishing, Paris, http://dx.doi.org/10.1787/9789264128859-en.
Pierre, G. et al. (2014), STEP Skills Measurement Surveys: Innovative Tools for Assessing Skills, working paper, World Bank Human Development Network, Washington DC.
Ross, K. et al. (2004), “Chapter 2: Methodology for SACMEQ II Study”, IIEP, UNESCO, Paris.
Ross, K.N. (ed.) (1995), “From educational research to educational policy: An example from Zimbabwe”, International Journal of Educational Research, 23(4), Sage Publications, Thousand Oaks, CA, pp. 301-401.
RTI International and International Rescue Committee (2011), Guidance Notes for Planning and Implementing EGRA, RTI International, North Carolina.
SACMEQ (2007), SACMEQ III: Manual for National Research Co-ordinators: Main Study, SACMEQ, Paris.
SERCE (2009), Segundo Estudio Regional Comparativo y Explicativo: Aportes para la enseñanza de la matemática, L. Bronzina, G. Chemello, M. Agrasar, Santiago: UNESCO/OREALC.
UIS (2009), The Next Generation of Literacy Statistics: Implementing the Literacy Assessment and Monitoring Programme (LAMP), UNESCO Institute for Statistics, Montreal.
Uwezo (2014), Are Our Children Learning? Literacy and Numeracy across East Africa 2013, Uwezo and Hivos/Twaweza, Nairobi.
Uwezo (2011), “Improving learning outcomes in East Africa 2009-2013: Strategy update”, www.uwezo.net/strategies.
Uwezo Uganda (2010), Test Development Framework 2010-2014, Uwezo Uganda, Kampala.
Yamamoto, K., L. Khorramdel and M.v. Davier (2013a), “Chapter 17: Scaling PIAAC cognitive data” in Technical report of the Survey of Adult Skills (PIAAC), pre-publication copy, OECD, Paris.
Yamamoto, K., L. Khorramdel and M.v. Davier (2013b), “Chapter 19: Proficiency scale construction” in Technical report of the Survey of Adult Skills (PIAAC), OECD, Paris.


ANNEX D – OVERVIEW TABLES OF CONTEXTUAL DATA COLLECTION INSTRUMENTS – 203
A REVIEW OF INTERNATIONAL LARGE-SCALE ASSESSMENTS IN EDUCATION: ASSESSING COMPONENT SKILLS AND COLLECTING CONTEXTUAL DATA © OECD AND THE WORLD BANK 2015
Annex D
Overview tables of contextual data collection instruments
Table D.1 Type of contextual data collection instruments used in the surveys and their mode of delivery
Survey Target population Contextual data collection instrument Mode of delivery Setting for cognitive assessment
Large-scale international surveys
PISA 15-year-old students (min. Grade 7) Questionnaires for students, principals; optional for parents and teachers (from 2015)
Paper-and-pencil (up to 2012), computer-based from 2015 (paper-based option available)
Group setting
PIRLS PrePIRLS
PIRLS: students in Grade 4PrePIRLS: Grades 4 or 5 or 6
Questionnaires for students, parents, teachers, principals, national curriculum
Paper-and pencil; online option for teacher and principal questionnaire
Group setting
TIMSS/ TIMSS-Numeracy
TIMSS: students in Grade 4 and 8; Grade 11 for advanced module TIMSS Numeracy: Grades 4 or 5 or 6
Questionnaires for students, parents (2011), teachers, principals, national curriculum
Paper-and-pencil; online option for teacher and principal questionnaire
Group setting
SACMEQ Students in Grade 6, teachers in Grade 6 classes
Questionnaires for students, teachers, principals
Paper-and-pencil
Group setting
PASEC Students in Grades 2, and 5/6 Questionnaires for students, teachers, principals
Paper-and-pencil
Group setting
LLECE Students in Grades 3 and 6 Questionnaires for students, teachers, principals, parents
Paper-and-pencil
Group setting
WEI-SPS Grade 4 language and mathematics teachers
Questionnaires for teachers, principals, national curriculum
Paper-and-pencil
–

204 – ANNEX D – OVERVIEW TABLES OF CONTEXTUAL DATA COLLECTION INSTRUMENTS
A REVIEW OF INTERNATIONAL LARGE-SCALE ASSESSMENTS IN EDUCATION: ASSESSING COMPONENT SKILLS AND COLLECTING CONTEXTUAL DATA © OECD AND THE WORLD BANK 2015
Survey Target population Contextual data collection instrument Mode of delivery Setting for cognitive assessment
School-based surveys
EGRA/ EGMA
Students in Grades 1-3 Optional interview with student, teacher, principal, and classroom observation
Paper-and-pencil One-on-one setting
Household-based surveys
PIAAC Adults (aged 16-65) Interview with the participant (individual in the household)
Computer-assisted interview One-on-one setting
STEP Adults (aged 15-64) Interview with the participant (individual in the household; employer)
Paper-and-pencil; optional computer-assisted for household interview
One-on-one setting
LAMP Adults (aged 15+) Interview with the participant (individual in the household)
Paper-and-pencil One-on-one setting
ASER Children and teenagers in rural areas in India, ages 3-16 for background information, ages 5-16 for assessment
Interview and observation,household survey sheet (interview with head of household), school survey sheet (interview with head master), village observation sheet
Paper-and-pencil One-on-one setting
UWEZO Children and teenagers (aged 6-16) Interview and observation,household survey sheet (interview with head of household), school survey sheet (interview with head of teachers), village survey sheet (interview with local council chairperson/ village chief)
Paper-and-pencil One-on-one setting
Note: Reading the “household-based surveys” “contextual data collection instrument” for LAMP, the first part (Introduction) contains screening questions for the head of household. The second part contains questions for the individual selected to respond to the rest of the LAMP questionnaire (primary sampling units are households, therefore interviewers must make contact with the household first, to determine who is residing there and then select an individual to participate in LAMP (UIS, 2006).

ANNEX D – OVERVIEW TABLES OF CONTEXTUAL DATA COLLECTION INSTRUMENTS – 205
A REVIEW OF INTERNATIONAL LARGE-SCALE ASSESSMENTS IN EDUCATION: ASSESSING COMPONENT SKILLS AND COLLECTING CONTEXTUAL DATA © OECD AND THE WORLD BANK 2015
Table D.2 Developing contextual data collection instruments: Bodies involved and main steps
Survey Bodies involved in contextual instrument development Main steps in contextual instrument development
Large-scale international surveys
PISA • OECD • PISA Governing Board (PGB) • Consortium responsible for questionnaire
development • Questionnaire expert group • National project managers (NPMs) • National experts
• PGB defines policy priorities • Questionnaire consortium and questionnaire expert group develop context framework (based on prior versions) • Framework is reviewed through PGB, NPMs and national experts • Questionnaire expert group and questionnaire consortium develop new items • Review of questionnaires through PGB, NPMs and national experts • Field trial, scaling, item statistics and decision about inclusion in main study
PIRLS and TIMSS
• TIMSS and PIRLS International Study Center at Boston College
• National research co-ordinators (NRCs) • Questionnaire Development Group for
PIRLS Questionnaire Item Review Committee for TIMSS
• IEA Data Processing and Research Center
• International Study Center develops draft framework with NRCs as main reference source • NRCs review each questionnaire • International Study Center updates drafts accordingly • Questionnaire Development Group/Item Review Committee reviews the updated drafts of the field test
questionnaires • Data Processing and Research Center ensures that the questionnaire committee’s recommendations are
amenable to data collection and processing • International Study Center implements the committee’s recommendations; NRCs review draft questionnaires
again, update through International Study Center • Field trial, data analyses and finalisation for implementation in main study (Mullis et al., 2012: 15-16)
SACMEQ Committee of experts consisting of:• SACMEQ Co-ordinating Centre • SACMEQ country ministries of education
(provide policy questions) • Members from all SACMEQ countries • UNESCO-IIEP staff • SACMEQ scientific committee • Private consultants
SACMEQ III questionnaires were developed following:• field experiences gained from the SACMEQ II study • recommendations arising from analyses of SACMEQ II data • policy questions raised by SACMEQ country ministries of education • These questionnaires were refined by the SACMEQ scientific committee, then piloted in each SACMEQ country
and refined further before they were administered (Hungi, 2011a)
PASEC • PASEC • The Permanent Secretariat of CONFEMEN • National centres • Scientific committee
• The Permanent Secrétariat of CONFEMEN is responsible for monitoring the programme. The national centre conducts the field operations and participates in the analysis and writing parts of the report. The scientific committee is responsible for reviewing and validating the final report (CONFEMEN, 2012: 108).
• The national centre adapts the instruments, which are then validated through the Permanent Secretariat of CONFEMEN (CONFEMEN, 2012: 108).
• During the latest programme cycles the coherence of certain contextual constructs has been verified, for example household facilities, nutrition, instructional material, and classroom and school facilities (CONFEMEN, 2012: 110).

206 – ANNEX D – OVERVIEW TABLES OF CONTEXTUAL DATA COLLECTION INSTRUMENTS
A REVIEW OF INTERNATIONAL LARGE-SCALE ASSESSMENTS IN EDUCATION: ASSESSING COMPONENT SKILLS AND COLLECTING CONTEXTUAL DATA © OECD AND THE WORLD BANK 2015
Survey Bodies involved in contextual instrument development Main steps in contextual instrument development
Large-scale international surveys (cont.)
LLECE • National Coordinators Council • UNESCO’s Regional Bureau of Education
for Latin America and the Caribbean (OREALC)
• International experts • Country co-ordinators
• National Coordinators Council and UNESCO-OREALC are responsible for defining and deciding all aspects of the study including instrument/questionnaire design, administration and analysis
• Questionnaire design followed a process of discussion and agreements between the international experts and country co-ordinators at bi-annual/annual meetings
• A list of proposed items was sent to country co-ordinators, who indicated the relevance of each item for their country’s context
• Country feedback was incorporated into the development of pilot questionnaires • Field trial, data analysis, as well as feedback from participants and test administrators to select and refine the final
context questionnaires for the main survey
WEI-SPS • OECD • UIS • Project steering committee • Stakeholders • International experts • Countries • National project managers (NPMs)
• OECD led the framework and questionnaire development, with support from UIS, international experts, and countries
• OECD incorporated experience from other large-scale surveys/questionnaires • NPMs rated indicators on a draft list of indicators by priority and relevance to their national contexts • Several meetings with stakeholders and with the project steering committee until the questionnaire frameworks,
and draft questionnaires were finalised • Country review of draft questionnaires • Pre-pilot in Brazil and update of questionnaires; pilot in 11 countries; finalisation
School-based surveys
EGRA/ EGMA
• Research Triangle Institute (RTI) • Network of experts
• During the development of the SSME contextual instruments (from Crouch, 2008), practical checklists and tools were reviewed
• Compilation of a large item data bank • Written input from a network of experts • In 2007 two pilots were conducted and results were evaluated • Second expert panel in 2008 refined the instrument • Implementation
Household-based surveys
PIAAC • OECD • Consortium led by ETS • PIAAC Board of Participating Countries
(BPC) • Background questionnaire expert group • Subject matter expert groups
• OECD and ETS consortium led the framework and questionnaire development • Questionnaire development guided by the background questionnaire expert group, with input from the other
subject matter expert groups, particularly in relation to questions regarding the use of and engagement with literacy, numeracy and ICT
• The PIAAC BPC is closely involved in the development process, reviewing the contents of the proposed background questionnaire twice before its finalisation (Kirsch and Thorn, 2013: 11)
• Field trial, item selection, and finalisation for main study

ANNEX D – OVERVIEW TABLES OF CONTEXTUAL DATA COLLECTION INSTRUMENTS – 207
A REVIEW OF INTERNATIONAL LARGE-SCALE ASSESSMENTS IN EDUCATION: ASSESSING COMPONENT SKILLS AND COLLECTING CONTEXTUAL DATA © OECD AND THE WORLD BANK 2015
Survey Bodies involved in contextual instrument development Main steps in contextual instrument development
Household-based surveys (cont.)
STEP • World Bank STEP team • Expert group for skills module • Specialists within and outside the World
Bank
• Surveys developed by the World Bank STEP team and a group of experts that provided drafts for each skills module of the household survey and of the employer survey
• Drafts of each survey extensively reviewed and revised by a wider group of specialists within and outside the World Bank
• Pilot (qualitative tests), field trial of full survey, analysis and finalisation of surveys
LAMP • UIS • Participating countries
• Background questionnaire is developed by the UIS • Field trial, item selection, and finalisation for main study
ASER • ASER Centre • The ASER Centre in New Delhi is responsible for instrument development • No explicit information about the interview and observation sheets development process available
UWEZO • Twaweza • Uwezo regional office • National offices • Uwezo’s Advisory Board – representatives
from participant countries, members of research institutions, NGOs, intergovernmental organisations, international experts on global development and social change, donor representatives, director of ASER survey in India.
• Twaweza manages the Uwezo initiative • Uwezo’s methodology is based on ASER but adapted for use in the East African context • Tool development is undertaken by the Uwezo regional office • National offices review the tools to ensure the relevance of all items • Field trial activities are reported for all three participating countries
Note: The content of this table is based on the information available through the review and does not make a claim to be complete. The main aim was to provide an overview of the main bodies and steps during the development process identified in the review of international surveys.

208 – ANNEX D – OVERVIEW TABLES OF CONTEXTUAL DATA COLLECTION INSTRUMENTS
A REVIEW OF INTERNATIONAL LARGE-SCALE ASSESSMENTS IN EDUCATION: ASSESSING COMPONENT SKILLS AND COLLECTING CONTEXTUAL DATA © OECD AND THE WORLD BANK 2015
Table D.3 Languages of contextual data collection instruments, and translation, adaptation and verification
Survey Languages Translation, adaptation and verification process
Large-scale inter-national surveys
PISA • English (source) • French (source) • 46 languages (for 98 national versions in 2012), including right-to-left scripts
(Arabic) and top-to bottom scripts (Chinese traditional and simplified script) (OECD, 2014a: 94)
• Two independent translations (preferably from both source versions) and reconciliation through an independent translator in a third step.
• Extensive linguistic quality control (verification) of translation and adaptations. • National options are welcome, but should be administered after the
international PISA questionnaire.
PIRLS and TIMSS
• English (source) • 58 languages – for 215 sets of achievement tests and 170 sets of
background questionnaires at Grade 4 and 8 (Yu and Ebbs, 2012: 2) • The most common languages for the TIMSS assessment were English (19
countries) and Arabic (13 countries), with 21 countries administering all or parts of the assessment in two or more languages
The most commonly used languages for PIRLS were also English (16 countries) and Arabic (7 countries). In PIRLS, 17 countries administered the test and/or questionnaires in more than one language (Yu and Ebbs, 2012: 2) • South Africa (PrePIRLS Grade 4) was the country with the most languages
(11 official languages at Grade 4; teacher and school questionnaire were administered in English and Afrikaans only), followed by Spain (5 languages for PIRLS and TIMSS) (Howie et al., 2012: 10)
• Translation from English source version considering thorough translation guidelines.
• As with other aspects of TIMSS and PIRLS in 2011, the alignment of data collection for the two projects required a co-ordinated approach to the background questionnaires preparation. Countries participating in both studies with the same students conducted a single translation of the Grade 4 questionnaires (Yu and Ebbs, 2012: 2).
• International translation verification at the IEA Secretariat in co-ordination with an external translation verification company, cApStAn Linguistic Quality Control.
• National questions: Countries are permitted to add a limited number of questions of national interest to the questionnaires. NRCs are advised to place any national questions at the end of the corresponding module or questionnaire, in the same format as the rest of the questionnaire, to avoid influencing responses to the international questions. All national questions must be documented and approved for inclusion by the TIMSS and PIRLS International Study Center (Yu and Ebbs, 2012: 8).
SACMEQ • English (source) • Kiswalihi (Tanzania) • Portuguese (Mozambique)
• SACMEQ recommends two independent translations by expert translators familiar with age-appropriate linguistic demands. In cases of disagreement, consensus should be achieved either by direct negotiation between the two translators or by a third expert making the final choice (SACMEQ, 2007: 29).
• For test items, back translations were compared with the original (English) versions of the tests in order to check for omissions, additions, unwanted changes in meaning, or other problems (Ross et al., 2004: 11). No information was found if this is also used for context questionnaires.

ANNEX D – OVERVIEW TABLES OF CONTEXTUAL DATA COLLECTION INSTRUMENTS – 209
A REVIEW OF INTERNATIONAL LARGE-SCALE ASSESSMENTS IN EDUCATION: ASSESSING COMPONENT SKILLS AND COLLECTING CONTEXTUAL DATA © OECD AND THE WORLD BANK 2015
Survey Languages Translation, adaptation and verification process
Large-scale inter-national surveys (cont.)
PASEC • Varies from country to country with French as the link language. • Madagascar 2005: French, Malagasy • Mauritania, 2004: French, Arabic • Cameroon, 2005: French, English, • Mauritius, 2006: French, English
• The translation process is overseen by the PASEC technical team. • There are some issues that require adaptation, including: the languages
spoken by the teacher and the class, the status, teachers’ and directors’ academic qualifications and training, types of premium teachers, the type of partnership established by the school, students’ household conditions, students’ household assets, food consumed and language spoken at home by the student.
• Measuring nutrition and the variety of meals for children is one of the main difficulties: several variables are used, which vary between countries and even between regions within the same country. There is an interest in the variance between students on the basis of consumption of regular food in the country.
LLECE • Spanish (source) • Portuguese
• 3-step-translation: 1) Spanish source version translated into Portuguese; 2) Portuguese version back-translated into Spanish; 3) source Spanish version and back-translated version compared and validated before the test.
• Any adaptation in regard to the source version (structural – to the questionnaire format, or linguistic) was documented in a specific form and verified.
WEI-SPS • English (source) translated into 8 languages: • Arabic, Assamese, Hindi, Tamil, Bahasa Malaysia, Portuguese, Sinhala,
Spanish (standard version with adaptations for different Spanish-speaking countries)
• English adapted for the Philippines
• Same procedures applied as PISA. • To ensure international comparability, translation of all instruments verified for
each language (UIS, 2009a: 9).
School-based surveys
EGRA/ EGMA
• English (source) • Implementing countries translate as required
• Core SSME instruments developed in English. • RTI highlights specific text in the SSME that requires adaptation. • Translation and adaptation is the responsibility of implementing countries. RTI
does not oversee or attempt to control the quality of the translation/adaptation/verification of these instruments for use in specific country implementations and local versions. So there is no standard process.
• Inspection of a few specific country implementation reports showed that there is little information about the specific translation/adaptation/verification processes adopted. For instance, from an EGRA/EGMA/SSME implementation in Morocco: “The EGRA, EGMA, and SSME tools are always carefully tailored to the appropriate country or region, rather than existing tools simply being translated into the language selected for the implementation” (Messaoud-Galusi et al., 2012: 27).

210 – ANNEX D – OVERVIEW TABLES OF CONTEXTUAL DATA COLLECTION INSTRUMENTS
A REVIEW OF INTERNATIONAL LARGE-SCALE ASSESSMENTS IN EDUCATION: ASSESSING COMPONENT SKILLS AND COLLECTING CONTEXTUAL DATA © OECD AND THE WORLD BANK 2015
Survey Languages Translation, adaptation and verification process
House-hold-based surveys
PIAAC • English (source) • The language of assessment was the official language or languages of each
participating country. In some countries, the assessment was also conducted in widely spoken minority or regional languages (OECD, 2013a: 26)
• Translated into about 30 languages
• Double translation by two independent translators, followed by reconciliation. • Strongly guided translation, adaptation and verification process (similar to
PISA).
STEP • English (source) • Translated into 8 languages: • Wave 1: • Spanish (Bolivia, Colombia), Lao (Lao PDR), Tamil and Sinhala (Sri Lanka),
Vietnamese (Vietnam), Mandarin (Yunnan Province of China) • Wave 2: • Armenian (Armenia), English with adaptations (Ghana), Georgian (Georgia)
• Separate translation by two independent translators, reconciliation through a third translator.
• Any discrepancies documented. • The STEP team and ETS checked the translations and worked closely with the
survey firms to finalise the instruments. In English-speaking countries, the instruments were adapted to reflect local idioms (Pierre et al., 2014: 58).
LAMP • English, French and Spanish (source) • Translated into nine languages belonging to five different language families: • Indo-European (French and Spanish) • Altaic (Mongolian) • Afro-Asiatic (Arabic, Hausa and Tamasheq) • Niger-Congo (Fulfulde) • Nilo-Saharan (Kanuri and Zarma) • (UIS, 2009b: 22).
• Translation and adaptation to the particular characteristics of each country and its language usage are important and based on specific guidelines, but no details about the process were available.
• Adaptations are verified. • The adaptation of the background questionnaire is of utmost importance as it
will provide key elements for analysis and, therefore, for accomplishing the goals set at the national level (UIS, 2009b: 37).
• National options are important but should not exceed 5 minutes.
ASER • English • Hindi
Not applicable
UWEZO • English • Kiswahili
Not applicable
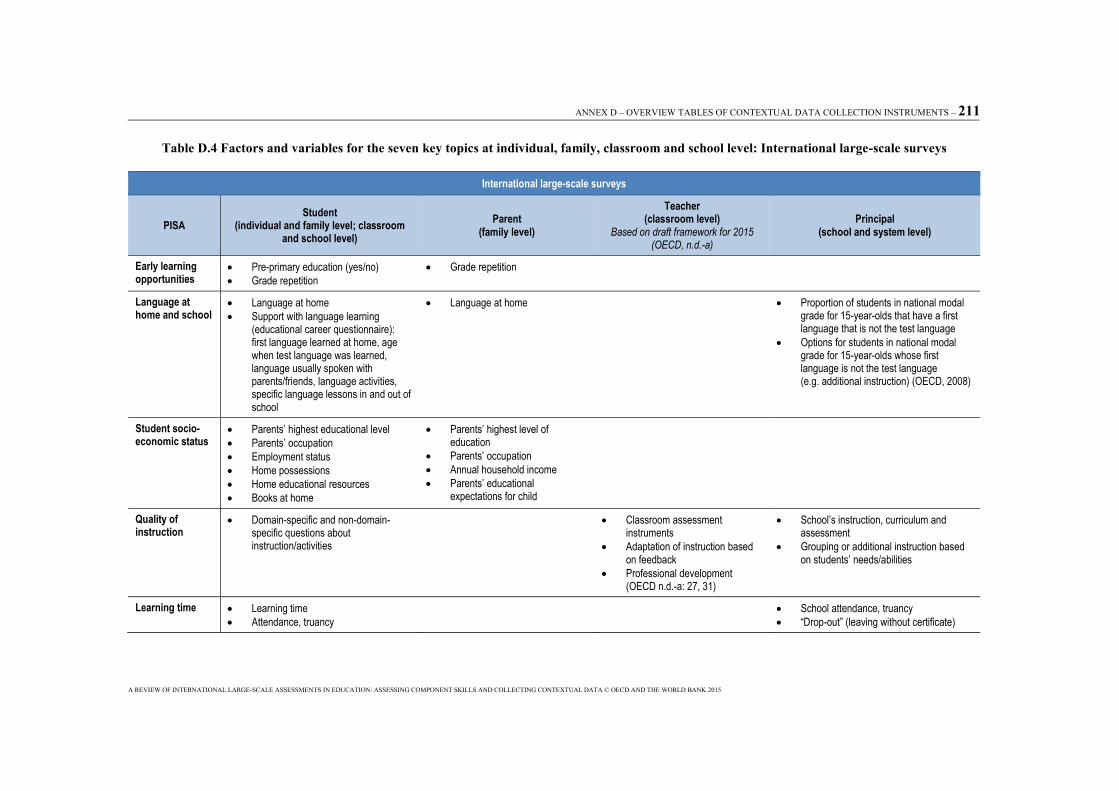
ANNEX D – OVERVIEW TABLES OF CONTEXTUAL DATA COLLECTION INSTRUMENTS – 211
A REVIEW OF INTERNATIONAL LARGE-SCALE ASSESSMENTS IN EDUCATION: ASSESSING COMPONENT SKILLS AND COLLECTING CONTEXTUAL DATA © OECD AND THE WORLD BANK 2015
Table D.4 Factors and variables for the seven key topics at individual, family, classroom and school level: International large-scale surveys
International large-scale surveys
PISA Student
(individual and family level; classroom and school level)
Parent (family level)
Teacher(classroom level)
Based on draft framework for 2015 (OECD, n.d.-a)
Principal (school and system level)
Early learning opportunities
• Pre-primary education (yes/no) • Grade repetition
• Grade repetition
Language at home and school
• Language at home • Support with language learning
(educational career questionnaire): first language learned at home, age when test language was learned, language usually spoken with parents/friends, language activities, specific language lessons in and out of school
• Language at home • Proportion of students in national modal grade for 15-year-olds that have a first language that is not the test language
• Options for students in national modal grade for 15-year-olds whose first language is not the test language (e.g. additional instruction) (OECD, 2008)
Student socio-economic status
• Parents’ highest educational level • Parents’ occupation • Employment status • Home possessions • Home educational resources • Books at home
• Parents’ highest level of education
• Parents’ occupation • Annual household income • Parents’ educational
expectations for child
Quality of instruction
• Domain-specific and non-domain-specific questions about instruction/activities
• Classroom assessment instruments
• Adaptation of instruction based on feedback
• Professional development (OECD n.d.-a: 27, 31)
• School’s instruction, curriculum and assessment
• Grouping or additional instruction based on students’ needs/abilities
Learning time • Learning time • Attendance, truancy
• School attendance, truancy • “Drop-out” (leaving without certificate)

212 – ANNEX D – OVERVIEW TABLES OF CONTEXTUAL DATA COLLECTION INSTRUMENTS
A REVIEW OF INTERNATIONAL LARGE-SCALE ASSESSMENTS IN EDUCATION: ASSESSING COMPONENT SKILLS AND COLLECTING CONTEXTUAL DATA © OECD AND THE WORLD BANK 2015
PISA (cont.) Student
(individual and family level; classroom and school level)
Parent (family level)
Teacher(classroom level)
Based on draft framework for 2015 (OECD, n.d.-a)
Principal (school and system level)
School resources • Teacher’s employment status, job experience, subjects studied, teaching modal grade? workplace selection (OECD, n.d.-a: 27, 31)
• Funding sources • Size, structure and organisation of the
school • Student and teacher body • School resources • Human resources • Responsibility for specific decisions • School location (size of community)
Family and community support
• Cost of educational service • Attitudes to child’s school • Parental support for learning in
the home • Parents’ participation in school
activities
• Parental expectations towards school • Parents’ participation in school activities
PIRLS and TIMSS Student Parent Teacher Principal
Early learning opportunities
• ISCED 0 attendance • Primary school starting age • Reading activities before primary
school • Information on early literacy and
numeracy activities, reading and quantitative readiness at beginning of primary school
• Students’ readiness for school
Language at home and school
• Frequency of speaking test language at home
• Most used language at home (father and mother)
• Language spoken by child before school started
• If the books at home are mainly in test language
• Number of students that have difficulties understanding spoken test language
• Proportion of students who have test language as native language
• Provisions for reading instruction in mother tongue for students whose mother tongue is not test language

ANNEX D – OVERVIEW TABLES OF CONTEXTUAL DATA COLLECTION INSTRUMENTS – 213
A REVIEW OF INTERNATIONAL LARGE-SCALE ASSESSMENTS IN EDUCATION: ASSESSING COMPONENT SKILLS AND COLLECTING CONTEXTUAL DATA © OECD AND THE WORLD BANK 2015
PIRLS and TIMSS (cont.) Student Parent Teacher Principal
Student socio-economic status
• Number of books at home • Grade 8 only: • Highest level of education completed
by parents • Student’s expected educational
completion level
• Books in the home • Parents’ highest educational
level • Parents’ occupation (main ISCO
groups) • Employment status of father and
mother • Number of children’s books at
home • Parents’ educational
expectations for child
• Average income level of school’s immediate area (high, medium, low)
Quality of instruction
• Instructions to engage students in learning
• Limitations of teaching (including nutrition of students and if they have enough sleep)
• Time spent on language of test instruction and specific activities per week
• Grouping of students • Remedial instruction and options
for advanced readers • Use of different reading material • Reading instruction strategies • Teacher support to develop
reading comprehension skills • Dealing with reading difficulties • Assessing practices for reading • Reading homework • TIMSS includes specific
questions about teaching mathematics/science in Grade 4 and 8
• Emphasis on academic success
• Emphasis on academic success • Evaluate the practice of Grade 4 teachers • Primary emphasis on reading skills per
grade • Emphasis on literacy skills (reading,
writing, speaking/listening)

214 – ANNEX D – OVERVIEW TABLES OF CONTEXTUAL DATA COLLECTION INSTRUMENTS
A REVIEW OF INTERNATIONAL LARGE-SCALE ASSESSMENTS IN EDUCATION: ASSESSING COMPONENT SKILLS AND COLLECTING CONTEXTUAL DATA © OECD AND THE WORLD BANK 2015
PIRLS and TIMSS (cont.) Student Parent Teacher Principal
Learning time • Time spent on homework • Instructional time • School enrolment, Grade 4 enrolment
School resources • Years of teaching experience • Highest educational level
completed • Main areas of post-secondary
studies and specifications • Job satisfaction, safety, working
conditions • Education in teaching reading • Number of students in class • Resources for reading instruction • Computer and library resources
• Resources and technology (computers, science laboratory, library),
• Shortage of resources for instruction (general, reading, mathematics and science)
• Discipline and safety
Family and community support
• Home study support • Parents’ involvement
• Homework activities • Parents involvement with child’s
school work (home-school involvement)
• Opinion about child’s school • Parents’ reading activities and
attitudes towards reading
• Information of parents • School location (number of people/rural, suburban; average income level of the school’s immediate area (high, medium, low)
• Involvement of parents
SACMEQ Student Teacher Principal
Early learning opportunities
• Preschool attendance • Grade repetition
Language at home and school
• Frequency of speaking the language of instruction outside of school
Student socio-economic status
• Socio-economic status factor; number of siblings; meals per week; household tasks factor; learning culture at home; parents alive; living with parents/relatives
• Home environment

ANNEX D – OVERVIEW TABLES OF CONTEXTUAL DATA COLLECTION INSTRUMENTS – 215
A REVIEW OF INTERNATIONAL LARGE-SCALE ASSESSMENTS IN EDUCATION: ASSESSING COMPONENT SKILLS AND COLLECTING CONTEXTUAL DATA © OECD AND THE WORLD BANK 2015
SACMEQ (cont.) Student Teacher Principal
Quality of instruction
• Personalised learning support • Homework factor
• Hours of preparation per week • Trained to teach subject • Subject matter knowledge • School report • Frequency of tests
Learning time • Days absent • Days absent • Teaching hours per week
• Teaching hours per week • School days lost
School resources • Student learning materials • Textbook ownership • Workspace factor
• Teacher characteristics: permanent teacher; education level; years of professional training; years of experience; in-service training
• Classroom environment • Class size; classroom resources • Teacher satisfaction (travel distance, if teacher housing
provided, and quality of housing; quality of school building, level of salary, quality of educational material, professional development, etc.)
• Years of professional training; education level; years of experience as a head; years of teaching experience; training through management course
• School environment • Condition of school buildings • School resources factor; borrowing books
from school; proportion of female teachers; school days lost; location; school inspections
• Students’ behavioural problems • Teacher’s behavioural problems • Pupil-teacher ratio • Pupil-toilet ratio • Free school meals • School size (total number of pupils in the
school’s biggest shift)
Family and community support
• Homework help at home • Extra tuition • Travel distance to school
• Frequency of meeting parents • Parents sign homework
• School community contribution • school community problems

216 – ANNEX D – OVERVIEW TABLES OF CONTEXTUAL DATA COLLECTION INSTRUMENTS
A REVIEW OF INTERNATIONAL LARGE-SCALE ASSESSMENTS IN EDUCATION: ASSESSING COMPONENT SKILLS AND COLLECTING CONTEXTUAL DATA © OECD AND THE WORLD BANK 2015
PASEC Student Teacher Principal
Early learning opportunities
• Pre-school attendance • Grade repetition
Language at home and school
• Language spoken at home (if the student speaks French/Arabic/mother tongue at home)
• Languages spoken by the teacher
Student socio-economic status
• Student socio-economic level (standard of living – poor, intermediate, rich)
• Family background of the student (if mother/father are literate)
Quality of instruction
• • Organisation of learning (e.g. multi-grade) • Pedagogical practices
Learning time • Work in the household/in agriculture/in retail • If out-of-school work hinders learning/hinders school
attendance/hinders during classes because of fatigue • number of out-of-school activities • number of days absent
• School time management
School resources • Availability of text books for French, mathematics • Profile of teacher (e.g. type of education, qualification, years of teaching)
• Classroom infrastructure
• Profile of principal • School characteristics of the school
(e.g. location – rural, urban) • School infrastructure (e.g. electricity) • Pedagogical resources available at
school
Family and community support
• If there is no support for schooling outside of school • Tuition background
• Community infrastructures • Opinions of the principal
Health and wellbeing
• School environment (wellbeing at school) • School environment (wellbeing at school) • School environment (wellbeing at school)

ANNEX D – OVERVIEW TABLES OF CONTEXTUAL DATA COLLECTION INSTRUMENTS – 217
A REVIEW OF INTERNATIONAL LARGE-SCALE ASSESSMENTS IN EDUCATION: ASSESSING COMPONENT SKILLS AND COLLECTING CONTEXTUAL DATA © OECD AND THE WORLD BANK 2015
LLECE Student, parent and teacher Teacher and principal
Early learning opportunities
• How often someone at home reads aloud • Pre-school education • Age of enrolment • Grade repetition • Early reading with the child
Language at home and school
• Language spoken at home (distinction between Spanish or Portuguese; a foreign language and indigenous languages)
• Language of instruction for partial or all instruction • Indigenous language services/resources
Student socio-economic status
• Parental education (level of education; if mother/father reads and writes)
• Home utilities (electricity, water, sewage, phone, cable/internet), construction materials of the home
• Educational materials • Number of books
Quality of instruction
• • Class organisation, structure • Types of formative assessment; type of homework
Learning time • Child labour (i.e. does the child work, at home or outside home, if paid for working, type of work; Grade 6 also days per week and hours per day)
• School shift that student attends (morning, afternoon, intermediate, complete day)
• Support networks or programmes for students with special needs (above all, programmes for student repetition or drop-out)
• Number of school days, length of school days and teaching time
• Enrolment information • Number of planned teaching days and weeks in
the academic year; duration of a school day; duration of each class period/class subject in a day; and number of teaching hours per week per academic subject
• Support networks or programmes for students with special needs (above all, programmes for student repetition or drop-out).

218 – ANNEX D – OVERVIEW TABLES OF CONTEXTUAL DATA COLLECTION INSTRUMENTS
A REVIEW OF INTERNATIONAL LARGE-SCALE ASSESSMENTS IN EDUCATION: ASSESSING COMPONENT SKILLS AND COLLECTING CONTEXTUAL DATA © OECD AND THE WORLD BANK 2015
LLECE (cont.) Student, parent and teacher Teacher and principal
School resources • Teaching resources • Sources of financing • Available educational materials for each student,
frequency of use of classroom texts and school library materials
• School violence
• Funding sources • Staff numbers • School infrastructure, school library • Teaching resources (e.g. television,
photocopier) • Food, transport, medical and clothing
programmes • Level of decision making for finances,
curriculum, hiring staff, professional development, student programmes, communication between the school and administrative jurisdiction (taking into account school visits, inspections
• School violence
Family and community support
• Parental involvement in child’s education: parent participation in school, classroom or advisory meetings and parent-teacher meetings; homework help and reading with the student; parental feeling of school welcome and belonging; parent assessment of school principal and student’s education.
• Parent participation in school, classroom or advisory meetings and parent-teacher meetings
WEI-SPS Teacher Principal
Language at home and school
• Teacher for language of instruction
Quality of instruction
• Classroom organisation and management • Student assessment at classroom level (assessment
methods, relative importance of different assessment methods, use of student assessment)
• Active learning (active teaching in reading, active teaching in mathematics, reproductive and active learning activities)
• Differentiation (internal differentiation in instructional approach and grouping)
• Structured teaching/scaffolding • School goals and achievement expectations
• Staff professional development • Principal’s professional development • Types of professional development activities • Proportion of staff involved in several kinds of professional development activities

ANNEX D – OVERVIEW TABLES OF CONTEXTUAL DATA COLLECTION INSTRUMENTS – 219
A REVIEW OF INTERNATIONAL LARGE-SCALE ASSESSMENTS IN EDUCATION: ASSESSING COMPONENT SKILLS AND COLLECTING CONTEXTUAL DATA © OECD AND THE WORLD BANK 2015
WEI-SPS (cont.) Teacher Principal
Learning time • Instruction time in basic subjects: • Official instruction time – language • Official instruction time – arithmetic and mathematics • Lesson time that is spent on other activities than
teaching/learning
School resources • Instructional resources: • Classroom furniture – tables and chairs • Classroom equipment • Textbooks • Teacher background: • Level of education, training
• Availability and condition of school resources and school facilities • Principal’s perceptions of shortages in school human resources • School human resources – staff • School size and class size • Staff qualification • Staff stability • Permanent and temporary teachers, support staff
Family and community support
• Parents and community contributions • School-parent relations
Notes: Regarding the “Principal” column for PIRLS and TIMSS: The sections about students’ school readiness, emphasis on reading and language skills, as well as provision of reading instruction in mother tongue, are administered in TIMSS for Grade 4 only (IEA, 2013b).
Regarding the “Student, parent and teacher” column for LLECE: Student characteristics were collected from student, parent, and teacher questionnaires; family characteristics were collected from the student and parent questionnaires (LLECE, 2009: 40). The allocation of constructs in the table is indicative only.
Regarding the “Teacher and principal” column for LLEC: Teacher and principal characteristics were collected from teacher and principal questionnaires; school characteristics and educational resources were collected from principal, teacher and student questionnaires (LLECE, 2009: 40). The allocation of constructs in the table is indicative only.
Sources: For PISA: OECD, 2013b. For PIRLS: IEA, 2013a; Mullis and Martin, 2013; Mullis et al., 2009a. For TIMSS: Hooper et al., 2013; IEA, 2013b; Mullis et al., 2009b. For SACMEQ: Hungi, 2011a. For PASEC: CONFEMEN, 2012: 97, 121-122. For LLECE: LLECE, 2009. For WEI-SPS: UIS, 2009a.

220 – ANNEX D – OVERVIEW TABLES OF CONTEXTUAL DATA COLLECTION INSTRUMENTS
A REVIEW OF INTERNATIONAL LARGE-SCALE ASSESSMENTS IN EDUCATION: ASSESSING COMPONENT SKILLS AND COLLECTING CONTEXTUAL DATA © OECD AND THE WORLD BANK 2015
Table D.5 Factors and variables for the seven key topics at individual, family, classroom and school level: School-based surveys
School-based surveys
EGRA and EGMA Student(individual and family level)
Teacher(classroom level)
Principal(school level)
Early learning opportunities
• Grade repetition, preschool attendance
Language at home and school
• Language at home • Native language of teacher
Socio-economic status
• Household: electricity, type of toilet, method for cooking food, water source for washing, can mother and father read
• Books at home
Quality of instruction
• Teacher’s instructional practices: • Observe child’s language • Note teacher’s comments • How does teacher respond to child’s correct and
incorrect answers to questions in class • How much homework • Did teacher mark last homework
• Supervision/support for teacher – frequency of head teacher/supervisor checks of teacher’s lesson plans, frequency of formal and informal classroom visits by head teacher
• Monitoring and assessing students’ progress (how is children’s progress monitored and assessed)
• Expectations about learning levels (i.e. grade at which children are expected to be able to read fluently and write)
• School records (are records available for examination, how is students’ progress monitored)
• Expectations about learning levels (i.e. grade at which children are expected to be able to read fluently and write)
• Last visit of grade supervisor
Learning time • Child’s absences/lateness
• Student attendance – number of different grades in teacher’s class, number of boys and girls in class, typical absentee and lateness numbers
• Duration of school day – school day start, end, and time taken for breaks/assembly etc.
• Student enrolment – numbers of boys and girls • Unofficial school closures during current year (has
school been closed or classes not taught this year, if yes how many days in past month)
• Teacher attendance (number of teachers absent/on leave/arriving late, what happens to a class when a teacher is absent)

ANNEX D – OVERVIEW TABLES OF CONTEXTUAL DATA COLLECTION INSTRUMENTS – 221
A REVIEW OF INTERNATIONAL LARGE-SCALE ASSESSMENTS IN EDUCATION: ASSESSING COMPONENT SKILLS AND COLLECTING CONTEXTUAL DATA © OECD AND THE WORLD BANK 2015
EGRA and EGMA (cont.)
Student(individual and family level)
Teacher(classroom level)
Principal(school level)
School resources • Teacher’s pedagogical preparation and training (highest level of education, pre-service and in-service training for reading and maths)
• Safety at school – does teacher feel that he/she and children are safe at school, if no explain
Observation: • Number of textbooks, number of students with
pencils, presence and number of books other than textbooks for reading, students’ work and instructional material displayed on walls, adequate number of seats, teachers materials (blackboard, chalk, pen, notebook, teacher manuals), teacher’s lesson plan book (is there one, is it used, does head teacher check it), adequate lighting in classroom
• School resources (adequate numbers of textbooks received from ministry, presence of library and is it used
• School facilities (are they shared between more than one school, if yes how many)
• Teacher background (gender breakdown of teaching population, number of teachers for assessed grade)
• Safety at school (does head feel that school is safe, does head feel that he/she and children are safe at school, if no explain)
Observation: • School resources and facilities: cleanliness of
school and surrounds, any major repairs required, presence of electricity source and functioning on day of observation, presence of water source and functioning on day of observation, number of functional toilets overall and for girls, presence of functioning phone, presence and use of library, presence of playground/wall/security guard
Family and community support
Parents’ engagement/investment in education:• Help at home with homework • Providing meal to child before school • Parents’ knowledge when child does well at
school • How often child reads aloud at home and is read
to aloud at home
• Monitoring and assessing students’ progress (how many parents review children’s homework, teacher’s level of satisfaction with parental involvement)
• Presence of Parent Teacher Association and when did it last meet, head teacher’s level of satisfaction with parental involvement
Sources: RTI International, 2013a, 2013b, 2013c, 2013d, 2013e, 2013f.

222 – ANNEX D – OVERVIEW TABLES OF CONTEXTUAL DATA COLLECTION INSTRUMENTS
A REVIEW OF INTERNATIONAL LARGE-SCALE ASSESSMENTS IN EDUCATION: ASSESSING COMPONENT SKILLS AND COLLECTING CONTEXTUAL DATA © OECD AND THE WORLD BANK 2015
Table D.6 Factors and variables for the seven key topics at individual, family, school and village level: Household-based surveys (child population)
Household-based surveys (child population)
ASER Head of household (individual and family level) Head teacher (school level) Village(system level)
Early learning opportunities
• Pre-school status of the child (in which programme) • School-status (in which programme) • Out-of-school status; this refers to children currently not enrolled,
age 5-16: never enrolled, dropped out, schooling status when child left the school, year of drop out
• If child goes to the school observed
Language at home and school
• Language spoken at home by family members
Socio-economic status
• Economic conditions of the household (type of house, electricity connection and availability on the day of interview, availability of toilet, TV (including a paid facility), and mobile phone
• Availability of reading material (books and daily newspapers) • If anyone in the household knows how to use a computer • Father’s and mother’s background information (age, if attended
school and which level completed, if never attended school)
Quality of instruction
• Official medium of instruction in school
Learning time • Student enrolment and attendance (for classes 1-8) • Teacher numbers and attendance

ANNEX D – OVERVIEW TABLES OF CONTEXTUAL DATA COLLECTION INSTRUMENTS – 223
A REVIEW OF INTERNATIONAL LARGE-SCALE ASSESSMENTS IN EDUCATION: ASSESSING COMPONENT SKILLS AND COLLECTING CONTEXTUAL DATA © OECD AND THE WORLD BANK 2015
ASER (cont.) Head of household (individual and family level) Head teacher (school level) Village(system level)
School resources • Grouping of students of different grades in one class • Where children are seated (classroom, veranda, outdoors) • Availability of a blackboard (and if one can easily write on
it) • Availability of other material apart from text books • Availability of midday meal (and if cooking facilities are
available at school) • Facilities observation (total number of teaching rooms,
office, playground, library, hand pump or tap, drinking water, boundary wall or fencing, computers at school for children’s use; toilets for boys and girls)
• School grant information and activities carried out (repairs, purchase, expenditures)
• Availability of basic facilities such as a road, electricity, a post office, a bank, a shop, a health care centre (government), private health clinic, and internet café and supply of solar energy
• Government schools in the village (yes/no): pre-school, primary school, upper-primary, secondary school, private school
Family and community support
• How much household spent on paid tuition in 2013
UWEZO Head of household Head teacher Village
Early learning opportunities
• Child’s schooling/enrolment status
Language at home and school
• Language spoken at home • Number of Kiswahili, English and maths textbooks
Socio-economic status
• Socio-economic status, including home possessions and main source of income: number of members who eat from the same pot (the definition of a household), type of house, lighting in house, presence of protected water source, presence of toilet, number of meals per day, possessions: radio, TV, computer, mobile phone, cattle, donkeys, camels, sheep/goats, bicycle, motorbike, cart, number of books in the home
• Parents’ level of education
Learning time • Children’s enrolment • Teacher numbers and attendance

224 – ANNEX D – OVERVIEW TABLES OF CONTEXTUAL DATA COLLECTION INSTRUMENTS
A REVIEW OF INTERNATIONAL LARGE-SCALE ASSESSMENTS IN EDUCATION: ASSESSING COMPONENT SKILLS AND COLLECTING CONTEXTUAL DATA © OECD AND THE WORLD BANK 2015
UWEZO (cont.) Head of household Head teacher Village
School resources • Classroom organisation (based on observation) including: how many children, where are children sitting, do most of them have writing materials, is there a chalkboard, is there a timetable and is it being followed, are there any other teaching and learning materials, number of Kiswahili, English and maths textbooks, availability of teaching and learning materials
• Background data about teacher of observed classroom, including highest level of education completed
School facilities, including electricity, admin building, playing field, fence, toilets • Drinking water • Library • Grant activities – application and receipt of grants
• Electricity availability • Basic facilities • School types • Health facilities • Village meetings • Awareness of Uwezo
Family and community support
• Parents’ involvement in child’s education • Parents’ awareness of Uwezo • Parents’ sense of how much their opinions about education are
heard by local and national officials • Parents’ view of most pressing issues facing community
• Awareness about Uwezo • Number of parents that attended last school meeting • How many parents in the last year came voluntarily to talk
about children’s education
Health and wellbeing
• Health and other services: presence of nurse, main health issue keeping children out of school (malaria, diarrhoea, cough/flu, other), provision of sanitary items for girls, availability of drinking water, presence of food services
Sources: For ASER: ASER Centre, 2012a, 2012b, 2013. For UWEZO: Uwezo Kenya, 2013a.

ANNEX D – OVERVIEW TABLES OF CONTEXTUAL DATA COLLECTION INSTRUMENTS – 225
A REVIEW OF INTERNATIONAL LARGE-SCALE ASSESSMENTS IN EDUCATION: ASSESSING COMPONENT SKILLS AND COLLECTING CONTEXTUAL DATA © OECD AND THE WORLD BANK 2015
Table D.7 Factors and variables regarding the seven key topics at individual level: Household-based surveys (adult population)
Household-based surveys – adult target population
PIAAC Respondent (individual level)
Language at home and school
• Language first learned at home in childhood • Second language learned • Language spoken at home most often
Socio-economic status
• Socio-economic status derived from five indicators: highest level of education ever attained by parents (HISEI), occupational code (ISCO) of both parents when respondent was age 16, and number of books in the household when respondent was age 16 (as indicator of level of cultural capital in the parental home)
• Education and training: highest level of education (ISCED 97 classification), area of study, working while studying, other organised learning/training activities, time spent on learning/training
• Parental education • Current status and work history: current status in paid/unpaid work, work history • Current work/last job: job title (ISCO 2008), work responsibility, type of work, employer/employee, size of the employer, type of employment contract, hours of work, flexibility,
learning at work, wage
Family and community support
• Household composition • Cultural capital • Parental home
Health and wellbeing
• Health: single item on subjective health retained for main study (OECD, 2013a: 39): “In general, would you say your health is excellent, very good, good, fair, or poor?” (OECD, n.d.-b: 106)
STEP (Household survey only)
Respondent
Early learning opportunities
• Module 2: Participation in early childhood education
Language at home and school
Module 7 language: • Mother tongue (first language a person learned; up to two languages can be recorded) • Language that is mainly spoken in the house • The total number of people in the household that speak any of the official country language • Languages in which the respondents speak • Languages in which the respondents read and write well enough to work in a job that requires that language

226 – ANNEX D – OVERVIEW TABLES OF CONTEXTUAL DATA COLLECTION INSTRUMENTS
A REVIEW OF INTERNATIONAL LARGE-SCALE ASSESSMENTS IN EDUCATION: ASSESSING COMPONENT SKILLS AND COLLECTING CONTEXTUAL DATA © OECD AND THE WORLD BANK 2015
STEP (Household survey only) (cont.)
Respondent
Socio-economic status
• Module 1b dwelling characteristics, used to measure SES: domestic water supply, cooking conditions, source of lighting and other issues related to housing conditions in which the household lives
• Module 2: education and training: level of formal education and whether academic or vocational, field of study for highest qualification (13-15 categories), reasons for dropping out (if applicable), reason for interrupting schooling (if applicable), apprenticeship (y/n) and trade, number of training courses, participation in literacy courses, school class rank, parental encouragement questions related to formal education, lifelong learning, and other types of training and certificates; ISCED 97 is used to classify education
• Module 4 employment: basic employment information, such as employed, unemployed, or inactive, including self-employed (with and without paid work), underemployed, or holding low-productivity jobs
Other • Module 3 health: information on a number of key health indicators (e.g. on the individual’s level of satisfaction regarding own life, height (cm), weight (kg), number of days the individual was prevented from working during the last four weeks due to sudden illness, accident or chronic illness, existence and kind of health insurance)
LAMP Respondent
Language at home and school
• Languages used by the respondent: the number of languages that the respondents knows and which language they use most often in their daily lives • Parental language
Socio-economic status
• SES measure created from questions about household facility and living environment (respondent); questions include structure of the household (materials used for the house, number of rooms etc.), the equipment available in the household (electricity, running water, stove, refrigerator, TV, radio, telephone, kind of toilet facility etc.), air quality and household waste disposal, and ownership of assets (bank account, land, animals etc.)
• Education attainment (current and history); ISCED 97 is used to classify education • Attendance of literacy programmes (incl. formal education, non-formal-education) • Attendance of training courses (incl. formal education, non-formal-education), employment status (and history): if respondents are in the labour force, for how long, type of
work, part-time, full-time, for an organisation or self-employed; pay • Educational attainment and occupation of parents or guardians
Family and community support
• Human and social capital (social context, literate environment) • Household characteristics and structure (head of household screening questions about number of individuals living in the household, classified by relationship to head of
household, age, sex, and highest level of education)
Health and wellbeing
• Personal wellbeing and health-related literacy questions (respondents are asked about their health condition and if they can perform basic functions like filling in medical forms, reading medical labels and food labels)
Sources: For PIAAC: See OECD, n.d.-b. For STEP: Pierre et al., 2014. For LAMP: UIS, n.d.

ANNEX D – OVERVIEW TABLES OF CONTEXTUAL DATA COLLECTION INSTRUMENTS – 227
A REVIEW OF INTERNATIONAL LARGE-SCALE ASSESSMENTS IN EDUCATION: ASSESSING COMPONENT SKILLS AND COLLECTING CONTEXTUAL DATA © OECD AND THE WORLD BANK 2015
Table D.8 Scaling/computing of relevant contextual constructs in international surveys reviewed
Survey Scaling methodology Constructs relevant for PISA-D in regards to the seven key areas(without SES-related measures)
Large-scale international surveys
PISA • PISA calculates simple indices and scale indices from contextual data:
• Simple indices are constructed through arithmetic transformation or recoding of one or more items (e.g. recoding of the 4-digit ISCO Code into HISEI, or teacher/student ratio based on information from the school questionnaire).
Scale indices are the variables constructed through the scaling of multiple items. Unless otherwise indicated, indices were scaled using a weighted likelihood estimate (Warm, 1989), using a one-parameter item response model (a partial credit model was used in the case of items with more than two categories). For details on how each scale index was constructed see the PISA 2012 Technical Report (OECD, 2014a). In general, the scaling was done in three stages: • The item parameters were estimated from equal-sized
subsamples of students from all participating countries and economies.
• The estimates were computed for all students and all schools by anchoring the item parameters obtained in the preceding step.
• The indices were then standardised so that the mean of the index value for the OECD student population was 0 and the standard deviation was 1 (countries being given equal weight in the standardisation process).
(OECD, 2014b: 260)
• Language background: (1) language at home is the same as the language of assessment, and (2) language at home is a different language than the language of assessment (LANGN).
• In order to capture between-country variation, the relative Grade index (GRADE) indicates whether students are at the modal Grade in a country (value of 0), or whether they are below or above the modal grade level.
(OECD, 2014b: 260-266)
PIRLS and TIMSS
• Most context questionnaire items in TIMSS and PIRLS 2011 were designed to be combined into scales measuring a single underlying latent construct. The scales were constructed using IRT scaling methods, specifically the Rasch partial credit model (Masters and Wright, 1997). As a parallel to the International Benchmarks of achievement in TIMSS and PIRLS, each context scale was divided into regions corresponding to high, middle, and low values on the construct. To facilitate interpretation of the regions, the cutpoints delimiting the regions were defined in terms of combinations of response categories (Martin et al., 2012: 1).
• The TIMSS and PIRLS 2011 context questionnaire scaling was conducted using the ConQuest 2.0 software (Wu et al., 2007).
• Early literacy activities before beginning primary school scale (Grade 4): this scale was created based on parents’ frequency of doing nine activities (e.g. read books, tell stories, sing songs, play word games etc.)
• Early numeracy activities before beginning primary school scale (Grade 4): based on parents’ responses to six statements (e.g. say counting rhymes or sing counting songs, count different things, play with building blocks or construction toys)
• Could do early literacy tasks when began primary school scale (PIRLS Grade 4): Based on parents’ responses to how well their children could do five tasks (e.g. recognise most of the letters of the alphabet, read some words, read some sentences etc.)
• Could do early numeracy tasks when began primary school scale (TIMSS Grade 4): based on parents’ responses to the six statements (e.g. count by himself/herself, recognise different shapes (e.g. square, triangle, circle etc.)

228 – ANNEX D – OVERVIEW TABLES OF CONTEXTUAL DATA COLLECTION INSTRUMENTS
A REVIEW OF INTERNATIONAL LARGE-SCALE ASSESSMENTS IN EDUCATION: ASSESSING COMPONENT SKILLS AND COLLECTING CONTEXTUAL DATA © OECD AND THE WORLD BANK 2015
Survey Scaling methodology Constructs relevant for PISA-D in regards to the seven key areas(without SES-related measures)
Large-scale international surveys (cont.)
PIRLS and TIMSS (cont.)
• Instruction affected by reading resource shortages scale: based on principals’ responses concerning 11 school and classroom resources: 7 general resources and 4 reading specific resources
• Instruction affected by mathematics resource shortage scale (TIMSS Grades 4 and 8): principals’ responses concerning 12 school and classroom ffresources: 7 general resources and 5 mathematics specific resources
• Instruction affected by science resource shortage scale (TIMSS Grades 4 and 8): Principals’ responses concerning 12 school and classroom resources: 7 general resources and 5 science specific resources
• Teachers’ working conditions scale (PIRLS, TIMSS Grades 4 and 8): Based on teachers’ responses concerning five potential problem areas (school building needing significant repair, classrooms being overcrowded, teachers having too many teaching hours, teachers not having adequate workspace, teachers not having adequate instructional materials and supplies)
• School emphasis on academic success – Principal reports scale (PIRLS, TIMSS Grades 4 and 8): based on principals’ responses characterising five aspects (e.g. teachers’ understanding of the school’s curricular goals, teachers’ expectations for student achievement etc.)
• School emphasis on academic success – teacher reports scale (PIRLS, TIMSS Grades 4 and 8): based on teachers’ responses, same as principals’ scale
• Emphasis in early grades on reading skills and strategies scale: based on principals’ responses about the earliest grade at which each of 11 reading skills and strategies were emphasised.
• Safe and orderly school scale (PIRLS, TIMSS Grades 4 and 8): based on teachers’ degree of agreement with five statements (e.g. this school is located in a safe neighbourhood, I feel safe at this school, the students behave in an orderly manner etc.)
• School discipline and safety scale (PIRLS, TIMSS Grades 4 and 8): based on principals’ responses concerning ten potential school problems (e.g. arriving late at school, absenteeism, as in unjustified absences, vandalism etc.)
• Teacher career satisfaction (PIRLS, TIMSS Grades 4 and 8): based on teachers’ degree of agreement with six statements (e.g. I am content with my profession as a teacher, I do important work as a teacher, etc.)
• Collaborate to improve teaching scale (PIRLS, TIMSS Grades 4 and 8): based on teachers’ responses to how often they interacted with other teachers in each of five teaching areas (e.g. discuss how to teach a particular topic, visit another classroom to learn more about teaching etc.)

ANNEX D – OVERVIEW TABLES OF CONTEXTUAL DATA COLLECTION INSTRUMENTS – 229
A REVIEW OF INTERNATIONAL LARGE-SCALE ASSESSMENTS IN EDUCATION: ASSESSING COMPONENT SKILLS AND COLLECTING CONTEXTUAL DATA © OECD AND THE WORLD BANK 2015
Survey Scaling methodology Constructs relevant for PISA-D in regards to the seven key areas(without SES-related measures)
Large-scale international surveys (cont.)
PIRLS and TIMSS (cont.)
• Instructions to engage students in learning scale (PIRLS, TIMSS Grades 4 and 8): based on teachers’ responses to how often they used each of six instructional practices (e.g. summarise what students should have learned from the lesson, praise students for good effort etc.)
• Students engaged in reading lessons scale: based on students’ degree of agreement with seven statements (e.g. I like what I read about in school, know what my teacher expects me to do, I am interested in what my teacher says etc.)
SACMEQ • Using Rasch IRT model, six factors were constructed: one factor derived from Level 1 (student) variables, and five factors derived from Level 2 (school and class) variables (Hungi, 2011b: 32).
• School community contribution factor: Sum of the presence of community contributions towards nine school activities including construction and maintenance of school building, construction and repair of school furniture, provision of school meals, buying textbooks, stationery and supplies, payment of teacher salaries, and extra-curriculum activities.
• Students’ behaviour problems factor: Sum of existence of behavioural problems among pupils (e.g. lateness, skipping classes, classroom disturbance, cheating, use of abusive language, theft, fighting, and vandalism)
• Teachers’ behaviour problems factor: Sum of existence of behavioural problems among teachers (e.g. lateness, absenteeism, skipping classes, use of abusive language, drug abuse, and alcohol abuse)
(Hungi, 2011b)
PASEC • PASEC uses classical IRT for scaling (CONFEMEN, 2012: 113) • For the analysis of questionnaire responses the same techniques
are applied as for the analysis of test items. • Questionnaire analysis (Cronbach’s alpha, point-biserial
correlations) are carried out to measure internal consistency (CONFEMEN, 2012: 110).
Not applicable
LLECE • LLECE reports assessment results using a single continuous scale obtained from the application of the Rasch IRT model for each subject.
• For the analysis of factors associated with student achievement (i.e. contextualising results) LLECE uses hierarchical linear models.
(LLECE, 2009)
• Index of educational opportunity: classroom time, learning resources, school library, financial resources, school infrastructure, and teacher and leader quality as processes that mediate pedagogy (curriculum coverage, language of instruction, school autonomy, use of teaching materials, homework and school climate). Analyses are conducted at the classroom, school and education system levels.
• Index of accessibility of basic school services: five items from Question 11 in the principal questionnaire (census questionnaire, in Spanish, “Ficha de Empadronamiento”) if the following exists in the school (yes/no): electricity/lights; drinkable water; sewage system; phone; sufficient number of bathrooms.

230 – ANNEX D – OVERVIEW TABLES OF CONTEXTUAL DATA COLLECTION INSTRUMENTS
A REVIEW OF INTERNATIONAL LARGE-SCALE ASSESSMENTS IN EDUCATION: ASSESSING COMPONENT SKILLS AND COLLECTING CONTEXTUAL DATA © OECD AND THE WORLD BANK 2015
Survey Scaling methodology Constructs relevant for PISA-D in regards to the seven key areas(without SES-related measures)
Large-scale international surveys (cont.)
LLECE (cont.)
• Index of school infrastructure: created from 15 items from Question 12 of the principal (census) questionnaire: principal’s office; additional offices (secretary/administration); staff room; sports field/court/oval; science room; gym; school garden; computer room; auditorium; kitchen’ cafeteria; art/music room; medical office; speech-psychology services; school library.
(LLECE, 2009)
WEI-SPS • Composite indices were used to summarise the responses from school principals and teachers.
• Some indices were nationally standardised so that the mean of the index for each country was zero and the standard deviation was 1.0.
• Some other indices were internationally standardised so that the mean of the index value for all of the WEI-SPS countries was zero and the standard deviation was 1.0. In the latter case, countries were given equal weight in the standardisation process. Unless otherwise indicated, decisions about the standardisation were taken on the basis of theoretical considerations.
(UIS, 2009a: 70, Appendix III)
Six indices about instruction were computed based on teachers’ responses about how oftenthey implement these activities: • Learning style – active learning activities • Learning style – group work • Learning style – rote repetition • Teacher-centred teaching practices • Strongly structured teaching practices • Pupil-centred teaching practices Eight indices about opportunity to learn in reading were computed: • Difficulty of reading materials • Variety of reading materials • Emphasis on creative activities • Emphasis on grammar and other formal exercises • Emphasis on locating information • Emphasis on interpreting the meaning of the text • Difficulty of reading activities • Grade where (the sample question was) appropriate (UIS, 2009a: 70, Appendix III)
School-based surveys
EGRA/ EGMA
• No general guidelines are provided by RTI about how contextual variables should be processed/analysed.
• In reports from specific implementations that used SSME contextual instruments, contextual data are usually just analysed with frequency analyses (i.e. percentages in particular categories).

ANNEX D – OVERVIEW TABLES OF CONTEXTUAL DATA COLLECTION INSTRUMENTS – 231
A REVIEW OF INTERNATIONAL LARGE-SCALE ASSESSMENTS IN EDUCATION: ASSESSING COMPONENT SKILLS AND COLLECTING CONTEXTUAL DATA © OECD AND THE WORLD BANK 2015
Survey Scaling methodology Constructs relevant for PISA-D in regards to the seven key areas(without SES-related measures)
Household-based surveys
PIAAC • Indices are derived with IRT. • Indices from continuous variables were all standardised to have
mean equal to 2 and standard deviation equal to 1 across the pooled sample of respondents in all countries. This results in indices for which at least 90% of the observations lay between 0 and 4, whereby values approaching 0 suggest a low frequency of use and values approaching 4 suggest a high frequency.
(OECD, 2013c: 43)
STEP • Construction of simple scales (derived from Likert scales). • Most of the skill measures collected under the STEP surveys can
be scored using simple algorithms (simple averages across questions will work in most of the cases).
• Negatively scored items were recoded prior to the aggregation. (Pierre et al., 2014: 69)
LAMP • Basically some background information is selected to build the reporting scale.
• Plausible values are created every time with a different set of context variables that should be included in the analyses (e.g. gender, or gender by location; SES). This has practical reasons: in LAMP there not much background information available as a lot of questions have been skipped. That way it’s more accurate and programming is not as complex (B. Tay-Lim, personal communication, 13 November 2014).
ASER • Usually frequency analyses and some aggregated variables are reported.

232 – ANNEX D – OVERVIEW TABLES OF CONTEXTUAL DATA COLLECTION INSTRUMENTS
A REVIEW OF INTERNATIONAL LARGE-SCALE ASSESSMENTS IN EDUCATION: ASSESSING COMPONENT SKILLS AND COLLECTING CONTEXTUAL DATA © OECD AND THE WORLD BANK 2015
Survey Scaling methodology Constructs relevant for PISA-D in regards to the seven key areas(without SES-related measures)
Household-based surveys (cont.)
UWEZO • For the regional report, average teacher attendance rates were calculated for each of the three countries (Kenya, Tanzania and Uganda) in the Uwezo regional report (see Uwezo, 2014: 17).
• The Tanzania national report from 2012 presents the following calculated indices: pupil attendance rates (percentage of enrolled children who are present on the day school is surveyed), pupil-teacher ratios (calculated for each region), percentage of teachers absent (calculated for each region), pupil/textbook ratio (calculated for each region) (see Uwezo Tanzania, 2013: 36-39).
• The Kenya national report from 2012 presents the following calculated indices: pupil/textbook ratio (see Uwezo Kenya, 2013b: 12), student attendance rates and teacher-pupil ratios based on enrolment and attendance figures (for national indices see Uwezo Kenya, 2013a: 15). Student and teacher attendance rates are also calculated for each country (see Uwezo Kenya, 2013b: 21-67).
Notes: Detailed information about all questionnaire scales in PIRLS and TIMSS are documented on the PIRLS and TIMSS website: http://timssandpirls.bc.edu/methods/t-context-q-scales.html.
Concerning the “large-scale international surveys” “scaling methodology” for PIRLS and TIMSS, the “students confident in reading scale” consists of seven statements. For each of the seven statements, students were asked how much they agreed with the statement: agree a lot, agree a little, disagree a little, or disagree a lot. Using IRT partial credit scaling, student responses were placed on a scale constructed so that the mean scale score across all PIRLS countries was 10 and the standard deviation was 2. Statements expressing negative sentiment were reverse coded during the scaling (statements 3, 5, and 7). Students “confident in their reading” had a scale score greater than or equal to the point on the scale corresponding to agreeing a lot, on average with four of the seven statements and a little with three of the statements. Students “not confident” in their reading had a score no higher than the point on the scale corresponding to disagreeing a little with four of the statements, on average, and agreeing a little with three of them.
Concerning the “large-scale international surveys” “constructs relevant for PISA-D in regards to the seven key areas (without SES-related measures)” for PASEC, specific information on contextual constructs computed in PASEC was not available for the review of international assessments.
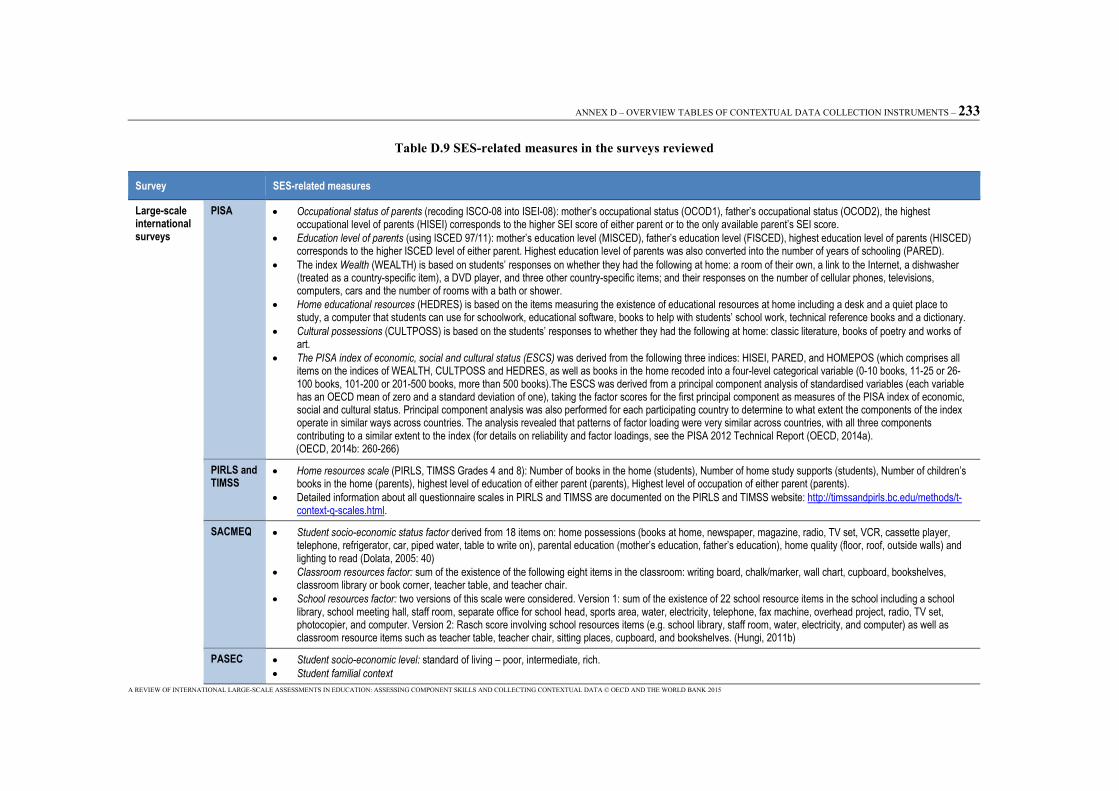
ANNEX D – OVERVIEW TABLES OF CONTEXTUAL DATA COLLECTION INSTRUMENTS – 233
A REVIEW OF INTERNATIONAL LARGE-SCALE ASSESSMENTS IN EDUCATION: ASSESSING COMPONENT SKILLS AND COLLECTING CONTEXTUAL DATA © OECD AND THE WORLD BANK 2015
Table D.9 SES-related measures in the surveys reviewed
Survey SES-related measures
Large-scale international surveys
PISA • Occupational status of parents (recoding ISCO-08 into ISEI-08): mother’s occupational status (OCOD1), father’s occupational status (OCOD2), the highest occupational level of parents (HISEI) corresponds to the higher SEI score of either parent or to the only available parent’s SEI score.
• Education level of parents (using ISCED 97/11): mother’s education level (MISCED), father’s education level (FISCED), highest education level of parents (HISCED) corresponds to the higher ISCED level of either parent. Highest education level of parents was also converted into the number of years of schooling (PARED).
• The index Wealth (WEALTH) is based on students’ responses on whether they had the following at home: a room of their own, a link to the Internet, a dishwasher (treated as a country-specific item), a DVD player, and three other country-specific items; and their responses on the number of cellular phones, televisions, computers, cars and the number of rooms with a bath or shower.
• Home educational resources (HEDRES) is based on the items measuring the existence of educational resources at home including a desk and a quiet place to study, a computer that students can use for schoolwork, educational software, books to help with students’ school work, technical reference books and a dictionary.
• Cultural possessions (CULTPOSS) is based on the students’ responses to whether they had the following at home: classic literature, books of poetry and works of art.
• The PISA index of economic, social and cultural status (ESCS) was derived from the following three indices: HISEI, PARED, and HOMEPOS (which comprises all items on the indices of WEALTH, CULTPOSS and HEDRES, as well as books in the home recoded into a four-level categorical variable (0-10 books, 11-25 or 26-100 books, 101-200 or 201-500 books, more than 500 books).The ESCS was derived from a principal component analysis of standardised variables (each variable has an OECD mean of zero and a standard deviation of one), taking the factor scores for the first principal component as measures of the PISA index of economic, social and cultural status. Principal component analysis was also performed for each participating country to determine to what extent the components of the index operate in similar ways across countries. The analysis revealed that patterns of factor loading were very similar across countries, with all three components contributing to a similar extent to the index (for details on reliability and factor loadings, see the PISA 2012 Technical Report (OECD, 2014a).
(OECD, 2014b: 260-266)
PIRLS and TIMSS
• Home resources scale (PIRLS, TIMSS Grades 4 and 8): Number of books in the home (students), Number of home study supports (students), Number of children’s books in the home (parents), highest level of education of either parent (parents), Highest level of occupation of either parent (parents).
• Detailed information about all questionnaire scales in PIRLS and TIMSS are documented on the PIRLS and TIMSS website: http://timssandpirls.bc.edu/methods/t-context-q-scales.html.
SACMEQ • Student socio-economic status factor derived from 18 items on: home possessions (books at home, newspaper, magazine, radio, TV set, VCR, cassette player, telephone, refrigerator, car, piped water, table to write on), parental education (mother’s education, father’s education), home quality (floor, roof, outside walls) and lighting to read (Dolata, 2005: 40)
• Classroom resources factor: sum of the existence of the following eight items in the classroom: writing board, chalk/marker, wall chart, cupboard, bookshelves, classroom library or book corner, teacher table, and teacher chair.
• School resources factor: two versions of this scale were considered. Version 1: sum of the existence of 22 school resource items in the school including a school library, school meeting hall, staff room, separate office for school head, sports area, water, electricity, telephone, fax machine, overhead project, radio, TV set, photocopier, and computer. Version 2: Rasch score involving school resources items (e.g. school library, staff room, water, electricity, and computer) as well as classroom resource items such as teacher table, teacher chair, sitting places, cupboard, and bookshelves. (Hungi, 2011b)
PASEC • Student socio-economic level: standard of living – poor, intermediate, rich. • Student familial context

234 – ANNEX D – OVERVIEW TABLES OF CONTEXTUAL DATA COLLECTION INSTRUMENTS
A REVIEW OF INTERNATIONAL LARGE-SCALE ASSESSMENTS IN EDUCATION: ASSESSING COMPONENT SKILLS AND COLLECTING CONTEXTUAL DATA © OECD AND THE WORLD BANK 2015
Survey SES-related measures
Large-scale international surveys (cont.)
LLECE • ISEC – Index of socio-economic and cultural background: considers child wellbeing, and cultural access at local, regional and global levels. This index has an emphasis on home assets, assuming that assets in the home facilitate access to culture and learning. Items include the following six questions from the parent questionnaire: parent level of education; mother tongue of the child; construction material of home; available home utilities (water, electricity etc.); home possessions (appliances not cultural items); number of books in the home.
(LLECE, 2009)
WEI-SPS • Social advantage of school intake index has been computed based on school principal’s responses about the number of students (e.g. none, most, all) for three items about student SES and home background (e.g. parental education; students receiving feeding/clothing programmes; school intake compared to national GDP per capita) and based on teacher’s responses about the number of students (e.g. none, most, all) for six items about student SES and home backgrounds (e.g. child labour; family health problems).
• Social advantage of classroom intake index has been computed based on teacher’s responses about the number of students (e.g. none, most, all) for six items about student SES and home backgrounds (e.g. child labour; family health problems).
(UIS, 2009a: 70, Appendix III)
School-based surveys
EGRA/ EGMA
• Household SES includes data about electricity, type of toilet, method for cooking food, water source for washing, can mother and father read. • Books at home information is available as well (but no information if used for SES information).
Household-based surveys
PIAAC • The background questionnaire contained five indicators of respondents’ socio-economic background, namely the highest level of education ever attained by parents (HISEI), the occupational code of both parents when the respondent was age 16 (ISCO 2008), and the number of books in the household when the respondent was age 16 (as indicator of the level of cultural capital in the parental home).
(OECD, 2013a: 32)
STEP • An asset index was constructed for urban areas as a proxy for wealth (Pierre et al., 2014: 15), using the information collected in Module 1b of the STEP household questionnaire on dwelling characteristics and household assets. Since the focus of the survey is to obtain detailed information at the individual level, the household-level information is kept to a minimum (Pierre et al., 2014: 14).
LAMP • Respondents are classified into four socio-economic groups: 1) affluent (well-off); 2) comfortable; 3) poor; 4) subsistence level. This is based on information on SES collected through questions about household facility and living environment and includes the structure of the household (materials used for the house, number of rooms, etc.), the equipment available in the household (electricity, running water, stove, refrigerator, TV, radio, telephone, etc.), air quality and household waste disposal, and ownership of assets (bank account, land, animals etc.). More details about creating SES can be found in the forthcoming LAMP international report (mid-2015) (B. Tay-Lim, personal communication, 13 November 2014).
ASER • SES measures include: • Economic conditions of the household (type of house, electricity connection and if there was electricity available on the day of interview, availability of toilet, TV
(including a paid facility), and mobile phone • Availability of reading material (books and daily newspapers) • If anyone in the household knows how to use a computer • Father’s and mother’s background information (age, if attended school and which status completed, if never attended school)

ANNEX D – OVERVIEW TABLES OF CONTEXTUAL DATA COLLECTION INSTRUMENTS – 235
A REVIEW OF INTERNATIONAL LARGE-SCALE ASSESSMENTS IN EDUCATION: ASSESSING COMPONENT SKILLS AND COLLECTING CONTEXTUAL DATA © OECD AND THE WORLD BANK 2015
Survey SES-related measures
Household-based surveys (cont.)
UWEZO • Socio-economic status measures include home possessions and main source of income: number of members who eat from the same pot (their definition of a household), type of house, lighting in house, presence of protected water source, presence of toilet, number of meals per day, possessions: radio, TV, computer, mobile phone, cattle , donkeys, camels, sheep/goats, bicycle, motorbike, cart, number of books in the home.
• Parents’ level of education is captured as well. • For the regional report an SES indicator was created: “…households in the survey were categorised into three socio-economic groups according to durable assets
owned, access to electricity and/or clean water, and mother’s formal education level” (Uwezo, 2014: 16). Children are then categorised into three groups: 1) non-poor; 2) poor; and 3) ultra-poor.

236 – ANNEX D – OVERVIEW TABLES OF CONTEXTUAL DATA COLLECTION INSTRUMENTS
A REVIEW OF INTERNATIONAL LARGE-SCALE ASSESSMENTS IN EDUCATION: ASSESSING COMPONENT SKILLS AND COLLECTING CONTEXTUAL DATA © OECD AND THE WORLD BANK 2015
References
ASER Centre (2013), Guidelines for Development of ASER Tools, ASER Centre, New Delhi.
ASER Centre (2012a), ASER 2012 - Household Survey Sheet, ASER Centre, New Delhi, http://img.asercentre.org/docs/Bottom%20Panel/Key%20Docs/hhsheet.pdf.
ASER Centre (2012b), ASER 2012 - School Observation Sheet, ASER Centre, New Delhi, http://img.asercentre.org/docs/Bottom%20Panel/Key%20Docs/schoolobservationsheet.pdf.
CONFEMEN (2012), Améliorer la Qualité de l’Education au Tchad : Quels sont les Facteurs de Réussite? Évaluation Diagnostique PASEC-CONFEMEN 2e et 5e du Primaire Année Scolaire 2009/2010, CONFEMEN, Dakar.
Crouch, L. (2008), “Snapshot of school management effectiveness aims, initial development, instruments, methods”, presentation, SSME workshop, Washington DC, 18 December 2008, www.eddataglobal.org/management/index.cfm?fuseaction=pubDetailandID=164.
Dolata, S. (2005), “Construction and validation of pupil socioeconomic status index for SACMEQ education systems”, conference paper, International Invitational Educational Policy Research Conference, Paris, 28 September to 2 October 2005.
Hooper, M., I. V. S. Mullis and M.O. Martin (2013), “PIRLS 2016 context questionnaire framework”, in I. V. S. Mullis and M. O. Martin (eds.), PIRLS 2016 Assessment Framework, TIMSS and PIRLS International Study Center, Lynch School of Education, Boston College and International Association for the Evaluation of Educational Achievement, Massachusetts, pp. 33-55.
Howie, S. et al. (2012), PIRLS 2011: South African Children’s Reading Literacy Achievement, Summary Report, Centre for Evaluation and Assessment, University of Pretoria, Pretoria, www.up.ac.za/media/shared/Legacy/sitefiles/file/publications/2013/pirls_2011_report_12_dec.pdf.
Hungi, N. (2011a), “Characteristics of Grade 6 pupils, their homes and learning environments”, SACMEQ Working Paper, SACMEQ, Paris.
Hungi, N. (2011b), Accounting for Variations in the Quality of Primary School Education, SACMEQ, Paris, www.sacmeq.org/?q=publications.
IEA (2013a), PIRLS 2011 User Guide for the International Database: PIRLS Released Passages and Items, TIMSS and PIRLS International Study Center, Boston College, Chestnut Hill, MA, and International Association for the Evaluation of Educational Achievement (IEA), Amsterdam.

ANNEX D – OVERVIEW TABLES OF CONTEXTUAL DATA COLLECTION INSTRUMENTS – 237
A REVIEW OF INTERNATIONAL LARGE-SCALE ASSESSMENTS IN EDUCATION: ASSESSING COMPONENT SKILLS AND COLLECTING CONTEXTUAL DATA © OECD AND THE WORLD BANK 2015
IEA (2013b), PIRLS 2011 User Guide for the International Database: PIRLS Percent Correct Statistics for the Released Items, TIMSS and PIRLS International Study Center and IEA, Chestnut Hill, MA and Amsterdam.
Kirsch, I. and W. Thorn (2013), “Foreword: The Programme for International Assessment of Adult Competencies - an overview”, in Technical report of the Survey of Adult Skills (PIAAC), OECD, Paris.
LLECE (2009), SERCE: Segundo Estudio Regional Comparativo y Explicativo: Los Aprendizajes de los Estudiantes de América Latina y el Caribe; Reporte Técnico, (Second International Comparative Study of Student Learning in Latin American and the Caribbean: Technical Report), Office Santiago and Regional Bureau for Education in Latin America and the Caribbean, LLECE, Santiago.
Martin, M.O. et al. (2012), “Creating and interpreting the TIMSS and PIRLS 2011 context questionnaire scales”, in M.O. Martin and I.V.S. Mullis (eds.), Methods and Procedures in TIMSS and PIRLS 2011, TIMSS and PIRLS International Study Center, Chestnut Hill, MA.
Masters, G.N. and B.D. Wright (1997), “The partial credit model”, in W.J. van der Linden and R. K. Hambleton (eds.), Handbook of Modern Item Response Theory, Springer-Verlag, New York, pp. 101-21.
Messaoud-Galusi, S. et al. (2012), Student Performance in Reading and Mathematics, Pedagogic Practice, and School Management in Doukkala Abda, Morocco, RTI International, North Carolina.
Mullis, I.V.S. et al. (2012), “Assessment framework and instrument development”, in M.O. Martin and I.V.S. Mullis (eds.), Methods and Procedures in TIMSS and PIRLS 2011, TIMSS and PIRLS International Study Center, Chestnut Hill, MA.
Mullis, I. V. S. et al. (2009a), PIRLS 2011 Assessment Framework, TIMSS and PIRLS International Study Center and IEA, Chestnut Hill, MA, and Amsterdam.
Mullis, I.V.S. et al. (2009b), TIMSS 2011 Assessment Frameworks, TIMSS and PIRLS International Study Center and IEA, Chestnut Hill, MA, and Amsterdam.
Mullis, I.V.S. and M.O. Martin (eds.) (2013), PIRLS 2016 Assessment Framework, TIMSS and PIRLS International Study Center and IEA, Chestnut Hill, MA and Amsterdam.
OECD (2014a), PISA 2012 Technical Report, OECD Publishing, Paris, www.oecd.org/pisa/pisaproducts/PISA-2012-technical-report-final.pdf.
OECD (2014b), PISA 2012 Results: What Students Know and Can Do (Volume I, Revised edition, February 2014): Student Performance in Mathematics, Reading and Science, OECD Publishing, Paris, http://dx.doi.org/10.1787/9789264208780-en.
OECD (2013a), “Technical report of the Survey of Adult Skills (PIAAC)”, pre-publication copy, OECD, Paris.
OECD (2013b), PISA 2012 Assessment and Analytical Framework: Mathematics, Reading, Science, Problem Solving and Financial Literacy, OECD Publishing, Paris, http://dx.doi.org/10.1787/9789264190511-en.
OECD (2013c), The Survey of Adult Skills: Reader's companion, OECD Publishing, Paris, http://dx.doi.org/10.1787/9789264204027-en.

238 – ANNEX D – OVERVIEW TABLES OF CONTEXTUAL DATA COLLECTION INSTRUMENTS
A REVIEW OF INTERNATIONAL LARGE-SCALE ASSESSMENTS IN EDUCATION: ASSESSING COMPONENT SKILLS AND COLLECTING CONTEXTUAL DATA © OECD AND THE WORLD BANK 2015
OECD (2008), School questionnaire for PISA 2009 main survey, OECD, Paris.
OECD (n.d.-a), “PISA 2015 draft questionnaire framework”, www.oecd.org /pisa/pisaproducts/PISA-2015-draft-questionnaire-framework.pdf (accessed 5 August 2015).
OECD (n.d.-b), “PIAAC Background Questionnaire: MS version 2.1 d.d. 15-12-2010,” OECD, Paris.
Pierre, G. et al. (2014), STEP Skills Measurement Surveys: Innovative Tools for Assessing Skills, working paper, World Bank Human Development Network, Washington DC.
Ross, K. et al. (2004), “Chapter 2: Methodology for SACMEQ II Study”, IIEP, UNESCO, Paris.
RTI International (2013a), SSME Classroom Inventory, RTI International, North Carolina.
RTI International (2013b), SSME Head Teacher Questionnaire, RTI International, North Carolina.
RTI International (2013c), SSME Item Bank, RTI International, North Carolina.
RTI International (2013d), SSME School Inventory, RTI International, North Carolina.
RTI International (2013e), SSME Student Questionnaire, RTI International, North Carolina.
RTI International (2013f), SSME Teacher Questionnaire, RTI International, North Carolina.
SACMEQ (2007), SACMEQ III: Manual for National Research Co-ordinators: Main Study, SACMEQ, Paris.
UIS (2009a), WEI Survey of Primary Schools: Technical Report, UNESCO Institute for Statistics, Montreal.
UIS (2009b), The Next Generation of Literacy Statistics: Implementing the Literacy Assessment and Monitoring Programme (LAMP), UNESCO Institute for Statistics, Montreal.
UIS (2006), Literacy Assessment and Monitoring Programme (LAMP) Background Questionnaire (BQ), UNESCO Institute for Statistics, Montreal.
UIS (n.d.), Literacy Assessment and Monitoring Programme (LAMP) - Background Questionnaire, UNESCO Institute for Statistics, Montreal.
Uwezo (2014), Are Our Children Learning? Literacy and Numeracy across East Africa 2013, Uwezo and Hivos/Twaweza, Nairobi.
Uwezo Kenya (2013a), “Volunteer workbook - Kenya”, www.uwezo.net/assessment /training (accessed 11 March 2014).
Uwezo Kenya (2013b), Are Our Children Learning? Annual Learning Assessment Report 2012, Uwezo and Women Educational Researchers of Kenya (WERK), Nairobi.
Uwezo Tanzania (2013), Are Our Children Learning? Annual Learning Assessment Report 2012, Uwezo and Tanzania Education Network (TEN/MET), Dar es Salaam.

ANNEX D – OVERVIEW TABLES OF CONTEXTUAL DATA COLLECTION INSTRUMENTS – 239
A REVIEW OF INTERNATIONAL LARGE-SCALE ASSESSMENTS IN EDUCATION: ASSESSING COMPONENT SKILLS AND COLLECTING CONTEXTUAL DATA © OECD AND THE WORLD BANK 2015
Warm T.A. (1989), “Weighted likelihood estimation of ability in item response theory”, Psychometrika, 54, Springer US, New York, pp. 427-450, http://iacat.org/sites/default /files/biblio/wa99-02.pdf.
Wu et al. (2007), ACERConQuest Version 2: Generalised Item Response Modelling Software, Australian Council for Educational Research, Camberwell.
Yu, A., and D. Ebbs (2012), “Translation and translation verification”, in M.O. Martin and I.V.S. Mullis (eds.), Methods and Procedures in TIMSS and PIRLS 2011, TIMSS and PIRLS International Study Center, Chestnut Hill, MA.


OECD PUBLISHING, 2, rue André-Pascal, 75775 PARIS CEDEX 16
(98 2015 04 1 P) ISBN 978-92-64-24834-2 – 2015

2015
PISA
A Review of International Large-Scale Assessments in Education
ASSESSING COMPONENT SKILLS AND COLLECTING CONTEXTUAL DATA
This report reviews the major international and regional large-scale educational assessments, including international surveys, school-based surveys and household-based surveys. The report compares and contrasts the cognitive and contextual data collection instruments and implementation methods used by the different assessments in order to identify practices that are recognised as being effective. It also identifies assessment practices that are particularly likely to be useful for developing countries.
The findings of this report are being used by the OECD to support its efforts to make PISA more relevant to a wider range of countries, and by the World Bank as part of its on-going dialogue with its client countries regarding participation in international large-scale assessments.
ContentsChapter 1. Overview: Lessons from international large-scale assessments in educationChapter 2. Methodology for the review of international large-scale assessments in educationChapter 3. Component skills and cognitive instruments used in educational assessmentsChapter 4. Contextual data collection instruments used in educational assessmentsChapter 5. Implementation procedures and approaches to including out-of-school children in educational assessmentsChapter 6. Analysis, reporting and use of data from international large-scale assessments in education
Consult this publication on line at: http://dx.doi.org/10.1787/9789264248373-en
This work is published on the OECD iLibrary, which gathers all OECD books, periodicals and statistical databases. Visit www.oecd-ilibrary.org and do not hesitate to contact us for more information.
789264 2483429
ISBN 978-92-64-24834-2 98 2015 04 1P
PIS
A
A
Review
of In
ternatio
nal L
arge
-Scale A
ssessmen
ts in Ed
ucatio
n AS
SE
SS
ING
CO
MP
ON
EN
T S
KILLS
AN
D C
OLLE
CT
ING
CO
NT
EX
TU
AL D
ATA
Programme for International Student Assessment
FOR DEVELOPMENT
PISA
A Review of International Large-Scale Assessments in EducationASSESSING COMPONENT SKILLS AND COLLECTING CONTEXTUAL DATA
Copyright © 2022 FDOKUMEN