Large scale brain networks in epilepsy
10
Large scale brain networks in epilepsy Hitten P. Zaveri a* , Steven M. Pincus b , Irina I. Goncharova a , Robert B. Duckrow a,c , Susan S. Spencer a,c a Departments of Neurology, c Neurosurgery, Yale University, New Haven, CT 06520, USA; b Guilford, CT 06437, USA ABSTRACT Two studies of brain networks, performed on interictal intracranial EEGs recorded during the presurgical evaluation of patients with epilepsy, are presented in this report. In the first we examine pairwise relationships between pre-defined brain regions in 12 patients, 6 with medial temporal onset of seizures and 6 with frontal and parietal onset of seizures. We demonstrate that differences, in pairwise relationships between brain regions, allow a distinction of these two groups of patients. In the second study we evaluate short, mid, and long-distance brain connectivity as a function of distance to the seizure onset area in another 2 patients. We demonstrate that the measures of brain connectivity distinguish between brain areas which are close to and far from the seizure onset area. The results of the two studies may help both define large scale brain networks involved in the generation of seizures, and localize the area of seizure onset. Keywords: Localization related epilepsy, seizure onset area, brain networks, brain connectivity, coherence, Teager energy. 1. INTRODUCTION The pre-surgical evaluation of patients with epilepsy, in whom seizures cannot be controlled by medications, involves a series of increasingly more invasive investigations, and may require, as a final step, continuous monitoring of brain electrical activity directly from the cortex and subcortical structures (intracranial EEG, icEEG) over days and weeks to record seizures and locate their origin. The icEEG has helped establish the concept of a seizure onset area where seizures in localization related epilepsy are first expressed, and from where they may spread. This definition has been central to research on seizure generation and the control of epilepsy. Investigations of seizure generation have often focused on brain excitation and inhibition, and argued for a lack of balance between the two at the seizure onset area, such that out- of-control excitation sets up a cascade of events which culminates in seizure. The success of surgical control of epilepsy is predicated on detecting this area of the brain and resecting or disconnecting it. The success of new approaches such as stimulation of the brain with a brain implantable device or local delivery of drugs is predicated as well on an accurate definition of the seizure onset area. A considerable amount of evidence, from animal models of epilepsy as well as clinical, icEEG and imaging studies in humans, suggests the involvement of cortical and subcortical networks in the generation of partial and generalized onset seizures [1]. The underlying thesis of these studies is that seizures are an expression of network rather than focal brain abnormality. The specific brain networks which may be involved in the generation of seizures remain poorly defined and poorly understood. Intracranial EEG studies of brain networks can be conducted with pairwise measures of relationship (bivariate measures). Pairwise measures of relationship have been used to study seizures and the peri-seizure interval, typically in studies of seizure spread, seizure onset, and seizure prediction, and on interictal or background icEEG (ongoing activity between seizures). In a recent study of the background icEEG we demonstrated increased long-range theta coherence, between amygdala and the frontal lobe, accompanies the process of kindling in a rat model of epilepsy [2]. Further, Towle and coworkers, used the coherence of the background icEEG to define the functional borders of brain regions [3]. Schevon and coworkers sought to demonstrate that local hypersynchrony is a marker of epileptogenic cortex * [email protected] Advanced Signal Processing Algorithms, Architectures, and Implementations XVIII, edited by Franklin T. Luk, Proc. of SPIE Vol. 7074, 70740T, (2008) · 0277-786X/08/$18 · doi: 10.1117/12.801365 Proc. of SPIE Vol. 7074 70740T-1 2008 SPIE Digital Library -- Subscriber Archive Copy
-
Upload
independent -
Category
Documents
-
view
3 -
download
0
Transcript of Large scale brain networks in epilepsy

Large scale brain networks in epilepsy
Hitten P. Zaveria*, Steven M. Pincusb, Irina I. Goncharovaa, Robert B. Duckrowa,c, Susan S. Spencera,c
aDepartments of Neurology, cNeurosurgery, Yale University, New Haven, CT 06520, USA;
bGuilford, CT 06437, USA
ABSTRACT
Two studies of brain networks, performed on interictal intracranial EEGs recorded during the presurgical evaluation of patients with epilepsy, are presented in this report. In the first we examine pairwise relationships between pre-defined brain regions in 12 patients, 6 with medial temporal onset of seizures and 6 with frontal and parietal onset of seizures. We demonstrate that differences, in pairwise relationships between brain regions, allow a distinction of these two groups of patients. In the second study we evaluate short, mid, and long-distance brain connectivity as a function of distance to the seizure onset area in another 2 patients. We demonstrate that the measures of brain connectivity distinguish between brain areas which are close to and far from the seizure onset area. The results of the two studies may help both define large scale brain networks involved in the generation of seizures, and localize the area of seizure onset.
Keywords: Localization related epilepsy, seizure onset area, brain networks, brain connectivity, coherence, Teager energy.
1. INTRODUCTION
The pre-surgical evaluation of patients with epilepsy, in whom seizures cannot be controlled by medications, involves a series of increasingly more invasive investigations, and may require, as a final step, continuous monitoring of brain electrical activity directly from the cortex and subcortical structures (intracranial EEG, icEEG) over days and weeks to record seizures and locate their origin. The icEEG has helped establish the concept of a seizure onset area where seizures in localization related epilepsy are first expressed, and from where they may spread. This definition has been central to research on seizure generation and the control of epilepsy. Investigations of seizure generation have often focused on brain excitation and inhibition, and argued for a lack of balance between the two at the seizure onset area, such that out-of-control excitation sets up a cascade of events which culminates in seizure. The success of surgical control of epilepsy is predicated on detecting this area of the brain and resecting or disconnecting it. The success of new approaches such as stimulation of the brain with a brain implantable device or local delivery of drugs is predicated as well on an accurate definition of the seizure onset area.
A considerable amount of evidence, from animal models of epilepsy as well as clinical, icEEG and imaging studies in humans, suggests the involvement of cortical and subcortical networks in the generation of partial and generalized onset seizures [1]. The underlying thesis of these studies is that seizures are an expression of network rather than focal brain abnormality. The specific brain networks which may be involved in the generation of seizures remain poorly defined and poorly understood. Intracranial EEG studies of brain networks can be conducted with pairwise measures of relationship (bivariate measures). Pairwise measures of relationship have been used to study seizures and the peri-seizure interval, typically in studies of seizure spread, seizure onset, and seizure prediction, and on interictal or background icEEG (ongoing activity between seizures). In a recent study of the background icEEG we demonstrated increased long-range theta coherence, between amygdala and the frontal lobe, accompanies the process of kindling in a rat model of epilepsy [2]. Further, Towle and coworkers, used the coherence of the background icEEG to define the functional borders of brain regions [3]. Schevon and coworkers sought to demonstrate that local hypersynchrony is a marker of epileptogenic cortex
Advanced Signal Processing Algorithms, Architectures, and Implementations XVIII, edited by Franklin T. Luk, Proc. of SPIE Vol. 7074, 70740T, (2008) · 0277-786X/08/$18 · doi: 10.1117/12.801365
Proc. of SPIE Vol. 7074 70740T-12008 SPIE Digital Library -- Subscriber Archive Copy

[4]. The analysis was performed with the mean phase coherence method [5] for adjacent contacts of a subdural electrode grid. In other recent studies Staniek and Lehnertz determined the hemisphere of seizure onset with a measure of symbolic transfer entropy [6] and Kramer and co-workers employed network measures to determine changes in connectivity at seizure onset [7].
Two studies of brain networks are reported here. Both were conducted on the background icEEG recorded during the pre-surgical evaluation of patients for epilepsy surgery. In the first we examine pairwise relationships between pre-defined brain regions, in patients from two groups: (1) with medial temporal onset of seizures, and (2) with frontal and frontal-parietal onset of seizures; to test if the relationships between brain regions are different in the two groups of patients. In the second study we evaluate short, mid, and long-distance brain connectivity as a function of distance to the seizure onset area. We seek to evaluate if these measures change as a function of distance from the seizure onset area.
2. METHODS
2.1. Intracranial electrode placement and localization Multicontact electrodes used in subdural locations were implanted under visual guidance. Chronically placed depth electrodes were stereotactically implanted using MRI guidance and a computerized planning system which allows interactive previewing of electrode trajectories. To determine the location of all intracranial electrode contacts, individual contacts were marked on postoperative CT scans. CT scans were registered to post-operative MRI scans using a 6-parameter rigid transformation, and post-operative MRI scans were then registered with pre-operative scans using a nonlinear grid-based transformation to account for the distortion of the brain that occurs as a result of the craniotomy [8]. Each electrode contact was assigned, by expert evaluation, to one of 12 regions of interest (ROIs) defined on a standard brain. The ROIs (ipsilateral and contralateral to the side of seizure onset) are: frontal, medial temporal, thalamus, temporal neocortical, parietal and occipital. For group analysis and visualization of results, the pre-operative MRI was co-registered with the MRI of a standard brain and electrode contacts were located on the standard brain and in the ROIs defined on the standard brain. Intercontact distance was measured as Euclidean distance using the 3D coordinates of the electrode contacts.
2.2. Intracranial EEG acquisition Patients were monitored continuously using a commercial EEG acquisition and storage system (Bio-logic Systems Corp., Mundelein, Illinois). Intracranial EEGs were recorded with respect to a peg electrode placed within the skull. An inverted strip placed in subgaleal space is used as the ground electrode. Additional channels were dedicated to measuring reference signals from the left and right mastoids for use in post-processing. Up to 128 channels of EEG were recorded (20 bit A/D conversion, 256 Hz sampling frequency) and stored along with a time synchronized video signal of the patient.
2.3. Study 1 We evaluated pairwise relationship over the duration of intracranial EEG monitoring in 6 MTLE and 6 frontal / frontal-parietal (F-P) onset patients. The MTLE patients all had left sided onset of seizures. The F-P patients had right (2 patients), left (3 patients) and bilateral frontal (1 patient) onset of seizures. Cortical relationship was evaluated by correlation of Teager energy. For each patient, relationship measures were evaluated for all possible pairs of electrode contacts, for every 5 min of background activity, and the estimates were averaged over the duration of icEEG monitoring. The number of pairwise evaluations ranged from 5,000 to 7,000 for each patient, and the duration ranged from 7 to 14 days.
We employ a weighted measure of energy, Teager energy, to measure the energy of icEEGs. The conventional measure of signal energy weighs contributions from all frequencies of a signal equally. While this is appropriate for electrical circuits, it may not be accurate for many physical systems as greater energy may be expended by these systems to generate signals at higher frequencies than lower frequencies. That is, these systems expend greater energy when operating at higher frequencies than when working at lower frequencies. Starting with this observation Kaiser introduced an alternate measure of signal energy which weights contributions of different frequencies non-uniformly, emphasizing higher frequencies over lower frequencies by a square law weighting [9]. In previous reports we have demonstrated that
Proc. of SPIE Vol. 7074 70740T-2

energy evaluations of icEEGs obtained by Teager's algorithm, in contrast to those obtained by the conventional measure, consistently credit seizures with greater energy than background signals [10, 11]. While conventional energy estimates do not display a hypothesized relationship between the energy of seizures and background signals, estimates obtained by Teager's algorithm do. Teager energy has been found useful to detect seizures and interictal activity and categorize seizures [10-12]. Teager's algorithm is attractive because it is simple, physically intuitive, computationally efficient, and amenable to time-varying signals. We calculate the correlation of the weighted signal energy measurements to estimate the relationship of excitation in different brain regions.
2.4. Study 2 The connectivity analysis was performed for two patients with neocortical seizure onset (patients A and B). The entire icEEG monitoring period was recorded from these 2 patients. Subsequently we identified a 1 hr epoch from day 2 or 3 of the monitoring, when the patients were awake and resting quietly. The time period was identified after an examination of medication records and the video and icEEG. Day 2 or 3 was selected because it was considered to be sufficiently removed from surgery to place the electrodes and because anti-epileptic drug (AED) taper had not been started and the patients had not experienced seizures. The 1 hr icEEG records were examined for artifacts at a 1-sec time-resolution, and 1-sec segments with artifacts were identified, marked and deleted by the use of custom written software. There were no subclinical seizures during the selected epochs. Coherence was evaluated for all pairs of electrode contacts for the delta, theta, alpha, beta and gamma frequency bands [13]. Between 5000-7000 pairwise evaluations were performed, for each frequency band, for each patient’s data. The coherence estimates were subsequently employed to estimate the connectivity for each electrode contact by estimating the average coherence with all other electrode contacts. Only significantly non-zero coherence values were considered [13].
Coherence, the normalized cross-power spectrum of two stationary random processes is a complex valued measure that can be employed to measure the linear relationship between two input signals. Magnitude squared coherence (MSC) may be interpreted as a frequency indexed correlation coefficient, and phase-coherence is the phase difference, a measure of the time-difference, between the signals. MSC is a bounded measure (0 < MSC < 1) and MSC = 1 if and only if there is a perfect linear relationship between the two random processes. Coherence is a well developed measure and procedures exist to both obtain estimates and evaluate their statistical significance. Coherence has seen widespread application to scalp and intracranial EEGs for determining relationship. Coherence analysis of human icEEGs has been performed to study both propagation delay during seizures and the spatial and temporal structure of icEEGs. Two methodological shortcomings can be identified in previous coherence studies of human icEEGs. First, in a majority of these studies coherence estimates were formed from a very small number of independent sample spectra, nd; in several instances nd = 2 to 3. Second, the significance of MSC estimates was either not evaluated, or poorly evaluated. The performance of the commonly used WOSA coherence estimator may be extremely poor for small values of nd, and the coupling of poor estimation and statistical testing can result in inaccuracy in the measurement of MSC. In our previous work we have described the statistical properties of the coherence estimator [13], defined upper bounds of the effect of a scalp reference electrode on coherence measurements of icEEGs [14], and demonstrated the utility of this measure for measuring network change [2].
3. RESULTS
3.1. Network definition from background intracranial EEGFig 1 shows examples of relationship measures, obtained over the duration of icEEG monitoring, observed in MTLE and frontal onset patients. The panels of this figure show the following. Fig 1(a) displays, in a single patient with right MTLE, all pairs of electrode contacts with delta MSC > 0.6. Electrode contact pairs with high delta coherence are located in the ipsilateral temporal lobe, ipsilateral frontal lobe, and in the contralateral temporal lobe, and include interhemispheric temporal connections. In Fig 1(b)-(d) the correlation of Teager energy measures is shown. In each of these cases, the highest 20 pairwise measures in each patient were displayed overlapped with the highest measures observed in the other patients. In Fig 1(b) two right MTLE patients are shown, Fig 1(c) three frontal patients, and Fig 1(d) three left MTLE patients. The evaluations presented in Fig 1 suggest that specific anatomic locations are synchronized over the duration of icEEG monitoring and the location of the largest pairwise measures, in MTLE and frontal patients, show a degree of consistency between patients.
Proc. of SPIE Vol. 7074 70740T-3
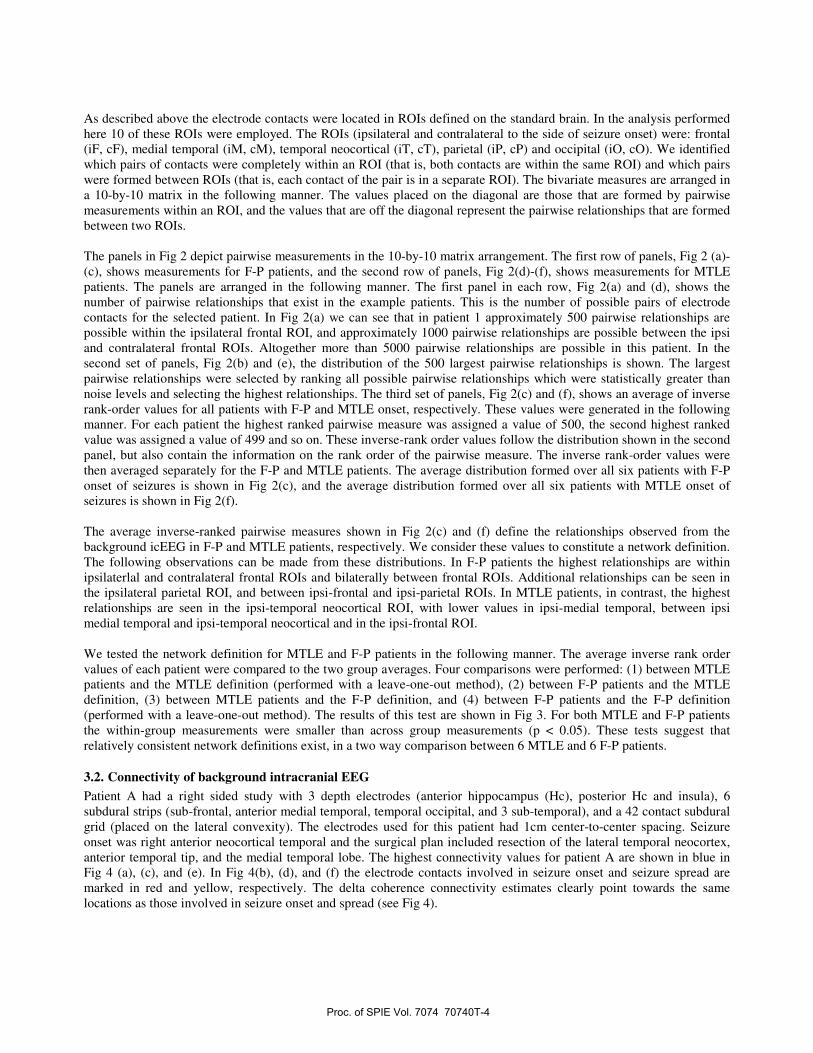
As described above the electrode contacts were located in ROIs defined on the standard brain. In the analysis performed here 10 of these ROIs were employed. The ROIs (ipsilateral and contralateral to the side of seizure onset) were: frontal (iF, cF), medial temporal (iM, cM), temporal neocortical (iT, cT), parietal (iP, cP) and occipital (iO, cO). We identified which pairs of contacts were completely within an ROI (that is, both contacts are within the same ROI) and which pairs were formed between ROIs (that is, each contact of the pair is in a separate ROI). The bivariate measures are arranged in a 10-by-10 matrix in the following manner. The values placed on the diagonal are those that are formed by pairwise measurements within an ROI, and the values that are off the diagonal represent the pairwise relationships that are formed between two ROIs.
The panels in Fig 2 depict pairwise measurements in the 10-by-10 matrix arrangement. The first row of panels, Fig 2 (a)-(c), shows measurements for F-P patients, and the second row of panels, Fig 2(d)-(f), shows measurements for MTLE patients. The panels are arranged in the following manner. The first panel in each row, Fig 2(a) and (d), shows the number of pairwise relationships that exist in the example patients. This is the number of possible pairs of electrode contacts for the selected patient. In Fig 2(a) we can see that in patient 1 approximately 500 pairwise relationships are possible within the ipsilateral frontal ROI, and approximately 1000 pairwise relationships are possible between the ipsi and contralateral frontal ROIs. Altogether more than 5000 pairwise relationships are possible in this patient. In the second set of panels, Fig 2(b) and (e), the distribution of the 500 largest pairwise relationships is shown. The largest pairwise relationships were selected by ranking all possible pairwise relationships which were statistically greater than noise levels and selecting the highest relationships. The third set of panels, Fig 2(c) and (f), shows an average of inverse rank-order values for all patients with F-P and MTLE onset, respectively. These values were generated in the following manner. For each patient the highest ranked pairwise measure was assigned a value of 500, the second highest ranked value was assigned a value of 499 and so on. These inverse-rank order values follow the distribution shown in the second panel, but also contain the information on the rank order of the pairwise measure. The inverse rank-order values were then averaged separately for the F-P and MTLE patients. The average distribution formed over all six patients with F-P onset of seizures is shown in Fig 2(c), and the average distribution formed over all six patients with MTLE onset of seizures is shown in Fig 2(f).
The average inverse-ranked pairwise measures shown in Fig 2(c) and (f) define the relationships observed from the background icEEG in F-P and MTLE patients, respectively. We consider these values to constitute a network definition. The following observations can be made from these distributions. In F-P patients the highest relationships are within ipsilaterlal and contralateral frontal ROIs and bilaterally between frontal ROIs. Additional relationships can be seen in the ipsilateral parietal ROI, and between ipsi-frontal and ipsi-parietal ROIs. In MTLE patients, in contrast, the highest relationships are seen in the ipsi-temporal neocortical ROI, with lower values in ipsi-medial temporal, between ipsi medial temporal and ipsi-temporal neocortical and in the ipsi-frontal ROI.
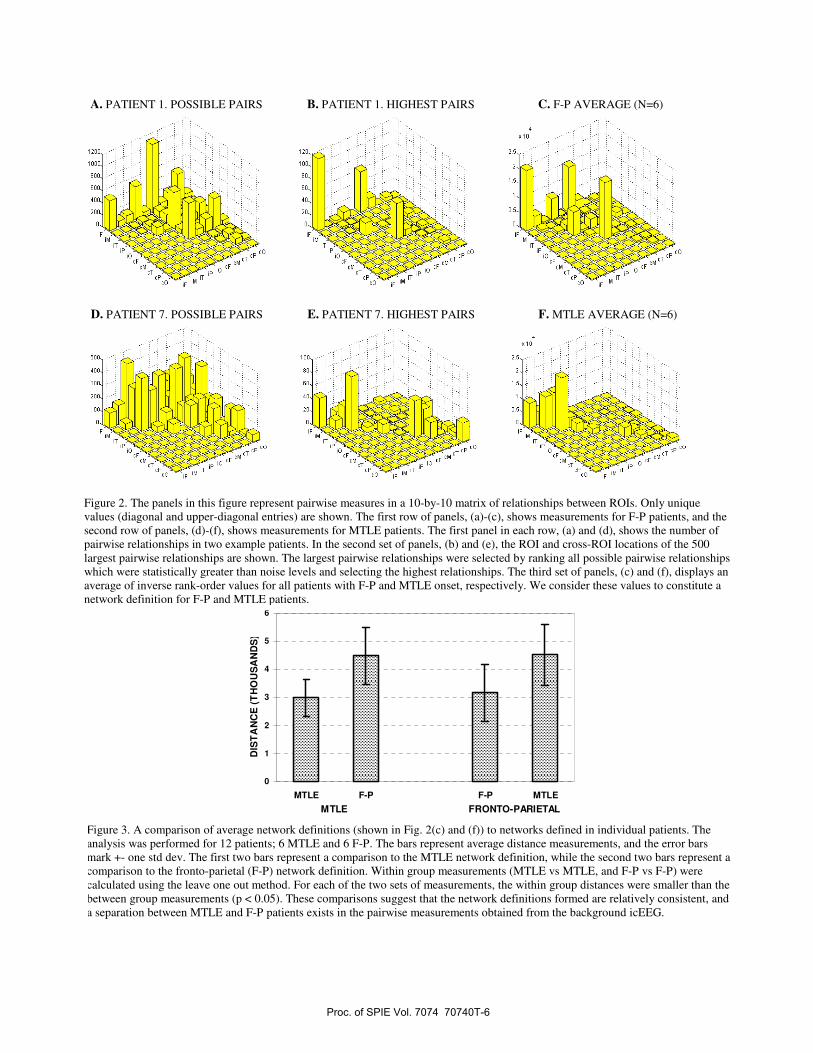
We tested the network definition for MTLE and F-P patients in the following manner. The average inverse rank order values of each patient were compared to the two group averages. Four comparisons were performed: (1) between MTLE patients and the MTLE definition (performed with a leave-one-out method), (2) between F-P patients and the MTLE definition, (3) between MTLE patients and the F-P definition, and (4) between F-P patients and the F-P definition (performed with a leave-one-out method). The results of this test are shown in Fig 3. For both MTLE and F-P patients the within-group measurements were smaller than across group measurements (p < 0.05). These tests suggest that relatively consistent network definitions exist, in a two way comparison between 6 MTLE and 6 F-P patients.
3.2. Connectivity of background intracranial EEG Patient A had a right sided study with 3 depth electrodes (anterior hippocampus (Hc), posterior Hc and insula), 6 subdural strips (sub-frontal, anterior medial temporal, temporal occipital, and 3 sub-temporal), and a 42 contact subdural grid (placed on the lateral convexity). The electrodes used for this patient had 1cm center-to-center spacing. Seizure onset was right anterior neocortical temporal and the surgical plan included resection of the lateral temporal neocortex, anterior temporal tip, and the medial temporal lobe. The highest connectivity values for patient A are shown in blue in Fig 4 (a), (c), and (e). In Fig 4(b), (d), and (f) the electrode contacts involved in seizure onset and seizure spread are marked in red and yellow, respectively. The delta coherence connectivity estimates clearly point towards the same locations as those involved in seizure onset and spread (see Fig 4).
Proc. of SPIE Vol. 7074 70740T-4

2C
4C
Sc
8C
IcC
12C
14C
16C
20 40 60 80 100 120 140 160 180 200
2C
4C
6C
8C
IOC
12C
14C
16C
20 40 60 80 100 120 140 160 180 200
2C
4C
6C
8C
IOC
12C
14C
20 40 60 80 100 120 140 160 180 200
4C
6C
8C
IOC
12C
14C
20 40 60 80 100 120 140 160 180 200
Patient B had a 10x12 subdural electrode grid placed on the left lateral convexity. Center-to-center spacing of the electrode contacts was 0.5 cm. Seizure onset was localized to the left motor strip. Due to the overlap of seizure onset with the motor strip the patient was treated with a Neuropace (Mountain View, CA) stimulation device. The patient has demonstrated improvement with the Neuropace device but is not seizure free. The connectivity measures for this patient are shown in Fig 5. In the panels of Fig 5 the electrode contacts with the highest electrode connectivity values are shown in blue for the (a) delta, (b) theta, (c) alpha, (d) beta, and (e) gamma frequency bands. In Fig 5(f) the 9 electrode contacts involved in seizure onset and 3 electrode contacts involved in seizure spread are marked in red and yellow, respectively. The electrode contacts with the highest connectivity values, for all frequency bands, are located in the anterior and central parts of the grid. The electrode contacts with the highest connectivity values are close to and overlap with some of the electrode contacts involved in seizure onset, but are not identical to the seizure onset contacts.
Figure 1. Graphical depiction of the largest pairwise relationships observed over the duration of intracranial monitoring. These panels were created by co-registering the MRI of each patient’s brain to the MRI of a standard brain, locating electrodes on the standard brain, and projecting on to a 2D surface in the orientation indicated in (a). All recorded electrode contacts are shown as circles. Electrode contacts with the highest pairwise relationship are shown as filled circles with connecting lines. (a) All pairwise delta coherence measures greater than 0.6 in a single patient with right MTLE. (b)-(d) The largest 20 Teager energy correlation measures overlapped in (b) from each of two right MTLE patients, (c) from each of three frontal onset patients, and (d) from each of three left MTLE patients. The largest pairwise measures, in MTLE and frontal patients, show a degree of consistency in their localization between patients.
C
Proc. of SPIE Vol. 7074 70740T-5
0
1
2
3
4
5
6
MTLE F-P F-P MTLE
MTLE FRONTO-PARIETAL
DIS
TA
NC
E (
TH
OU
SA
ND
S)
Figure 3. A comparison of average network definitions (shown in Fig. 2(c) and (f)) to networks defined in individual patients. The analysis was performed for 12 patients; 6 MTLE and 6 F-P. The bars represent average distance measurements, and the error bars mark +- one std dev. The first two bars represent a comparison to the MTLE network definition, while the second two bars represent a comparison to the fronto-parietal (F-P) network definition. Within group measurements (MTLE vs MTLE, and F-P vs F-P) were calculated using the leave one out method. For each of the two sets of measurements, the within group distances were smaller than the between group measurements (p < 0.05). These comparisons suggest that the network definitions formed are relatively consistent, and a separation between MTLE and F-P patients exists in the pairwise measurements obtained from the background icEEG.
A. PATIENT 1. POSSIBLE PAIRS B. PATIENT 1. HIGHEST PAIRS C. F-P AVERAGE (N=6)
D. PATIENT 7. POSSIBLE PAIRS E. PATIENT 7. HIGHEST PAIRS F. MTLE AVERAGE (N=6)
Figure 2. The panels in this figure represent pairwise measures in a 10-by-10 matrix of relationships between ROIs. Only unique values (diagonal and upper-diagonal entries) are shown. The first row of panels, (a)-(c), shows measurements for F-P patients, and the second row of panels, (d)-(f), shows measurements for MTLE patients. The first panel in each row, (a) and (d), shows the number of pairwise relationships in two example patients. In the second set of panels, (b) and (e), the ROI and cross-ROI locations of the 500 largest pairwise relationships are shown. The largest pairwise relationships were selected by ranking all possible pairwise relationships which were statistically greater than noise levels and selecting the highest relationships. The third set of panels, (c) and (f), displays an average of inverse rank-order values for all patients with F-P and MTLE onset, respectively. We consider these values to constitute a network definition for F-P and MTLE patients.
Proc. of SPIE Vol. 7074 70740T-6

Figure 4. Electrode contacts on the lateral (a, b) and inferior (c, d) aspects, as well as depth electrodes (e, f) sampling the insula and anterior hippocampus, of the right temporal lobe in patient A are shown in different panels of this figure. The panels on the left (a, c, e) show the electrode contacts with the highest connectivity values (blue). The panels on the right show the seizure onset (red) and spread (yellow) electrode contacts. In this patient the seizure onset was right anterior temporal. The electrode contacts involved in seizure onset were located on the C strip, the depth electrodes (I, H) sampling the hippocampus and insula as well as parts of the grid electrode (G). The electrode contacts with the highest delta coherence connectivity values were on the C, B, D and A electrode strips, parts of the grid, and the depth electrodes sampling insula and anterior and posterior (not shown) hippocampus. Two of the seizure onset and 3 of the seizure spread contacts were represented in the 7 electrode contacts with the highest delta connectivity. The electrode contacts with the highest interictal connectivity are clearly in the same area as the seizure onset and spread contacts. Large parts of the grid (posterior, superior) and electrode contacts on the posterior subtemporal (E) and temporal-occipital (F) strips do not demonstrate high connectivity values.
Proc. of SPIE Vol. 7074 70740T-7
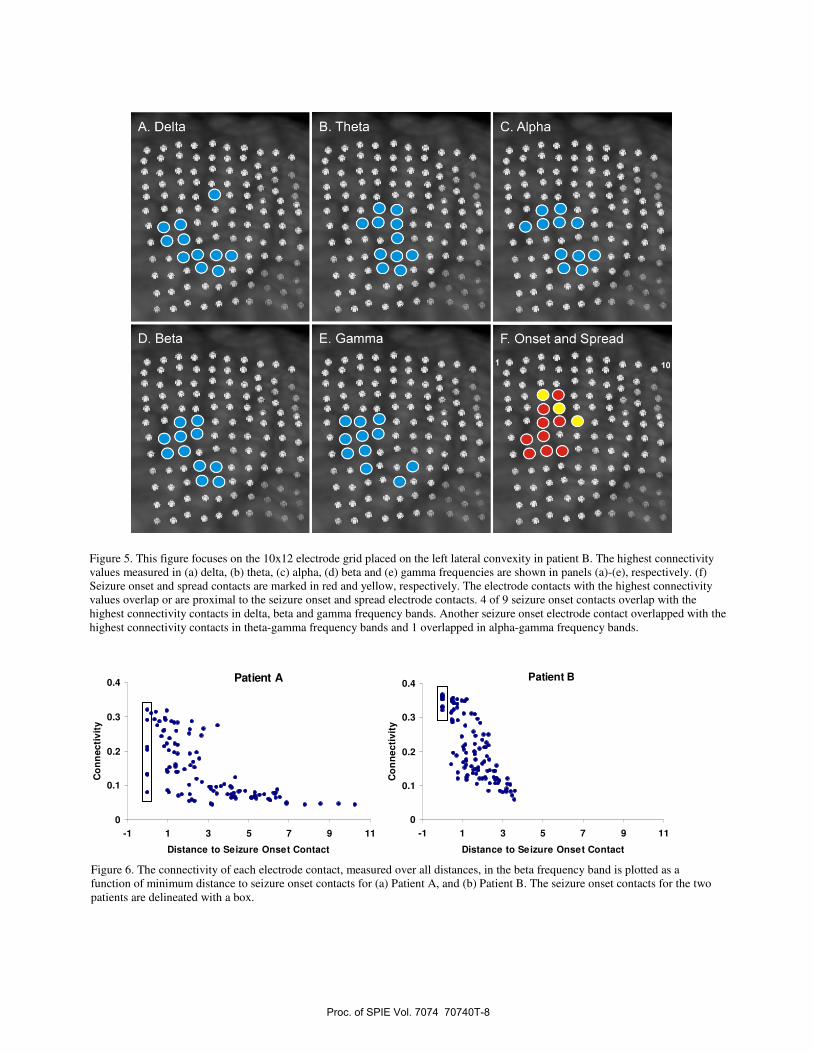
Figure 5. This figure focuses on the 10x12 electrode grid placed on the left lateral convexity in patient B. The highest connectivity values measured in (a) delta, (b) theta, (c) alpha, (d) beta and (e) gamma frequencies are shown in panels (a)-(e), respectively. (f) Seizure onset and spread contacts are marked in red and yellow, respectively. The electrode contacts with the highest connectivity values overlap or are proximal to the seizure onset and spread electrode contacts. 4 of 9 seizure onset contacts overlap with the highest connectivity contacts in delta, beta and gamma frequency bands. Another seizure onset electrode contact overlapped with the highest connectivity contacts in theta-gamma frequency bands and 1 overlapped in alpha-gamma frequency bands.
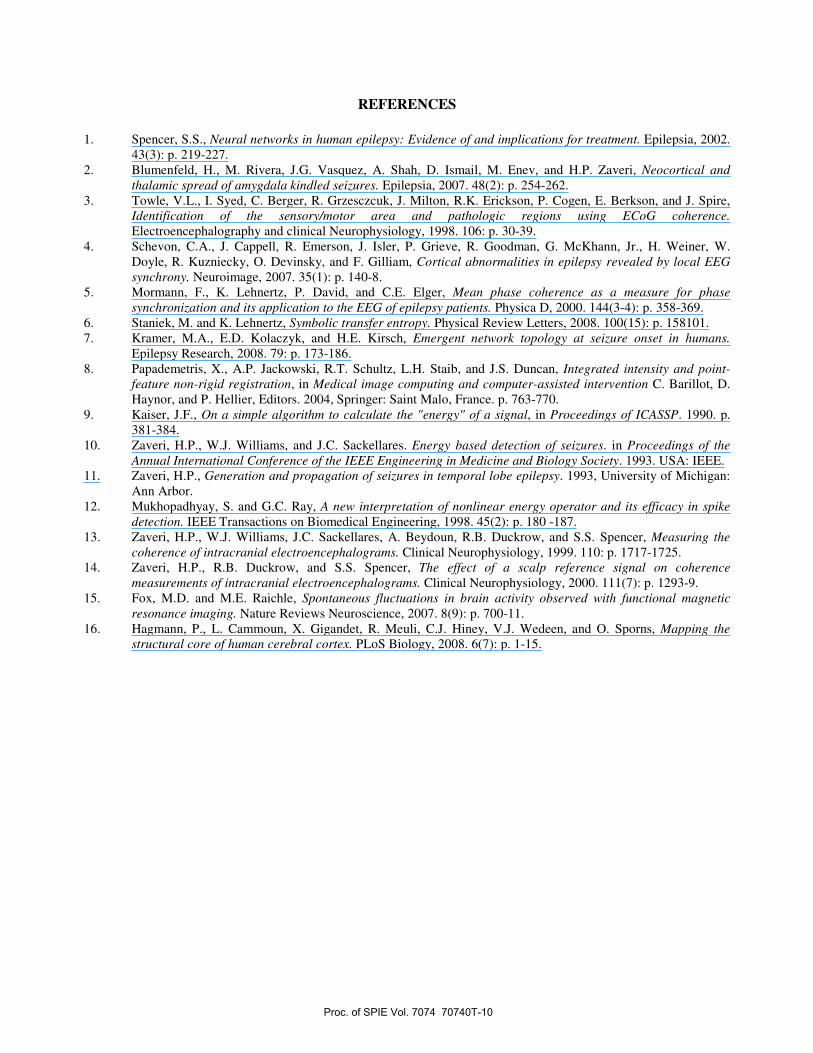
Figure 6. The connectivity of each electrode contact, measured over all distances, in the beta frequency band is plotted as a function of minimum distance to seizure onset contacts for (a) Patient A, and (b) Patient B. The seizure onset contacts for the two patients are delineated with a box.
Patient A
0
0.1
0.2
0.3
0.4
-1 1 3 5 7 9 11
Distance to Seizure Onset Contact
Co
nn
ecti
vity
Patient B
0
0.1
0.2
0.3
0.4
-1 1 3 5 7 9 11
Distance to Seizure Onset Contact
Co
nn
ecti
vity
Proc. of SPIE Vol. 7074 70740T-8

Connectivity was evaluated for each electrode contact, for the five frequency bands, over short distance (less than 3 cm), mid-distance (between 3 to 8 cm), long-distance (more than 8 cm) and all distances. Subsequently, the distance of each electrode contact to the nearest seizure onset contact was determined. Connectivity estimates were arrayed with respect to the distance to the nearest seizure onset contact. Short and mid-distance connectivity values in most frequency bands demonstrated an increase with decreasing distance to seizure onset contacts. The beta band connectivity for patients A and B, evaluated over all distances, is displayed in Fig 6 as a function of distance to seizure onset contacts. The beta band connectivity values of the different electrode contacts display a strong relationship to distance to the seizure onset area. The lowest connectivity measures are observed most distant from the seizure onset area, and the highest connectivity measures are observed at contacts closest to the seizure onset area. The seizure onset contacts, located at distance 0, are delineated by a box. While some of the seizure onset contacts have amongst the highest values observed these contacts do not uniformly demonstrate the highest connectivity values.
4. DISCUSSION
We have proposed network pathophysiology in epilepsy is expressed in background icEEG and have described methods to measure it. The robust bivariate values observed suggests that long-duration relationships between brain regions can be measured from the background icEEG, and that the location of high pairwise values may be common in patients with seizure onset localization in the same area. The network definitions proposed are preliminary given the low number of patients studied. A more proper definition should be possible when more patients are studied. We note that in MTLE patients the ipsi-temporal neocortical ROI and not the ipsi-medial temporal ROI has the highest ranked values. This stems from the relative difference in the size of the medial temporal and temporal neocortical ROIs, and the relatively lower number of contacts in the medial temporal ROI. This can be corrected by re-designing the ROIs. Additionally the analysis can be executed to stop the selection of highest pairwise measures when all of the measures in a ROI, such as the medial temporal ROI, have been exhausted. This or other procedures can be followed to balance the effect of unequal ROIs.
The second study was performed on 1 hr of icEEG recorded prior to the expression of any seizures. The results of this study demonstrate that the background icEEG contains considerable pathphysiological expression. The contacts with highest connectivity values were observed to overlap with, or were proximal, to the seizure onset and spread contacts. The seizure onset contacts do not uniformly demonstrate the highest connectivity values observed, but some seizure onset contacts have amongst the highest values observed. The temporal stability of these observations remain to be evaluated. It is possible that different seizure contacts will show high values at different times. Importantly, connectivity displays a graded change with respect to distance to the seizure onset area. This is possibly the first demonstration of a graded change of a measure with respect to distance from the seizure onset area. The results of this study suggest that areas outside the seizure onset area contribute to its dysfunction. The measure of connectivity shows promise for the determination of the seizure onset area, and may represent a quantitative measure of cortical dysfunction which could be used as a target in efforts to control ictogenesis and epileptogenesis.
There has been considerable interest in the study of resting state networks using fMRI measurements [15, 16]. This work has been performed, primarily, in normal subjects. Large areas of the brain have been demonstrated to be positively or negatively correlated with each other. It remains to be demonstrated if resting state networks are present in patients with epilepsy. If they are present, it would be of interest to know how they may be influenced by the considerably strong network interactions that appear to be formed with the seizure onset area.
5. CONCLUSIONS
We have presented results from two studies that demonstrate the value of bivariate measures of the background icEEG. The results of the first study suggest that pairwise measurements may help distinguish classes of patients, and may help define large scale brain networks in epilepsy. The demonstration of a graded change with respect to distance from the seizure onset area, in the second study, holds promise for better definition of the seizure onset area and a delineation of the areas that contribute to its dysfunction.
Proc. of SPIE Vol. 7074 70740T-9
REFERENCES
1. Spencer, S.S., Neural networks in human epilepsy: Evidence of and implications for treatment. Epilepsia, 2002. 43(3): p. 219-227.
2. Blumenfeld, H., M. Rivera, J.G. Vasquez, A. Shah, D. Ismail, M. Enev, and H.P. Zaveri, Neocortical and thalamic spread of amygdala kindled seizures. Epilepsia, 2007. 48(2): p. 254-262.
3. Towle, V.L., I. Syed, C. Berger, R. Grzesczcuk, J. Milton, R.K. Erickson, P. Cogen, E. Berkson, and J. Spire, Identification of the sensory/motor area and pathologic regions using ECoG coherence.Electroencephalography and clinical Neurophysiology, 1998. 106: p. 30-39.
4. Schevon, C.A., J. Cappell, R. Emerson, J. Isler, P. Grieve, R. Goodman, G. McKhann, Jr., H. Weiner, W. Doyle, R. Kuzniecky, O. Devinsky, and F. Gilliam, Cortical abnormalities in epilepsy revealed by local EEG synchrony. Neuroimage, 2007. 35(1): p. 140-8.
5. Mormann, F., K. Lehnertz, P. David, and C.E. Elger, Mean phase coherence as a measure for phase synchronization and its application to the EEG of epilepsy patients. Physica D, 2000. 144(3-4): p. 358-369.
6. Staniek, M. and K. Lehnertz, Symbolic transfer entropy. Physical Review Letters, 2008. 100(15): p. 158101.7. Kramer, M.A., E.D. Kolaczyk, and H.E. Kirsch, Emergent network topology at seizure onset in humans.
Epilepsy Research, 2008. 79: p. 173-186. 8. Papademetris, X., A.P. Jackowski, R.T. Schultz, L.H. Staib, and J.S. Duncan, Integrated intensity and point-
feature non-rigid registration, in Medical image computing and computer-assisted intervention C. Barillot, D. Haynor, and P. Hellier, Editors. 2004, Springer: Saint Malo, France. p. 763-770.
9. Kaiser, J.F., On a simple algorithm to calculate the "energy" of a signal, in Proceedings of ICASSP. 1990. p. 381-384.
10. Zaveri, H.P., W.J. Williams, and J.C. Sackellares. Energy based detection of seizures. in Proceedings of the Annual International Conference of the IEEE Engineering in Medicine and Biology Society. 1993. USA: IEEE.
11. Zaveri, H.P., Generation and propagation of seizures in temporal lobe epilepsy. 1993, University of Michigan: Ann Arbor.
12. Mukhopadhyay, S. and G.C. Ray, A new interpretation of nonlinear energy operator and its efficacy in spike detection. IEEE Transactions on Biomedical Engineering, 1998. 45(2): p. 180 -187.
13. Zaveri, H.P., W.J. Williams, J.C. Sackellares, A. Beydoun, R.B. Duckrow, and S.S. Spencer, Measuring the coherence of intracranial electroencephalograms. Clinical Neurophysiology, 1999. 110: p. 1717-1725.
14. Zaveri, H.P., R.B. Duckrow, and S.S. Spencer, The effect of a scalp reference signal on coherence measurements of intracranial electroencephalograms. Clinical Neurophysiology, 2000. 111(7): p. 1293-9.
15. Fox, M.D. and M.E. Raichle, Spontaneous fluctuations in brain activity observed with functional magnetic resonance imaging. Nature Reviews Neuroscience, 2007. 8(9): p. 700-11.
16. Hagmann, P., L. Cammoun, X. Gigandet, R. Meuli, C.J. Hiney, V.J. Wedeen, and O. Sporns, Mapping the structural core of human cerebral cortex. PLoS Biology, 2008. 6(7): p. 1-15.
Proc. of SPIE Vol. 7074 70740T-10