Novel Phenotypic and Large-Scale Genomic Approaches
154
Understanding the Genetics of Substance Use: Novel Phenotypic and Large-Scale Genomic Approaches by David Brazel B.A., Colby College, 2012 A thesis submitted to the Faculty of the Graduate School of the University of Colorado in partial fulfillment of the requirements for the degree of Doctor of Philosophy Department of Molecular, Cellular, and Developmental Biology 2018
-
Upload
khangminh22 -
Category
Documents
-
view
0 -
download
0
Transcript of Novel Phenotypic and Large-Scale Genomic Approaches

Understanding the Genetics of Substance Use: Novel
Phenotypic and Large-Scale Genomic Approaches
by
David Brazel
B.A., Colby College, 2012
A thesis submitted to the
Faculty of the Graduate School of the
University of Colorado in partial fulfillment
of the requirements for the degree of
Doctor of Philosophy
Department of Molecular, Cellular, and Developmental Biology
2018
This thesis entitled:Understanding the Genetics of Substance Use: Novel Phenotypic and Large-Scale Genomic
Approacheswritten by David Brazel
has been approved for the Department of Molecular, Cellular, and Developmental Biology
Prof. Scott Vrieze
Prof. Kenneth Krauter
Prof. Marissa Ehringer
Date
The final copy of this thesis has been examined by the signatories, and we find that both thecontent and the form meet acceptable presentation standards of scholarly work in the above
mentioned discipline.
IRB protocol #140371 and 140433

Brazel, David (Ph.D., Molecular, Cellular, and Developmental Biology)
Understanding the Genetics of Substance Use: Novel Phenotypic and Large-Scale Genomic Ap-
proaches
Thesis directed by Prof. Scott Vrieze
Substance abuse is one of the leading causes of morbidity and mortality in both the developing
and the developed worlds. For example, approximately 88,000 people die each year from alcohol-
related causes and the annual cost to society of alcohol misuse is estimated to be $249,000,000,000.
Converging lines of evidence indicate that these behaviors are substantially heritable: twin and
adoption studies have found significant genetic effects for initiation, intensity of use, dependence,
and abuse for alcohol, tobacco, marijuana, and other drugs. Genome-wide association studies
(GWAS) and candidate gene studies have found a number of robust associations between genetic
variants and substance use and dependence. Twin studies have found evidence for common genetic
liability across drugs and for distinct genetic influences on substance use initiation and on quantity
of use and substance dependence after initiation.
Chapter 2 of this thesis describes a rare variant GWAS meta-analysis focused primarily on
the role of exonic variants in alcohol and smoking behavior. Across 17 contributing studies, most
using the Exome Chip, I assembled a total sample size of between 70,847 and 164,142 individuals
for five standard phenotypes: cigarettes per day, smoking initiation, pack years, age of smoking
initiation, and drinks per week. In this meta-analysis, I performed single variant tests, gene-based
burden tests, and tests conditioned on the effects of common variants. I replicated a number of
known associations but failed to find any reproducible novel associations. A modest portion of
phenotypic variance (1.7-3.6%) was accounted for by all genotyped rare variants. In summary, if
rare variants with large effect sizes exist for these traits, they must be substantially more rare than
the modestly rare variants genotyped on the Exome Chip. It follows that large sequenced samples
will be required to detect their effects.
Chapter 3 of this thesis describes a twin study of adolescent substance use development which
iv
used smartphone applications and location tracking to measure twins’ behavior and environmental
exposures. Adolescence is a sensitive period for substance use. Individuals who initiate substance
use in early adolescence are at higher risk for dependence diagnoses in adulthood than individu-
als who initiate later in adolescence. Excessive adolescent substance use is also associated with
increased risk for accidental and intentional injuries. Genetic and environmental explanations for
adolescent substance use have been advanced but few studies have examined specific environmental
hypotheses while accounting for genetic confounding. In this chapter, I show that substance use
behavior and related variables can be measured accurately and at high frequency by automated
remote assessment and monitoring mediated through the participant’s smartphone. I found that
adolescent substance use and change in use is heritable, including e-cigarette use, a novel result. I
used the participants’ location data to measure the fraction of time they spent at school during the
school day and at home at night, measures of delinquent behavior. These variables were not asso-
ciated with substance use, contradicting previous results. I also found that the physical distance
between twins in a twin pair increased with age and increased more quickly for dizygotic twins
than for monozygotic twins, a violation of the equal environment assumption of the classic twin
model and an indication that location is heritable. In conclusion, digital phenotyping methods can
be used to obtain high quality, longitudinal data in a scalable fashion.

Dedication
To Suzanne Gentner and Gary Brazel

vi
Acknowledgements
I would like to thank my advisor, Scott Vrieze, for his dedicated mentorship and commitment
to scientific achievement. Ken Krauter, in addition to talking me out of dropping out, has always
been there to help not just me but any student in need. The members of my committee, Marissa
Ehringer, Will Old, and Zoe Donaldson, have been more than generous with their time and their
advice. Toni Smolen’s brilliance, wisdom, compassion, and deep dedication to maintaining the best
of our heritage while fostering a better future have been nothing short of inspirational. The staff
of the Institute for Behavioral Genetics and of MCDB – Janna Vannorsdel, Sean Shelby, Wendy
Senger, Katie Sheehan, Melissa Dunivant, and Karen Brown – have been indispensable supports. I
am also grateful to Tom Cech, Andrea Stith, Kristen Powell, Amber McDonnell, and Kim Kelley for
their stewardship of the IQ Biology program and promotion of interdisciplinary education. Robbee
Wedow, Zhen Liu, Gargi Datta, and Maia Frieser were the best and strangest labmates I could have
hoped to have. My parents, Gary Brazel and Suzanne Gentner, taught me the joy of unbridled
curiosity and the importance of tikkun olam. Finally, none of this would have been possible without
the love, support, and counsel of Katie Kumamoto, my fiancee and my friend.
I am grateful for the support provided by an Institute for Behavioral Genetics training
grant awarded by the National Institute on Drug Abuse, 5T3DA017637-13, and by an IQ Biol-
ogy IGERT training grant awarded by the National Science Foundation. The work in Chapters 2
and 3 was funded by grants from the National Institutes of Health: R01DA037904, R21DA040177,
R01HG008983, and R01AA023974. These grants were awarded by the National Institute on Drug
Abuse, the National Human Genome Research Institute, and the National Institute on Alcohol
Abuse and Alcoholism.

Contents
Chapter
1 Introduction 1
1.1 Early history of genetics . . . . . . . . . . . . . . . . . . . . . . . . . . . . . . . . . . 1
1.2 Methods in statistical genetics. . . . . . . . . . . . . . . . . . . . . . . . . . . . . . . 3
1.2.1 Twin and family studies . . . . . . . . . . . . . . . . . . . . . . . . . . . . . . 3
1.2.2 Linkage . . . . . . . . . . . . . . . . . . . . . . . . . . . . . . . . . . . . . . . 5
1.2.3 Genotyping and sequencing technologies . . . . . . . . . . . . . . . . . . . . . 6
1.2.4 Genome-wide association studies . . . . . . . . . . . . . . . . . . . . . . . . . 9
1.2.5 Rare variant methods . . . . . . . . . . . . . . . . . . . . . . . . . . . . . . . 11
1.3 Mechanisms of action . . . . . . . . . . . . . . . . . . . . . . . . . . . . . . . . . . . 12
1.3.1 Alcohol . . . . . . . . . . . . . . . . . . . . . . . . . . . . . . . . . . . . . . . 12
1.3.2 Nicotine . . . . . . . . . . . . . . . . . . . . . . . . . . . . . . . . . . . . . . . 13
1.3.3 Marijuana . . . . . . . . . . . . . . . . . . . . . . . . . . . . . . . . . . . . . . 13
1.4 Substance use genetics . . . . . . . . . . . . . . . . . . . . . . . . . . . . . . . . . . . 14
1.4.1 Alcohol . . . . . . . . . . . . . . . . . . . . . . . . . . . . . . . . . . . . . . . 15
1.4.2 Nicotine . . . . . . . . . . . . . . . . . . . . . . . . . . . . . . . . . . . . . . . 17
1.4.3 Marijuana . . . . . . . . . . . . . . . . . . . . . . . . . . . . . . . . . . . . . . 18
1.4.4 Shared liability . . . . . . . . . . . . . . . . . . . . . . . . . . . . . . . . . . . 19
2 A rare variant association study of alcohol and tobacco use 20
2.1 Abstract . . . . . . . . . . . . . . . . . . . . . . . . . . . . . . . . . . . . . . . . . . . 20
viii
2.2 Introduction . . . . . . . . . . . . . . . . . . . . . . . . . . . . . . . . . . . . . . . . . 21
2.3 Methods . . . . . . . . . . . . . . . . . . . . . . . . . . . . . . . . . . . . . . . . . . . 23
2.3.1 Ancestry . . . . . . . . . . . . . . . . . . . . . . . . . . . . . . . . . . . . . . 24
2.3.2 Phenotypes . . . . . . . . . . . . . . . . . . . . . . . . . . . . . . . . . . . . . 24
2.3.3 Genotypes . . . . . . . . . . . . . . . . . . . . . . . . . . . . . . . . . . . . . . 25
2.3.4 Generation of summary association statistics . . . . . . . . . . . . . . . . . . 25
2.3.5 Meta-analysis . . . . . . . . . . . . . . . . . . . . . . . . . . . . . . . . . . . . 28
2.3.6 Replication data . . . . . . . . . . . . . . . . . . . . . . . . . . . . . . . . . . 36
2.3.7 Genetic architecture analysis . . . . . . . . . . . . . . . . . . . . . . . . . . . 36
2.4 Results . . . . . . . . . . . . . . . . . . . . . . . . . . . . . . . . . . . . . . . . . . . . 36
2.5 Discussion . . . . . . . . . . . . . . . . . . . . . . . . . . . . . . . . . . . . . . . . . . 40
2.6 Acknowledgements . . . . . . . . . . . . . . . . . . . . . . . . . . . . . . . . . . . . . 45
2.7 Supplemental information . . . . . . . . . . . . . . . . . . . . . . . . . . . . . . . . . 46
3 Intensive longitudinal assessment elucidates adolescent substance use development 47
3.1 Introduction . . . . . . . . . . . . . . . . . . . . . . . . . . . . . . . . . . . . . . . . . 47
3.2 Methods . . . . . . . . . . . . . . . . . . . . . . . . . . . . . . . . . . . . . . . . . . . 53
3.2.1 Subject recruitment . . . . . . . . . . . . . . . . . . . . . . . . . . . . . . . . 53
3.2.2 Intake assessment . . . . . . . . . . . . . . . . . . . . . . . . . . . . . . . . . . 53
3.2.3 Intensive follow-up assessments . . . . . . . . . . . . . . . . . . . . . . . . . . 56
3.2.4 Phenotype extraction . . . . . . . . . . . . . . . . . . . . . . . . . . . . . . . 58
3.2.5 Statistical analysis . . . . . . . . . . . . . . . . . . . . . . . . . . . . . . . . . 59
3.3 Results . . . . . . . . . . . . . . . . . . . . . . . . . . . . . . . . . . . . . . . . . . . . 62
3.3.1 Sample description . . . . . . . . . . . . . . . . . . . . . . . . . . . . . . . . . 62
3.3.2 Substance use and dependence . . . . . . . . . . . . . . . . . . . . . . . . . . 62
3.3.3 Parental monitoring . . . . . . . . . . . . . . . . . . . . . . . . . . . . . . . . 65
3.3.4 Locations . . . . . . . . . . . . . . . . . . . . . . . . . . . . . . . . . . . . . . 68
3.3.5 Growth models . . . . . . . . . . . . . . . . . . . . . . . . . . . . . . . . . . . 70

ix
3.4 Discussion . . . . . . . . . . . . . . . . . . . . . . . . . . . . . . . . . . . . . . . . . . 85
4 Conclusion 89
4.1 Summary . . . . . . . . . . . . . . . . . . . . . . . . . . . . . . . . . . . . . . . . . . 89
4.2 Future directions . . . . . . . . . . . . . . . . . . . . . . . . . . . . . . . . . . . . . . 90
Bibliography 93
Appendix
A Methods for estimating heritability and genetic correlation in meta-analyses of rare variant
association studies 120
B Phenotype extraction and genetic association in the UK Biobank 124
B.1 GSCAN phenotype definitions . . . . . . . . . . . . . . . . . . . . . . . . . . . . . . . 124
B.2 UK Biobank phenotype definitions . . . . . . . . . . . . . . . . . . . . . . . . . . . . 127
B.3 GSCAN Exome analysis . . . . . . . . . . . . . . . . . . . . . . . . . . . . . . . . . . 130
B.4 GSCAN GWAS analysis . . . . . . . . . . . . . . . . . . . . . . . . . . . . . . . . . . 131
C Funding sources for GSCAN Exome contributors 132

Tables
Table
1.1 Meta-analysis of substance use twin studies in both adolescent and adult samples . . 16
2.1 Participating cohort description . . . . . . . . . . . . . . . . . . . . . . . . . . . . . . 26
2.2 Per-study, per-phenotype sample size (N) and genomic control (GC). . . . . . . . . . 29
2.3 Marker number by MAF and functional category for cigarettes per day . . . . . . . . 29
2.4 Significant results for common and rare variants . . . . . . . . . . . . . . . . . . . . . 33
2.5 Comparison to past studies . . . . . . . . . . . . . . . . . . . . . . . . . . . . . . . . 34
2.6 All significant associations, including variants present only in the UK Biobank. . . . 38
2.7 Partitioned heritability for variants on the Exome Array. . . . . . . . . . . . . . . . . 41
2.8 Estimation of heritability . . . . . . . . . . . . . . . . . . . . . . . . . . . . . . . . . 43
2.9 Genetic correlation estimates between smoking and drinking traits . . . . . . . . . . 43
3.1 Intake assessments . . . . . . . . . . . . . . . . . . . . . . . . . . . . . . . . . . . . . 55
3.2 Follow-up assessments . . . . . . . . . . . . . . . . . . . . . . . . . . . . . . . . . . . 57
3.3 Model fit and fixed effect parameters for the linear and quadratic mixed-effect growth
models of the longitudinal phenotypes . . . . . . . . . . . . . . . . . . . . . . . . . . 61
3.4 Sample household demographics compared to the populations of Colorado and the
United States . . . . . . . . . . . . . . . . . . . . . . . . . . . . . . . . . . . . . . . . 63
3.5 Substance use and dependence rates at intake as compared to state-wide and national
samples of tenth graders . . . . . . . . . . . . . . . . . . . . . . . . . . . . . . . . . . 64

xi
3.6 Twin variance components of the quadratic growth model parameters with 95%
confidence intervals . . . . . . . . . . . . . . . . . . . . . . . . . . . . . . . . . . . . . 80
3.7 Correlations between the twin variance components with 95% confidence intervals . 81
3.8 Model fit and fixed effect parameters for the bilinear mixed-effect growth models . . 84

Figures
Figure
1.1 A homunculus in a sperm, drawn by Nicolaas Hartsoecker in 1695. . . . . . . . . . . 2
1.2 Recombination rates and LD patterns for two regions of the human genome and for
three populations . . . . . . . . . . . . . . . . . . . . . . . . . . . . . . . . . . . . . . 7
1.3 Cost per genome . . . . . . . . . . . . . . . . . . . . . . . . . . . . . . . . . . . . . . 9
1.4 Effect size and MAF . . . . . . . . . . . . . . . . . . . . . . . . . . . . . . . . . . . . 12
2.1 Distribution of nonsynonymous and loss of function variant allele frequencies in the
Illumina exome array and the UK Biobank arrays. . . . . . . . . . . . . . . . . . . . 30
2.2 Distribution of variant allele frequencies in the Illumina exome array and the UK
Biobank arrays. . . . . . . . . . . . . . . . . . . . . . . . . . . . . . . . . . . . . . . . 31
3.1 Rate of data acquisition . . . . . . . . . . . . . . . . . . . . . . . . . . . . . . . . . . 66
3.2 Smoothed means of the longitudinal phenotypes . . . . . . . . . . . . . . . . . . . . 67
3.3 Lengths of the intervals between locations . . . . . . . . . . . . . . . . . . . . . . . . 69
3.4 Fill forward length by hour . . . . . . . . . . . . . . . . . . . . . . . . . . . . . . . . 71
3.5 Fill forward length by day . . . . . . . . . . . . . . . . . . . . . . . . . . . . . . . . . 72
3.6 Time at home by day and hour . . . . . . . . . . . . . . . . . . . . . . . . . . . . . . 73
3.7 Time at school by day and hour . . . . . . . . . . . . . . . . . . . . . . . . . . . . . . 74
3.8 Calendar heatmap of time at school . . . . . . . . . . . . . . . . . . . . . . . . . . . 75
3.9 Growth model variance components . . . . . . . . . . . . . . . . . . . . . . . . . . . 77

xiii
3.10 Growth model covariance components . . . . . . . . . . . . . . . . . . . . . . . . . . 78
3.11 Cross-phenotype growth parameter correlations . . . . . . . . . . . . . . . . . . . . . 82

Chapter 1
Introduction
1.1 Early history of genetics
It seems likely that heredity, the resemblance of offspring and their parents, was first recog-
nized and exploited in prehistory during the domestication of animals and plants through selective
breeding. The domestication process involves significant behavioral changes and the heredity of
behavior must have been obvious as well. For example, phylogenetic estimates place the divergence
of wolves and dogs between 9,000 and 34,000 years ago (Larson & Bradley, 2014). In addition to
the obvious morphological changes between a wolf and a Shih Tzu, dogs show less aggression and
fear towards humans than wolves. Signals of selection in dogs have been identified and mapped
to genes involved in the fight-or-flight response (Cagan & Blass, 2016). Presumably, prehistoric
humans recognized that some proto-dogs were more friendly and more biddable and encouraged
their reproduction just as they selected for grain nutrient content, transforming a small, thin, and
more variable wild grain into modern wheat (Eckardt, 2010).
The first recorded theories of heredity came much later than its practical applications. In
Aristotle’s On the Generation of Animals, published in the 4th century BCE, he argues that the
semen of the father and the menses of the mother encode their characteristics, including acquired
characteristics. The semen contributes “heat” or “power” that animates the embryo and determines
the form of the species, while the balance of heat (seen as male) and cold (seen as female) determines
the sex of the offspring (Lennox, 2017). In contrast, the doctrine of preformationism held that the
form of the offspring is predetermined, perhaps at the creation of humanity, and merely revealed

2
Figure 1.1: A homunculus in a sperm, drawn by Nicolaas Hartsoecker in 1695.
through development. In its most literal form, this doctrine envisioned a homunculus, or tiny
human, present in either the sperm or the egg (Figure 1.1), and homunculi within that homunculus,
ad infinitum (Maienschein, 2017).
For much of the 19th century, the dominant theory of heredity was blending inheritance,
whereby offspring receive the average phenotypic value of their parents. This position was held by
Darwin, in conjunction with Lamarckian inheritance of acquired characteristics (Holterhoff, 2014).
Gregor Mendel, inspired by his experiments in the hybridization of pea plants, proposed particulate
inheritance. In this model, offspring inherit the discrete factors that we would call genes and
alleles from their parents. These factors remain independent. Therefore, phenotypic and genetic
variation can be maintained over time (Mendel, 1965). Even after the rediscovery of Mendel’s
work, it was commonly thought that his results applied only to categorical phenotypes with large
differences between individuals and not to continuous phenotypes, such as height. R.A. Fisher
reconciled these perspectives in a seminal paper which concluded that continuous variation may be
the result of many Mendelian genes affecting a trait, the polygenic model (Fisher, 1918). He also
noted that the phenotypic correlations between relatives may be used to calculate heritability (the
proportion of variation in a trait that is explained by genetic variation), the degree of dominance
or non-additivity, the contribution of the environment, and the effect of assortative mating. These

3
observations establish the framework within which modern twin and family genetic models operate,
although Francis Galton anticipated the use of twins to determine whether behavioral traits were
heritable (Galton, 1875).
1.2 Methods in statistical genetics.
It is important to note that the methods I will describe in this section all address the question
of phenotypic variance—the differences between individuals in a population. If a phenotype is not
heritable, that does not mean genes play no role in it. If a phenotype is under heavy selective
pressure, variants that affect it negatively may be rapidly removed from the population, and relevant
genetic variance will not be found. Additionally, this discussion will be oriented towards methods
applicable to complex and reasonably common traits. A discussion of rare and Mendelian traits
lies outside the scope of this dissertation.
1.2.1 Twin and family studies
Before going into historical and mathematical detail, I would like to explain the intuitions
behind twin and family methods. If a trait is heritable, individuals who are related to each other
should be more similar to each other on that trait than randomly selected individuals. Addi-
tionally, phenotypic similarity should correlate positively with relatedness (genetic similarity) to a
degree determined by the heritability of the trait. However, this approach cannot produce unbi-
ased heritability estimates because environment similarity is likely to be confounded with genetic
similarity.
Twins are a natural experiment that can address this difficulty. Monozygotic (MZ) or iden-
tical twins share all (really, almost all) of their alleles while dizygotic (DZ) or fraternal twins share
half of their alleles on average. If we assume that MZ twins and DZ twins share equally similar
environments, then the difference between their phenotypic correlations can provide an unbiased
estimate of heritability. In the classic twin model, we divide the phenotypic variance into three
components (Neale & Maes, 1994):

4
• A — Additive genetic effects or heritability
• C — Common environment, the environment shared by both twins. This is assumed to be
the same for MZ and DZ twins.
• E — Unique environment, environmental influences not shared by the twins. This is
the only components on which MZ twins differ. Measurement error will appear in this
component.
Since C is the same for MZ and DZ twins and DZ twins share half of their alleles, we can
decompose the phenotypic correlations as follows:
rMZ = A+ C (1.1)
rDZ =1
2A+ C (1.2)
And we can calculate the components as:
A = 2(rMZ − rDZ) (1.3)
C = rMZ −A (1.4)
And because A+ C + E = 1:
E = 1− rMZ (1.5)
A common pattern in statistical genetics is the development of a statistical method in non-
human animals before its application to humans. This occurred recently with the advent of GCTA
heritability estimation (Yang et al., 2010). The formulation of modern twin and family methods,
often termed the “model fitting” approach, also followed this pattern. In 1970, John Jinks and
David Fulker proposed that the approach used in biometric genetics to analyze non-human animal

5
data be applied to humans (Jinks & Fulker, 1970). In biometrical genetics, maximum likelihood was
used to fit a model of genetic and environmental effects. The maximum likelihood approach allows
a researcher to compare models, estimate parameter confidence intervals, calculate the goodness-of-
fit of a model, and fit more complex models. For example, biometrical genetic models can examine
the shared environmental and genetic effects between two or more phenotypes (Martin & Eaves,
1977) or incorporate extended family data to estimate non-additive genetic effects (Neale & Maes,
1994). I use this approach in Chapter 3 to examine genetic and environmental effects on adolescent
substance use trajectories.
1.2.2 Linkage
The concepts of linkage and linkage disequilibrium (LD) are essential to the genome-wide
methods that I will discuss. Linkage refers to the observation that loci which are close to each other
on a chromosome are more likely to be inherited together. Linkage occurs because of chromosomal
crossover or recombination during meiosis. The closer together two loci are, the less likely they are
to be split apart (Miko, 2008).
LD is quite misleadingly named because it does not necessarily have anything to do with
linkage and can occur under equilibrium. LD is merely “a nonrandom association of alleles at two
or more loci” (Slatkin, 2008). The definition is purely statistical—under certain circumstances, LD
can exist between chromosomes. Mathematical definitions of LD are based on the statistic D:
D = pAB − pApB (1.6)
where pAB is the frequency of the haplotype combining alleles A and B and pApB is the
product of the frequencies of those alleles. Therefore, D is the difference of the realized frequency
from the frequency under independence. D is constrained by the allele frequencies and so derived
statistics are typically used. D′ is defined as D divided by its maximum possible absolute value.

6
Most commonly used is a correlation coefficient of indicator variables for A and B:
r2 =D2
pA(1− pA)pB(1− pB)(1.7)
The maximum value of r2 is constrained by the difference between pA and pB. For example,
if r2 ≥ 0.8 and pA = 0.5, pB cannot be less than 0.44 or greater than 0.56 (Wray, 2005). This
importance of this observation will become clear in a later discussion of genotype imputation.
LD is not uniform across the genome because the rate of recombination is not uniform.
Sections of the genome tend to be inherited together, as an “LD block” or “haploblock” (Figure
1.2). If we measure a single allele in that block, we have learned a great deal about the rest of the
block.
LD decreases slowly and can be created by many forces, including selection, drift, gene flow,
inbreeding, population subdivision, and mutation (Slatkin, 2008). Humans have extensive LD
because of our population history, including recent bottleneck events, and because we are subject
to the forces listed above. LD is less prevalent in sub-Saharan African populations because they
have not experienced those bottlenecks (Wall & Pritchard, 2003).
1.2.3 Genotyping and sequencing technologies
If we wish to go beyond the broad question of the role of genetic variance and identify specific
genetic variants responsible for differences in a phenotype of interest, we must be able to determine
which variants an individual has. In other words, we must be able to genotype people and probably
quite a few of them. If we don’t have strong a priori theories about which variants are important,
we must be able to genotype many variants across the genome. In many ways, the story of modern
human genetics is one of the development of cheaper and faster genotyping and genome sequencing
technologies, rather than one of major advances in theory.
The first widely adopted DNA sequencing method was Sanger sequencing. In Sanger se-
quencing, a primer is designed to target the region to be sequenced. DNA polymerase and deoxynu-
cleosidetriphosphates (dNTPs) are added to extend the primer. Di-deoxynucleosidetriphosphates

7
Figure 1.2: Recombination rates and LD patterns for two regions of the human genome and for threepopulations (Sachidanandam et al., 2001). YRI = Yoruba in Ibadan, Nigeria; CEU = Caucasianindividuals in Utah, USA; CHB = Han Chinese in Beijing, China; JPT = Japanese in Tokyo,Japan.

8
(ddNTPs) are included in the reaction mix and terminate chain extension when they are incorpo-
rated. In the classic method, four reaction mixes are run, one for each ddNTP. The fragment lengths
are then determined by gel electrophoresis and autoradiography (Sanger et al., 1977), yielding the
sequence. This method was quite labor intensive and was replaced by an approach where each
ddNTP has a unique fluorescent label. A single reaction mix is run and capillary electrophoresis
is used to separate the fragments and read the sequence, in an automated fashion (Smith et al.,
1986).
Automated Sanger sequencing greatly increased the efficiency of DNA sequencing and was
essential to the completion of the first human genome. However, the throughput provided by
even the most sophisticated Sanger sequencing machines is not sufficient to allow for population
whole genome sequencing. One solution to this problem was based on the observation, described
above, that humans have many LD blocks. Common genetic variation can therefore be assessed
by genotyping hundreds of thousands of variants across the genome, selected using the haplotype
information assembled by consortia like HapMap (Frazer et al., 2007) and the 1000 Genomes Project
(Auton et al., 2015). Genotyping arrays based on DNA hybridization to pre-designed probes and
fluorescent microscopy were designed to do just this, at a much lower price per genome than
sequencing (Gunderson et al., 2005). After genotyping, the haplotype information is used to impute
ungenotyped sites (Li et al., 2009).
Unfortunately, genotyping arrays have several limitations. First, the strategy of using “tag”
SNPs that are in high LD with neighboring variants works only for common and moderately rare
variants because of the greater number of rare variants and because of the constraints on LD
imposed by allele frequency. Second, the probes used on arrays can only target single nucleotide
polymorphisms (SNPs) and certain simple structural variants. In order to understand the effects
of rare and complex structural variants, whole genome sequencing is necessary.
Next-generation sequencing (NGS) refers to a class of sequencing technologies that were
developed after Sanger sequencing. The most successful has been the approach developed first by
Solexa and then by Illumina. Illumina sequencing utilizes reversible, labeled terminators and clonal

9
clusters on a two-dimensional flow cell surface. Each cluster is derived from a single fragment.
Millions of clusters can be sequenced in parallel by a single machine, providing much greater
throughput at a lower per base cost than Sanger sequencing (van Dijk et al., 2014). The adoption
of NGS has corresponded to an extraordinary decrease in sequencing costs although the cost per
genome has stabilized in the past few years (Figure 1.3).
Figure 1.3: The cost per human genome over time (Wetterstrand, 2018).
1.2.4 Genome-wide association studies
Genome-wide association studies (GWAS) test whether any of a set of genetic variants drawn
from across the genome predict variation of a trait in a sample of genotyped and phenotyped
individuals. The first GWAS performed on a sample of significant size (N = 14,000) was published
in 2007 by the Wellcome Trust Case Control Consortium (Burton et al., 2007). GWAS soon to be
published have combined sample sizes of over a million individuals (Karlsson Linner et al., 2018).
These large studies are not based on a single sample but on meta-analyses of results from, often,
dozens of samples originally collected for very different purposes. As an aside, GWAS of alcohol
and smoking behaviors have benefited from the fact that these traits are important covariates for
many other diseases. These efforts have been made because of the realization that complex traits

10
are highly polygenic. At least among common variants, there are many associated loci, each with a
small effect, requiring a large sample size to reach adequate power. What has been the cost of this
approach? We have, by necessity, used phenotypes whose primary merit is that they are broadly
available. Complicated and sophisticated phenotypes have not been accessible. The advent of large,
deeply phenotyped biobanks mitigates this issue as does the calculation of genetic correlations or
other measures of concordance between large GWAS and phenotypes of interest.
From a statistical standpoint, most GWAS are very simple. A regression is run for each vari-
ant in the sample, with the genotypes at that site as predictors, along with appropriate covariates.
The outcome is the phenotype of interest. LD-based genotype imputation is used to increase the
number of variants tested (Li et al., 2009; Howie et al., 2012). In order to deal with the confounding
between genetic and environmental similarity described for twin studies, close relatives are usually
removed from the sample. Another solution to relatedness within a sample is to use mixed model
association methods, which explicitly account for it (Loh et al., 2015). Population stratification
refers to the fact that different populations have different allele frequencies, due to their unique his-
tories. Here, population can refer to anything from continent-level ancestry to a village separated
by a mountain from a neighboring village. All that is required is a historic barrier to gene flow.
Confounding due to population stratification is introduced when populations present in a GWAS
sample have different phenotypic distributions. Variants that distinguish the populations will be
highly associated with the phenotype without having any real causal effect. Typically, we deal
with population stratification by including genomic principal components as covariates, accounting
for the large-scale covariation of allele frequencies associated with population stratification. The
sample will also typically be split by continent-level ancestry and each sub-group will be analyzed
separately.
What have we learned from GWAS? We have not learned much about the fundamental
biology of these traits. The study of Mendelian disorders has been far more fruitful in exposing the
molecular pathways underlying disease and health. The few exceptions (Claussnitzer et al., 2015;
Sekar et al., 2016) required significant laboratory follow-up, an approach that is inherently difficult
11
to scale, especially when many loci reach significance and none are obviously more important
than others. GWAS findings have found some applications in pharmacology (Nelson et al., 2015;
Cardon & Harris, 2016). One important finding has come from the use of SNP-based heritability
methods to determine that a significant portion of the additive genetic variance for complex traits
is accounted for by common variants (Yang et al., 2010, 2015; Gaugler et al., 2014). Pleiotropy is
the phenomenon of a gene influencing multiple traits. Genetic correlations calculated from GWAS
summary statistics have shown that pleiotropy is extremely common (Bulik-Sullivan et al., 2015a).
Finally, GWAS summary statistics can be used to construct genomic predictors, which are used
to calculate risk scores for the trait of interest in independent samples. Those samples can be
much smaller, allowing for the use of GWAS results in deeply phenotyped samples. One of the
interesting applications of genomic predictors is removing genetic confounding from studies that
seek to understand environmental effects on a trait. Even so, for the average person, having their
genome sequenced would yield interesting trivia but no information of practical importance.
1.2.5 Rare variant methods
Rare variants are often discussed in the context of “missing heritability,” the observation
that the total additive genetic variance accounted for by GWAS-associated loci is often much less
than the estimates from twin studies. This problem has been partially resolved through SNP-based
heritability estimates, based on all common variants. It is possible rare variants may account for
the remaining “missing heritability.” Rare variants are also of interest because if the traits we study
are under selection, variants with large effect sizes ought to be fixed or driven to low frequency.
Generally, we expect most variants that affect function to be deleterious and to be selected against.
If large effect sizes are enriched in rarer variants, finding and studying those rare variants could
enhance our understanding of complex trait etiology. A large study of the role of moderately rare
variants in height found that effect size did increase as minor allele frequency (MAF) decreased
(Figure 1.4). If, as we expect, associated rare variants are more likely to be coding, then their
effects are much easier to interpret than the typical common non-coding variant.

12
Figure 1.4: Among variants significantly associated with height, the variants of high effect are rare(Marouli et al., 2017). MAF = Minor allele frequency
Discovering and measuring rare variants is technically straightforward. We simply need to
sequence enough genomes, using the techniques described above. The challenge is assembling a
sufficient sample size. The rarer the variant, the more people we will need to sequence to detect an
effect of a given size. One solution to this problem is to combine information across rare variants
within a gene and conduct a burden test. In a burden test, we ask if some measure of loss of
function of a gene is associated with the phenotype of interest, increasing our power under the
assumption that we are appropriately grouping variants that have a similar effect and, for most
tests, that the directions of effect of the variants are consistent (Lee et al., 2014).
1.3 Mechanisms of action
1.3.1 Alcohol
Alcohol is a sedative hypnotic. Effects of use include disinhibition, impairment of motor
control, cognition, reflexes, and memory, blackouts, coma, and death (McCracken et al., 2016).

13
Unlike most substances of abuse, alcohol does not target a specific receptor, complicating the study
of its effects. Alcohol binds to and affects the function of a number of synaptic membrane ion
channels, including GABA, NMDA, and glycine receptors (Harris et al., 2008). Alcohol also binds
to and activates potassium channels (Aryal et al., 2009). Alcohol binds to and enhances the activity
of adenylyl cyclases, influencing the G protein signaling pathway (Yoshimura & Tabakoff, 1995).
Rat self-administration of alcohol increases dopamine levels in the nucleus accumbens, providing a
neural mechanism for the pleasurable and reinforcing effects of alcohol (Weiss et al., 1993).
1.3.2 Nicotine
Acute nicotine administration has positive cognitive effects, benefiting concentration and
reaction time. It also acts as a stimulant, produces pleasure, and decreases anxiety. However,
withdrawal leads to a number of negative effects (Benowitz, 2008b). Nicotine binds to and activates
nicotine acetylcholine receptors (nAChRs) in the brain. By activating presynaptic nAChRs, nicotine
stimulates the release of dopamine and a number of other neurotransmitters, causing the effects
described above (Benowitz, 2008a).
1.3.3 Marijuana
Marijuana use induces relaxation, hunger, enhanced perception, euphoria, analgesia, and dis-
inhibition. Large doses can cause hallucinations (McCracken et al., 2016). Cannabinoids are com-
pounds that bind to cannabinoid receptors and affect neurotransmitter release. Many cannabinoids
are produced by the cannabis plant (Martin, 1986) but the major active compound in marijuana is
∆9-tetrahydrocannabinol (THC) (Gaoni & Mechoulam, 1964). THC binds to CB1, the cannabinoid
receptor present in the brain (Matsuda et al., 1990). CB1 activation inhibits acetylcholine release
(Carta et al., 1998), increases dopamine levels and the firing rate of dopaminergic neurons (Chen
et al., 1990; Melis et al., 2000; Morera-Herreras et al., 2008), inhibits calcium channels (Mackie
& Hille, 1992), and activates MAP/ERK kinase (MEK) and extracellular signal-regulated kinase
(ERK), leading to the expression of immediate early genes (Derkinderen et al., 2003). The analgesic

14
effects of cannabinoids seem to be due to their binding to glycine receptors (Xiong et al., 2011).
1.4 Substance use genetics
Most terms for substance use are self-explanatory but two formal diagnoses deserve explicit
definition. Substance dependence “is a cluster of cognitive, behavioral, and physiological symptoms
indicating that the individual continues use of the substance despite significant substance-related
problems.” Substance abuse “is a maladaptive pattern of substance use manifested by recurrent and
significant adverse consequences related to the repeated use of substances” (American Psychiatric
Association, 2000). Substance dependence is diagnosed if a patient shows three of more of the
following symptoms in a year:
(1) Tolerance, either:
(a) the patient needs more of the substance to become intoxicated
(b) the patient experiences less of an effect with the same amount of the substance
(2) Withdrawal, either:
(a) the patient experiences the withdrawal symptoms typical for the substance
(b) the patient uses the substance to relieve or avoid withdrawal symptoms
(3) The patient uses the substance more than they meant to
(4) The patient wants to stop using the substance or use less
(5) The patient spends a lot of time obtaining, using, or recovering from the substance
(6) The patient spends less time doing important activities because of their use
(7) The patient continues using the substance despite knowing that it is causing or exacerbating
a significant health issue
Substance abuse is diagnosed if a patient shows one or more of the following symptoms in a
year:

15
(1) The patient fails to accomplish important tasks in their life (related to work, school, or
home life) because of their substance use
(2) The patient uses the substance when it is physically dangerous to do so
(3) The patient has legal problems because of their substance use
(4) The patient keeps using the substance despite inter-personal problems caused by their
substance use
1.4.1 Alcohol
1.4.1.1 Twin and family studies
A number of lines of evidence support the heritability of alcohol use. Twin studies have
found significant heritability for initiation, regular use, and dependence, increasing in adults as
compared to adolescents, at the expense of shared environment (Table 1.1). In general, shared
environment seems to contribute most to whether or not someone drinks but much less to how
they drink. Adoption studies have found significant genetic and environmental effects on alcohol
dependence and abuse (Cadoret et al., 1985; Yates et al., 1996). Another adoption study focusing
on environmental effects found evidence for an effect of sibling environment on alcohol use and
abuse but not of parental environment (McGue et al., 1996). This study also found significant
differences between the effect of parental behavior on drinking between adoptive and biological
children of the same parents, supporting the position that gene-environment correlation at least
partially accounts for the effects of family environment on drinking.
1.4.1.2 Candidate genes
Candidate gene studies examine the association between a phenotype and one or more genetic
variants hypothesized to influence it. Although the record of complex trait candidate gene research
is mixed at best (Tabor et al., 2002; Hutchison et al., 2004; Sullivan, 2007), it has proven more
robust in its application to substance use, at least with targets most directly tied to a given

16
Table 1.1: Meta-analysis of substance use twin studies in both adolescent and adult samples
Adolescent Adult
A C E A C E
AlcoholEver 0.16 0.70 0.15 0.59 0.27 0.16Regular 0.57 0.14 0.29 0.47 0.04 0.49Dependent 0.33 0.27 0.40 0.54 0.00 0.46
TobaccoEver 0.45 0.43 0.13 0.68 0.09 0.25Regular 0.58 0.27 0.16 0.56 0.27 0.18Dependent 0.49 0.15 0.13 0.55 0.03 0.43
MarijuanaEver 0.32 0.53 0.16 0.59 0.17 0.25Regular 0.64 0.00 0.36 0.67 0.00 0.33Dependent 0.55 0.24 0.21 0.53 0.13 0.36
Variance component estimates extracted from a meta-analysis of twin studies (Stallings et al.,2014). Ever = Ever Used; Regular = Regular Use; Dependent = Abuse/Dependence
substance. One explanation for this is that substance use involves a substance, a chemical entity
whose interactions with proteins can be cataloged. The receptor target of nicotine or the enzyme
that metabolizes alcohol in the liver are better than average gene candidates. Put another way,
our understanding of the biology of substance use has been better than our understanding of the
biology of depression or schizophrenia. In this and later sections, I will focus on candidate gene
results that have been replicated. For alcohol dependence, associations with polymorphisms in the
alcohol dehydrogenase (ADH) and aldehyde dehydrogenase (ALDH) genes have proven to be quite
robust (Edenberg, 2007). ADH and ALDH are the primary metabolizing enzymes for alcohol.
1.4.1.3 GWAS
In this and later sections, I will only discuss GWAS that had a sample size of at least ten
thousand subjects (Altshuler et al., 2008). Four alcohol studies in the GWAS Catalog (MacArthur
et al., 2017) met these criteria. The first study found an association between the amount of alcohol
consumed and AUTS2, a gene implicated in neurodevelopment (Schumann et al., 2011). A study
of the same phenotype by the same group in a much larger sample failed to replicate the AUTS2
association but found an association with GCKR, which regulates glucose metabolism (Schumann
et al., 2016). The study claimed an association with KLB but this was based on an analysis that

17
inappropriately combined their discovery and replication samples. A study of alcohol consumption
based on the first release of data from the UK Biobank replicated the GCKR association and found
associations with ADH1B, ADH1C, ADH5, and KLB (Clarke et al., 2017). Several other novel loci
were also associated. Finally, a study of alcohol consumption in a multi-ethnic sample replicated a
number of associations from previous studies and found significant heterogeneity in genetic effects
across ethnic groups (Jorgenson et al., 2017).
1.4.2 Nicotine
1.4.2.1 Twin and family studies
Robust evidence supports the existence of substantial genetic and environmental effects on
tobacco use, including adoption studies (Osler et al., 2001; Keyes et al., 2008) and twin studies
(Table 1.1). As for alcohol, shared environmental factors appear to be significant in adolescence
but diminish in adulthood, becoming negligible for all phenotypes but regular tobacco use.
1.4.2.2 Candidate genes
CYP2A6 converts nicotine to cotinine, its primary metabolite. Individuals with mutations
in CYP2A6 that reduce its activity smoke fewer cigarettes and are more likely to quit (Tyndale
& Sellers, 2001; Ray et al., 2009). Three genes encoding for nAChR subunits cluster together on
chromosome 15: CHRNA5, CHRNA3, and CHRNB4. A number of targeted resequencing and
genotyping studies of this locus have found associations with nicotine dependence and smoking
behavior (Saccone et al., 2009; Wessel et al., 2010; Haller et al., 2012, 2014a; Olfson et al., 2016;
Thorgeirsson et al., 2016). Intriguingly, polymorphisms in this locus have also been associated with
alcohol, cocaine, and opiate dependence (Haller et al., 2014b; Sherva et al., 2010).
1.4.2.3 GWAS
The first qualifying GWAS of smoking behavior found an association between the CHRNA5-
CHRNA3-CHRNB4 cluster and nicotine dependence and cigarettes per day (CPD) (Thorgeirsson

18
et al., 2008). A later study replicated that finding and used a conditional association analysis to
demonstrate that the locus contains multiple independent signals of association (Liu et al., 2010).
A follow-up to the first study examined both smoking initiation (SI) and CPD. No associations were
found for smoking initiation but previous findings for CPD were replicated and novel associations
were found with CYP2A6, CYP2B6, and other genes encoding nAChR subunits (Thorgeirsson
et al., 2010). Another study of CPD, SI, and smoking cessation (SC) replicated previous associations
for CPD and found a novel association with EGLN2, which encodes a protein that regulates oxygen
homeostasis (Furberg et al., 2010). A number of novel associations with SI and SC were also found.
The CHRNA5-CHRNA3-CHRNB4 cluster’s association with CPD has been replicated in African
American and Hispanic samples (David et al., 2012; Saccone et al., 2018) but not in a Japanese
sample (Kumasaka et al., 2012). The association of the cluster with nicotine dependence has also
been replicated (Hancock et al., 2015).
1.4.3 Marijuana
1.4.3.1 Twin and family studies
No adoption studies have been published for marijuana use. Twin studies have found sub-
stantial environmental and genetic effects for marijuana use (Table 1.1), with common environment
playing a more significant role in adolescence. No effect of common environment was found for reg-
ular use, however Stallings et al. (2014) did not include a meta-analysis for adult or adolescent
regular marijuana use, so these estimates are based on a single study.
1.4.3.2 Candidate genes
I have found no replicated candidate gene studies for marijuana use or dependence.
1.4.3.3 GWAS
Two GWAS of marijuana initiation found no significant associations (Verweij et al., 2013;
Stringer et al., 2016). A GWAS of cannabis dependence symptom count found several significant

19
associations (Sherva et al., 2016).
1.4.4 Shared liability
Most substance users use more than one substance (Glantz & Leshner, 2000). Polysubstance
use is more common in adolescents than adults (Young et al., 2002), a fact that may be related
to the greater role of common environmental variance in adolescent substance use. Twin studies
have found evidence for moderate to substantial genetic correlations between use and dependence
phenotypes across substances (Madden & Heath, 2002; Young et al., 2006; Kendler et al., 2007),
consistent with a model where both general and substance-specific genetic factors influence sub-
stance use. One theory that seeks to explain these findings holds that a general tendency to
behavioral disinhibition leads to substance abuse and dependence, problem behavior, and exter-
nalizing psychopathology. This theory is supported by the discovery of a single, highly-heritable
factor underlying substance dependence, antisocial behavior, conduct disorder, and the personality
construct of constraint (Krueger et al., 2002).

Chapter 2
A rare variant association study of alcohol and tobacco use
2.1 Abstract
Background: Smoking and alcohol use behaviors in humans have been associated with
common genetic variants within multiple genomic loci. Investigation of rare variation within these
loci holds promise for identifying causal variants impacting biological mechanisms in the etiology of
disordered behavior. Microarrays have been designed to genotype rare nonsynonymous and putative
loss of function variants. Such variants are expected to have greater deleterious consequences on
gene function than other variants, and significantly contribute to disease risk.
Methods: In the present study, we analyzed ∼250,000 rare variants from 17 independent
studies. Each variant was tested for association with five addiction-related phenotypes: cigarettes
per day, pack years, smoking initiation, age of smoking initiation, and alcoholic drinks per week.
We conducted single variant tests of all variants, and gene-based burden tests of nonsynonymous
or putative loss of function variants with minor allele frequency less than 1%.
Results: Meta-analytic sample sizes ranged from 70,847 to 164,142 individuals, depending
on the phenotype. Known loci tagged by common variants replicated but there was no robust
evidence for individually associated rare variants, either in gene based or single variant tests.
Using a modified method-of-moment approach, we found that all low frequency coding variants, in
aggregate, contributed 1.7% to 3.6% of the phenotypic variation for the five traits (p < 0.05).
Conclusions: The findings indicate that rare coding variants contribute to phenotypic vari-
ation, but that much larger samples and/or denser genotyping of rare variants will be required to

21
successfully identify associations with these phenotypes, whether individual variants or gene-based
associations.
2.2 Introduction
Tobacco and alcohol use together account for more morbidity and mortality in Western
cultures than any other single risk factor or health outcome (Ezzati et al., 2002). These preventable
and modifiable behaviors are heritable (Polderman et al., 2015), have been associated previously
in human and model organism research with multiple common genetic variants (Bierut & Stitzel,
2014; Eng et al., 2007; Furberg et al., 2010; Luczak et al., 2006; Saccone et al., 2010), and most
prominently feature genes involved in alcohol/nicotine metabolism and nicotinic receptors.
Advances in sequencing technology have led to cost-effective “exome arrays,” which affordably
genotype a few hundred thousand rare (minor allele frequency [MAF] < 1%), putatively functional
exonic variants. Compared to common SNPs (MAF > 1%) used in genome-wide association studies
(GWAS), rare exonic variants may have greater potential to elucidate the biological mechanisms
of addiction and other complex traits (Lek et al., 2016; Minikel et al., 2016). Loss of function
(LoF) variants result in the loss of normal function of a protein, and may have greater phenotypic
impact than other variants that do not have obvious biological consequences (Marouli et al., 2017;
Sveinbjornsson et al., 2016). One well-known example is rare LoF mutations in PCSK9 that greatly
reduce risk of cardiovascular disease with no apparent negative effects, encouraging the development
of a new class of PCSK9 inhibitor drugs (Cohen et al., 2006; Hall, 2013).
The analysis of any rare event, including rare genetic variants, presents analytical challenges.
First, statistical power is a function of MAF, such that rare variants of small to moderate effect
require very large samples to achieve adequate statistical power (Auer et al., 2016). Statistical
association techniques have been developed to mitigate this issue, including tests that aggregate in-
formation across many low-frequency variants (Lee et al., 2014). These “burden” tests can improve
power under certain assumptions, such as that a large proportion of the aggregated variants are
independently associated with the phenotype of interest. Here, we use novel methods to implement

22
a variety of genetic association tests, in the largest sample currently available, to test the effect of
rare and low-frequency exonic variants on tobacco and alcohol use behaviors.
The vast majority of existing addiction-related rare variant studies use targeted sequencing of
known addiction-associated loci to discover and test for association. This has led to intriguing new
leads, especially within nicotinic receptor gene clusters (Haller et al., 2012, 2014b; McClure-Begley
et al., 2014; Olfson et al., 2016; Piliguian et al., 2014; Thorgeirsson et al., 2016; Wessel et al., 2010;
Xie et al., 2011; Yang et al., 2015; Zuo et al., 2016) and alcohol metabolism genes (Peng et al.,
2014; Way et al., 2015; Zuo et al., 2013b) for alcohol and nicotine dependence. This strategy has
also produced rare variant associations with alcohol dependence in genes not previously implicated
in addiction. In one case, burden testing was used to find an association with rare variants in
SERINC2 (Zuo et al., 2013b). In another case, a burden test across PTP4A1, PHF3, and EYS
showed an association with alcohol dependence (Zuo et al., 2013a). Single variant tests did not
reach significance after multiple-testing corrections in either case. In part due to the nature of
burden tests, especially when conducted across multiple genes, these findings do not have simple
biological interpretations, and no rare variant results have been replicated.
Some studies also leverage information about predicted functional consequences of rare muta-
tions to increase the power of association analyses. For example, one study of nicotine dependence
found significant rare single-variant associations in CHRNB4, but only when variants were weighted
by their effect on the cellular response to nicotine and acetylcholine (Haller et al., 2014a). Such
positive findings benefit from replication, which has not always been straightforward. For example,
all rare variant associations in addiction are, to our knowledge, candidate gene analyses with type
I error thresholds based only on tests within that region. Historically, such analyses have tended
to produce overly optimistic estimates of the number of associated loci (Duncan & Keller, 2011).
Genome-wide analyses with more conservative type I error thresholds have reported null rare vari-
ant findings across an array of phenotypes relevant to addiction (Vrieze et al., 2014a,b,c). Precisely
because genome-wide analyses are conducted on many variants across the genome, they are in
principle able to discover novel rare variant associations within new or known loci. One way to
23
improve power in genome-wide analyses is through genetic association meta-analysis, which entails
the aggregation of results across many studies to achieve large sample sizes. We present here such
a meta-analysis, aggregating studies with rare variant genotype arrays and measured alcohol and
nicotine use, to arrive at a highly powered test of the hypothesis that rare exonic variants affect
addiction-related outcomes.
In addition to single variant and gene-level tests, we also conducted tests of the contribution of
rare nonsynonymous variants to the heritability of our alcohol and tobacco use phenotypes. Twin
studies, as well as studies of the aggregate effects of common variants, have found both alcohol
use and tobacco use to be heritable behaviors (Hicks et al., 2011; Maes et al., 2004; Swan et al.,
1990; Vink et al., 2005; Vrieze et al., 2014a, 2013). Research on the aggregate contribution of rare
variants, however, has been scarce, with previous work on related phenotypes in smaller samples
failing to detect aggregate effects for smoking and alcohol consumption (Vrieze et al., 2014c). In this
study, we implemented a novel method-of-moments approach to analyze heritability and genetic
correlations due to variants genotyped on the exome array. We used meta-analytic summary
statistics to quantify the contribution to heritability of variants in various functional categories
and frequency bins, estimated the genetic correlation between smoking and drinking traits, and
evaluated the contribution of rare coding variants to the phenotypic variation of smoking and
alcohol use behavior.
2.3 Methods
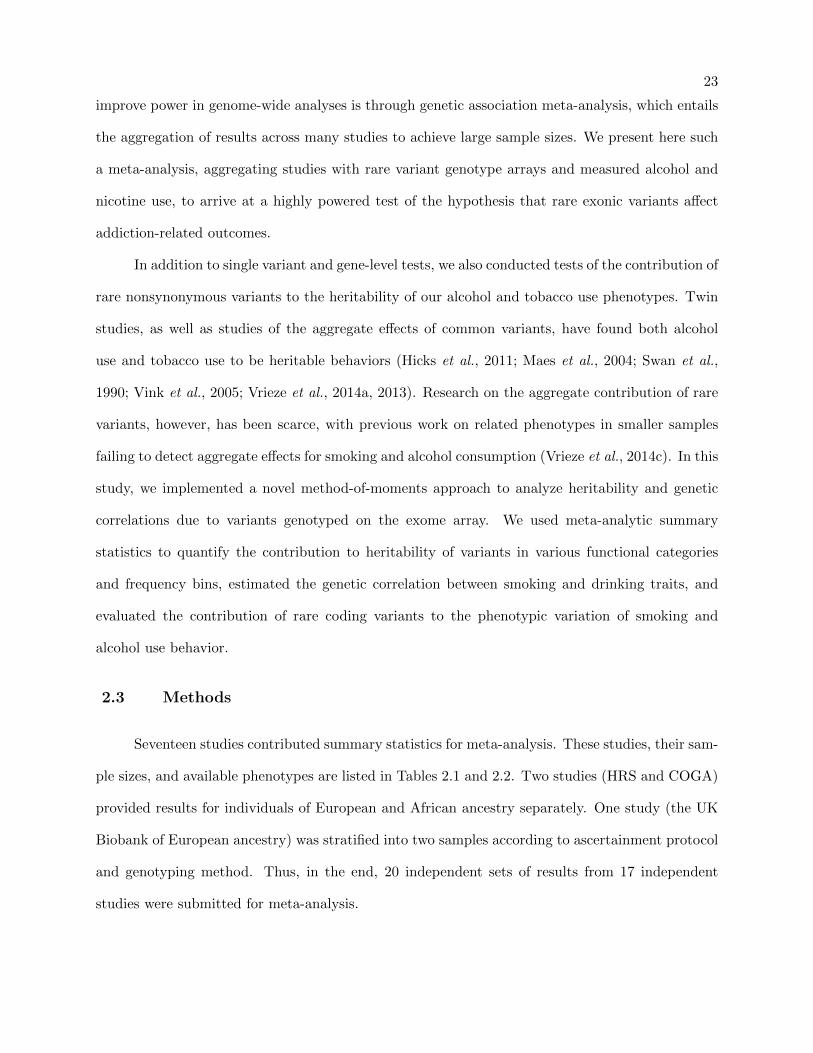
Seventeen studies contributed summary statistics for meta-analysis. These studies, their sam-
ple sizes, and available phenotypes are listed in Tables 2.1 and 2.2. Two studies (HRS and COGA)
provided results for individuals of European and African ancestry separately. One study (the UK
Biobank of European ancestry) was stratified into two samples according to ascertainment protocol
and genotyping method. Thus, in the end, 20 independent sets of results from 17 independent
studies were submitted for meta-analysis.

24
2.3.1 Ancestry
All analyses were stratified by ancestry. Eighteen datasets were on individuals of European
ancestry and two datasets on individuals of African ancestry.
2.3.2 Phenotypes
Phenotypes were selected to be relevant to prior GWAS of smoking and alcohol use, com-
mon in psychological, medical, and epidemiological data sets, and known to be correlated with
measures of substance dependence. Five phenotypes were selected based on their inclusion in pre-
vious successful GWAS studies (Furberg et al., 2010; Jorgenson et al., 2017; Schumann et al., 2016;
Thorgeirsson et al., 2010) and availability among large exome chip studies.
(1) Cigarettes per day. The average number of cigarettes smoked in a day among current and
former smokers. Studies with binned responses retained their existing bins. Studies that
recorded an integer value binned responses into one of four categories: 1 = 1–10, 2 = 11–20,
3 = 21–30, 4 = 31 or more. Anyone reporting 0 cigarettes per day was coded as missing.
This phenotype is a component of commonly used measures of nicotine dependence such
as the Fagerstrom Test for Nicotine Dependence.
(2) Pack years. Defined in the same way as cigarettes per day but not binned, divided by
20 (cigarettes in a pack), and multiplied by number of years smoking. This yields a mea-
sure of total overall exposure to tobacco and is relevant to cancer and chronic obstructive
pulmonary disease risk.
(3) Age of initiation of smoking. A measure of early cigarette use. Defined as the age at which
a participant first started smoking regularly.
(4) Smoking initiation. A binary variable of whether the individual had ever been a regular
smoker (1) or not (0), and often defined as having smoked at least 100 cigarettes during
one’s lifetime.

25
(5) Drinks per week. A measure of drinking frequency/quantity. The average number of drinks
per week in current or former drinkers.
2.3.3 Genotypes
Fifteen of the seventeen studies were genotyped with the Illumina HumanExome BeadChip,
which contains ∼250,000 low-frequency nonsynonymous variants, variants from the GWAS cat-
alog, and a small number of variants selected for other purposes. Two studies were genotyped
on the Illumina Human Core Exome, which includes an additional ∼250,000 tag SNPs. Finally,
the present study used the initial release of 150,000 UK Biobank participants, which comprised
two cohorts: 1) the UK BiLEVE cohort of ∼50,000 heavy and never smokers genotyped on the
UK BiLEVE array and 2) ∼100,000 participants genotyped on the UK Axiom array. These ar-
rays are highly similar and described elsewhere (http://www.ukbiobank.ac.uk/scientists-3/
uk-biobank-axiom-array). They both include >800,000 variants including ∼630,000 genome-
wide tagging markers, ∼110,000 rare coding variants that are largely a subset of variants also
genotyped on the Illumina HumanExome Beadchip, and an additional ∼107,000 variants chosen
for the study of specific medical conditions.
2.3.4 Generation of summary association statistics
Twenty sets of results from 17 independent studies (Table 2.1) with smoking and drinking
phenotypes were included in the discovery phase. Summary statistics were adjusted by local ana-
lysts for age, sex, any study-specific covariates, and ancestry principal components (see Table 2.2 for
genomic controls). For studies with related individuals (see Table 2.1), relatedness was accounted
for in linear mixed models using empirically estimated kinships from common SNPs (Kang et al.,
2010). Residuals were inverse-normalized to help ensure well-behaved test statistics for rare variant
tests.
Details on phenotype extraction and GWAS in the UK Biobank sample are in Appendix B.

26
Tab
le2.
1:P
arti
cip
atin
gco
hor
td
escr
ipti
on
Stu
dy
ab
bre
via
tion
Fu
llst
ud
yn
am
eD
esig
nA
rray
pla
tform
Ass
oci
ati
on
covari
ate
s
AR
ICA
ther
osc
lero
sis
Ris
kin
Com
mu
nit
ies
Com
mu
nit
ysa
mp
leof
old
erad
ult
sIl
lum
ina
Hu
man
Exom
e
CO
GA
Collab
ora
tive
Stu
dy
on
the
Gen
etic
sof
Alc
oh
oli
smF
am
ily
stu
dy
of
alc
oh
olism
Illu
min
aH
um
an
Core
Exom
eaA
ge,
age2
,se
x,
age*
sex,
bir
thco
hort
,D
SM
5alc
oh
ol
dep
end
ence
FT
CN
AG
-FIN
,F
inn
Tw
in12,
Fin
nT
win
16,
FIT
SA
Pop
ula
tion
-base
dtw
insa
mp
les
from
the
Old
eran
dY
ou
nger
Fin
nis
hT
win
Coh
ort
s
Illu
min
aH
um
an
Core
Exom
eA
ge,
age2
,se
x,
curr
ent
or
form
ersm
oker
(for
cigare
ttes
per
day),
yea
rof
bir
th,
coh
ort
statu
s,B
MI
FU
SIO
NF
inla
nd
-Un
ited
Sta
tes
Inves
tigati
on
of
NID
DM
Gen
etic
s
Typ
e-2
dia
bet
esca
se-c
ontr
ol
Illu
min
aH
um
an
Exom
eA
ge,
age2
,se
x,
curr
ent
v.
form
ersm
oker
(for
cigare
ttes
per
day),
hei
ght
an
dw
eight
(for
dri
nks
per
wee
k)
GE
CC
OG
enet
ics
an
dE
pid
emio
logy
of
Colo
rect
al
Can
cer
Con
sort
ium
Colo
rect
al
can
cer
case
-contr
ol
Illu
min
aH
um
an
Exom
e—
HR
SH
ealt
han
dR
etir
emen
tS
tud
yN
ati
on
al
rep
rese
nta
tive
sam
ple
of
old
erad
ult
sIl
lum
ina
Hu
man
Exom
eA
ge,
age2
,se
x,
age*
sex,
bir
thyea
r,P
Cs
1–4
(Eu
rop
ean
ance
stry
)or
PC
s1–10
(Afr
ican
an
cest
ry),
curr
ent
v.
form
ersm
oker
(for
smokin
gou
tcom
es),
wei
ght,
bm
i,b
mi*
gen
der
,an
dcu
rren
tv.
form
erd
rin
ker
(for
dri
nkin
gou
tcom
es)
ID1000
—N
ati
on
al
rep
rese
nta
tive
sam
ple
of
you
ng
ad
ult
sIl
lum
ina
Hu
man
Exom
eA
ge,
age2
,se
x,
age*
sex,
PC
s1–10,
curr
ent
v.
form
ersm
oker
(for
cigare
ttes
per
day,
pack
yea
rs);
bm
i,w
eight,
hei
ght,
bm
i*se
xfo
r(f
or
dri
nks
per
wee
k)
ME
CM
ult
i-E
thn
icC
oh
ort
—Il
lum
ina
Hu
man
Exom
e—
ME
TS
IMM
etab
oli
cS
yn
dro
me
inM
en—
Illu
min
aH
um
an
Exom
eS
ex,
age,
age2
,cu
rren
tv.
form
ersm
oker
(for
cigare
ttes
per
day),
hei
ght
an
dw
eight
(for
dri
nks
per
wee
k)
MH
IM
ontr
eal
Hea
rtIn
stit
ute
Com
mu
nit
ysa
mp
leof
ad
ult
sam
on
gvis
itors
,p
ati
ents
an
dem
plo
yee
sof
the
MH
I.
Illu
min
aH
um
an
Exom
eS
ex,
age,
age2
,P
Cs
1–10,
curr
ent
v.
form
ersm
oker
statu
s(f
or
cigare
ttes
per
day),
hei
ght
an
dw
eight
(for
dri
nks
per
wee
k) Continued
onnextpa
ge

27
Tab
le2.
1–
Con
tin
ued
from
pre
viou
spa
ge
Stu
dy
ab
bre
via
tion
Fu
llst
ud
yn
am
eD
esig
nA
rray
pla
tform
Ass
oci
ati
on
covari
ate
s
MC
TF
RM
inn
esota
Cen
ter
for
Tw
inan
dF
am
ily
Res
earc
hC
om
mu
nit
y-b
ase
dfa
mily
coh
ort
Illu
min
aH
um
an
Exom
eA
ge,
sex,
pare
nt-
child
gen
erati
on
NA
GO
ZA
LC
——
Illu
min
aH
um
an
Exom
e—
NE
SC
OG
Net
her
lan
ds
stu
dy
of
Cogn
itio
n,
Envir
on
men
t,an
dG
enes
Nati
on
al
rep
rese
nta
tive
sam
ple
of
ad
ult
sIl
lum
ina
Hu
man
Exom
eA
ge,
age2
,se
x,
age*
sex,
PC
s1–10;
curr
ent
v.
form
ersm
oker
(for
cigare
ttes
per
day,
pack
yea
rs);
bm
i,w
eight,
hei
ght,
bm
i*se
x(f
or
dri
nks
per
wee
k).
Sard
iNIA
—C
om
mu
nit
y-b
ase
dfa
mily
coh
ort
Illu
min
aH
um
an
Exom
eA
ge,
age2
,se
x,
curr
ent
v.
form
ersm
oker
(cig
are
ttes
per
day),
hei
ght
an
dw
eight
(dri
nks
per
wee
k)
Tw
insU
K—
Tw
inco
hort
Illu
min
aH
um
an
Exom
e—
WH
IW
om
ens
Hea
lth
Init
iati
ve
Com
ple
xd
esig
nco
nsi
stin
gof
clin
ical
tria
lsan
dob
serv
ati
on
al
coh
ort
Illu
min
aH
um
an
Exom
eA
ge,
age2
,se
x,
EV
1,
EV
2,
EV
3(a
llp
hen
oty
pes
);cu
rren
tv.
form
ersm
okin
g(f
or
cigare
ttes
per
day),
hei
ght
an
dw
eight
(for
dri
nks
per
wee
k)
UK
Bio
Ban
k(B
iLE
VE
)—
Com
mu
nit
ysa
mp
leof
old
erad
ult
s,se
lect
edfo
rh
eavy
an
dn
on
-sm
oker
sU
KB
iLE
VE
Age,
age2
,se
x,
curr
ent
v.
form
ersm
oker
(for
cigare
ttes
per
day),
PC
s1–15,
hei
ght,
an
dw
eight
(for
dri
nkin
g)
UK
Bio
Ban
k(A
xio
m)
—C
om
mu
nit
ysa
mp
leof
old
erad
ult
s,th
ose
not
sele
cted
for
BiL
EV
EU
KB
iob
an
kA
xio
mA
ge,
age2
,se
x,
curr
ent
v.
form
ersm
oker
(for
cigare
ttes
per
day),
PC
s1–15,
hei
ght,
an
dw
eight
(for
dri
nkin
g)
aT
he
exom
earr
ay
gen
oty
pin
gin
CO
GA
was
per
form
edin
thre
eb
road
ergro
up
sco
mp
rise
dof
1059
fou
nd
ersu
bje
cts
from
118
exte
nd
edE
uro
pea
nA
mer
ican
fam
ilie
s,626
sub
ject
sfr
om
40
exte
nd
edA
fric
an
Am
eric
an
fam
ilie
san
d2815
lon
git
ud
inally
asc
erta
ined
sub
ject
sof
mix
edet
hn
icit
ies.
Th
e1059
sub
ject
sin
118
fam
ilie
sw
ere
sele
cted
usi
ng
the
Exom
ePic
kp
rogra
m(h
ttp
://gen
om
e.sp
h.u
mic
h.e
du
/w
iki/
Exom
ePic
ks)
that
use
sth
ekin
ship
info
rmati
on
tosu
gges
tsin
div
idu
als
tob
ese
qu
ence
din
ala
rge
ped
igre
e.O
ut
of
2815
lon
git
ud
inally
asc
erta
ined
sub
ject
s538
sub
ject
sw
ere
als
oyou
nger
rela
tives
of
1059
EA
sub
ject
sfr
om
118
exte
nd
edfa
milie
s.T
her
ew
ere
aro
un
d726
sub
ject
sin
thes
eE
Afa
milie
sth
at
wer
en
ot
gen
oty
ped
usi
ng
the
exom
earr
ay.
All
of
EA
sub
ject
sfr
om
118
fam
ilie
sw
ere
pre
vio
usl
ygen
oty
ped
usi
ng
Illu
min
aH
um
an
Om
niE
xp
ress
arr
ay
12.V
I(I
llu
min
a,
San
Die
go,
CA
,U
SA
).T
his
gave
us
an
op
port
un
ity
toin
fer
the
den
seS
NP
sin
un
-gen
oty
ped
sub
ject
su
sin
gid
enti
tyby
des
cent
info
rmati
on
gen
erate
dth
rou
gh
the
spars
earr
ay
usi
ng
pu
blicl
yavailab
lelo
ng
ran
ge
ph
asi
ng
pro
gra
mC
hro
moP
hase
(Daet
wyle
ret
al,
2011).
We
ph
ase
dgen
oty
ped
sub
ject
sin
each
ped
igre
efo
rea
chch
rom
oso
me
by
com
bin
ing
the
spars
ean
dd
ense
gen
oty
pes
an
du
sed
this
IBD
info
rmati
on
tofi
llin
the
mis
sin
ggen
oty
pes
acc
ord
ing
toru
les
of
Men
del
ian
segre
gati
on
.T
he
ph
ase
of
un
am
big
uou
sS
NP
sw
ere
gen
erate
du
sin
gth
ep
op
ula
tion
freq
uen
cyan
dw
ere
imp
ute
dacc
ord
ing
top
op
ula
tion
base
dim
pu
tati
on
.U
sin
gth
isop
tion
we
wer
eab
leto
gues
s>
98%
mis
sin
gh
ap
loty
pes
inall
of
the
sub
ject
s.A
fter
infe
rp
roce
ssw
ere
moved
the
vari
ants
that
did
n’t
follow
the
rule
sof
Men
del
ian
segre
gati
on
.

28
Quality control of per-study summary statistics included evaluation and correction of strand
flips and allele flips through systematic comparison of alleles and allele frequencies against reference
datasets ExAC v2.0, 1000 Genomes Phase 3, and dbSNP. Variants with call rates <0.9, and Hardy
Weinberg p < 1 × 10⁻⁷, and polymorphic in <3 studies, were also removed. The latter filter was
meant to avoid findings that could not be broadly replicated across the 17 studies.
Variants were annotated against RefSeq 1.9 (Pruitt et al., 2014). The allelic spectrum of all
nonsynonymous, start loss/gain, stop loss/gain, or splice acceptor/donor is displayed in Figure 2.1
for cigarettes per day, stratified by whether the variant exists only in the UK Biobank, only in
studies genotyped with the Illumina exome chip, or in both. More details on the allelic spectra
within functional classes are available in Table 2.3 and Figure 2.2.
2.3.5 Meta-analysis
We performed meta-analysis in rareMETALS version 5.8 using the Mantel-Haenszel method
(Liu et al., 2014). For gene-level burden tests, we selected variants predicted to be nonsynonymous,
start loss, start gain, stop loss, stop gain, or splice donor/acceptor within each gene from RefSeq 1.9
(Pruitt et al., 2014). Two complementary gene-level association tests were performed: the sequence
kernel association test (SKAT; Lee et al., 2012; Wu et al., 2011) with MAF cutoff 1% and a variable
MAF threshold test (VTCMC; Price et al., 2010) with a maximum MAF = 1%. We chose variants
with MAF ≤ 1% as we were interested in the contribution of variants with a frequency lower than
that which has been reliably imputed and tested in past GWAS meta-analyses. Exceedingly rare
variants, with minor allele counts less than five, were excluded from single variant analyses due to
extremely low expected power. These rare variants were included in all gene-based tests.
There exist known genetic associations between common variants and smoking or drinking
phenotypes, including variants within the nicotinic receptor gene cluster on chromosome 15 with
cigarettes per day (Furberg et al., 2010; Saccone et al., 2010); CYP2A6 and CYP2B6 with cigarettes
per day (Thorgeirsson et al., 2010); AUTS2, KLB, ADH1B, ALDH2, and GCKR with alcohol use
(Jorgenson et al., 2017; Schumann et al., 2016); and NCAM1 and TEX41 with smoking initiation

29
Table 2.2: Per-study, per-phenotype sample size (N) and genomic control (GC).
Cigarettes perday
Pack yearsAge of initiation
of smokingSmokinginitiation
Drinks per week
Study N GC N GC N GC N GC N GC
ARIC 5381 1.063 5304 1.045 5407 1.096 8970 1.064 5966 1.000COGA (EA) 1465 0.895 1435 1.050 1638 0.923 — — 3398 0.953COGA (AA) 476 0.940 457 0.988 494 0.919 — — 1182 0.953FTC 819 1.048 767 1.012 769 1.059 1467 1.063 1242 0.995FUSION 568 1.040 530 1.042 562 1.018 1153 1.016 830 0.997GECCO 2916 1.018 2876 1.028 — — 6459 0.993 2077 0.967HRS (EA) 3303 0.988 3303 0.992 3303 0.998 6393 1.096 4507 0.988HRS (AA) 961 1.029 961 1.016 961 1.010 1746 1.037 980 0.987ID1000 366 0.974 373 1.007 — — 803 0.994 740 0.985MEC 1087 0.979 1082 0.963 1086 0.999 1903 0.973 1271 1.064METSIM 1374 1.028 1370 1.016 1370 1.026 8146 1.044 6303 1.099MHI 4391 1.011 4400 1.016 4420 1.018 6820 1.025 4205 1.022MCTFR 2043 0.991 — — — — — — 4757 0.998NAGOZALC 671 1.006 646 1.006 647 1.011 1038 1.004 663 0.994NESCOG 217 1.004 220 1.000 — — 486 1.038 437 0.980SardiNIA 1969 1.009 1967 1.064 1967 1.014 5069 1.082 2516 1.142TwinsUK 358 1.039 358 1.010 358 1.006 878 0.971 603 0.989WHI 6246 1.031 6236 1.006 — — — — 7213 0.982UK BiLEVE 19357 1.020 19357 1.008 19247 1.004 39480 1.106 30214 1.024UK Axiom 21525 1.020 21267 1.007 22387 1.025 73331 1.089 59999 1.045
Note: EA=European ancestry, AA=African ancestry. Study abbreviations are defined inTable 2.1.
Table 2.3: Marker number by MAF and functional category for cigarettes per day (results for otherphenotypes will differ slightly).
Functional category MAF (%)(0, .01) [.01, .1) [.1, 1) [1, 10) [10, 50) All
Nonsynonymous 50548 81949 31584 11271 10189 185541Stop Gain 2007 1314 339 124 74 3858Stop Loss 81 84 26 7 27 225Start Gain 0 0 1 1 0 2Start Loss 61 132 58 24 17 292Essential Splice 708 557 182 60 61 1568Normal Splice 7 86 177 382 546 1218Synonymous 2232 3750 3598 3830 5469 18879Intron 384 3451 36391 111995 163395 315616Intergenic 514 4825 51451 163628 257097 477515Other 98 488 2023 5529 8905 17043
Total 56660 96636 125830 296851 445780 1021757

30
Figure 2.1: Distribution of nonsynonymous and loss of function variant allele frequencies in theIllumina exome array and the UK Biobank arrays, generated from the results for cigarettes perday. (Allelic spectra for other phenotypes may differ slightly). Note there are only 241 variantsthat were present only in the UK Biobank and not on the Illumina Exome Chip; these 241 variantsare not displayed in the figure. MAF = minor allele frequency estimated in the meta-analysis.

31
Figure 2.2: Distribution of variant allele frequencies in the Illumina exome array and the UKBiobank arrays. This figure was generated from results for cigarettes per day. (Allelic spectra forvariants from analyses of other phenotypes will differ slightly.) MAF = Minor allele frequency.Note: The vast majority of common variants (MAF > 5× 10⁻²) attributed to the Illumina exomechip are from a single study (FTC) that used the Illumina HumanCore Exome, which includes250,000 common GWAS tag SNPs.

32
(Wain et al., 2015). We conducted sequential forward selection association tests, as implemented in
rareMETALS, for rare variants within these regions, controlling for any common variant associations
in these regions.
Association testing was done in stages. First, we tested common variants within all known
loci associated with these phenotypes, as listed above. To these variants we applied the standard
genome-wide significance threshold of p < 5× 10⁻⁸. Second, for rare variants with MAF < 1% and
minor allele count ≥5, we applied a Bonferroni correction for the number of such variants tested,
resulting in p-value thresholds from 2.1 × 10⁻⁷ to 2.2 × 10⁻⁷ depending on the phenotype. This
threshold was applied to both marginal (unconditional) analyses and forward selection conditional
analyses of rare variants within known loci.
Third and finally, for each known and previously validated locus associated with these and
related traits, we explored a relaxed multiple-testing threshold based only on the number of rare
variants within a 1MB region around the most highly significant (usually common variant) associa-
tion within that region. Each locus-wide p-value threshold is provided in Table 2.4. This approach
is meant to mimic the typical candidate gene or targeted sequencing approach, where one or a few
known loci are analyzed separately from the rest of the genome. While this threshold is overly
liberal, it allows a more direct comparison between our results and existing publications of rare
variants described in the introduction.
Finally, we attempted to replicate previous rare variant associations referenced in the intro-
duction and listed in Table 2.5. The prior studies were of alcohol or nicotine dependence. We
attempted replication in our phenotypes for any single variant when that variant was included on
the exome array (5 of 23 variants were available) and, if not, we took the variant with the smallest
p-value within the same gene as the original finding (16 of remaining 18 variants), or any gene-based
burden test for which content existed on the array (27 of 27 prior associated genes had content on
the array). We applied a liberal threshold that corrected only for the number of tests conducted
for this replication exercise (0.05/52 = 0.00096).

33
Tab
le2.4
:S
ign
ifica
nt
resu
lts
for
com
mon
an
dra
re(M
AF<
1%)
vari
ants
.U
nco
nd
itio
nal
resu
lts
and
con
dit
ion
alre
sult
sb
ased
onst
epw
ise
forw
ard
sele
ctio
nare
show
n.
Ph
enoty
pe
Kn
ow
nlo
cus
Ch
rP
os
rsID
Ref
Alt
Nea
rest
gen
eA
nn
ot.
Sam
ple
size
No.
of
stu
die
sA
LT
AF
%U
nco
nd
itio
nal
ass
oci
ati
on
test
s
Ste
pw
ise
forw
ard
sele
ctio
n
con
dit
ion
al
test
s
Bet
a(S
E)
p-v
alu
eC
on
d.
vari
ant(
s)C
on
d.
bet
a(S
E)
Con
d.
p-v
alu
eL
ocu
s-w
ide
Bon
ferr
on
i
Cig
are
ttes
per
day
CHRNA5-
CHRNA3-
CHRNB4
15
78806023
rs8034191
aT
CAGPHD1
Intr
on
75,4
93
20
34.1
.09
(.005)
3.7
E-5
7n
/a
15
78896547
rs938682
GA
CHRNA3
Intr
on
75,4
93
20
77.6
.09
(.006)
2.9
E-4
5rs
8034191
.06
(.006)
6.3
E-1
83.1
E-5
—17
37814687
rs36015615
bG
ASTARD3
Non
syn
on
30,0
30
14
0.0
31.2
9(.
224)
1.6
E-8
n/a
Pack
yea
rs
CHRNA5-
CHRNA3-
CHRNB4
15
78806023
rs8034191
aT
CAGPHD1
Intr
on
72,9
09
19
34.0
.08
(.006)
6.6
E-4
1n
/a
15
78896547
rs938682
GA
CHRNA3
Intr
on
72,9
09
19
77.6
.05
(.006)
1.4
E-3
115:7
8806023
.05
(.006)
4.1
E-1
21.1
E-4
CYP2A6
19
41302706
rs7937
CT
RAB4B
UT
R3
41,2
70
356.1
.40
(.007)
1.6
E-8
n/a
Dri
nks
per
wee
k
ADH1B-
ADH1C
4100239319
rs1229984
TC
ADH1B
Non
syn
on
105,5
67
998.9
.23
(.016)
4.2
E-4
4n
/a
GCKR
227730940
rs1260326
TC
GCKR
Non
syn
on
139,1
03
20
62.1
.03
(.004)
4.1
E-1
6n
/a
aT
his
vari
ant
isa
pro
xy
for
the
know
nco
mm
onnon
synon
ym
ous
SN
Prs
16969
968,
aknow
nca
usa
lva
rian
taff
ecti
ng
hea
vin
ess
ofsm
okin
g.In
our
analy
ses,
rs16
9699
68
had
the
seco
nd-m
ost
sign
ifica
nt
asso
ciat
ion
p-v
alue,
afte
rrs
8034
191.
brs
360156
15
did
not
replica
tein
two
addit
ional
dat
aset
s.See
mai
nte
xt.
Not
e:A
llp-v
alu
eare
corr
ecte
dfo
rge
nom
icin
flat
ion
fact
orbas
edon
all
vari
ants
wit
hM
AC≥
5te
sted
for
that
phen
otyp
e.C
hr
=ch
rom
oso
me,
Pos
=p
osi
tion
(build
37)
,R
ef=
refe
rence
alle
leon
GR
Ch37
,A
lt=
alte
rnat
eal
lele
,N
=sa
mple
size
acro
ssal
lst
udie
sth
atgen
oty
ped
the
vari
ant,
ALT
AF
=al
lele
freq
uen
cyof
the
alte
rnat
eal
lele
esti
mate
din
the
met
a-an
alysi
s.A
llva
rian
tsth
atar
efr
omonly
2st
udie
sw
ere
uniq
ue
toth
eU
KB
ioban
kar
ray.
The
Bon
ferr
oni
p-v
alue
thre
shol
dfo
ral
llo
w-f
requen
cy(M
AF<
1%)
vari
ants
ranged
from
1.8
E-7
to1.
9E
-7,
dep
endin
gon
the
phen
otyp
e.T
he
full
set
ofsu
mm
ary
stat
isti
csan
dad
dit
ional
info
rmat
ion
abou
tea
chass
oci
ati
on,
ishost
edathttps://genome.psych.umn.edu/index.php/GSCAN
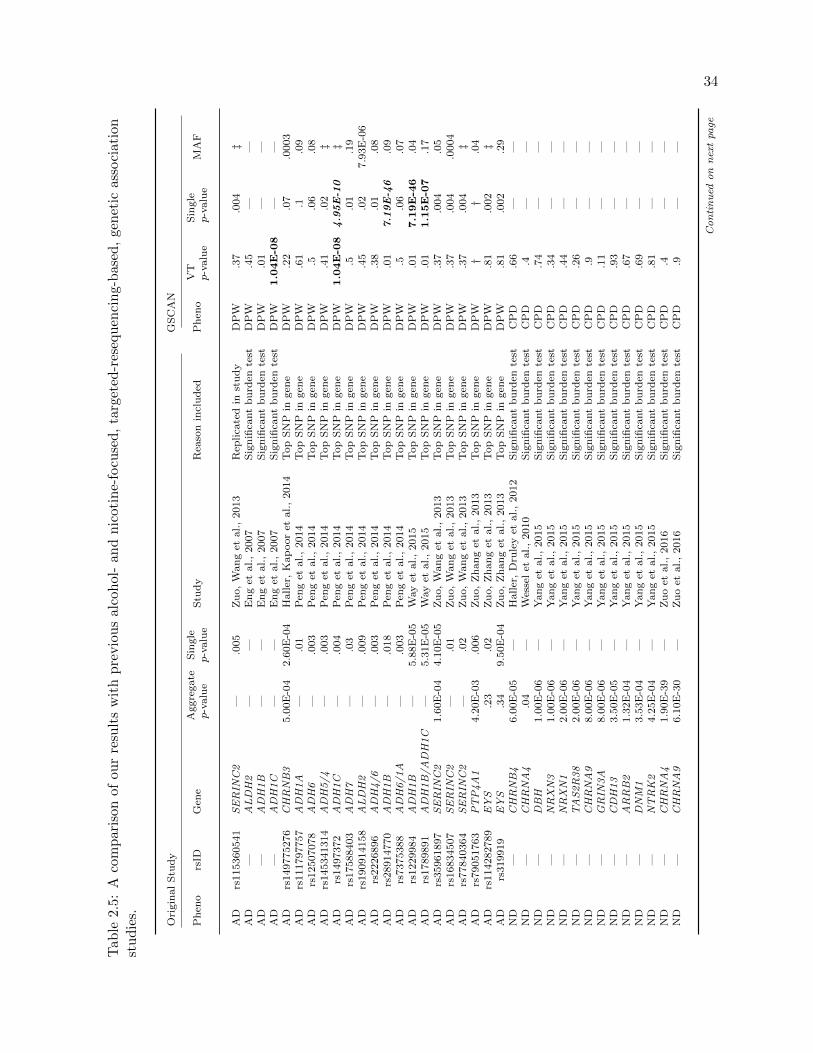
34
Tab
le2.
5:A
com
par
ison
ofou
rre
sult
sw
ith
pre
vio
us
alco
hol
-an
dn
icot
ine-
focu
sed
,ta
rget
ed-r
eseq
uen
cin
g-b
ase
d,
gen
etic
ass
oci
ati
on
stu
die
s.
Ori
gin
al
Stu
dy
GS
CA
N
Ph
eno
rsID
Gen
eA
ggre
gate
p-v
alu
eS
ingle
p-v
alu
eS
tud
yR
easo
nin
clu
ded
Ph
eno
VT
p-v
alu
eS
ingle
p-v
alu
eM
AF
AD
rs115360541
SERIN
C2
—.0
05
Zu
o,
Wan
get
al.,
2013
Rep
lica
ted
inst
ud
yD
PW
.37
.004
‡A
D—
ALDH2
——
Eng
etal.,
2007
Sig
nifi
cant
bu
rden
test
DP
W.4
5—
—A
D—
ADH1B
——
Eng
etal.,
2007
Sig
nifi
cant
bu
rden
test
DP
W.0
1—
—A
D—
ADH1C
——
Eng
etal.,
2007
Sig
nifi
cant
bu
rden
test
DP
W1.04E-0
8—
—A
Drs
149775276
CHRNB3
5.0
0E
-04
2.6
0E
-04
Haller
,K
ap
oor
etal.,
2014
Top
SN
Pin
gen
eD
PW
.22
.07
.0003
AD
rs111797757
ADH1A
—.0
1P
eng
etal.,
2014
Top
SN
Pin
gen
eD
PW
.61
.1.0
9A
Drs
12507078
ADH6
—.0
03
Pen
get
al.,
2014
Top
SN
Pin
gen
eD
PW
.5.0
6.0
8A
Drs
145341314
ADH5/4
—.0
03
Pen
get
al.,
2014
Top
SN
Pin
gen
eD
PW
.41
.02
‡A
Drs
1497372
ADH1C
—.0
04
Pen
get
al.,
2014
Top
SN
Pin
gen
eD
PW
1.04E-0
84.95E-1
0‡
AD
rs17588403
ADH7
—.0
3P
eng
etal.,
2014
Top
SN
Pin
gen
eD
PW
.5.0
1.1
9A
Drs
190914158
ALDH2
—.0
09
Pen
get
al.,
2014
Top
SN
Pin
gen
eD
PW
.45
.02
7.9
3E
-06
AD
rs2226896
ADH4/6
—.0
03
Pen
get
al.,
2014
Top
SN
Pin
gen
eD
PW
.38
.01
.08
AD
rs28914770
ADH1B
—.0
18
Pen
get
al.,
2014
Top
SN
Pin
gen
eD
PW
.01
7.19E-4
6.0
9A
Drs
7375388
ADH6/1A
—.0
03
Pen
get
al.,
2014
Top
SN
Pin
gen
eD
PW
.5.0
6.0
7A
Drs
1229984
ADH1B
—5.8
8E
-05
Way
etal.,
2015
Top
SN
Pin
gen
eD
PW
.01
7.19E-4
6.0
4A
Drs
1789891
ADH1B/ADH1C
—5.3
1E
-05
Way
etal.,
2015
Top
SN
Pin
gen
eD
PW
.01
1.15E-0
7.1
7A
Drs
35961897
SERIN
C2
1.6
0E
-04
4.1
0E
-05
Zu
o,
Wan
get
al.
,2013
Top
SN
Pin
gen
eD
PW
.37
.004
.05
AD
rs16834507
SERIN
C2
—.0
1Z
uo,
Wan
get
al.,
2013
Top
SN
Pin
gen
eD
PW
.37
.004
.0004
AD
rs77840364
SERIN
C2
—.0
2Z
uo,
Wan
get
al.,
2013
Top
SN
Pin
gen
eD
PW
.37
.004
‡A
Drs
79051763
PTP4A1
4.2
0E
-03
.006
Zu
o,
Zh
an
get
al.
,2013
Top
SN
Pin
gen
eD
PW
††
.04
AD
rs114282789
EYS
.23
.02
Zu
o,
Zh
an
get
al.,
2013
Top
SN
Pin
gen
eD
PW
.81
.002
‡A
Drs
319919
EYS
.34
9.5
0E
-04
Zu
o,
Zh
an
get
al.
,2013
Top
SN
Pin
gen
eD
PW
.81
.002
.29
ND
—CHRNB4
6.0
0E
-05
—H
aller
,D
rule
yet
al.,
2012
Sig
nifi
cant
bu
rden
test
CP
D.6
6—
—N
D—
CHRNA4
.04
—W
esse
let
al.,
2010
Sig
nifi
cant
bu
rden
test
CP
D.4
——
ND
—DBH
1.0
0E
-06
—Y
an
get
al.,
2015
Sig
nifi
cant
bu
rden
test
CP
D.7
4—
—N
D—
NRXN3
1.0
0E
-06
—Y
an
get
al.,
2015
Sig
nifi
cant
bu
rden
test
CP
D.3
4—
—N
D—
NRXN1
2.0
0E
-06
—Y
an
get
al.,
2015
Sig
nifi
cant
bu
rden
test
CP
D.4
4—
—N
D—
TAS2R38
2.0
0E
-06
—Y
an
get
al.,
2015
Sig
nifi
cant
bu
rden
test
CP
D.2
6—
—N
D—
CHRNA9
8.0
0E
-06
—Y
an
get
al.,
2015
Sig
nifi
cant
bu
rden
test
CP
D.9
——
ND
—GRIN
3A
8.0
0E
-06
—Y
an
get
al.,
2015
Sig
nifi
cant
bu
rden
test
CP
D.1
1—
—N
D—
CDH13
3.5
0E
-05
—Y
an
get
al.,
2015
Sig
nifi
cant
bu
rden
test
CP
D.9
3—
—N
D—
ARRB2
1.3
2E
-04
—Y
an
get
al.,
2015
Sig
nifi
cant
bu
rden
test
CP
D.6
7—
—N
D—
DNM1
3.5
3E
-04
—Y
an
get
al.,
2015
Sig
nifi
cant
bu
rden
test
CP
D.6
9—
—N
D—
NTRK2
4.2
5E
-04
—Y
an
get
al.,
2015
Sig
nifi
cant
bu
rden
test
CP
D.8
1—
—N
D—
CHRNA4
1.9
0E
-39
—Z
uo
etal.,
2016
Sig
nifi
cant
bu
rden
test
CP
D.4
——
ND
—CHRNA9
6.1
0E
-30
—Z
uo
etal.,
2016
Sig
nifi
cant
bu
rden
test
CP
D.9
——
Continued
onnextpa
ge

35
Tab
le2.
5–
Con
tin
ued
from
pre
viou
spa
ge
Origin
alStu
dy
GSCAN
Ph
eno
rsID
Gen
eA
ggre
gate
p-v
alu
eS
ingle
p-v
alu
eS
tud
yR
easo
nin
clu
ded
Ph
eno
VT
p-v
alu
eS
ingle
p-v
alu
eM
AF
ND
—CHRNA10
3.4
0E
-29
—Z
uo
etal.,
2016
Sig
nifi
cant
bu
rden
test
CP
D.5
7—
—N
D—
CHRNA7
6.1
0E
-27
—Z
uo
etal.,
2016
Sig
nifi
cant
bu
rden
test
CP
D.1
1—
—N
D—
CHRNB2
1.3
0E
-18
—Z
uo
etal.,
2016
Sig
nifi
cant
bu
rden
test
CP
D.8
7—
—N
D—
CHRNE
4.9
0E
-15
—Z
uo
etal.,
2016
Sig
nifi
cant
bu
rden
test
CP
D.8
4—
—N
D—
CHRNA1
1.2
0E
-14
—Z
uo
etal.,
2016
Sig
nifi
cant
bu
rden
test
CP
D.7
2—
—N
D—
CHRNA2
5.2
0E
-13
—Z
uo
etal.,
2016
Sig
nifi
cant
bu
rden
test
CP
D.2
1—
—N
Drs
16969968
CHRNA5
.01
.003
Olf
son
etal.,
2016
Top
SN
Pin
gen
eC
PD
.13
2.14E-5
7.3
4N
Drs
2229961
CHRNA5
—.0
3O
lfso
net
al.,
2016
Top
SN
Pin
gen
eC
PD
.13
7.08E-0
4.0
2N
Drs
56175056
CHRNA4
—1.2
0E
-04
Th
org
eirs
son
etal.,
2016
Top
SN
Pin
gen
eC
PD
.49.42E-0
6.0
003
ND
rs2072661
CHRNB2
.002
.002
Wes
sel
etal.,
2010
Top
SN
Pin
gen
eC
PD
.87
.0004
.24
†Th
ege
ne
was
not
pre
sent
inth
eG
SC
AN
dat
aset
.‡
Th
eva
rian
tw
asn
otp
rese
nt
inth
eH
RC
and
gnom
AD
dat
aset
s.
Th
em
inor
alle
lefr
equ
enci
es(M
AF
s)w
ere
der
ived
from
the
Hap
loty
pe
Ref
eren
ceC
onso
rtiu
m(H
RC
)d
ata
set,
wit
hou
tth
e1000
Gen
omes
sam
ple
.V
aria
nts
not
pre
sent
inth
eH
RC
dat
aset
wer
elo
oked
up
inth
egn
omA
Db
row
ser,
an
dth
eE
uro
pea
nM
AF
was
list
ed,
ifav
aila
ble
.A
llsi
gnifi
cant
bu
rden
test
sfr
oma
pap
erw
ere
incl
ud
ed,
alon
gw
ith
the
most
ass
oci
ate
dva
riant
ina
gen
ew
ith
ina
give
nan
alysi
s,an
dan
yva
rian
tth
atw
asre
pli
cate
din
anin
dep
end
ent
sam
ple
.If
ava
riant
was
not
pre
sent
inth
eG
SC
AN
dat
aset
,th
elo
wes
tsi
ngl
eva
rian
tp-v
alu
ein
the
gen
ew
assu
bst
itu
ted
and
ital
iciz
ed.
Ifap-v
alu
eis
inb
old
,it
mee
tsth
eB
onfe
rron
i-co
rrec
tedp-v
alu
e,u
sin
gth
enum
ber
sof
test
sco
nd
uct
edin
this
tab
le.
AD
=A
lcoh
olD
epen
den
ce;
ND
=N
icoti
ne
Dep
end
ence

36
2.3.6 Replication data
We replicated any novel exome-wide significant rare variant (MAF < 1%) in two additional
exome chip smoking meta-analysis efforts, the CHD Exome+ Consortium (N = 17, 789) and the
Consortium for Genetics of Smoking Behaviour (N = 28, 583). Both consortia defined their phe-
notypes similarly and corrected for sex, age, principal components (and/or genetic relatedness, as
appropriate), and inverse-normalized prior to association analysis.
2.3.7 Genetic architecture analysis
We performed heritability and genetic correlation analyses using a modified method-of-
moment estimator, adapted to the analysis of sparsely genotyped rare variants. The method
calculates covariate-adjusted LD scores from summary statistics based upon partial correlations
and quantifies the uncertainty of LD scores with a bootstrap procedure that uses multiple con-
tributing studies. The estimation of heritability follows established methods. Detailed descriptions
of the approach can be found in Appendix A.
2.4 Results
Conditionally independent, significant single-variant association results are displayed in Table
2.4. We discovered a single novel association signal for a single rare variant, only for cigarettes per
day, rs36015615 (N = 30, 030, β = 1.3, p = 9.5 × 10⁻⁹), a nonsynonymous SNP in the gene
STARD3. This novel variant did not replicate in either of two replication consortium datasets, the
CHD Exome+ Consortium (N = 17, 789, β = −0.01, p = 0.94) or the Consortium for Genetics of
Smoking Behaviour (N = 28, 583, β = 0.056, p = 0.84).
Two known common variants within the CHRNA5-CHRNA3-CHRNB4 locus (rs16969968
and rs938682) were independently associated with cigarettes per day and pack years. Conditional
tests of rare nonsynonymous variants within these genes were non-significant. We verified at p < 5×
10−8 a common variant association near CYP2A6 for pack years. For drinks per week, we replicated
at p < 5 × 10⁻⁸ a variant in GCKR and a known low-frequency association for a nonsynonymous

37
variant in AHD1B, but did not replicate at p < 5 × 10⁻⁸ prior genome-wide associations around
AUTS2. In GCKR we discovered a common nonsynonymous SNP, rs1260326, associated with
drinks per week. This SNP is 10,047 base pairs from, and in high LD (r2 = 0.97 in 1000 Genomes
Phase 3 data) with the intronic GCKR SNP rs780094 that almost reached statistical significance
(p = 1.6× 10⁻⁷) in a recent report (Schumann et al., 2016).
We removed variants that were only present in two or fewer studies to avoid reporting as-
sociations that arose solely from the UK Biobank and are essentially unreplicable. This filter
removed several genome-wide significantly associated common variants previously reported to as-
sociate with either tobacco or alcohol use. These variants included rs1137115 in CYP2A6 associated
with cigarettes per day as well as some rare variants within that locus that showed evidence of con-
ditionally independent association. Additional UK Biobank-associated variants were rs4144892 in
NCAM1 associated with SI; rs58930260, rs11694518, and rs12619517 associated with SI; rs12648443
in ADH1C associated with drinks per week; and rs13146907 in an intron of KLB associated with
drinks per week. These results are reported in Table 2.6.
SKAT gene-based tests of nonsynonymous variants with MAF<1% resulted in one significant
association with ADH1C (SKAT p = 1.0 × 10⁻⁸), although after conditioning this gene-based
test on a nearby genome-wide significant nonsynonymous variant in ADH1B, the ADH1C effect
becomes nonsignificant (p = 0.52). Variable threshold gene based burden tests (VTCMC) yielded
no significantly associated gene.
Out of four published rare single variant associations with addiction phenotypes, we replicated
only one, even after examining other variants in the same gene and applying a relaxed multiple
testing threshold (Table 2.5). The variant was rs56175056 in CHRNA4 (p = 9.4×10⁻⁶), previously
identified in an Icelandic population (Thorgeirsson et al., 2016). Out of twenty six genes that have
been associated with alcohol or nicotine dependence in published rare variant burden tests, we
found a significant association for one, ADH1C (Table 2.5), described in the previous paragraph.
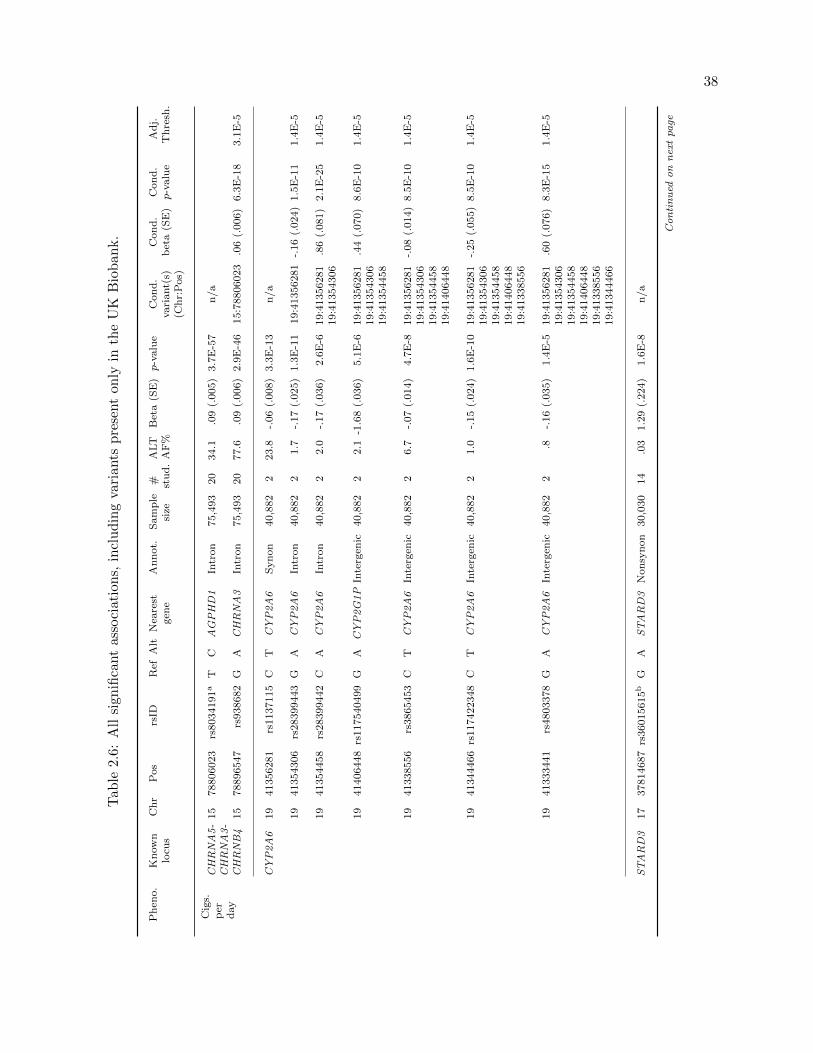
38
Tab
le2.
6:A
llsi
gnifi
cant
asso
ciat
ion
s,in
clu
din
gva
rian
tsp
rese
nt
only
inth
eU
KB
iob
an
k.
Ph
eno.
Kn
ow
nlo
cus
Ch
rP
os
rsID
Ref
Alt
Nea
rest
gen
eA
nn
ot.
Sam
ple
size
# stu
d.
ALT
AF
%B
eta
(SE
)p-v
alu
eC
ond
.vari
ant(
s)(C
hr:
Pos)
Con
d.
bet
a(S
E)
Con
d.
p-v
alu
eA
dj.
Th
resh
.
Cig
s.p
erd
ay
CHRNA5-
CHRNA3-
CHRNB4
15
78806023
rs8034191
aT
CAGPHD1
Intr
on
75,4
93
20
34.1
.09
(.005)
3.7
E-5
7n
/a
15
78896547
rs938682
GA
CHRNA3
Intr
on
75,4
93
20
77.6
.09
(.006)
2.9
E-4
615:7
8806023
.06
(.006)
6.3
E-1
83.1
E-5
CYP2A6
19
41356281
rs1137115
CT
CYP2A6
Syn
on
40,8
82
223.8
-.06
(.008)
3.3
E-1
3n
/a
19
41354306
rs28399443
GA
CYP2A6
Intr
on
40,8
82
21.7
-.17
(.025)
1.3
E-1
119:4
1356281
-.16
(.024)
1.5
E-1
11.4
E-5
19
41354458
rs28399442
CA
CYP2A6
Intr
on
40,8
82
22.0
-.17
(.036)
2.6
E-6
19:4
1356281
19:4
1354306
.86
(.081)
2.1
E-2
51.4
E-5
19
41406448
rs117540499
GA
CYP2G1P
Inte
rgen
ic40,8
82
22.1
-1.6
8(.
036)
5.1
E-6
19:4
1356281
19:4
1354306
19:4
1354458
.44
(.070)
8.6
E-1
01.4
E-5
19
41338556
rs3865453
CT
CYP2A6
Inte
rgen
ic40,8
82
26.7
-.07
(.014)
4.7
E-8
19:4
1356281
19:4
1354306
19:4
1354458
19:4
1406448
-.08
(.014)
8.5
E-1
01.4
E-5
19
41344466
rs117422348
CT
CYP2A6
Inte
rgen
ic40,8
82
21.0
-.15
(.024)
1.6
E-1
019:4
1356281
19:4
1354306
19:4
1354458
19:4
1406448
19:4
1338556
-.25
(.055)
8.5
E-1
01.4
E-5
19
41333441
rs4803378
GA
CYP2A6
Inte
rgen
ic40,8
82
2.8
-.16
(.035)
1.4
E-5
19:4
1356281
19:4
1354306
19:4
1354458
19:4
1406448
19:4
1338556
19:4
1344466
.60
(.076)
8.3
E-1
51.4
E-5
STARD3
17
37814687
rs36015615
bG
ASTARD3
Non
syn
on
30,0
30
14
.03
1.2
9(.
224)
1.6
E-8
n/a
Continued
onnextpa
ge

39
Tab
le2.
6–
Con
tin
ued
from
pre
viou
spa
ge
Ph
eno.
Kn
ow
nlo
cus
Ch
rP
os
rsID
Ref
Alt
Nea
rest
gen
eA
nn
ot.
Sam
ple
size
# stu
d.
ALT
AF
%B
eta
(SE
)p-v
alu
eC
ond
.vari
ant(
s)(C
hr:
Pos)
Con
d.
bet
a(S
E)
Con
d.
p-v
alu
eA
dj.
Th
resh
.
Pack
yea
rsCHRNA5-
CHRNA3-
CHRNB4
15
78806023
rs8034191
aT
CAGPHD1
Intr
on
72,9
09
19
34.0
.08
(.006)
6.6
E-4
1n
/a
15
78896547
rs938682
GA
CHRNA3
Intr
on
72,9
09
19
77.6
.05
(.006)
1.4
E-3
115:7
8806023
.05
(.006)
4.1
E-1
21.1
E-4
CYP2A6
19
41302706
rs7937
CT
RAB4B
UT
R3
41,2
70
356.1
.40
(.007)
1.6
E-8
n/a
Sm
oke
init
.NCAM1
11
112866456
rs4144892
CT
NCAM1
Intr
on
112,8
11
236.6
.06
(.009)
3.1
E-9
n/a
TEX41
2146039101
rs58930260
CT
TEX41
Inte
rgen
ic112,8
11
229.5
.06
(.009)
1.6
E-8
n/a
2146243333
rs11694518
CT
TEX41
Inte
rgen
ic112,8
11
227.5
-.05
(.009)
6.0
E-8
2:1
46039101
-.04
(.009)
6.5
E-5
2.3
E-4
2146276380
rs12619517
AC
TEX41
Inte
rgen
ic112,8
11
24.6
-.10
(.021)
1.7
E-5
2:1
46039101
2:1
46243333
-.10
(.020)
1.1
E-5
2.3
E-4
Dri
nks
per
wee
k
ADH1B-
ADH1C
4100239319
rs1229984
TC
ADH1B
Non
syn
on
105,5
67
998.9
.23
(.016)
4.2
E-4
4n
/a
4100304248
rs12648443
TC
ADH1C
Inte
rgen
ic90,2
13
218.9
-.03
(.006)
2.1
E-5
4:1
00239319
-.02
(.005)
2.1
E-6
1.4
E-4
GCKR
227730940
rs1260326
TC
GCKR
Non
syn
on
139,1
03
20
62.1
.03
(.004)
4.1
E-1
6n
/a
KLB
43942548
rs13146907
AG
KLB
Intr
on
90,2
13
234.5
-.04
(.005)
1.0
E-1
2n
/a
aT
his
vari
ant
isa
pro
xy
for
the
com
mon
non
syn
onym
ou
sS
NP
rs16969968,
akn
ow
nca
usa
lvari
ant
aff
ecti
ng
hea
vin
ess
of
smokin
g.
brs
36015615
did
not
rep
lica
tein
two
ad
dit
ion
al
data
sets
.S
eem
ain
text.
Note
:A
llp-v
alu
esare
corr
ecte
dfo
rgen
om
icin
flati
on
fact
or
base
don
all
vari
ants
wit
hM
AC≥
5te
sted
for
that
ph
enoty
pe.
Ch
r=
chro
moso
me,
Pos=
posi
tion
(bu
ild
37),
Ref
=re
fere
nce
allel
eon
GR
Ch
37,
Alt
=alt
ern
ate
allel
e,N
=sa
mp
lesi
zeacr
oss
all
stu
die
sth
at
gen
oty
ped
the
vari
ant,
ALT
AF
=allel
efr
equ
ency
of
the
alt
ern
ate
allel
ees
tim
ate
din
the
met
a-a
naly
sis.
All
vari
ants
that
are
from
on
ly2
stu
die
sw
ere
un
iqu
eto
the
UK
Bio
ban
karr
ay.
Th
eB
on
ferr
on
ip-v
alu
eth
resh
old
for
all
low
-fre
qu
ency
(MA
F<
1%
)vari
ants
ran
ged
from
1.8
E-7
to1.9
E-7
,d
epen
din
gon
the
ph
enoty
pe.
Th
efu
llse
tof
sum
mary
stati
stic
san
dad
dit
ion
al
info
rmati
on
ab
ou
tea
chass
oci
ati
on
,is
host
edathttps://genome.psych.umn.edu/index.php/GSCAN

40
Heritability was estimated for each trait and partitioned by annotation category. First,
we annotated variants on the exome chip based upon gene definitions in RefSeq 1.9, using SE-
QMINER version 6.0 (Zhan & Liu, 2015). Sixteen functional categories were considered, includ-
ing downstream, essential splice site, noncoding exon, intergenic, intron, common nonsynonymous
(MAF>0.01), rare nonsynonymous (MAF<0.01), normal splice site, start gain/loss, stop gain/loss,
synonymous, and 3’/5’ untranslated regions. We fitted the baseline model with 16 categories, and
estimated phenotypic variance explained by each category (Table 2.7).
Significant phenotypic variance was explained from rare nonsynonymous variants for all traits
(p < 0.05), from 1.7% to 3.6% (Table 2.8). We also estimated the phenotypic variance explained
by all variants on the exome chip, through aggregating the variance explained by each significant
category (p < 0.05) listed in Table 2.7. The total variance explained was highest for cigarettes per
day (4.6% ± 1.3% standard error) and the lowest for drinks per week (2.4 ± 0.8%).
All pairs of traits are genetically correlated (Table 2.9) except for cigarettes per day and
smoking initiation, and the direction of the genetic correlations are in the expected direction. For
instance, cigarettes per day has a positive genetic correlation with drinks per week (0.04±0.008),
consistent with the observation that the increased alcohol consumption is correlated with increased
tobacco consumption. Age of initiation has a negative correlation with all other traits, which is
consistent with the observation that an earlier age of smoking initation is correlated with increased
tobacco and alcohol consumption in adulthood. The patterns and magnitudes of correlation are
highly similar when considering only rare nonsynonymous variants (Table 2.9).
2.5 Discussion
With a maximum sample size ranging from 70,847 to 164,142, the present study is the largest
study to date of low-frequency nonsynonymous and LoF variants in smoking and alcohol use. Our
meta-analytic study design allowed us to conduct single variant, gene-based burden tests, and
exact conditional analyses accounting for common variants on the Illumina exome chip and UK
Biobank arrays. Despite these analytical advantages and a large sample size, we were unable to
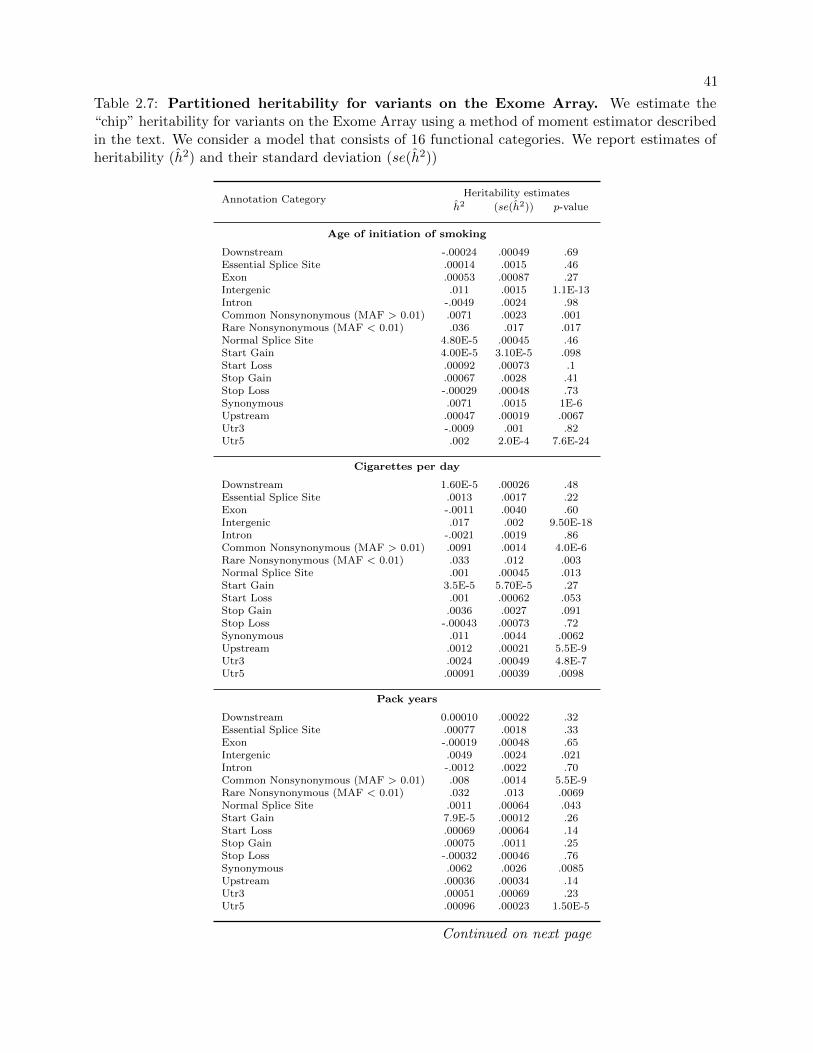
41
Table 2.7: Partitioned heritability for variants on the Exome Array. We estimate the“chip” heritability for variants on the Exome Array using a method of moment estimator describedin the text. We consider a model that consists of 16 functional categories. We report estimates ofheritability (h2) and their standard deviation (se(h2))
Annotation CategoryHeritability estimates
h2 (se(h2)) p-value
Age of initiation of smoking
Downstream -.00024 .00049 .69Essential Splice Site .00014 .0015 .46Exon .00053 .00087 .27Intergenic .011 .0015 1.1E-13Intron -.0049 .0024 .98Common Nonsynonymous (MAF > 0.01) .0071 .0023 .001Rare Nonsynonymous (MAF < 0.01) .036 .017 .017Normal Splice Site 4.80E-5 .00045 .46Start Gain 4.00E-5 3.10E-5 .098Start Loss .00092 .00073 .1Stop Gain .00067 .0028 .41Stop Loss -.00029 .00048 .73Synonymous .0071 .0015 1E-6Upstream .00047 .00019 .0067Utr3 -.0009 .001 .82Utr5 .002 2.0E-4 7.6E-24
Cigarettes per day
Downstream 1.60E-5 .00026 .48Essential Splice Site .0013 .0017 .22Exon -.0011 .0040 .60Intergenic .017 .002 9.50E-18Intron -.0021 .0019 .86Common Nonsynonymous (MAF > 0.01) .0091 .0014 4.0E-6Rare Nonsynonymous (MAF < 0.01) .033 .012 .003Normal Splice Site .001 .00045 .013Start Gain 3.5E-5 5.70E-5 .27Start Loss .001 .00062 .053Stop Gain .0036 .0027 .091Stop Loss -.00043 .00073 .72Synonymous .011 .0044 .0062Upstream .0012 .00021 5.5E-9Utr3 .0024 .00049 4.8E-7Utr5 .00091 .00039 .0098
Pack years
Downstream 0.00010 .00022 .32Essential Splice Site .00077 .0018 .33Exon -.00019 .00048 .65Intergenic .0049 .0024 .021Intron -.0012 .0022 .70Common Nonsynonymous (MAF > 0.01) .008 .0014 5.5E-9Rare Nonsynonymous (MAF < 0.01) .032 .013 .0069Normal Splice Site .0011 .00064 .043Start Gain 7.9E-5 .00012 .26Start Loss .00069 .00064 .14Stop Gain .00075 .0011 .25Stop Loss -.00032 .00046 .76Synonymous .0062 .0026 .0085Upstream .00036 .00034 .14Utr3 .00051 .00069 .23Utr5 .00096 .00023 1.50E-5
Continued on next page

42Table 2.7 – Continued from previous page
Annotation CategoryHeritability estimates
h2 (se(h2)) p-value
Smoking initiation
Downstream .00028 .00022 .1Essential Splice Site .00037 .00098 .35Exon -.00041 .00023 .96Intergenic -.0092 .0080 .87Intron .00049 .001 .31Common Nonsynonymous (MAF > 0.01) .014 .0015 5.1E-21Rare Nonsynonymous (MAF < 0.01) .025 .01 .0062Normal Splice Site .00045 .00027 .048Start Gain 9.5E-6 1.3E-5 .23Start Loss -.0006 .00059 .81Stop Gain .0018 .0017 .14Stop Loss .00054 .00032 .046Synonymous .011 .00091 6.1E-34Upstream .00064 .00018 .00019Utr3 .0016 .00026 3.8E-10Utr5 .00043 .00012 .00017
Drinks per week
Downstream -3.5E-5 .00019 .57Essential Splice Site -.00097 .00073 .91Exon .0012 .00053 .012Intergenic .0033 .001 .00048Intron .0089 .0012 6.0E-14Common Nonsynonymous (MAF > 0.01) .015 .0025 9.9E-10Rare Nonsynonymous (MAF < 0.01) .017 .008 .017Normal Splice Site .00082 .00030 .0031Start Gain .00010 .00016 .27Start Loss -.00068 .00039 .96Stop Gain -.0022 .0012 .97Stop Loss .0018 .00071 .0056Synonymous .0072 .0015 7.90E-7Upstream -.00028 .00025 .87Utr3 -.00079 .00080 .84Utr5 .00089 .00016 1.3E-8
discover robust, novel associations for nonsynonymous or LoF variants. The one novel associated
rare variant in STARD3 did not replicate in two complementary large exome chip meta-analysis
consortia.
We discovered a common nonsynonymous SNP, rs1260326, in GCKR, associated with drinks
per week. The T→C change results in a nonsynonymous (Leu→Pro) and splice region change in
the final codon of the 14th exon in GCKR. The mutation is predicted to be possibly damaging by
PolyPhen-252, although the functional significance of this variant is unknown. Denser genotyping
or genotype imputation will verify whether this particular variant has a direct causal relationship to
drinks per week, or if the association arises artifactually due to linkage disequilibrium between this
variant and other variants in the locus. We replicated one of four previous rare single variant associ-

43
Table 2.8: Estimation of heritability explained by variants on Exome Array. We estimatethe heritability based upon a baseline model with 16 different functional categories. The reportedheritability h2 is based upon the cumulative value from the functional categories with significantheritabilities. We also report the its standard deviation (se(h2)) and p-values, estimated usingjackknife.
Annotation PhenotypeHeritability estimates
h2 (se(h2)) p-value
All Variants
Age of initiation of smoking .044 .017 .0048
Cigarettes per day .046 .013 .00020
Pack years .044 .013 .00040
Smoking initiation .027 .010 .0035
Drinks per week .024 .0080 .0015
Rare (MAF < .01)nonsynonymousvariants
Age of initiation of smoking .036 .017 .017
Cigarettes per day .033 .012 .0030
Pack years .032 .013 .0069
Smoking initiation .025 .010 .0062
Drinks per week .017 .0080 .017
Table 2.9: Genetic correlation estimates between smoking and drinking traits. Weestimate genetic correlations between 5 smoking and drinking traits. Genetic correlation estimates(rg), their standard deviation (se(rg)) and p-values are reported.
Trait 1 Trait 2Genetic Correlationrg (se(rg)) p-value
A. Aggregated genetic correlation induced by all variants on the Exome ArrayAge of initiation of smoking Cigarettes per day -.024 .010 .020Age of initiation of smoking Smoking initiation -.037 .012 .0017Age of initiation of smoking Drinks per week -.023 .010 .023Age of initiation of smoking Pack years -.03 .010 .0040Cigarettes per day Smoking initiation .0027 .0088 .76Cigarettes per day Drinks per week .040 .0084 1.6E-6Cigarettes per day Pack years .054 .011 1.4E-6Smoking initiation Drinks per week .041 .0058 9.4E-13Smoking initiation Pack years .018 .0057 .0012Drinks per week Pack years .025 .0070 .00038
B. Genetic correlation induced by rare (MAF < 1%) variantsAge of initiation of smoking Cigarettes per day -.024 .010 .020Age of initiation of smoking Smoking initiation -.033 .011 .0026Age of initiation of smoking Drinks per week -.023 .0094 .013Age of initiation of smoking Pack years -.032 .0088 .00021Cigarettes per day Smoking initiation .0025 .0084 .76Cigarettes per day Drinks per week .043 .0076 1.10E-8Cigarettes per day Pack years .059 .010 1.50E-8Smoking initiation Drinks per week .013 .0051 .0084Smoking initiation Pack years .010 .0044 .0019Drinks per week Pack years .011 .0056 .049

44
ations and one out of twenty six gene-level associations. Possible explanations include the relatively
thin coverage of the exome chip compared to targeted resequencing, phenotypic heterogeneity (pre-
vious studies used dependence diagnoses), differences in study population, or overestimation of true
effects in the original studies.
We showed that rare nonsynonymous variants on the exome chip explain significant propor-
tions of phenotypic variance. The exome chip was designed to genotype coding variants uncovered
in ∼12,000 sequenced exomes. By design, it comprehensively ascertained high confidence rare non-
synonymous, splice, and stop variants within those sequences and only sparsely genotypes other
classes of variation, including common variants. The use of the exome chip therefore limited our
ability to quantify heritability for these other types of variants, or to conduct enrichment tests.
Care should also be taken when interpreting those results for which we had substantial coverage on
the exome chip. The estimates should be interpreted as “chip heritability,” which is the proportion
of heritability that can be tagged by variants on the chip. Even rare nonsynonymous variants may
be in linkage disequilibrium with other nearby variants, and thus the percent variance explained
by nonsynonymous variants may not be solely attributed to the genotyped variants. Additional
fine mapping and denser genotype data is needed to dissect the contribution of any given variant
or class of variants. Nonetheless, our results provide preliminary evidence that nonsynonymous
variants contribute substantially to the genetic etiology of smoking and drinking.
The exome chip design is an efficient way to accumulate large samples genotyped with a
moderate number of low-frequency exonic variants. The effect size spectrum of low-frequency
variants on complex traits is poorly understood and, despite our large sample sizes, it may well
be that our meta-analysis was underpowered to detect variants with small effects on smoking and
alcohol use behaviors (Auer et al., 2016). The maximum sample size for cigarettes per day, for
example, was N ∼ 75,000. At this sample size, we had 80% power to detect a variant accounting
for >0.05% of variance. A small effect, but if the variant in question has MAF = 0.1%, it translates
to a standardized regression weight of 0.5. That is, for every risk allele an individual carries,
their expected phenotype increases by 12 of a standard deviation. Such a variant would be highly

45
consequential for the individuals who carry it, and of considerable scientific interest. The result
is similar for SI, where N ∼ 165,000, and we had 80% power to detect an odds ratio >1.14 for a
variant with MAF = 1%. We had 80% power to detect an odds ratio >1.5 for a variant with MAF
= 0.1%. The present results indicate there are no rare variants on the exome chip with such effects
on smoking and alcohol use in European ancestry individuals.
A similar line of reasoning can be used to put the chip heritability results into context.
We found that rare nonsynonymous variants contribute to heritability (e.g., ∼3%) in these traits.
Rare disease-associated variants are expected to have larger effects than common variants, in the
sense that carrying a rare mutation is expected to have a larger phenotypic impact, if only due to
purifying selection for deleterious mutations. However, even if the effect is large in that sense, any
rare mutation by definition only affects a small number of individuals. Thus, a rare variant with a
large effect accounts for a tiny fraction of variation in any common, complex disorder or trait. In
the present study, there were ∼130,000 nonsynonymous variants with MAF < 1% (Table 2.3) and
they in aggregate appear to account for substantial variation in the phenotypes. So, the present
results provide evidence that rare nonsynonymous variants play a significant role in risk for smoking
and alcohol use behavior but that individual rare variants associations remain undetectable even
at the sample sizes accumulated here.
2.6 Acknowledgements
Research reported in this article was supported by the National Institute on Drug Abuse and
the National Human Genome Research Institute of the National Institutes of Health under award
numbers R01DA037904 (SIV), R21DA040177 (DJL), R01HG008983 (DJL), and 5T3DA017637-13
(DMB), as well as funding sources listed in Appendix C. This research has been conducted using
the UK Biobank Resource under Application Number 6395. A preprint of this manuscript was
posted to the bioRxiv. We would like to acknowledge the contributions of the members of the CHD
Exome+ Consortium and the Consortium for Genetics of Smoking Behavior.

46
2.7 Supplemental information
Complete sets of summary statistics will be made available for download here: https:
//genome.psych.umn.edu/index.php/GSCAN. The analysis plan used by all studies to generate
summary statistics is here: https://genome.psych.umn.edu/index.php/GSCAN.

Chapter 3
Intensive longitudinal assessment elucidates adolescent substance use
development
3.1 Introduction
Smoking and alcohol use and abuse are among the most severe threats to public health in
both the developed and developing worlds. The total health burden of a disease can be calculated
in disability adjusted life years (DALY) — the number of years of life lost to a disease, including
ill-health, disability, and death. This measures the total number of years of healthy life lost to
a disease, accounting for both morbidity and mortality. Globally, tobacco use accounted for the
loss of 59 million disability adjusted life years in the year 2000 and alcohol use for 58 million,
placing them in fourth and fifth place, respectively, among all disease categories (Ezzati et al.,
2002). Although e-cigarette and marijuana use is very likely to be less damaging than cigarette use
in adults, multiple lines of evidence suggest greater risk in adolescents (Yuan et al., 2015; Hajek
et al., 2014; Hopfer, 2014). In 2015, the age-adjusted death rate from alcohol-induced causes in
the United States reached its highest rate in over fifteen years, 9.1 deaths per 100,000 people. This
corresponds to an increase in mortality of 28% since 1999 (Tejada-Vera, 2017).
Adolescence appears to be a time of special importance in the development of substance use
and abuse. Puberty is associated with a general increase in risky behavior and impaired social and
emotional processing, relative to adults and pre-pubescent children (Hall et al., 2016). Substance
use in early adolescence is associated with an increased rate of substance abuse and dependence in
adulthood to a degree that substance use later in adolescence and in adulthood is not. Although

48
this association reflects, at least in part, shared genetic risk (Ystrom et al., 2014), it has been
hypothesized that this association is causal. In this model, ongoing neurodevelopment renders
adolescents uniquely vulnerable to damage caused by substance use. This damage causes lasting
changes in the response to substance use and in assessment of risk, suggesting that adolescent
substance use is self-reinforcing (Jordan & Andersen, 2016). This perspective is supported by
animal studies, where adolescent exposure to alcohol and other drugs causes changes in hippocampal
function not seen in adults (McClain et al., 2014). Regardless of the etiology of adolescent and adult
substance use and abuse, adolescent use poses a significant risk to health, both through the direct
effects of use and the increased risk for other negative outcomes, including violence and accidental
injury.
Substance use and abuse has a substantial genetic component. A large meta-analysis of twin
studies found a heritability of 0.41 for alcohol-related disorders, 0.44 for tobacco-related disorders,
and 0.51 for cannabis-related disorders (Polderman et al., 2015). Researchers have attempted to
discern the extent of the genetic influences on different phases of the path to substance dependence.
One twin study found a heritability for the initiation of regular smoking of approximately 0.6
and for nicotine dependence of approximately 0.7 (Sullivan & Kendler, 1999). A similar study
determined that alcohol initiation, frequency of use, and problem drinking all have heritabilities
of approximately 0.4 (Pagan et al., 2006). Another twin study found a heritability of 0.6 for
alcohol dependence (Mbarek et al., 2015). There is a high degree of overlap in the genetic effects
influencing alcohol frequency of use and alcohol abuse and dependence but not alcohol initiation
and alcohol abuse and dependence, indicating that genetic studies of population alcohol use can
provide information on the genetics of alcohol dependence (Dick et al., 2011; Pagan et al., 2006).
Converging lines of evidence support the hypothesis that phenotypes of use and abuse of
licit and illicit drugs have a strong genetic correlation with each other and with antisocial behavior
and other forms of problem behavior, indicating shared genetic effects. A study of adolescent
twins found antisocial behavior, conduct disorder, alcohol dependence, drug dependence, and the
inverse of constraint shared a common factor, described as externalizing behavior, with loadings

49
generally higher than 0.5. The heritability of externalizing behavior was estimated as 0.81 (Krueger
et al., 2002). Another twin study found modest genetic correlations between tobacco, marijuana,
and alcohol use, from 0.14 to 0.31, but significantly larger genetic correlations between tobacco,
marijuana, and alcohol problem use, between 0.56 and 0.62 (Young et al., 2006). The existence of
substantial common genetic liability for substance use and abuse, antisocial behavior, other risky
behaviors, and other forms of behavioral disinhibition has been extensively replicated (Iacono et al.,
2008).
More recent studies have extended these results in several ways. First, a longitudinal twin
study found that the shared genetic influence on alcohol, marijuana, and nicotine dependence
decreased between age 14 and age 29, suggesting that heritability of these traits is greater in ado-
lescence than young adulthood (Vrieze et al., 2012). One might presume that twin environmental
similarity is greater in adolescence because of parental influence, which would increase the dizygotic
twin correlation and decrease heritability, making this a surprising result. In part, this reflects the
decrease in polysubstance use with age. Second, another longitudinal twin study found a correla-
tion over time between borderline personality disorder, alcohol use disorder, and drug use disorders
which was explained by shared genetic influences. This result reinforces the relationship between
substance abuse and other non-normative behaviors (Bornovalova et al., 2018). Third, another
twin study used genome-wide data to examine the influence of common single nucleotide polymor-
phisms (SNPs), measured with a microarray, on behavioral disinhibition and substance use and
dependence. Genome-wide Complex Trait Analysis (GCTA) was used to estimate the proportion
of the phenotypic variance in these traits explained by all common SNPs and produced estimated
between 0.16 and 0.22, though with substantial variance due to the marginal sample size. Polygenic
risk scores (PGRS) constructed from the genome wide data showed significant but small correla-
tions between traits (Vrieze et al., 2013). These results together indicate that the findings from
biometrical modeling of twins are robust and that similar effects are detectable in genome-wide
data.
In addition to the significant genetic effects described above, an extensive literature doc-

50
uments associations between various environmental variables and adolescent substance use and
abuse. Most of these associations can be divided into two categories: peer variables and parental
variables. Typically, peer use is the best predictor of adolescent substance use while peer norms
are a better predictor of adolescent substance abuse. Parental norms and behavior are significantly
correlated with both but less so than peer variables (Dielman et al., 1990). A review of longitudinal
studies examining the impact of parenting strategies on adolescent smoking found that a ban on
smoking in the house and frequency and quality of communication between parents and child were
the most consistently associated with decreased smoking (Hiemstra et al., 2017). A similar review
examining alcohol use found that parental monitoring, limits on alcohol availability, relationship
quality, communication quality, and parent involvement in the child’s life were associated, across
studies, with lower rates of alcohol use (Ryan et al., 2010).
Parental monitoring has been examined extensively in the literature. Although it is often
described as the parents’ surveillance of their child’s behavior, the instruments used ask how much
the parents know about the child’s behavior. Two detailed examinations of the sources of parental
knowledge found that child disclosure is the key predictor of parental knowledge, not the behavior
of the parents (Stattin & Kerr, 2000; Eaton et al., 2009).
These papers often suggest that their results inform the strategies used for the prevention
of adolescent substance abuse. This implies that the environmental exposures cause increases or
decreases in substance abuse risk. However, cross-sectional designs cannot exclude the possibility of
a confounding variable that causes both the environmental exposure and substance abuse, or reverse
causation, where substance abuse causes the environmental exposure. The former mechanism is
particularly plausible in adolescent substance abuse. As described earlier, antisocial behavior,
substance abuse, and other forms of behavioral disinhibition share genetic risk factors. Individuals
with high genetic risk for these traits are likely to associate with each other in preference to
those without these risk factors, which could create the peer effects described above. Those same
individuals would be less likely to share information with their parents about their activities,
decreasing parental monitoring as commonly measured in the literature. Children with antisocial

51
traits may fail to respond to approaches that were successful with siblings who possessed lower
genetic risk and would evoke different parenting strategies. Parents who smoke may be less likely
to impose a ban on smoking in the house and are more likely to have children with high genetic
risk.
In sum, although a purely genetic etiology is unlikely, gene-environment covariance can plau-
sibly account for the environmental risk factors commonly proposed in the literature. Longitudinal
designs may exclude causation but they cannot conclusively demonstrate it. Twin and family
designs can account for genetic effects but there are few published studies that test specific envi-
ronmental hypotheses. A review of randomized controlled trials and quasi- experimental studies
testing the effect of parent-based interventions on adolescent substance use found some evidence
for the efficacy of interventions that improved parent-child communication and monitoring and
and imposed strict rules. Unfortunately, no meta-analysis was performed, preventing a rigorous
assessment of the strength of evidence for intervention effectiveness (Sandra & Emmanuel, 2016).
One approach to resolving these issues is to obtain detailed longitudinal measurements of
environment and behavior in genetically informed samples. With these data, it would be possible to
control for confounding variables and determine the effects of genes and environment on adolescent
substance use and abuse. However, the traditional methods of collecting such data are expensive and
suffer from recall and reporting biases. Smartphone technology is one solution to this. Smartphones
are pocket supercomputers which the owner keeps charged, has in their possession most or all of
the time, and which can determine their location to an accuracy of meters, administer dynamic
and interactive assessments at a high frequency, measure physical activity, and carry or connect to
sensors (Miller, 2012). Smartphones have been widely adopted across socioeconomic groups in the
United States and a prospective subject likely already has a smartphone. In 2015, 73% of teenagers
had access to a smartphone. Teenager smartphone access was over 50% in all age, race, household
income, and population density categories (Pew Research Center, 2015).
Ecological momentary assessment (EMA) is defined as “repeated sampling of subjects’ current
behaviors and experiences in real time, in subjects’ natural environments,” as opposed to traditional
52
retrospective assessments administered in a laboratory or at a clinic (Shiffman et al., 2008). EMA
reduces recall bias and increases ecological validity. Smartphones simplify the inclusion of EMA in
a study design, removing the need for specialized hardware.
EMA has been applied to the study of substance use. One early study examined the question
of when people smoke. Smoking was preceded by and related to smoking urges, eating and drinking,
and the social environment but was not related to positive or negative affect (Shiffman et al.,
2002). A study of alcohol use found high levels of compliance with EMA with results comparable
to traditional measures (Collins et al., 2003). A study of smoking found that EMA was less biased
than traditional measures and successfully predicted physiological measures of smoking (Shiffman,
2009). In a study of smokers trying to quit, EMA measures but not traditional measures were able
to predict lapses in smoking cessation (Shiffman et al., 2007). Moving away from self-report, a
recent study showed that mobile phone sensor data can detect drinking episodes and the quantity
drunk (Bae et al., 2017).
Smartphones carry global positioning system (GPS) and other sensors that provide estimates
of physical location accurate to within several meters. Densely measured location data, combined
with existing geospatial datasets, can directly measure many environmental variables of interest to
substance use research. For example, it is possible to measure the movement patterns of a pair of
twins and determine their similarity (Long & Nelson, 2013), to measure an individual’s presence in
areas with a high rate of substance use, and to determine if a teenager is leaving their home at night
or their school during the day. Several studies show that it is possible to extract an individual’s
routine from their location data and to determine when they deviate from their habits (Song et al.,
2010; Gonzalez et al., 2008; Eagle & Pentland, 2009). At a large scale, the patterns of life of an
entire city can be studied (Reades et al., 2009). It is also possible to predict social interaction
between two individuals and to construct a social graph, providing measures of peer environment
(Cho et al., 2011; Cranshaw et al., 2010; Wang et al., 2011).
In the Colorado Online Twin Study (CoTwins), we demonstrate the feasibility of measuring
adolescent substance use and abuse and a range of environmental and behavioral measures relevant

53
to substance use through EMA self-report and location tracking. We show that these methods
provide data which can be used to examine the correlations between substance use and various
environmental exposures.
3.2 Methods
3.2.1 Subject recruitment
The CoTwins sample was recruited from the Colorado Twin Registry (CTR), a population-
based registry maintained by the Institute for Behavioral Genetics at the University of Colorado
Boulder (Rhea et al., 2006, 2013). Twin pairs were eligible for the study if they were between 14 and
17 years of age, had their own Android or iOS smartphones, and resided in the state of Colorado.
The study was described to parents and eligible families were invited to participate, either at the
Institute for Behavioral Genetics or at a private location near the family’s home. Remote sites
were chosen to increase the geographic and demographic diversity of the sample. Families were
compensated for their travel costs.
3.2.2 Intake assessment
Informed consent was obtained from the parents of each twin pair and assent was obtained
from the twins themselves. The consent form and all research protocols were approved by the
CU Boulder Institutional Review Board and a Certificate of Confidentiality was received from the
National Institutes of Health. After consent was obtained, the twins were registered for CoTwins
accounts, the study smartphone application was installed on their phones, and our Google Chrome
extension was installed on their laptops. If the twins did not have their own computers, they were
instructed on how to log-on independently. Next, a battery of cognitive tests was administered to
each twin, followed by an interview covering psychiatric problems, parental monitoring, substance
use and abuse, social environment, and personality. The substance use and abuse items were
derived from the Substance Abuse and Addiction collection of the PhenX Toolkit (Hamilton et al.,
2011; Conway et al., 2014) and the parental monitoring items were obtained from the Minnesota

54
Twin Family Study (Eaton et al., 2009). Same-sex twin zygosity was inferred from the interviewers’
assessments of the twins’ physical characteristics (Nichols & Bilbro, 1966). Table 3.1 contains a
complete description of the in-person assessments. Each family received $200 in cash at the end of
the in-person session.

55
Tab
le3.
1:In
take
asse
ssm
ents
Typ
eIn
stru
ment
Purp
ose
Cit
ati
on/N
ote
Cognit
ive
(Tw
in)
Wechsl
er
Abbre
via
ted
Scale
of
Inte
llig
ence
IISta
ndard
ass
ess
ment
of
cognit
ive
abilit
ies
Wechsl
er
(2011)
Anti
saccade
(Inhib
itio
n),
Keep
Tra
ck
(Up
dati
ng),
Cate
gory
Sw
itch
(Shif
ting)
Com
pute
rized
test
sof
executi
ve
functi
on
Fri
edm
an
etal.
(2016)
Inte
rvie
w(T
win
)
DIS
CA
nxie
ty,
Mood,
&D
isru
pti
ve
Dis
ord
ers
Sta
ndard
inte
rvie
wass
ess
ing
psy
chia
tric
pro
ble
ms
Shaff
eretal.
(2000)
PhenX
:Subst
ance
Use
,A
buse
,D
ep
endence,a
nd
Availabilit
ySta
ndard
inte
rvie
wass
ess
ing
subst
ance
involv
em
ent
and
dia
gnosi
ng
subst
ance
abuse
and
dep
endence
Conw
ay
etal.
(2014);
Ham
ilto
netal.
(2011)
Min
neso
taT
win
Fam
ily
Stu
dy
–Sib
ling
Inte
racti
on
and
Behavio
rStu
dy:
Pare
nta
lK
now
ledge
Regard
ing
Childre
ns
Acti
vit
ies
(Child
Vers
ion)
Sta
ndard
inte
rvie
wass
ess
ing
pare
nta
lm
onit
ori
ng
Eato
netal.
(2009)
Subst
ance
Use
Term
inolo
gy
Collecti
on
of
word
suse
dor
heard
todesc
rib
esu
bst
ance
use
Develo
ped
for
this
study
AddH
ealt
h:
Rela
tions
wit
hSib
lings
Inte
rvie
wass
ess
ing
twin
’sclo
seness
toth
eir
siblings
Harr
isetal.
(2009)
Sara
son:
Socia
lSupp
ort
Quest
ionnair
e(S
hort
ened
Vers
ion)
Sta
ndard
ass
ess
ment
of
socia
lsu
pp
ort
Sara
son
etal.
(1987)
Min
neso
taT
win
Fam
ily
Stu
dy:
Lif
eE
vents
Ass
ess
ment
of
signifi
cant
life
events
,desi
gned
for
teenagers
Billig
etal.
(1996)
Nati
onal
Youth
Surv
ey:
Peer
Involv
em
ent/
Engagem
ent
Ass
ess
ment
of
twin
’sre
lati
onsh
ipw
ith
their
frie
nds
Ellio
ttetal.
(1989)
PhenX
:Subst
ance
Use
-Rela
ted
Psy
choso
cia
lR
isk
Facto
rsA
ssess
es
adole
scents
’exp
osu
reto
subst
ance
use
risk
and
pro
tecti
ve
facto
rsin
the
com
munit
yC
onw
ay
etal.
(2014);
Ham
ilto
netal.
(2011)
Quest
ionnair
e(T
win
)
PhenX
:T
anner
Physi
cal
Develo
pm
ent
Sta
ndard
ass
ess
ment
of
adole
scent
physi
cal
develo
pm
ent
Ham
ilto
netal.
(2011)
AddH
ealt
h:
Sexual
Exp
eri
ences
Measu
res
of
rom
anti
cre
lati
onsh
ips
and
sexual
behavio
rH
arr
isetal.
(2009)
Big
Fiv
eIn
vento
rySta
ndard
measu
reof
pers
onality
John
etal.
(1991)
AddH
ealt
h:
Extr
acurr
icula
rA
cti
vit
ies
Ass
ess
ment
of
twin
’sextr
acurr
icula
racti
vit
ies
Harr
isetal.
(2009)
Achenbach
Youth
Self
Rep
ort
Measu
res
of
inte
rnalizin
gand
exte
rnalizin
gb
ehavio
rsA
chenbach
(1991b)
Physi
cal
(Tw
inand
Pare
nt)
Saliva
sam
ple
Futu
regenom
icst
udie
s
Photo
gra
phs
of
full
body,
face,
and
ears
(tw
ins
only
)Z
ygosi
tydete
rmin
ati
on
Quest
ionnair
e(P
are
nt)
PhenX
:Subst
ance
Use
,A
buse
,D
ep
endence,a
nd
Availabilit
yA
dult
quest
ionnair
evers
ion
of
childre
n’s
ass
ess
ment
(see
ab
ove)
Conw
ay
etal.
(2014);
Ham
ilto
netal.
(2011)
PhenX
:D
em
ogra
phic
sSta
ndard
measu
res
of
dem
ogra
phic
vari
able
sH
am
ilto
netal.
(2011)
Nic
hols
and
Bilbro
:Z
ygosi
tyM
easu
reof
twin
pair
zygosi
tyN
ichols
&B
ilbro
(1966)
Min
neso
taT
win
Fam
ily
Stu
dy:
Lif
eE
vents
Ass
ess
ment
of
signifi
cant
life
events
,desi
gned
for
adult
sB
illi
getal.
(1996)
Min
neso
taT
win
Fam
ily
Stu
dy
–Sib
ling
Inte
racti
on
and
Behavio
rStu
dy:
Pare
nta
lK
now
ledge
Regard
ing
Childre
ns
Acti
vit
ies
(Pare
nt
Vers
ion)
Sta
ndard
inte
rvie
wass
ess
ing
pare
nta
lm
onit
ori
ng
Eato
netal.
(2009)
Subst
ance
Use
Term
inolo
gy
Collecti
on
of
word
suse
dor
heard
todesc
rib
esu
bst
ance
use
Develo
ped
for
this
study
Nati
onal
Youth
Fit
ness
Surv
ey:
Pare
nta
lR
ep
ort
of
Child
Healt
hM
easu
res
of
accult
ura
tion
for
imm
igra
nt
fam
ilie
s,dia
bete
s,earl
ychildhood
healt
h,
healt
hin
sura
nce,
hosp
ital
uti
lizati
on
and
access
tocare
,m
edic
al
condit
ions,
physi
cal
acti
vit
ies,
physi
cal
functi
onin
g,
and
resp
irato
ryhealt
hand
dis
ease
Borr
ud
etal.
(2014)
Big
Fiv
eIn
vento
rySta
ndard
measu
reof
pers
onality
John
etal.
(1991)
Achenbach
Chil
dB
ehavio
rC
hecklist
Sta
ndard
pare
nt
rep
ort
of
child
behavio
rm
odifi
ed
toin
clu
de
item
sfr
om
the
standard
teacher
rep
ort
Achenbach
(1991a)

56
3.2.3 Intensive follow-up assessments
Initially, twins and their parents agreed to a year of remote assessment. We subsequently
obtained consent from 79% of the sample for a second year. Two categories of data were col-
lected during this period: 1) questionnaires pushed to the twins’ phones and browsers and 2)
smartphone data measured passively. The questionnaires are subsets of the in-person measures
modified to minimize completion time. For example, twins are asked about their substance use
weekly, about parental monitoring monthly, and complete substance abuse and dependence items
every six months. Details of the remote assessments are available in Table 3.2. Twins receive push
notifications on their phones and in their browsers when a questionnaire is due. The smartphone
applications measure physical location and store a list of nearby places obtained from the Google
Places API. Our use of location data was carefully calibrated to minimize battery consumption and
maximize research value. On iOS, we use the Significant Change location API and locations are
recorded only when the user has moved more than 500 meters and no more frequently than every
five minutes. On Android, the user’s location is recorded every five minutes. These data are stored
and batch uploaded to the study servers over an encrypted connection when the phone connects to
WiFi. Study staff monitor questionnaire completion rates and passive data collection and contact
twins to offer technical support when necessary. For the first year of remote assessment, twins who
completed their assigned surveys received $100 if age 14 or 15 at recruitment and $150 if age 16 or
17 at recruitment. Twins who agreed to participate for another year received $25 after completing
their first survey and $100 at the end of the year.

57
Tab
le3.
2:F
ollo
w-u
pas
sess
men
ts
Typ
eIn
stru
ment
Purp
ose
Fre
quency
Cit
ati
on/N
ote
Quest
ionnair
e
Checkin
gIn
Measu
rem
ent
of
recent
subst
ance
use
quanti
tyand
frequency
Init
ially:
Every
5±
2days
Aft
er
5/8/17:
Every
7±
2days
Conw
ay
etal.
(2014);
Ham
ilto
netal.
(2011)
Lif
eE
vents
Ass
ess
ment
of
signifi
cant
life
events
,desi
gned
for
teenagers
Every
30±
10
days
Billig
etal.
(1996)
Peer
Involv
em
ent/
Engagem
ent
Ass
ess
ment
of
twin
’sre
lati
onsh
ipw
ith
their
frie
nds
Every
25±
3days
Ellio
ttetal.
(1989)
Peer
Subst
ance
Use
Ass
ess
ment
of
twin
’sp
eers
’su
bst
ance
use
Every
30±
5days
Conw
ay
etal.
(2014);
Ham
ilto
netal.
(2011)
Extr
acurr
icula
rA
cti
vit
ies
Ass
ess
ment
of
twin
’sextr
acurr
icula
racti
vit
ies
Init
ially:
Every
40±
3days
Aft
er
11/3/17:
Every
100±
3days
Harr
isetal.
(2009)
Pare
nta
lM
onit
ori
ng
Sta
ndard
ass
ess
ment
of
pare
nta
lm
onit
ori
ng
Every
60±
10
days
Eato
netal.
(2009)
Pers
onali
tySta
ndard
Big
Fiv
em
easu
reof
pers
onality
Init
ially:
Every
180±
3days
Aft
er
3/24/17:
Every
300±
3days
John
etal.
(1991)
Subst
ance
Use
,A
buse
,and
Dep
endence
Sta
ndard
inte
rvie
wass
ess
ing
subst
ance
involv
em
ent
and
dia
gnosi
ng
subst
ance
abuse
and
dep
endence
Every
170±
6days
Conw
ay
etal.
(2014);
Ham
ilto
netal.
(2011)
Socia
lM
edia
Use
Ass
ess
ment
of
whic
hso
cia
lm
edia
pla
tform
sa
twin
use
sand
wit
hw
hom
Once,
at
enro
llm
ent
Develo
ped
for
this
study
Sub
jecti
ve
Eff
ects
Ass
ess
ment
of
the
eff
ects
of
asu
bst
ance
when
firs
ttr
ied
When
atw
infi
rst
use
sa
part
icula
rsu
bst
ance
Hab
ers
tick
etal.
(2011)
Inte
rmit
tent
Use
Dete
rmin
ew
hy
atw
inst
opp
ed
usi
ng
asu
bst
ance
Schedule
dw
hen
atw
inuse
da
subst
ance
two
weeks
ago
but
not
the
week
befo
reD
evelo
ped
for
this
study
Pass
ive
(Phone)
Locati
on
Lati
tude,
longit
ude,
and
accura
cy
obta
ined
from
the
phone’s
op
era
ting
syst
em
Andro
id:
Every
five
min
ute
siO
S:
When
the
twin
moves
XX
mete
rs
Nearb
yP
laces
Pla
ces
clo
seto
agiv
en
twin
locati
on,
obta
ined
from
the
Pla
ces
AP
IW
hen
alo
cati
on
isre
cord
ed
App
Usa
ge
Sta
rtand
end
tim
es
for
the
twin
’ssm
art
phone
app
usa
ge
When
an
app
isop
ened
and
clo
sed
Pass
ive
(Bro
wse
r)
Dom
ain
Nam
es
The
dom
ain
nam
eand
ati
mest
am
pfo
rw
ebsi
tes
vis
ited
by
the
twin
When
atw
invis
its
aU
RL
Term
Vecto
rFre
quency
The
frequency
of
subst
ance
use
rela
ted
term
son
each
websi
tevis
ited
When
atw
invis
its
aU
RL
Page
Conte
nt
The
full
text
of
aw
ebsi
teW
hen
atw
invis
its
aw
hit
e-l
iste
dU
RL
(chose
nto
avoid
the
poss
ibil
ity
of
record
ing
unconse
nte
dth
ird
part
ycom
munic
ati
ons)
Pass
ive
(Oth
er)
Tw
eets
Public
tweets
sent
by
atw
inw
ho
chose
tosh
are
their
Tw
itte
ruse
rnam
eW
hen
atw
intw
eets
Acti
ve
Keep
Tra
ck
(Up
dati
ng)
Cate
gory
Shif
t(S
wit
chin
g)
Bro
wse
r-base
dass
ess
ments
of
executi
ve
functi
on
Every
300
days
Fri
edm
an
etal.
(2016)
58
3.2.4 Phenotype extraction
Most data extraction, cleaning, analysis, and visualization was performed using the R lan-
guage, version 3.4.4 (R Core Team, 2018). Plots were produced with the R package ggplot2, version
2.2.1 (Wickham, 2009). Scripts and documentation are available in a GitHub repository which has
been permanently archived on Zenodo. The location data were subjected to a series of cleaning and
standardization steps. First, points were required to have an accuracy of less than 500 meters and
a timestamp within the study’s data collection period. In order to allow for comparisons between
twins in a pair, each twin pair’s locations were standardized to a series of consecutive time windows
of thirty minutes, starting at their first point and ending at their last point. For each twin, the
point within each window closest to the center of that window was chosen to represent the win-
dow and produce a standardized point. Next, we accounted for the fact that the iOS application
only records a point when the user has moved more than 500 meters by filling forward missing
standardized iOS points for up to 12 hours.
Three variables were derived from the location data: twin distance, fraction of time at home
at night (time at home), and fraction of time at school during the school day (time at school). Twin
distance was calculated for each twin pair by taking their overlapping filled and standardized points
and calculating the distance in meters between each latitude/longitude pair on the WGS84 ellipsoid,
using the geosphere R package, version 1.5-7 (Hijmans, 2017). For computational efficiency, twin
distance was then defined as the average distance each day, for each twin pair. For time at home, a
filled and standardized point was considered “at home” if it was within 100 meters, or approximately
one city block, of any of the home addresses on file for that family, which were geocoded using the
Google Geocoding API. Then, the fraction of points at home between 12 and 5 AM was calculated
each week, for each twin. If a manual inspection showed that a twin was consistently never at home,
we inferred that we had an incorrect home address and removed them from the at home data. For
time at school, a list of public and private schools in the state of Colorado was downloaded from
the ElSi Table Generator maintained by the National Center for Education Statistics. The latest
data release was used, from the 2015-2016 school year. High schools were selected and the physical

59
address of each school was geocoded, using the Google Geocoding API. A filled and standardized
point was considered “at school” if it was within 200 meters of any of the schools in the list. The
distance threshold was increased relative to time at home to account for the size of many high
school campuses in Colorado. Then, those points were subset to include only school hours (8 AM
- 3 PM) and school days, as determined by Colorado public school calendars and visualizations
of the data. Time at school was then defined as the fraction of remaining points at school each
week, for each twin. If a manual inspection showed that a twin was consistently never at school,
we inferred that their school was not included in the ElSi database and removed them from the at
school data.
Parental monitoring was calculated as an additive score. For each question, the maximum
value (most knowledge) was chosen from all parental figures for that twin, in order to avoid an arti-
ficial depression due to, for example, an uninvolved stepfather and an involved mother and father.
Then, the maximum values for each question were added together to produce a score for a given
twin on a given occasion of measurement. Weekly substance use quantity-frequency was calculated
for the three most popular substances in our sample: alcohol (as drinks per week), marijuana (as
marijuana uses per week), and e-cigarettes (as e-cigarette uses per week). Log-transformed versions
of the three substance use phenotypes were used for all subsequent analyses.
3.2.5 Statistical analysis
In order to visualize the longitudinal trajectories of the phenotypes, non-linear mean func-
tions were calculated for twin distance, time at home, time at school, parental monitoring, drinks
per week, marijuana uses per week, and puffs per week using generalized additive mixed models
(GAMMs) fit by the R package gamm4, version 0.2-5 (Wood & Scheipl, 2017). In these models,
the phenotype of interest was predicted by smooth functions of age, which were fit by penalized
regression. The basis dimension for each phenotype was chosen using the residual randomization
test implemented in the R package mgcv, version 1.8-23 (Wood, 2017). The random effects for each
smooth were nested by twin pair for the twin distance model and by twins within twin pairs for

60
all other GAMMs. The ggplot2 extension ggExtra, version 0.8 (Attali & Baker, 2018), was used in
combination with ggplot2 to visualize the estimates from these models.
Mixed-effect linear and quadratic growth models (Grimm et al., 2017), with the intercept
centered at age 17, were fit to time at home, time at school, parental monitoring, drinks per week,
marijuana uses per week, and puffs per week using the R package lme4, version 1.1-17 (Bates et al.,
2015). For time at home, time at school, and parental monitoring the data were truncated at
age 18 before the growth models were fit. Random effects for the intercept, slope, and (in the
quadratic models) quadratic term were included, with twins nested within families. Both the linear
and quadratic models had fixed effects for the intercept, slope, quadratic term, and sex. For all
phenotypes, the quadratic model was preferred by AIC and BIC (Table 3.3) and only quadratic
results will be presented in this paper. For the fixed effects, standard errors and statistical tests
were derived by Satterthwaite’s approximation, as implemented by the lmerTest R package, version
3.0-1 (Kuznetsova et al., 2017). Confidence intervals for the variance-covariance parameters of the
random effects were obtained by the percentile method from nonparametric bootstrap replicates (N
= 1,000), using the boot (version 1.3-20) and broom (version 0.4.4) R packages (Canty & Ripley,
2017; Davison & Hinkley, 1997; Robinson, 2018). Estimates of the growth parameters (intercept,
slope, and quadratic term) for each twin from a given growth model were extracted by adding the
conditional modes of the random effects at the twin and family levels to the fixed effect estimates.
The cross-phenotype growth parameter correlations were then calculated, with confidence intervals
obtained through nonparametric bootstrapping (N = 1,000). A standard multivariate ACE twin
model (Neale & Maes, 1994) was also fit to the growth parameter estimates for each phenotype,
using the OpenMx R package, version 2.7.10 (Neale et al., 2016).

61
Tab
le3.
3:M
od
elfi
tan
dfi
xed
effec
tp
aram
eter
sfo
rth
eli
nea
ran
dqu
adra
tic
mix
ed-e
ffec
tgro
wth
mod
els
of
the
lon
gitu
din
alp
hen
otyp
es
Phenoty
pe
Model
Typ
eM
odel
Com
pari
son
Fix
ed
Eff
ects
AIC
pIn
terc
ept
SE
pSlo
pe
SE
pQ
uadra
tic
SE
pSex
SE
p
Alc
ohol
Lin
ear
32208
<2.2
E-1
60.0
94
0.0
19
1.5
2E
-60.0
61
0.0
12
4.9
4E
-70.0
16
0.0
04
7.2
5E
-5-0
.008
0.0
25
0.7
54
Quadra
tic
31568
0.0
96
0.0
16
1.0
3E
-80.0
53
0.0
10
1.5
2E
-70.0
08
0.0
05
0.0
76
-5.3
5E
-40.0
13
0.9
68
Mari
juana
Lin
ear
-4531.6
<2.2
E-1
60.0
76
0.0
18
3.1
7E
-50.0
33
0.0
10
0.0
01
0.0
05
0.0
03
0.0
90
-0.0
05
0.0
26
0.8
44
Quadra
tic
-5111.6
0.0
77
0.0
17
1.2
4E
-50.0
45
0.0
13
0.0
01
-8.5
1E
-40.0
07
0.9
02
-0.0
04
0.0
24
0.8
60
E-C
igare
ttes
Lin
ear
15207
<2.2
E-1
60.0
36
0.0
22
0.1
02
0.0
92
0.0
20
4.5
8E
-60.0
05
0.0
04
0.2
12
0.0
21
0.0
31
0.4
92
Quadra
tic
13059
0.0
43
0.0
21
0.0
37
0.0
58
0.0
22
0.0
08
0.0
26
0.0
18
0.1
36
0.0
30
0.0
30
0.3
28
Pare
nts
Lin
ear
16596
1.6
3E
-12
16.6
01
0.1
53
<2E
-16
-0.6
21
0.0
88
6.0
8E
-12
-0.0
35
0.0
45
0.4
32
0.0
18
0.2
02
0.9
29
Quadra
tic
16541
16.6
82
0.1
53
<2E
-16
-0.5
93
0.0
96
2.6
8E
-9-0
.047
0.0
48
0.3
30
-0.1
33
0.1
92
0.4
89
Hom
eL
inear
795.4
4<
2.2
E-1
60.6
63
0.0
16
<2E
-16
-0.0
45
0.0
16
0.0
06
0.0
13
0.0
09
0.1
44
-0.0
21
0.0
18
0.2
51
Quadra
tic
702.4
60.6
64
0.0
16
<2E
-16
-0.0
33
0.0
15
0.0
27
0.0
13
0.0
13
0.3
36
-0.0
26
0.0
17
0.1
29
School
Lin
ear
-479.4
22.2
9E
-13
0.5
09
0.0
15
<2E
-16
-0.1
15
0.0
13
<2E
-16
-0.0
28
0.0
09
0.0
01
0.0
21
0.0
19
0.2
81
Quadra
tic
-538.6
50.5
11
0.0
16
<2E
-16
-0.0
99
0.0
12
2.5
8E
-14
-0.0
21
0.0
11
0.0
59
0.0
19
0.0
18
0.2
99
Alc
ohol
=D
rinks
per
week,
Mari
juana
=M
ari
juana
use
sp
er
week,
E-C
igare
ttes
=E
-Cig
are
tte
use
sp
er
week,
Pare
nts
=P
are
nta
lm
onit
ori
ng
score
,H
om
e=
Fra
cti
on
of
tim
eat
hom
eat
nig
ht,
School
=Fra
cti
on
of
tim
eat
school
duri
ng
the
school
day.

62
The time at home data for each twin was used to infer when they moved out of the family
home. Two independent raters examined each twin’s data and considered them to have moved out
when they had four or more consecutive weeks where the fraction of time spent at home was less
than two days in seven (equivalent to spending weekends at home and living away during the week)
after age 18. After resolving disagreements between the raters and averaging their estimates, the
derived time of moving out of the home was used as the knot point in bilinear mixed-effect growth
models (Grimm et al., 2017) for the substance use phenotypes, fit using lme4 (Bates et al., 2015).
The fit of the bilinear growth models was compared to monolinear models and to models with a
knot point fixed at age 18.5.
3.3 Results
3.3.1 Sample description
The CoTwins sample consists of 110 monozygotic (MZ) twin pairs (67 female and 43 male)
and 225 dizygotic (DZ) twin pairs (74 female, 63 male, and 88 opposite-sex). Their age at recruit-
ment was between 14 and 17 (mean: 16.1; SD: 1.1). Their ethnicity distribution, as described by
their parents, is 77.1% non-Hispanic white, 14.7% Hispanic, 6.1% multi-racial, 0.6% Asian, 0.6%
African-American, 0.3% Native American, and 0.6% unknown. Compared to the populations of
the United States and the state of Colorado, the families in our sample are whiter, wealthier, and
better educated (Table 3.4). Factors that may have contributed to these discrepancies include the
location of our testing facility, differences in willingness to participate in research, our requirement
that twins have their own smartphones, or the fact that the Colorado Twin Registry contains only
twins born in Colorado.
3.3.2 Substance use and dependence
Twins completed a standard assessment of substance use and dependence (Conway et al.,
2014) during their initial visit and every six months during the remote follow-up period. As
expected from a non-clinical sample of adolescents, substance use and dependence rates were low

63
Table 3.4: Sample household demographics compared to the populations of Colorado and the UnitedStates
CoTwins Colorado USA
Non-Hispanic white 77.1% 69.0% 62.0%Bachelor’s degree or higher 62.1% 38.7% 30.3%Median household income $100,000-$150,000 $62,520 $55,322
Estimates for the state of Colorado and the United States were obtained from the AmericanCommunity Survey (United States Census Bureau, 2016a,b,c).
at intake, albeit lower than state-wide and national samples of high school students (Table 3.5).
Most twins had never used a substance at intake: the average number of types of drugs ever tried
at intake was 0.04 (SD = 1.03). The rates of use in the CoTwins sample may be depressed by
the demographic differences described above and by the fact that some twins in the sample had
not yet entered high school when they were recruited. We find substantial test-retest reliability of
DSM-IV substance dependence symptom counts between the intake assessment and the first remote
assessment, six months later: rank correlations of 0.49 for alcohol, 0.38 for marijuana, and 0.34 for
tobacco.

64
Tab
le3.
5:S
ub
stan
ceu
sean
dd
epen
den
cera
tes
atin
take
asco
mp
ared
tost
ate-
wid
ean
dn
atio
nal
sam
ple
sof
tenth
gra
der
s
Eve
rU
sed
Cu
rren
tU
ser
Dep
end
ent
inL
ast
Yea
r
CoT
win
sC
olor
ado
US
AC
oTw
ins
Col
orad
oU
SA
CoT
win
s
Alc
ohol
37.9
%58
.2%
42.2
%13
.3%
29.1
%19
.7%
4.5%
Mar
iju
ana
16.6
%35
.4%
30.7
%6.
4%18
.8%
15.7
%2.
1%C
igar
ette
s—
18.6
%15
.9%
0.4%
8.9%
5.0%
1.2%
(All
tob
acc
o)
Coca
ine
0.9%
5.6%
2.1%
0.0%
—0.
5%0.
0%H
eroi
n0.
0%2.
0%0.
4%0.
0%—
0.1%
0.0%
Th
eC
olor
ado
stat
isti
csw
ere
der
ived
from
the
Hea
lthy
Kid
sC
olor
ado
Su
rvey
(Un
iver
sity
ofC
olora
do
An
schu
tzC
om
mu
nit
yE
pid
emio
logy
and
Pro
gram
Eva
luat
ion
Gro
up
,20
15)
and
the
nat
ion
alst
atis
tics
wer
ed
eriv
edfr
omM
on
itori
ng
the
Futu
re(M
iech
etal.
,20
17).
Inb
oth
case
s,10
thgr
ade
dat
aw
asu
sed
,to
corr
esp
ond
toth
em
edia
nag
eof
the
CoT
win
ssa
mp
leat
recr
uit
men
t.C
urr
ent
use
was
defi
ned
asu
sein
the
pas
t30
day
s.—
=N
otas
ked
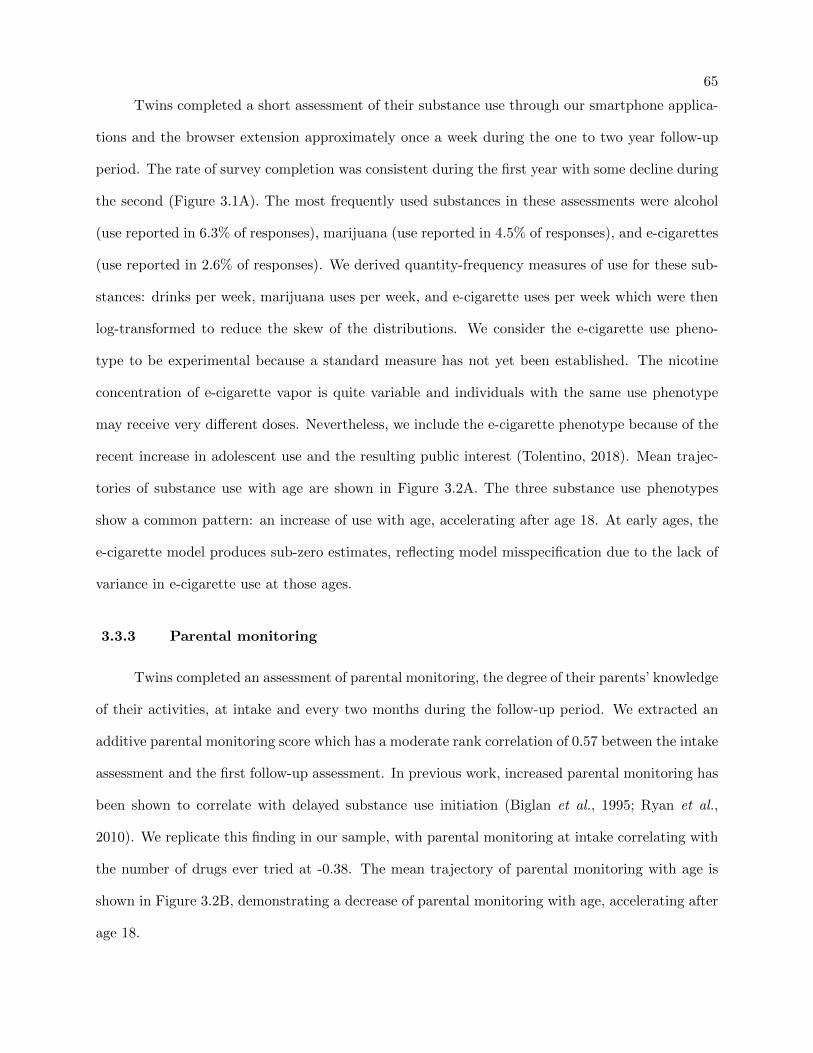
65
Twins completed a short assessment of their substance use through our smartphone applica-
tions and the browser extension approximately once a week during the one to two year follow-up
period. The rate of survey completion was consistent during the first year with some decline during
the second (Figure 3.1A). The most frequently used substances in these assessments were alcohol
(use reported in 6.3% of responses), marijuana (use reported in 4.5% of responses), and e-cigarettes
(use reported in 2.6% of responses). We derived quantity-frequency measures of use for these sub-
stances: drinks per week, marijuana uses per week, and e-cigarette uses per week which were then
log-transformed to reduce the skew of the distributions. We consider the e-cigarette use pheno-
type to be experimental because a standard measure has not yet been established. The nicotine
concentration of e-cigarette vapor is quite variable and individuals with the same use phenotype
may receive very different doses. Nevertheless, we include the e-cigarette phenotype because of the
recent increase in adolescent use and the resulting public interest (Tolentino, 2018). Mean trajec-
tories of substance use with age are shown in Figure 3.2A. The three substance use phenotypes
show a common pattern: an increase of use with age, accelerating after age 18. At early ages, the
e-cigarette model produces sub-zero estimates, reflecting model misspecification due to the lack of
variance in e-cigarette use at those ages.
3.3.3 Parental monitoring
Twins completed an assessment of parental monitoring, the degree of their parents’ knowledge
of their activities, at intake and every two months during the follow-up period. We extracted an
additive parental monitoring score which has a moderate rank correlation of 0.57 between the intake
assessment and the first follow-up assessment. In previous work, increased parental monitoring has
been shown to correlate with delayed substance use initiation (Biglan et al., 1995; Ryan et al.,
2010). We replicate this finding in our sample, with parental monitoring at intake correlating with
the number of drugs ever tried at -0.38. The mean trajectory of parental monitoring with age is
shown in Figure 3.2B, demonstrating a decrease of parental monitoring with age, accelerating after
age 18.
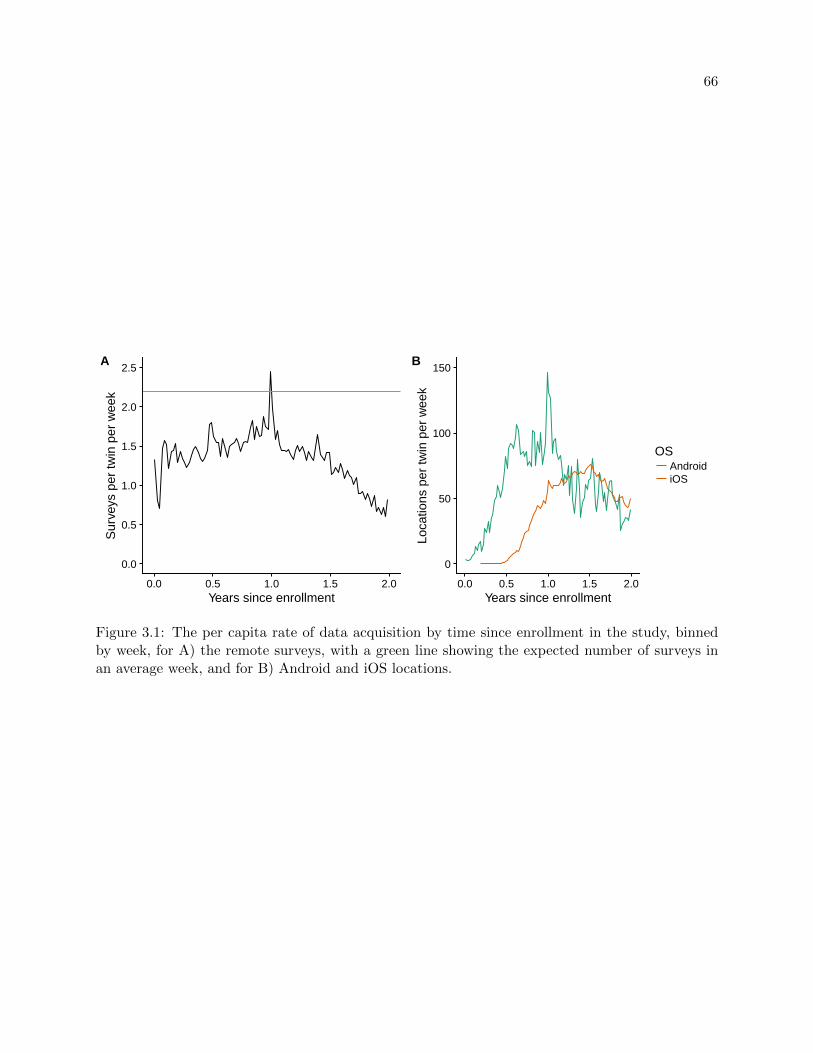
66
0.0
0.5
1.0
1.5
2.0
2.5
0.0 0.5 1.0 1.5 2.0Years since enrollment
Sur
veys
per
twin
per
wee
k
A
0
50
100
150
0.0 0.5 1.0 1.5 2.0Years since enrollment
Loca
tions
per
twin
per
wee
k
OSAndroidiOS
B
Figure 3.1: The per capita rate of data acquisition by time since enrollment in the study, binnedby week, for A) the remote surveys, with a green line showing the expected number of surveys inan average week, and for B) Android and iOS locations.

67
0.0
0.2
0.4
14 16 18 20Age (years)
Pre
dict
ed ln
of s
ubst
ance
use
Alcohol Marijuana E−Cigarettes
A
12
14
16
18
14 16 18 20Age (years)
Pre
dict
ed p
aren
tal m
onito
ring
scor
e
B
1 km
10 km
100 km
1,000 km
14 16 18 20Age (years)
Pre
dict
ed lo
g10
of d
ista
nce
(met
ers)
Zygosity MZ DZ OS
C
0.00
0.25
0.50
0.75
1.00
14 16 18 20Age (years)
Pre
dict
ed fr
actio
n of
tim
e
Home School
D
Figure 3.2: The smoothed mean values conditional on age, as calculated with generalized additivemixed models (GAMMs), of A) drinks per week (Alcohol), marijuana uses per week (Marijuana),and e-cigarette uses per week (E-Cigarettes), B) parental monitoring, C) the distance of twins in atwin pair conditional on twin zygosity (monozygotic (MZ), same-sex dizygotic (DZ), and opposite-sex dizygotic (DZ)), and D) the fraction of time spent at the family home at night (Home) andthe fraction of time spent at school during the school day (School). Uncertainty in the estimate isshown as 95% confidence intervals and the marginal histograms show the relative number of datapoints available for a given phenotype in a given age range.

68
3.3.4 Locations
The smartphone applications installed on twins’ phones regularly record their physical loca-
tion, using the Android and iOS location subsystems. After quality control, the data freeze used for
these analyses had 6,409,846 recorded locations from 573 twins with a median number of locations
per twin of 6,062. Location tracking was not implemented in the smartphone applications when
recruitment began and was activated for iOS after Android, which is reflected in the number of
locations recorded per twin over time (Figure 3.1B). Otherwise, the rate of location acquisition has
been consistent, aside from a drop in the second year of enrollment.
In configuring location collection, we had to trade-off between three parameters: rate, accu-
racy, and battery life. Before quality control, the median accuracy was 65 meters. After removing
locations with an accuracy worse than 500 meters, it is 20 meters. Both accuracies are sufficient to
place an individual on a city block but not in a particular business.
The Android and iOS location modules are black boxes which have unknown differences from
each other in how they perform sensor fusion and produce location estimates. One known difference
between our two smartphone applications is that the Android application records a location every
five minutes while the iOS application records a location when the twin moves more than 500 meters.
These patterns can be seen in the distributions of the time and distance between successive points,
as shown in Figure 3.3. The successive points of twins using Android phones are closer to each
other in time and space than those of twins using iPhones. Successive points are very rarely further
apart than 1 day or 100 kilometers.
The quality controlled points were then processed further: first, twins in a twin pair were
standardized to a common set of 30 minute time windows, allowing us to calculate the distance
between them. Second, twins using iPhones had their missing standardized locations filled from
their last recorded location, up to 12 hours earlier, in order to account for the fact that the iOS
application will not record new locations if a twin’s phone is stationary. Figures 3.4 and 3.5 show
the distribution of the length of these fills, conditional on the hour of the day and the day of the
week. Fills that start between 8 PM and 3 AM, between 7 AM and 9 AM, or on Monday through
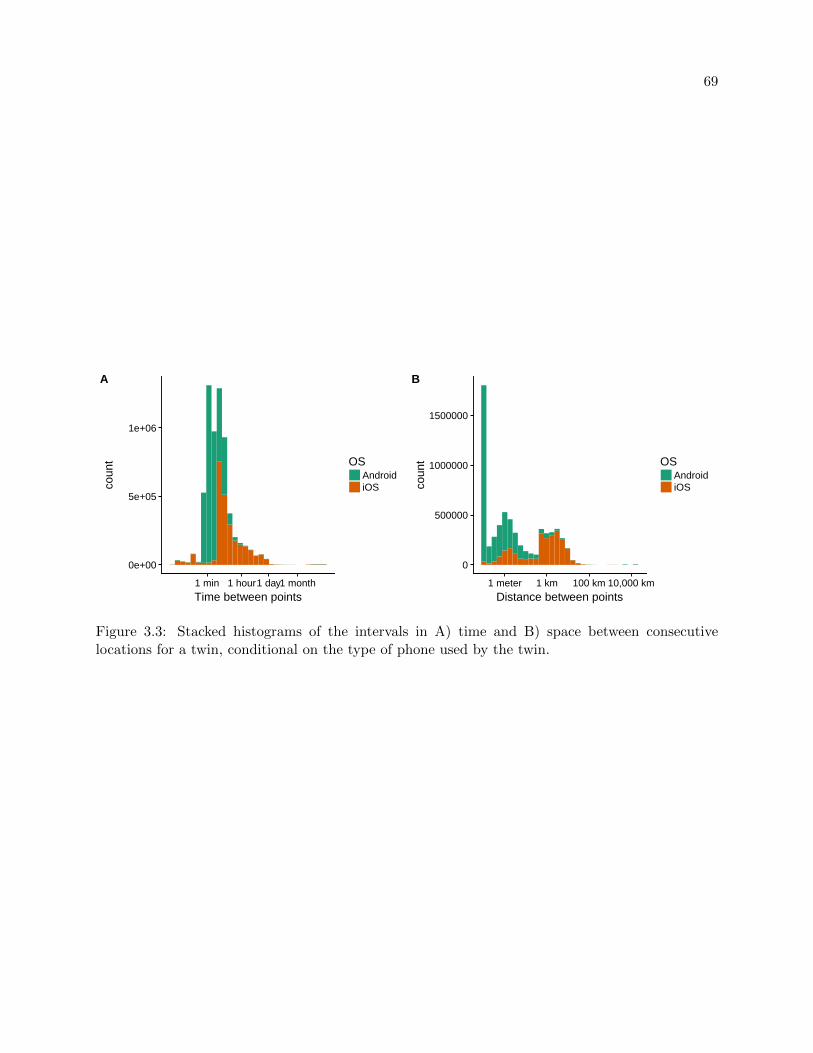
69
0e+00
5e+05
1e+06
1 min 1 hour1 day1 monthTime between points
coun
t OSAndroidiOS
A
0
500000
1000000
1500000
1 meter 1 km 100 km 10,000 kmDistance between points
coun
t OSAndroidiOS
B
Figure 3.3: Stacked histograms of the intervals in A) time and B) space between consecutivelocations for a twin, conditional on the type of phone used by the twin.

70
Thursday are longer, reflecting our subjects tendency to move less at night, on weekends, and
during the school day.
Figure 3.2C shows the mean trajectory of the distance between twins in a twin pair (twin
distance). There is a general increase after age 18 but monozygotic or identical twins remain
closer to each other than dizygotic or fraternal twins. This difference can be interpreted as a
form of gene by environment correlation, where greater genetic similarity is associated with greater
environmental similarity. Alternatively, we can state that location and environment are heritable.
We used a database of public and private schools and the family addresses on record for
each twin to determine whether each location was “at home,” “at school,” or neither. We then
calculated the fraction of time a twin spent at school during the school day (time at school) and
the fraction of time a twin spent at home at night (time at home) over time. Figure 3.2D shows
the mean trajectories of these phenotypes which decrease with age, accelerating after age 18. The
lower fraction of time at school as compared to time at home is likely due to the large size of some
high school campuses and the absence of some schools from the database. Time at home and time
at school showed the expected patterns with time of day and day of week with time at home higher
at night than during the day and lower on weekend nights than during the week (Figure 3.6). Time
at school was highest on school days, during school hours and lower on Friday than other school
days (Figure 3.7). Time at school was also much lower on school holidays than other weekdays
(Figure 3.8).
3.3.5 Growth models
In order to understand the change over time of the longitudinal phenotypes described above,
we fit linear and quadratic mixed-effect growth models, with individual twins nested within families,
to drinks per week, marijuana uses per week, e-cigarette uses per week, parental monitoring, time
at home, and time at school. Parental monitoring, time at home, and time at school were not fit on
data past age 18 because they lack validity after the twins become adults and graduate from high
school. Table 3.3 summarizes the fixed effect estimates and the comparisons between the linear and

71
0
5
10
0 1 2 3 4 5 6 7 8 9 10 11 12 13 14 15 16 17 18 19 20 21 22 23Hour
Fill
leng
th (
hour
s)
Figure 3.4: A boxplot of the length in hours of the forward fills of missing iOS location data,conditional on the hour of the day of the point being filled forward. Outliers are not displayed dueto extensive overplotting.

72
0
5
10
Sun Mon Tue Wed Thu Fri SatDay of week
Fill
leng
th (
hour
s)
Figure 3.5: A boxplot of the length in hours of the forward fills of missing iOS location data,conditional on the day of the week of the point being filled forward. Outliers are not displayed dueto extensive overplotting.
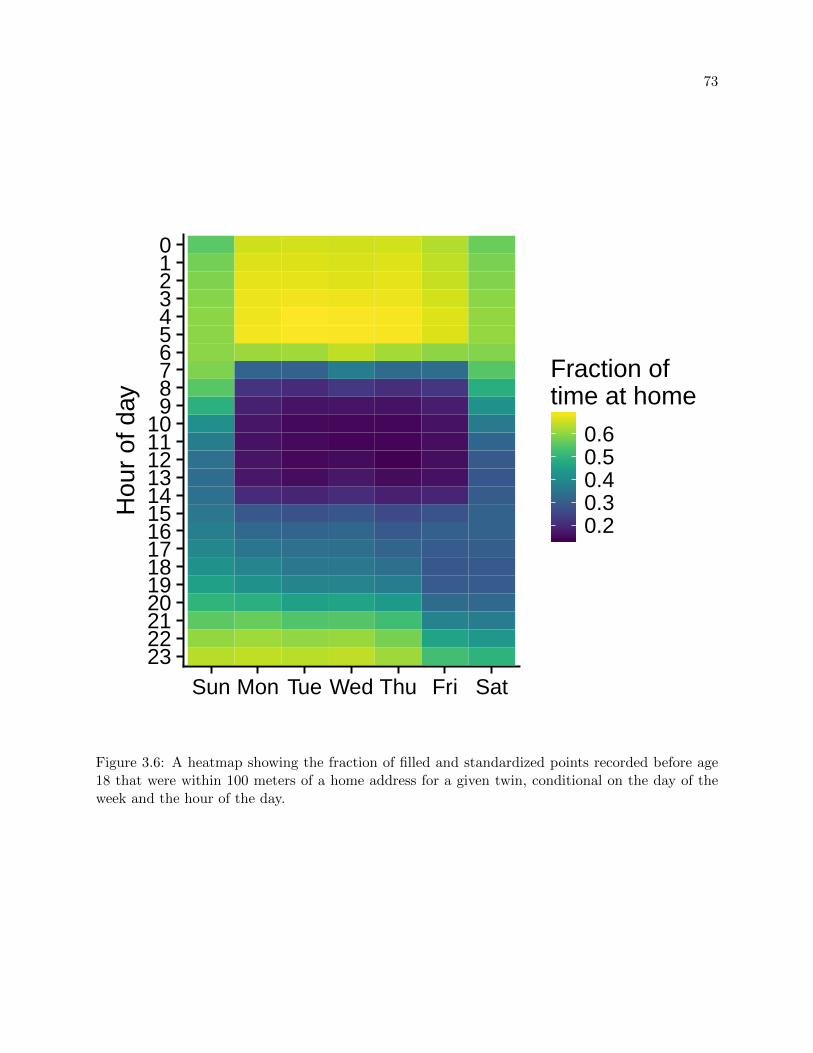
73
2322212019181716151413121110
9876543210
Sun Mon Tue Wed Thu Fri Sat
Hou
r of
day
0.20.30.40.50.6
Fraction oftime at home
Figure 3.6: A heatmap showing the fraction of filled and standardized points recorded before age18 that were within 100 meters of a home address for a given twin, conditional on the day of theweek and the hour of the day.
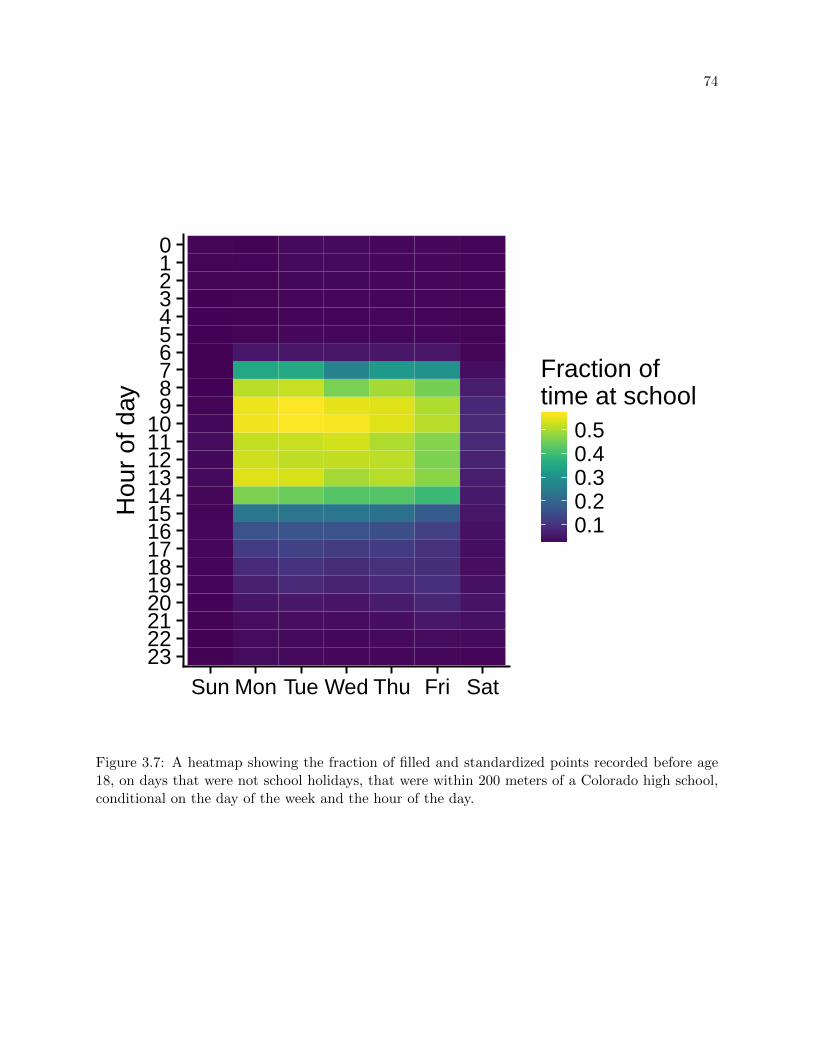
74
2322212019181716151413121110
9876543210
Sun Mon Tue Wed Thu Fri Sat
Hou
r of
day
0.10.20.30.40.5
Fraction oftime at school
Figure 3.7: A heatmap showing the fraction of filled and standardized points recorded before age18, on days that were not school holidays, that were within 200 meters of a Colorado high school,conditional on the day of the week and the hour of the day.

75
2018
2017
Jan Feb Mar Apr May Jun Jul Aug Sep Oct Nov Dec
MonTue
WedThuFri
SatSun
MonTue
WedThuFri
SatSun
0.00.20.40.60.8
Fraction at school
Figure 3.8: A calendar heatmap showing the fraction of filled and standardized points recordedbefore age 18 that were within 200 meters of a Colorado high school, for each calendar day. Schoolholidays consistently have a much lower fraction of points at school.

76
quadratic models. For every phenotype, the quadratic model fit significantly better than the linear
model, in a test accounting for model complexity. Sex did not have a significant effect on any of
the phenotypes. For the substance use phenotypes, this reflects the results of national and state-
wide surveys (Miech et al., 2017; University of Colorado Anschutz Community Epidemiology and
Program Evaluation Group, 2015). The intercept at age 17 was greater than zero for all phenotypes
but was smallest for e-cigarettes. The three substance use phenotypes increased with age, while
parental monitoring, time at home, and time at school decreased with age. Figure 3.9 shows the
variance explained by the random effects of the growth models. Parental monitoring had the most
variance, while the substance use phenotypes were intermediate, and time at home and time at
school had the least variance. For all phenotypes, non-zero amount of variance were assigned to
the intercept, slope, and quadratic parameters, at both the individual and family levels. Figure
3.10 shows the correlations of the random effects of the growth models. The intercept-quadratic
correlations were consistently negative for parental monitoring, time at home, and time at school,
indicating that individuals and families who were higher on these variables at age 17 tended to
have a lower or more negative acceleration of their trajectories.
At intake, twins were asked how many days of school they skipped in the past month. We
find weak evidence for a correlation between this value and the intercept estimate from the time at
school growth model (correlation = -0.04, p = 0.43). Since twins could only respond with a whole
number of days skipped, their responses have low variance and time at school may reflect twins
leaving school for only part of the day.
We performed twin variance decomposition on the growth parameter estimates for each twin,
in order to understand the genetic and environmental effects on change in these behaviors. These
results are summarized in Tables 3.6 and 3.7. For the substance use phenotypes, the intercept of
marijuana and e-cigarette use was moderately heritable, as was the slope of alcohol and marijuana
use. The quadratic terms of all three phenotypes were moderately heritable. A significant common
environment component was found for the intercept of alcohol use and the quadratic term of e-
cigarette use. Of parental monitoring, time at home, and time at school, only time at home showed

77
0.0
0.5
1.0
1.5
2.0
Alcohol Marijuana E−Cigarettes Parents Home School
Est
imat
e
Individual SD InterceptIndividual SD SlopeIndividual SD QuadraticFamily SD InterceptFamily SD SlopeFamily SD QuadraticResidual Variance
Figure 3.9: Variance explained by the random effect parameters of the quadratic growth models,in standard deviations, with bootstrapped (N = 1,000) 95% confidence intervals. Alcohol = Drinksper week, Marijuana = Marijuana uses per week, E-Cigarettes = E-Cigarette uses per week, Parents= Parental monitoring score, Home = Fraction of time at home at night, School = Fraction of timeat school during the school day.

78
−1.0
−0.5
0.0
0.5
1.0
Alcohol Marijuana E−Cigarettes Parents Home School
Est
imat
e
Individual Intercept <−> SlopeIndividual Intercept <−> QuadraticIndividual Slope <−> QuadraticFamily Intercept <−> SlopeFamily Intercept <−> QuadraticFamily Slope <−> Quadratic
Figure 3.10: Correlations between the random effect parameters of the quadratic growth modelswith bootstrapped (N = 1,000) 95% confidence intervals. Alcohol = Drinks per week, Marijuana =Marijuana uses per week, E-Cigarettes = E-Cigarette uses per week, Parents = Parental monitoringscore, Home = Fraction of time at home at night, School = Fraction of time at school during theschool day.

79
significant heritability, for its intercept and quadratic terms. Significant common environment
components were found for all three phenotypes for the intercept and quadratic terms, and for the
slope term of parental monitoring and time at school. Significant genetic correlations were found
between the growth parameters for the three substance use phenotypes.
In order to understand the degree to which variation over time in one phenotype predicts
variation over time in another, we calculated the cross-phenotype correlations of the individual
growth model estimates, shown in Figure 3.11. We found significant positive intercept-intercept
and slope-slope correlations amongst the substance use phenotypes, indicating that use and change
of use of one substance are associated with use and change of use in another. Parental monitoring
and the substance use phenotypes had significant negative intercept-intercept correlations but low
or non-existent slope-slope correlations, indicating that increased parental monitoring is correlated
with lower substance use rates but not their change over the time period measured in this study.
Time at home and time at school had significant positive intercept-intercept and slope-slope cor-
relations while time at home and parental monitoring had a positive slope-slope correlation. We
found no evidence of correlations between parental monitoring and time at school. Unexpectedly,
we also found little to no evidence of correlations between time at home and time at school, on one
hand, and the substance use phenotypes, on the other.
Two independent raters used the time at home data to identify the point in time where each
twin was likely to have moved out of their family home. The two raters had a Cohen’s kappa
concordance of 0.86, with a mean absolute difference of two weeks, collectively identifying 76 twins
as having moved out. Every month, twins were asked if they had moved out of the family home.
83 twins responded “Yes” to this question at some point, 44 of whom were also identified as having
moved out in the time at home analysis. This difference reflects twins who answered surveys
when location tracking wasn’t functioning for them, twins whose location tracking was functional
when they weren’t answering surveys, twins who moved to a new home with their families without
reporting the new address, and twins who incorrectly responded “No” to the survey. For twins
present in both data sets, the median difference between the location-derived and self-reported
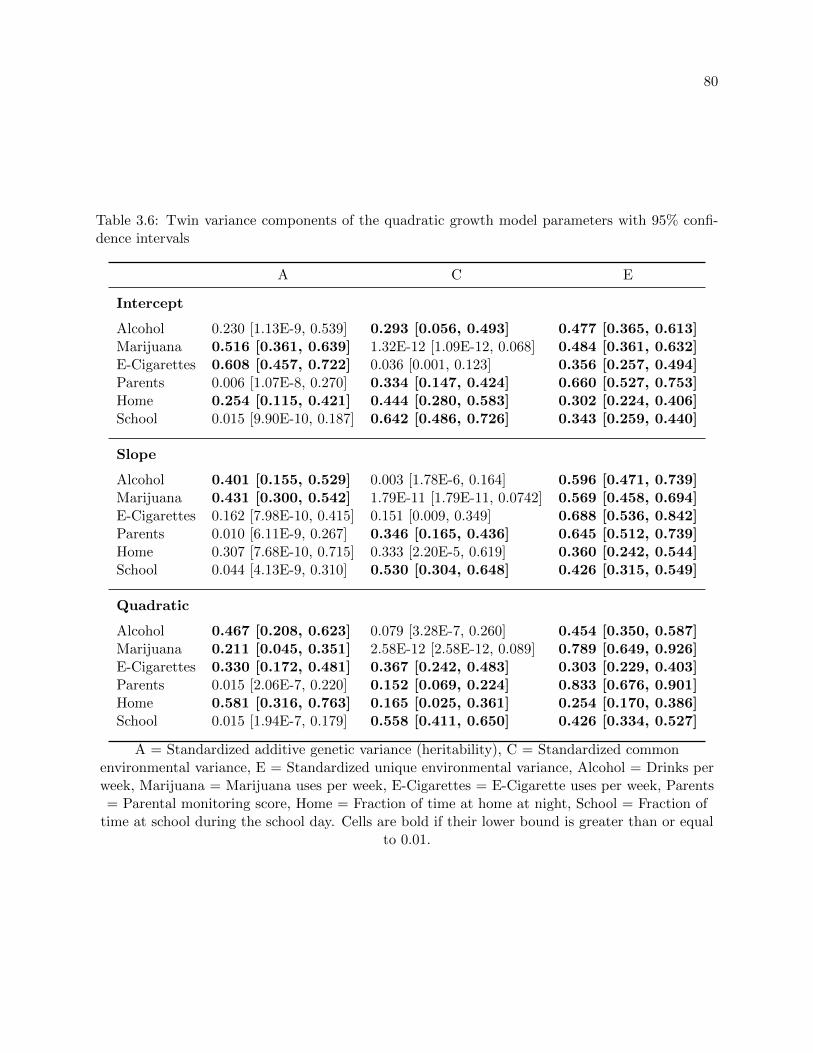
80
Table 3.6: Twin variance components of the quadratic growth model parameters with 95% confi-dence intervals
A C E
Intercept
Alcohol 0.230 [1.13E-9, 0.539] 0.293 [0.056, 0.493] 0.477 [0.365, 0.613]Marijuana 0.516 [0.361, 0.639] 1.32E-12 [1.09E-12, 0.068] 0.484 [0.361, 0.632]E-Cigarettes 0.608 [0.457, 0.722] 0.036 [0.001, 0.123] 0.356 [0.257, 0.494]Parents 0.006 [1.07E-8, 0.270] 0.334 [0.147, 0.424] 0.660 [0.527, 0.753]Home 0.254 [0.115, 0.421] 0.444 [0.280, 0.583] 0.302 [0.224, 0.406]School 0.015 [9.90E-10, 0.187] 0.642 [0.486, 0.726] 0.343 [0.259, 0.440]
Slope
Alcohol 0.401 [0.155, 0.529] 0.003 [1.78E-6, 0.164] 0.596 [0.471, 0.739]Marijuana 0.431 [0.300, 0.542] 1.79E-11 [1.79E-11, 0.0742] 0.569 [0.458, 0.694]E-Cigarettes 0.162 [7.98E-10, 0.415] 0.151 [0.009, 0.349] 0.688 [0.536, 0.842]Parents 0.010 [6.11E-9, 0.267] 0.346 [0.165, 0.436] 0.645 [0.512, 0.739]Home 0.307 [7.68E-10, 0.715] 0.333 [2.20E-5, 0.619] 0.360 [0.242, 0.544]School 0.044 [4.13E-9, 0.310] 0.530 [0.304, 0.648] 0.426 [0.315, 0.549]
Quadratic
Alcohol 0.467 [0.208, 0.623] 0.079 [3.28E-7, 0.260] 0.454 [0.350, 0.587]Marijuana 0.211 [0.045, 0.351] 2.58E-12 [2.58E-12, 0.089] 0.789 [0.649, 0.926]E-Cigarettes 0.330 [0.172, 0.481] 0.367 [0.242, 0.483] 0.303 [0.229, 0.403]Parents 0.015 [2.06E-7, 0.220] 0.152 [0.069, 0.224] 0.833 [0.676, 0.901]Home 0.581 [0.316, 0.763] 0.165 [0.025, 0.361] 0.254 [0.170, 0.386]School 0.015 [1.94E-7, 0.179] 0.558 [0.411, 0.650] 0.426 [0.334, 0.527]
A = Standardized additive genetic variance (heritability), C = Standardized commonenvironmental variance, E = Standardized unique environmental variance, Alcohol = Drinks perweek, Marijuana = Marijuana uses per week, E-Cigarettes = E-Cigarette uses per week, Parents= Parental monitoring score, Home = Fraction of time at home at night, School = Fraction of
time at school during the school day. Cells are bold if their lower bound is greater than or equalto 0.01.

81
Table 3.7: Correlations between the twin variance components with 95% confidence intervals
rA rC rE
Intercept ↔ Slope
Alcohol -0.451 [-1.0, 0.294] 1.0 [-1.0, 1.0] 0.127 [-0.048, 0.293]Marijuana 0.712 [0.507, 0.952] 0.075 [-1.0, 1.0] -0.097 [-0.255, 0.069]E-Cigarettes -0.086 [-1.0, 1.0] 0.320 [-0.668, 1.0] 0.194 [0.019, 0.356]Parents -1.0 [-1.0, 1.0] 0.147 [-0.470, 0.422] 0.064 [-0.064, 0.207]Home -0.333 [-1.0, 1.0] -0.320 [-1.0, 0.210] -0.302 [-0.479, -0.099]School -1.0 [-1.0, 1.0] 0.198 [-0.030, 0.458] 0.206 [0.035, 0.383]
Intercept ↔ Quadratic
Alcohol -0.752 [-1.0, 1.0] -1.0 [-1.0, 1.0] -0.472 [-0.598, -0.325]Marijuana -0.240 [-0.502, 1.0] 0.353 [-1.0, 1.0] -0.527 [-0.629, -0.405]E-Cigarettes -0.973 [-1.0, -0.781] 0.938 [0.234, 1.0] -0.122 [-0.315, 0.066]Parents -1.0 [-1.0, 0.994] -0.691 [-0.909, -0.369] -0.704 [-0.759, -0.627]Home -0.986 [-1.0, -0.865] -0.776 [-1.0, -0.416] -0.727 [-0.809, -0.618]School -1.0 [-1.0, 1.0] -1.0 [-1.0, -0.998] -0.959 [-0.968, -0.947]
Slope ↔ Quadratic
Alcohol 0.923 [0.744, 1.0] -1.0 [-1.0, 1.0] 0.784 [0.710, 0.843]Marijuana 0.511 [0.168, 0.769] 0.760 [-1.0, 1.0] 0.120 [-0.017, 0.253]E-Cigarettes -0.148 [-1.0, 1.0] 0.628 [0.127, 1.0] -0.162 [-0.330, 0.006]Parents 1.0 [-1.0, 1.0] 0.613 [0.276, 0.890] 0.636 [0.549, 0.706]Home 0.487 [-1.0, 1.0] 0.846 [-1.0, 1.0] 0.738 [0.587, 0.839]School 1.0 [-1.0, 1.0] -0.173 [-0.446, 0.062] -0.061 [-0.232, 0.099]
rA = Genetic correlation, rC = Common environment correlation, rE = Unique environmentcorrelation, Alcohol = Drinks per week, Marijuana = Marijuana uses per week, E-Cigarettes =E-Cigarette uses per week, Parents = Parental monitoring score, Home = Fraction of time at
home at night, School = Fraction of time at school during the school day. Cells are bold if theirupper and lower bounds exclude zero.
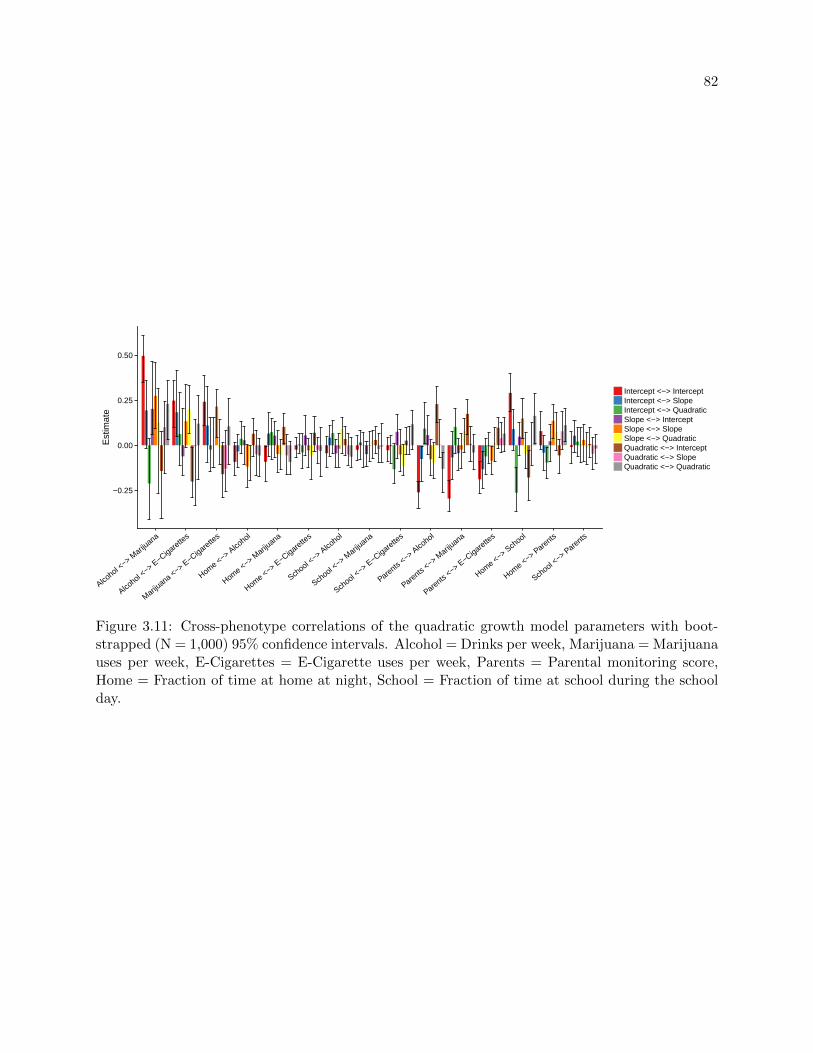
82
−0.25
0.00
0.25
0.50
Alcohol <
−> Mariju
ana
Alcohol <
−> E−Cigarette
s
Marijuana <−> E
−Cigarettes
Home <−> Alco
hol
Home <−> Mariju
ana
Home <−> E−Cigarette
s
School <
−> Alco
hol
School <
−> Mariju
ana
School <
−> E−Cigarette
s
Parents <−> A
lcohol
Parents <−> M
arijuana
Parents <−> E
−Cigarettes
Home <−> Sch
ool
Home <−> Parents
School <
−> Parents
Est
imat
e
Intercept <−> InterceptIntercept <−> SlopeIntercept <−> QuadraticSlope <−> InterceptSlope <−> SlopeSlope <−> QuadraticQuadratic <−> InterceptQuadratic <−> SlopeQuadratic <−> Quadratic
Figure 3.11: Cross-phenotype correlations of the quadratic growth model parameters with boot-strapped (N = 1,000) 95% confidence intervals. Alcohol = Drinks per week, Marijuana = Marijuanauses per week, E-Cigarettes = E-Cigarette uses per week, Parents = Parental monitoring score,Home = Fraction of time at home at night, School = Fraction of time at school during the schoolday.

83
measures of when they moved out of their family home was 2.9 weeks, well within the resolution of
the survey. We then used these estimates as the knot points in bilinear mixed-effect growth models
of the substance use phenotypes, providing a test of whether moving out of the family home affects
substance use, above and beyond the general effect of age. The e-cigarette use model failed to
converge and is omitted from the results, shown in Table 3.8. Neither alcohol use nor marijuana
use had a significant fixed effect for the deviation of the slope after moving out. However, in
comparisons to a linear model and a bilinear model with the knot point fixed at age 18.5, the
dynamic knot point model fit substantially better than the two alternatives for alcohol use. The
dynamic knot point model had a worse fit than the fixed knot point model for marijuana use.
These results suggest that alcohol use behavior does change when moving out of the family home
but marijuana use behavior does not, or does after a longer lag.

84
Tab
le3.
8:M
od
elfi
tan
dfi
xed
effec
tp
aram
eter
sfo
rth
eb
ilin
ear
mix
ed-e
ffec
tgr
owth
mod
els
Mod
elC
omp
aris
onF
ixed
Eff
ects
Ph
enot
yp
eM
odel
Typ
eA
ICp
Inte
rcep
tS
Ep
Slo
pe1
SE
pS
lop
e2S
Ep
Alc
ohol
Lin
ear
8303
.00.
051
0.04
80.
283
0.25
00.
049
2.5
4E
-6—
——
Fix
edK
not
Poi
nt
8223
.4<
2.2E
-16
0.06
90.
044
0.11
80.
219
0.05
31.2
3E
-40.1
08
0.1
24
0.3
90
Dyn
amic
Kn
otP
oint
8207
.3<
2.2E
-16
0.06
20.
043
0.15
20.
233
0.05
01.3
5E
-50.1
04
0.1
33
0.4
35
Mar
iju
ana
Lin
ear
-23.
240.
084
0.04
20.
050
0.05
00.
031
0.1
10
——
—F
ixed
Kn
otP
oint
-344
.69
<2.
2E-1
60.
090
0.04
30.
041
0.04
20.
050
0.4
04
0.0
48
0.0
83
0.5
64
Dyn
amic
Kn
otP
oint
-270
.27
10.
088
0.04
30.
043
0.04
20.
043
0.3
28
0.0
32
0.0
85
0.7
03
Alc
ohol
=D
rin
ks
per
wee
k,
Mar
iju
ana
=M
arij
uan
au
ses
per
wee
k.

85
3.4 Discussion
In this paper, we have demonstrated that ecological momentary assessment (EMA) and
location tracking, administered with smartphone applications, can be used to measure substance
use relevant behavioral and environmental variables, consistently, scalably, and at high frequency.
Prior work has shown that substance use can be measured using EMA (Shiffman, 2009; Collins
et al., 2003) but previous studies of adolescent substance use and substance use genetics have had a
frequency of assessment measured in years or used a single occasion of measurement (Bornovalova
et al., 2018; Vrieze et al., 2013, 2012; Young et al., 2006; Pagan et al., 2006; Krueger et al., 2002;
Stallings et al., 2014). In contrast, our approach was able to provide weekly measurements of
substance use and semiannual measurements of substance dependence without the expense of an
extensive research staff. In accord with those previous studies, we find that adolescent substance
use rates are heritable. Additionally, we find, for the first time, that change in use over a period of
one to two years is heritable.
High frequency location data is powerful because it can be linked to other data sets with
geographic information. We used the location data to measure the fraction of time that twins spent
at home at night and at school during the school day. These variables measure forms of delinquent
behavior that have been associated with substance use initiation and escalation (Masten et al.,
2008; Henry & Thornberry, 2010; Colder et al., 2013). The fraction of time spent at school during
the school day was consistently lower than the fraction of time spent at home at night (Figure
3.2D), likely a reflection of the large size of many suburban and rural high schools in Colorado. For
a smaller or more geographically concentrated sample, this issue could be addressed by mapping
the campuses of all possible schools. This was not possible for this study, so our measure of time at
school during the school day is confounded with the type of school attended and possibly the area
in which a subject resides. Our measure of time at home at night is likely to be downwardly biased
in families where a child sometimes stays with relatives or in divorced families, as our set of home
addresses for a family may not include all homes for those twins. Nevertheless, these variables
showed the expected relationships with the day of the week, the hour of the day (Figures 3.6 and

86
3.7), and the Colorado public school calendar (Figure 3.8), evidence of their validity. A notable
property of all the longitudinal phenotypes is an inflection after age 18 (Figure 3.2). Further
research may profitably use the methods of this study to examine that transitional period and
understand what drives individual differences in substance use between the ages of 18 and 19.
To our knowledge, ours is the first genetic study of e-cigarette use. Adolescent e-cigarette use
has increased dramatically in the past decade, becoming the most commonly used tobacco product
among middle and high school students (Singh et al., 2016). Standard resources, such as the PhenX
Toolkit (Hamilton et al., 2011), do not have measures of e-cigarette use. The development of a
standard measure is complicated by the wide range of nicotine doses provided by different products.
It may be necessary to develop a database of e-cigarette products, the nicotine concentrations of
their liquids, and the nicotine dose provided by a puff to accurately and reliably measure e-cigarette
use. As an interim measure, we used the number of e-cigarette uses per week. Modeling of this
phenotype was complicated by its extreme zero-inflation (use was endorsed in only 2.6% of weekly
questionnaire responses). Nevertheless, we found that e-cigarette use increases with age (Figure
3.2A and Table 3.3), e-cigarette use and change of use is heritable (Table 3.6), and that e-cigarette
use is positively correlated with alcohol and marijuana use (Figure 3.11). These results suggest
that our measure of e-cigarette use is reasonably consistent and robust and that the genetics of
e-cigarette use should be studied further.
One of the most robust and most frequently replicated results in behavioral genetics is that
the heritability of behavioral traits increases with age (McGue & Gottesman, 2015; Plomin et al.,
2016). We find that the physical distance between twins in a twin pair increases more rapidly for
dizygotic pairs than for monozygotic pairs (Figure 3.2C), particularly after age 18, implying that
location is partially heritable. Twins who are physically closer to each other are likely to be in more
similar environments. Therefore, distance is a proxy for similarity on many different environmental
variables, implying that monozygotic twins are more correlated on those variables. If some of
those environmental variables have a significant effect on behavioral traits, then this difference
in distance may partially explain the increase of heritability with age. Alternatively, the greater

87
genetic similarity of monozygotic twins may lead to them seeking out more similar environments,
leading to a decreased distance. This observation also violates the equal environments assumption
(EEA) of the standard twin model. The EEA states that monozygotic twins do not have more
similar environments than dizygotic twins. If monozygotic twins do have more similar environments,
in ways that affect outcomes of interest, then heritability estimates will be inflated. Previous work
has found that the EEA is violated for most traits but that the resulting bias is small (Felson,
2014). Since distance is a property of the twin pair, it is not possible to calculate a heritability
from these data using standard methods. However, these results do point to an approach that can
identify and characterize violations of the EEA — the use of location tracking, in combination with
geospatial databases, to measure an individual’s environment.
In order to understand the relationships among our longitudinal phenotypes, we calculated
cross-phenotype correlations of the growth model parameters (Figure 3.11). We find the expected
positive correlation among the substance use phenotypes and between time at home at night and
time at school during the school day, supporting their validity. We also find that parental monitoring
is negatively correlated with substance use level but we find less evidence for a correlation between
their rates of change. Most strikingly, we find little or no evidence for any significant correlations
between time at home and time at school, on the one hand, and the substance use phenotype, on
the other. This result contradicts previous findings but may reflect the non-random nature of our
sample (Table 3.4) and the low variance of time at home and time at school in our data (Figure
3.9).
In summary, valuable substance use relevant phenotypic and environmental information can
be collected through smartphone applications, suggesting the possibility of running genetic studies
with a much lower cost per participant than traditional designs. As sequencing and genotyping
costs have dropped, the costs of recruiting and phenotyping participants determine the maximum
sample size obtainable with a given budget. We suggest that combining the methods used in this
study with remote recruitment of participants will enable the next generation of genetic studies to
obtain high quality and longitudinal phenotypic and environmental measurements on larger samples

88
with smaller budgets.

Chapter 4
Conclusion
4.1 Summary
Chapter 2 describes the GSCAN Exome project, a GWAS meta-analysis examining the effect
of moderately rare nonsynonymous and loss of function genetic variants on alcohol and nicotine
behavior. We assembled samples varying in size from ∼71,000 to ∼164,000 individuals, larger than
any comparable published study. We conducted single variant association analyses and conditional
association analyses accounting for the effects of common variants. We also performed gene-based
burden tests. Despite being well-powered to detect variants of modest effect size, we discovered only
one novel rare variant association which failed to replicate in two independent samples, indicating
that any effects are likely to be small. After a literature search, we found four published rare
variant associations and twenty six published gene-level associations from studies of substance
dependence. Only one example from each category was successfully replicated in our analyses. As
we studied dependence rather than use and had relatively low variant coverage, we cannot rule out
the possibility of real associations at these loci. A novel method for calculating “chip heritability”
showed that all genotyped variants and variants in linkage disequilibrium with them account for
∼3% of the phenotypic variance in our traits, a small but significant proportion.
Chapter 3 describes the Colorado Online Twin Study (CoTwins), a study of adolescent
substance use using smartphone applications to administer assessments and location tracking to
measure behavior and environment. By using smartphone applications, we measured these variables
at a higher frequency and a lower cost than we could have with traditional methods. Our measures

90
of substance use and dependence and related variables were consistent with in-person assessments.
We were able to extract elements of delinquent behavior such as proportion of time spent at school
during the school day (time at school) and proportion of time spent at home at night (time at
home), without the biases of self or parental report. Growth models revealed that substance use
increased with age, accelerating around age 18 and that time at home, time at school, and parental
monitoring decreased with age, with an inflection point shortly after age 18. In the first genetic
study of e-cigarette use, we found that both the rates of use and rates of change of use of alcohol,
marijuana, and e-cigarettes are heritable. We used the location data to determine the distance
between twins in a twin pair and found that it increases with age, more rapidly for dizygotic twins
than for monozygotic twins, implying that monozygotic twins share a more similar environment.
We calculated cross-phenotype correlations of the growth model parameters, finding the expected
relationships within the substance use phenotypes, between time at school and time at home, and
between parental monitoring and substance use. However, time at home and time at school had
little or no relationship with substance use, contradicting previous results.
4.2 Future directions
Future work on the GSCAN Exome project is limited by sample size and the available vari-
ants. The chip heritability results suggest that variants of large effect are unlikely to be found
among the moderately rare variants genotyped by an exome chip. Although some evidence exists
to support the hypothesis that rarer variants have larger effect sizes for complex traits (Figure 1.4),
conclusive evidence is forthcoming. Further investigation will require very large, whole genome
sequenced samples with high read depth. Very large samples will be required to have a sufficient
number of rare allele carriers and high read depth will be necessary to detect de novo mutations
(Wray & Gratten, 2018). One major project in this area is the Precision Medicine Initiative, an
NIH project that plans to sequence the genomes of over a million participants (Hudson et al., 2015).
Unfortunately, the cost per genome has leveled off in the past few years (Figure 1.3) as Illumina
has come to dominate the next generation sequencing market. I suspect that further growth in

91
rare variant study sample sizes, above and beyond the biobank projects that have been announced,
will depend on whole genome sequencing becoming medically useful outside of oncology and rare
disease.
There are a number of areas for future work in the CoTwins study. First, it may be worthwhile
to fit time series models to the longitudinal data in order to account for its autoregressive properties.
This approach is possible but complicated by the need to model the nested structure of the data.
The growth models and the biometric twin models were fit separately because standard structural
equation model software packages cannot scale to hundreds or thousands of observations per subject.
However, the formal equivalence between structural equation models and multilevel models (Curran,
2003) suggests that it is possible to combine growth and twin models even for large-scale data, and
to explicitly model longitudinal change in the A, C, and E variance components. Some model
classes of this type have already been implemented in OpenMx (state space modeling; Neale et al.
(2016)) and in Mplus (dynamic structural equation modeling; Asparouhov et al. (2018)) but their
use proved infeasible for the work described in Chapter 3.
Substance use behavior in the CoTwins data seems to have autoregressive properties – if a
twin drank last week, they are more likely to drink this week. If a twin didn’t drink last week, they
are less likely to drink this week. I think that these transitions betweens states of substance use
and non-use are of interest, both for understanding the etiology of adolescent substance use and
for the development of interventions. Hidden Markov models are worth considering because they
explicitly model transitions between states.
More work should be done to understand the nature of the difference in twin distance be-
tween monozygotic and dizygotic twins. First, distance could be decomposed into similarities on
specific environmental variables. For example, I have constructed a measure of the number of bars,
nightclubs, and liquor stores near a given location using Google Places data. We could ask how
twin similarity on exposure to alcohol use changes with age and zygosity. Second, we could provide
greater context to the distances between twins. What does it mean if twin A and twin B are 100
meters apart, on average? If I compared twin A on odd days to her own data from even days, how

92
close would twin A be to herself? Someone living nearby could be another point of comparison.
More broadly, I do not believe that the future of human genetics lies in increasing sample size
until the variance explained by GWAS hits converges to GCTA or twin study estimates. I suspect
that we have hit a point of diminishing scientific returns from GWAS. The expansion of large
GWAS to non-European ancestry samples is an interesting possibility. There are hints that genetic
effects are heterogeneous between populations. This observation suggests that, as it certainly does
in animal models, genetic background matters for human complex traits. As we assemble large
samples, we will be able to measure epistasis more precisely, potentially improving the performance
of genomic predictors. Better measurements of phenotype and environment will also be important.
As the number of large biobanks increases, the compromises on measurement quality made in
GWAS meta-analyses will be less necessary. I expect that large, deeply phenotyped samples will
allow us to understand the subtypes within disease definitions. By integrating measurements of
environmental variables, obtained by methods similar to those used in Chapter 3, we will be able to
parse the genetic and environmental influences on complex traits and their change over time. The
combination of better causal understanding and better risk prediction could fulfill at least some of
the promises of precision medicine.

Bibliography
Achenbach, Thomas M. 1991a. Manual for the Child Behavior Checklist/4 - 18 and 1991 Profile.Burlington, VT: University of Vermont, Department of Psychiatry.
Achenbach, Thomas M. 1991b. Manual for the Youth Self-Report and 1991 Profile. Burlington,VT: Dept. of Psychiatry, University of Vermont.
Adzhubei, Ivan A., Schmidt, Steffen, Peshkin, Leonid, Ramensky, Vasily E., Gerasimova, Anna,Bork, Peer, Kondrashov, Alexey S., & Sunyaev, Shamil R. 2010. A method and server forpredicting damaging missense mutations. Nature Methods, 7(4), 248–249.
Altshuler, D., Daly, M. J., & Lander, E. S. 2008. Genetic Mapping in Human Disease. Science,322(5903), 881–888.
American Psychiatric Association. 2000. Diagnostic and Statistical Manual of Mental Disorders.4th edn. Washington, DC: American Psychiatric Association.
Aryal, Prafulla, Dvir, Hay, Choe, Senyon, & Slesinger, Paul A. 2009. A discrete alcohol pocketinvolved in GIRK channel activation. Nature Neuroscience, 12(8), 988–995.
Asparouhov, Tihomir, Hamaker, Ellen L, & Muthen, Bengt. 2018. Dynamic Structural EquationModels. Structural Equation Modeling: A Multidisciplinary Journal, 25(3), 359–388.
Attali, Dean, & Baker, Christopher. 2018. ggExtra: Add Marginal Histograms to “ggplot2”. Rpackage version 0.8.
Auer, Paul L., Reiner, Alex P., Wang, Gao, Kang, Hyun Min, Abecasis, Goncalo R., Altshuler,David, Bamshad, Michael J., Nickerson, Deborah A., Tracy, Russell P., Rich, Stephen S., &Leal, Suzanne M. 2016. Guidelines for Large-Scale Sequence-Based Complex Trait AssociationStudies: Lessons Learned from the NHLBI Exome Sequencing Project. The American Journalof Human Genetics, 99(4), 791–801.
Auton, Adam, Abecasis, Goncalo R., Altshuler, David M., Durbin, Richard M., Bentley, David R.,Chakravarti, Aravinda, Clark, Andrew G., Donnelly, Peter, Eichler, Evan E., Flicek, Paul,Gabriel, Stacey B., Gibbs, Richard A., Green, Eric D., Hurles, Matthew E., Knoppers, Bartha M.,Korbel, Jan O., Lander, Eric S., Lee, Charles, Lehrach, Hans, Mardis, Elaine R., Marth, Ga-bor T., McVean, Gil A., Nickerson, Deborah A., Schmidt, Jeanette P., Sherry, Stephen T., Wang,Jun, Wilson, Richard K., Boerwinkle, Eric, Doddapaneni, Harsha, Han, Yi, Korchina, Viktoriya,Kovar, Christie, Lee, Sandra, Muzny, Donna, Reid, Jeffrey G., Zhu, Yiming, Chang, Yuqi, Feng,Qiang, Fang, Xiaodong, Guo, Xiaosen, Jian, Min, Jiang, Hui, Jin, Xin, Lan, Tianming, Li,

94
Guoqing, Li, Jingxiang, Li, Yingrui, Liu, Shengmao, Liu, Xiao, Lu, Yao, Ma, Xuedi, Tang,Meifang, Wang, Bo, Wang, Guangbiao, Wu, Honglong, Wu, Renhua, Xu, Xun, Yin, Ye, Zhang,Dandan, Zhang, Wenwei, Zhao, Jiao, Zhao, Meiru, Zheng, Xiaole, Gupta, Namrata, Gharani,Neda, Toji, Lorraine H., Gerry, Norman P., Resch, Alissa M., Barker, Jonathan, Clarke, Laura,Gil, Laurent, Hunt, Sarah E., Kelman, Gavin, Kulesha, Eugene, Leinonen, Rasko, McLaren,William M., Radhakrishnan, Rajesh, Roa, Asier, Smirnov, Dmitriy, Smith, Richard E., Streeter,Ian, Thormann, Anja, Toneva, Iliana, Vaughan, Brendan, Zheng-Bradley, Xiangqun, Grocock,Russell, Humphray, Sean, James, Terena, Kingsbury, Zoya, Sudbrak, Ralf, Albrecht, Marcus W.,Amstislavskiy, Vyacheslav S., Borodina, Tatiana A., Lienhard, Matthias, Mertes, Florian, Sul-tan, Marc, Timmermann, Bernd, Yaspo, Marie Laure, Fulton, Lucinda, Ananiev, Victor, Belaia,Zinaida, Beloslyudtsev, Dimitriy, Bouk, Nathan, Chen, Chao, Church, Deanna, Cohen, Robert,Cook, Charles, Garner, John, Hefferon, Timothy, Kimelman, Mikhail, Liu, Chunlei, Lopez, John,Meric, Peter, O’Sullivan, Chris, Ostapchuk, Yuri, Phan, Lon, Ponomarov, Sergiy, Schneider,Valerie, Shekhtman, Eugene, Sirotkin, Karl, Slotta, Douglas, Zhang, Hua, Balasubramaniam,Senduran, Burton, John, Danecek, Petr, Keane, Thomas M., Kolb-Kokocinski, Anja, McCarthy,Shane, Stalker, James, Quail, Michael, Davies, Christopher J., Gollub, Jeremy, Webster, Teresa,Wong, Brant, Zhan, Yiping, Campbell, Christopher L., Kong, Yu, Marcketta, Anthony, Yu, Fuli,Antunes, Lilian, Bainbridge, Matthew, Sabo, Aniko, Huang, Zhuoyi, Coin, Lachlan J.M., Fang,Lin, Li, Qibin, Li, Zhenyu, Lin, Haoxiang, Liu, Binghang, Luo, Ruibang, Shao, Haojing, Xie, Yin-long, Ye, Chen, Yu, Chang, Zhang, Fan, Zheng, Hancheng, Zhu, Hongmei, Alkan, Can, Dal, Elif,Kahveci, Fatma, Garrison, Erik P., Kural, Deniz, Lee, Wan Ping, Leong, Wen Fung, Stromberg,Michael, Ward, Alistair N., Wu, Jiantao, Zhang, Mengyao, Daly, Mark J., DePristo, Mark A.,Handsaker, Robert E., Banks, Eric, Bhatia, Gaurav, Del Angel, Guillermo, Genovese, Giulio, Li,Heng, Kashin, Seva, McCarroll, Steven A., Nemesh, James C., Poplin, Ryan E., Yoon, Seung-tai C., Lihm, Jayon, Makarov, Vladimir, Gottipati, Srikanth, Keinan, Alon, Rodriguez-Flores,Juan L., Rausch, Tobias, Fritz, Markus H., Stutz, Adrian M., Beal, Kathryn, Datta, Avik, Her-rero, Javier, Ritchie, Graham R.S., Zerbino, Daniel, Sabeti, Pardis C., Shlyakhter, Ilya, Schaffner,Stephen F., Vitti, Joseph, Cooper, David N., Ball, Edward V., Stenson, Peter D., Barnes, Bret,Bauer, Markus, Cheetham, R. Keira, Cox, Anthony, Eberle, Michael, Kahn, Scott, Murray, Lisa,Peden, John, Shaw, Richard, Kenny, Eimear E., Batzer, Mark A., Konkel, Miriam K., Walker,Jerilyn A., MacArthur, Daniel G., Lek, Monkol, Herwig, Ralf, Ding, Li, Koboldt, Daniel C.,Larson, David, Ye, Kai, Gravel, Simon, Swaroop, Anand, Chew, Emily, Lappalainen, Tuuli, Er-lich, Yaniv, Gymrek, Melissa, Willems, Thomas Frederick, Simpson, Jared T., Shriver, Mark D.,Rosenfeld, Jeffrey A., Bustamante, Carlos D., Montgomery, Stephen B., De La Vega, Fran-cisco M., Byrnes, Jake K., Carroll, Andrew W., DeGorter, Marianne K., Lacroute, Phil, Maples,Brian K., Martin, Alicia R., Moreno-Estrada, Andres, Shringarpure, Suyash S., Zakharia, Fouad,Halperin, Eran, Baran, Yael, Cerveira, Eliza, Hwang, Jaeho, Malhotra, Ankit, Plewczynski, Dar-iusz, Radew, Kamen, Romanovitch, Mallory, Zhang, Chengsheng, Hyland, Fiona C.L., Craig,David W., Christoforides, Alexis, Homer, Nils, Izatt, Tyler, Kurdoglu, Ahmet A., Sinari, Shri-pad A., Squire, Kevin, Xiao, Chunlin, Sebat, Jonathan, Antaki, Danny, Gujral, Madhusudan,Noor, Amina, Ye, Kenny, Burchard, Esteban G., Hernandez, Ryan D., Gignoux, Christopher R.,Haussler, David, Katzman, Sol J., Kent, W. James, Howie, Bryan, Ruiz-Linares, Andres, Der-mitzakis, Emmanouil T., Devine, Scott E., Kang, Hyun Min, Kidd, Jeffrey M., Blackwell, Tom,Caron, Sean, Chen, Wei, Emery, Sarah, Fritsche, Lars, Fuchsberger, Christian, Jun, Goo, Li,Bingshan, Lyons, Robert, Scheller, Chris, Sidore, Carlo, Song, Shiya, Sliwerska, Elzbieta, Taliun,Daniel, Tan, Adrian, Welch, Ryan, Wing, Mary Kate, Zhan, Xiaowei, Awadalla, Philip, Hodgkin-son, Alan, Li, Yun, Shi, Xinghua, Quitadamo, Andrew, Lunter, Gerton, Marchini, Jonathan L.,Myers, Simon, Churchhouse, Claire, Delaneau, Olivier, Gupta-Hinch, Anjali, Kretzschmar, War-

95
ren, Iqbal, Zamin, Mathieson, Iain, Menelaou, Androniki, Rimmer, Andy, Xifara, Dionysia K.,Oleksyk, Taras K., Fu, Yunxin, Liu, Xiaoming, Xiong, Momiao, Jorde, Lynn, Witherspoon,David, Xing, Jinchuan, Browning, Brian L., Browning, Sharon R., Hormozdiari, Fereydoun,Sudmant, Peter H., Khurana, Ekta, Tyler-Smith, Chris, Albers, Cornelis A., Ayub, Qasim,Chen, Yuan, Colonna, Vincenza, Jostins, Luke, Walter, Klaudia, Xue, Yali, Gerstein, Mark B.,Abyzov, Alexej, Balasubramanian, Suganthi, Chen, Jieming, Clarke, Declan, Fu, Yao, Harmanci,Arif O., Jin, Mike, Lee, Donghoon, Liu, Jeremy, Mu, Xinmeng Jasmine, Zhang, Jing, Zhang, Yan,Hartl, Chris, Shakir, Khalid, Degenhardt, Jeremiah, Meiers, Sascha, Raeder, Benjamin, Casale,Francesco Paolo, Stegle, Oliver, Lameijer, Eric Wubbo, Hall, Ira, Bafna, Vineet, Michaelson,Jacob, Gardner, Eugene J., Mills, Ryan E., Dayama, Gargi, Chen, Ken, Fan, Xian, Chong,Zechen, Chen, Tenghui, Chaisson, Mark J., Huddleston, John, Malig, Maika, Nelson, Bradley J.,Parrish, Nicholas F., Blackburne, Ben, Lindsay, Sarah J., Ning, Zemin, Zhang, Yujun, Lam,Hugo, Sisu, Cristina, Challis, Danny, Evani, Uday S., Lu, James, Nagaswamy, Uma, Yu, Jin, Li,Wangshen, Habegger, Lukas, Yu, Haiyuan, Cunningham, Fiona, Dunham, Ian, Lage, Kasper,Jespersen, Jakob Berg, Horn, Heiko, Kim, Donghoon, Desalle, Rob, Narechania, Apurva, Sayres,Melissa A.Wilson, Mendez, Fernando L., Poznik, G. David, Underhill, Peter A., Mittelman,David, Banerjee, Ruby, Cerezo, Maria, Fitzgerald, Thomas W., Louzada, Sandra, Massaia, An-drea, Yang, Fengtang, Kalra, Divya, Hale, Walker, Dan, Xu, Barnes, Kathleen C., Beiswanger,Christine, Cai, Hongyu, Cao, Hongzhi, Henn, Brenna, Jones, Danielle, Kaye, Jane S., Kent,Alastair, Kerasidou, Angeliki, Mathias, Rasika, Ossorio, Pilar N., Parker, Michael, Rotimi,Charles N., Royal, Charmaine D., Sandoval, Karla, Su, Yeyang, Tian, Zhongming, Tishkoff,Sarah, Via, Marc, Wang, Yuhong, Yang, Huanming, Yang, Ling, Zhu, Jiayong, Bodmer, Wal-ter, Bedoya, Gabriel, Cai, Zhiming, Gao, Yang, Chu, Jiayou, Peltonen, Leena, Garcia-Montero,Andres, Orfao, Alberto, Dutil, Julie, Martinez-Cruzado, Juan C., Mathias, Rasika A., Hennis,Anselm, Watson, Harold, McKenzie, Colin, Qadri, Firdausi, LaRocque, Regina, Deng, Xiaoyan,Asogun, Danny, Folarin, Onikepe, Happi, Christian, Omoniwa, Omonwunmi, Stremlau, Matt,Tariyal, Ridhi, Jallow, Muminatou, Joof, Fatoumatta Sisay, Corrah, Tumani, Rockett, Kirk,Kwiatkowski, Dominic, Kooner, Jaspal, Hien, Tran Tinh, Dunstan, Sarah J., ThuyHang, Nguyen,Fonnie, Richard, Garry, Robert, Kanneh, Lansana, Moses, Lina, Schieffelin, John, Grant, Don-ald S., Gallo, Carla, Poletti, Giovanni, Saleheen, Danish, Rasheed, Asif, Brooks, Lisa D., Felsen-feld, Adam L., McEwen, Jean E., Vaydylevich, Yekaterina, Duncanson, Audrey, Dunn, Michael,& Schloss, Jeffery A. 2015. A global reference for human genetic variation. Nature, 526(7571),68–74.
Bae, Sangwon, Ferreira, Denzil, Suffoletto, Brian, Puyana, Juan C., Kurtz, Ryan, Chung, Tammy,& Dey, Anind K. 2017. Detecting Drinking Episodes in Young Adults Using Smartphone-basedSensors. Proceedings of the ACM on Interactive, Mobile, Wearable and Ubiquitous Technologies,1(2), 1–36.
Bates, Douglas, Machler, Martin, Bolker, Ben, & Walker, Steve. 2015. Fitting Linear Mixed-EffectsModels Using lme4. Journal of Statistical Software, 67(1).
Benowitz, Neal L. 2008a. Clinical Pharmacology of Nicotine: Implications for Understanding,Preventing, and Treating Tobacco Addiction. Clinical Pharmacology & Therapeutics, 83(4),531–541.
Benowitz, Neal L. 2008b. Neurobiology of Nicotine Addiction: Implications for Smoking CessationTreatment. The American Journal of Medicine, 121(4), S3–S10.

96
Bierut, Laura J., & Stitzel, Jerry. 2014. Genetic Contributions of the α5 Nicotinic Receptor Subunitto Smoking Behavior. Pages 327–339 of: Lester, R.A.J. (ed), Nicotinic Receptors. New York:Springer.
Biglan, Anthony, Duncan, Terry E, Ary, Dennis V, & Smolkowski, Keith. 1995. Peer and parentalinfluences on adolescent tobacco use. Journal of Behavioral Medicine, 18(4), 315–330.
Billig, John P., Hershberger, Scott L., Iacono, William G., & McGue, Matt. 1996. Life events andpersonality in late adolescence: Genetic and environmental relations. Behavior Genetics, 26(6),543–554.
Bornovalova, Marina A., Verhulst, Brad, Webber, Troy, McGue, Matt, Iacono, William G., & Hicks,Brian M. 2018. Genetic and environmental influences on the codevelopment among borderlinepersonality disorder traits, major depression symptoms, and substance use disorder symptomsfrom adolescence to young adulthood. Development and Psychopathology, 30(01), 49–65.
Borrud, Lori, Chiappa, Michele M, Burt, Vicki L, Gahche, Jaime, Zipf, George, Johnson, Clifford L,& Dohrmann, Sylvia M. 2014. National Health and Nutrition Examination Survey: nationalyouth fitness survey plan, operations, and analysis, 2012. Vital and health statistics. Series 2,Data evaluation and methods research, apr, 1–24.
Bulik-Sullivan, Brendan, Finucane, Hilary K, Anttila, Verneri, Gusev, Alexander, Day, Felix R,Loh, Po-Ru, Duncan, Laramie, Perry, John R B, Patterson, Nick, Robinson, Elise B, Daly,Mark J, Price, Alkes L, & Neale, Benjamin M. 2015a. An atlas of genetic correlations acrosshuman diseases and traits. Nature Genetics, 47(11), 1236–1241.
Bulik-Sullivan, Brendan K, Loh, Po-Ru, Finucane, Hilary K, Ripke, Stephan, Yang, Jian, Pat-terson, Nick, Daly, Mark J, Price, Alkes L, & Neale, Benjamin M. 2015b. LD Score regressiondistinguishes confounding from polygenicity in genome-wide association studies. Nature Genetics,47(3), 291–295.
Burton, Paul R., Clayton, David G., Cardon, Lon R., Craddock, Nick, Deloukas, Panos, Dun-canson, Audrey, Kwiatkowski, Dominic P., McCarthy, Mark I., Ouwehand, Willem H., Samani,Nilesh J., Todd, John A., Donnelly, Peter, Barrett, Jeffrey C., Davison, Dan, Easton, Doug,Evans, David, Leung, Hin Tak, Marchini, Jonathan L., Morris, Andrew P., Spencer, Chris C.A.,Tobin, Martin D., Attwood, Antony P., Boorman, James P., Cant, Barbara, Everson, Ursula,Hussey, Judith M., Jolley, Jennifer D., Knight, Alexandra S., Koch, Kerstin, Meech, Elizabeth,Nutland, Sarah, Prowse, Christopher V., Stevens, Helen E., Taylor, Niall C., Walters, Gra-ham R., Walker, Neil M., Watkins, Nicholas A., Winzer, Thilo, Jones, Richard W., McArdle,Wendy L., Ring, Susan M., Strachan, David P., Pembrey, Marcus, Breen, Gerome, St. Clair,David, Caesar, Sian, Gordon-Smith, Katherine, Jones, Lisa, Fraser, Christine, Green, Elaine K.,Grozeva, Detelina, Hamshere, Marian L., Holmans, Peter A., Jones, Ian R., Kirov, George,Moskvina, Valentina, Nikolov, Ivan, O’Donovan, Michael C., Owen, Michael J., Collier, David A.,Elkin, Amanda, Farmer, Anne, Williamson, Richard, McGuffin, Peter, Young, Allan H., Fer-rier, I. Nicol, Ball, Stephen G., Balmforth, Anthony J., Barrett, Jennifer H., Bishop, D. Tim-othy, Iles, Mark M., Maqbool, Azhar, Yuldasheva, Nadira, Hall, Alistair S., Braund, Peter S.,Dixon, Richard J., Mangino, Massimo, Stevens, Suzanne, Thompson, John R., Bredin, Francesca,Tremelling, Mark, Parkes, Miles, Drummond, Hazel, Lees, Charles W., Nimmo, Elaine R., Sat-sangi, Jack, Fisher, Sheila A., Forbes, Alastair, Lewis, Cathryn M., Onnie, Clive M., Prescott,Natalie J., Sanderson, Jeremy, Mathew, Christopher G., Barbour, Jamie, Mohiuddin, M. Khalid,

97
Todhunter, Catherine E., Mansfield, John C., Ahmad, Tariq, Cummings, Fraser R., Jewell,Derek P., Webster, John, Brown, Morris J., Lathrop, G. Mark, Connell, John, Dominiczak,Anna, Braga Marcano, Carolina A., Burke, Beverley, Dobson, Richard, Gungadoo, Johannie,Lee, Kate L., Munroe, Patricia B., Newhouse, Stephen J., Onipinla, Abiodun, Wallace, Chris,Xue, Mingzhan, Caulfield, Mark, Farrall, Martin, Barton, Anne, Bruce, Ian N., Donovan, Han-nah, Eyre, Steve, Gilbert, Paul D., Hider, Samantha L., Hinks, Anne M., John, Sally L., Potter,Catherine, Silman, Alan J., Symmons, Deborah P.M., Thomson, Wendy, Worthington, Jane,Dunger, David B., Widmer, Barry, Frayling, Timothy M., Freathy, Rachel M., Lango, Hana,Perry, John R.B., Shields, Beverley M., Weedon, Michael N., Hattersley, Andrew T., Hitman,Graham A., Walker, Mark, Elliott, Kate S., Groves, Christopher J., Lindgren, Cecilia M., Rayner,Nigel W., Timpson, Nicholas J., Zeggini, Eleftheria, Newport, Melanie, Sirugo, Giorgio, Lyons,Emily, Vannberg, Fredrik, Hill, Adrian V.S., Bradbury, Linda A., Farrar, Claire, Pointon, Jen-nifer J., Wordsworth, Paul, Brown, Matthew A., Franklyn, Jayne A., Heward, Joanne M., Sim-monds, Matthew J., Gough, Stephen C.L., Seal, Sheila, Stratton, Michael R., Rahman, Nazneen,Ban, Sclerosis Maria, Goris, An, Sawcer, Stephen J., Compston, Alastair, Conway, David, Jallow,Muminatou, Rockett, Kirk A., Bumpstead, Suzannah J., Chaney, Amy, Downes, Kate, Ghori,Mohammed J.R., Gwilliam, Rhian, Hunt, Sarah E., Inouye, Michael, Keniry, Andrew, King,Emma, McGinnis, Ralph, Potter, Simon, Ravindrarajah, Rathi, Whittaker, Pamela, Widden,Claire, Withers, David, Cardin, Niall J., Ferreira, Teresa, Pereira-Gale, Joanne, Hallgrimsdottir,Ingileif B., Howie, Bryan N., Spencer, Chris C.A., Su, Zhan, Teo, Yik Ying, Vukcevic, Damjan,Bentley, David, & Compston, Alistair. 2007. Genome-wide association study of 14,000 cases ofseven common diseases and 3,000 shared controls. Nature, 447(7145), 661–678.
Bycroft, Clare, Freeman, Colin, Petkova, Desislava, Band, Gavin, Delaneau, Olivier, Connell,Jared O, Cortes, Adrian, & Welsh, Samantha. 2017. Genome-wide genetic data on ∼500,000UK Biobank participants. bioRxiv.
Cadoret, Remi J., O’Gorman, Thomas W., Troughton, Ed, & Heywood, Ellen. 1985. Alcoholismand Antisocial Personality. Archives of General Psychiatry, 42(2), 161.
Cagan, Alex, & Blass, Torsten. 2016. Identification of genomic variants putatively targeted byselection during dog domestication. BMC Evolutionary Biology, 16(1), 1–13.
Canty, Angelo, & Ripley, B. D. 2017. boot: Bootstrap R (S-Plus) Functions. R package version1.3-20.
Cardon, Lon R., & Harris, Tim. 2016. Precision medicine, genomics and drug discovery. HumanMolecular Genetics, 25(R2), R166–R172.
Carta, Giovanna, Nava, Felice, & Gessa, Gian Luigi. 1998. Inhibition of hippocampal acetylcholinerelease after acute and repeated ∆9-tetrahydrocannabinol in rats. Brain Research, 809(1), 1–4.
Chen, Jianping, Paredes, William, Li, Jin, Smith, Diane, Lowinson, Joyce, & Gardner, Eliot L.1990. ∆9-Tetrahydrocannabinol produces naloxone-blockable enhancement of presynaptic basaldopamine efflux in nucleus accumbens of conscious, freely-moving rats as measured by intracere-bral microdialysis. Psychopharmacology, 102(2), 156–162.
Cho, Eunjoon, Myers, Seth A., & Leskovec, Jure. 2011. Friendship and mobility. Page 1082 of:Proceedings of the 17th ACM SIGKDD International Conference on Knowledge Discovery andData Mining - KDD ’11. New York, New York, USA: ACM Press.
98
Clarke, T-K, Adams, M. J., Davies, G., Howard, D. M., Hall, L. S., Padmanabhan, S., Murray,A. D., Smith, B. H., Campbell, A., Hayward, C., Porteous, D. J., Deary, I. J., & McIntosh,A. M. 2017. Genome-wide association study of alcohol consumption and genetic overlap withother health-related traits in UK Biobank (N=112 117). Molecular Psychiatry, 22(10), 1376–1384.
Claussnitzer, Melina, Dankel, Simon N., Kim, Kyoung-Han, Quon, Gerald, Meuleman, Wouter,Haugen, Christine, Glunk, Viktoria, Sousa, Isabel S., Beaudry, Jacqueline L., Puviindran, Vi-jitha, Abdennur, Nezar a., Liu, Jannel, Svensson, Per-Arne, Hsu, Yi-Hsiang, Drucker, Daniel J.,Mellgren, Gunnar, Hui, Chi-Chung, Hauner, Hans, & Kellis, Manolis. 2015. FTO Obesity Vari-ant Circuitry and Adipocyte Browning in Humans. New England Journal of Medicine, 373(10),895–907.
Cohen, Jonathan C, Boerwinkle, Eric, Mosley, Thomas H, & Hobbs, Helen H. 2006. SequenceVariations in PCSK9, Low LDL, and Protection against Coronary Heart Disease. New EnglandJournal of Medicine, 354(12), 1264–1272.
Colder, Craig R., Scalco, Matthew, Trucco, Elisa M., Read, Jennifer P., Lengua, Liliana J., Wiec-zorek, William F., & Hawk, Larry W. 2013. Prospective Associations of Internalizing and Ex-ternalizing Problems and Their Co-Occurrence with Early Adolescent Substance Use. Journal ofAbnormal Child Psychology, 41(4), 667–677.
Collins, R. Lorraine, Kashdan, Todd B., & Gollnisch, Gernot. 2003. The feasibility of using cellularphones to collect ecological momentary assessment data: Application to alcohol consumption.Experimental and Clinical Psychopharmacology, 11(1), 73–78.
Conway, Kevin P., Vullo, Genevieve C., Kennedy, Ashley P., Finger, Matthew S., Agrawal, Arpana,Bjork, James M., Farrer, Lindsay A., Hancock, Dana B., Hussong, Andrea, Wakim, Paul, Hug-gins, Wayne, Hendershot, Tabitha, Nettles, Destiney S., Pratt, Joseph, Maiese, Deborah, Junk-ins, Heather A., Ramos, Erin M., Strader, Lisa C., Hamilton, Carol M., & Sher, Kenneth J.2014. Data compatibility in the addiction sciences: An examination of measure commonality.Drug and Alcohol Dependence, 141, 153–158.
Cranshaw, Justin, Toch, Eran, Hong, Jason, Kittur, Aniket, & Sadeh, Norman. 2010. Bridging thegap between physical location and online social networks. Pages 119–128 of: Proceedings of the12th ACM International Conference on Ubiquitous Computing - Ubicomp ’10. New York, NewYork, USA: ACM Press.
Curran, P.J. 2003. Have multilevel models been structural equation models all along? MultivariateBehavioral Research, 38(4), 529–569.
David, S. P., Hamidovic, A., Chen, G. K., Bergen, A. W., Wessel, J., Kasberger, J. L., Brown,W. M., Petruzella, S., Thacker, E. L., Kim, Y., Nalls, M. A., Tranah, G. J., Sung, Y. J.,Ambrosone, C. B., Arnett, D., Bandera, E. V., Becker, D M, Becker, L., Berndt, S. I., Bernstein,L., Blot, W. J., Broeckel, U., Buxbaum, S. G., Caporaso, N., Casey, G., Chanock, S. J., Deming,S. L., Diver, W. R., Eaton, C. B., Evans, D S, Evans, M. K., Fornage, M., Franceschini, N.,Harris, T. B., Henderson, B. E., Hernandez, D. G., Hitsman, B., Hu, J. J., Hunt, S. C., Ingles,S. A., John, E. M., Kittles, R., Kolb, S., Kolonel, L. N., Le Marchand, L., Liu, Y., Lohman,K. K., McKnight, B., Millikan, R. C., Murphy, A., Neslund-Dudas, C., Nyante, S., Press, M.,Psaty, B. M., Rao, D. C., Redline, S., Rodriguez-Gil, J. L., Rybicki, B. A., Signorello, L. B.,Singleton, A. B., Smoller, J., Snively, B., Spring, B., Stanford, J. L., Strom, S. S., Swan, G. E.,

99
Taylor, K. D., Thun, M. J., Wilson, A. F., Witte, J. S., Yamamura, Y., Yanek, L. R., Yu, K.,Zheng, W., Ziegler, R. G., Zonderman, A. B., Jorgenson, E., Haiman, C. A., & Furberg, H.2012. Genome-wide meta-analyses of smoking behaviors in African Americans. TranslationalPsychiatry, 2(5), e119–e119.
Davison, A. C., & Hinkley, D. V. 1997. Bootstrap Methods and Their Applications. Cambridge:Cambridge University Press. ISBN 0-521-57391-2.
Derkinderen, Pascal, Valjent, Emmanuel, Toutant, Madeleine, Corvol, Jean-Christophe, Enslen,Herve, Ledent, Catherine, Trzaskos, James, Caboche, Jocelyne, & Girault, Jean-Antoine. 2003.Regulation of Extracellular Signal-Regulated Kinase by Cannabinoids in Hippocampus. TheJournal of Neuroscience, 23(6), 2371–2382.
Dick, Danielle M., Meyers, Jacquelyn L., Rose, Richard J., Kaprio, Jaakko, & Kendler, Kenneth S.2011. Measures of Current Alcohol Consumption and Problems: Two Independent Twin StudiesSuggest a Complex Genetic Architecture. Alcoholism: Clinical and Experimental Research,35(12), 2152–2161.
Dielman, T E, Butchart, A T, Shope, J T, & Miller, M. 1990. Environmental correlates of adolescentsubstance use and misuse: implications for prevention programs. The International Journal ofthe Addictions, 25(7A-8A), 855–80.
Duncan, Laramie E, & Keller, Matthew C. 2011. A critical review of the first 10 years of candidategene-by-environment interaction research in psychiatry. The American Journal of Psychiatry,168(10), 1041–9.
Eagle, Nathan, & Pentland, Alex Sandy. 2009. Eigenbehaviors: Identifying structure in routine.Behavioral Ecology and Sociobiology, 63(7), 1057–1066.
Eaton, Nicholas R, Krueger, Robert F, Johnson, Wendy, McGue, Matt, & Iacono, William G. 2009.Parental Monitoring, Personality, and Delinquency: Further Support for a Reconceptualizationof Monitoring. Journal of Research in Personality, 43(1), 49–59.
Eckardt, Nancy A. 2010. Evolution of Domesticated Bread Wheat. The Plant Cell, 22(4), 993–993.
Edenberg, Howard J. 2007. The genetics of alcohol metabolism: role of alcohol dehydrogenase andaldehyde dehydrogenase variants. Alcohol Research & Health, 30(1), 5–13.
Elliott, Delbert S., Huizinga, David, & Menard, Scott. 1989.Multiple Problem Youth: Delinquency, Susbtance Use, and Mental Health Problems. NewYork: Springer-Verlag.
Eng, Mimy Y, Luczak, Susan E, & Wall, Tamara L. 2007. ALDH2, ADH1B, and ADH1C genotypesin Asians: a literature review. Alcohol Research & Health, 30(1), 22+.
Esser, Marissa B, Clayton, Heather, Demissie, Zewditu, Kanny, Dafna, & Brewer, Robert D. 2017.Current and Binge Drinking Among High School Students United States, 1991 2015. MMWR,66(18), 474–478.
Ezzati, M, Lopez, A D, Rodgers. A., Vander-Hoorn, S, & Murray, C J L. 2002. Selected major riskfactors and global and regional burden of disease. Lancet, 360, 1347–1360.

100
Felson, Jacob. 2014. What can we learn from twin studies? A comprehensive evaluation of theequal environments assumption. Social Science Research, 43(jan), 184–199.
Fisher, R.A. 1918. The Correlation between Relatives on the Supposition of Mendelian Inheritance.Philosophical Transactions of the Royal Society of Edinburgh, 52, 399–433.
Frazer, Kelly A., Ballinger, Dennis G., Cox, David R., Hinds, David A., Stuve, Laura L., Gibbs,Richard A., Belmont, John W., Boudreau, Andrew, Hardenbol, Paul, Leal, Suzanne M., Paster-nak, Shiran, Wheeler, David A., Willis, Thomas D., Yu, Fuli, Yang, Huanming, Zeng, Changqing,Gao, Yang, Hu, Haoran, Hu, Weitao, Li, Chaohua, Lin, Wei, Liu, Siqi, Pan, Hao, Tang, Xiaoli,Wang, Jian, Wang, Wei, Yu, Jun, Zhang, Bo, Zhang, Qingrun, Zhao, Hongbin, Zhao, Hui,Zhou, Jun, Gabriel, Stacey B., Barry, Rachel, Blumenstiel, Brendan, Camargo, Amy, Defelice,Matthew, Faggart, Maura, Goyette, Mary, Gupta, Supriya, Moore, Jamie, Nguyen, Huy, Onofrio,Robert C., Parkin, Melissa, Roy, Jessica, Stahl, Erich, Winchester, Ellen, Ziaugra, Liuda, Alt-shuler, David, Shen, Yan, Yao, Zhijian, Huang, Wei, Chu, Xun, He, Yungang, Jin, Li, Liu, Yang-fan, Shen, Yayun, Sun, Weiwei, Wang, Haifeng, Wang, Yi, Wang, Ying, Xiong, Xiaoyan, Xu,Liang, Waye, Mary M.Y., Tsui, Stephen K.W., Xue, Hong, Wong, J. Tze Fei, Galver, Luana M.,Fan, Jian Bing, Gunderson, Kevin, Murray, Sarah S., Oliphant, Arnold R., Chee, Mark S., Mont-petit, Alexandre, Chagnon, Fanny, Ferretti, Vincent, Leboeuf, Martin, Olivier, Jean Francois,Phillips, Michael S., Roumy, Stephanie, Sallee, Clementine, Verner, Andrei, Hudson, Thomas J.,Kwok, Pui Yan, Cai, Dongmei, Koboldt, Daniel C., Miller, Raymond D., Pawlikowska, Ludmila,Taillon-Miller, Patricia, Xiao, Ming, Tsui, Lap Chee, Mak, William, You, Qiang Song, Tam,Paul K.H., Nakamura, Yusuke, Kawaguchi, Takahisa, Kitamoto, Takuya, Morizono, Takashi,Nagashima, Atsushi, Ohnishi, Yozo, Sekine, Akihiro, Tanaka, Toshihiro, Tsunoda, Tatsuhiko,Deloukas, Panos, Bird, Christine P., Delgado, Marcos, Dermitzakis, Emmanouil T., Gwilliam,Rhian, Hunt, Sarah, Morrison, Jonathan, Powell, Don, Stranger, Barbara E., Whittaker, Pamela,Bentley, David R., Daly, Mark J., De Bakker, Paul I.W., Barrett, Jeff, Chretien, Yves R., Maller,Julian, McCarroll, Steve, Patterson, Nick, Pe’Er, Itsik, Price, Alkes, Purcell, Shaun, Richter,Daniel J., Sabeti, Pardis, Saxena, Richa, Schaffner, Stephen F., Sham, Pak C., Varilly, Patrick,Stein, Lincoln D., Krishnan, Lalitha, Smith, Albert Vernon, Tello-Ruiz, Marcela K., Thorisson,Gudmundur A., Chakravarti, Aravinda, Chen, Peter E., Cutler, David J., Kashuk, Carl S., Lin,Shin, Abecasis, Goncalo R., Guan, Weihua, Li, Yun, Munro, Heather M., Qin, Zhaohui Steve,Thomas, Daryl J., McVean, Gilean, Auton, Adam, Bottolo, Leonardo, Cardin, Niall, Eyhera-mendy, Susana, Freeman, Colin, Marchini, Jonathan, Myers, Simon, Spencer, Chris, Stephens,Matthew, Donnelly, Peter, Cardon, Lon R., Clarke, Geraldine, Evans, David M., Morris, An-drew P., Weir, Bruce S., Johnson, Todd A., Mullikin, James C., Sherry, Stephen T., Feolo,Michael, Skol, Andrew, Zhang, Houcan, Matsuda, Ichiro, Fukushima, Yoshimitsu, MacEr, Dar-ryl R., Suda, Eiko, Rotimi, Charles N., Adebamowo, Clement A., Ajayi, Ike, Aniagwu, Toyin,Marshall, Patricia A., Nkwodimmah, Chibuzor, Royal, Charmaine D.M., Leppert, Mark F.,Dixon, Missy, Peiffer, Andy, Qiu, Renzong, Kent, Alastair, Kato, Kazuto, Niikawa, Norio, Ade-wole, Isaac F., Knoppers, Bartha M., Foster, Morris W., Clayton, Ellen Wright, Watkin, Jessica,Muzny, Donna, Nazareth, Lynne, Sodergren, Erica, Weinstock, George M., Yakub, Imtaz, Bir-ren, Bruce W., Wilson, Richard K., Fulton, Lucinda L., Rogers, Jane, Burton, John, Carter,Nigel P., Clee, Christopher M., Griffiths, Mark, Jones, Matthew C., McLay, Kirsten, Plumb,Robert W., Ross, Mark T., Sims, Sarah K., Willey, David L., Chen, Zhu, Han, Hua, Kang,Le, Godbout, Martin, Wallenburg, John C., L’Archeveque, Paul, Bellemare, Guy, Saeki, Koji,Wang, Hongguang, An, Daochang, Fu, Hongbo, Li, Qing, Wang, Zhen, Wang, Renwu, Holden,Arthur L., Brooks, Lisa D., McEwen, Jean E., Guyer, Mark S., Wang, Vivian Ota, Peterson,

101
Jane L., Shi, Michael, Spiegel, Jack, Sung, Lawrence M., Zacharia, Lynn F., Collins, Francis S.,Kennedy, Karen, Jamieson, Ruth, & Stewart, John. 2007. A second generation human haplotypemap of over 3.1 million SNPs. Nature, 449(7164), 851–861.
Friedman, Naomi P., Miyake, Akira, Altamirano, Lee J., Corley, Robin P., Young, Susan E., Rhea,Sally Ann, & Hewitt, John K. 2016. Stability and change in executive function abilities from lateadolescence to early adulthood: A longitudinal twin study. Developmental Psychology, 52(2),326–340.
Furberg, Helena, Kim, YunJung, Dackor, Jennifer, Boerwinkle, Eric, Franceschini, Nora, Ardissino,Diego, Bernardinelli, Luisa, Mannucci, Pier M, Mauri, Francesco, Merlini, Piera A, Absher,Devin, Assimes, Themistocles L, Fortmann, Stephen P, Iribarren, Carlos, Knowles, Joshua W,Quertermous, Thomas, Ferrucci, Luigi, Tanaka, Toshiko, Bis, Joshua C, Furberg, Curt D, Haritu-nians, Talin, McKnight, Barbara, Psaty, Bruce M, Taylor, Kent D, Thacker, Evan L, Almgren,Peter, Groop, Leif, Ladenvall, Claes, Boehnke, Michael, Jackson, Anne U, Mohlke, Karen L,Stringham, Heather M, Tuomilehto, Jaakko, Benjamin, Emelia J, Hwang, Shih-Jen, Levy, Daniel,Preis, Sarah Rosner, Vasan, Ramachandran S, Duan, Jubao, Gejman, Pablo V, Levinson, Dou-glas F, Sanders, Alan R, Shi, Jianxin, Lips, Esther H, McKay, James D, Agudo, Antonio,Barzan, Luigi, Bencko, Vladimir, Benhamou, Simone, Castellsague, Xavier, Canova, Cristina,Conway, David I, Fabianova, Eleonora, Foretova, Lenka, Janout, Vladimir, Healy, Claire M,Holcatova, Ivana, Kjaerheim, Kristina, Lagiou, Pagona, Lissowska, Jolanta, Lowry, Ray, Macfar-lane, Tatiana V, Mates, Dana, Richiardi, Lorenzo, Rudnai, Peter, Szeszenia-Dabrowska, Neonilia,Zaridze, David, Znaor, Ariana, Lathrop, Mark, Brennan, Paul, Bandinelli, Stefania, Frayling,Timothy M, Guralnik, Jack M, Milaneschi, Yuri, Perry, John R B, Altshuler, David, Elosua,Roberto, Kathiresan, Sek, Lucas, Gavin, Melander, Olle, O’Donnell, Christopher J, Salomaa,Veikko, Schwartz, Stephen M, Voight, Benjamin F, Penninx, Brenda W, Smit, Johannes H,Vogelzangs, Nicole, Boomsma, Dorret I, de Geus, Eco J C, Vink, Jacqueline M, Willemsen,Gonneke, Chanock, Stephen J, Gu, Fangyi, Hankinson, Susan E, Hunter, David J, Hofman,Albert, Tiemeier, Henning, Uitterlinden, Andre G, van Duijn, Cornelia M, Walter, Stefan, Chas-man, Daniel I, Everett, Brendan M, Pare, Guillaume, Ridker, Paul M, Li, Ming D, Maes, Her-mine H, Audrain-McGovern, Janet, Posthuma, Danielle, Thornton, Laura M, Lerman, Caryn,Kaprio, Jaakko, Rose, Jed E, Ioannidis, John P A, Kraft, Peter, Lin, Dan-Yu, & Sullivan,Patrick F. 2010. Genome-wide meta-analyses identify multiple loci associated with smokingbehavior. Nature Genetics, 42(5), 441–447.
Galton, Francis. 1875. The history of twins, as a criterion of the relative powers of nature andnurture. Fraser’s Magazine, 12, 566–76.
Gaoni, Y., & Mechoulam, R. 1964. Isolation, Structure, and Partial Synthesis of an Active Con-stituent of Hashish. Journal of the American Chemical Society, 86(8), 1646–1647.
Gaugler, Trent, Klei, Lambertus, Sanders, Stephan J., Bodea, Corneliu A., Goldberg, Arthur P.,Lee, Ann B., Mahajan, Milind, Manaa, Dina, Pawitan, Yudi, Reichert, Jennifer, Ripke, Stephan,Sandin, Sven, Sklar, Pamela, Svantesson, Oscar, Reichenberg, Abraham, Hultman, Christina M.,Devlin, Bernie, Roeder, Kathryn, & Buxbaum, Joseph D. 2014. Most genetic risk for autismresides with common variation. Nature Genetics, 46(8), 881–885.
Glantz, Meyer D., & Leshner, Alan I. 2000. Drug abuse and developmental psychopathology.Development and Psychopathology, 12(4), 795–814.

102
Gonzalez, Marta C., Hidalgo, Cesar A., & Barabasi, Albert-Laszlo. 2008. Understanding individualhuman mobility patterns. Nature, 453(7196), 779–782.
Grimm, Kevin J., Ram, Nilam, & Ryne, Estabrook. 2017.Growth modeling: structural equation and multilevel modeling approaches. New York: TheGuilford Press.
Gunderson, Kevin L., Steemers, Frank J., Lee, Grace, Mendoza, Leo G., & Chee, Mark S. 2005.A genome-wide scalable SNP genotyping assay using microarray technology. Nature Genetics,37(5), 549–554.
Haberstick, Brett C., Zeiger, Joanna S., Corley, Robin P., Hopfer, Christian J., Stallings,Michael C., Rhee, Soo Hyun, & Hewitt, John K. 2011. Common and drug-specific geneticinfluences on subjective effects to alcohol, tobacco and marijuana use. Addiction, 106(1), 215–224.
Hajek, Peter, Etter, Jean Francois, Benowitz, Neal, Eissenberg, Thomas, & Mcrobbie, Hayden.2014. Electronic cigarettes: Review of use, content, safety, effects on smokers and potential forharm and benefit. Addiction, 109(11), 1801–1810.
Hall, Stephen S. 2013. Genetics: A gene of rare effect. Nature, 496(7444), 152–155.
Hall, Wayne D, Patton, George, Stockings, Emily, Weier, Megan, Lynskey, Michael, Morley, Kather-ine I, & Degenhardt, Louisa. 2016. Why young people’s substance use matters for global health.The Lancet Psychiatry, 3(3), 265–279.
Haller, Gabe, Druley, Todd, Vallania, Francesco L., Mitra, Robi D., Li, Ping, Akk, Gustav, Stein-bach, Joe Henry, Breslau, Naomi, Johnson, Eric, Hatsukami, Dorothy, Stitzel, Jerry, Bierut,Laura J., & Goate, Alison M. 2012. Rare missense variants in CHRNB4 are associated withreduced risk of nicotine dependence. Human Molecular Genetics, 21(3), 647–655.
Haller, Gabe, Li, Ping, Esch, Caroline, Hsu, Simon, Goate, Alison M., & Steinbach, Joe Henry.2014a. Functional Characterization Improves Associations between Rare Non-Synonymous Vari-ants in CHRNB4 and Smoking Behavior. PLoS ONE, 9(5), e96753.
Haller, Gabe, Kapoor, Manav, Budde, John, Xuei, Xiaoling, Edenberg, Howard, Nurnberger, John,Kramer, John, Brooks, Andy, Tischfield, Jay, Almasy, Laura, Agrawal, Arpana, Bucholz, Kath-leen, Rice, John, Saccone, Nancy, Bierut, Laura, & Goate, Alison. 2014b. Rare missense variantsin CHRNB3 and CHRNA3 are associated with risk of alcohol and cocaine dependence. HumanMolecular Genetics, 23(3), 810–819.
Hamilton, Carol M., Strader, Lisa C., Pratt, Joseph G., Maiese, Deborah, Hendershot, Tabitha,Kwok, Richard K., Hammond, Jane A., Huggins, Wayne, Jackman, Dean, Pan, Huaqin, Nettles,Destiney S., Beaty, Terri H., Farrer, Lindsay A., Kraft, Peter, Marazita, Mary L., Ordovas,Jose M., Pato, Carlos N., Spitz, Margaret R., Wagener, Diane, Williams, Michelle, Junkins,Heather A., Harlan, William R., Ramos, Erin M., & Haines, Jonathan. 2011. The PhenX toolkit:Get the most from your measures. American Journal of Epidemiology, 174(3), 253–260.
Hancock, D. B., Reginsson, G. W., Gaddis, N. C., Chen, X, Saccone, N. L., Lutz, S. M., Qaiser,B., Sherva, R., Steinberg, S., Zink, F., Stacey, S. N., Glasheen, C., Chen, J., Gu, F., Frederiksen,B. N., Loukola, A., Gudbjartsson, D. F., Bruske, I., Landi, M. T., Bickeboller, H., Madden,P., Farrer, L., Kaprio, J., Kranzler, H. R., Gelernter, J., Baker, T. B., Kraft, P., Amos, C. I.,

103
Caporaso, N. E., Hokanson, J. E., Bierut, L. J., Thorgeirsson, T. E., Johnson, E. O., & Stefansson,K. 2015. Genome-wide meta-analysis reveals common splice site acceptor variant in CHRNA4associated with nicotine dependence. Translational Psychiatry, 5(10).
Harris, K.M., Halpern, C.T., Whitsel, E., Hussey, J., Tabor, J., Entzel, P., & Udry, J.R. 2009.The National Longitudinal Study of Adolescent to Adult Health: Codebook.
Harris, R. Adron, Trudell, James R., & Mihic, S. John. 2008. Ethanol’s Molecular Targets. ScienceSignaling, 1(28).
Henry, Kimberly L., & Thornberry, Terence P. 2010. Truancy and Escalation of Substance UseDuring Adolescence. Journal of Studies on Alcohol and Drugs, 71(1), 115–124.
Hicks, Brian M., Schalet, Benjamin D., Malone, Stephen M., Iacono, William G., & McGue,Matt. 2011. Psychometric and genetic architecture of substance use disorder and behavioraldisinhibition measures for gene association studies. Behavior Genetics, 41(4), 459–475.
Hiemstra, Marieke, de Leeuw, Rebecca N.H., Engels, Rutger C.M.E., & Otten, Roy. 2017. Whatparents can do to keep their children from smoking: A systematic review on smoking-specificparenting strategies and smoking onset. Addictive Behaviors, 70, 107–128.
Hijmans, Robert J. 2017. geosphere: Spherical Trigonometry. R package version 1.5-7.
Holterhoff, Kate. 2014. The History and Reception of Charles Darwin’s Hypothesis of Pangenesis.Journal of the History of Biology, 47(4), 661–695.
Hopfer, Christian. 2014. Implications of marijuana legalization for adolescent substance use.Substance Abuse, 35(4), 331–335.
Howie, Bryan, Fuchsberger, Christian, Stephens, Matthew, Marchini, Jonathan, & Abecasis,Goncalo R. 2012. Fast and accurate genotype imputation in genome-wide association studiesthrough pre-phasing. Nature Genetics, 44(8), 955–959.
Hudson, Kathy, Lifton, Richard, & Patrick-Lake, Bray. 2015.The Precision Medicine Initiative Cohort Program. Tech. rept. National Institutes of Health.
Hutchison, Kent E., Stallings, Michael, McGeary, John, & Bryan, Angela. 2004. Population Strat-ification in the Candidate Gene Study: Fatal Threat or Red Herring? Psychological Bulletin,130(1), 66–79.
Iacono, William G., Malone, Stephen M., & McGue, Matt. 2008. Behavioral Disinhibition andthe Development of Early-Onset Addiction: Common and Specific Influences. Annual Review ofClinical Psychology, 4(1), 325–348.
Jinks, J L, & Fulker, D W. 1970. Comparison of the biometrical genetical, MAVA, and classicalapproaches to the analysis of human behavior. Psychological bulletin, 73(5), 311–49.
John, O.P., Donahue, E.M., & Kentle, R.L. 1991. The Big Five Inventory–Versions 4a and 54.Berkeley, CA: University of California, Berkeley, Institute of Personality and Social Research.
Jordan, Chloe J., & Andersen, Susan L. 2016. Sensitive periods of substance abuse: Early risk forthe transition to dependence. Developmental Cognitive Neuroscience, oct.

104
Jorgenson, E, Thai, K K, Hoffmann, T J, Sakoda, L C, Kvale, M N, Banda, Y, Schaefer, C,Risch, N, Mertens, J, Weisner, C, & Choquet, H. 2017. Genetic contributors to variation in alco-hol consumption vary by race/ethnicity in a large multi-ethnic genome-wide association study.Molecular Psychiatry, 22(9), 1359–1367.
Kang, Hyun Min, Sul, Jae Hoon, Service, Susan K., Zaitlen, Noah A., Kong, Sit Yee, Freimer,Nelson B., Sabatti, Chiara, & Eskin, Eleazar. 2010. Variance component model to account forsample structure in genome-wide association studies. Nature Genetics, 42(4), 348–354.
Karlsson Linner, Richard, Biroli, Pietro, Kong, Edward, Meddens, S Fleur W, Wedow, Robbee,Fontana, Mark Alan, Lebreton, Mael, Abdellaoui, Abdel, Hammerschlag, Anke R, Nivard,Michel G, Okbay, Aysu, Rietveld, Cornelius A, Timshel, Pascal N, Tino, Stephen P, Trzaskowski,Maciej, de Vlaming, Ronald, Zund, Christian L, Bao, Yanchun, Buzdugan, Laura, Caplin, Ann H,Chen, Chia-Yen, Eibich, Peter, Fontanillas, Pierre, Gonzalez, Juan R, Joshi, Peter K, Karhunen,Ville, Kleinman, Aaron, Levin, Remy Z, Lill, Christina M, Meddens, Gerardus A, Muntane, Ger-ard, Sanchez-Roige, Sandra, van Rooij, Frank J, Taskesen, Erdogan, Wu, Yang, Zhang, Futao, , ,, , , Auton, Adam, Boardman, Jason D, Clark, David W, Conlin, Andrew, Dolan, Conor C, Fis-chbacher, Urs, Groenen, Patrick J F, Harris, Kathleen Mullan, Hasler, Gregor, Hofman, Albert,Ikram, Mohammad A, Jain, Sonia, Karlsson, Robert, Kessler, Ronald C, Kooyman, Maarten,MacKillop, James, Mannikko, Minna, Morcillo-Suarez, Carlos, McQueen, Matthew B, Schmidt,Klaus M, Smart, Melissa C, Sutter, Matthias, Thurik, A Roy, Uitterlinden, Andre G, White,Jon, de Wit, Harriet, Yang, Jian, Bertram, Lars, Boomsma, Dorret, Esko, Tonu, Fehr, Ernst,Hinds, David A, Johannesson, Magnus, Kumari, Meena, Laibson, David, Magnusson, Patrik K E,Meyer, Michelle N, Navarro, Arcadi, Palmer, Abraham A, Pers, Tune H, Posthuma, Danielle,Schunk, Daniel, Stein, Murray B, Svento, Rauli, Tiemeier, Henning, Timmers, Paul R H J,Turley, Patrick, Ursano, Robert J, Wagner, Gert G, Wilson, James F, Gratten, Jacob, Lee,James J, Cesarini, David, Benjamin, Daniel J, Koellinger, Philipp, & Beauchamp, Jonathan P.2018. Genome-wide study identifies 611 loci associated with risk tolerance and risky behaviors.bioRxiv, jan.
Kendler, Kenneth S., Myers, John, & Prescott, Carol A. 2007. Specificity of genetic and environ-mental risk factors for symptoms of cannabis, cocaine, alcohol, caffeine, and nicotine dependence.Archives of General Psychiatry, 64(11), 1313–1320.
Keyes, Margaret, Legrand, Lisa N, Iacono, William G, & McGue, Matt. 2008. Parental Smokingand Adolescent Problem Behavior: An Adoption Study of General and Specific Effects. AmericanJournal of Psychiatry, 165(10), 1338–1344.
Krueger, Robert F., Hicks, Brian M., Patrick, Christopher J., Carlson, Scott R., Iacono, William G.,& McGue, Matt. 2002. Etiologic connections among substance dependence, antisocial behaviorand personality: Modeling the externalizing spectrum. Journal of Abnormal Psychology, 111(3),411–424.
Kumasaka, Natsuhiko, Aoki, Masayuki, Okada, Yukinori, Takahashi, Atsushi, Ozaki, Kouichi,Mushiroda, Taisei, Hirota, Tomomitsu, Tamari, Mayumi, Tanaka, Toshihiro, Nakamura, Yusuke,Kamatani, Naoyuki, & Kubo, Michiaki. 2012. Haplotypes with Copy Number and Single Nu-cleotide Polymorphisms in CYP2A6 Locus Are Associated with Smoking Quantity in a JapanesePopulation. PLoS ONE, 7(9).
Kuznetsova, Alexandra, Brockhoff, Per B., & Christensen, Rune H. B. 2017. lmerTest Package:Tests in Linear Mixed Effects Models. Journal of Statistical Software, 82(13).
105
Larson, Greger, & Bradley, Daniel G. 2014. How Much Is That in Dog Years? The Advent ofCanine Population Genomics. PLoS Genetics, 10(1), 1–3.
Lee, Seunggeun, Wu, Michael C., & Lin, Xihong. 2012. Optimal tests for rare variant effects insequencing association studies. Biostatistics, 13(4), 762–775.
Lee, Seunggeung, Abecasis, Goncalo R., Boehnke, Michael, & Lin, Xihong. 2014. Rare-VariantAssociation Analysis: Study Designs and Statistical Tests. The American Journal of HumanGenetics, 95(1), 5–23.
Lek, Monkol, Karczewski, Konrad J., Minikel, Eric V., Samocha, Kaitlin E., Banks, Eric, Fennell,Timothy, O’Donnell-Luria, Anne H., Ware, James S., Hill, Andrew J., Cummings, Beryl B.,Tukiainen, Taru, Birnbaum, Daniel P., Kosmicki, Jack A., Duncan, Laramie E., Estrada, Karol,Zhao, Fengmei, Zou, James, Pierce-Hoffman, Emma, Berghout, Joanne, Cooper, David N., De-flaux, Nicole, DePristo, Mark, Do, Ron, Flannick, Jason, Fromer, Menachem, Gauthier, Laura,Goldstein, Jackie, Gupta, Namrata, Howrigan, Daniel, Kiezun, Adam, Kurki, Mitja I., Moon-shine, Ami Levy, Natarajan, Pradeep, Orozco, Lorena, Peloso, Gina M., Poplin, Ryan, Rivas,Manuel A., Ruano-Rubio, Valentin, Rose, Samuel A., Ruderfer, Douglas M., Shakir, Khalid,Stenson, Peter D., Stevens, Christine, Thomas, Brett P., Tiao, Grace, Tusie-Luna, Maria T.,Weisburd, Ben, Won, Hong Hee, Yu, Dongmei, Altshuler, David M., Ardissino, Diego, Boehnke,Michael, Danesh, John, Donnelly, Stacey, Elosua, Roberto, Florez, Jose C., Gabriel, Stacey B.,Getz, Gad, Glatt, Stephen J., Hultman, Christina M., Kathiresan, Sekar, Laakso, Markku, Mc-Carroll, Steven, McCarthy, Mark I., McGovern, Dermot, McPherson, Ruth, Neale, Benjamin M.,Palotie, Aarno, Purcell, Shaun M., Saleheen, Danish, Scharf, Jeremiah M., Sklar, Pamela, Sul-livan, Patrick F., Tuomilehto, Jaakko, Tsuang, Ming T., Watkins, Hugh C., Wilson, James G.,Daly, Mark J., & MacArthur, Daniel G. 2016. Analysis of protein-coding genetic variation in60,706 humans. Nature, 536(7616), 285–291.
Lennox, James. 2017. Aristotle’s Biology. In: Zalta, Edward N. (ed), The Stanford Encyclopediaof Philosophy, spring 2017 edn. Metaphysics Research Lab, Stanford University.
Li, Yun, Willer, Cristen, Sanna, Serena, & Abecasis, Goncalo. 2009. Genotype Imputation. AnnualReview of Genomics and Human Genetics, 10(1), 387–406.
Liu, Dajiang J, Peloso, Gina M, Zhan, Xiaowei, Holmen, Oddgeir L, Zawistowski, Matthew, Feng,Shuang, Nikpay, Majid, Auer, Paul L, Goel, Anuj, Zhang, He, Peters, Ulrike, Farrall, Mar-tin, Orho-Melander, Marju, Kooperberg, Charles, McPherson, Ruth, Watkins, Hugh, Willer,Cristen J, Hveem, Kristian, Melander, Olle, Kathiresan, Sekar, & Abecasis, Goncalo R. 2014.Meta-analysis of gene-level tests for rare variant association. Nature Genetics, 46(2), 200–204.
Liu, Jason Z., Tozzi, Federica, Waterworth, Dawn M., Pillai, Sreekumar G., Muglia, Pierandrea,Middleton, Lefkos, Berrettini, Wade, Knouff, Christopher W., Yuan, Xin, Waeber, Gerard, Vol-lenweider, Peter, Preisig, Martin, Wareham, Nicholas J., Zhao, Jing Hua, Loos, Ruth J.F., Bar-roso, Ins, Khaw, Kay Tee, Grundy, Scott, Barter, Philip, Mahley, Robert, Kesaniemi, Antero,McPherson, Ruth, Vincent, John B., Strauss, John, Kennedy, James L., Farmer, Anne, McGuffin,Peter, Day, Richard, Matthews, Keith, Bakke, Per, Gulsvik, Amund, Lucae, Susanne, Ising, Mar-cus, Brueckl, Tanja, Horstmann, Sonja, Wichmann, H. Erich, Rawal, Rajesh, Dahmen, Norbert,Lamina, Claudia, Polasek, Ozren, Zgaga, Lina, Huffman, Jennifer, Campbell, Susan, Kooner,Jaspal, Chambers, John C., Burnett, Mary Susan, Devaney, Joseph M., Pichard, Augusto D.,Kent, Kenneth M., Satler, Lowell, Lindsay, Joseph M., Waksman, Ron, Epstein, Stephen, Wil-son, James F., Wild, Sarah H., Campbell, Harry, Vitart, Veronique, Reilly, Muredach P., Li,

106
Mingyao, Qu, Liming, Wilensky, Robert, Matthai, William, Hakonarson, Hakon H., Rader,Daniel J., Franke, Andre, Wittig, Michael, Schafer, Arne, Uda, Manuela, Terracciano, Antonio,Xiao, Xiangjun, Busonero, Fabio, Scheet, Paul, Schlessinger, David, Clair, David St, Rujescu,Dan, Abecasis, Goncalo R., Grabe, Hans Jorgen, Teumer, Alexander, Volzke, Henry, Peters-mann, Astrid, John, Ulrich, Rudan, Igor, Hayward, Caroline, Wright, Alan F., Kolcic, Ivana,Wright, Benjamin J., Thompson, John R., Balmforth, Anthony J., Hall, Alistair S., Samani,Nilesh J., Anderson, Carl A., Ahmad, Tariq, Mathew, Christopher G., Parkes, Miles, Satsangi,Jack, Caulfield, Mark, Munroe, Patricia B., Farrall, Martin, Dominiczak, Anna, Worthington,Jane, Thomson, Wendy, Eyre, Steve, Barton, Anne, Mooser, Vincent, Francks, Clyde, & Mar-chini, Jonathan. 2010. Meta-analysis and imputation refines the association of 15q25 with smok-ing quantity. Nature Genetics, 42(5), 436–440.
Loh, Po-Ru, Tucker, George, Bulik-Sullivan, Brendan K, Vilhjalmsson, Bjarni J, Finucane, Hi-lary K, Salem, Rany M, Chasman, Daniel I, Ridker, Paul M, Neale, Benjamin M, Berger, Bon-nie, Patterson, Nick, & Price, Alkes L. 2015. Efficient Bayesian mixed-model analysis increasesassociation power in large cohorts. Nature genetics, 47(3), 284–90.
Long, Jed A., & Nelson, Trisalyn A. 2013. A review of quantitative methods for movement data.International Journal of Geographical Information Science, 27(2), 292–318.
Luczak, Susan E., Glatt, Stephen J., & Wall, Tamara J. 2006. Meta-analyses of ALDH2 andADH1B with alcohol dependence in asians. Psychological Bulletin, 132(4), 607–621.
MacArthur, Jacqueline, Bowler, Emily, Cerezo, Maria, Gil, Laurent, Hall, Peggy, Hastings, Emma,Junkins, Heather, McMahon, Aoife, Milano, Annalisa, Morales, Joannella, Pendlington, Zoe May,Welter, Danielle, Burdett, Tony, Hindorff, Lucia, Flicek, Paul, Cunningham, Fiona, & Parkinson,Helen. 2017. The new NHGRI-EBI Catalog of published genome-wide association studies (GWASCatalog). Nucleic Acids Research, 45(D1), D896–D901.
Mackie, K., & Hille, B. 1992. Cannabinoids inhibit N-type calcium channels in neuroblastoma-glioma cells. Proceedings of the National Academy of Sciences, 89(9), 3825–3829.
Madden, Pamela A.F., & Heath, Andrew C. 2002. Shared genetic vulnerability in alcohol andcigarette use and dependence. Alcoholism: Clinical and Experimental Research, 26(12), 1919–1921.
Maes, Hermine H., Sullivan, Patrick F., Bulik, Cynthia M., Neale, Michael C., Prescott, Carol A.,Eaves, Lindon J., & Kendler, Kenneth S. 2004. A twin study of genetic and environmentalinfluences on tobacco initiation, regular tobacco use and nicotine dependence. PsychologicalMedicine, 34(7), 1251–1261.
Maienschein, Jane. 2017. Epigenesis and Preformationism. In: Zalta, Edward N. (ed), The StanfordEncyclopedia of Philosophy, spring 2017 edn. Metaphysics Research Lab, Stanford University.
Marouli, Eirini, Graff, Mariaelisa, Medina-Gomez, Carolina, Lo, Ken Sin, Wood, Andrew R., Kjaer,Troels R., Fine, Rebecca S., Lu, Yingchang, Schurmann, Claudia, Highland, Heather M., Rueger,Sina, Thorleifsson, Gudmar, Justice, Anne E., Lamparter, David, Stirrups, Kathleen E., Turcot,Valerie, Young, Kristin L, Winkler, Thomas W., Esko, Tonu, Karaderi, Tugce, Locke, Adam E.,Masca, Nicholas G. D., Ng, Maggie C. Y., Mudgal, Poorva, Rivas, Manuel A., Vedantam, Sailaja,Mahajan, Anubha, Guo, Xiuqing, Abecasis, Goncalo, Aben, Katja K., Adair, Linda S., Alam, De-wan S., Albrecht, Eva, Allin, Kristine H., Allison, Matthew, Amouyel, Philippe, Appel, Emil V.,
107
Arveiler, Dominique, Asselbergs, Folkert W., Auer, Paul L., Balkau, Beverley, Banas, Bernhard,Bang, Lia E., Benn, Marianne, Bergmann, Sven, Bielak, Lawrence F., Bluher, Matthias, Boe-ing, Heiner, Boerwinkle, Eric, Boger, Carsten A., Bonnycastle, Lori L., Bork-Jensen, Jette, Bots,Michiel L., Bottinger, Erwin P., Bowden, Donald W., Brandslund, Ivan, Breen, Gerome, Brilliant,Murray H., Broer, Linda, Burt, Amber A., Butterworth, Adam S., Carey, David J., Caulfield,Mark J., Chambers, John C., Chasman, Daniel I., Chen, Yii-Der Ida, Chowdhury, Rajiv, Chris-tensen, Cramer, Chu, Audrey Y., Cocca, Massimiliano, Collins, Francis S., Cook, James P.,Corley, Janie, Galbany, Jordi Corominas, Cox, Amanda J., Cuellar-Partida, Gabriel, Danesh,John, Davies, Gail, de Bakker, Paul I. W., de Borst, Gert J., de Denus, Simon, de Groot, MarkC. H., de Mutsert, Renee, Deary, Ian J., Dedoussis, George, Demerath, Ellen W., den Hollander,Anneke I., Dennis, Joe G., Di Angelantonio, Emanuele, Drenos, Fotios, Du, Mengmeng, Dunning,Alison M., Easton, Douglas F., Ebeling, Tapani, Edwards, Todd L, Ellinor, Patrick T., Elliott,Paul, Evangelou, Evangelos, Farmaki, Aliki-Eleni, Faul, Jessica D., Feitosa, Mary F., Feng,Shuang, Ferrannini, Ele, Ferrario, Marco M., Ferrieres, Jean, Florez, Jose C., Ford, Ian, For-nage, Myriam, Franks, Paul W., Frikke-Schmidt, Ruth, Galesloot, Tessel E., Gan, Wei, Gandin,Ilaria, Gasparini, Paolo, Giedraitis, Vilmantas, Giri, Ayush, Girotto, Giorgia, Gordon, Scott D.,Gordon-Larsen, Penny, Gorski, Mathias, Grarup, Niels, Grove, Megan L., Gudnason, Vilmundur,Gustafsson, Stefan, Hansen, Torben, Harris, Kathleen Mullan, Harris, Tamara B., Hattersley,Andrew T., Hayward, Caroline, He, Liang, Heid, Iris M., Heikkila, Kauko, Helgeland, Øyvind,Hernesniemi, Jussi, Hewitt, Alex W., Hocking, Lynne J., Hollensted, Mette, Holmen, Oddgeir L.,Hovingh, G. Kees, Howson, Joanna M. M., Hoyng, Carel B., Huang, Paul L., Hveem, Kristian,Ikram, M. Arfan, Ingelsson, Erik, Jackson, Anne U., Jansson, Jan-Hakan, Jarvik, Gail P., Jensen,Gorm B., Jhun, Min A., Jia, Yucheng, Jiang, Xuejuan, Johansson, Stefan, Jørgensen, Marit E,Jørgensen, Torben, Jousilahti, Pekka, Jukema, J. Wouter, Kahali, Bratati, Kahn, Rene S.,Kahonen, Mika, Kamstrup, Pia R., Kanoni, Stavroula, Kaprio, Jaakko, Karaleftheri, Maria,Kardia, Sharon L. R., Karpe, Fredrik, Kee, Frank, Keeman, Renske, Kiemeney, Lambertus A.,Kitajima, Hidetoshi, Kluivers, Kirsten B., Kocher, Thomas, Komulainen, Pirjo, Kontto, Jukka,Kooner, Jaspal S., Kooperberg, Charles, Kovacs, Peter, Kriebel, Jennifer, Kuivaniemi, Helena,Kury, Sebastien, Kuusisto, Johanna, La Bianca, Martina, Laakso, Markku, Lakka, Timo A.,Lange, Ethan M, Lange, Leslie A., Langefeld, Carl D., Langenberg, Claudia, Larson, Eric B., Lee,I-Te, Lehtimaki, Terho, Lewis, Cora E., Li, Huaixing, Li, Jin, Li-Gao, Ruifang, Lin, Honghuang,Lin, Li-An, Lin, Xu, Lind, Lars, Lindstrom, Jaana, Linneberg, Allan, Liu, Yeheng, Liu, Yong-mei, Lophatananon, Artitaya, Luan, Jian’an, Lubitz, Steven A., Lyytikainen, Leo-Pekka, Mackey,David A., Madden, Pamela A. F., Manning, Alisa K., Mannisto, Satu, Marenne, Gaelle, Marten,Jonathan, Martin, Nicholas G., Mazul, Angela L., Meidtner, Karina, Metspalu, Andres, Mitchell,Paul, Mohlke, Karen L., Mook-Kanamori, Dennis O., Morgan, Anna, Morris, Andrew D, Morris,Andrew P., Muller-Nurasyid, Martina, Munroe, Patricia B., Nalls, Mike A., Nauck, Matthias,Nelson, Christopher P., Neville, Matt, Nielsen, Sune F., Nikus, Kjell, Njølstad, Pal R., Nordest-gaard, Børge G., Ntalla, Ioanna, O’Connel, Jeffrey R., Oksa, Heikki, Loohuis, Loes M. Olde,Ophoff, Roel A., Owen, Katharine R., Packard, Chris J., Padmanabhan, Sandosh, Palmer, ColinN. A., Pasterkamp, Gerard, Patel, Aniruddh P., Pattie, Alison, Pedersen, Oluf, Peissig, Peggy L.,Peloso, Gina M., Pennell, Craig E., Perola, Markus, Perry, James A, Perry, John R. B., Per-son, Thomas N., Pirie, Ailith, Polasek, Ozren, Posthuma, Danielle, Raitakari, Olli T., Rasheed,Asif, Rauramaa, Rainer, Reilly, Dermot F., Reiner, Alex P., Renstrom, Frida, Ridker, Paul M.,Rioux, John D., Robertson, Neil, Robino, Antonietta, Rolandsson, Olov, Rudan, Igor, Ruth,Katherine S., Saleheen, Danish, Salomaa, Veikko, Samani, Nilesh J., Sandow, Kevin, Sapkota,Yadav, Sattar, Naveed, Schmidt, Marjanka K., Schreiner, Pamela J., Schulze, Matthias B., Scott,Robert A., Segura-Lepe, Marcelo P., Shah, Svati, Sim, Xueling, Sivapalaratnam, Suthesh, Small,

108
Kerrin S., Smith, Albert Vernon, Smith, Jennifer A., Southam, Lorraine, Spector, Timothy D.,Speliotes, Elizabeth K., Starr, John M., Steinthorsdottir, Valgerdur, Stringham, Heather M.,Stumvoll, Michael, Surendran, Praveen, ’t Hart, Leen M, Tansey, Katherine E., Tardif, Jean-Claude, Taylor, Kent D., Teumer, Alexander, Thompson, Deborah J., Thorsteinsdottir, Unnur,Thuesen, Betina H., Tonjes, Anke, Tromp, Gerard, Trompet, Stella, Tsafantakis, Emmanouil,Tuomilehto, Jaakko, Tybjaerg-Hansen, Anne, Tyrer, Jonathan P., Uher, Rudolf, Uitterlinden,Andre G., Ulivi, Sheila, van der Laan, Sander W., Van Der Leij, Andries R., van Duijn, Cor-nelia M., van Schoor, Natasja M., van Setten, Jessica, Varbo, Anette, Varga, Tibor V., Varma,Rohit, Edwards, Digna R. Velez, Vermeulen, Sita H., Vestergaard, Henrik, Vitart, Veronique,Vogt, Thomas F., Vozzi, Diego, Walker, Mark, Wang, Feijie, Wang, Carol A, Wang, Shuai, Wang,Yiqin, Wareham, Nicholas J., Warren, Helen R., Wessel, Jennifer, Willems, Sara M., Wilson,James G., Witte, Daniel R., Woods, Michael O., Wu, Ying, Yaghootkar, Hanieh, Yao, Jie, Yao,Pang, Yerges-Armstrong, Laura M., Young, Robin, Zeggini, Eleftheria, Zhan, Xiaowei, Zhang,Weihua, Zhao, Jing Hua, Zhao, Wei, Zhao, Wei, Zheng, He, Zhou, Wei, EPIC-InterAct Con-sortium, CHD Exome+ Consortium, ExomeBP Consortium, T2D-Genes Consortium, GoT2DGenes Consortium, Global Lipids Genetics Consortium, ReproGen Consortium, MAGIC Inves-tigators, Rotter, Jerome I, Boehnke, Michael, Kathiresan, Sekar, McCarthy, Mark I., Willer,Cristen J., Stefansson, Kari, Borecki, Ingrid B., Liu, Dajiang J., North, Kari E., Heard-Costa,Nancy L., Pers, Tune H., Lindgren, Cecilia M., Oxvig, Claus, Kutalik, Zoltan, Rivadeneira, Fer-nando, Loos, Ruth J. F., Frayling, Timothy M., Hirschhorn, Joel N., Deloukas, Panos, & Lettre,Guillaume. 2017. Rare and low-frequency coding variants alter human adult height. Nature,542(7640), 186–190.
Martin, B R. 1986. Cellular effects of cannabinoids. Pharmacological Reviews, 38(1), 45 LP – 74.
Martin, N G, & Eaves, L J. 1977. The genetical analysis of covariance structure. Heredity, 38(1),79–95.
Masten, Ann S., Faden, Vivian B., Zucker, Robert A., & Spear, Linda P. 2008. Underage Drinking:A Developmental Framework. Pediatrics, 121(Supplement 4), S235–S251.
Matsuda, L a, Lolait, S J, Brownstein, M J, Young, a C, & Bonner, T I. 1990. Structure of acannabinoid receptor and functional expression of the cloned cDNA. Nature, 346(6284), 561–564.
Mbarek, Hamdi, Milaneschi, Yuri, Fedko, Iryna O., Hottenga, Jouke-Jan, de Moor, Marleen H.M.,Jansen, Rick, Gelernter, Joel, Sherva, Richard, Willemsen, Gonneke, Boomsma, Dorret I., Pen-ninx, Brenda W., & Vink, Jacqueline M. 2015. The genetics of alcohol dependence: Twin andSNP-based heritability, and genome-wide association study based on AUDIT scores. AmericanJournal of Medical Genetics Part B: Neuropsychiatric Genetics, 168(8), 739–748.
McClain, Justin A., Morris, Stephanie A., Marshall, S. Alexander, & Nixon, Kimberly. 2014. Ec-topic hippocampal neurogenesis in adolescent male rats following alcohol dependence. AddictionBiology, 19(4), 687–699.
McClure-Begley, T D, Papke, R L, Stone, K L, Stokes, C, Levy, A D, Gelernter, J, Xie, P, Lind-strom, J, & Picciotto, M R. 2014. Rare Human Nicotinic Acetylcholine Receptor 4 Subunit(CHRNA4) Variants Affect Expression and Function of High-Affinity Nicotinic AcetylcholineReceptors. Journal of Pharmacology and Experimental Therapeutics, 348(3), 410–420.

109
McCracken, Lindsay M., McCracken, Mandy L., & Harris, R. Adron. 2016. Mechanisms of Actionof Different Drugs of Abuse. In: Sher, Kenneth J. (ed), The Oxford Handbook of Substance UseDisorders, vol. 1. Oxford University Press.
McGue, M, Sharma, A, & Benson, P. 1996. Parent and sibling influences on adolescent alcohol useand misuse: evidence from a U.S. adoption cohort. Journal of Studies on Alcohol, 57(1), 8–18.
McGue, Matt, & Gottesman, Irving I. 2015. Behavior Genetics. In: The Encyclopedia of ClinicalPsychology. Hoboken, NJ, USA: John Wiley & Sons, Inc.
Melis, Miriam, Gessa, Gian Luigi, & Diana, Marco. 2000. Different mechanisms for dopamin-ergic excitation induced by opiates and cannabinoids in the rat midbrain. Progress inNeuro-Psychopharmacology and Biological Psychiatry, 24(6), 993–1006.
Mendel, Gregor. 1965. Experiments in Plant Hybridisation. Edinburgh and London: Oliver &Boyd.
Miech, R. A., Schulenberg, J. E., Johnston, L. D., Bachman, J. G., O’Malley, P. M., & Patrick, M. E.2017. National Adolescent Drug Trends in 2017: Findings Released. Tech. rept. Monitoring theFuture, Ann Arbor, MI.
Miko, Ilona. 2008. Mitosis, Meiosis, and Inheritance.
Miller, Geoffrey. 2012. The Smartphone Psychology Manifesto. Perspectives on PsychologicalScience, 7(3), 221–237.
Minikel, Eric V., Lek, Monkol, Samocha, Kaitlin E., Karczewski, Konrad J., Marshall, Jamie L.,Armean, Irina M, Ware, James S., Daly, Mark J., & MacArthur, Daniel G. 2016. An earlyglimpse of saturation mutagenesis in humans: Insights from protein-coding genetic variation in60,706 people. Pages S107–S107 of: Prion. Taylor & Francis.
Morera-Herreras, T., Ruiz-Ortega, J.A., Gomez-Urquijo, S., & Ugedo, L. 2008. Involvement of sub-thalamic nucleus in the stimulatory effect of ∆9-tetrahydrocannabinol on dopaminergic neurons.Neuroscience, 151(3), 817–823.
Neale, M C, & Maes, Hermine H M. 1994. Methodology for Genetic Studies of Twins and Families.Vol. 48.
Neale, Michael C., Hunter, Michael D., Pritikin, Joshua N., Zahery, Mahsa, Brick, Timo-thy R., Kirkpatrick, Robert M., Estabrook, Ryne, Bates, Timothy C., Maes, Hermine H., &Boker, Steven M. 2016. OpenMx 2.0: Extended Structural Equation and Statistical Modeling.Psychometrika, 81(2), 535–549.
Nelson, Matthew R., Tipney, Hannah, Painter, Jeffery L., Shen, Judong, Nicoletti, Paola, Shen,Yufeng, Floratos, Aris, Sham, Pak Chung, Li, Mulin Jun, Wang, Junwen, Cardon, Lon R.,Whittaker, John C., & Sanseau, Philippe. 2015. The support of human genetic evidence forapproved drug indications. Nature Genetics, 47(8), 856–860.
Nichols, R.C., & Bilbro, WC Jr. 1966. The Diagnosis of Twin Zygosity. Human Heredity, 16(3),265–275.

110
Olfson, E, Saccone, N L, Johnson, E O, Chen, L-S, Culverhouse, R, Doheny, K, Foltz, S M, Fox,L, Gogarten, S M, Hartz, S, Hetrick, K, Laurie, C C, Marosy, B, Amin, N, Arnett, D, Barr,R G, Bartz, T M, Bertelsen, S, Borecki, I B, Brown, M R, Chasman, D I, van Duijn, C M,Feitosa, M F, Fox, E R, Franceschini, N, Franco, O H, Grove, M L, Guo, X, Hofman, A, Kardia,S L R, Morrison, A C, Musani, S K, Psaty, B M, Rao, D C, Reiner, A P, Rice, K, Ridker, P M,Rose, L M, Schick, U M, Schwander, K, Uitterlinden, A G, Vojinovic, D, Wang, J-C, Ware,E B, Wilson, G, Yao, J, Zhao, W, Breslau, N, Hatsukami, D, Stitzel, J A, Rice, J, Goate, A,& Bierut, L J. 2016. Rare, low frequency and common coding variants in CHRNA5 and theircontribution to nicotine dependence in European and African Americans. Molecular Psychiatry,21(5), 601–607.
Osler, Merete, Holst, Claus, Prescott, Eva, & Sørensen, Thorkild I.A. 2001. Influence of genesand family environment on adult smoking behavior assessed in an adoption study. GeneticEpidemiology, 21(3), 193–200.
Pagan, Jason L., Rose, Richard J., Viken, Richard J., Pulkkinen, Lea, Kaprio, Jaakko, & Dick,Danielle M. 2006. Genetic and environmental influences on stages of alcohol use across adolescenceand into young adulthood. Behavior Genetics, 36(4), 483–497.
Peng, Qian, Gizer, Ian R., Libiger, Ondrej, Bizon, Chris, Wilhelmsen, Kirk C., Schork, Nicholas J.,& Ehlers, Cindy L. 2014. Association and ancestry analysis of sequence variants in ADH andALDH using alcohol-related phenotypes in a Native American community sample. AmericanJournal of Medical Genetics Part B: Neuropsychiatric Genetics, 165(8), 673–683.
Pew Research Center. 2015. Teens, Social Media & Technology Overview 2015.
Piliguian, Mark, Zhu, Andy Z X, Zhou, Qian, Benowitz, Neal L, Ahluwalia, Jasjit S, Sanderson Cox,Lisa, & Tyndale, Rachel F. 2014. Novel CYP2A6 variants identified in African Americans areassociated with slow nicotine metabolism in vitro and in vivo. Pharmacogenetics and genomics,24(2), 118–28.
Plomin, Robert, DeFries, John C., Knopik, Valerie S., & Neiderhiser, Jenae M. 2016. Top 10Replicated Findings From Behavioral Genetics. Perspectives on Psychological Science, 11(1),3–23.
Polderman, Tinca J C, Benyamin, Beben, de Leeuw, Christiaan A, Sullivan, Patrick F, van Bo-choven, Arjen, Visscher, Peter M, & Posthuma, Danielle. 2015. Meta-analysis of the heritabilityof human traits based on fifty years of twin studies. Nature Genetics, 47(7), 702–709.
Price, Alkes L., Kryukov, Gregory V., de Bakker, Paul I.W., Purcell, Shaun M., Staples, Jeff,Wei, Lee Jen, & Sunyaev, Shamil R. 2010. Pooled Association Tests for Rare Variants in Exon-Resequencing Studies. American Journal of Human Genetics, 86(6), 832–838.
Pruitt, Kim D., Brown, Garth R., Hiatt, Susan M., Thibaud-Nissen, Francoise, Astashyn, Alexan-der, Ermolaeva, Olga, Farrell, Catherine M., Hart, Jennifer, Landrum, Melissa J., McGarvey,Kelly M., Murphy, Michael R., O’Leary, Nuala A., Pujar, Shashikant, Rajput, Bhanu, Rang-wala, Sanjida H., Riddick, Lillian D., Shkeda, Andrei, Sun, Hanzhen, Tamez, Pamela, Tully,Raymond E., Wallin, Craig, Webb, David, Weber, Janet, Wu, Wendy, Dicuccio, Michael, Kitts,Paul, Maglott, Donna R., Murphy, Terence D., & Ostell, James M. 2014. RefSeq: An update onmammalian reference sequences. Nucleic Acids Research, 42(D1).

111
R Core Team. 2018. R: A Language and Environment for Statistical Computing. R Foundationfor Statistical Computing, Vienna, Austria.
Ray, Riju, Tyndale, Rachel F., & Lerman, Caryn. 2009. Nicotine dependence pharmacogenetics:Role of genetic variation in nicotine-metabolizing enzymes. Journal of Neurogenetics, 23(3),252–261.
Reades, Jonathan, Calabrese, Francesco, & Ratti, Carlo. 2009. Eigenplaces: analysing cities usingthe space time structure of the mobile phone network. Environment and Planning B: Planningand Design, 36(5), 824–836.
Rhea, Sally-Ann, Gross, Andy A., Haberstick, Brett C., & Corley, Robin P. 2006. Colorado TwinRegistry. Twin Research and Human Genetics, 9(6), 941–949.
Rhea, Sally-Ann, Gross, Andy A., Haberstick, Brett C., & Corley, Robin P. 2013. Colorado TwinRegistry: An Update. Twin Research and Human Genetics, 16(01), 351–357.
Robinson, David. 2018. broom: Convert Statistical Analysis Objects into Tidy Data Frames. Rpackage version 0.4.4.
Ryan, Siobhan M, Jorm, Anthony F, & Lubman, Dan I. 2010. Parenting factors associated withreduced adolescent alcohol use: a systematic review of longitudinal studies. The Australian andNew Zealand Journal of Psychiatry, 44(9), 774–83.
Saccone, Nancy L., Wang, Jen C., Breslau, Naomi, Johnson, Eric O., Hatsukami, Dorothy, Sac-cone, Scott F., Grucza, Richard A., Sun, Lingwei, Duan, Weimin, Budde, John, Culverhouse,Robert C., Fox, Louis, Hinrichs, Anthony L., Steinbach, Joseph Henry, Wu, Meng, Rice, John P.,Goate, Alison M., & Bierut, Laura J. 2009. The CHRNA5-CHRNA3-CHRNB4 nicotinic receptorsubunit gene cluster affects risk for nicotine dependence in African-Americans and in European-Americans. Cancer Research, 69(17), 6848–6856.
Saccone, Nancy L., Culverhouse, Robert C., Schwantes-An, Tae Hwi, Cannon, Dale S., Chen, Xi-angning, Cichon, Sven, Giegling, Ina, Han, Shizhong, Han, Younghun, Keskitalo-Vuokko, Kaisu,Kong, Xiangyang, Landi, Maria Teresa, Ma, Jennie Z., Short, Susan E., Stephens, Sarah H.,Stevens, Victoria L., Sun, Lingwei, Wang, Yufei, Wenzlaff, Angela S., Aggen, Steven H., Breslau,Naomi, Broderick, Peter, Chatterjee, Nilanjan, Chen, Jingchun, Heath, Andrew C., Heliovaara,Markku, Hoft, Nicole R., Hunter, David J., Jensen, Majken K., Martin, Nicholas G., Montgomery,Grant W., Niu, Tianhua, Payne, Thomas J., Peltonen, Leena, Pergadia, Michele L., Rice, John P.,Sherva, Richard, Spitz, Margaret R., Sun, Juzhong, Wang, Jen C., Weiss, Robert B., Wheeler,William, Witt, Stephanie H., Yang, Bao Zhu, Caporaso, Neil E., Ehringer, Marissa A., Eisen,Tim, Gapstur, Susan M., Gelernter, Joel, Houlston, Richard, Kaprio, Jaakko, Kendler, Ken-neth S., Kraft, Peter, Leppert, Mark F., Li, Ming D., Madden, Pamela A F, Nothen, Markus M.,Pillai, Sreekumar, Rietschel, Marcella, Rujescu, Dan, Schwartz, Ann, Amos, Christopher I., &Bierut, Laura J. 2010. Multiple independent loci at chromosome 15q25.1 affect smoking quantity:A meta-analysis and comparison with lung cancer and COPD. PLoS Genetics, 6(8).
Saccone, Nancy L., Emery, Leslie S., Sofer, Tamar, Gogarten, Stephanie M., Becker, Diane M., Bot-tinger, Erwin P., Chen, Li-Shiun, Culverhouse, Robert C., Duan, Weimin, Hancock, Dana B.,Hosgood, H. Dean, Johnson, Eric O., Loos, Ruth J F, Louie, Tin, Papanicolaou, George, Per-reira, Krista M., Rodriquez, Erik J., Schurmann, Claudia, Stilp, Adrienne M., Szpiro, Adam A.,Talavera, Gregory A., Taylor, Kent D., Thrasher, James F., Yanek, Lisa R., Laurie, Cathy C.,

112
Perez-Stable, Eliseo J., Bierut, Laura J., & Kaplan, Robert C. 2018. Genome-Wide Associa-tion Study of Heavy Smoking and Daily/Nondaily Smoking in the Hispanic Community HealthStudy/Study of Latinos (HCHS/SOL). Nicotine & Tobacco Research, 20(4), 448–457.
Sachidanandam, Ravi, Weissman, David, Schmidt, Steven C., Kakol, Jerzy M., Stein, Lincoln D.,Marth, Gabor, Sherry, Steve, Mullikin, James C., Mortimore, Beverley J., Willey, David L., Hunt,Sarah E., Cole, Charlotte G., Coggill, Penny C., Rice, Catherine M., Ning, Zemin, Rogers, Jane,Bentley, David R., Kwok, Pui Yan, Mardis, Elaine R., Yeh, Raymond T., Schultz, Brian, Cook,Lisa, Davenport, Ruth, Dante, Michael, Fulton, Lucinda, Hillier, Ladeana, Waterston, Robert H.,McPherson, John D., Gilman, Brian, Schaffner, Stephen, Van Etten, William J., Reich, David,Higgins, John, Daly, Mark J., Blumenstiel, Brendan, Baldwin, Jennifer, Stange-Thomann, Nicole,Zody, Michael C., Linton, Lauren, Lander, Eric S., & Altshuler, David. 2001. A map of humangenome sequence variation containing 1.42 million single nucleotide polymorphisms. Nature,409(6822), 928–933.
Sandra, Kuntsche, & Emmanuel, Kuntsche. 2016. Parent-based interventions for preventing orreducing adolescent substance use A systematic literature review. Clinical Psychology Review,45, 89–101.
Sanger, F., Nicklen, S., & Coulson, A. R. 1977. DNA sequencing with chain-terminating inhibitors.Proceedings of the National Academy of Sciences, 74(12), 5463–5467.
Sarason, Irwin G., Sarason, Barbara R., Shearin, Edward N., & Pierce, Gregory R. 1987. ABrief Measure of Social Support: Practical and Theoretical Implications. Journal of Social andPersonal Relationships, 4(4), 497–510.
Schumann, Gunter, Coin, L. J., Lourdusamy, A., Charoen, P., Berger, K. H., Stacey, D., Desrivieres,S., Aliev, F. A., Khan, A. A., Amin, Najaf, Aulchenko, Y. S., Bakalkin, Georgy, Bakker, S. J.,Balkau, B., Beulens, J. W., Bilbao, A., de Boer, R. A., Beury, D., Bots, M. L., Breetvelt,E. J., Cauchi, Stephane, Cavalcanti-Proenca, C., Chambers, J. C., Clarke, T.-K., Dahmen, N.,de Geus, E. J., Dick, D., Ducci, F., Easton, A., Edenberg, H. J., Esko, Tonu, Fernandez-Medarde,A., Foroud, T., Freimer, N. B., Girault, J.-A., Grobbee, D. E., Guarrera, S., Gudbjartsson,D. F., Hartikainen, A.-L., Heath, Andrew C., Hesselbrock, V., Hofman, Albert, Hottenga, J.-J.,Isohanni, M. K., Kaprio, Jaakko, Khaw, K.-T., Kuehnel, B., Laitinen, Jaana, Lobbens, S., Luan,Jian’an, Mangino, Massimo, Maroteaux, M., Matullo, G., McCarthy, M. I., Mueller, C., Navis,G., Numans, M. E., Nunez, A., Nyholt, D. R., Onland-Moret, C. N., Oostra, B. A., O’Reilly,P. F., Palkovits, M., Penninx, B. W., Polidoro, S., Pouta, A., Prokopenko, I., Ricceri, F., Santos,E., Smit, J. H., Soranzo, N., Song, K., Sovio, U., Stumvoll, M., Surakk, I., Thorgeirsson, T. E.,Thorsteinsdottir, U., Troakes, C., Tyrfingsson, T., Tonjes, A., Uiterwaal, C. S., Uitterlinden,Andre G, van der Harst, Pim, van der Schouw, Y. T., Staehlin, O., Vogelzangs, N., Vollenweider,Peter, Waeber, G., Wareham, Nicholas J, Waterworth, D. M., Whitfield, John B., Wichmann,E. H., Willemsen, G., Witteman, J. C., Yuan, X., Zhai, G., Zhao, Jing Hua, Zhang, Weihua,Martin, N. G., Metspalu, A., Doering, A., Scott, J., Spector, Tim D, Loos, R. J., Boomsma,Dorret I, Mooser, V., Peltonen, L., Stefansson, K., van Duijn, Cornelia M., Vineis, P., Sommer,W. H., Kooner, Jaspal S, Spanagel, R., Heberlein, U. A., Jarvelin, M.-R., & Elliott, Paul. 2011.Genome-wide association and genetic functional studies identify autism susceptibility candidate2 gene (AUTS2) in the regulation of alcohol consumption. Proceedings of the National Academyof Sciences, 108(17), 7119–7124.

113
Schumann, Gunter, Liu, Chunyu, O’Reilly, Paul, Gao, He, Song, Parkyong, Xu, Bing, Ruggeri,Barbara, Amin, Najaf, Jia, Tianye, Preis, Sarah, Segura Lepe, Marcelo, Akira, Shizuo, Barbieri,Caterina, Baumeister, Sebastian, Cauchi, Stephane, Clarke, Toni-Kim, Enroth, Stefan, Fischer,Krista, Hallfors, Jenni, Harris, Sarah E, Hieber, Saskia, Hofer, Edith, Hottenga, Jouke-Jan, Jo-hansson, Asa, Joshi, Peter K, Kaartinen, Niina, Laitinen, Jaana, Lemaitre, Rozenn, Loukola,Anu, Luan, Jian’an, Lyytikainen, Leo-Pekka, Mangino, Massimo, Manichaikul, Ani, Mbarek,Hamdi, Milaneschi, Yuri, Moayyeri, Alireza, Mukamal, Kenneth, Nelson, Christopher, Nettle-ton, Jennifer, Partinen, Eemil, Rawal, Rajesh, Robino, Antonietta, Rose, Lynda, Sala, Cinzia,Satoh, Takashi, Schmidt, Reinhold, Schraut, Katharina, Scott, Robert, Smith, Albert Vernon,Starr, John M, Teumer, Alexander, Trompet, Stella, Uitterlinden, Andre G, Venturini, Cristina,Vergnaud, Anne-Claire, Verweij, Niek, Vitart, Veronique, Vuckovic, Dragana, Wedenoja, Juho,Yengo, Loic, Yu, Bing, Zhang, Weihua, Zhao, Jing Hua, Boomsma, Dorret I, Chambers, John,Chasman, Daniel I, Daniela, Toniolo, de Geus, Eco, Deary, Ian, Eriksson, Johan G, Esko, Tonu,Eulenburg, Volker, Franco, Oscar H, Froguel, Philippe, Gieger, Christian, Grabe, Hans J, Gudna-son, Vilmundur, Gyllensten, Ulf, Harris, Tamara B, Hartikainen, Anna-Liisa, Heath, Andrew C,Hocking, Lynne, Hofman, Albert, Huth, Cornelia, Jarvelin, Marjo-Riitta, Jukema, J Wouter,Kaprio, Jaakko, Kooner, Jaspal S, Kutalik, Zoltan, Lahti, Jari, Langenberg, Claudia, Lehti-maki, Terho, Liu, Yongmei, Madden, Pamela A F, Martin, Nicholas, Morrison, Alanna, Penninx,Brenda, Pirastu, Nicola, Psaty, Bruce, Raitakari, Olli, Ridker, Paul, Rose, Richard, Rotter,Jerome I, Samani, Nilesh J, Schmidt, Helena, Spector, Tim D, Stott, David, Strachan, David,Tzoulaki, Ioanna, van der Harst, Pim, van Duijn, Cornelia M, Marques-Vidal, Pedro, Vollen-weider, Peter, Wareham, Nicholas J, Whitfield, John B, Wilson, James, Wolffenbuttel, Bruce,Bakalkin, Georgy, Evangelou, Evangelos, Liu, Yun, Rice, Kenneth M, Desrivieres, Sylvane,Kliewer, Steven A, Mangelsdorf, David J, Muller, Christian P, Levy, Daniel, & Elliott, Paul.2016. KLB is associated with alcohol drinking, and its gene product beta-Klotho is necessary forFGF21 regulation of alcohol preference. Proceedings of the National Academy of Sciences of theUnited States of America, 113(50), 14372–14377.
Sekar, Aswin, Bialas, Allison R., de Rivera, Heather, Davis, Avery, Hammond, Timothy R., Kami-taki, Nolan, Tooley, Katherine, Presumey, Jessy, Baum, Matthew, Van Doren, Vanessa, Gen-ovese, Giulio, Rose, Samuel A., Handsaker, Robert E., Schizophrenia Working Group of thePsychiatric Genomics Consortium, Daly, Mark J., Carroll, Michael C., Stevens, Beth, & McCar-roll, Steven A. 2016. Schizophrenia risk from complex variation of complement component 4.Nature, 530(7589), 177–83.
Shaffer, D, Fisher, P, Lucas, C P, Dulcan, M K, & Schwab-Stone, M E. 2000. NIMH DiagnosticInterview Schedule for Children Version IV (NIMH DISC-IV): description, differences from pre-vious versions, and reliability of some common diagnoses. Journal of the American Academy ofChild and Adolescent Psychiatry, 39(1), 28–38.
Sherva, R, Wang, Q, Kranzler, H, & et Al. 2016. Genome-wide association study of cannabisdependence severity, novel risk variants, and shared genetic risks. JAMA Psychiatry, 73(5),472–480.
Sherva, Richard, Kranzler, Henry R., Yu, Yi, Logue, Mark W., Poling, James, Arias, Albert J.,Anton, Raymond F., Oslin, David, Farrer, Lindsay A., & Gelernter, Joel. 2010. Variation in nico-tinic acetylcholine receptor genes is associated with multiple substance dependence phenotypes.Neuropsychopharmacology, 35(9), 1921–1931.
114
Shiffman, Saul. 2009. How many cigarettes did you smoke? Assessing cigarette consumption byglobal report, time-line follow-back, and ecological momentary assessment. Health Psychology,28(5), 519–526.
Shiffman, Saul, Gwaltney, Chad J, Balabanis, Mark H, Liu, Kenneth S, Paty, Jean A, Kassel,Jon D, Hickcox, Mary, & Gnys, Maryann. 2002. Immediate antecedents of cigarette smoking:An analysis from ecological momentary assessment. Journal of Abnormal Psychology, 111(4),531–545.
Shiffman, Saul, Balabanis, Mark H., Gwaltney, Chad J., Paty, Jean A., Gnys, Maryann, Kassel,Jon D., Hickcox, Mary, & Paton, Stephanie M. 2007. Prediction of lapse from associationsbetween smoking and situational antecedents assessed by ecological momentary assessment. Drugand Alcohol Dependence, 91(2-3), 159–168.
Shiffman, Saul, Stone, Arthur A., & Hufford, Michael R. 2008. Ecological Momentary Assessment.Annual Review of Clinical Psychology, 4(1), 1–32.
Singh, Tushar, Arrazola, Rene A, Corey, Catherine G, Husten, Corrine G, Neff, Linda J, Homa,David M, & King, Brian A. 2016. Tobacco Use Among Middle and High School Students - UnitedStates, 2011-2015. MMWR, 65(14), 361–367.
Slatkin, Montgomery. 2008. Linkage disequilibrium understanding the evolutionary past andmapping the medical future. Nature Reviews Genetics, 9(6), 477–485.
Smith, Lloyd M, Sanders, Jane Z, Kaiser, Robert J, Hughes, Peter, Dodd, Chris, Connell, Charles R,Heiner, Cheryl, Kent, Stephen B H, & Hood, Leroy E. 1986. Fluorescence detection in automatedDNA sequence analysis. Nature, 321(jun), 674.
Song, C., Qu, Z., Blumm, N., & Barabasi, A.-L. 2010. Limits of Predictability in Human Mobility.Science, 327(5968), 1018–1021.
Stallings, Michael C., Gizer, Ian R., & Young-Wolff, Kelly C. 2014.Genetic Epidemiology and Molecular Genetics. Vol. 1. Oxford University Press.
Stattin, Hakan, & Kerr, Margaret. 2000. Parental Monitoring: A Reinterpretation. ChildDevelopment, 71(4), 1072–1085.
Stringer, S, Minic, C C, Verweij, K J H, Mbarek, H, Bernard, M, Derringer, J, van Eijk, K R, Isen,J D, Loukola, A, Maciejewski, D F, Mihailov, E, van der Most, P J, Sanchez-Mora, C, Roos,L, Sherva, R, Walters, R, Ware, J J, Abdellaoui, A, Bigdeli, T B, Branje, S J T, Brown, S A,Bruinenberg, M, Casas, M, Esko, T, Garcia-Martinez, I, Gordon, S D, Harris, J M, Hartman,C A, Henders, A K, Heath, A C, Hickie, I B, Hickman, M, Hopfer, C J, Hottenga, J J, Huizink,A C, Irons, D E, Kahn, R S, Korhonen, T, Kranzler, H R, Krauter, K, van Lier, P A C, Lubke,G H, Madden, P A F, Magi, R, McGue, M K, Medland, S E, Meeus, W H J, Miller, M B,Montgomery, G W, Nivard, M G, Nolte, I M, Oldehinkel, A J, Pausova, Z, Qaiser, B, Quaye,L, Ramos-Quiroga, J A, Richarte, V, Rose, R J, Shin, J, Stallings, M C, Stiby, A I, Wall, T L,Wright, M J, Koot, H M, Paus, T, Hewitt, J K, Ribases, M, Kaprio, J, Boks, M P, Snieder,H, Spector, T, Munafo, M R, Metspalu, A, Gelernter, J, Boomsma, D I, Iacono, W G, Martin,N G, Gillespie, N A, Derks, E M, & Vink, J M. 2016. Genome-wide association study of lifetimecannabis use based on a large meta-analytic sample of 32 330 subjects from the InternationalCannabis Consortium. Translational Psychiatry, 6(3).

115
Sullivan, Patrick F. 2007. Spurious Genetic Associations. Biological Psychiatry, 61(10), 1121–1126.
Sullivan, Patrick F, & Kendler, Kenneth S. 1999. The genetic epidemiology of smoking. Nicotine& Tobacco Research, 1(785022308), 51–57.
Sveinbjornsson, Gardar, Albrechtsen, Anders, Zink, Florian, Gudjonsson, Sigurjon A., Oddson, As-mundur, Masson, Gısli, Holm, Hilma, Kong, Augustine, Thorsteinsdottir, Unnur, Sulem, Patrick,Gudbjartsson, Daniel F., & Stefansson, Kari. 2016. Weighting sequence variants based on theirannotation increases power of whole-genome association studies. Nature Genetics, 48(3), 314–317.
Swan, Gary E., Carmelli, Dorit, Rosenman, Ray H., Fabsitz, Richard R., & Christian, Joe C.1990. Smoking and alcohol consumption in adult male twins: Genetic heritability and sharedenvironmental influences. Journal of Substance Abuse, 2(1), 39–50.
Tabor, Holly K., Risch, Neil J., & Myers, Richard M. 2002. Candidate-gene approaches for studyingcomplex genetic traits: Practical considerations. Nature Reviews Genetics, 3(5), 391–397.
Tejada-Vera, Betzaida. 2017. Age-Adjusted Death Rates Attributable to Alcohol-Induced Causes,by Race/Ethnicity – United States, 1999-2015. MMWR, 66(18), 491.
Thorgeirsson, T E, Steinberg, S, Reginsson, G W, Bjornsdottir, G, Rafnar, T, Jonsdottir, I, Hel-gadottir, A, Gretarsdottir, S, Helgadottir, H, Jonsson, S, Matthiasson, S E, Gislason, T, Tyrf-ingsson, T, Gudbjartsson, T, Isaksson, H J, Hardardottir, H, Sigvaldason, A, Kiemeney, L A,Haugen, A, Zienolddiny, S, Wolf, H J, Franklin, W A, Panadero, A, Mayordomo, J I, Hall,I P, Ronmark, E, Lundback, B, Dirksen, A, Ashraf, H, Pedersen, J H, Masson, G, Sulem, P,Thorsteinsdottir, U, Gudbjartsson, D F, & Stefansson, K. 2016. A rare missense mutation inCHRNA4 associates with smoking behavior and its consequences. Molecular Psychiatry, 21(5),594–600.
Thorgeirsson, Thorgeir E., Geller, Frank, Sulem, Patrick, Rafnar, Thorunn, Wiste, Anna, Mag-nusson, Kristinn P., Manolescu, Andrei, Thorleifsson, Gudmar, Stefansson, Hreinn, Ingason,Andres, Stacey, Simon N., Bergthorsson, Jon T., Thorlacius, Steinunn, Gudmundsson, Julius,Jonsson, Thorlakur, Jakobsdottir, Margret, Saemundsdottir, Jona, Olafsdottir, Olof, Gudmunds-son, Larus J., Bjornsdottir, Gyda, Kristjansson, Kristleifur, Skuladottir, Halla, Isaksson, Helgi J.,Gudbjartsson, Tomas, Jones, Gregory T., Mueller, Thomas, Gottsater, Anders, Flex, Andrea,Aben, Katja K. H., de Vegt, Femmie, Mulders, Peter F. A., Isla, Dolores, Vidal, Maria J.,Asin, Laura, Saez, Berta, Murillo, Laura, Blondal, Thorsteinn, Kolbeinsson, Halldor, Stefans-son, Jon G., Hansdottir, Ingunn, Runarsdottir, Valgerdur, Pola, Roberto, Lindblad, Bengt, vanRij, Andre M., Dieplinger, Benjamin, Haltmayer, Meinhard, Mayordomo, Jose I., Kiemeney,Lambertus A., Matthiasson, Stefan E., Oskarsson, Hogni, Tyrfingsson, Thorarinn, Gudbjarts-son, Daniel F., Gulcher, Jeffrey R., Jonsson, Steinn, Thorsteinsdottir, Unnur, Kong, Augustine,& Stefansson, Kari. 2008. A variant associated with nicotine dependence, lung cancer and pe-ripheral arterial disease. Nature, 452(7187), 638–642.
Thorgeirsson, Thorgeir E., Gudbjartsson, Daniel F., Surakka, Ida, Vink, Jacqueline M., Amin, Na-jaf, Geller, Frank, Sulem, Patrick, Rafnar, Thorunn, Esko, Tonu, Walter, Stefan, Gieger, Chris-tian, Rawal, Rajesh, Mangino, Massimo, Prokopenko, Inga, Magi, Reedik, Keskitalo, Kaisu, Gud-jonsdottir, Iris H., Gretarsdottir, Solveig, Stefansson, Hreinn, Thompson, John R., Aulchenko,Yurii S., Nelis, Mari, Aben, Katja K., den Heijer, Martin, Dirksen, Asger, Ashraf, Haseem, So-ranzo, Nicole, Valdes, Ana M., Steves, Claire, Uitterlinden, Andre G., Hofman, Albert, Tonjes,

116
Anke, Kovacs, Peter, Hottenga, Jouke Jan, Willemsen, Gonneke, Vogelzangs, Nicole, Doring, An-gela, Dahmen, Norbert, Nitz, Barbara, Pergadia, Michele L., Saez, Berta, De Diego, Veronica,Lezcano, Victoria, Garcia-Prats, Maria D., Ripatti, Samuli, Perola, Markus, Kettunen, Johannes,Hartikainen, Anna-Liisa, Pouta, Anneli, Laitinen, Jaana, Isohanni, Matti, Huei-Yi, Shen, Allen,Maxine, Krestyaninova, Maria, Hall, Alistair S., Jones, Gregory T., van Rij, Andre M, Mueller,Thomas, Dieplinger, Benjamin, Haltmayer, Meinhard, Jonsson, Steinn, Matthiasson, Stefan E.,Oskarsson, Hogni, Tyrfingsson, Thorarinn, Kiemeney, Lambertus A., Mayordomo, Jose I., Lind-holt, Jes S., Pedersen, Jesper Holst, Franklin, Wilbur A., Wolf, Holly, Montgomery, Grant W.,Heath, Andrew C., Martin, Nicholas G., Madden, Pamela A F, Giegling, Ina, Rujescu, Dan,Jarvelin, Marjo-Riitta, Salomaa, Veikko, Stumvoll, Michael, Spector, Tim D., Wichmann, H-Erich, Metspalu, Andres, Samani, Nilesh J., Penninx, Brenda W., Oostra, Ben A., Boomsma,Dorret I., Tiemeier, Henning, van Duijn, Cornelia M, Kaprio, Jaakko, Gulcher, Jeffrey R., Mc-Carthy, Mark I., Peltonen, Leena, Thorsteinsdottir, Unnur, & Stefansson, Kari. 2010. Sequencevariants at CHRNB3CHRNA6 and CYP2A6 affect smoking behavior. Nature Genetics, 42(5),448–453.
Tolentino, Jia. 2018. The Promise of Vaping and the Rise of Juul. The New Yorker, may.
Tyndale, Rachel F., & Sellers, Edward M. 2001. Variable CYP2A6-mediated nicotine metabolismalters smoking behavior and risk. Drug Metabolism and Disposition, 29(4), 548–552.
United States Census Bureau. 2016a. Table DP05: ACS Demographic and Housing Estimates.
United States Census Bureau. 2016b. Table S1501: Educational Attainment.
United States Census Bureau. 2016c. Table S1901: Median Household Income.
University of Colorado Anschutz Community Epidemiology and Program Evaluation Group. 2015.Healthy Kids Colorado Survey. Tech. rept.
van Dijk, Erwin L., Auger, Helene, Jaszczyszyn, Yan, & Thermes, Claude. 2014. Ten years ofnext-generation sequencing technology. Trends in Genetics, 30(9), 418–426.
Verweij, Karin J.H., Vinkhuyzen, Anna A.E., Benyamin, Beben, Lynskey, Michael T., Quaye,Lydia, Agrawal, Arpana, Gordon, Scott D., Montgomery, Grant W., Madden, Pamela A.F.,Heath, Andrew C., Spector, Timothy D., Martin, Nicholas G., & Medland, Sarah E. 2013. Thegenetic aetiology of cannabis use initiation: A meta-analysis of genome-wide association studiesand a SNP-based heritability estimation. Addiction Biology, 18(5), 846–850.
Vink, Jacqueline M., Willemsen, Gonneke, & Boomsma, Dorret I. 2005. Heritability of smokinginitiation and nicotine dependence. Behavior Genetics, 35(4), 397–406.
Vrieze, Scott I., Hicks, Brian M., Iacono, William G., & McGue, Matt. 2012. Decline in geneticinfluence on the co-occurrence of alcohol, marijuana, and nicotine dependence symptoms fromage 14 to 29. American Journal of Psychiatry, 169(10), 1073–1081.
Vrieze, Scott I., McGue, Matt, Miller, Michael B., Hicks, Brian M., & Iacono, William G. 2013.Three mutually informative ways to understand the genetic relationships among behavioral disin-hibition, alcohol use, drug use, nicotine use/dependence, and their co-occurrence: Twin biometry,GCTA, and genome-wide scoring. Behavior Genetics, 43(2), 97–107.

117
Vrieze, Scott I., Malone, Stephen M., Pankratz, Nathan, Vaidyanathan, Uma, Miller, Michael B.,Kang, Hyun Min, McGue, Matt, Abecasis, Goncalo, & Iacono, William G. 2014a. Ge-netic associations of nonsynonymous exonic variants with psychophysiological endophenotypes.Psychophysiology, 51(12), 1300–8.
Vrieze, Scott I, Malone, Stephen M, Vaidyanathan, Uma, Kwong, Alan, Kang, Hyun Min, Zhan,Xiaowei, Flickinger, Matthew, Irons, Daniel, Jun, Goo, Locke, Adam E, Pistis, Giorgio, Porcu,Eleonora, Levy, Shawn, Myers, Richard M, Oetting, William, McGue, Matt, Abecasis, Goncalo,& Iacono, William G. 2014b. In search of rare variants: Preliminary results from whole genomesequencing of 1,325 individuals with psychophysiological endophenotypes. Psychophysiology,51(12), 1309–1320.
Vrieze, Scott I., Feng, Shuang, Miller, Michael B., Hicks, Brian M., Pankratz, Nathan, Abecasis,Goncalo R., Iacono, William G., & McGue, Matt. 2014c. Rare Nonsynonymous Exonic Variantsin Addiction and Behavioral Disinhibition. Biological Psychiatry, 75(10), 783–789.
Wain, Louise V, Shrine, Nick, Miller, Suzanne, Jackson, Victoria E, Ntalla, Ioanna, Artigas,Marıa Soler, Billington, Charlotte K, Kheirallah, Abdul Kader, Allen, Richard, Cook, James P,Probert, Kelly, Obeidat, Ma’en, Bosse, Yohan, Hao, Ke, Postma, Dirkje S, Pare, Peter D, Ra-masamy, Adaikalavan, Magi, Reedik, Mihailov, Evelin, Reinmaa, Eva, Melen, Erik, O’Connell,Jared, Frangou, Eleni, Delaneau, Olivier, Freeman, Colin, Petkova, Desislava, McCarthy, Mark,Sayers, Ian, Deloukas, Panos, Hubbard, Richard, Pavord, Ian, Hansell, Anna L, Thomson, Neil C,Zeggini, Eleftheria, Morris, Andrew P, Marchini, Jonathan, Strachan, David P, Tobin, Martin D,& Hall, Ian P. 2015. Novel insights into the genetics of smoking behaviour, lung function, andchronic obstructive pulmonary disease (UK BiLEVE): a genetic association study in UK Biobank.The Lancet Respiratory Medicine, 3(10), 769–781.
Wall, Jeffrey D., & Pritchard, Jonathan K. 2003. Haplotype blocks and linkage disequilibrium inthe human genome. Nature Reviews Genetics, 4(8), 587–597.
Wang, Dashun, Pedreschi, Dino, Song, Chaoming, Giannotti, Fosca, & Barabasi, Albert-Laszlo.2011. Human mobility, social ties, and link prediction. Page 1100 of: Proceedings of the 17thACM SIGKDD International Conference on Knowledge Discovery and Data Mining - KDD ’11.New York, New York, USA: ACM Press.
Way, Michael, McQuillin, Andrew, Saini, Jit, Ruparelia, Kush, Lydall, Gregory J., Guerrini, Irene,Ball, David, Smith, Iain, Quadri, Giorgia, Thomson, Allan D., Kasiakogia-Worlley, Katherine,Cherian, Raquin, Gunwardena, Priyanthi, Rao, Harish, Kottalgi, Girija, Patel, Shamir, Hill-man, Audrey, Douglas, Ewen, Qureshi, Sherhzad Y., Reynolds, Gerry, Jauhar, Sameer, O’Kane,Aideen, Dedman, Alex, Sharp, Sally, Kandaswamy, Radhika, Dar, Karim, Curtis, David, Mor-gan, Marsha Y., & Gurling, Hugh M D. 2015. Genetic variants in or near ADH1B and ADH1Caffect susceptibility to alcohol dependence in a British and Irish population. Addiction Biology,20(3), 594–604.
Wechsler, David. 2011. Wechsler Abbreviated Scale of Intelligence - Second Edition (WASI-II).Pearson.
Weiss, F, Lorang, M T, Bloom, F E, & Koob, G F. 1993. Oral alcohol self-administration stimulatesdopamine release in the rat nucleus accumbens: genetic and motivational determinants. Journalof Pharmacology and Experimental Therapeutics, 267(1), 250 LP – 258.

118
Wessel, Jennifer, McDonald, Sarah M, Hinds, David a, Stokowski, Renee P, Javitz, Harold S, Ken-nemer, Michael, Krasnow, Ruth, Dirks, William, Hardin, Jill, Pitts, Steven J, Michel, Martha,Jack, Lisa, Ballinger, Dennis G, McClure, Jennifer B, Swan, Gary E, & Bergen, Andrew W.2010. Resequencing of Nicotinic Acetylcholine Receptor Genes and Association of Common andRare Variants with the Fagerstrom Test for Nicotine Dependence. Neuropsychopharmacology,35(12), 2392–2402.
Wetterstrand, KA. 2018. DNA Sequencing Costs: Data from the NHGRI GSP.
Wickham, Hadley. 2009. ggplot2: Elegant Graphics for Data Analysis. New York: Springer-Verlag.
Wickham, Hadley, & Henry, Lionel. 2018. tidyr: Easily Tidy Data with ’spread()’ and ’gather()’Functions. R package version 0.8.0.
Wood, Simon, & Scheipl, Fabian. 2017. gamm4: Generalized Additive Mixed Models using ’mgcv’and ’lme4’. R package version 0.2-5.
Wood, Simon N. 2017. Generalized Additive Models: An Introduction with R. Second edn. Chap-man and Hall/CRC.
Wray, Naomi R. 2005. Allele Frequencies and the r2 Measure of Linkage Disequilibrium: Impact onDesign and Interpretation of Association Studies. Twin Research and Human Genetics, 8(02),87–94.
Wray, Naomi R., & Gratten, Jacob. 2018. Sizing up whole-genome sequencing studies of commondiseases. Nature Genetics, 1.
Wu, Michael C., Lee, Seunggeun, Cai, Tianxi, Li, Yun, Boehnke, Michael, & Lin, Xihong. 2011.Rare-variant association testing for sequencing data with the sequence kernel association test.American Journal of Human Genetics, 89(1), 82–93.
Xie, Pingxing, Kranzler, Henry R., Krauthammer, Michael, Cosgrove, Kelly P., Oslin, David,Anton, Raymond F., Farrer, Lindsay A., Picciotto, Marina R., Krystal, John H., Zhao, Hongyu, &Gelernter, Joel. 2011. Rare Nonsynonymous Variants in Alpha-4 Nicotinic Acetylcholine ReceptorGene Protect Against Nicotine Dependence. Biological Psychiatry, 70(6), 528–536.
Xiong, Wei, Cheng, Kejun, Cui, Tanxing, Godlewski, Grzegorz, Rice, Kenner C., Xu, Yan, &Zhang, Li. 2011. Cannabinoid potentiation of glycine receptors contributes to cannabis-inducedanalgesia. Nature Chemical Biology, 7(5), 296–303.
Yang, J, Wang, S, Yang, Z, Hodgkinson, C A, Iarikova, P, Ma, J Z, Payne, T J, Goldman, D,& Li, M D. 2015. The contribution of rare and common variants in 30 genes to risk nicotinedependence. Molecular Psychiatry, 20(11), 1467–1478.
Yang, Jian, Benyamin, Beben, McEvoy, Brian P, Gordon, Scott, Henders, Anjali K, Nyholt, Dale R,Madden, Pamela A, Heath, Andrew C, Martin, Nicholas G, Montgomery, Grant W, Goddard,Michael E, & Visscher, Peter M. 2010. Common SNPs explain a large proportion of the heri-tability for human height. Nature Genetics, 42(7), 565–569.
Yates, William R., Cadoret, Remi J., Troughton, Ed, & Stewart, Mark A. 1996. An adoption studyof DSM-IIIR alcohol and drug dependence severity. Drug and Alcohol Dependence, 41(1), 9–15.

119
Yoshimura, Masami, & Tabakoff, Boris. 1995. Selective Effects of Ethanol on the Generationof cAMP by Particular Members of the Adenylyl Cyclase Family. Alcoholism: Clinical andExperimental Research, 19(6), 1435–1440.
Young, S. E., Corley, R. P., Stallings, M. C., Rhee, S. H., Crowley, T. J., & Hewitt, J. K. 2002. Sub-stance use, abuse and dependence in adolescence: Prevalence, symptom profiles and correlates.Drug and Alcohol Dependence, 68(3), 309–322.
Young, Susan E., Rhee, Soo Hyun, Stallings, Michael C., Corley, Robin P., & Hewitt, John K. 2006.Genetic and environmental vulnerabilities underlying adolescent substance use and problem use:General or specific? Behavior Genetics, 36(4), 603–615.
Ystrom, Eivind, Kendler, Kenneth S., & Reichborn-Kjennerud, Ted. 2014. Early age of alcoholinitiation is not the cause of alcohol use disorders in adulthood, but is a major indicator of geneticrisk. A population-based twin study. Addiction, 109(11), 1824–1832.
Yuan, Menglu, Cross, Sarah J., Loughlin, Sandra E., & Leslie, Frances M. 2015. Nicotine and theadolescent brain. Journal of Physiology, 593(16), 3397–3412.
Zhan, Xiaowei, & Liu, Dajiang J. 2015. SEQMINER: An R-Package to Facilitate the FunctionalInterpretation of Sequence-Based Associations. Genetic Epidemiology, 39(8), 619–623.
Zhan, Xiaowei, Hu, Youna, Li, Bingshan, Abecasis, Goncalo R., & Liu, Dajiang J. 2016. RVTESTS:an efficient and comprehensive tool for rare variant association analysis using sequence data:Table 1. Bioinformatics, 32(9), 1423–1426.
Zhou, Xiang. 2017. A unified framework for variance component estimation with summary statisticsin genome-wide association studies. Annals of Applied Statistics, 11(4), 2027–2051.
Zuo, Lingjun, Zhang, Xiangyang, Deng, Hong-wen, & Luo, Xingguang. 2013a. Association ofrare PTP4A1-PHF3-EYS variants with alcohol dependence. Journal of Human Genetics, 58(3),178–179.
Zuo, Lingjun, Wang, Ke-Sheng, Zhang, Xiang-Yang, Li, Chiang-shan R, Zhang, Fengyu, Wang,Xiaoping, Chen, Wenan, Gao, Guimin, Zhang, Heping, Krystal, John H, & Luo, Xingguang.2013b. Rare SERINC2 variants are specific for alcohol dependence in individuals of Europeandescent. Pharmacogenetics and Genomics, 23(8), 395–402.
Zuo, Lingjun, Tan, Yunlong, Li, Chiang-Shan R., Wang, Zhiren, Wang, Kesheng, Zhang, Xi-angyang, Lin, Xiandong, Chen, Xiangning, Zhong, Chunlong, Wang, Xiaoping, Wang, Jijun, Lu,Lu, & Luo, Xingguang. 2016. Associations of rare nicotinic cholinergic receptor gene variants tonicotine and alcohol dependence. American Journal of Medical Genetics Part B: NeuropsychiatricGenetics, 171(8), 1057–1071.

Appendix A
Methods for estimating heritability and genetic correlation in meta-analyses of
rare variant association studies
This appendix describes the novel methods of calculating heritability and genetic correlation
for rare variants developed by Dr. Dajiang Liu and used in the analyses described in Chapter 2.
We extended existing methods in order to be able to unbiasedly estimate the contribution of
rare variants in various functional categories to the heritability. The method differs from existing
methods, such as LD score regression (Bulik-Sullivan et al., 2015b) and MINQUE (Zhou, 2017), in
several notable ways:
(1) We computed covariate adjusted LD-scores using partial correlation, based upon the RVTESTS
or RAREMETALWORKER summary statistics provided for each study in the meta-analysis.
These summary statistics contain information on the partialed covariances between score
statistics, adjusted for the influence of covariates. We expected that the partial covariance
and genotype covariance (i.e., LD) to differ when the genotypes were correlated with the
adjusted covariates, e.g. principal components or heritable covariates. Moreover, as the
meta-analysis datasets are often much larger than currently available reference panels, we
are able to accurately calculate the LD scores for rare/lower frequency variants.
(2) As we do not typically have individual level data in meta-analysis, we quantified uncer-
tainty of the partial-correlation-based LD scores using a bootstrap procedure that resamples
contributing studies in the meta-analysis.
In our study, we collected single variant score statistics, as well as their covariance matri-

121
ces within sliding windows of 1 million basepairs (Liu et al., 2014). Specifically, for continuous
outcomes, the association analysis was performed using a linear model
Y = Gβ + Zγ + ε (A.1)
Without loss of generality, we assume that the genotypes are standardized, so that E(G) = 0 and
var(G) = 1. G can be the genotype vector for a single variant or the genotype matrix for multiple
variants. The score statistics take the form of
UG =1
σ2G′(Y − Zγ). (A.2)
We denote the variance-covariance matrix for score statistics as VG, which can be calculated by
VG =1
σ2[G′G−G′Z(Z ′Z)−1Z ′G]. (A.3)
The marginal association statistic equals:
T =U2G
VG(A.4)
which follows a chi-square distribution with 1 degree of freedom.
To estimate heritability, the following model is used,
Y = Zγ +∑l
gl + e, (A.5)
where gl is the random effects for variants in functional class l. The random effects follow gl ∼
MVN(0, h2l /MlKl) and e ∼ MVN(0, σ2I), where Kl is the kinship matrix estimated by variants in
function class l, i.e., Kl = GlG′l.
To estimate the variance components, we consider the following quadratic function that
calculates the second moment for the phenotype.
E(U2G) = E(G′(I − Z(Z ′Z)−1Z ′)Y Y ′(I − Z(Z ′Z)−1Z ′)G) (A.6)
We noted that
E(Y Y ′) = Zγγ′Z ′ +∑l
h2l
MlKl + σ2
eI, (A.7)

122
so
E(U2G) =
∑l
h2l
MlG(I − Z(Z ′Z)−1Z ′)Kl(I − Z(Z ′Z)−1Z ′)G′ +G′(I − Z(Z ′Z)−1Z ′)Gσ2
e . (A.8)
As Kl = 1NGlG
′l, we have
G′(I − Z(Z ′Z)−1Z ′)Kl(I − Z(Z ′Z)−1Z ′)G =1
N2VGGl
V ′GGl(A.9)
with
VGGl= G′(I − Z(Z ′Z)−1Z ′)Gl. (A.10)
It is easy to verify that VGGlcan be calculated from shared summary statistics VG. We denote the
standardized covariance matrices as RGGl= 1
N VGGl, which we call partial-correlation-based LD
scores.
It is necessary to quantify the uncertainty of the estimated LD scores, especially for rare vari-
ants. Given that there is no individual level data in genetic meta-analysis, the originally proposed
jackknife method by leaving one individual out does not work. Instead, we derived a formula for
bootstrap estimates for the variance of estimated partial correlation-based LD scores. As compared
to jackknife based method, the bootstrap gives more stable variance estimates, as each bootstrap
sample contains the same number of studies. We denote estimated variance-covariance matrix from
the bth bootstrap sample as R(b)GGl
, which is estimated by
R(b)GGl
=1
N (b)V(b)GGl
. (A.11)
The estimation error for the partial-correlation-based LD score can be estimated by
err2(RGGl) =
∑Bb=1N
(b)(R(b)GGl− RGGl
)2∑Bb=1N
(b)(A.12)
and
RGGl=
∑Bb=1N
(b)RbGGl∑B
b N(b)
. (A.13)
Due to the estimation variance in the partial-correlation-based LD scores, the estimates of
heritability can be downwardly biased. To correct for this, we multiply the weighted regression

123
estimates with the correction factor
cl =var(RGGl
) + err2(RGGl)
var(RGGl
(A.14)
where var(RGGl) is the sample variance of the estimated LD scores and err2(RGGl
) is the average
estimation error across all variant sites.
To estimate the heritability, we regress squared score statistics over the estimated partial
correlation based LD scores (Equation A.8). We use equal weight regression, which is equivalent to
Haseman-Elston regression. In simulations by us and others (Zhou, 2017), unweighted regression
gives more efficient heritability estimates for traits with low heritability, such as smoking and
drinking behavior, than weighted regression with LD score weights.

Appendix B
Phenotype extraction and genetic association in the UK Biobank
This appendix describes how the GSCAN Exome and GWAS phenotypes were extracted from
the UK Biobank and how GWAS of those phenotypes were performed.
B.1 GSCAN phenotype definitions
The GSCAN GWAS meta-analysis has seven standard phenotypes:
(1) Cigarettes per day (CPD)
• Average number of cigarettes smoked per day, either as a current smoker or former
smoker. Individuals who either never smoked, or on whom there is no available data
(e.g., someone was a former smoker but former smoking was never assessed) will be
set to missing.
• For studies that collect a quantitative measure of CPD, where the respondent is free
to provide any integer, we will bin responses as follows:
∗ 1 = 1-5
∗ 2 = 6-15
∗ 3 = 16-25
∗ 4 = 26-35
∗ 5 = 36+
For studies which have pre-defined bins, those will be preferred.

125
• Information about non-cigarette forms of tobacco use is not included.
(2) Smoking initiation (SI)
• This is a binary phenotype. Code “2” for anyone who reports having been a regular
smoker at some point in their lives. Code “1” for anyone who denies having been a
regular smoker at some point in their lives.
• Information about non-cigarette forms of tobacco use is not included.
• Example questions:
∗ Have you smoked over 100 cigarettes over the course of your life?
∗ Have you ever smoked every day for at least a month?
∗ Have you ever smoked regularly?
∗ Do you smoke?
(3) Smoking cessation (SC)
• This is a binary phenotype. Current smokers are coded as “2” and former smokers
are coded as “1”.
• Information about non-cigarette forms of tobacco use is not included.
• Former smokers should meet the criteria for having been a regular smoker.
(4) Age of initiation of smoking (AI)
• The age at which an individual first became a regular smoker.
• Information about non-cigarette forms of tobacco use is not included.
(5) Drinks per week in individuals who are active drinkers (DPW)
• The average number of standard drinks a subject reports drinking each week, aggre-
gated across all types of alcohol.
• If binned responses were recorded, use the midrange of each bin.

126
(6) Drinker versus non-drinker (DND)
• If a respondent reports drinking in the time-frame under study, they are coded as “2”.
If they deny drinking in that time-frame, they are coded as “1”.
(7) Binge drinking
• This variable has many definitions but is a measure of problem drinking, typically
defined as exceeding a certain number of drinks in a certain time period.
• Binge drinkers are coded as “2” and non-binge-drinkers are coded as “1”.
The GSCAN Exome meta-analysis has five standard phenotypes:
(1) Cigarettes per day (CPD)
• Average number of cigarettes smoked per day, either as a current smoker or former
smoker. Individuals who either never smoked, or on whom there is no available data
(e.g., someone was a former smoker but former smoking was never assessed) will be
set to missing.
• For studies that collect a quantitative measure of CPD, where the respondent is free
to provide any integer, we will bin responses as follows:
∗ 1 = 1-10
∗ 2 = 11-20
∗ 3 = 21-30
∗ 4 = 31+
• If the study collected different bins, those should be reported.
(2) Smoking initiation (SI)
• This is a binary phenotype. Code “2” for anyone who reports having been a regular
smoker at some point in their lives. Code “1” for anyone who denies having been a
regular smoker at some point in their lives.

127
• Information about non-cigarette forms of tobacco use is not included.
(3) Pack years (PY)
• Number of cigarettes per day, divided by twenty, and multiplied by the number of
years the person has smoked.
• This should be calculated with quantitative CPD, not binned. If only binned responses
are available, use the midpoint of the range for each bin.
(4) Age of initiation of smoking (AI)
• The age an individual first became a regular smoker.
• Remove obvious outliers.
• Information about non-cigarette forms of tobacco use is not included.
(5) Average drinks per week, either as a current drinker or as a former drinker (DPW)
• The average number of standard drinks a subject reports drinking each week.
• All types of alcohol should be combined into a single number.
• Never drinkers should be set to missing.
B.2 UK Biobank phenotype definitions
• Cigarettes per day (CPD)
∗ Quantitative CPD was calculated as the union of field 2887 (number of cigarettes previ-
ously smoked daily, asked of former smokers), field 3456 (number of cigarettes currently
smoked daily, asked of current smokers), and field 6183 (number of cigarettes previ-
ously smoked daily, asked of current cigar or pipe smokers who used to be cigarette
smokers).
∗ Individuals who reported use of more than 60 cigarettes (3 packs) per day were set to
missing.

128
∗ Quantitative CPD was binned as described above.
• Smoking initiation (SI)
∗ Individuals who answered “Yes” on field 2644 (at least 100 smokes in life time, asked
of former light smokers) were considered smokers and non-smokers if they answered
“No.”
∗ Individuals who answered “Hand-rolled cigarettes” or “Manufactured cigarettes” to
field 2877 (type of tobacco previously smoked, asked of former smokers) were classified
as smokers.
∗ Individuals who answered “I have never smoked” to field 1249 (past tobacco smoking
frequency, asked of former smokers) were classified as non-smokers.
∗ Individuals who answered field 6183 (current pipe or cigar smokers who used to smoke
cigarettes) were classified as smokers.
∗ Individuals who answered “Manufactured cigarettes” or “Hand-rolled cigarettes” to
field 3446 (type of tobacco currently smoked, asked of current smokers) were classified
as smokers.
• Pack years (PY)
∗ The smoking period was calculated from field 21003 (age at assessment), field 3436
(age started smoking in current smokers), field 2867 (age started smoking in former
smokers), and field 2897 (age stopped smoking).
∗ PY was calculated as quantitative CPD divided by twenty times the smoking period
in years.
∗ Individuals who smoked for less than one year were set to missing.
∗ The phenotype was left-anchored at 1 and log transformed.
• Age of initiation (AI)

129
∗ AI was derived from field 3436 (age started smoking in current smokers) and field 2867
(age started smoking in former smokers)
∗ Individuals who claimed to have started smoking before age 10 or after age 35 were
set to missing.
∗ The phenotype was left-anchored at 1 and log transformed.
• Drinks per week (DPW)
∗ Two sets of questions were used. Individuals who drink less than once a week were
asked about their consumption, in a variety of categories of alcohol, in the average
month (fields 4407, 4418, 4429, 4440, 4451, and 4462). Individuals who drink once
a week or more were asked about their consumption, in the same categories, in the
average week (fields 1568, 1578, 1588, 1598, 1608, and 5364).
∗ For each type of alcohol, I calculated a conversion to standard drinks:
– Glass of red wine – 1 drink
– Glass of white wine or champagne – 1 drink
– Pint of beer or cider – 1.3 drinks
– Measure of spirits or liqueur – 1 drink
– Glass of fortified wine – 1 drink
– Glass of alcopop or other – 1.5 drinks
∗ The sum of the standardized categories was taken for each subject. Drinks per month
was divided by the average number of days in a month (30.42) and multiplied by the
number of days in a week (7).
∗ Individuals who claimed to drink more than 24 drinks per day on average were set to
missing.
∗ The phenotype was left-anchored at 1 and log transformed.
• Smoking cessation (SC)

130
∗ Individuals who responded “Yes” to field 2644 (at least 100 smokes in life time, asked
of former light smokers) were coded as former smokers.
∗ Individuals who responded “Hand-rolled cigarettes” or “Manufactured cigarettes” to
field 2877 (type of tobacco previously smoked, asked of former smokers) were classified
as former smokers.
∗ Individuals who responded “Manufactured cigarettes” or “Hand-rolled cigarettes” to
field 3446 (type of tobacco currently smoked, asked of current smokers) were classified
as current smokers.
• Binge drinking
∗ The UK Biobank has no measure of binge drinking.
• Drinker versus non-drinker (DND)
∗ Individuals who responded “Never” to field 1558 were classified as non-drinkers. All
other responses to that field, other than “Prefer not to answer,” were classified as
drinkers.
B.3 GSCAN Exome analysis
I performed two separate association analyses for GSCAN Exome: one on the initial release
of genetic data for ∼150,000 subjects and the other on the full release of genetic data. Both anal-
yses were performed with the RVTESTS software package (Zhan et al., 2016). For all phenotypes,
sex, age, age2, the first fifteen genomic principal components, and binary one-hot variables corre-
sponding to the genotyping batch were included as covariates. Height and weight were included
as covariates for DPW, along with a binary indicator of current/former drinker status. For the
smoking phenotypes, a binary indicator of current/former smoker status was included as a covari-
ate. The residuals, after regressing on the covariates, were inverse normal transformed to produce
the final phenotypes. For both analyses, only Caucasian individuals were included. For the first
analysis, related individuals were removed.

131
The UK Biobank sample was genotyped on two slightly different chips. The BiLEVE sub-
sample, consisting of 25,000 heavy smokers and 25,000 never-smokers, was genotyped on a chip
with very similar content to the chip used on the majority of the sample but with significantly
different call rates at some sites (Bycroft et al., 2017). This means that, for a study investigating
substance use behavior, genotyping method and phenotypes of interest are confounded. Therefore,
for all analyses, the BiLEVE sub-sample was analyzed separately from the rest of the UK Biobank.
In the analysis of the initial release, RVTESTS was used to produce single variant score
statistics, sliding window covariance matrices (to enable rare variant burden tests in the meta-
analysis), and statistics under dominant and recessive models. In the analysis of the full release,
the BOLT-LMM mode of RVTESTS was used, which accounts for sample relatedness (Loh et al.,
2015). Sliding window covariance matrices were calculated only for loss of function variants and
variants included on the Exome Chip, in order to make the calculations computationally feasible.
In both analyses, imputed data was used.
B.4 GSCAN GWAS analysis
Covariates were included and the BiLEVE sub-sample was treated as described above. RVTESTS
was used, in its default non-BOLT-LMM mode. Only single variant score statistics were generated
because rare variant analyses were not performed in the GSCAN GWAS meta-analysis. Related
individuals were excluded from the analysis (relatedness of 0.05 or greater). Non-Caucasian individ-
uals were excluded from the analysis in order to avoid confounding with population structure.

Appendix C
Funding sources for GSCAN Exome contributors
COGA: The Collaborative Study on the Genetics of Alcoholism (COGA), Principal In-
vestigators B. Porjesz, V. Hesselbrock, H. Edenberg, L. Bierut, includes eleven different centers:
University of Connecticut (V. Hesselbrock); Indiana University (H.J. Edenberg, J. Nurnberger
Jr., T. Foroud); University of Iowa (S. Kuperman, J. Kramer); SUNY Downstate (B. Porjesz);
Washington University in St. Louis (L. Bierut, J. Rice, K. Bucholz, A. Agrawal); University of
California at San Diego (M. Schuckit); Rutgers University (J. Tischfield, A. Brooks); Department
of Biomedical and Health Informatics, The Childrens Hospital of Philadelphia; Department of
Genetics, Perelman School of Medicine, University of Pennsylvania, Philadelphia PA (L. Almasy),
Virginia Commonwealth University (D. Dick), Icahn School of Medicine at Mount Sinai (A. Goate),
and Howard University (R. Taylor). Other COGA collaborators include: L. Bauer (University of
Connecticut); J. McClintick, L. Wetherill, X. Xuei, Y. Liu, D. Lai, S. OConnor, M. Plawecki, S.
Lourens (Indiana University); G. Chan (University of Iowa; University of Connecticut); J. Meyers,
D. Chorlian, C. Kamarajan, A. Pandey, J. Zhang (SUNY Downstate); J.-C. Wang, M. Kapoor,
S. Bertelsen (Icahn School of Medicine at Mount Sinai); A. Anokhin, V. McCutcheon, S. Saccone
(Washington University); J. Salvatore, F. Aliev, B. Cho (Virginia Commonwealth University); and
Mark Kos (University of Texas Rio Grande Valley). A. Parsian and M. Reilly are the NIAAA Staff
Collaborators.
We continue to be inspired by our memories of Henri Begleiter and Theodore Reich, founding
PI and Co-PI of COGA, and also owe a debt of gratitude to other past organizers of COGA,
133
including Ting-Kai Li, P. Michael Conneally, Raymond Crowe, and Wendy Reich, for their critical
contributions. This national collaborative study is supported by NIH Grant U10AA008401 from
the National Institute on Alcohol Abuse and Alcoholism (NIAAA) and the National Institute on
Drug Abuse (NIDA).
FTC: Phenotyping and genotyping of the Finnish Twin Cohort (FTC) has been supported
by the Academy of Finland Center of Excellence in Complex Disease Genetics (grants 213506,
129680), the Academy of Finland (grants 100499, 205585, 118555, 141054, 265240, 263278 and
264146 to J. Kaprio), National Institute for Health (grant DA12854 to P.A.F. Madden), National
Institute of Alcohol Abuse and Alcoholism (grants AA-12502, AA-00145, and AA-09203 to R. J.
Rose and AA15416 and K02AA018755 to D. M. Dick), Sigrid Juselius Foundation (to J. Kaprio),
Global Research Award for Nicotine Dependence, Pfizer Inc. (to J. Kaprio), and the Welcome
Trust Sanger Institute, UK. Antti-Pekka Sarin and Samuli Ripatti are acknowledged for genotype
data quality controls and imputation. Association analyses were run at the ELIXIR Finland node
hosted at CSC IT Center for Science for ICT resources.
GECCO: Support for this study came from the National Cancer Institute, National Insti-
tutes of Health, U.S. Department of Health and Human Services (U01 CA137088; R01CA059045).
The authors also thank all those at the GECCO Coordinating Center for helping bring together
the data and people that made this project possible.
Substudies of GECCO:
• ASTERISK: a Hospital Clinical Research Program (PHRC-BRD09/C) from the Univer-
sity Hospital Center of Nantes (CHU de Nantes) and supported by the Regional Council
of Pays de la Loire, the Groupement des Entreprises Franaises dans la Lutte contre le
Cancer (GEFLUC), the Association Anne de Bretagne Gntique and the Ligue Rgionale
Contre le Cancer (LRCC). We are very grateful to Dr. Bruno Buecher without whom this
project would not have existed. We also thank all those who agreed to participate in this
study, including the patients and the healthy control persons, as well as all the physicians,
technicians and students.

134
• CPS-II: The authors thank the CPS-II participants and Study Management Group for
their invaluable contributions to this research. The authors would also like to acknowledge
the contribution to this study from central cancer registries supported through the Centers
for Disease Control and Prevention National Program of Cancer Registries, and cancer
registries supported by the National Cancer Institute Surveillance Epidemiology and End
Results program.
• HPFS, NHS: We would like to acknowledge Patrice Soule and Hardeep Ranu of the Dana
Farber Harvard Cancer Center High-Throughput Polymorphism Core who assisted in the
genotyping for NHS, HPFS under the supervision of Dr. Immaculata Devivo and Dr.
David Hunter, Qin (Carolyn) Guo and Lixue Zhu who assisted in programming for NHS
and HPFS. We would like to thank the participants and staff of the Nurses’ Health Study
and the Health Professionals Follow-Up Study, for their valuable contributions as well as
the following state cancer registries for their help: AL, AZ, AR, CA, CO, CT, DE, FL,
GA, ID, IL, IN, IA, KY, LA, ME, MD, MA, MI, NE, NH, NJ, NY, NC, ND, OH, OK, OR,
PA, RI, SC, TN, TX, VA, WA, WY. The authors assume full responsibility for analyses
and interpretation of these data.
• PLCO: Intramural Research Program of the Division of Cancer Epidemiology and Genet-
ics and supported by contracts from the Division of Cancer Prevention, National Cancer
Institute, NIH, DHHS. Additionally, a subset of control samples were genotyped as part of
the Cancer Genetic Markers of Susceptibility (CGEMS) Prostate Cancer GWAS (Yeager,
M et al. Genome-wide association study of prostate cancer identifies a second risk locus
at 8q24. Nat Genet 2007 May;39(5):645-9), CGEMS pancreatic cancer scan (PanScan)
(Amundadottir, L et al. Genome-wide association study identifies variants in the ABO
locus associated with susceptibility to pancreatic cancer. Nat Genet. 2009 Sep;41(9):986-
90, and Petersen, GM et al. A genome-wide association study identifies pancreatic can-
cer susceptibility loci on chromosomes 13q22.1, 1q32.1 and 5p15.33. Nat Genet. 2010
135
Mar;42(3):224-8), and the Lung Cancer and Smoking study (Landi MT, et al. A genome-
wide association study of lung cancer identifies a region of chromosome 5p15 associated
with risk for adenocarcinoma. Am J Hum Genet. 2009 Nov;85(5):679-91). The prostate
and PanScan study datasets were accessed with appropriate approval through the db-
GaP online resource (http://cgems.cancer.gov/data/) accession numbers phs000207.v1.p1
and phs000206.v3.p2, respectively, and the lung datasets were accessed from the dbGaP
website (http://www.ncbi.nlm.nih.gov/gap) through accession number phs000093.v2.p2.
Funding for the Lung Cancer and Smoking study was provided by National Institutes of
Health (NIH), Genes, Environment and Health Initiative (GEI) Z01 CP 010200, NIH U01
HG004446, and NIH GEI U01 HG 004438. For the lung study, the GENEVA Coordinat-
ing Center provided assistance with genotype cleaning and general study coordination, and
the Johns Hopkins University Center for Inherited Disease Research conducted genotyping.
The authors thank Drs. Christine Berg and Philip Prorok, Division of Cancer Prevention,
National Cancer Institute, the Screening Center investigators and staff or the Prostate,
Lung, Colorectal, and Ovarian (PLCO) Cancer Screening Trial, Mr. Tom Riley and staff,
Information Management Services, Inc., Ms. Barbara OBrien and staff, Westat, Inc., and
Drs. Bill Kopp and staff, SAIC-Frederick. Most importantly, we acknowledge the study
participants for their contributions to making this study possible. The statements con-
tained herein are solely those of the authors and do not represent or imply concurrence or
endorsement by NCI.
• PMH: National Institutes of Health (R01 CA076366 to P.A. Newcomb). The authors
would like to thank the study participants and staff of the Hormones and Colon Cancer
study.
• CCFR: This work was supported by grant UM1 CA167551 from the National Cancer
Institute and through cooperative agreements with the following CCFR centers: Ontario
Familial Colorectal Cancer Registry (U01/U24 CA074783)

136
HRS: HRS is supported by the National Institute on Aging (NIA U01AG009740). The geno-
typing was funded separately by the National Institute on Aging (RC2 AG036495, RC4 AG039029).
Our genotyping was conducted by the NIH Center for Inherited Disease Research (CIDR) at Johns
Hopkins University. Genotyping quality control and final preparation of the data were performed
by the University of Michigan School of Public Health.
MEC: Support for this study came from the National Institutes of Health (R37CA54281,
P01CA033619, R01CA63464).
MCTFR: Data collection and analysis was supported by National Institutes of Health awards
DA036216, DA05147, and DA024417.
MHI: We thank all participants and staff of the Andr and France Desmarais Montreal
Heart Institutes (MHI) Biobank. The genotyping of the MHI Biobank was done at the MHI
Pharmacogenomic Centre and funded by the MHI Foundation. Valerie Turcot is supported by
a postdoctoral fellowship from the Canadian Institutes of Health Research (CIHR). Jean-Claude
Tardif and Guillaume Lettre are supported by the Canada Research Chair Program.
NESCOG: This work is supported by the Netherlands Organization for Scientific Research
(NWO Brain & Cognition 433-09-228, NWO Complexity Project 645-000-003, NWO VICI 453-14-
005). Statistical analyses were carried out on the Genetic Cluster Computer hosted by SURFsara
and financially supported by the Netherlands Organization for Scientific Research (NWO 480-05-003
PI: Posthuma) along with a supplement from the Dutch Brain Foundation and the VU University
Amsterdam.
WHI: The WHI program is funded by the National Heart, Lung, and Blood Institute, Na-
tional Institutes of Health, U.S. Department of Health and Human Services through contracts
HHSN268201100046C, HHSN268201100001C, HHSN268201100002C, HHSN268201100003C, and
HHSN271201100004C. Personal funding for Sean P. David from National Institute on Minority
Health and Health Disparities grant U54-MD010724. The authors thank the WHI investigators
and staff for their dedication, and the study participants for making the program possible.
Consortium for Genetics of Smoking Behaviour Funding statements: Understand-

137
ing Society Scientific Group is funded by the Economic and Social Research Council (ES/H029745/1)
and the Wellcome Trust (WT098051). Paul D.P. Pharoah is funded by Cancer Research UK
(C490/A16561). SHIP is funded by the German Federal Ministry of Education and Research
(BMBF) and the German Research Foundation (DFG); see acknowledgements for details. F.W.
Asselbergs is funded by the Netherlands Heart Foundation (2014T001) and UCL Hospitals NIHR
Biomedical Research Centre. The LifeLines Cohort Study, and generation and management of
GWAS genotype data for the LifeLines Cohort Study is supported by the Netherlands Organi-
zation of Scientific Research NWO (grant 175.010.2007.006), the Economic Structure Enhancing
Fund (FES) of the Dutch government, the Ministry of Economic Affairs, the Ministry of Edu-
cation, Culture and Science, the Ministry for Health, Welfare and Sports, the Northern Nether-
lands Collaboration of Provinces (SNN), the Province of Groningen, University Medical Center
Groningen, the University of Groningen, Dutch Kidney Foundation and Dutch Diabetes Research
Foundation. Niek Verweij is supported by Horizon 2020 (Marie Sklodowska-Curie, 661395) and
ICIN-NHI. LBC1921 and LBC1936 is supported by the MRC (MR/K026992/1). Paul W. Franks
is supported by Novo Nordisk, the Swedish Research Council, Phlssons Foundation, Swedish Heart
Lung Foundation (2020389), and Skne Regional Health Authority. Nicholas J Wareham, Claudia
Langenberg, Robert A Scott, and Jian’an Luan are supported by the MRC (MC U106179471 and
MC UU 12015/1). John C. Chambers and Jaspal S. Kooner are supported by the British Heart
Foundation (SP/04/002), Medical Research Council (G0601966 and G0700931), Wellcome Trust
(084723/Z/08/Z), NIHR (RP-PG-0407-10371), European Union FP7 (EpiMigrant, 279143), Action
on Hearing Loss (G51), National Institute for Health Research (NIHR) Comprehensive Biomed-
ical Research Centre Imperial College Healthcare NHS Trust, and iHEalth-T2D (643774). The
BRIGHT study was supported by the Medical Research Council of Great Britain (Grant Number
G9521010D); and by the British Heart Foundation (Grant Number PG/02/128). The BRIGHT
study is extremely grateful to all the patients who participated in the study and the BRIGHT nurs-
ing team. The Exome Chip genotyping was funded by Wellcome Trust Strategic Awards (083948
and 085475). We would also like to thank the Barts Genome Centre staff for their assistance with
138
this project. The ASCOT study and the collection of the ASCOT DNA repository was supported
by Pfizer, New York, NY, USA, Servier Research Group, Paris, France; and by Leo Laborato-
ries, Copenhagen, Denmark. Genotyping of the Exome Chip in ASCOT-SC and ASCOT-UK was
funded by the National Institutes of Health Research (NIHR). Anna F. Dominiczak was supported
by the British Heart Foundation (Grant Numbers RG/07/005/23633, SP/08/005/25115); and by
the European Union Ingenious HyperCare Consortium: Integrated Genomics, Clinical Research,
and Care in Hypertension (grant number LSHM-C7-2006-037093). Nilesh J. Samani is supported
by the British Heart Foundation. Panos Deloukas is supported by the British Heart Foundation
(RG/14/5/30893), and NIHR, where his work forms part of the research themes contributing to
the translational research portfolio of Barts Cardiovascular Biomedical Research Centre which is
funded by the National Institute for Health Research (NIHR).
Consortium for Genetics of Smoking Behaviour Acknowledgements: The authors
would like to thank the many colleagues who contributed to collection and phenotypic characterisa-
tion of the clinical samples, as well as genotyping and analysis of the GWA data. Special mentions
are as follows:
Some of the data utilised in this study were provided by the Understanding Society: The
UK Household Longitudinal Study, which is led by the Institute for Social and Economic Re-
search at the University of Essex and funded by the Economic and Social Research Council. The
data were collected by NatCen and the genome wide scan data were analysed by the Wellcome
Trust Sanger Institute. The Understanding Society DAC have an application system for ge-
netics data and all use of the data should be approved by them. The application form is at:
https://www.understandingsociety.ac.uk/about/health/data.
SHIP (Study of Health in Pomerania) and SHIP-TREND both represent population-based
studies. SHIP is supported by the German Federal Ministry of Education and Research (Bun-
desministerium fr Bildung und Forschung (BMBF); grants 01ZZ9603, 01ZZ0103, and 01ZZ0403)
and the German Research Foundation (Deutsche Forschungsgemeinschaft (DFG); grant GR 1912/5-
1). SHIP and SHIP-TREND are part of the Community Medicine Research net (CMR) of the

139
Ernst-Moritz-Arndt University Greifswald (EMAU) which is funded by the BMBF as well as the
Ministry for Education, Science and Culture and the Ministry of Labor, Equal Opportunities, and
Social Affairs of the Federal State of Mecklenburg-West Pomerania. The CMR encompasses several
research projects that share data from SHIP. The EMAU is a member of the Center of Knowledge
Interchange (CKI) program of the Siemens AG. SNP typing of SHIP and SHIP-TREND using
the Illumina Infinium HumanExome BeadChip (version v1.0) was supported by the BMBF (grant
03Z1CN22). LifeLines authors thank Behrooz Alizadeh, Annemieke Boesjes, Marcel Bruinenberg,
Noortje Festen, Ilja Nolte, Lude Franke, Mitra Valimohammadi for their help in creating the GWAS
database, and Rob Bieringa, Joost Keers, Ren Oostergo, Rosalie Visser, Judith Vonk for their work
related to data-collection and validation. The authors are grateful to the study participants, the
staff from the LifeLines Cohort Study and Medical Biobank Northern Netherlands, and the par-
ticipating general practitioners and pharmacists. LifeLines Scientific Protocol Preparation: Rudolf
de Boer, Hans Hillege, Melanie van der Klauw, Gerjan Navis, Hans Ormel, Dirkje Postma, Ju-
dith Rosmalen, Joris Slaets, Ronald Stolk, Bruce Wolffenbuttel; LifeLines GWAS Working Group:
Behrooz Alizadeh, Marike Boezen, Marcel Bruinenberg, Noortje Festen, Lude Franke, Pim van der
Harst, Gerjan Navis, Dirkje Postma, Harold Snieder, Cisca Wijmenga, Bruce Wolffenbuttel. The
authors wish to acknowledge the services of the LifeLines Cohort Study, the contributing research
centres delivering data to LifeLines, and all the study participants.
Fenland authors thank Fenland Study volunteers for their time and help, Fenland Study
general Practitioners and practice staff for assistance with recruitment, and Fenland Study Inves-
tigators, Co-ordination team and the Epidemiology Field, Data and Laboratory teams for study
design, sample/data collection and genotyping. We thank all ASCOT trial participants, physicians,
nurses, and practices in the participating countries for their important contribution to the study. In
particular we thank Clare Muckian and David Toomey for their help in DNA extraction, storage,
and handling. We would also like to acknowledge the Barts and The London Genome Centre staff
for genotyping the Exome Chip array.
The BRIGHT study is extremely grateful to all the patients who participated in the study
140
and the BRIGHT nursing team. We would also like to thank the Barts Genome Centre staff for
their assistance with this project. Patricia B. Munroe, Mark J. Caulfield, and Helen R. Warren
wish to acknowledge the NIHR Cardiovascular Biomedical Research Unit at Barts and The Lon-
don, Queen Mary University of London, UK for support. Nilesh J. Samani and Mark J. Caulfield
are Senior National Institute for Health Research Investigators. EMBRACE Collaborating Cen-
tres are: Coordinating Centre, Cambridge: Daniel Barrowdale, Debra Frost, Jo Perkins. North
of Scotland Regional Genetics Service, Aberdeen: Zosia Miedzybrodzka, Helen Gregory. Northern
Ireland Regional Genetics Service, Belfast: Patrick Morrison, Lisa Jeffers. West Midlands Regional
Clinical Genetics Service, Birmingham: Kai-ren Ong, Jonathan Hoffman. South West Regional Ge-
netics Service, Bristol: Alan Donaldson, Margaret James. East Anglian Regional Genetics Service,
Cambridge: Joan Paterson, Marc Tischkowitz, Sarah Downing, Amy Taylor. Medical Genetics
Services for Wales, Cardiff: Alexandra Murray, Mark T. Rogers, Emma McCann. St Jamess Hos-
pital, Dublin & National Centre for Medical Genetics, Dublin: M. John Kennedy, David Barton.
South East of Scotland Regional Genetics Service, Edinburgh: Mary Porteous, Sarah Drummond.
Peninsula Clinical Genetics Service, Exeter: Carole Brewer, Emma Kivuva, Anne Searle, Selina
Goodman, Kathryn Hill. West of Scotland Regional Genetics Service, Glasgow: Rosemarie David-
son, Victoria Murday, Nicola Bradshaw, Lesley Snadden, Mark Longmuir, Catherine Watt, Sarah
Gibson, Eshika Haque, Ed Tobias, Alexis Duncan. South East Thames Regional Genetics Service,
Guys Hospital London: Louise Izatt, Chris Jacobs, Caroline Langman. North West Thames Re-
gional Genetics Service, Harrow: Huw Dorkins. Leicestershire Clinical Genetics Service, Leicester:
Julian Barwell. Yorkshire Regional Genetics Service, Leeds: Julian Adlard, Gemma Serra-Feliu.
Cheshire & Merseyside Clinical Genetics Service, Liverpool: Ian Ellis, Claire Foo. Manchester
Regional Genetics Service, Manchester: D Gareth Evans, Fiona Lalloo, Jane Taylor. North East
Thames Regional Genetics Service, NE Thames, London: Lucy Side, Alison Male, Cheryl Berlin.
Nottingham Centre for Medical Genetics, Nottingham: Jacqueline Eason, Rebecca Collier. North-
ern Clinical Genetics Service, Newcastle: Alex Henderson, Oonagh Claber, Irene Jobson. Oxford
Regional Genetics Service, Oxford: Lisa Walker, Diane McLeod, Dorothy Halliday, Sarah Durell,

141
Barbara Stayner. The Institute of Cancer Research and Royal Marsden NHS Foundation Trust:
Ros Eeles, Nazneen Rahman, Elizabeth Bancroft, Elizabeth Page, Audrey Ardern-Jones, Kelly
Kohut, Jennifer Wiggins, Jenny Pope, Sibel Saya, Natalie Taylor, Zoe Kemp and Angela George.
North Trent Clinical Genetics Service, Sheffield: Jackie Cook, Oliver Quarrell, Cathryn Bardsley.
South West Thames Regional Genetics Service, London: Shirley Hodgson, Sheila Goff, Glen Brice,
Lizzie Winchester, Charlotte Eddy, Vishakha Tripathi, Virginia Attard. Wessex Clinical Genetics
Service, Princess Anne Hospital, Southampton: Diana Eccles, Anneke Lucassen, Gillian Crawford,
Donna McBride, Sarah Smalley.
Consortium for Genetics of Smoking Behaviour Conflict of Interest statements:
Paul W. Franks has been a paid consultant for Eli Lilly and Sanofi Aventis and has received research
support from several pharmaceutical companies as part of European Union Innovative Medicines
Initiative (IMI) projects. Neil Poulter has received financial support from several pharmaceutical
companies that manufacture either blood pressure lowering or lipid lowering agents or both and
consultancy fees. Peter Sever has received research awards from Pfizer. Mark J. Caulfield is Chief
Scientist for Genomics England, a UK government company.