The Strength of Phenotypic Selection in Natural Populations
18
The Strength of Phenotypic Selection in Natural Populations. Author(s): J. G. Kingsolver, H. E. Hoekstra, J. M. Hoekstra, D. Berrigan, S. N. Vignieri, C. E. Hill, A. Hoang, P. Gibert, P. Beerli Source: The American Naturalist, Vol. 157, No. 3 (March 2001), pp. 245-261 Published by: The University of Chicago Press for The American Society of Naturalists Stable URL: http://www.jstor.org/stable/10.1086/319193 . Accessed: 02/02/2011 16:00 Your use of the JSTOR archive indicates your acceptance of JSTOR's Terms and Conditions of Use, available at . http://www.jstor.org/page/info/about/policies/terms.jsp. JSTOR's Terms and Conditions of Use provides, in part, that unless you have obtained prior permission, you may not download an entire issue of a journal or multiple copies of articles, and you may use content in the JSTOR archive only for your personal, non-commercial use. Please contact the publisher regarding any further use of this work. Publisher contact information may be obtained at . http://www.jstor.org/action/showPublisher?publisherCode=ucpress. . Each copy of any part of a JSTOR transmission must contain the same copyright notice that appears on the screen or printed page of such transmission. JSTOR is a not-for-profit service that helps scholars, researchers, and students discover, use, and build upon a wide range of content in a trusted digital archive. We use information technology and tools to increase productivity and facilitate new forms of scholarship. For more information about JSTOR, please contact [email protected]. The University of Chicago Press and The American Society of Naturalists are collaborating with JSTOR to digitize, preserve and extend access to The American Naturalist. http://www.jstor.org
Transcript of The Strength of Phenotypic Selection in Natural Populations
The Strength of Phenotypic Selection in Natural Populations.Author(s): J. G. Kingsolver, H. E. Hoekstra, J. M. Hoekstra, D. Berrigan, S. N. Vignieri, C. E.Hill, A. Hoang, P. Gibert, P. BeerliSource: The American Naturalist, Vol. 157, No. 3 (March 2001), pp. 245-261Published by: The University of Chicago Press for The American Society of NaturalistsStable URL: http://www.jstor.org/stable/10.1086/319193 .Accessed: 02/02/2011 16:00
Your use of the JSTOR archive indicates your acceptance of JSTOR's Terms and Conditions of Use, available at .http://www.jstor.org/page/info/about/policies/terms.jsp. JSTOR's Terms and Conditions of Use provides, in part, that unlessyou have obtained prior permission, you may not download an entire issue of a journal or multiple copies of articles, and youmay use content in the JSTOR archive only for your personal, non-commercial use.
Please contact the publisher regarding any further use of this work. Publisher contact information may be obtained at .http://www.jstor.org/action/showPublisher?publisherCode=ucpress. .
Each copy of any part of a JSTOR transmission must contain the same copyright notice that appears on the screen or printedpage of such transmission.
JSTOR is a not-for-profit service that helps scholars, researchers, and students discover, use, and build upon a wide range ofcontent in a trusted digital archive. We use information technology and tools to increase productivity and facilitate new formsof scholarship. For more information about JSTOR, please contact [email protected].
The University of Chicago Press and The American Society of Naturalists are collaborating with JSTOR todigitize, preserve and extend access to The American Naturalist.
http://www.jstor.org
vol. 157, no. 3 the american naturalist march 2001
The Strength of Phenotypic Selection in Natural Populations
J. G. Kingsolver,1,* H. E. Hoekstra,1 J. M. Hoekstra,1,† D. Berrigan,1,‡ S. N. Vignieri,1 C. E. Hill,1,§ A. Hoang,1
P. Gibert,1,k and P. Beerli2
1. Department of Zoology, University of Washington, Seattle,Washington 98195;2. Department of Genetics, University of Washington, Seattle,Washington 98195
Submitted June 9, 2000; Accepted October 31, 2000
abstract: How strong is phenotypic selection on quantitative traitsin the wild? We reviewed the literature from 1984 through 1997 forstudies that estimated the strength of linear and quadratic selectionin terms of standardized selection gradients or differentials on naturalvariation in quantitative traits for field populations. We tabulated 63published studies of 62 species that reported over 2,500 estimates oflinear or quadratic selection. More than 80% of the estimates werefor morphological traits; there is very little data for behavioral orphysiological traits. Most published selection studies were unrepli-cated and had sample sizes below 135 individuals, resulting in lowstatistical power to detect selection of the magnitude typically re-ported for natural populations. The absolute values of linear selectiongradients FbF were exponentially distributed with an overall medianof 0.16, suggesting that strong directional selection was uncommon.The values of FbF for selection on morphological and on life-history/phenological traits were significantly different: on average, selectionon morphology was stronger than selection on phenology/life history.Similarly, the values of FbF for selection via aspects of survival,fecundity, and mating success were significantly different: on average,selection on mating success was stronger than on survival. Com-parisons of estimated linear selection gradients and differentials sug-gest that indirect components of phenotypic selection were usuallymodest relative to direct components. The absolute values of qua-dratic selection gradients FgF were exponentially distributed with an
* Corresponding author. Present address: Department of Biology, University
of North Carolina, Chapel Hill, North Carolina 27599-3280; e-mail: jgking@
bio.unc.edu.
† Present address: Department of Ecology and Evolutionary Biology, Univer-
sity of Arizona, Tucson, Arizona 20892.
‡ Present address: National Cancer Institute, Bethesda, Maryland 20892.
§ Present address: Department of Biology, Coastal Carolina University, Con-
way, South Carolina 29528.
k Present address: Laboratoire Populations, Genetique, et Evolution, Centre
National de la Recherche Scientifique, 91198, Gif Sur Yvette Cedex, France.
Am. Nat. 2001. Vol. 157, pp. 245–261. q 2001 by The University of Chicago.0003-0147/2001/15703-0001$03.00. All rights reserved.
overall median of only 0.10, suggesting that quadratic selection istypically quite weak. The distribution of g values was symmetricabout 0, providing no evidence that stabilizing selection is strongeror more common than disruptive selection in nature.
Keywords: microevolution, natural populations, natural selection,phenotypic selection, sexual selection.
How strong is phenotypic selection on quantitative traitsin nature? Is strong directional selection rare? Is stabilizingor correlational selection common? Is selection more in-tense on life history than on morphological traits? Whatis the relative importance of direct versus indirect selectionon correlated traits? The answers to these and similar ques-tions are fundamental to understanding the role of selec-tion in determining evolutionary changes and adaptationin current populations. In his influential book, NaturalSelection in the Wild, Endler (1986) provided a compre-hensive review of published field studies of selectionthrough 1983. His synthesis documented the abundantevidence that selection on quantitative traits occurs fre-quently in natural populations. However, quantitative es-timates of the strength of phenotypic selection on quan-titative traits were largely lacking at that time (e.g., Endler’sreview reports values of directional selection differentialsfrom a total of 25 species).
The early 1980s also saw the development and intro-duction of new methods for estimating the strength ofselection on multiple quantitative traits (Lande 1979;Lande and Arnold 1983; Arnold and Wade 1984a, 1984b).These methods had two important advantages. First, theyprovided a means of distinguishing the direct and indirectcomponents of selection on a set of correlated traits. Thisallowed researchers to use simple statistical methods (par-tial regression models) to estimate the strength of directselection on a trait in terms of a common metric, theselection gradient, that represents the relationship of rel-ative fitness to the variation in a quantitative trait mea-sured in standard deviation units. Second, selection gra-dients were shown to be directly relevant to quantitativegenetic models for the evolution of multiple, correlatedtraits (Lande 1979; Lande and Arnold 1983).
246 The American Naturalist
Table 1: Summary of the database of phenotypicselection studies (1984–1997)
Number of itemsin the database
Studies 63Records 1,582Species 62Genera 51Taxon type:
Invertebrates (I) 534 records (19 studies)Plants (P) 587 records (18 studies)Vertebrates (V ) 461 records (27 studies)
Study type:Cross-sectional (C) 14 studiesLongitudinal (L) 51 studies
These and other advances led to an explosion of fieldstudies of selection on quantitative traits in a variety ofsystems during the ensuing 15 yr. These studies have beenimportant for exploring the role of selection for evolutionof particular traits in many specific model systems of in-terest. However, while aspects of these studies have beenreviewed with respect to specific issues or taxa (Primackand Kang 1989; Travis 1989; Gontard-Danek and Møller1999), no synthesis of this literature has emerged thatexamines the strength of selection in natural systems moregenerally.
In this report, we describe such a synthesis. We havereviewed the published literature from 1984 through 1997that reported standardized selection gradients and/or se-lection differentials on natural variation in quantitativetraits within field populations. Using the resulting data-base, we explore how the strength of directional and qua-dratic selection varies across systems, traits, and fitnesscomponents and examine the power of these studies fordetecting selection on quantitative traits.
Methods
General Considerations
We started our literature review with 1984 because Endler’smonograph (1986) reviewed the literature on selection,including estimates of selection differentials, published bythe end of 1983. We examined all studies published from1984 through 1997 in 15 peer-reviewed journals: AmericanJournal of Botany, American Naturalist, Annals of the En-tomological Society of America, Biological Journal of the Lin-nean Society, Ecological Entomology, Ecology, EnvironmentalEntomology, Evolution, Evolutionary Ecology, Genetics, He-redity, Journal of Evolutionary Biology, Nature, Philosoph-
ical Transactions of the Royal Society of London, Proceedingsof the Royal Society of London, and Science. These representthe major peer-reviewed outlets for original scientific re-search on phenotypic selection. We did not include un-published studies or studies published in book chaptersor technical reports, for which it is more difficult to assessquality control.
We used four main criteria for including studies in ouranalyses. First, the studies involved quantitative traitsshowing continuous phenotypic variation within the studypopulation: studies of discrete and categorical traits werenot considered. Second, the studies examined naturalphenotypic variation within populations: studies involvinggenetically or phenotypically manipulated traits, highly in-bred or experimental genetic lines, or domesticated specieswere not considered. Third, the studies were conductedin natural conditions in the field: studies in the lab, green-house, experimental plots, or other controlled environ-mental conditions were not considered.
The fourth criterion concerns the metrics used to es-timate selection. We included only those studies that re-ported one or more of the following metrics: standardizedlinear selection gradients (b), standardized quadratic se-lection gradients (g), standardized linear selection differ-entials (i), or standardized quadratic selection differentials(Lande and Arnold 1983; Arnold and Wade 1984a, 1984b).These metrics estimate selection on a trait in terms of theeffects on relative fitness in units of (phenotypic) standarddeviations of the trait, allowing direct comparisons amongtraits, fitness components, and study systems. Selectiongradients estimate the selection directly on the trait ofinterest, whereas selection differentials estimate total se-lection on the trait acting both directly and indirectly viaselection on other, correlated traits (Lande and Arnold1983). Linear selection gradients and differentials estimatethe strength of directional selection; quadratic selectiongradients and differentials estimate the curvature of theselection function. Note that stabilizing selection on a traitimplies that the quadratic selection gradient and differ-ential are negative, and disruptive selection on a trait im-plies that the quadratic selection gradient and differentialare positive. However, the converse is not true: a negativequadratic selection gradient or differential is not sufficientto demonstrate stabilizing selection (Mitchell-Olds andShaw 1987).
These criteria exclude many important and interestingstudies of selection—we estimate that more than half ofall studies of selection in our target journals were excludedby these criteria. However, this enables us to focus ouranalyses on the question, What are the patterns of pheno-typic selection on natural variation in quantitative traitsin natural populations in the wild?
Strength of Phenotypic Selection 247
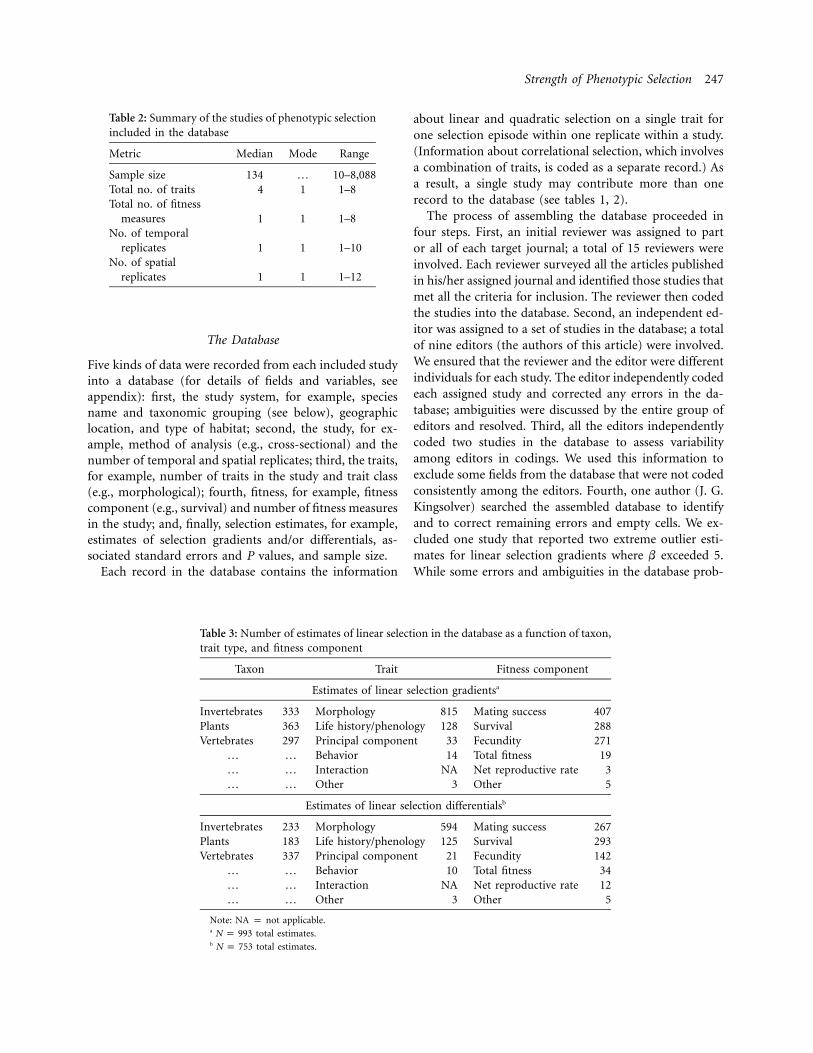
Table 2: Summary of the studies of phenotypic selectionincluded in the database
Metric Median Mode Range
Sample size 134 … 10–8,088Total no. of traits 4 1 1–8Total no. of fitness
measures 1 1 1–8No. of temporal
replicates 1 1 1–10No. of spatial
replicates 1 1 1–12
Table 3: Number of estimates of linear selection in the database as a function of taxon,trait type, and fitness component
Taxon Trait Fitness component
Estimates of linear selection gradientsa
Invertebrates 333 Morphology 815 Mating success 407Plants 363 Life history/phenology 128 Survival 288Vertebrates 297 Principal component 33 Fecundity 271
… … Behavior 14 Total fitness 19… … Interaction NA Net reproductive rate 3… … Other 3 Other 5
Estimates of linear selection differentialsb
Invertebrates 233 Morphology 594 Mating success 267Plants 183 Life history/phenology 125 Survival 293Vertebrates 337 Principal component 21 Fecundity 142
… … Behavior 10 Total fitness 34… … Interaction NA Net reproductive rate 12… … Other 3 Other 5
Note: NA p not applicable.a total estimates.N p 993b total estimates.N p 753
The Database
Five kinds of data were recorded from each included studyinto a database (for details of fields and variables, seeappendix): first, the study system, for example, speciesname and taxonomic grouping (see below), geographiclocation, and type of habitat; second, the study, for ex-ample, method of analysis (e.g., cross-sectional) and thenumber of temporal and spatial replicates; third, the traits,for example, number of traits in the study and trait class(e.g., morphological); fourth, fitness, for example, fitnesscomponent (e.g., survival) and number of fitness measuresin the study; and, finally, selection estimates, for example,estimates of selection gradients and/or differentials, as-sociated standard errors and P values, and sample size.
Each record in the database contains the information
about linear and quadratic selection on a single trait forone selection episode within one replicate within a study.(Information about correlational selection, which involvesa combination of traits, is coded as a separate record.) Asa result, a single study may contribute more than onerecord to the database (see tables 1, 2).
The process of assembling the database proceeded infour steps. First, an initial reviewer was assigned to partor all of each target journal; a total of 15 reviewers wereinvolved. Each reviewer surveyed all the articles publishedin his/her assigned journal and identified those studies thatmet all the criteria for inclusion. The reviewer then codedthe studies into the database. Second, an independent ed-itor was assigned to a set of studies in the database; a totalof nine editors (the authors of this article) were involved.We ensured that the reviewer and the editor were differentindividuals for each study. The editor independently codedeach assigned study and corrected any errors in the da-tabase; ambiguities were discussed by the entire group ofeditors and resolved. Third, all the editors independentlycoded two studies in the database to assess variabilityamong editors in codings. We used this information toexclude some fields from the database that were not codedconsistently among the editors. Fourth, one author (J. G.Kingsolver) searched the assembled database to identifyand to correct remaining errors and empty cells. We ex-cluded one study that reported two extreme outlier esti-mates for linear selection gradients where b exceeded 5.While some errors and ambiguities in the database prob-
248 The American Naturalist
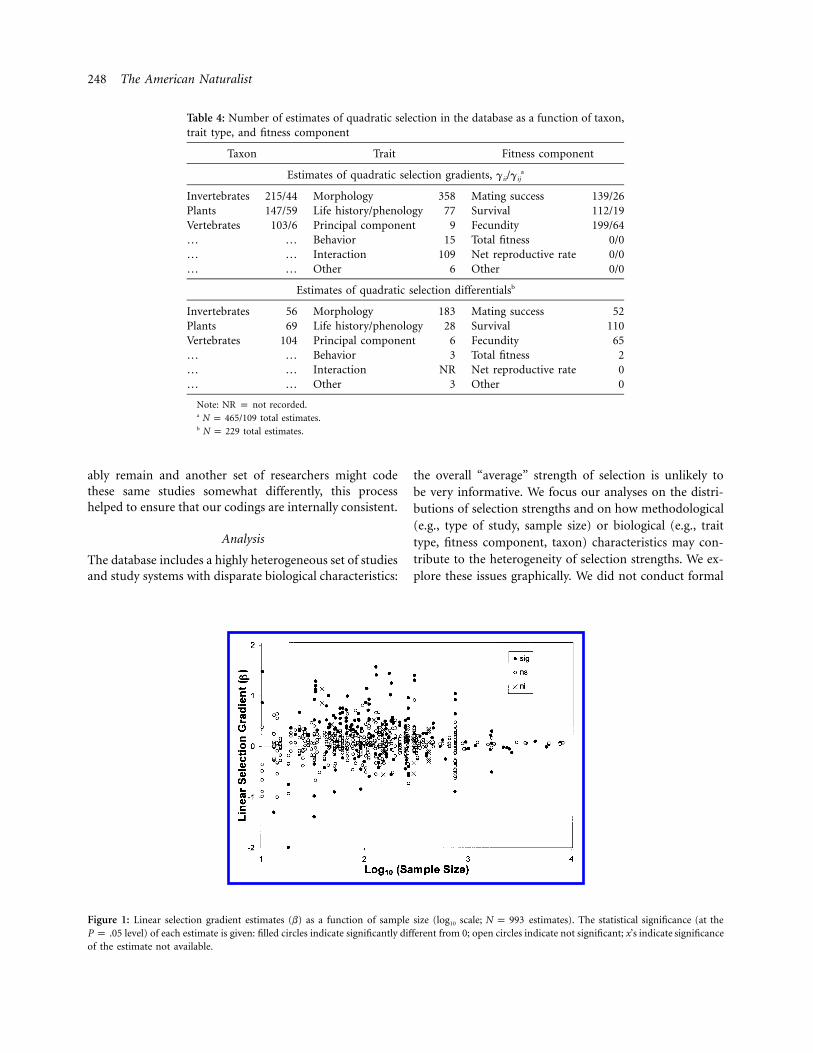
Table 4: Number of estimates of quadratic selection in the database as a function of taxon,trait type, and fitness component
Taxon Trait Fitness component
Estimates of quadratic selection gradients, gii/gija
Invertebrates 215/44 Morphology 358 Mating success 139/26Plants 147/59 Life history/phenology 77 Survival 112/19Vertebrates 103/6 Principal component 9 Fecundity 199/64… … Behavior 15 Total fitness 0/0… … Interaction 109 Net reproductive rate 0/0… … Other 6 Other 0/0
Estimates of quadratic selection differentialsb
Invertebrates 56 Morphology 183 Mating success 52Plants 69 Life history/phenology 28 Survival 110Vertebrates 104 Principal component 6 Fecundity 65… … Behavior 3 Total fitness 2… … Interaction NR Net reproductive rate 0… … Other 3 Other 0
Note: NR p not recorded.a /109 total estimates.N p 465b total estimates.N p 229
Figure 1: Linear selection gradient estimates (b) as a function of sample size (log10 scale; estimates). The statistical significance (at theN p 993level) of each estimate is given: filled circles indicate significantly different from 0; open circles indicate not significant; x’s indicate significanceP p .05
of the estimate not available.
ably remain and another set of researchers might codethese same studies somewhat differently, this processhelped to ensure that our codings are internally consistent.
Analysis
The database includes a highly heterogeneous set of studiesand study systems with disparate biological characteristics:
the overall “average” strength of selection is unlikely tobe very informative. We focus our analyses on the distri-butions of selection strengths and on how methodological(e.g., type of study, sample size) or biological (e.g., traittype, fitness component, taxon) characteristics may con-tribute to the heterogeneity of selection strengths. We ex-plore these issues graphically. We did not conduct formal
Strength of Phenotypic Selection 249
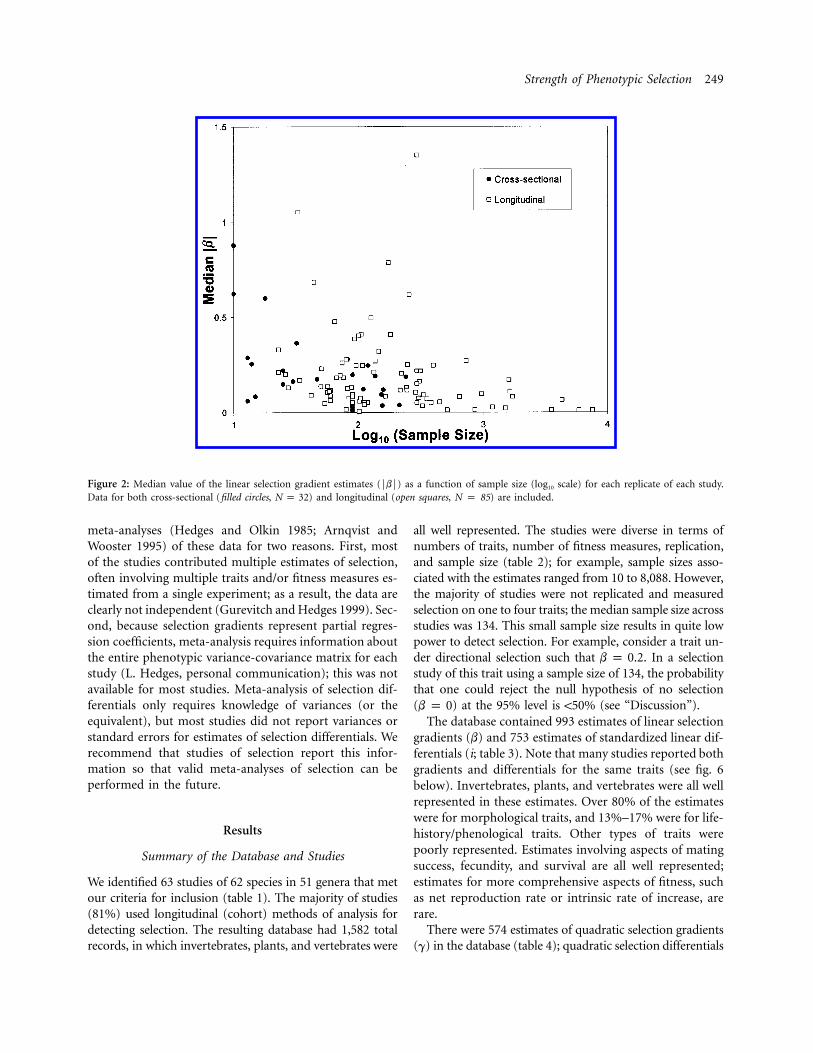
Figure 2: Median value of the linear selection gradient estimates (FbF) as a function of sample size (log10 scale) for each replicate of each study.Data for both cross-sectional (filled circles, ) and longitudinal (open squares, N p 85) are included.N p 32
meta-analyses (Hedges and Olkin 1985; Arnqvist andWooster 1995) of these data for two reasons. First, mostof the studies contributed multiple estimates of selection,often involving multiple traits and/or fitness measures es-timated from a single experiment; as a result, the data areclearly not independent (Gurevitch and Hedges 1999). Sec-ond, because selection gradients represent partial regres-sion coefficients, meta-analysis requires information aboutthe entire phenotypic variance-covariance matrix for eachstudy (L. Hedges, personal communication); this was notavailable for most studies. Meta-analysis of selection dif-ferentials only requires knowledge of variances (or theequivalent), but most studies did not report variances orstandard errors for estimates of selection differentials. Werecommend that studies of selection report this infor-mation so that valid meta-analyses of selection can beperformed in the future.
Results
Summary of the Database and Studies
We identified 63 studies of 62 species in 51 genera that metour criteria for inclusion (table 1). The majority of studies(81%) used longitudinal (cohort) methods of analysis fordetecting selection. The resulting database had 1,582 totalrecords, in which invertebrates, plants, and vertebrates were
all well represented. The studies were diverse in terms ofnumbers of traits, number of fitness measures, replication,and sample size (table 2); for example, sample sizes asso-ciated with the estimates ranged from 10 to 8,088. However,the majority of studies were not replicated and measuredselection on one to four traits; the median sample size acrossstudies was 134. This small sample size results in quite lowpower to detect selection. For example, consider a trait un-der directional selection such that . In a selectionb p 0.2study of this trait using a sample size of 134, the probabilitythat one could reject the null hypothesis of no selection( ) at the 95% level is !50% (see “Discussion”).b p 0
The database contained 993 estimates of linear selectiongradients (b) and 753 estimates of standardized linear dif-ferentials (i; table 3). Note that many studies reported bothgradients and differentials for the same traits (see fig. 6below). Invertebrates, plants, and vertebrates were all wellrepresented in these estimates. Over 80% of the estimateswere for morphological traits, and 13%–17% were for life-history/phenological traits. Other types of traits werepoorly represented. Estimates involving aspects of matingsuccess, fecundity, and survival are all well represented;estimates for more comprehensive aspects of fitness, suchas net reproduction rate or intrinsic rate of increase, arerare.
There were 574 estimates of quadratic selection gradients(g) in the database (table 4); quadratic selection differentials
250 The American Naturalist
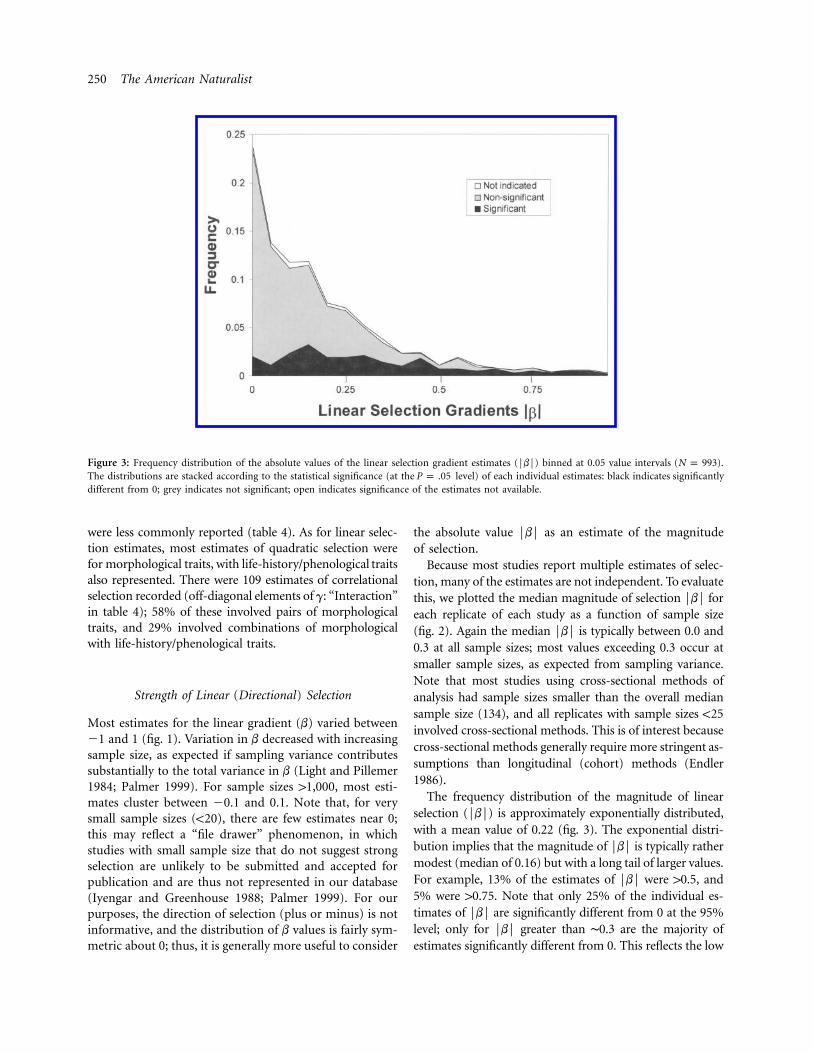
Figure 3: Frequency distribution of the absolute values of the linear selection gradient estimates (FbF) binned at 0.05 value intervals ( ).N p 993The distributions are stacked according to the statistical significance (at the level) of each individual estimates: black indicates significantlyP p .05different from 0; grey indicates not significant; open indicates significance of the estimates not available.
were less commonly reported (table 4). As for linear selec-tion estimates, most estimates of quadratic selection werefor morphological traits, with life-history/phenological traitsalso represented. There were 109 estimates of correlationalselection recorded (off-diagonal elements of g: “Interaction”in table 4); 58% of these involved pairs of morphologicaltraits, and 29% involved combinations of morphologicalwith life-history/phenological traits.
Strength of Linear (Directional) Selection
Most estimates for the linear gradient (b) varied between21 and 1 (fig. 1). Variation in b decreased with increasingsample size, as expected if sampling variance contributessubstantially to the total variance in b (Light and Pillemer1984; Palmer 1999). For sample sizes 11,000, most esti-mates cluster between 20.1 and 0.1. Note that, for verysmall sample sizes (!20), there are few estimates near 0;this may reflect a “file drawer” phenomenon, in whichstudies with small sample size that do not suggest strongselection are unlikely to be submitted and accepted forpublication and are thus not represented in our database(Iyengar and Greenhouse 1988; Palmer 1999). For ourpurposes, the direction of selection (plus or minus) is notinformative, and the distribution of b values is fairly sym-metric about 0; thus, it is generally more useful to consider
the absolute value FbF as an estimate of the magnitudeof selection.
Because most studies report multiple estimates of selec-tion, many of the estimates are not independent. To evaluatethis, we plotted the median magnitude of selection FbF foreach replicate of each study as a function of sample size(fig. 2). Again the median FbF is typically between 0.0 and0.3 at all sample sizes; most values exceeding 0.3 occur atsmaller sample sizes, as expected from sampling variance.Note that most studies using cross-sectional methods ofanalysis had sample sizes smaller than the overall mediansample size (134), and all replicates with sample sizes !25involved cross-sectional methods. This is of interest becausecross-sectional methods generally require more stringent as-sumptions than longitudinal (cohort) methods (Endler1986).
The frequency distribution of the magnitude of linearselection (FbF) is approximately exponentially distributed,with a mean value of 0.22 (fig. 3). The exponential distri-bution implies that the magnitude of FbF is typically rathermodest (median of 0.16) but with a long tail of larger values.For example, 13% of the estimates of FbF were 10.5, and5% were 10.75. Note that only 25% of the individual es-timates of FbF are significantly different from 0 at the 95%level; only for FbF greater than ∼0.3 are the majority ofestimates significantly different from 0. This reflects the low
Strength of Phenotypic Selection 251
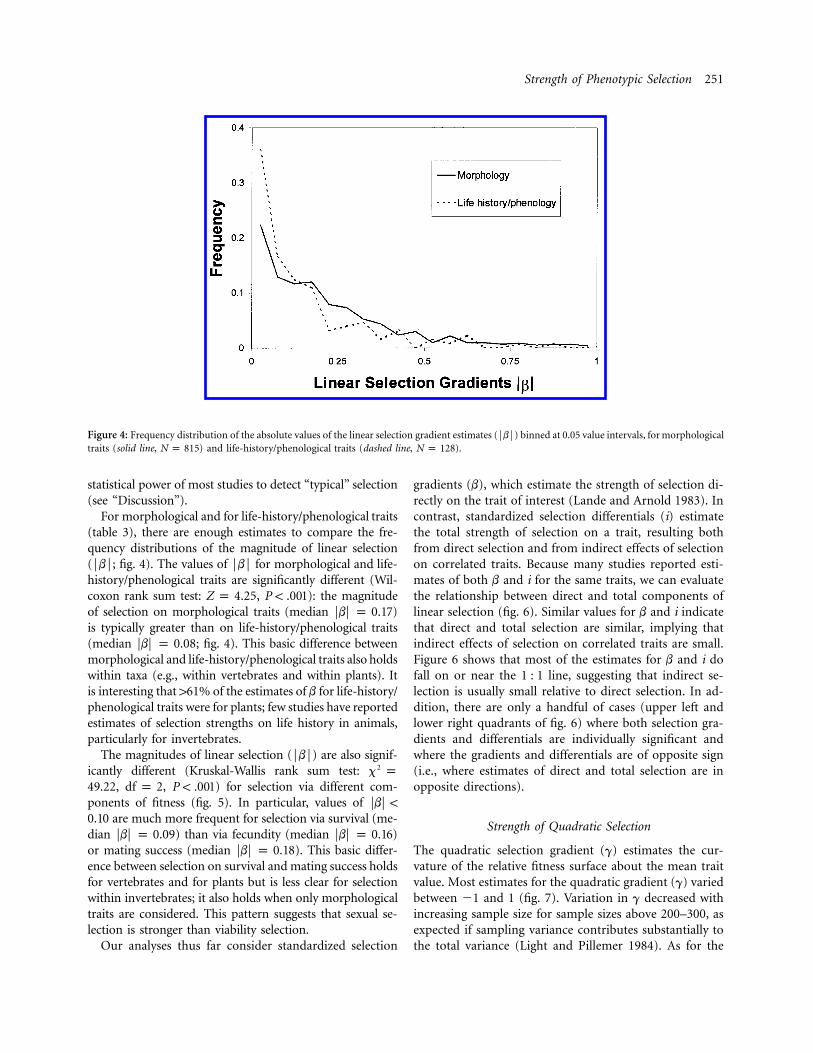
Figure 4: Frequency distribution of the absolute values of the linear selection gradient estimates (FbF) binned at 0.05 value intervals, for morphologicaltraits (solid line, ) and life-history/phenological traits (dashed line, ).N p 815 N p 128
statistical power of most studies to detect “typical” selection(see “Discussion”).
For morphological and for life-history/phenological traits(table 3), there are enough estimates to compare the fre-quency distributions of the magnitude of linear selection(FbF; fig. 4). The values of FbF for morphological and life-history/phenological traits are significantly different (Wil-coxon rank sum test: , ): the magnitudeZ p 4.25 P ! .001of selection on morphological traits (median )FbF p 0.17is typically greater than on life-history/phenological traits(median ; fig. 4). This basic difference betweenFbF p 0.08morphological and life-history/phenological traits also holdswithin taxa (e.g., within vertebrates and within plants). Itis interesting that 161% of the estimates of b for life-history/phenological traits were for plants; few studies have reportedestimates of selection strengths on life history in animals,particularly for invertebrates.
The magnitudes of linear selection (FbF) are also signif-icantly different (Kruskal-Wallis rank sum test: 2x p
, , ) for selection via different com-49.22 df p 2 P ! .001ponents of fitness (fig. 5). In particular, values of FbF !
are much more frequent for selection via survival (me-0.10dian ) than via fecundity (median )FbF p 0.09 FbF p 0.16or mating success (median ). This basic differ-FbF p 0.18ence between selection on survival and mating success holdsfor vertebrates and for plants but is less clear for selectionwithin invertebrates; it also holds when only morphologicaltraits are considered. This pattern suggests that sexual se-lection is stronger than viability selection.
Our analyses thus far consider standardized selection
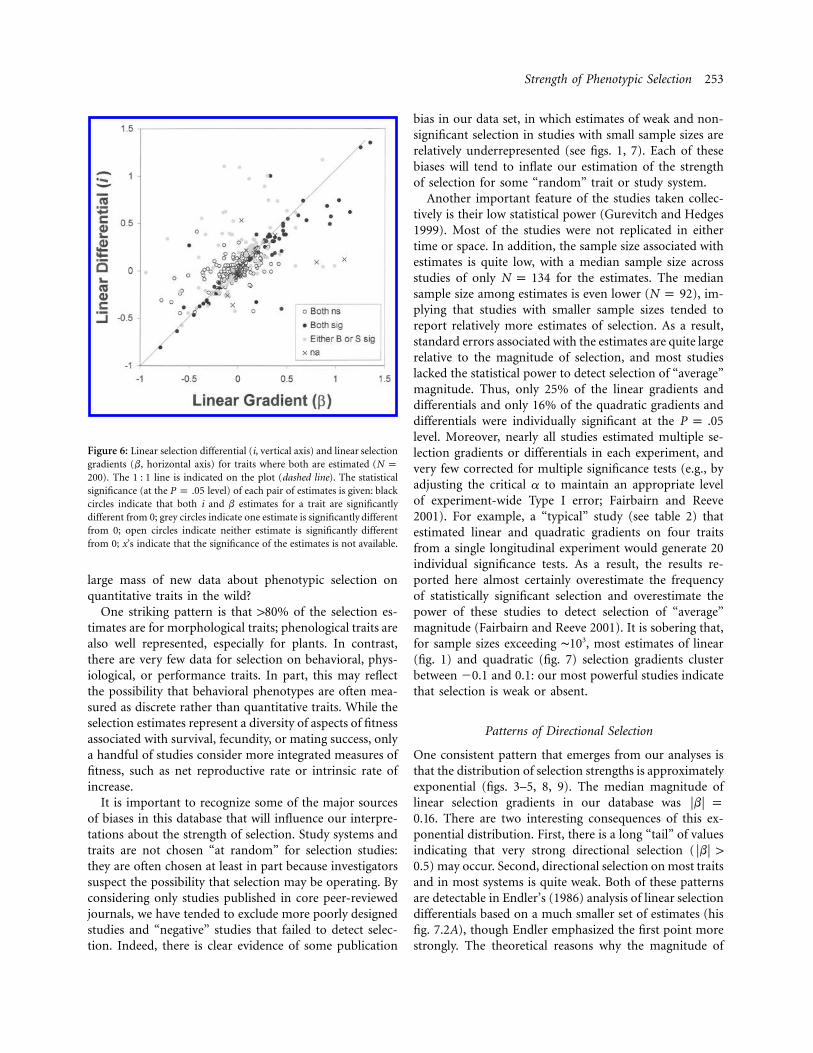
gradients (b), which estimate the strength of selection di-rectly on the trait of interest (Lande and Arnold 1983). Incontrast, standardized selection differentials (i) estimatethe total strength of selection on a trait, resulting bothfrom direct selection and from indirect effects of selectionon correlated traits. Because many studies reported esti-mates of both b and i for the same traits, we can evaluatethe relationship between direct and total components oflinear selection (fig. 6). Similar values for b and i indicatethat direct and total selection are similar, implying thatindirect effects of selection on correlated traits are small.Figure 6 shows that most of the estimates for b and i dofall on or near the 1 : 1 line, suggesting that indirect se-lection is usually small relative to direct selection. In ad-dition, there are only a handful of cases (upper left andlower right quadrants of fig. 6) where both selection gra-dients and differentials are individually significant andwhere the gradients and differentials are of opposite sign(i.e., where estimates of direct and total selection are inopposite directions).
Strength of Quadratic Selection
The quadratic selection gradient (g) estimates the cur-vature of the relative fitness surface about the mean traitvalue. Most estimates for the quadratic gradient (g) variedbetween 21 and 1 (fig. 7). Variation in g decreased withincreasing sample size for sample sizes above 200–300, asexpected if sampling variance contributes substantially tothe total variance (Light and Pillemer 1984). As for the
252 The American Naturalist
Figure 5: Frequency distribution of the absolute values of the linear selection gradient estimates (FbF) binned at 0.05 value intervals, for selectionvia three different components of fitness: fecundity (solid line, ), mating success (short dashes, ), and survival (long dashes,N p 271 N p 407 N p
).288
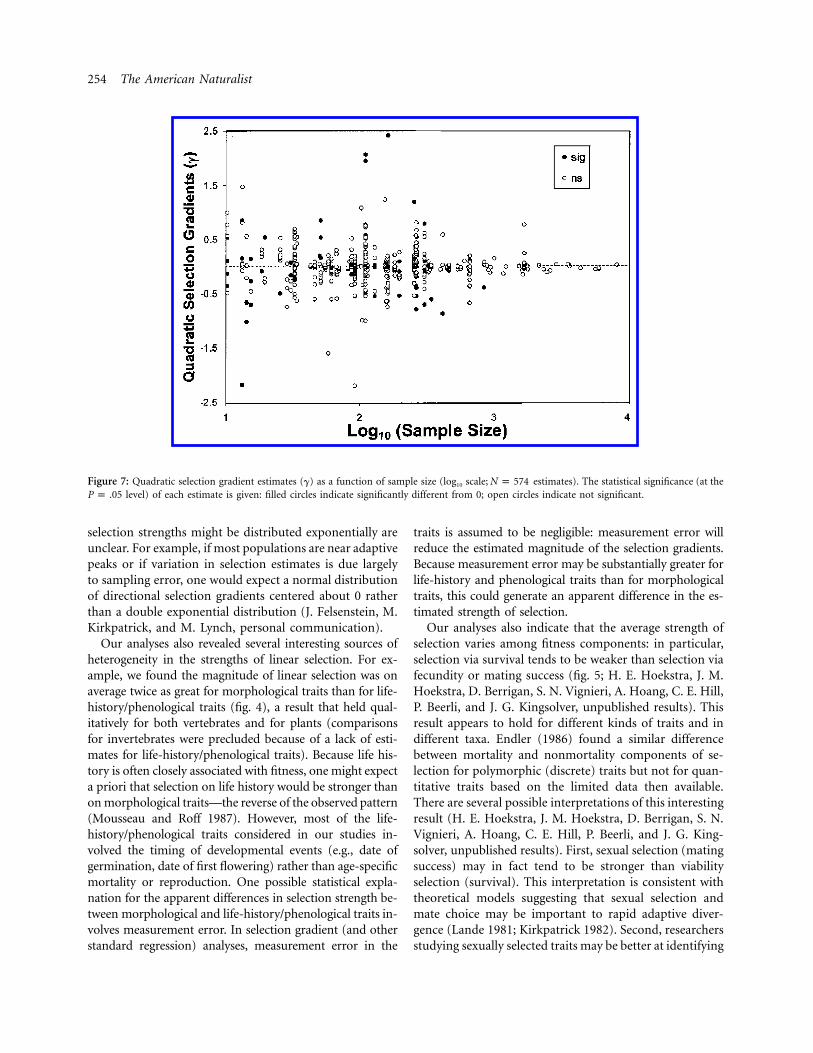
linear gradients, for sample sizes above 1,000, most esti-mates of g cluster between 20.1 and 0.1. Note that, forvery small sample sizes (!30), there are few small or non-significant estimates of g reported, suggesting a strong filedrawer effect in which studies with small sample sizes thatdo not suggest strong selection are unlikely to be submittedand accepted for publication (Iyengar and Greenhouse1988; Palmer 1999). Indeed, some studies stated that es-timates of g were initially computed but were not signif-icant and were therefore not reported in the publishedpaper.
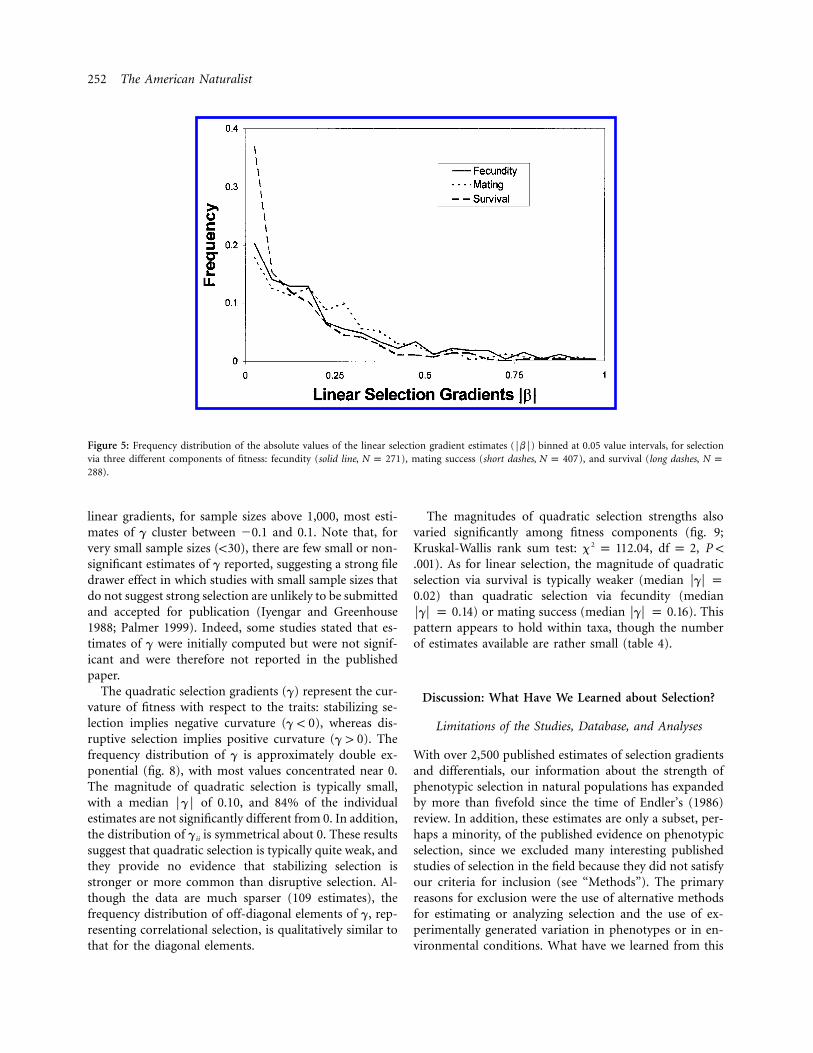
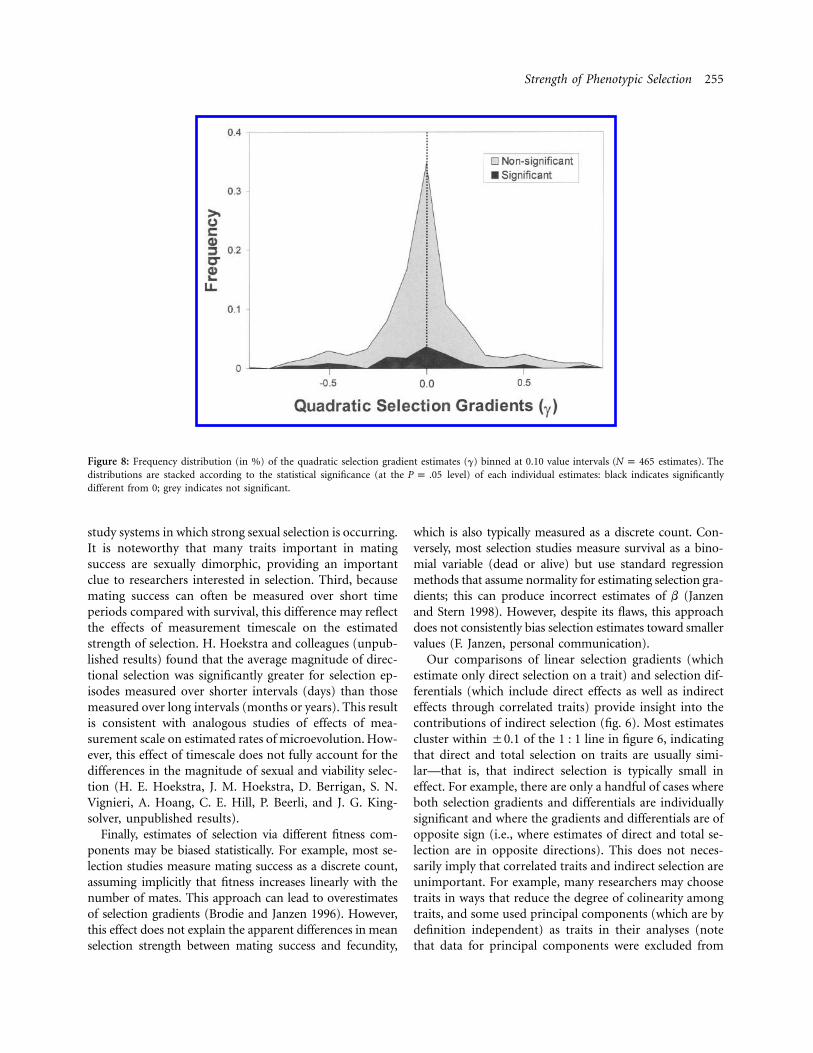
The quadratic selection gradients (g) represent the cur-vature of fitness with respect to the traits: stabilizing se-lection implies negative curvature ( ), whereas dis-g ! 0ruptive selection implies positive curvature ( ). Theg 1 0frequency distribution of g is approximately double ex-ponential (fig. 8), with most values concentrated near 0.The magnitude of quadratic selection is typically small,with a median FgF of 0.10, and 84% of the individualestimates are not significantly different from 0. In addition,the distribution of gii is symmetrical about 0. These resultssuggest that quadratic selection is typically quite weak, andthey provide no evidence that stabilizing selection isstronger or more common than disruptive selection. Al-though the data are much sparser (109 estimates), thefrequency distribution of off-diagonal elements of g, rep-resenting correlational selection, is qualitatively similar tothat for the diagonal elements.
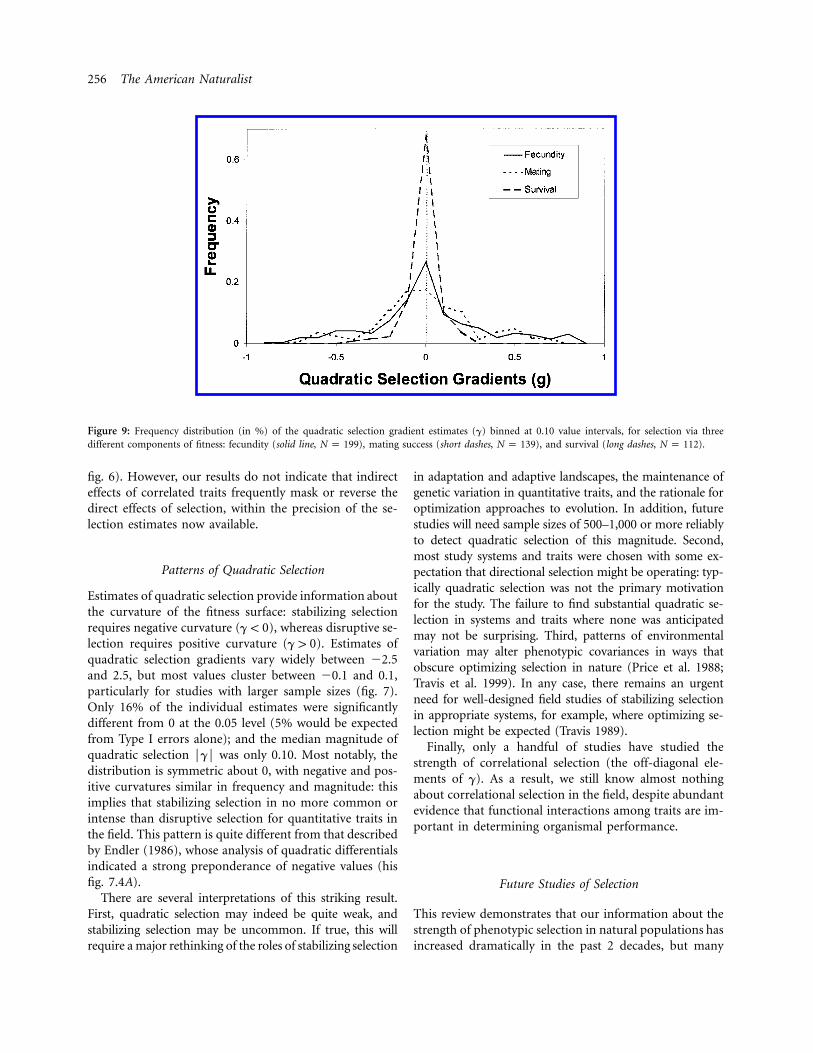
The magnitudes of quadratic selection strengths alsovaried significantly among fitness components (fig. 9;Kruskal-Wallis rank sum test: , ,2x p 112.04 df p 2 P !
). As for linear selection, the magnitude of quadratic.001selection via survival is typically weaker (median FgF p
) than quadratic selection via fecundity (median0.02) or mating success (median ). ThisFgF p 0.14 FgF p 0.16
pattern appears to hold within taxa, though the numberof estimates available are rather small (table 4).
Discussion: What Have We Learned about Selection?
Limitations of the Studies, Database, and Analyses
With over 2,500 published estimates of selection gradientsand differentials, our information about the strength ofphenotypic selection in natural populations has expandedby more than fivefold since the time of Endler’s (1986)review. In addition, these estimates are only a subset, per-haps a minority, of the published evidence on phenotypicselection, since we excluded many interesting publishedstudies of selection in the field because they did not satisfyour criteria for inclusion (see “Methods”). The primaryreasons for exclusion were the use of alternative methodsfor estimating or analyzing selection and the use of ex-perimentally generated variation in phenotypes or in en-vironmental conditions. What have we learned from this
Strength of Phenotypic Selection 253
Figure 6: Linear selection differential (i, vertical axis) and linear selectiongradients (b, horizontal axis) for traits where both are estimated (N p
). The 1 : 1 line is indicated on the plot (dashed line). The statistical200significance (at the level) of each pair of estimates is given: blackP p .05circles indicate that both i and b estimates for a trait are significantlydifferent from 0; grey circles indicate one estimate is significantly differentfrom 0; open circles indicate neither estimate is significantly differentfrom 0; x’s indicate that the significance of the estimates is not available.
large mass of new data about phenotypic selection onquantitative traits in the wild?
One striking pattern is that 180% of the selection es-timates are for morphological traits; phenological traits arealso well represented, especially for plants. In contrast,there are very few data for selection on behavioral, phys-iological, or performance traits. In part, this may reflectthe possibility that behavioral phenotypes are often mea-sured as discrete rather than quantitative traits. While theselection estimates represent a diversity of aspects of fitnessassociated with survival, fecundity, or mating success, onlya handful of studies consider more integrated measures offitness, such as net reproductive rate or intrinsic rate ofincrease.
It is important to recognize some of the major sourcesof biases in this database that will influence our interpre-tations about the strength of selection. Study systems andtraits are not chosen “at random” for selection studies:they are often chosen at least in part because investigatorssuspect the possibility that selection may be operating. Byconsidering only studies published in core peer-reviewedjournals, we have tended to exclude more poorly designedstudies and “negative” studies that failed to detect selec-tion. Indeed, there is clear evidence of some publication
bias in our data set, in which estimates of weak and non-significant selection in studies with small sample sizes arerelatively underrepresented (see figs. 1, 7). Each of thesebiases will tend to inflate our estimation of the strengthof selection for some “random” trait or study system.
Another important feature of the studies taken collec-tively is their low statistical power (Gurevitch and Hedges1999). Most of the studies were not replicated in eithertime or space. In addition, the sample size associated withestimates is quite low, with a median sample size acrossstudies of only for the estimates. The medianN p 134sample size among estimates is even lower ( ), im-N p 92plying that studies with smaller sample sizes tended toreport relatively more estimates of selection. As a result,standard errors associated with the estimates are quite largerelative to the magnitude of selection, and most studieslacked the statistical power to detect selection of “average”magnitude. Thus, only 25% of the linear gradients anddifferentials and only 16% of the quadratic gradients anddifferentials were individually significant at the P p .05level. Moreover, nearly all studies estimated multiple se-lection gradients or differentials in each experiment, andvery few corrected for multiple significance tests (e.g., byadjusting the critical a to maintain an appropriate levelof experiment-wide Type I error; Fairbairn and Reeve2001). For example, a “typical” study (see table 2) thatestimated linear and quadratic gradients on four traitsfrom a single longitudinal experiment would generate 20individual significance tests. As a result, the results re-ported here almost certainly overestimate the frequencyof statistically significant selection and overestimate thepower of these studies to detect selection of “average”magnitude (Fairbairn and Reeve 2001). It is sobering that,for sample sizes exceeding ∼103, most estimates of linear(fig. 1) and quadratic (fig. 7) selection gradients clusterbetween 20.1 and 0.1: our most powerful studies indicatethat selection is weak or absent.
Patterns of Directional Selection
One consistent pattern that emerges from our analyses isthat the distribution of selection strengths is approximatelyexponential (figs. 3–5, 8, 9). The median magnitude oflinear selection gradients in our database was FbF p
. There are two interesting consequences of this ex-0.16ponential distribution. First, there is a long “tail” of valuesindicating that very strong directional selection (FbF 1
) may occur. Second, directional selection on most traits0.5and in most systems is quite weak. Both of these patternsare detectable in Endler’s (1986) analysis of linear selectiondifferentials based on a much smaller set of estimates (hisfig. 7.2A), though Endler emphasized the first point morestrongly. The theoretical reasons why the magnitude of
254 The American Naturalist
Figure 7: Quadratic selection gradient estimates (g) as a function of sample size (log10 scale; estimates). The statistical significance (at theN p 574level) of each estimate is given: filled circles indicate significantly different from 0; open circles indicate not significant.P p .05
selection strengths might be distributed exponentially areunclear. For example, if most populations are near adaptivepeaks or if variation in selection estimates is due largelyto sampling error, one would expect a normal distributionof directional selection gradients centered about 0 ratherthan a double exponential distribution (J. Felsenstein, M.Kirkpatrick, and M. Lynch, personal communication).
Our analyses also revealed several interesting sources ofheterogeneity in the strengths of linear selection. For ex-ample, we found the magnitude of linear selection was onaverage twice as great for morphological traits than for life-history/phenological traits (fig. 4), a result that held qual-itatively for both vertebrates and for plants (comparisonsfor invertebrates were precluded because of a lack of esti-mates for life-history/phenological traits). Because life his-tory is often closely associated with fitness, one might expecta priori that selection on life history would be stronger thanon morphological traits—the reverse of the observed pattern(Mousseau and Roff 1987). However, most of the life-history/phenological traits considered in our studies in-volved the timing of developmental events (e.g., date ofgermination, date of first flowering) rather than age-specificmortality or reproduction. One possible statistical expla-nation for the apparent differences in selection strength be-tween morphological and life-history/phenological traits in-volves measurement error. In selection gradient (and otherstandard regression) analyses, measurement error in the
traits is assumed to be negligible: measurement error willreduce the estimated magnitude of the selection gradients.Because measurement error may be substantially greater forlife-history and phenological traits than for morphologicaltraits, this could generate an apparent difference in the es-timated strength of selection.
Our analyses also indicate that the average strength ofselection varies among fitness components: in particular,selection via survival tends to be weaker than selection viafecundity or mating success (fig. 5; H. E. Hoekstra, J. M.Hoekstra, D. Berrigan, S. N. Vignieri, A. Hoang, C. E. Hill,P. Beerli, and J. G. Kingsolver, unpublished results). Thisresult appears to hold for different kinds of traits and indifferent taxa. Endler (1986) found a similar differencebetween mortality and nonmortality components of se-lection for polymorphic (discrete) traits but not for quan-titative traits based on the limited data then available.There are several possible interpretations of this interestingresult (H. E. Hoekstra, J. M. Hoekstra, D. Berrigan, S. N.Vignieri, A. Hoang, C. E. Hill, P. Beerli, and J. G. King-solver, unpublished results). First, sexual selection (matingsuccess) may in fact tend to be stronger than viabilityselection (survival). This interpretation is consistent withtheoretical models suggesting that sexual selection andmate choice may be important to rapid adaptive diver-gence (Lande 1981; Kirkpatrick 1982). Second, researchersstudying sexually selected traits may be better at identifying
Strength of Phenotypic Selection 255
Figure 8: Frequency distribution (in %) of the quadratic selection gradient estimates (g) binned at 0.10 value intervals ( estimates). TheN p 465distributions are stacked according to the statistical significance (at the level) of each individual estimates: black indicates significantlyP p .05different from 0; grey indicates not significant.
study systems in which strong sexual selection is occurring.It is noteworthy that many traits important in matingsuccess are sexually dimorphic, providing an importantclue to researchers interested in selection. Third, becausemating success can often be measured over short timeperiods compared with survival, this difference may reflectthe effects of measurement timescale on the estimatedstrength of selection. H. Hoekstra and colleagues (unpub-lished results) found that the average magnitude of direc-tional selection was significantly greater for selection ep-isodes measured over shorter intervals (days) than thosemeasured over long intervals (months or years). This resultis consistent with analogous studies of effects of mea-surement scale on estimated rates of microevolution. How-ever, this effect of timescale does not fully account for thedifferences in the magnitude of sexual and viability selec-tion (H. E. Hoekstra, J. M. Hoekstra, D. Berrigan, S. N.Vignieri, A. Hoang, C. E. Hill, P. Beerli, and J. G. King-solver, unpublished results).
Finally, estimates of selection via different fitness com-ponents may be biased statistically. For example, most se-lection studies measure mating success as a discrete count,assuming implicitly that fitness increases linearly with thenumber of mates. This approach can lead to overestimatesof selection gradients (Brodie and Janzen 1996). However,this effect does not explain the apparent differences in meanselection strength between mating success and fecundity,
which is also typically measured as a discrete count. Con-versely, most selection studies measure survival as a bino-mial variable (dead or alive) but use standard regressionmethods that assume normality for estimating selection gra-dients; this can produce incorrect estimates of b (Janzenand Stern 1998). However, despite its flaws, this approachdoes not consistently bias selection estimates toward smallervalues (F. Janzen, personal communication).
Our comparisons of linear selection gradients (whichestimate only direct selection on a trait) and selection dif-ferentials (which include direct effects as well as indirecteffects through correlated traits) provide insight into thecontributions of indirect selection (fig. 6). Most estimatescluster within 50.1 of the 1 : 1 line in figure 6, indicatingthat direct and total selection on traits are usually simi-lar—that is, that indirect selection is typically small ineffect. For example, there are only a handful of cases whereboth selection gradients and differentials are individuallysignificant and where the gradients and differentials are ofopposite sign (i.e., where estimates of direct and total se-lection are in opposite directions). This does not neces-sarily imply that correlated traits and indirect selection areunimportant. For example, many researchers may choosetraits in ways that reduce the degree of colinearity amongtraits, and some used principal components (which are bydefinition independent) as traits in their analyses (notethat data for principal components were excluded from
256 The American Naturalist
Figure 9: Frequency distribution (in %) of the quadratic selection gradient estimates (g) binned at 0.10 value intervals, for selection via threedifferent components of fitness: fecundity (solid line, ), mating success (short dashes, ), and survival (long dashes, ).N p 199 N p 139 N p 112
fig. 6). However, our results do not indicate that indirecteffects of correlated traits frequently mask or reverse thedirect effects of selection, within the precision of the se-lection estimates now available.
Patterns of Quadratic Selection
Estimates of quadratic selection provide information aboutthe curvature of the fitness surface: stabilizing selectionrequires negative curvature ( ), whereas disruptive se-g ! 0lection requires positive curvature ( ). Estimates ofg 1 0quadratic selection gradients vary widely between 22.5and 2.5, but most values cluster between 20.1 and 0.1,particularly for studies with larger sample sizes (fig. 7).Only 16% of the individual estimates were significantlydifferent from 0 at the 0.05 level (5% would be expectedfrom Type I errors alone); and the median magnitude ofquadratic selection FgF was only 0.10. Most notably, thedistribution is symmetric about 0, with negative and pos-itive curvatures similar in frequency and magnitude: thisimplies that stabilizing selection in no more common orintense than disruptive selection for quantitative traits inthe field. This pattern is quite different from that describedby Endler (1986), whose analysis of quadratic differentialsindicated a strong preponderance of negative values (hisfig. 7.4A).
There are several interpretations of this striking result.First, quadratic selection may indeed be quite weak, andstabilizing selection may be uncommon. If true, this willrequire a major rethinking of the roles of stabilizing selection
in adaptation and adaptive landscapes, the maintenance ofgenetic variation in quantitative traits, and the rationale foroptimization approaches to evolution. In addition, futurestudies will need sample sizes of 500–1,000 or more reliablyto detect quadratic selection of this magnitude. Second,most study systems and traits were chosen with some ex-pectation that directional selection might be operating: typ-ically quadratic selection was not the primary motivationfor the study. The failure to find substantial quadratic se-lection in systems and traits where none was anticipatedmay not be surprising. Third, patterns of environmentalvariation may alter phenotypic covariances in ways thatobscure optimizing selection in nature (Price et al. 1988;Travis et al. 1999). In any case, there remains an urgentneed for well-designed field studies of stabilizing selectionin appropriate systems, for example, where optimizing se-lection might be expected (Travis 1989).
Finally, only a handful of studies have studied thestrength of correlational selection (the off-diagonal ele-ments of g). As a result, we still know almost nothingabout correlational selection in the field, despite abundantevidence that functional interactions among traits are im-portant in determining organismal performance.
Future Studies of Selection
This review demonstrates that our information about thestrength of phenotypic selection in natural populations hasincreased dramatically in the past 2 decades, but many

Strength of Phenotypic Selection 257
important issues about selection remain unresolved. Ouranalyses suggest some specific directions for future study.
First, higher methodological standards are needed for fu-ture studies of selection (Gurevitch and Hedges 1999; Fair-bairn and Reeve 2001). Most studies to date are unreplicatedand have sample sizes too small to detect selection of typicalmagnitude. To reduce problems with Type I errors, signif-icance testing of selection gradients and differentials shouldadjust for multiple tests within studies. Future studiesshould also report phenotypic variances and covariancesamong traits and standard errors on selection differentialsso that appropriate meta-analyses can be conducted.
Second, we have abundant information about direc-tional selection on morphological traits. By contrast, se-lection on quantitative behavioral and physiological traitsremains largely unknown and should be the focus of futurestudies.
Third, to address the apparent differences in selectionstrength among fitness components, studies are neededthat estimate the strength of both sexual and viability se-lection at similar timescales on the same traits. Only ahandful of such studies are currently available.
Fourth, much more effort is needed to estimate thestrength of quadratic selection in systems and traits whereoptimizing or correlational selection is anticipated basedon functional analyses (Travis 1989). Because the mag-nitude of quadratic selection may be relatively small, largersample sizes than in past studies may be required.
Finally, our analyses and comparisons were only possiblebecause selection data have been reported in a commonmetric—that is, in standardized selection differentials andgradients. However, in many cases estimation and visu-alization of fitness surfaces may be more informative forunderstanding selection in particular systems (Schluterand Nychka 1994; Brodie et al. 1995). We suggest thatfuture studies report both standardized metrics (differ-entials or gradients) and fitness surfaces, so that both spe-cific patterns of selection in particular systems and generalpatterns of selection across systems can be evaluated.
Acknowledgments
We thank S. A. Combes, G. W. Gilchrist, T. R. Hammon,C. M. Hess, K. M. Kay, J. Ramsey, M. C. Silva, E. K. Stein-berg, K. L. Ward, and other members of the Selection Squad(Zoology 571, University of Washington, 1998) for theirhelp in reviewing the literature. The thoughtful inputs ofD. Schemske were critical to many stages of this project. S.Arnold, E. Brodie, S. Edwards, D. Fairbairn, N. Gotelli, R.Huey, S. Stearns, and J. Travis provided useful suggestionson points of analysis and interpretation. After publication,the database described in this article (appendix) will beposted at http://www.bio.unc.edu/faculty/kingsolver/ andon the American Naturalist Web site. Research supportedin part by National Science Foundation grant IBN 9818431to J.G.K.
APPENDIX
Table A1: Fields included for each record included in the selection database for this study
Field Field name Description Values
1 Species Genus and species …2 Taxon.group Taxonomic group I p invertebrate, P p plant, V p vertebrate3 Studytype Type of study C p cross-sectional, L p longitudinal4 #tmp_reps No. of temporal replicates …5 #spc_reps No. of spatial replicates …6 Dur_rep Duration of the replicate In days7 RepID ID no. of the replicate …8 Traitclass Trait type MO p morphology, LH p life history or phenology, BE p
behavior, PC p principal component, I p interaction9 Traitname Name of trait …10 Ttl#trait Total no. of traits …11 Fit.comp Fitness component F p fecundity/fertility, M p mating success, S p survival,
N p net reproductive rate, T p aggregate12 Ttl#meas Total no. of fitness measures …13 Measure Name of fitness measure …14 Grad.linear.value Linear gradient, b …15 Grad.linear.StErr SE of b …16 Grad.linear.p-value P value of b …17 Grad.quad.value Quadratic gradient, g …
258 The American Naturalist
Table A1 (Continued)
Field Field name Description Values
18 Grad.quad.StErr SE of g …19 Grad.quad.p-value P value of g …20 Diff.linear.value Linear differential, i …21 Diff.linear.StErr SE of i …22 Diff.linear.p-value P value of i …23 Diff.quad.value Quadratic differential, j …24 Diff.quad.StErr SE of j …25 Diff.quad.p-value P value of j …26 N Sample size …27 Subset_popn Subset of population E.g., M p males, F p females, J p juveniles, A p adults28 Authors Authors of study …29 Year Year of publication …30 Journal Journal name …31 Vol:p–p Volume and page no. …32 StudyID Study ID …
Note: See “Methods.” Values common to all fields: NA p not available or not applicable; O p other; NS p not significant.
Studies Included in the Selection Database
Alatalo, R. V., and A. Lundberg. 1986. Heritability andselection on tarsus length in the pied flycatcher (Ficedulahypoleuca). Evolution 40:574–583.
Alatalo, R. V., L. Gustafsson, and A. Lundberg. 1990.Phenotypic selection on heritable size traits—environmental variance and genetic response. AmericanNaturalist 135:464–471.
Anholt, B. R. 1991. Measuring selection on a populationof damselflies with a manipulated phenotype. Evolution45:1091–1106.
Arnold, S. J., and M. J. Wade. 1984. On the measurementof natural and sexual selection: applications. Evolution38:720–734.
Arnqvist, G. 1992. Spatial variation in selective regimes:sexual selection in the water strider, Gerris odontogaster.Evolution 46:914–929.
Bjorklund, M., and M. Linden. 1993. Sexual size dimor-phism in the great tit (Parus major) in relation to historyand current selection. Journal of Evolutionary Biology6:397–415.
Brodie, E. D. 1992. Correlational selection for color patternand antipredator behavior in the garter snake, Tham-nophis ordinoides. Evolution 46:1284–1298.
Campbell, D. R. 1991. Effects of floral traits on sequentialcomponents of fitness in Ipomopsis aggregata. AmericanNaturalist 137:713–737.
Campbell, D. R., N. M. Waser, M. V. Price, E. A. Lynch,and R. J. Mitchell. 1991. Components of phenotypicselection: pollen export and lower corolla width inIpomopsis aggregata. Evolution 45:1458–1467.
Campbell, D. R., N. M. Waser, and E. J. Melendez-Acker-man. 1997. Analyzing pollinator-mediated selection in aplant hybrid zone: hummingbird visitation patterns onthree spatial scales. American Naturalist 149:295–315.
Conner, J. 1988. Field measurements of natural and sexualselection in the fungus beetle, Bolitotherus cornutus.Evolution 42:736–749.
Conner, J. K., and S. Rush. 1997. Measurements of selec-tion of floral traits in black mustard, Brassica nigra.Journal of Evolutionary Biology 10:327–335.
Conner, J. K., S. Rush, and P. Jennetten. 1996. Measure-ment of natural selection on floral traits in wild radish(Raphanus raphanistrum). I. Selection through lifetimefemale fitness. Evolution 50:1127–1136.
Conner, J. K., S. Rush, S. Kercher, and P. Jennetten. 1996.Measurements of natural selection on floral traits in wildradish (Raphanus raphanistrum). II. Selection throughlifetime male and total fitness. Evolution 50:1137–1146.
Downhower, J. F., L. S. Blumer, and L. Brown. 1987. Sea-sonal variation in sexual selection in the mottled sculpin.Evolution 41:1386–1394.
Fairbairn, D. J., and R. F. Preziosi. 1996. Sexual selectionand the evolution of sexual size dimorphism in the waterstrider, Aquarius remigis. Evolution 50:1549–1559.
Gibbs, H. L. 1988. Heritability and selection on clutch sizein Darwin’s medium ground finches (Geospiza fortis).Evolution 42:750–762.
Grant, B. R. 1985. Selection on bill characteristics in apopulation of Darwin finches, Geospiza conirostris, onIsla Genovesa, Galapagos. Evolution 39:523–532.
Grant, B. R., and P. R. Grant. 1989. Natural selection in
Strength of Phenotypic Selection 259
a population of Darwin finches. American Naturalist133:377–393.
———. 1993. Evolution of Darwin finches caused by arare climatic event. Proceedings of the Royal Society ofLondon B, Biological Sciences 251:111–117.
Grether, G. F. 1996. Intersexual competition alone favorsa sexually dimorphic ornament in the rubyspot dam-selfly Hetaerina americana. Evolution 50:1949–1957.
———. 1996. Sexual selection and survival selection onwing coloration and body size in the rubyspot damselflyHetaerina americana. Evolution 50:1939–1948.
Harvey, A. W. 1990. Sexual differences in contemporaryselection acting on size in the hermit crab, Clibanariusdigueti. American Naturalist 136:292–304.
Hews, D. K. 1990. Examining hypotheses generated byfield measures of sexual selection on male lizards, Utapalmeri. Evolution 44:1956–1966.
Hoglund, J., and L. Saterburg. 1989. Sexual selection incommon toads—correlates with age and body size.Journal of Evolutionary Biology 2:367–372.
Johnston, M. O. 1991. Natural selection on floral traits intwo species of Lobelia with different pollinators. Evo-lution 45:1468–1479.
Jones, R., and D. C. Culver. 1989. Evidence for selectionon sensory structures in a cave population of Gammarusminus (Amphipoda). Evolution 43:689–693.
Kaar, P., J. Jokela, T. Helle, and I. Kojola. 1996. Direct andcorrelative phenotypic selection on life-history traits inthree pre-industrial human populations. Proceedings ofthe Royal Society of London B, Biological Sciences 263:1475–1480.
Kalisz, S. 1986. Variable selection on the timing of ger-mination in Collinsia verna (Scrophulariaceae). Evolu-tion 40:479–491.
Kelly, C. A. 1992. Spatial and temporal variation in selec-tion on correlated life history traits and plant size inChamae crista fasciculata. Evolution 46:1658–1673.
King, R. B. 1993. Color pattern variation in Lake Erie watersnakes: prediction and measurements of natural selec-tion. Evolution 47:1818–1833.
Kingsolver, J. G. 1995. Viability selection on seasonallypolyphenic traits: wing melanin pattern in western whitebutterflies. Evolution 49:932–941.
Koenig, W. D., and S. S. Albano. 1987. Lifetime repro-ductive success, selection, and the opportunity for se-lection in the white-tailed skimmer, Plathemis lydia(Odonata, Libellulidae). Evolution 41:22–36.
Linden, M., L. Gustafsson, and T. Part. 1992. Selection onfledging mass in the collared flycatcher and the greattit. Ecology 73:336–343.
Martin, T. E. 1998. Are microhabitat preferences of co-existing species under selection and adaptive? Ecology79:656–670.
Mitchell-Olds, T., and J. Bergelson. 1990. Statistical ge-netics of an annual plant, Impatiens capensis. II. Naturalselection. Genetics 124:417–421.
Møller, A. P. 1991. Viability is positively related to degreeof ornamentation in male swallows. Proceedings of theRoyal Society of London B, Biological Sciences 243:145–148.
Moore, A. J. 1990. The evolution of sexual dimorphism bysexual selection: the separate effects of intrasexual selec-tion and intersexual selection. Evolution 44:315–331.
Morgan, M. T., and D. J. Schoen. 1997. Selection on re-productive characters: floral morphology in Asclepiassyriaca. Heredity 79:433–441.
Nunez-Farfan, J., and R. Dirzo. 1994. Evolutionary ecologyof Datura stramonium L. in central Mexico: natural se-lection for resistance to herbivorous insects. Evolution48:423–436.
O’Connell, L. M., and M. O. Johnston. 1998. Male andfemale pollination success in a deceptive orchid, a se-lection study. Ecology 79:1246–1260.
O’Neil, P. 1997. Natural selection on genetically correlatedphenological characters in Lythrum salicaria L. (Lyth-raceae). Evolution 51:267–274.
Preziosi, R. F., and D. J. Fairbairn. 1996. Sexual size di-morphism and selection in the wild in the waterstriderAquarius remigis: body size, components of body sizeand male mating success. Journal of Evolutionary Bi-ology 9:317–336.
———. 1997. Sexual size dimorphism and selection in thewild in the water strider, Aquarius remigis: lifetime fe-cundity selection on female total length and its com-ponents. Evolution 51:467–474.
Price, D. K. 1996. Sexual selection, selection load andquantitative genetics of zebra finch bill colour. Pro-ceedings of the Royal Society of London B, BiologicalSciences 263:217–221.
Price, T. 1984. Sexual selection on body size, territory, andplumage variables in a population of Darwin’s finches.Evolution 38:327–341.
Price, T. D. 1984. The evolution of sexual dimorphism inDarwin’s finches. American Naturalist 123:500–518.
Sabat, A. M., and J. D. Ackerman. 1996. Fruit set in adeceptive orchid: the effect of flowering phenology, dis-play size, and local floral abundance. American Journalof Botany 83:1181–1186.
Santos, M., A. Ruiz, J. E. Quezadadiaz, A. Barbadilla, andA. Fontdevila. 1992. The evolutionary history of Dro-sophila buzzatii. 20. Positive phenotypic covariance be-tween field and adult fitness components and body size.Journal of Evolutionary Biology 5:403–422.
Schemske, D. W., and C. C. Horvitz. 1989. Temporal var-iation in selection on a floral character. Evolution 43:461–465.
260 The American Naturalist
Schluter, D., and J. N. M. Smith. 1986. Natural selectionon beak and body size in the song sparrow. Evolution40:221–231.
Simms, E. L. 1990. Examining selection on the multivariatephenotype: plant resistance to herbivores. Evolution 44:1177–1188.
Smith, T. B. 1990. Natural selection on bill characteristicsin the two bill morphs of the African finch, Pyrenestesostrinus. Evolution 44:832–842.
Thessing, A., and J. Ekman. 1994. Selection on the ge-netical and environmental components of tarsal growthin juvenile willow tits (Parus montanus). Journal of Evo-lutionary Biology 7:713–726.
Van den Berghe, E. P., and M. R. Gross. 1989. Naturalselection resulting from female breeding competition ina Pacific salmon (Coho: Oncorhynchuskisutch). Evo-lution 43:125–140.
Ward, P. I. 1988. Sexual selection, natural selection, andbody size in Gammarus pulex (Amphipoda). AmericanNaturalist 131:348–359.
Weatherhead, P. J., and R. G. Clark. 1994. Natural selectionand sexual size dimorphism in red-winged blackbirds.Evolution 48:1071–1079.
Weatherhead, P. J., H. Greenwood, and R. G. Clark. 1987.Natural selection and sexual selection on body size inredwinged blackbirds. Evolution 41:1401–1403.
Willis, J. H. 1996. Measures of phenotypic selection arebiased by partial inbreeding. Evolution 50:1501–1511.
Wilson, P. 1995. Selection for pollination success and themechanical fit of Impatiens flowers around bumblebeebodies. Biological Journal of the Linnean Society 55:355–383.
Zeh, D. W., J. Zeh, A. Bermingham, and E. Bermingham.1997. The evolution of polyandry. 2. Post-copulatorydefences against genetic incompatibility. Proceedings ofthe Royal Society of London B, Biological Sciences 264:119–125.
Zuk, M. 1988. Parasite load, body size, and age of wildcaught male field crickets (Orthoptera: Gryllidae): ef-fects on sexual selection. Evolution 42:969–976.
Literature Cited
Arnold, S. J., and M. J. Wade. 1984a. On the measurementof natural and sexual selection: applications. Evolution38:720–734.
———. 1984b. On the measurement of natural and sexualselection: theory. Evolution 38:709–719.
Arnqvist, G., and D. Wooster. 1995. Meta-analysis—synthesizing research findings in ecology and evolution.Trends in Ecology & Evolution 10:236–240.
Brodie, E. D., and F. J. Janzen. 1996. On the assignment
of fitness values in statistical analyses of selection. Evo-lution 50:437–442.
Brodie, E. D. I., A. J. Moore, and F. J. Janzen. 1995. Vi-sualizing and quantifying natural selection. Trends inEcology & Evolution 10:313–318.
Endler, J. A. 1986. Natural selection in the wild. PrincetonUniversity Press, Princeton, N.J.
Fairbairn, D. J., and J. P. Reeve. 2001. Natural selection.In C. Fox, D. A. Roff, and D. J. Fairbairn, eds. Evolu-tionary ecology: concepts and case studies. Oxford Uni-versity Press, London (in press).
Gontard-Danek, M. C., and A. P. Møller. 1999. Thestrength of sexual selection: a meta-analysis of bird stud-ies. Behavioral Ecology 10:476–486.
Gurevitch, J., and L. V. Hedges. 1999. Statistical issues inecological meta-analyses. Ecology 80:1142–1149.
Hedges, V. L., and I. Olkin. 1985. Statistical methods formeta-analysis. Academic Press, Orlando, Fla.
Iyengar, S., and J. B. Greenhouse. 1988. Selection modelsand the file drawer problem. Statistical Science 3:109–135.
Janzen, F. J., and H. S. Stern. 1998. Logistic regression forempirical studies of multivariate selection. Evolution 52:1564–1571.
Kirkpatrick, M. 1982. Sexual selection and the evolutionof female choice. Evolution 36:1–12.
Lande, R. 1979. Quantitative genetic analysis of multivar-iate evolution, applied to brain : body size allometry.Evolution 33:402–416.
———. 1981. Models of speciation by sexual selection onpolygenic traits. Proceedings of the National Academyof Sciences of the USA 78:3721–3725.
Lande, R., and S. J. Arnold. 1983. The measurement ofselection on correlated characters. Evolution 37:1210–1226.
Light, R. J., and D. B. Pillemer. 1984. Summing up: thescience of reviewing research. Harvard University Press,Cambridge, Mass.
Mitchell-Olds, T., and R. G. Shaw. 1987. Regression anal-ysis of natural selection: statistical inference and bio-logical interpretation. Evolution 41:1149–1151.
Mousseau, T. A., and D. A. Roff. 1987. Natural selectionand the heritability of fitness components. Heredity 59:181–197.
Palmer, A. R. 1999. Detecting publication bias in meta-analyses: a case study of fluctuating asymmetry and sex-ual selection. American Naturalist 154:220–233.
Price, T. M., M. Kirkpatrick, and S. J. Arnold. 1988. Di-rectional selection and the evolution of breeding datein birds. Science (Washington, D.C.) 240:798–799.
Primack, R. B., and H. Kang. 1989. Measuring fitness andnatural selection in wild plant populations. Annual Re-view of Ecology and Systematics 20:367–396.

Strength of Phenotypic Selection 261
Schluter, D., and D. Nychka. 1994. Exploring fitness sur-faces. American Naturalist 143:597–616.
Travis, J. 1989. The role of optimizing selection in naturalpopulations. Annual Review of Ecology and Systematics20:279–296.
Travis, J., M. G. McManus, and C. F. Baer. 1999. Sourcesof variation in physiological phenotypes and their evo-lutionary significance. American Zoologist 39:422–433.
Editor: Joseph Travis