A quantum chemical and statistical study of flavonoid compounds with anti-HIV activity
10
Original article A quantum chemical and statistical study of flavonoid compounds (flavones) with anti-HIV activity Jaime Souza, Jr a , Regina Helena de Almeida Santos a , Ma ´rcia Miguel Castro Ferreira b , Fa ´bio Alberto Molfetta a , Ademir Joa ˜o Camargo a , Ka ´thia Maria Hono ´rio a , Albe ´rico Borges Ferreira da Silva a, * a Departamento de Quı ´mica e Fı ´sica Molecular, Instituto de Quı ´mica de Sa ˜o Carlos, Universidade de Sa ˜o Paulo, CP 780, 13560-970 Sa ˜o Carlos, SP, Brazil b lnstituto de Quı ´mica, Universidade de Campinas, CP 6154, 13081-970 Campinas, SP, Brazil Received 6 March 2003; received in revised form 20 June 2003; accepted 23 June 2003 Abstract The molecular orbital semi-empirical method AM1 was employed to calculate a set of molecular properties (variables) of 22 flavonoid compounds (flavones) with anti-HIV-1 activity and nine new compounds were proposed for anti-HIV-1 activity prediction. Pattern recognition techniques, principal component analysis (PCA), hierarchical cluster analysis (HCA), stepwise discriminant analysis (SDA) and K-nearest neighbor (KNN), were employed in order to reduce dimensionality and investigate which subset of variables could be more effective for classifying the flavones according to their degree of anti-HIV-1 activity. The PCA, HCA, SDA and KNN studies showed that the variables log P (partition coefficient), molecular volume (VOL) and electron affinity (EA) are responsible for the separation between anti-HIV-1 active and inactive compounds. The prediction study was done with a new set of nine analog compounds by using the PCA, HCA, SDA and KNN methods and only one of them was predicted as active against HIV-1. # 2003 E ´ ditions scientifiques et me ´dicales Elsevier SAS. All rights reserved. Keywords: Flavones; Anti-HIV-1 activity; AM1; Principal component analysis; Hierarchical cluster analysis; Stepwise discriminant analysis; K- nearest neighbor 1. Introduction Human immunodeficiency virus type 1 (HIV-1) is the causative agent of acquired immunodeficiency syn- drome (AIDS) which is characterized as a systemic and fatal disorder [1,2]. Since the start of global HIV/ AIDS epidemic, more than 30 million people can be infected with HIV [3]. After viral RNA is processed by the reverse transcriptase, the life cycle of the virus proceeds with the integration of the double-stranded DNA transcript into the host genome, a process that is mediated by the retroviral integrase [4]. Integrase presents an attractive possibility as an antiviral target because host cells do not make or require such enzymes. Although some HIV gene products may be expressed in the absence of integrase [5] and the possibility of HIV replication in some cell types in the absence of integrase has not been eliminated, recent evidences show that HIV replication in T-lymphoid cells requires integrase func- tions [6,7]. Among several compounds that present anti-HIV-1 activity, flavone compounds have been very studied due to their activity during the inhibition process of HIV-1 integrase [4]. A plausible view of the inhibition of integrase by flavones would be that these compounds bind to enzyme sites that normally interact with DNA bases blocking the action of HIV integrase [4]. The flavones are classified as flavonoid compounds and consist of three aromatic rings with polar groups appended at various positions [8]. The planarity, ar- omaticity and polarity may allow these compounds to bind by stacking with adenine or guanine, or to compete * Corresponding author. E-mail address: [email protected] (A.B.F. da Silva). European Journal of Medicinal Chemistry 38 (2003) 929 /938 www.elsevier.com/locate/ejmech 0223-5234/03/$ - see front matter # 2003 E ´ ditions scientifiques et me ´dicales Elsevier SAS. All rights reserved. doi:10.1016/j.ejmech.2003.06.001
-
Upload
independent -
Category
Documents
-
view
1 -
download
0
Transcript of A quantum chemical and statistical study of flavonoid compounds with anti-HIV activity

European Journal of Medicinal Chemistry 38 (2003) 929�/938
www.elsevier.com/locate/ejmech
Original article
A quantum chemical and statistical study of flavonoid compounds(flavones) with anti-HIV activity
Jaime Souza, Jr a, Regina Helena de Almeida Santos a,Marcia Miguel Castro Ferreira b, Fabio Alberto Molfetta a, Ademir Joao Camargo a,
Kathia Maria Honorio a, Alberico Borges Ferreira da Silva a,*a Departamento de Quımica e Fısica Molecular, Instituto de Quımica de Sao Carlos, Universidade de Sao Paulo, CP 780,
13560-970 Sao Carlos, SP, Brazilb lnstituto de Quımica, Universidade de Campinas, CP 6154, 13081-970 Campinas, SP, Brazil
Received 6 March 2003; received in revised form 20 June 2003; accepted 23 June 2003
Abstract
The molecular orbital semi-empirical method AM1 was employed to calculate a set of molecular properties (variables) of 22
flavonoid compounds (flavones) with anti-HIV-1 activity and nine new compounds were proposed for anti-HIV-1 activity
prediction. Pattern recognition techniques, principal component analysis (PCA), hierarchical cluster analysis (HCA), stepwise
discriminant analysis (SDA) and K-nearest neighbor (KNN), were employed in order to reduce dimensionality and investigate
which subset of variables could be more effective for classifying the flavones according to their degree of anti-HIV-1 activity. The
PCA, HCA, SDA and KNN studies showed that the variables log P (partition coefficient), molecular volume (VOL) and electron
affinity (EA) are responsible for the separation between anti-HIV-1 active and inactive compounds. The prediction study was done
with a new set of nine analog compounds by using the PCA, HCA, SDA and KNN methods and only one of them was predicted as
active against HIV-1.
# 2003 Editions scientifiques et medicales Elsevier SAS. All rights reserved.
Keywords: Flavones; Anti-HIV-1 activity; AM1; Principal component analysis; Hierarchical cluster analysis; Stepwise discriminant analysis; K-
nearest neighbor
1. Introduction
Human immunodeficiency virus type 1 (HIV-1) is the
causative agent of acquired immunodeficiency syn-
drome (AIDS) which is characterized as a systemic
and fatal disorder [1,2]. Since the start of global HIV/
AIDS epidemic, more than 30 million people can be
infected with HIV [3]. After viral RNA is processed by
the reverse transcriptase, the life cycle of the virus
proceeds with the integration of the double-stranded
DNA transcript into the host genome, a process that is
mediated by the retroviral integrase [4]. Integrase
presents an attractive possibility as an antiviral target
because host cells do not make or require such enzymes.
* Corresponding author.
E-mail address: [email protected] (A.B.F. da Silva).
0223-5234/03/$ - see front matter # 2003 Editions scientifiques et medicales
doi:10.1016/j.ejmech.2003.06.001
Although some HIV gene products may be expressed in
the absence of integrase [5] and the possibility of HIV
replication in some cell types in the absence of integrase
has not been eliminated, recent evidences show that HIV
replication in T-lymphoid cells requires integrase func-
tions [6,7].
Among several compounds that present anti-HIV-1
activity, flavone compounds have been very studied due
to their activity during the inhibition process of HIV-1
integrase [4]. A plausible view of the inhibition of
integrase by flavones would be that these compounds
bind to enzyme sites that normally interact with DNA
bases blocking the action of HIV integrase [4].
The flavones are classified as flavonoid compounds
and consist of three aromatic rings with polar groups
appended at various positions [8]. The planarity, ar-
omaticity and polarity may allow these compounds to
bind by stacking with adenine or guanine, or to compete
Elsevier SAS. All rights reserved.

J. Souza, Jr et al. / European Journal of Medicinal Chemistry 38 (2003) 929�/938930
with purine moieties for binding to enzyme sites. Many
of these molecules also have oxidation�/reduction and
metal chelation capabilities [4].
As the importance of three-dimensional microscopicinteraction and binding between a substrate and a
receptor increases, the importance of quantum chemical
quantities in SAR analyses also increases. The quantum
chemical parameters of molecules and even of interact-
ing molecular systems can, in principle, express all
electronic properties related to the molecular interac-
tions. Thus, SAR studies using quantum chemical
parameters have become important in qualitative andquantitative analyses of three-dimensional molecular
interactions [9�/12].
The present work employs the semi-empirical AM1
method [13] to calculate some atomic and molecular
descriptors of 22 flavones compounds reported in the
literature as potent and selective anti-HIV-1 agents [4]
and nine new analogue compounds proposed as predic-
tion set. Some structure�/activity studies have beencarried out with other flavonoid compounds [14�/17]
and these studies show that hydrophobic and electronic
characteristics of the substituents have a predominant
role in the anti-HIV-1 activity of those compounds.
The descriptors (variables) in this work were chosen
taking into account three classes of variables: electronic,
steric and hydrophobic, as they represent the possible
molecular interactions between the flavone compoundsand the biological receptor. The principal component
analysis (PCA), hierarchical cluster analysis (HCA),
stepwise discriminant analysis (SDA) and K-nearest
neighbor (KNN), which were employed in this work
to analyse the data set, are extremely useful to classify
the molecules into groups that can be correlated to their
anti-HIV-1 activity.
2. Methodology
2.1. Compounds
The molecular structure of each compound of the
training set used in the present study is showed in Fig. 1.
In Table 1, the chemical name, abbreviation and the
activity indication used for the 22 compounds of thetraining set are presented. The compounds listed in
Table 1 can be divided into two groups: group A, which
contains the active compounds (labelled from 1 to 9 in
Fig. 1) and group B, which contains the inactive
compounds (labelled from 10 to 22 in Fig. 1). The
molecular structures of the nine new compounds se-
lected for the anti-HIV-1 prediction study are presented
in Fig. 2 and the chemical name and the abbreviationused for these new compounds are also presented in
Table 1. The biological evaluation of the compounds
studied in this work was determined by using the
numerical indicator for activity IC50. The IC50 indicates
the pharmacological potency and it represents the
concentration that inhibits the virus replication by
50% [18].
2.2. Calculation of the atomic and molecular descriptors
All the molecular structures of the training set(numbered from 1 to 22 in Fig. 1) were fully optimized
by using the semi-empirical AM1 method [13] with the
eigenvector following (EF) keyword. When the gradient
norm did not converge to a value below the standard
limit, the optimization was restarted with the additional
keyword NLLSQ. Thus, it was guaranteed that the
optimized geometry obtained for each compound stu-
died represents the equilibrium conformation assessedtheoretically. Only these final structures, which repre-
sent the most stable ones for a given compound, have
been used to obtain the molecular descriptors.
For some compounds of the prediction set (numbered
from I to IX in Fig. 2), the initial structure used in the
calculations was based on their X-ray crystal structures,
i.e. for the 3-methoxyflavone (compound I) and
6,2?,3?,4?-tetramethoxyflavone (compound IX), the in-itial geometry used in the calculations was that deter-
mined by Wallet et al. [19,20]; for the compounds II, III
and VII, the initial structure used in the calculations was
that determined by Souza et al. [21]. For the other
compounds (IV, V, VI and VIII), the initial structure
was obtained using the methodology described for the
training set.
The following descriptors were calculated in thiswork:
. The energy of the HOMO (highest occupied mole-cular orbital energy) and LUMO (lowest unoccupied
molecular orbital energy);
. Mulliken electronegativity (x ): obtained from the
following equation: x�/(EHOMO�/ELUMO)/2;
. Partition coefficient (log P ): the values of this prop-
erty were obtained from the hydrophobic parameters
of the substituents [22];
. Dipole moment (m), molecular polarizability (POL),heat of formation (DHf), total energy (ET), electronic
energy (Eel);
. Electron affinity (EA): obtained as (�/ELUMO)
. Superficial area (A ) and molecular volume (VOL);
. Net atomic charge on atom N (Qn)
. Hydration energy (HE) and molecular refractivity
(MR).
The calculated descriptors were selected so that they
could represent electronic (HOMO, LUMO,x , m , POL,Qn, DHf, MR, EA, ET, Eel and HE), steric (A and VOL)
and hydrophobic (log P ) features of the compounds
studied. These features are supposed to be important for

Fig. 1. Molecular structure of the 22 flavonoid compounds (flavones) studied.
J. Souza, Jr et al. / European Journal of Medicinal Chemistry 38 (2003) 929�/938 931
the anti-HIV-1 activity presented by the flavones [14�/
17]. The statistical analysis (PCA, HCA, SDA and
KNN) was performed using the MATLAB 6.0 program
[23].
The descriptors HOMO, LUMO, ,x , m , POL, ET, Eel,
EA, DHf and Qn were calculated with the semi-empirical
AM1 method [13] built-in the AMPAC 6.0 molecular
package [24]. The atomic charges calculated in this work
were derived from the electrostatic potential obtained
with the AM1 method by using the routine developed by
Connolly [25]. The electrostatic potential was obtained
through the calculation of a set of punctual atomic
charges so that it represents the possible best quantum
molecular electrostatic potential for a set of points
defined around the molecule [26,27]. This method uses
a density of 1 point per A in four layers placed at
distances of 1.4, 1.6, 1.8 and 2.0 times the van der Waals
radii. The charges derived from electrostatic potential
have the advantage of being, in general, physically more
satisfactory than the Mulliken’s charges, especially when
one is working with compounds that present biological
activity [28]. The other descriptors were calculated by
using the HYPERCHEM 5.0 molecular package [29].
3. Results and discussion
3.1. Principal component analysis (PCA)
The central idea of PCA is to reduce the dimension-
ality of a data set, explaining the variance-covariance
structure [30]. This is achieved by linear transformation
of the original data set of variables into a smaller
number of uncorrelated significant principal compo-
nents (PCs). Geometrically, this transformation repre-
sents the rotation of the original coordinate system and
the direction of the maximum residual variance is givenby the first principal component axis. The second
principal component, orthogonal to the first one, has
the second maximum variance and so on. In this way,

Fig. 1 (Continued)
J. Souza, Jr et al. / European Journal of Medicinal Chemistry 38 (2003) 929�/938932
projections preserving maximum amounts of statistical
information can be visualized using microcomputers in
order to display a more detailed study of the data
structure [30,31].
In this work, before applying the PCA method, each
variable was auto-scaled so that they could be compared
to each other on the same scale. After several attempts
to obtain a good classification of the compounds, the
best separation was obtained with three variables (see
Table 2).
The first two principal components explain 86% of the
total variance in the data set as follows: PC1�/56% and
PC2�/30%. A number of score plots were examined and
the most informative one is presented in Fig. 3. This
projection has 86% of the total variance of the original
data set and provides a reasonably accurate representa-
tion of the higher order space. Table 3 shows the loading
vectors for PC1 and PC2.
From Fig. 3 we can see that the compounds studied
are separated into two groups: group A (active com-
pounds) and group B (inactive compounds). Also fromFig. 3, we can see that PC1 alone is responsible for the
separation between active and inactive compounds. Fig.
4 displays the plot of the loading vectors for these first
two principal components (PC1 and PC2).
According to Table 3, PC1 can be expressed through
the following equation:
PC1�0:610[log P]�0:403[VOL]�0:683[EA] (1)
From Eq. (1) we can notice that for a given flavone to
become active it must have smaller values for log P and
volume while the electron affinity must have larger
values. Considering the interactions between active
compounds and the biological receptor, we can say
that the compounds studied need to present three main
characteristics: (a) they must have small volume for
casing suitably with the biological receptor; (b) theymust have small values of log P ; (c) they must have large
values for the electron affinity (this indicates the
compound has a great probability of interacting with
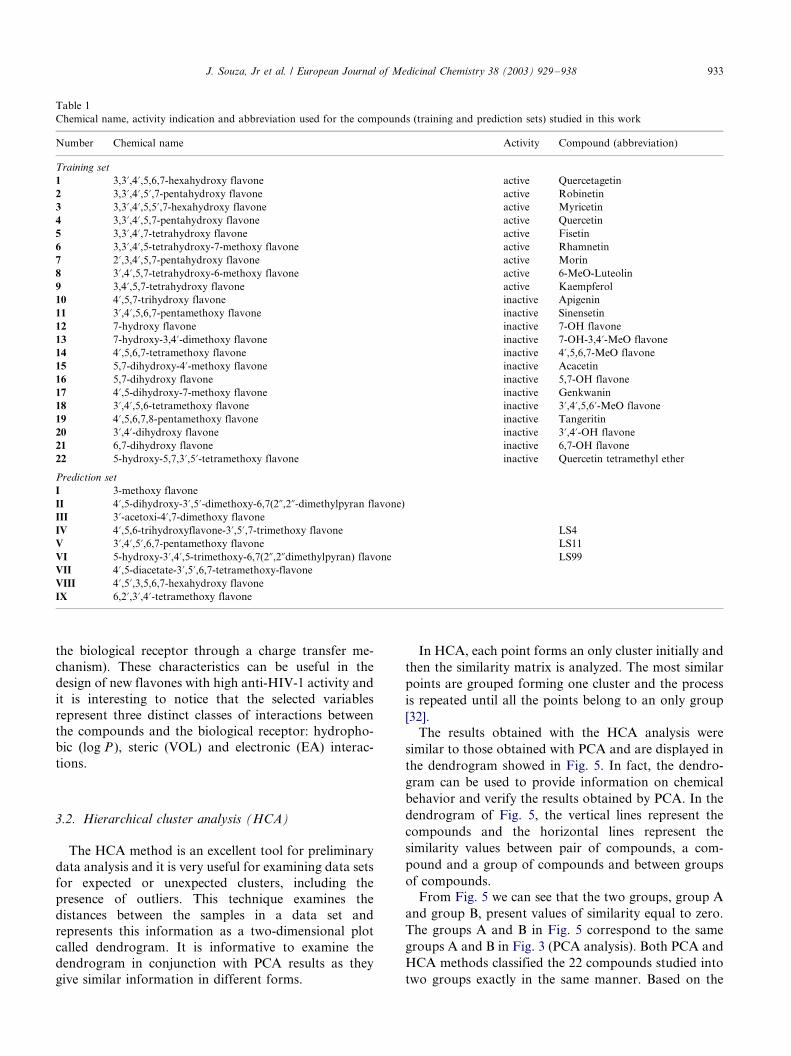
Table 1
Chemical name, activity indication and abbreviation used for the compounds (training and prediction sets) studied in this work
Number Chemical name Activity Compound (abbreviation)
Training set
1 3,3?,4?,5,6,7-hexahydroxy flavone active Quercetagetin
2 3,3?,4?,5?,7-pentahydroxy flavone active Robinetin
3 3,3?,4?,5,5?,7-hexahydroxy flavone active Myricetin
4 3,3?,4?,5,7-pentahydroxy flavone active Quercetin
5 3,3?,4?,7-tetrahydroxy flavone active Fisetin
6 3,3?,4?,5-tetrahydroxy-7-methoxy flavone active Rhamnetin
7 2?,3,4?,5,7-pentahydroxy flavone active Morin
8 3?,4?,5,7-tetrahydroxy-6-methoxy flavone active 6-MeO-Luteolin
9 3,4?,5,7-tetrahydroxy flavone active Kaempferol
10 4?,5,7-trihydroxy flavone inactive Apigenin
11 3?,4?,5,6,7-pentamethoxy flavone inactive Sinensetin
12 7-hydroxy flavone inactive 7-OH flavone
13 7-hydroxy-3,4?-dimethoxy flavone inactive 7-OH-3,4?-MeO flavone
14 4?,5,6,7-tetramethoxy flavone inactive 4?,5,6,7-MeO flavone
15 5,7-dihydroxy-4?-methoxy flavone inactive Acacetin
16 5,7-dihydroxy flavone inactive 5,7-OH flavone
17 4?,5-dihydroxy-7-methoxy flavone inactive Genkwanin
18 3?,4?,5,6-tetramethoxy flavone inactive 3?,4?,5,6?-MeO flavone
19 4?,5,6,7,8-pentamethoxy flavone inactive Tangeritin
20 3?,4?-dihydroxy flavone inactive 3?,4?-OH flavone
21 6,7-dihydroxy flavone inactive 6,7-OH flavone
22 5-hydroxy-5,7,3?,5?-tetramethoxy flavone inactive Quercetin tetramethyl ether
Prediction set
I 3-methoxy flavone
II 4?,5-dihydroxy-3?,5?-dimethoxy-6,7(2ƒ,2ƒ-dimethylpyran flavone)
III 3?-acetoxi-4?,7-dimethoxy flavone
IV 4?,5,6-trihydroxyflavone-3?,5?,7-trimethoxy flavone LS4
V 3?,4?,5?,6,7-pentamethoxy flavone LS11
VI 5-hydroxy-3?,4?,5-trimethoxy-6,7(2ƒ,2ƒdimethylpyran) flavone LS99
VII 4?,5-diacetate-3?,5?,6,7-tetramethoxy-flavone
VIII 4?,5?,3,5,6,7-hexahydroxy flavone
IX 6,2?,3?,4?-tetramethoxy flavone
J. Souza, Jr et al. / European Journal of Medicinal Chemistry 38 (2003) 929�/938 933
the biological receptor through a charge transfer me-
chanism). These characteristics can be useful in the
design of new flavones with high anti-HIV-1 activity and
it is interesting to notice that the selected variables
represent three distinct classes of interactions between
the compounds and the biological receptor: hydropho-
bic (log P ), steric (VOL) and electronic (EA) interac-
tions.
3.2. Hierarchical cluster analysis (HCA)
The HCA method is an excellent tool for preliminary
data analysis and it is very useful for examining data sets
for expected or unexpected clusters, including the
presence of outliers. This technique examines the
distances between the samples in a data set and
represents this information as a two-dimensional plot
called dendrogram. It is informative to examine the
dendrogram in conjunction with PCA results as they
give similar information in different forms.
In HCA, each point forms an only cluster initially and
then the similarity matrix is analyzed. The most similar
points are grouped forming one cluster and the process
is repeated until all the points belong to an only group
[32].
The results obtained with the HCA analysis were
similar to those obtained with PCA and are displayed in
the dendrogram showed in Fig. 5. In fact, the dendro-
gram can be used to provide information on chemical
behavior and verify the results obtained by PCA. In the
dendrogram of Fig. 5, the vertical lines represent the
compounds and the horizontal lines represent the
similarity values between pair of compounds, a com-
pound and a group of compounds and between groups
of compounds.
From Fig. 5 we can see that the two groups, group A
and group B, present values of similarity equal to zero.
The groups A and B in Fig. 5 correspond to the same
groups A and B in Fig. 3 (PCA analysis). Both PCA and
HCA methods classified the 22 compounds studied into
two groups exactly in the same manner. Based on the

Fig. 2. Molecular structure of the nine new flavones used for the prediction study.
J. Souza, Jr et al. / European Journal of Medicinal Chemistry 38 (2003) 929�/938934
classification obtained with the PCA and HCA we can
say that log P , EA and VOL are the descriptors
Table 2
Values of the three most important properties (variables) that classify
the 22 flavones studied and the activity indication
Compound Activity VOL (A3) log P EA (kcal mol�1)
1 active 777.90 0.00 1.18
2 active 765.70 0.28 0.99
3 active 796.50 0.00 0.89
4 active 762.10 0.28 1.05
5 active 747.09 0.56 0.93
6 active 817.35 0.31 0.99
7 active 770.74 0.28 0.80
8 active 821.97 0.93 1.01
9 active 742.69 0.56 1.01
10 inactive 727.14 1.46 0.92
11 inactive 1039.70 1.05 0.74
12 inactive 690.77 2.03 0.80
13 inactive 838.15 0.91 0.76
14 inactive 957.11 1.31 0.74
15 inactive 782.15 1.78 0.82
16 inactive 706.05 1.75 0.70
17 inactive 777.75 1.50 0.87
18 inactive 969.01 1.31 0.59
19 inactive 1022.40 1.95 0.78
20 inactive 710.25 1.75 0.86
21 inactive 710.80 1.75 0.84
22 inactive 985.54 1.46 0.99
responsible for the separation between the active and
inactive compounds against HIV-1.
3.3. Stepwise discriminant analysis (SDA)
The main objective of SDA is to determine discrimi-
nant functions using the measured variables that sepa-
rate the groupings as distinctly as possible. In this work
we considered two groups: group A which contains theactive compounds (numbered 1 to 9) and Group B that
contains the inactive compounds (numbered 10 to 22)
The stepwise discriminant analysis is a linear discri-
minant method based on the Fischer test (F -test) for the
significance of the variables [31]. In each step one
variable is selected based on its significance and after
several steps, the more significant variables are extracted
from the whole data set under investigation.The discriminant functions obtained in this work are
given as follows:
Group A:�94:11�0:10VOL�11:98 log P
�107:04EA (2)
Group B:�105:65�0:12VOL�26:26 log P
�88:83EA (3)
Through the discriminant functions above and the
values of each variable for the compounds studied, we
can obtain the classification matrix by using all com-
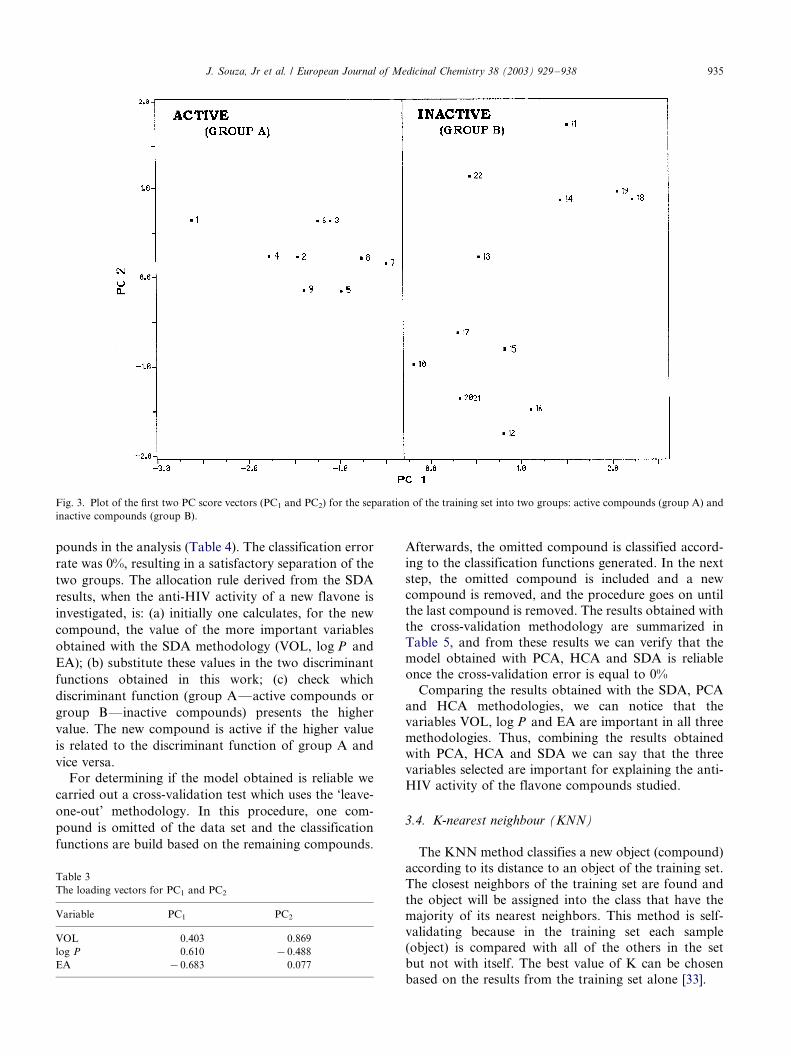
Fig. 3. Plot of the first two PC score vectors (PC1 and PC2) for the separation of the training set into two groups: active compounds (group A) and
inactive compounds (group B).
J. Souza, Jr et al. / European Journal of Medicinal Chemistry 38 (2003) 929�/938 935
pounds in the analysis (Table 4). The classification error
rate was 0%, resulting in a satisfactory separation of the
two groups. The allocation rule derived from the SDA
results, when the anti-HIV activity of a new flavone is
investigated, is: (a) initially one calculates, for the new
compound, the value of the more important variables
obtained with the SDA methodology (VOL, log P and
EA); (b) substitute these values in the two discriminant
functions obtained in this work; (c) check which
discriminant function (group A*/active compounds or
group B*/inactive compounds) presents the higher
value. The new compound is active if the higher value
is related to the discriminant function of group A and
vice versa.
For determining if the model obtained is reliable we
carried out a cross-validation test which uses the ‘leave-
one-out’ methodology. In this procedure, one com-
pound is omitted of the data set and the classification
functions are build based on the remaining compounds.
Table 3
The loading vectors for PC1 and PC2
Variable PC1 PC2
VOL 0.403 0.869
log P 0.610 �/0.488
EA �/0.683 0.077
Afterwards, the omitted compound is classified accord-
ing to the classification functions generated. In the next
step, the omitted compound is included and a newcompound is removed, and the procedure goes on until
the last compound is removed. The results obtained with
the cross-validation methodology are summarized in
Table 5, and from these results we can verify that the
model obtained with PCA, HCA and SDA is reliable
once the cross-validation error is equal to 0%
Comparing the results obtained with the SDA, PCA
and HCA methodologies, we can notice that thevariables VOL, log P and EA are important in all three
methodologies. Thus, combining the results obtained
with PCA, HCA and SDA we can say that the three
variables selected are important for explaining the anti-
HIV activity of the flavone compounds studied.
3.4. K-nearest neighbour (KNN)
The KNN method classifies a new object (compound)
according to its distance to an object of the training set.
The closest neighbors of the training set are found and
the object will be assigned into the class that have the
majority of its nearest neighbors. This method is self-
validating because in the training set each sample(object) is compared with all of the others in the set
but not with itself. The best value of K can be chosen
based on the results from the training set alone [33].
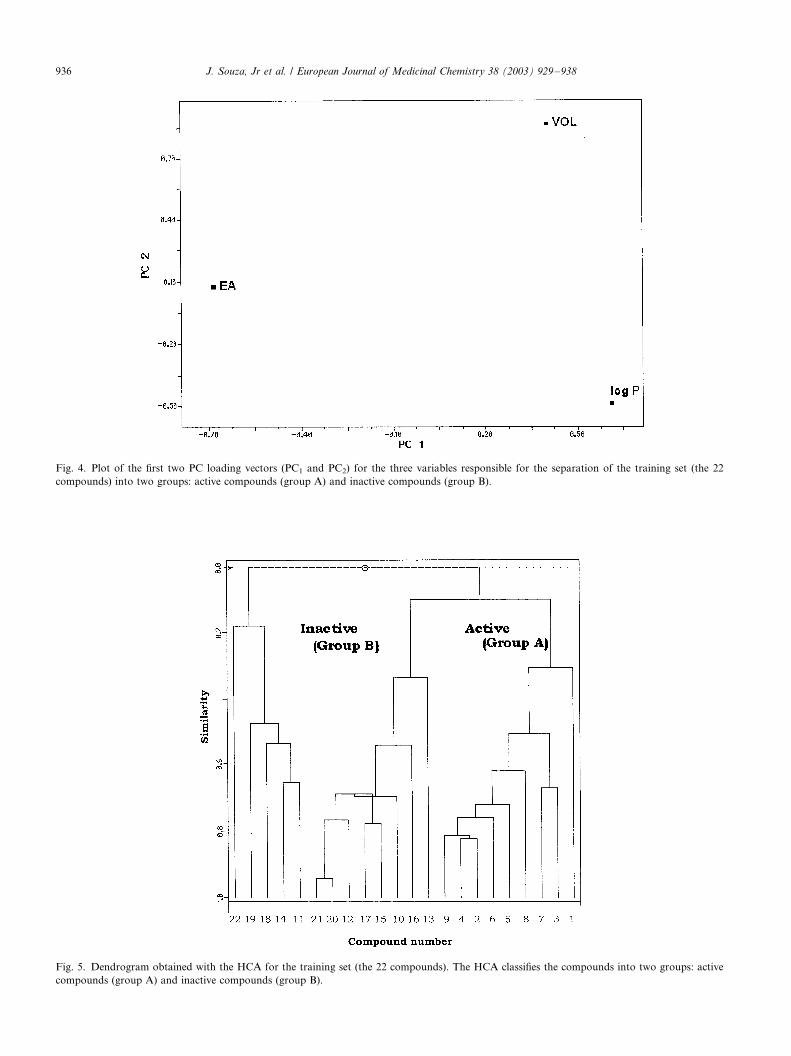
Fig. 4. Plot of the first two PC loading vectors (PC1 and PC2) for the three variables responsible for the separation of the training set (the 22
compounds) into two groups: active compounds (group A) and inactive compounds (group B).
Fig. 5. Dendrogram obtained with the HCA for the training set (the 22 compounds). The HCA classifies the compounds into two groups: active
compounds (group A) and inactive compounds (group B).
J. Souza, Jr et al. / European Journal of Medicinal Chemistry 38 (2003) 929�/938936

Table 4
Classification matrix obtained by using SDA
Classified group True group
A B
A 9 0
B 0 13
Total 9 13
Percentage 100 100
Table 5
Cross-validation matrix obtained by using SDA
Classified group True group
A B
A 9 0
B 0 13
Total 9 13
Percentage 100 100
Table 7
Values of the properties selected for the nine new compounds
Compound VOL (A3) log P EA (kcal mol�1)
I 736.21 1.45 0.84
II 1071.00 1.74 0.99
III 963.03 1.31 0.75
IV 950.85 0.71 0.72
V 1040.60 1.05 0.83
VI 1122.90 1.78 0.92
VII 1239.40 0.30 0.94
VIII 780.37 0.00 1.18
IX 762.54 1.31 0.74
Table 8
Prediction results obtained with four chemometric methods (PCA,
HCA, SDA and KNN) for the nine new compounds: active compound
(�/) and inactive compound (�/)
Compound Anti-HIV-1 activity
PCA HCA SDA KNN
I �/ �/ �/ �/
II �/ �/ �/ �/
III �/ �/ �/ �/
IV �/ �/ �/ �/
V �/ �/ �/ �/
VI �/ �/ �/ �/
VII �/ �/ �/ �/
VIII �/ �/ �/ �/
IX �/ �/ �/ �/
J. Souza, Jr et al. / European Journal of Medicinal Chemistry 38 (2003) 929�/938 937
The KNN method was used for the validation of the
initial data set and Table 6 presents the results obtained
with one (1NN), three (3NN) and five (5NN) nearest
neighbors. For all cases (1NN, 3NN and 5NN) the
percentage of correct information was 100% and we
decided to use 5NN because the greater the number of
nearest neighbors, the better the reliability of the KNN
method.
Knowing the performance of the four pattern recog-
nition methods (PCA, HCA, SDA and KNN) used for
the 22 compounds studied, we decided to apply them to
a series of nine new flavone compounds (see Fig. 2) with
similar chemical structure to the training set (the 22
compounds) and anti-HIV activity not yet known. The
nine molecules proposed for the activity prediction
study were supplied by the organic chemistry group of
the Federal University of Para, in Brazil, and the
biological tests were not performed with them yet. In
the future, the anti-HIV tests with these 9 flavone
compounds can be used to validate our statistical
models.
We applied the previous results obtained for the 22
compounds studied by using PCA, HCA, SDA and
Table 6
Classification obtained with the KNN method for the training set (the 22 co
Category Number of compou
Active 9
Inactive 13
Total 22
Percentage of correct information
KNN to a new set of nine analogue compounds in order
to verify which molecules of the new set would be
predicted as active or inactive against HIV-1. The values
of the properties selected (VOL, log P and EA) for the
nine new compounds are presented in Table 7.
The results (predictions) obtained with the PCA,
HCA, SDA and KNN methods for the prediction set
were similar and are summarized in Table 8. The
compounds I, II, III, IV, V, VI and IX were predicted
as inactive against HIV-1 with the four methods and
only the compound VIII was predicted as active by
using the four methods. On the other hand, only the
PCA analysis classified the compound VII as active. In
mpounds)
nds Compounds incorrectly classified
1NN 3NN 5NN
0 0 0
0 0 0
0 0 0
100 100 100

J. Souza, Jr et al. / European Journal of Medicinal Chemistry 38 (2003) 929�/938938
this way, we can consider only the compound VIII as
potentially active in a future biological test.
According to the three variables (EA, VOL and log P )
found here as having an important role in anti-HIV-1activity, we can verify that they belong, respectively, to
three distinct classes of variables: electronic, steric and
hydrophobic. Therefore we can conclude that these
properties have a very important role when one is trying
to understand the activity of flavone compounds against
HIV-1.
4. Conclusions
Principal component analysis (PCA), hierarchical
cluster analysis (HCA), stepwise discriminant analysis
(SDA) and K nearest neighbor method (KNN) showed
that the 22 flavonoid compounds (flavones) studied can
be classified into two groups: active (group A) and
inactive (group B) according to their degree of anti-HIV-1 activity. The variables log P , EA, VOL are the
ones responsible for the separation between active and
inactive molecules and it is interesting to notice that
these variables represent three distinct classes of inter-
actions between the compounds and the biological
receptor: hydrophobic (log P ), electronic (EA) and
steric (VOL) interactions. The behaviour of these three
variables can be useful when one is trying to obtainflavones with high anti-HIV-1 activity.
The prediction study with nine new compounds
employing the PCA, HCA, SDA and KNN analyses
showed that the four methods predicted that only one
compound would be active against HIV-1.
Acknowledgements
The authors would like to thank CAPES and CNPq
(Brazilian Agencies) for their financial support.
References
[1] J.C. Barre-Sinoussi, F. Chermann, M.T. Rey, S. Nugeyre, J.
Chamaret, C. Gruest, C. Dauguest, F. Axler-Blin, C. Vezinet-
Brun, W. Rouzioux, L. Rozenbaun, M. Montagnier, Science 220
(1983) 868.
[2] R.C. Gallo, S.Z. Salahuddin, M. Popovic, G.M. Shearer, M.
Kaplan, B.F. Haynes, T.J. Palker, R. Redfield, J. Oleske, B.
Saafai, G. White, P. Foster, P.D. Markham, Science 224 (1984)
500.
[3] G.A. Balint, Pharmacol. Ther. 89 (2001) 18.
[4] M.R. Fesen, Y. Pommier, F. Leteurtre, S. Hiroguchi, J. Yung,
K.W. Kohn, Biochem. Pharmacol. 48 (1994) 595.
[5] M. Stevenson, S. Haggerty, C.A. Lamonica, C.M. Meier, J. Virol.
64 (1990) 2421.
[6] R.I. LaFemina, C.L. Schneider, H.L. Robbins, P.L. Callahan, K.
LeGrow, E. Roth, W.A. Schleif, J. Virol. 66 (1992) 7414.
[7] H. Sakai, M. Kawamura, J. Sakuragi, S. Sakuragi, R. Shibata, A.
Ishimoto, N. Ono, S. Ueda, A. Adachi, J. Virol. 67 (1993) 1169.
[8] J. Peterson, J. Dwyer, Nutr. Res. 18 (1998) 1995.
[9] O. Kikuchi, Quant. Struct.-Acta Relat. 6 (1987) 179.
[10] M.C.A. Costa, L.E.S. Barata, Y. Takahata, J. Mol. Struct.
(Theochem.) 340 (1995) 185.
[11] C.N. Alves, L.G.M. de Macedo, K.M. Honorio, A.J. Camargo,
L.S. Santos, I.N. Jardim, L.E.S. Barata, A.B.F. da Silva, J. Braz.
Chem. Soc. 13 (2002) 300.
[12] A.J. Camargo, R. Mercadante, K.M. Honorio, C.N. Alves,
A.B.F. da Silva, J. Mol. Struct. (Theochem.) 583 (2002) 105.
[13] M.J.S. Dewar, E.G. Zoebisch, E.F. Healy, J.J.P. Stewart, J. Am.
Chem. Soc. 13 (1985) 3902.
[14] C.N. Alves, J.C. Pinheiro, A.J. Camargo, A.J. de Souza, R.B.
Carvalho, A.B.F.da Silva, J. Mol. Struct. (Theochem.) 530 (2000)
39.
[15] C.N. Alves, J.C. Pinheiro, A.J. Camargo, M.M.C. Ferreira,
A.B.F. da Silva, J. Mol. Struct. (Theochem.) 541 (2001) 81.
[16] (a) A. Mantas, E. Deretey, F.H. Ferretti, M.R. Estrada, I.G.
Csizmadia, J. Mol. Struct. (Theochem.) 504 (2001) 171;
(b) A. Mantas, E. Deretey, F.H. Ferretti, M.R. Estrada, I.G.
Csizmadia, J. Mol. Struct. (Theochem.) 504 (2001) 77.
[17] F.A. Molfetta, C.N. Alves, A.B.F. da Silva, J. Mol. Struct.
(Theochem.) 577 (2002) 187.
[18] G.T. Tan, J.M. Pezzuto, A.D. Kinghorn, J. Nat. Prod. 54 (1991)
143.
[19] J.C. Wallet, E.M. Gaydou, A. Fadlane, A. Baldy, Acta Crystal-
logr. Sect. C 44 (1988) 357.
[20] J.C. Wallet, E.M. Gaydou, A. Fadlane, A. Baldy, Acta Crystal-
lgor. Sect. C 46 (1990) 1131.
[21] J. Souza Jr., R.H.A. Santos, Z. Kristallogr. (2004) in press.
[22] G.G. Nys, R.F. Rekker, Eur. J. Med. Chem. Chim. Ther. 9 (1974)
361.
[23] J. Little, MATLAB, Mathworks Inc., Natick, MA, 1998.
[24] M.J.S. Dewar, AMPAC version 6.5, Semichem Inc. 1994.
[25] M.L. Connolly, J. Appl. Crystallogr. 16 (1983) 548.
[26] D.E. Willians, J. Yan, Adv. At. Mol. Phys. 23 (1998) 87.
[27] L.E. Chirlian, M.M. Francl, J. Comp. Chem. 8 (1987) 894.
[28] U.C. Singh, P.A. Kollman, J. Comp. Chem. 5 (1984) 129.
[29] N.S. Ostlund, HYPERCHEM, Release 5.0 for Windows, Reference
Manual, Canada, 1995.
[30] R.A. Johnson, D.W. Wichern, Applied Multivariate Statistical
Analysis, Prentice-Hall, New Jersey, 1982, p. 594.
[31] K.V. Mardia, J.T. Kent, J.M. Bibby, Multivariate Analysis,
Academic Press, New York, 1979, p. 521.
[32] B.R. Kowalski, C.F. Bender, J. Am. Chem. Soc. 94 (1972) 5632.
[33] J.C. Lindon, E. Holmes, J.K. Nicholson., Prog. Nucl. Res. Spec.
39 (2001) 1.