Investigation of basic mobile phases with positive ESI LC-MS for metabonomics studies
Upload
independentCategory
view
1download
0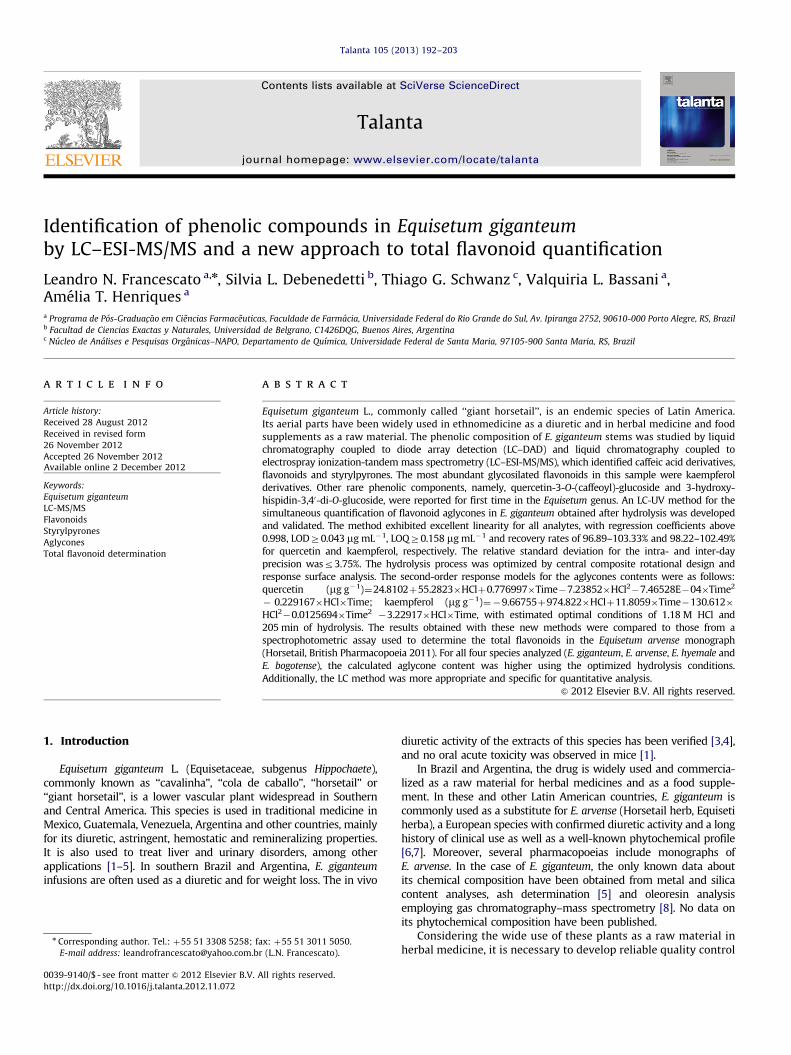
Talanta 105 (2013) 192–203
Contents lists available at SciVerse ScienceDirect
Talanta
0039-91
http://d
n Corr
E-m
journal homepage: www.elsevier.com/locate/talanta
Identification of phenolic compounds in Equisetum giganteumby LC–ESI-MS/MS and a new approach to total flavonoid quantification
Leandro N. Francescato a,n, Silvia L. Debenedetti b, Thiago G. Schwanz c, Valquiria L. Bassani a,Amelia T. Henriques a
a Programa de Pos-Graduac- ~ao em Ciencias Farmaceuticas, Faculdade de Farmacia, Universidade Federal do Rio Grande do Sul, Av. Ipiranga 2752, 90610-000 Porto Alegre, RS, Brazilb Facultad de Ciencias Exactas y Naturales, Universidad de Belgrano, C1426DQG, Buenos Aires, Argentinac Nucleo de Analises e Pesquisas Organicas–NAPO, Departamento de Quımica, Universidade Federal de Santa Maria, 97105-900 Santa Maria, RS, Brazil
a r t i c l e i n f o
Article history:
Received 28 August 2012
Received in revised form
26 November 2012
Accepted 26 November 2012Available online 2 December 2012
Keywords:
Equisetum giganteum
LC-MS/MS
Flavonoids
Styrylpyrones
Aglycones
Total flavonoid determination
40/$ - see front matter & 2012 Elsevier B.V. A
x.doi.org/10.1016/j.talanta.2012.11.072
esponding author. Tel.: þ55 51 3308 5258; f
ail address: [email protected]
a b s t r a c t
Equisetum giganteum L., commonly called ‘‘giant horsetail’’, is an endemic species of Latin America.
Its aerial parts have been widely used in ethnomedicine as a diuretic and in herbal medicine and food
supplements as a raw material. The phenolic composition of E. giganteum stems was studied by liquid
chromatography coupled to diode array detection (LC–DAD) and liquid chromatography coupled to
electrospray ionization-tandem mass spectrometry (LC–ESI-MS/MS), which identified caffeic acid derivatives,
flavonoids and styrylpyrones. The most abundant glycosilated flavonoids in this sample were kaempferol
derivatives. Other rare phenolic components, namely, quercetin-3-O-(caffeoyl)-glucoside and 3-hydroxy-
hispidin-3,40-di-O-glucoside, were reported for first time in the Equisetum genus. An LC-UV method for the
simultaneous quantification of flavonoid aglycones in E. giganteum obtained after hydrolysis was developed
and validated. The method exhibited excellent linearity for all analytes, with regression coefficients above
0.998, LODZ0.043 mg mL�1, LOQZ0.158 mg mL�1 and recovery rates of 96.89–103.33% and 98.22–102.49%
for quercetin and kaempferol, respectively. The relative standard deviation for the intra- and inter-day
precision wasr3.75%. The hydrolysis process was optimized by central composite rotational design and
response surface analysis. The second-order response models for the aglycones contents were as follows:
quercetin (mg g�1)¼24.8102þ55.2823�HClþ0.776997�Time�7.23852�HCl2�7.46528E�04�Time2
� 0.229167�HCl�Time; kaempferol (mg g�1)¼�9.66755þ974.822�HClþ11.8059�Time�130.612�
HCl2�0.0125694�Time2�3.22917�HCl�Time, with estimated optimal conditions of 1.18 M HCl and
205 min of hydrolysis. The results obtained with these new methods were compared to those from a
spectrophotometric assay used to determine the total flavonoids in the Equisetum arvense monograph
(Horsetail, British Pharmacopoeia 2011). For all four species analyzed (E. giganteum, E. arvense, E. hyemale and
E. bogotense), the calculated aglycone content was higher using the optimized hydrolysis conditions.
Additionally, the LC method was more appropriate and specific for quantitative analysis.
& 2012 Elsevier B.V. All rights reserved.
1. Introduction
Equisetum giganteum L. (Equisetaceae, subgenus Hippochaete),commonly known as ‘‘cavalinha’’, ‘‘cola de caballo’’, ‘‘horsetail’’ or‘‘giant horsetail’’, is a lower vascular plant widespread in Southernand Central America. This species is used in traditional medicine inMexico, Guatemala, Venezuela, Argentina and other countries, mainlyfor its diuretic, astringent, hemostatic and remineralizing properties.It is also used to treat liver and urinary disorders, among otherapplications [1–5]. In southern Brazil and Argentina, E. giganteum
infusions are often used as a diuretic and for weight loss. The in vivo
ll rights reserved.
ax: þ55 51 3011 5050.
r (L.N. Francescato).
diuretic activity of the extracts of this species has been verified [3,4],and no oral acute toxicity was observed in mice [1].
In Brazil and Argentina, the drug is widely used and commercia-lized as a raw material for herbal medicines and as a food supple-ment. In these and other Latin American countries, E. giganteum iscommonly used as a substitute for E. arvense (Horsetail herb, Equisetiherba), a European species with confirmed diuretic activity and a longhistory of clinical use as well as a well-known phytochemical profile[6,7]. Moreover, several pharmacopoeias include monographs ofE. arvense. In the case of E. giganteum, the only known data aboutits chemical composition have been obtained from metal and silicacontent analyses, ash determination [5] and oleoresin analysisemploying gas chromatography–mass spectrometry [8]. No data onits phytochemical composition have been published.
Considering the wide use of these plants as a raw material inherbal medicine, it is necessary to develop reliable quality control

L.N. Francescato et al. / Talanta 105 (2013) 192–203 193
methods to comply with regulatory requirements. For this pur-pose, the pharmacognostic parameters for E. giganteum have beenexamined [9]. Thus, the aim of this study was to determine, forthe first time, the phenolic profile of E. giganteum using liquidchromatography coupled with tandem mass spectrometry (LC–MS/MS) and to develop and validate a liquid chromatographycoupled with ultraviolet detection (LC–UV) method for thequantitation of flavonoid aglycones, including a previous statis-tical optimization of the acid hydrolysis of their glycosides. FourEquisetum species were evaluated: E. giganteum, E. arvense,E. hyemale and E. bogotense. The results obtained using thismethod were compared to those obtained using the hydrolysisand spectrophotometric method described for E. arvense in theBritish Pharmacopoeia 2011 [10].
2. Materials and methods
2.1. Plant material
The aerial sterile stems of Equisetum giganteum L. werecollected in Santo Antonio da Patrulha (RS, Brazil) in May 2011(sample 1) and October 2009 (sample 2) [9]. E. hyemale L. wascollected in August 2009 in Curitiba (PR, Brazil). E. bogotense
H.B.K. was collected in August 2008 in Bariloche (Rıo Negro,Argentina). A commercial sample of E. arvense L. was purchased inSpain, having been bottled in July 2008. All samples wereidentified botanically. The material was dried and ground to aparticle size o0.355 mm. Loss on drying was determined at105 1C for 4 h.
2.2. Chemicals and reagents
Distilled water and analytical-grade reagents were employedin the spectrophotometric and hydrolysis experiments: 37%hydrochloric acid from Quimex (SP, Brazil) and methanol, ethylacetate and anhydrous sodium sulfate from Synth (SP, Brazil).Ethanol (95%, Synth, SP, Brazil), ultra-pure water (Millipore, MA,USA) and HPLC-grade acetonitrile, methanol and formic acid 96%(Tedia, OH, USA) were used for chromatographic analysis.
Analytical-grade standards of quercetin (Janssen Chimica,Belgium), kaempferol (Chromadex, CA, USA) and astragalin (97%,Sigma-Aldrich, MO, USA) were used as reference compounds.
2.3. LC–MS/MS and LC–DAD qualitative analysis
2.3.1. Sample preparation
The powdered material of E. giganteum (0.4 g, sample 1) wasextracted with 2 mL of 50% aqueous ethanol (v/v) for 30 min bysonication, centrifuged (1500g) and filtered (0.22 mm PVDF, Milli-pore, MA, USA). The obtained extract was diluted with ultrapurewater (1:5) prior to use in LC–DAD and LC–MS analysis.
2.3.2. Instruments
LC-MS/MS analysis was performed on an Agilent 1200 series HPLC(Palo Alto, CA, USA) equipped with a G1312B SL binary pump, aG1367D high-performance auto-sampler (HiP ALS SLþ) and aG1316B SL thermostated column compartment. The mass spectro-meter was an Agilent model G6460A triple quadrupole instrumentequipped with an electrospray ionization source. Instrument control,data acquisition and processing were performed using MassHunterworkstation software (Qualitative Analysis, version B.03.01, Agilent).A Phenomenex Luna C18(2) column (250�4.6 mm2 i.d., 5 mmparticle; Torrance, CA, USA) was used.
A Waters Alliance 2690 Chromatograph Separations Moduleequipped with a multiple-UV-wavelength photo-diode array
detector (Model 996, Waters, Milford, MA, USA) was used forliquid chromatography coupled to diode array detection(LC–DAD) analysis. UV spectra were recorded in a range of210–400 nm and monitored at 254 nm. Instrument controland data acquisition were performed using Waters EmpowerSoftware 2002.
2.3.3. LC–MS/MS and LC–DAD conditions and parameters
Samples were eluted with a gradient of previously degassed0.3% (v/v) formic acid in water (eluent A, pH 2.2) and acetonitrile(eluent B). The gradient profile was 9–15% B (0–21 min), 15–22%B (21–45 min), 22–35% B (45–60 min), 35–90% B (60–65 min) and90% B (65–70 min). Separation was carried out at a flow rate of0.9 mL min�1 at 30 1C and the injection volume was 10 mL.Mass spectra of the column eluate were recorded in the rangem/z 100–1000. The instrument was operated with a capillaryvoltage of 3500 V and a nozzle voltage of 500 V. Nitrogen wasused as the nebulizer gas at 45 psi, a carrier gas of 6 L min�1 at350 1C and a sheath gas of 11 L min�1 at 350 1C. MS data wereacquired in negative and positive ionization modes for theaccurate determination of the m/z of the parent ions. MS/MS datawere acquired in negative ionization mode to obtain the m/z ofthe fragment ion. For structural interpretation, the MS/MSfragment ions were acquired using different collision-induceddecomposition energies (CID) of 10, 20, 30, 50 and 70 V with afragmentor voltage of 135 V. The classical nomenclature proposedby Domon and Costello [11] in the MS/MS spectra of glycosideswas adopted to name the fragment ions.
For LC–DAD analysis, the same chromatographic parametersdescribed for LC-MS/MS analysis were employed, with the excep-tion of an injection volume of 15 mL.
2.4. LC–UV quantitative analysis
2.4.1. Preparation of standard and sample solutions for LC–UV
method validation
Quercetin and kaempferol standards were dissolved in metha-nol and diluted to give seven concentrations in the range of0.175–43.7 mg mL�1 and 0.222–55.6 mg mL�1, respectively.E. giganteum (sample 2) was hydrolyzed in 1.8 M HCl for120 min, extracted and dissolved in methanol according theconditions described below (2.4.5).
2.4.2. Instruments
For the quantitative determination, LC–UV analysis, a WatersAlliance 2695 Chromatograph Separations Module equipped witha UV/VIS detector (Model 2487, Waters) was used. The LunaC18(2) column (4.6�250 mm2, 5 mm, Phenomenex, CA, USA)was protected by a Bondapak C18 guard-column (1�8 mm2,37–55 mm, Waters, MA, USA). To evaluate the specificity, amultiple-UV-wavelength photo-diode array detector (Model996, Waters) was also used. Empower Software 2002 (Waters)was used for instrument control, data acquisition and processingof the chromatographic information.
2.4.3. LC–UV conditions and parameters
The separation of aglycones was achieved using a lineargradient of water (A) and methanol (B), both acidified with 0.3%formic acid (v/v). The gradient profile was 47–60% B (0–15 min),60% B (15–23 min), 60–100% B (23–24 min) and 100% B (24–27 min). At the end of each analysis, the column was stabilized for10 min under the initial conditions. A volume of 10 mL of thesample was eluted with a flow rate of 0.9 mL min�1 and detectedat 370 nm; the column temperature was 2272 1C.
L.N. Francescato et al. / Talanta 105 (2013) 192–203194
2.4.4. LC–UV method validation
The method linearity, precision (repeatability and intermedi-ary precision), accuracy (recovery), specificity, detection andquantitation limits were evaluated according to the ICH guide-lines [12].
Linearity: Linearity was determined by the calibration curvesobtained from the LC analysis of the standard solutions ofquercetin and kaempferol. The linearity analysis, over a 3 dayperiod, was estimated by regression using the least squares method.Seven concentrations of quercetin and kaempferol in the range of0.175–43.7 mg mL�1 and 0.222–55.6 mg mL�1, respectively, wereemployed.
Accuracy: The accuracy was determined by recovery analysis.Measured amounts of quercetin (0.091, 0.272 and 0.453 mg mL�1)and kaempferol (1.08, 3.24 and 5.4 mg mL�1) were added to thehydrolyzed extract solution to create solutions with 80, 100 and120% of the theoretical concentration. Each sample was injectedthree times and the amount recovered was calculated. Controlsfrom all samples were prepared and analyzed.
Precision: To evaluate the repeatability and intermediate pre-cision (intra- and inter-day precision), five concentration levels(50 to 150%) of the hydrolyzed extract were prepared and injectedin triplicate on three different days. A new sample solution wasprepared each day. The results were expressed as relative stan-dard deviation (RSD, %).
Specificity: The specificity was determined by peak purity testsusing a diode array detector after adding a small amount of thestandard substances to the sample.
Limit of detection and limit of quantitation: The limit of detec-tion (LOD) and limit of quantitation (LOQ) were defined as signal-to-noise ratios of 3.3:1 and 10:1, respectively. The standardsolutions of quercetin and kaempferol for LOD and LOQ wereprepared by sequential dilution.
Robustness: A Plackett–Burman (P–B) design was employed totest the robustness of the method. Four factors were tested:column (two batch and age), formic acid concentration (0.28,0.3 and 0.32%, v/v), percentage of MeOH in the initial mobilephase composition (46, 47 and 48%) and flow rate (0.85, 0.9 and0.95 mL min�1). Eight experiments were evaluated with 3 factorsassigned to dummy factors, in triplicate and randomly. Threeresponses were evaluated: the area, retention time and width ofthe quercetin and kaempferol peaks. The analyses of the resultsand statistical interpretations of the effects were derived from theliterature [13]. The standard error was obtained from the dummyeffects. A response at the 5% level (a¼0.05) was consideredsignificant.
2.4.5. Hydrolysis and extraction
Powdered E. giganteum (0.4 g of sample 2) was refluxed in awater bath at 9071 1C with 40 mL of various final molarconcentrations of HCl in 50% aqueous methanol for differenttime-periods (see next subsection). The liquid was filteredthrough cotton, and the residue was extracted twice with metha-nol (10 mL) under reflux (9071 1C) for 10 min. The extracts werecombined, and the methanol was removed at reduced pressure(30–35 1C). Ten milliliters of water were added to the residue andextracted once with 20 mL and then three times with 10 mL ofethyl acetate. The combined ethyl acetate extracts were washedtwice with 50 mL of water and then filtered over 10 g ofanhydrous sodium sulfate. The resulting solution was dried atreduced pressure (o40 1C). The residue was resuspended in 5 mLof methanol, 5-fold diluted in the same solvent and filteredthrough a 0.45 mm PVDF filter (Millipore, MA, USA) prior to LCanalysis.
2.4.6. Experimental design and optimization of hydrolysis
by response surface methodology (RSM)
The acid hydrolysis of the E. giganteum raw material wasoptimized using central composite rotational design (CCRD) andresponse surface analysis [14,15] to maximize its efficiency whileavoiding the degradation of the flavonoid aglycones.
According to results obtained in preliminary research on theefficiency of the acid hydrolysis of flavonoid glycosides, the mostrelevant variables were identified as the HCl concentration andhydrolysis time. CCRD was developed using Minitabs 15.0 StatisticalSoftware (Minitab Inc., USA). Twelve experiments were performed intwo orthogonal blocks with 2 center points per block. The values ofthe variables were coded as 71 for the factorial points, 0 for thecenter points and 71.4142 for the axial points. The ranges of thevariables evaluated were 1.02 to 4.98 M for HCl concentration and35.1 to 204.9 min for hydrolysis time (see Table 4).
The experimental data were fitted in the second-order poly-nomial model encoded in
Y ¼ b0þb1X1þb2X2þb11X21þb22X2
2þb12X1X2 ð1Þ
where Y is the response variable to be modeled; b0, b1, b2, b11, b22
and b12 are the regression coefficients; X1 is the molar concentra-tion of HCl; and X2 is the hydrolysis time.
The suitability of the model for each extracted flavonoid aglyconewas verified by analysis of variance (ANOVA). The optimum HClconcentration and hydrolysis time were obtained from the model byinspecting the response surface contour plots and using the Minitabs
optimizer. The determination of flavonoid aglycones was carried outby LC–UV after hydrolysis at the optimum conditions, and the resultwas compared to the predicted value.
2.5. Statistical analysis
Analyses were performed in triplicate. The individual data weregrouped after each experiment. The mean with the respectivedeviation was used as a measurement of the central tendency anddispersion (RSD, %). Microsoft Excel software (Microsoft, USA) andMinitabs 15.0 Statistical Software (Minitab Inc., USA) were employedfor ANOVA.
3. Results and discussion
3.1. Qualitative analysis
The LC-DAD and LC–ESI-MS profiles of E. giganteum hydro-ethanolic extract are shown in Fig. 1, and the chromatographic,UV, MS and MS/MS data can be observed in Table 1.
The molecular mass of the compounds was obtained fromtheir positive and negative ion electrospray mass spectra(ESI-MS), which described the corresponding protonated anddeprotonated pseudomolecular ions as well as the sodium andpotassium adduct ions (Table 1). In some cases, sodium formateadduct ions ([Mþ68]� and [Mþ136]�), formed due to thepresence of formic acid in mobile phase A (data not shown) wereobserved in the negative ion mode ESI-MS. After the pseudomo-lecular ion identification, it was subjected to various CID energies(10, 20, 30, 50 and 70 V) in negative ion mode ESI-MS/MS todetect the site of substitution in the aglycones, thereby providingfirm evidence for the proposed compound structure.
Thus, the structure of 12 compounds present in hydroethano-lic extract of E. giganteum were fully or partially characterizedusing the combined interpretation of the retention time, UVspectra and fragmentation patterns of the compounds obtainedby LC–DAD and LC–ESI-MS/MS. These data were compared with

Fig. 1. LC–DAD chromatogram at 254 nm (a) and LC–ESI-MS (negative ion mode) total ion current (TIC) chromatogram (b) of the hydroethanolic extract of E. giganteum.
The peaks are labeled according to the compounds listed in Table 1.
L.N. Francescato et al. / Talanta 105 (2013) 192–203 195
literature data, mainly those for the phenolics present in otherEquisetum species [7,16–18].
3.1.1. Characterization of flavonoid derivatives
In combination with the application of different CID energiesin negative ion mode ESI-MS/MS, the UV spectral data were usedto characterize the site of substitution in the flavonoid aglycone.Band II is important for the identification of hydroxyl or methoxylsubstituents in the ring B, and hypsochromic shifts in Band I and/or II can indicate the methylation or glycosidation of the hydroxylgroups of flavonols [19]. Shoulders in the UV spectra can alsoindicate substitution in aglycones: kaempferol (266, 294sh,349 nm for 3-glycosides and 266, 318sh, 349 nm for 3,7-diglyco-sides) and quercetin (255, 266sh, 355 nm for 3-glycosides and255, 266sh, 294sh, 354 nm for 3,7-glycosides) [20].
Four peaks (compounds 2, 6, 10 and 12) had UV spectracompatible with kaempferol glycosides. The UV spectra of com-pounds 2 and 6 showed a Band I maximum at 346.5 nm and ashoulder at 318 nm, indicating 3,7-O substitution. In contrast, the UVof the compounds 10 and 12 showed a Band I maximum at 344.1 nmand a shoulder at 290 nm, indicating a 3-O substitution [19,20].
The Y07� [M-H-162]� at m/z 609 (compound 2, [M-H]� of m/z
771.1 amu) and m/z 447 (compound 6, [M-H]� of m/z 609 amu) werethe base peak at 20 and 30 V of CID energy, indicating the loss of aglucose residue at the 7-O position, which is preferential [20]. Forcompound 2 (at 30 V), the ion 0,2X0
� [M-H-120]� at m/z 651.2, withlow intensity (0.6%), and the ion Y7
0Z3�1 [M-H-342]� at m/z 428.7
(1.6%) (Table 1) indicated the 1-2 interglucosidic linkage andbreakdown of a sugar moiety with the loss of one glucose residue,respectively, which are characteristic of the flavonoid 3-O-sophoro-side. The ion m/z 445.8 indicated the flavonoid 3- or 7-O-glucosyl, andthe ion with m/z 284.8 indicated the aglycone, kaempferol [21]. Forcompound 6, the characteristic ion Z1
� [M-H-180]� , indicating 1-2interglycosidic linkage, was not detected. The ions 0,2X0
� [M-H-120]�
at m/z 488.9 and [M-H-282]� at m/z 327 indicated breakdown withpartial loss of a hexose residue. The Y3,7�
0 [M-H-324]� ion at m/z 284indicated kaempferol [21]. The homolytic cleavage of the 3,7-O-glycosidic bond in compounds 2 (at 70 V) and 6 (at 50 V) producedthe radical aglycone ions [Y0-2H]�� m/z 283 (base peak) and[Y0-H]�� m/z 284 as well as the aglycone [Y0]� ion m/z 284.9/ 285,indicating a di-O-glycoside [22,23]. The ions m/z 255/254.8 and 226.8/226.6, for compound 2 and 6, respectively, confirmed kaempferol[24], whereas the ion m/z 151.2/150.6 indicated the presence of a
7-O-glucoside [25]. Thus, compound 2 was identified as kaempferol-3-O-sophoroside-7-O-glucoside and compound 6 as kaempferol-3,7-di-O-glucoside. The influence of increasing fragmentation energy(CID) on the fragmentation pattern of compound 2 can be visualizedin Table 1 and Fig. 2.
For compound 10 ([M-H]� of m/z 609 amu), the base peak Y03�
[M-H-325]� at 30 V indicated the loss of a diglucose residue andthe kaempferol deprotoned aglycone at m/z 284. The character-istic ion Z1
� [M-H-180]� at m/z 428.9 indicated the 1-2 inter-glycosidic linkage of the flavonoid sophoroside. For compound 12([M-H]� of m/z 447 amu), the Y0
3� [M-H-163]� (base peak at30 V) indicated the loss of a glucose residue and kaempferol atm/z 283.9. The ion 0,2X0
� [M-H-120]� , indicating the loss of asugar residue, was only detected at 20 V [21]. For compounds 10and 12, the homolytic cleavage of the 3-O-glycosidic bondproduced more intense radical aglycone [Y0-H]�� ions m/z 284and 283.9 than the aglycone [Y0]� ions m/z 284.9 and 284.8,respectively, confirming the glycosylation site at 3-O position[22,23]. The ions m/z 255 and 227, formed in MS/MS at 50 and70 V for compound 10 and 30 and 50 V for compound 12,respectively, are characteristic of kaempferol [24]. The ion m/z
151, characteristic of kaempferol-7-O-glucoside, was not detectedfor either compound [25]. Compound 10 was identified askaempferol-3-O-sophoroside, and compound 12 was unambigu-ously identified as astragalin (kaempferol-3-O-glucoside) basedon a comparison of the retention times and MS and MS/MSspectra with those of a reference compound.
Compound 1 and 4 exhibited UV spectra characteristic of aquercetin derivative. The Band I maximum at 351.3 and 348.9 nmand the shoulder at 294 nm of compound 1 and 4 indicated a 3,7-Osubstitution. The characteristic ions Z1
� and 0,2X0� of 1-2 intergly-
cosidic linkages were not detected [21] for either flavonoid. Thepresence of ions at m/z 300.5 and 300.8 at 30 V, in addition to thefragment ions at m/z 271 and 270.9 at 70 V for compound 1 and 4,respectively, indicated the aglycone quercetin [24].
The fragmentation pattern of compound 1 ([M-H]� of m/z
787 amu) indicated the presence of 3 hexoses linked tothe aglycone by two or three O-glycosidic linkages. At 30 V, the[M-H]� ion m/z 787 was the base peak, followed by the[M-H-162]� ion m/z 625 (34.2% R.A.), [M-H-325]� ion m/z 462(30.7%) and [M-H-487]� ion m/z 300.5 (3.7%), making it difficultto infer the location of the substitution from the relative abun-dances. At 50 V, the base peak was the ion m/z 462, indicating thatthere is a hexose residue possibly linked at 3-O position (the
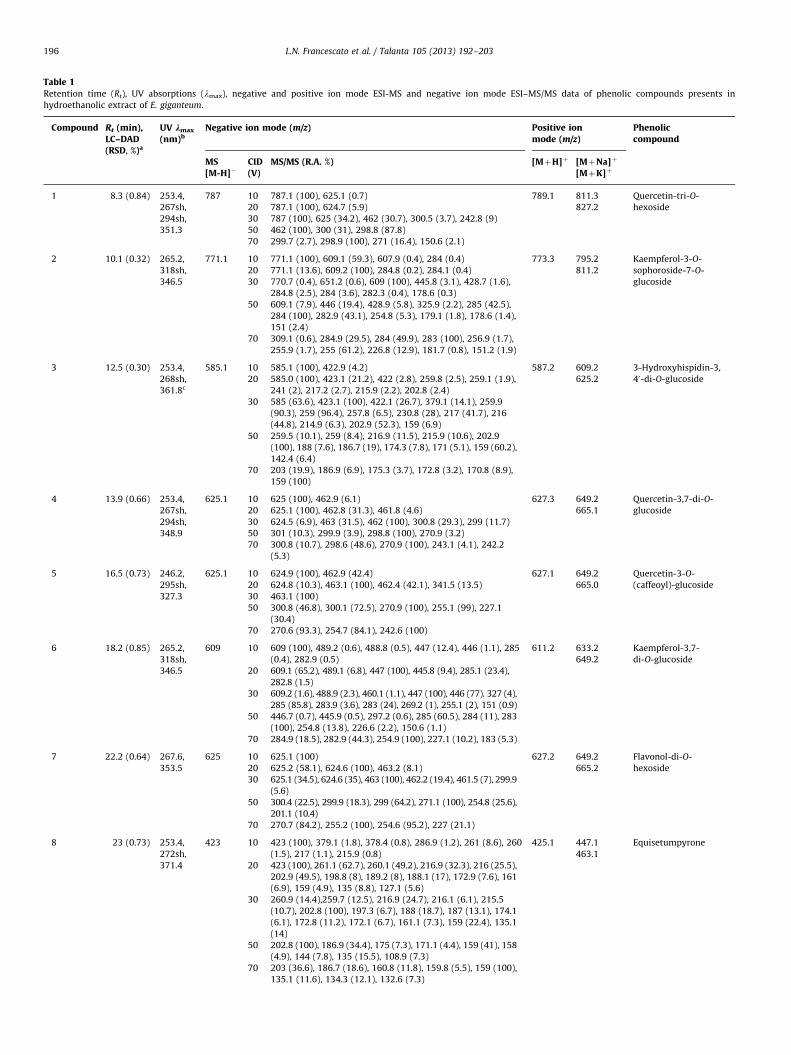
Table 1
Retention time (Rt), UV absorptions (lmax), negative and positive ion mode ESI-MS and negative ion mode ESI–MS/MS data of phenolic compounds presents in
hydroethanolic extract of E. giganteum.
Compound Rt (min),LC–DAD(RSD, %)a
UV kmax
(nm)b
Negative ion mode (m/z) Positive ionmode (m/z)
Phenoliccompound
MS[M-H]�
CID(V)
MS/MS (R.A. %) [MþH]þ [MþNa]þ
[MþK]þ
1 8.3 (0.84) 253.4,
267sh,
294sh,
351.3
787 10 787.1 (100), 625.1 (0.7) 789.1 811.3 Quercetin-tri-O-
hexoside20 787.1 (100), 624.7 (5.9) 827.2
30 787 (100), 625 (34.2), 462 (30.7), 300.5 (3.7), 242.8 (9)
50 462 (100), 300 (31), 298.8 (87.8)
70 299.7 (2.7), 298.9 (100), 271 (16.4), 150.6 (2.1)
2 10.1 (0.32) 265.2,
318sh,
346.5
771.1 10 771.1 (100), 609.1 (59.3), 607.9 (0.4), 284 (0.4) 773.3 795.2 Kaempferol-3-O-
sophoroside-7-O-
glucoside
20 771.1 (13.6), 609.2 (100), 284.8 (0.2), 284.1 (0.4) 811.2
30 770.7 (0.4), 651.2 (0.6), 609 (100), 445.8 (3.1), 428.7 (1.6),
284.8 (2.5), 284 (3.6), 282.3 (0.4), 178.6 (0.3)
50 609.1 (7.9), 446 (19.4), 428.9 (5.8), 325.9 (2.2), 285 (42.5),
284 (100), 282.9 (43.1), 254.8 (5.3), 179.1 (1.8), 178.6 (1.4),
151 (2.4)
70 309.1 (0.6), 284.9 (29.5), 284 (49.9), 283 (100), 256.9 (1.7),
255.9 (1.7), 255 (61.2), 226.8 (12.9), 181.7 (0.8), 151.2 (1.9)
3 12.5 (0.30) 253.4,
268sh,
361.8c
585.1 10 585.1 (100), 422.9 (4.2) 587.2 609.2 3-Hydroxyhispidin-3,
40-di-O-glucoside20 585.0 (100), 423.1 (21.2), 422 (2.8), 259.8 (2.5), 259.1 (1.9),
241 (2), 217.2 (2.7), 215.9 (2.2), 202.8 (2.4)
625.2
30 585 (63.6), 423.1 (100), 422.1 (26.7), 379.1 (14.1), 259.9
(90.3), 259 (96.4), 257.8 (6.5), 230.8 (28), 217 (41.7), 216
(44.8), 214.9 (6.3), 202.9 (52.3), 159 (6.9)
50 259.5 (10.1), 259 (8.4), 216.9 (11.5), 215.9 (10.6), 202.9
(100), 188 (7.6), 186.7 (19), 174.3 (7.8), 171 (5.1), 159 (60.2),
142.4 (6.4)
70 203 (19.9), 186.9 (6.9), 175.3 (3.7), 172.8 (3.2), 170.8 (8.9),
159 (100)
4 13.9 (0.66) 253.4,
267sh,
294sh,
348.9
625.1 10 625 (100), 462.9 (6.1) 627.3 649.2 Quercetin-3,7-di-O-
glucoside20 625.1 (100), 462.8 (31.3), 461.8 (4.6) 665.1
30 624.5 (6.9), 463 (31.5), 462 (100), 300.8 (29.3), 299 (11.7)
50 301 (10.3), 299.9 (3.9), 298.8 (100), 270.9 (3.2)
70 300.8 (10.7), 298.6 (48.6), 270.9 (100), 243.1 (4.1), 242.2
(5.3)
5 16.5 (0.73) 246.2,
295sh,
327.3
625.1 10 624.9 (100), 462.9 (42.4) 627.1 649.2 Quercetin-3-O-
(caffeoyl)-glucoside20 624.8 (10.3), 463.1 (100), 462.4 (42.1), 341.5 (13.5) 665.0
30 463.1 (100)
50 300.8 (46.8), 300.1 (72.5), 270.9 (100), 255.1 (99), 227.1
(30.4)
70 270.6 (93.3), 254.7 (84.1), 242.6 (100)
6 18.2 (0.85) 265.2,
318sh,
346.5
609 10 609 (100), 489.2 (0.6), 488.8 (0.5), 447 (12.4), 446 (1.1), 285
(0.4), 282.9 (0.5)
611.2 633.2 Kaempferol-3,7-
di-O-glucoside649.2
20 609.1 (65.2), 489.1 (6.8), 447 (100), 445.8 (9.4), 285.1 (23.4),
282.8 (1.5)
30 609.2 (1.6), 488.9 (2.3), 460.1 (1.1), 447 (100), 446 (77). 327 (4),
285 (85.8), 283.9 (3.6), 283 (24), 269.2 (1), 255.1 (2), 151 (0.9)
50 446.7 (0.7), 445.9 (0.5), 297.2 (0.6), 285 (60.5), 284 (11), 283
(100), 254.8 (13.8), 226.6 (2.2), 150.6 (1.1)
70 284.9 (18.5), 282.9 (44.3), 254.9 (100), 227.1 (10.2), 183 (5.3)
7 22.2 (0.64) 267.6,
353.5
625 10 625.1 (100) 627.2 649.2 Flavonol-di-O-
hexoside20 625.2 (58.1), 624.6 (100), 463.2 (8.1) 665.2
30 625.1 (34.5), 624.6 (35), 463 (100), 462.2 (19.4), 461.5 (7), 299.9
(5.6)
50 300.4 (22.5), 299.9 (18.3), 299 (64.2), 271.1 (100), 254.8 (25.6),
201.1 (10.4)
70 270.7 (84.2), 255.2 (100), 254.6 (95.2), 227 (21.1)
8 23 (0.73) 253.4,
272sh,
371.4
423 10 423 (100), 379.1 (1.8), 378.4 (0.8), 286.9 (1.2), 261 (8.6), 260
(1.5), 217 (1.1), 215.9 (0.8)
425.1 447.1 Equisetumpyrone
463.1
20 423 (100), 261.1 (62.7), 260.1 (49.2), 216.9 (32.3), 216 (25.5),
202.9 (49.5), 198.8 (8), 189.2 (8), 188.1 (17), 172.9 (7.6), 161
(6.9), 159 (4.9), 135 (8.8), 127.1 (5.6)
30 260.9 (14.4),259.7 (12.5), 216.9 (24.7), 216.1 (6.1), 215.5
(10.7), 202.8 (100), 197.3 (6.7), 188 (18.7), 187 (13.1), 174.1
(6.1), 172.8 (11.2), 172.1 (6.7), 161.1 (7.3), 159 (22.4), 135.1
(14)
50 202.8 (100), 186.9 (34.4), 175 (7.3), 171.1 (4.4), 159 (41), 158
(4.9), 144 (7.8), 135 (15.5), 108.9 (7.3)
70 203 (36.6), 186.7 (18.6), 160.8 (11.8), 159.8 (5.5), 159 (100),
135.1 (11.6), 134.3 (12.1), 132.6 (7.3)
L.N. Francescato et al. / Talanta 105 (2013) 192–203196

Table 1 (continued )
Compound Rt (min),LC–DAD(RSD, %)a
UV kmax
(nm)b
Negative ion mode (m/z) Positive ionmode (m/z)
Phenoliccompound
MS[M-H]�
CID(V)
MS/MS (R.A. %) [MþH]þ [MþNa]þ
[MþK]þ
9 24.9 (0.60) 244,
298sh,
327.3
295 10 201 (52.4), 200.4 (11.8), 179.1 (29.1), 134.9 (7.5), 132.7 (100),
114.6 (8.8)
� 319.1 Caffeic acid derivative
335
20 200.8 (68.9), 178.8 (54.8), 135.2 (100), 134.2 (84.8), 133.2
(83.4), 115 (98.3)
30 134.9 (80.2), 133.7 (18.6), 115.2 (100)
50 135 (83.5), 133.6 (100)
10 30.6 (0.52) 265.2,
290sh,
344.1
609 10 609.1 (100), 283.4 (0.4) 611.2 633.2 Kaempferol-3-O-
sophoroside20 609.1 (100), 428.9 (2.1), 285 (5.4), 284.1 (7) 649.2
30 609.1 (14.2), 446.8 (1.3), 428.9 (5.3), 284.9 (15.3), 284 (100),
256.9 (1.6), 178.8 (1.3), 126.8 (1.5)
50 285 (8.7), 284 (100), 255 (77.5), 228.9 (3.9), 226.9 (51.6)
70 283.4 (4.6), 255 (100), 227 (60.3), 210.8 (5.1)
11 37.6 (0.53) 241.5,
298sh,
327.3
309 10 192.9 (100), 177.6 (7.1), 134.2 (22.5), 133.5 (9.3), 115.1 (10.7) � 333.1 Ferulic acid derivative
349.220 193.1 (13.1), 192.5 (14.1), 134 (100), 117.1 (9.3)
30 134.2 (100)
12 42.2 (0.54) 265.2,
290sh,
344.1
447 10 447 (100), 284.6 (3.6) 449 471.1 Kaempferol-3-O-
glucoside48720 447.1 (100), 326.6 (11.1), 285.2 (38.1), 284.7 (34.9), 283.9
(61.8), 255.2 (7.9), 226.7 (19), 174.6 (16.8)
30 447 (10.1), 284.8 (6.2), 283.9 (100), 254.8 (52.1), 227 (14.2),
174.7 (13)
50 256.1 (5.1), 255 (100), 254.5 (37.5), 227 (69.3)
70 226.8 (100), 211.2 (8), 183.1 (20.7), 181.8 (11.6)
a Percent relative standard deviation of the triplicate measurements.b Shoulders obtained visually.c Other compound coeluting in the same peak. UV spectra maxima tentatively selected for the compound of interest.
L.N. Francescato et al. / Talanta 105 (2013) 192–203 197
most difficult breakdown position). The homolytic cleavage of theO-glycosidic bond produced (at 70 V) radical aglycone ions [Y0-2H]�� m/z 298.9 (high abundance) and [Y0-H]�� m/z 299.7 (lowabundance), but the aglycone ion [Y0]� m/z 301 was not observed.The ion [Y0-2H]�� indicated the presence of a di-O-glycoside [22],but no reference to the absence of an aglycone ion was found inliterature. Attributing this peak to the tri-O-glycosidic linkage,compound 1 was identified as quercetin-tri-O-hexoside.
In compound 4 ([M-H]� of m/z 625.1 amu), the ion Y7�0 [M-H-
162]� (base peak) at m/z 462 appears at 30 V, indicating the loss of ahexose residue in the 7-O position, which is preferential. TheY3,7�
0 [M-H-324]� ion at m/z 300.8 indicated quercetin [21]. Thehomolytic cleavage of the 3,7-O-glycosidic bond produced (at 50 V)radical aglycone ions [Y0-2H]�� m/z 298.8 (high intensity) and[Y0-H]�� m/z 299.9 as well as the aglycone [Y0]� ion m/z 301,indicating a di-O-glycoside [22]. Thus, compound 4 was identified asquercetin-3,7-O-glucoside.
Compound 5 ([M-H]� of m/z 625.1 amu) had a UV spectracharacteristic of a hydroxycinnamic acid, but the fragmentationpattern indicated an O-substituted flavonol. At 10 V, only the ion[M-H-162]� m/z 462.9 was formed in high intensity after the loss ofthe caffeoyl moiety from the pseudomolecular ion [M-H]� m/z 624.8.At 20 V, in addition to the ion m/z 463.1 (100%), the ion [M-H-Caf-120] m/z 341.5 (13.5%) indicated the breakdown of a sugar moiety.The homolytic cleavage of the O-substitute bond produced (at 50 V) aradical aglycone ion [Y0-H]�� m/z 300.1 (72.5%) as well as theaglycone ion [Y0]� m/z 300.8 (46.8%), implying a possible 3-O-substitution [23]. The ions m/z 270.9 and 255.1, formed in MS/MSat 50 V, are characteristic of quercetin [24]. Based on a comparison ofthe MS fragmentation pattern with the literature [26], compound 5was identified as quercetin-3-O-(caffeoyl)-glucoside.
Compound 7 ([M-H]� of m/z 625 amu) exhibited a UV spectratypical of a flavonol, and the Band I maximum at 353.5 nm
indicated that the compound was 3-O substituted. The ion[M-H-162]� at m/z 463 (base peak), indicated the loss of ahexose residue. The characteristic ion of a 1-2 interglycosidiclinkage was not detected. The Y3,7�
0 [M-H-324]� ion at m/z
299.9 indicated the aglycone. The homolytic cleavage of theO-glycosidic bond produced (at 50 V) radical aglycone ions [Y0-2H]�� m/z 299 (high intensity) and [Y0-H]�� m/z 299.9, indicatinga di-O-glycoside, possibly with 3-O-glycosidic linkage [22,23]. Theions m/z 271.1 and 254.8, formed in MS/MS at 50 V, indicated theaglycone quercetin [24], whereas the ion m/z 227 (at 70 V) corre-sponds to the MS/MS of kaempferol derivatives. Further research isthus needed to elucidate the structure of this derivative.
3.1.2. Characterization of styrylpyrone derivatives
Compounds 8 and 3 exhibited UV spectra characteristic ofstyrylpyrone, with maximum in the range of 253–258 nm and355–373 nm [16].
The results obtained for compound 8 were compared withliterature data [7,16,17]. At low collision energy (10 and 20 V)in MS/MS, the aglycone ion m/z 261 was detected from the pseu-domolecular ion [M-H]� m/z 423 (base peak), indicating the lossof a hexose residue (b-glucose) [M-H-162]� . Thus, compound 8was characterized as equisetumpyrone, a styrylpyrone glycoside(3,4-dihydroxy-6-(30,40-dihydroxy-E-styryl)-2-pyron-3-O-b-D-glu-copyranoside). This attribution could be confirmed by the pre-sence of the ions m/z 379.1 and 217 at 10 V, which indicated theloss of CO2 following the opening of the pyrone ring, and the ionsm/z 159 and 135.1 at 20 V, characteristic of a di-hydroxylatedstyryl group [16]. The MS/MS fragmentation pattern of compound8 at 30 V is presented in Fig. 3.
The results obtained for compound 3 were compared withliterature data [16], and the compound was initially characterized

L.N. Francescato et al. / Talanta 105 (2013) 192–203198
as 3-hydroxyhispidin-sophoroside. Our data, however, indicatedthat the compound was di-O-substituted because at low collisionenergy (10 V) in MS/MS, only the [M-H-162]� ion at m/z 422.9,characteristic of 3-hydroxyhispidin-hexoside, was present, corre-sponding to the loss of a hexose residue. Furthermore, at 30 V, thision was the base peak and the pseudomolecular ion m/z 585 andaglycone ions at m/z 259.9 and 259 exhibited high relativeabundances (63.5, 89.6 and 96.4% R.A., respectively), which usuallyoccurs in di-O-substituted compounds [21]. Moreover, the char-acteristic ion [M-H-180]� , typical of a 1-2 interglycosidic linkageof sophoroside, was not detected with any of the employedcollision energies. Fragments at m/z 379.1, 216, 202.9 and 159,present in equisetumpyrone spectra, were observed. In the fastatom bombardment mass spectrometry (FAB-MS) spectrapresented by Beckert [16], in addition to ions m/z 585 and423, another fragment at m/z 325 was reported, which the authorattributed to sophoroside (not observed in our experiment).However, that fragment may be due to the cleavage of the pyronering and formation of an ion containing a dihydroxy-styryl-O-glucoside derivative. Based on these data, compound 3 wasidentified as 3-hydroxyhispidin-3,40-di-O-glucoside (3,4-dihy-droxy-6-(30,40-dihydroxy-E-styryl)-2-pyron-3,40-O-b-diglucopyra-noside), although the position of the attachment of the glucoseresidue to the dihydroxy-styryl group must to be confirmed byNMR analysis.
Fig. 2. Principal fragmentation pathway and MS/MS [M-H]� at CID energies of 10, 2
3.1.3. Characterization of hydroxycinnamic acid derivatives
Two hydroxycinnamic acid esters were identified: compounds 9and 11. These compounds presented UV spectra characteristic ofhydroxycinnamic acid derivatives (with maximum at 324–326 nmand a shoulder at 296 nm) and fragmentation patterns in accordancewith those reported for caffeic acid ester derivatives [27], with a highfragmentation tendency even at a low collision energy (10 V). In thenegative ion mode ESI-MS, compound 9, beyond the pseudomolecu-lar ion m/z 295, an ion indicating a dimeric adduct of the compound[2M-H]� m/z 591 was observed (data not shown).
Compound 9 was identified as a caffeic acid ester derivative (UVlmax¼244, 298sh, 327.3 nm; [M-H]� of m/z 295 amu). In the MS/MSfragmentation at 20 V, the fragment ion [M-116]� m/z 178.8 isformed after the ester breakdown of the pseudomolecular ion m/z
295. This ion, in turn, yielded the ion [M-116-CO2]� m/z 135.2,characteristic of caffeic acid. Compound 11 was identified as a ferulicacid ester derivative (UV lmax¼241.5, 298sh, 327.3 nm; [M-H]� ofm/z 309 amu). In the MS/MS at 10 V, after the ester breakdown withthe loss of a residue [M-H-116]� , the fragment ion m/z 192.9corresponding to ferulic acid (base peak) is produced. This ion thenyielded the ion [M-H-116-CH3]� at m/z 177.6 after the loss of themethyl of the methoxy group and the ion [M-H-116-CH3-CO2]� atm/z 134.2, indicating the loss of CO2 of the acid group, all of which arecharacteristic of a ferulic acid derivative. The fragment with m/z 116present in both compounds could not be identified.
0, 30, 50 and 70 V for compound 2, kaempferol-3-O-sophoroside-7-O-glucoside.

Fig. 4. Structure of the styrylpyrones and flavonols identified by LC–MS/MS and LC–DAD in the hydroethanolic extract of E. giganteum.
Fig. 3. MS/MS [M-H]� at 30 V for styrylpyrone derivatives: compound 8, equisetumpyrone (a); compound 3, 3-hydroxyhispidin-3,40-di-O-glucoside (b).
L.N. Francescato et al. / Talanta 105 (2013) 192–203 199
The pattern of phenolics of E. arvense and other EuropeanEquisetum species is well known: flavonoid O-glycosides (mainlyapigenin, genkwanin, quercetin and kaempferol derivatives),caffeic acid conjugates (5-O-caffeoylshikimic acid, chlorogenicacid, dicaffeoyl-meso-tartaric acid and monocaffeoyl-meso-tartaric acid) and equisetumpyrone [7,28]. Thus, some com-pounds identified for the first time in E. giganteum in this study(Fig. 4) have been previously reported for the genus, whereasother compounds, such as quercetin-3-O-(caffeoyl)-glucoside,3,4-dihydroxy-6-(30,40-dihydroxy-E-styryl)-2-pyron-3,40-O-b-di-glucopyranoside, and caffeic and ferulic acid ester derivatives,are reported for first time in the Equisetum genus.
Styrylpyrone glycosides are rare natural products found in afew species of the Equisetum genus [7,16,17]. Some of thesecompounds are found in high levels in the rhizomes, gameto-phytes and fertile sporophytes of E. arvense and may be involvedin the constitutive defense mechanism against pathogens [16,29].However, equisetumpyrone was found as one of the major
constituents, together with other di-O-hexoside styrylpyrone, inthe aerial sterile stems of E. giganteum.
The flavonol glycosides and equisetumpyrone characterized inE. giganteum and previously described for the Equisetum species[7,18] can be employed as chemotaxonomic markers. Among thekaempferol derivatives, the kaempferol-3-O-sophoroside wasreported for all species found in the references evaluated[7,18,28,30], suggesting its potential use as a marker for the genus.
3.2. Quantitative analysis: flavonoid aglycone determination
As flavonoids are important constituents of Equisetum spp.and present many recognized medicinal properties, they can beused as chemical markers for quality control purposes. Chroma-tographic techniques in combination with UV detection can beused for the reliable quantitation of individual flavonoid glyco-sides. However, owing to the complexity of many extracts, theabsence of many commercial analytical standards, the similarity

Table 2Calibration curves, LOD and LOQ data of flavonoids aglycones determined by LC–UV.
Compound Linearity range (lg mL�1) Slope7standard error Intercept7standard error LOD (lg mL�1) LOQ (lg mL�1) Determination coefficient (R2)
Quercetin 0.175–43.7 43553.4793.6 �6580.872293.7 0.047 0.158 0.9997
Kaempferol 0.222–55.6 39563.67197.5 �5752.676157.8 0.043 0.205 0.9985
Table 3Calculated t-values of the factors effects (tcalc) on area, retention time (Rt) and peak
width of quercetin and kaempferol from results of the P–B design.
Factor tcalc
Quercetin peak Kaempferol peak
Area Rt Width Area Rt Width
MeOH % 2.05 �9.67a 0.65 0.97 �2.00 0.30
Flow rate �6.65a�11.23a
�0.29 �5.35a�4.38a 0.00
Formic acid % 1.38 0.07 1.44 0.11 �1.00 0.00
Column 14.75a�2.33 1.91 7.22a
�0.24 �2.66a
Dummy 1 �0.84 �0.87 �0.75 �0.65 �1.38 �0.89
Dummy 2 1.35 �0.02 �1.21 1.19 �1.02 �0.15
Dummy 3 �0.69 1.50 0.98 �1.08 �0.25 1.48
Critical value t(0.05,3) 2.36
a Significant at 5% level.
L.N. Francescato et al. / Talanta 105 (2013) 192–203200
between the spectra of different flavonoids glycosides, the lowreproducibility of retention times on long runs (450 min) andthe possibility of co-eluting compounds, this quantification tech-nique is often difficult to perform. Therefore, quantitative analysisof the flavonoid aglycones, after the hydrolysis of glycosides, is asimpler and faster approach because most aglycones are com-mercially available as reference compounds. Thus, this method isan attractive alternative appropriate for routine analysis.
Considering the complexity of the plant matrix and thedifferent flavonoid glycosides (i.e., aglycone moiety, C or O-glyco-sides bond, substitution position and different types of substitu-ents), the optimization of the hydrolysis process is necessary toensure its efficacy and accuracy.
For the quantitative analysis of the total flavonoid aglycones inE. arvense, the British Pharmacopoeia 2011 (BP2011) [10] employed acolorimetric method, which consists of the acid hydrolysis of theglycosides and their subsequent spectrophotometric determination at425 nm of a complex formed with AlCl3. Like all methods of this type,it is non-specific and most likely inaccurate if applied to thequantification of flavonoid aglycones obtained in E. giganteum becauseits flavonoid profile is distinctly different from that of E. arvense [7].Thus, a LC-UV method to determine each individual aglycone is moreappropriate for this determination, facilitating the interpretation of thedata obtained in hydrolysis optimization procedure.
3.2.1. LC–UV method validation
A solvent gradient elution system composed of MeOH:H2Oacidified with 0.3% formic acid was selected because it affordedgood separation and resolution of the target peaks from theirneighboring unknown compound peaks in the E. giganteum
hydrolyzed extract. The wavelength of 370 nm was selected forthe detection of target analytes because it showed good specifi-city and sensitivity, particularly for quercetin.
The proposed chromatographic method was validated by evaluat-ing the LOD, LOQ, linearity, intra- and inter-day precisions, specificityand accuracy [12]. The resultant calibration curves, LOD and LOQ offlavonoid aglycones are presented in Table 2. The calibration curveswere obtained with seven increments of concentrations for standards.Good linearity is shown for both calibration curves.
Under the established experimental conditions, the recoveries ofquercetin and kaempferol in the three concentrations levels were inthe range of 96.89–103.33% and 98.22–102.49%, respectively. Mea-surements of these intra- and inter-day precisions for both quercetinand kaempferol yielded good results in the ranges of 0.32–3.13% RSDand 1.05–3.75% RSD, respectively (data not shown). The chromato-graphic peak purity of the analytes in the hydrolyzed extract wasconfirmed by analysis with a diode array detector.
The results of the P–B design (Table 3) showed that themethod was more susceptible to wide deliberate variation inflow rate (above the usual parameters) and the use of a worn-outcolumn. Care should be taken with these factors whenever themethod is applied. The resolution between the quercetin andkaempferol peaks of their neighboring unknown compounds wascritical for the results of the robustness test, but even underextreme hydrolysis conditions, where the intensity of the neigh-boring peaks increased, this method, under normal conditions,proved to be specific for the aglycones of interest.
3.2.2. Hydrolysis and characterization of flavonoids
Hydrolysis had been previously evaluated using HCl in acetonemedium (British pharmacopoeic method), but a low yield ofaglycones with a large number of interfering compounds wasobtained after the liquid/liquid extraction with ethyl acetate. Thereplacement of acetone by aqueous methanol improved the yieldof aglycones (results not shown). All further experiments werethus carried out with 50% aqueous methanol (v/v), followed bythe elimination of methanol and liquid/liquid extraction withethyl acetate. This procedure allowed the removal of the majorityof the interfering compounds, facilitating the quantitative analy-sis of flavonoid aglycones.
Applying the developed hydrolysis/extraction method to theE. giganteum raw material, two flavonol aglycones were observedin the chromatogram and identified as quercetin (Rt¼16.1 min,UV lmax¼253.4, 295sh, 371.4 nm) and kaempferol (Rt¼21.9 min,UV lmax¼246sh, 262.9, 292sh, 322sh, 366.6 nm) (Fig. 6).
3.2.3. Hydrolysis optimization
Quercetin and kaempferol aglycones in the hydrolyzed extractof E. giganteum (sample 2) were quantified using the developedand validated LC method.
The value of independent variables, the design of experimentsthrough acid hydrolysis and the respective experimental andpredicted yield of quercetin and kaempferol are shown in Table 4.
The results obtained for each aglycone (Table 4) were ana-lyzed, and the data were fit to a second-order polynomial modelusing Eq. (1). The significance of each parameter of the model wasevaluated by the t-test. In a first analysis, the blocks parameterpresented less than 95% significance for kaempferol, but not forquercetin. Thus, due to the low variability in the levels ofquercetin, we chose to discard the blocks parameter for bothresponses. The reduced models were then submitted to an F-test(ANOVA) to calculate the significance of the regression (SOR), lack-of-fit (LOF) and the coefficient of multiple determination (R2).
After regression analysis, a second-order response model wasobtained as shown in Eqs. (2) and (3) for quercetin and kaemp-ferol, respectively, and the response surfaces were analyzed andplotted. The models presented significance of the F(SOR) higher

Table 4Experimental conditions, including factors and levels tested, of the central composite rotational design (CCRD), and experimental and predict quercetin and kaempferol
yield in acid hydrolysis of E. giganteum raw material (sample 2).
Run Block Variables Quercetin yield (lg g�1)a Kaempferol yield (lg g�1)a
Coded level Natural variables
X1 X2 HCl (M) Time (min) Experimental Predicted Experimental Predicted
1 1 �1 �1 1.6 60 118 116.7 1585 1568.8
2 1 1 �1 4.4 60 112 111.3 1542 1561.5
3 1 �1 1 1.6 180 147 144.4 2059 2003.5
4 1 1 1 4.4 180 64 62.1 931 911.2
5 1 0 0 3 120 125 125.5 1797 1812.5
6 1 0 0 3 120 127 125.5 1834 1812.5
7 2 �1.4142 0 1.02 120 126 128.1 1646 1689.3
8 2 1.4142 0 4.98 120 65 66.1 919 911.7
9 2 0 �1.4142 3 35.1 127 127.7 1808 1798.2
10 2 0 1.4142 3 204.9 110 112.5 1600 1645.8
11 2 0 0 3 120 125 125.5 1800 1812.5
12 2 0 0 3 120 125 125.5 1819 1812.5
X1¼HCl molar concentration; X2¼hydrolysis time.a Yield in mg g�1 of dry weight.
Fig. 5. Response surface (1) and contour plots (2) of HCl molar concentration and hydrolysis time effects on quercetin (a) and kaempferol (b) yield (in mg g�1 of dry plant).
L.N. Francescato et al. / Talanta 105 (2013) 192–203 201
than 95%, significance of F(LOF) lower than 95% and R240.99
quercetin mg g�1� �
¼ 24:8102þ55:2823�HClþ0:776997�Time
�7:23852�HCl2�7:46528E�04�Time2
�0:229167�HCl�Time ð2Þ
kaempferol mg g�1� �
¼�9:66755þ974:822�HClþ11:8059
�Time�130:612�HCl2�0:0125694
�Time2�3:22917�HCl�Time ð3Þ
The contour and three-dimensional (response surface) plotsdescribing the effect of HCl concentration and hydrolysis time onthe determination of quercetin and kaempferol in the E. gigan-
teum raw material are presented in Fig. 5. In both plots, theinteraction between the evaluated factors can be observed, withan improved yield of aglycones from the middle of the run
onwards (100 to 204.9 min) and from the lower to the middlelevel of HCl molar concentration (1.02 to 3 M), i.e., employing alower acid concentration and longer hydrolysis time at 90 1C.
Both higher HCl concentration and extended hydrolysis timeresulted in a decrease in the yield of aglycones, which could bedue to their degradation. On the other hand, lower HCl concen-tration and hydrolysis times might result in the partial hydrolysisof flavonoid glycosides, leading to an underestimation of theflavonoid aglycone content.
From the second-order models, the HCl concentration andhydrolysis time providing the maximum aglycone yield were1.1801 M and 204.85 min, which predicted quercetin and kaemp-ferol yields of 152 and 2069 mg g�1 of dry drug, respectively.A confirmation experiment was conducted for these predictedoptimum conditions (1.18 M HCl and 205 min of hydrolysis,n¼3). The aglycone yields for E. giganteum (sample 2) were

Table 5Content of total flavonoids, expressed as isoquercitrin (% w/w dry plant), and content of quercetin and kaempferol aglycones (mg g�1 dry plant) in E. giganteum (sample 2),
E. arvense, E. hyemale and E. bogotense.
Assay method Hydrolysis/extraction method Results expressed as E. giganteum E. arvense E. hyemale E. bogotense
Spectrophotometry Pharmacopoeic Isoquercitrin (%, w/w) 0.6670.02a 1.3370.01 0.5170.07 1.1070.04
Developed in this work Isoquercitrin (%, w/w) 1.0570.06 2.4270.26 1.0170.04 1.7470.05
LC–UV Pharmacopoeic Quercetin (mg g�1) 0.03870.003 0.57770.066 0.01670.000 0.01370.000
Kaempferol (mg g�1) 0.37570.016 0.08870.012 0.40070.051 0.49470.045
Developed in this work Quercetin (mg g�1) 0.11670.005 2.31370.176 0.08370.002 0.03370.001
Kaempferol (mg g�1) 1.40970.061 0.53370.036 1.38070.055 2.36070.063
a Value expressed as mean7standard deviation of three determinations, in terms of dry plant.
Fig. 6. LC–UV chromatograms at 370 nm of the fraction containing the aglycones
of E. arvense (Ea), E. giganteum (Eg), E. bogotense (Eb) and E. hyemale (Eh), using the
method developed in this work for E. giganteum. UV spectra of quercetin (1),
apigenin (2), kaempferol (3) and an unknown flavonoid (4).
L.N. Francescato et al. / Talanta 105 (2013) 192–203202
14772 mg g�1 of quercetin and 1923711 mg g�1 of kaempferol,which were only 3.29% and 7.06% below the predicted values,revealing the good predictivity capacity of the model.
3.3. Aglycone quantification in Equisetum spp.
The optimized hydrolysis conditions obtained for the E. giganteum
raw material (1.18 M HCl and a hydrolysis time of 205 min at 90 1C in50% aqueous methanol medium) were employed for the assay offlavonoid aglycones in several Equisetum species: E. giganteum
(sample 2), E. arvense, E. hyemale and E. bogotense. These sampleswere also submitted to the pharmacopoeic hydrolysis method forHorsetail (0.6 M HCl and a hydrolysis time of 30 min under reflux inacetone medium) [10]. The aglycones formed were quantified usingthe spectrophotometric pharmacopoeic method and the LC–UVmethod developed and validated in this study. The content of totalflavonoids expressed as isoquercitrin and the content of quercetinand kaempferol aglycones were thus obtained (Table 5).
The data presented in Table 5 show that the hydrolysis/extraction method described by the BP2011 [10] yielded lowervalues of total flavonoids for all four species, including E. arvense,compared to those obtained by the application of the hydrolysis/extraction method developed in this study. The contents of totalflavonoids were between 58 and 98% higher for the four speciescompared with levels obtained using the pharmacopoeic method.
In the case of the determination of quercetin and kaempferolaglycones, the samples obtained with the optimized hydrolysis/extraction procedure showed a yield of over 153% for all fourspecies relative to the yield obtained with the extract obtainedusing the BP2011 method. For E. arvense, the contents of querce-tin and kaempferol differed by 301% and 506%, respectively,between the content calculated in samples obtained withthe optimized hydrolysis/extraction method and the methoddescribed in BP2011. These data reveal the influence of themethod and hydrolysis conditions in the determination of totalflavonoids and aglycones for the four species analyzed, indicatingthat the glycosilated flavonoids present in these samples are notcompletely hydrolyzed, which leads to an underestimation of thetotal flavonoid content.
The increase in the content of quercetin and kaempferolobserved by LC–UV after the application of optimized hydrolysisconditions was not proportional to the increase observed usingthe spectrophotometric method. This difference demonstrates thenon-specificity of the spectrophotometric method for aglyconequantitation. Thus, the LC–UV determination of individual aglyconeswas more specific than the spectrophotometric method, proving tobe more appropriate for the quality control of the Equisetum speciesanalyzed.
Among these species, E. arvense was the only one with a highercontent of quercetin than kaempferol, as determined by both hyd-rolysis/extraction methods. Equisetum giganteum, E. hyemale andE. bogotense exhibited at least 10 times more kaempferol thanquercetin. This difference in the levels of these two aglycones maybe very useful and perhaps decisive in the differentiation of theanalyzed species but also can assist in the identification, mainly forpowdered materials in which the botanical identification becomes

L.N. Francescato et al. / Talanta 105 (2013) 192–203 203
difficult and in the quality control of plant material. The initialobjective of finding a way to differentiate the species chemicallythrough their aglycone profiles was not achieved, with the exceptionfor E. arvense.
For both assay methods, E. arvense had the highest content of totalflavonoids expressed as isoquercitrin, as well as a higher content ofaglycones (considering only quercetin and kaempferol), followed byE. bogotense, E. giganteum and E. hyemale. In addition to having thehighest content of aglycones, two other flavonoid aglycones weredetected, although not quantified, in the hydrolyzed extract ofE. arvense (Fig. 6). These compounds can be observed in thechromatogram of E. arvense, in which, in addition to quercetin (peak1, Rt¼15.6 min) and kaempferol (peak 3, Rt¼20.9 min), there areanother two peaks corresponding to apigenin (peak 2, Rt¼22 min)and an unidentified flavonoid (peak 4, Rt¼17.5 min). In the otherthree species, only quercetin and kaempferol aglycones were foundafter the hydrolysis of flavonoid glycosides.
4. Conclusions
The major phenolic compounds of E. giganteum were identified forthe first time by LC–DAD and LC–MS/MS. Some of these compoundswere reported for the first time in the Equisetum genus.
Glucosylated kaempferol derivatives proved to be the mostabundant flavonoids in E. giganteum, showing potential as quali-tative and quantitative markers for this species.
Considering that there are no commercial standards availablefor most flavonoids in the hydroethanolic extract of E. giganteum,we developed and validated a reversed phase LC–UV method todetermine the flavonoid aglycones content obtained after anoptimized hydrolysis process. The developed LC–UV methodproved to be simple, sensitive, accurate, linear, precise, reprodu-cible, specific and robust.
When applied to the analysis of flavonoid aglycones inE. giganteum, E. arvense, E. hyemale and E. bogotense raw material,the developed hydrolysis method showed higher yields than themethod described in BP2011 for E. arvense [10]. These resultsindicate that this method is more suitable for the determinationof total flavonoids in Equisetum species. Furthermore, it providedthe first description of the chromatographic profile and quantifi-cation of aglycones in these species.
The results presented in this paper are useful for the differ-entiation of these Equisetum species and represent a contributionto the quality control of E. giganteum raw material and deriva-tives. Additionally, these findings suggest that this method couldbe extended to other species of the genus Equisetum, includingE. arvense.
Acknowledgments
This work was supported by the Brazilian Agencies CNPq andFAPERGS. CAPES-REUNI provided a doctoral scholarship to the
first author. The authors wish to thank F.K.J. Yatsu for excellentdiscussions and contributions and E. Wilson (Universidad deBelgrano) for assistance with the English language.
References
[1] S. Gorzalczany, A. Rojo, R. Rondinaz, S. Debenedetti, C. Acevedo, Acta Farm.Bonaerense 18 (1999) 221–224.
[2] N.I. Hilgert, J. Ethnopharmacol. 76 (2001) 11–34.[3] R.M. Perez Gutierrez, G.Y. Laguna, A. Walkowski, J. Ethnopharmacol. 14
(1985) 269–272.[4] A. Caceres, L.M. Giron, A.M. Martinez, J. Ethnopharmacol. 19 (1987) 233–245.[5] J.F. Ovalles, J.R. Fuller, M. Spinetti, Rev. Fac. Farm. 32 (1996) 2–4.[6] M. Blumenthal, A. Goldberg, J. Brinckmann, Herbal Medicine: Expanded
Commission E Monographs, first ed., Integrative Medicine Communications,Newton, MA, 2000.
[7] M. Veit, C. Beckert, C. Hohne, K. Bauer, H. Geiger, Phytochemistry 38 (1995)881–891.
[8] E.M.Z. Michielin, L.F.V. Bresciani, L. Danielski, R.A. Yunes, S.R.S. Ferreira,J. Supercrit. Fluids 33 (2005) 131–138.
[9] L.N. Francescato, D.A. Quinteros, S. Bordignon, V.L. Bassani, A.T. Henriques,Lat. Am. J. Pharm. 30 (2011) 1196–1201.
[10] British Pharmacopoeia Commission Secretariat, British Pharmacopoeia 2011.Volume IV. Herbal Drugs, The Stationary Office, London, 2011.
[11] B. Domon, C.E. Costello, Glycoconjugate J. 5 (1988) 397–409.[12] ICH, Validation of Analytical Procedures: Text and Methodology Q2(R1), 2005.[13] Y. Vander Heyden, A. Nijhuis, J. Smeyers-Verbeke, B.G.M. Vandeginste,
D.L. Massart, J. Pharmaceut. Biomed. Anal. 24 (2001) 723–753.[14] R.H. Myers, D.C. Montgomery, C.M. Anderson-Cook, Response Surface Meth-
odology: Process and Product Optimization Using Designed Experiments,third ed, Wiley, New York, 2009.
[15] M.A. Bezerra, R.E. Santelli, E.P. Oliveira, L.S. Villar, L.A. Escaleira, Talanta 76(2008) 965–977.
[16] C. Beckert, Biosynthese, Akkumulation und Strukturen von Styrylpyronen ingametophytischen und sporophytischen Geweben von Equisetum in Julius-
von-Sachs-Institut fur Biowissenschaften, Bayerischen Julius-Maximilians-Universitat Wurzburg, Wurzburg, 2002.
[17] M. Veit, H. Eiger, V. Wray, A. Abou-Mandour, W. Rozdzinski, L. Witte,D. Strack, F.C. Czygan, Phytochemistry 32 (1993) 1029–1032.
[18] B.-J. Park, M. Tomohiko, Chem. Nat. Compd. 47 (2011) 363–365.[19] L. Jurd, The Chemistry of Flavonoid Compounds, in: T.A. Geissman (Ed.),
Macmillan, New York, 1962 (pp. 107–155).[20] A. Romani, P. Vignolini, L. Isolani, F. Ieri, D. Heimler, J. Agric. Food Chem. 54
(2006) 1342–1346.[21] F. Ferreres, R. Llorach, A. Gil-Izquierdo, J. Mass Spectrom. 39 (2004) 312–321.[22] K. Ablajan, Z. Abliz, X.-Y. Shang, J.-M. He, R.-P. Zhang, J.-G. Shi, J. Mass
Spectrom. 41 (2006) 352–360.[23] L. Lu, F.-R. Song, R. Tsao, Y.-R. Jin, Z.-Q. Liu, S.-Y. Liu, Rapid Commun. Mass
Spectrom. 24 (2010) 169–172.[24] B.D. Davis, J.S. Brodbelt, J. Mass Spectrom. 43 (2008) 1045–1052.[25] R.E. March, E.G. Lewars, C.J. Stadey, X.-S. Miao, X. Zhao, C.D. Metcalfe, Int. J.
Mass Spectrom. 248 (2006) 61–85.[26] F. Vallejo, F.A. Tomas-Barberan, F. Ferreres, J. Chromatogr. A 1054 (2004)
181–193.[27] C. Medana, F. Carbone, R. Aigotti, G. Appendino, C. Baiocchi, Phytochem. Anal.
19 (2008) 32–39.[28] M. Veit, K. Bauer, C. Beckert, B. Kast, H. Geiger, F.-C. Czygan, Biochem. Syst.
Ecol. 23 (1995) 79–87.[29] C. Beckert, C. Horn, J.-P. Schnitzler, A. Lehning, W. Heller, M. Veit, Phyto-
chemistry 44 (1997) 275–283.[30] H. Wiedenfeld, A.A. Cetto, C.P. Amador, Biochem. Syst. Ecol. 28 (2000)
395–397.
Copyright © 2022 FDOKUMEN