
A PROJECT REPORT
75
A PROJECT REPORT On “A STUDY OF FOREX MARKET AND ANALYSIS OF MAJOR CURRRENCIES AT JMARATHON ADVISORY SERVICES PVT LTD ” 18MBAPR407 By MONISHA B 1CR18MBA24 Submitted to VISVESVARAYA TECHNOLOGICAL UNIVERSITY, BELAGAVI In partial fulfillment of the requirement for the award of the degree of MASTER OF BUSINESS ADMINISTRATION Under Guidance of Internal guide Mr. Sushant E Revankar External guide Mr. Gopal Krishna Assistant Professor Dept of Management Studies CMR Institute of Technology Business Head JMarathon Advisory Services Pvt Ltd Department of Management Studies and Research Centre CMR Institute of Technology #132, AECS Layout, IT Park Road, Bangalore - 560037 JUNE-JULY 2020
-
Upload
khangminh22 -
Category
Documents
-
view
2 -
download
0
Transcript of A PROJECT REPORT

A PROJECT REPORT
On
“A STUDY OF FOREX MARKET AND ANALYSIS OF MAJOR CURRRENCIES
AT JMARATHON ADVISORY SERVICES PVT LTD”
18MBAPR407
By
MONISHA B
1CR18MBA24
Submitted to
VISVESVARAYA TECHNOLOGICAL UNIVERSITY, BELAGAVI
In partial fulfillment of the requirement for the award of the degree of
MASTER OF BUSINESS ADMINISTRATION
Under Guidance of
Internal guide
Mr. Sushant E Revankar
External guide
Mr. Gopal Krishna
Assistant Professor
Dept of Management Studies
CMR Institute of Technology
Business Head
JMarathon Advisory Services
Pvt Ltd
Department of Management Studies and Research Centre
CMR Institute of Technology
#132, AECS Layout, IT Park Road, Bangalore - 560037
JUNE-JULY 2020


A PROJECT REPORT
On
“A STUDY OF FOREX MARKET AND ANALYSIS OF MAJOR CURRRENCIES
AT JMARATHON ADVISORY SERVICES PVT LTD”
18MBAPR407
By
MONISHA B
1CR18MBA24
Submitted to
VISVESVARAYA TECHNOLOGICAL UNIVERSITY, BELAGAVI
In partial fulfillment of the requirement for the award of the degree of
MASTER OF BUSINESS ADMINISTRATION
Under Guidance of
Internal guide
Mr. Sushant E Revankar
External guide
Mr. Gopal Krishna
Assistant Professor
Dept of Management Studies
CMR Institute of Technology
Business Head
JMarathon Advisory Services
Pvt Ltd
Department of Management Studies and Research Centre
CMR Institute of Technology
#132, AECS Layout, IT Park Road, Bangalore - 560037
Batch of 2018-2020

CERTIFICATE BY THE COMPANY

CERTIFICATE BY THE INSTITUTION

DECLARATION
I, Ms. MONISHA B, hereby declare that the Project report entitled “An analytical study of
Forex market” with reference to “JMarathon Advisory Services Pvt. Ltd., Bangalore”,
prepared by me under the guidance of Prof. Sushant E Revankar, faculty of MBA
Department, CMR Institute of Technology and external assistance by Mr. Gopal Krishna,
Business Head, JMarathon Advisory Services Pvt Ltd. I also declare that this project work is
towards the partial fulfillment of the university regulations for the award of degree of Master of
Business Administration by Visvesvaraya Technological University, Belagavi. I have undergone
a summer project for six weeks. I further declare that this project is based on the original study
undertaken by me and has not been submitted to any other University/Institution for the award of
any degree/diploma.
Place: (Ms. MONISHA B)
Date: USN: 1CR18MBA24

ACKNOWLEDGMENT
I have been fortunate enough to get good timely advice and support from a host of people to
whom I shall remain grateful.
I take this opportunity to express my heartfelt thanks to Dr. Sanjay Jain, Principal, CMR
Institute of Technology, Bangalore, for his support and cooperation to undertake and complete
the project work.
I am extremely thankful to Prof. Sandeep Kumar, Head of the Department of Management
Studies and Research, CMR Institute of Technology, Bangalore, for his advice and support
throughout the completion of the project work.
It gives me immense pleasure to record my thanks to my Internal Guide, Prof. Sushant E
Revankar, CMR Institute of Technology, Bangalore, for his valuable guidance and untiring
support and cooperation in completing the project work.
I acknowledge the insights provided by my External Guide, Mr.Gopal Krishna, Business
Head, JMarathon Advisory Services Pvt Ltd. which helped me to a great extent in the
completion of the project work.
And finally, there is deepest of thanks for the patience and cooperation of the family and friends,
without whom the endeavor would not have been possible.
Ms. MONISHA B
USN: 1CR18MBA24

TABLE OF CONTENTS
Chapter
No.
CONTENTS Page
No.
1
Executive Summary
INTRODUCTION
Introduction
Industry profile and company profile
Vision, mission and quality policy
Service profile
Competitors’ information
SWOT analysis
Future growth and prospects
Financial statement analysis
1
2
3-7
7-8
8
9
9-11
11
12-16
2 CONCEPTUAL BACKGROUND AND
LITERATURE REVIEW
Theoretical Background of the Study
Literature Review
17-21
22-26
3 RESEARCH DESIGN
Topic of the study
Objectives of the Study
Scope & Importance of the Study
Research Methodology
Limitations of the Study
27
28
28
29
29

4 DATA ANALYSIS AND INTERPRETATION
Analysis of Forex Market
Analysis of currencies
30-36
37-59
5 SUMMARY OF FINDINGS, SUGGESTIONS AND
CONCLUSION
Findings and
Suggestions
60-62
BIBLIOGRAPHY 63
LIST OF FIGURES
Fig. no Title Page no.
1 Market segments 3
2 Derivatives market 4
3 Company values 7
4 Company Balance sheet 12
5 Company provisional balance
sheet
13
6 Line chart 17
7 Bar chart 17
8 Candlestick chart 18
9 Japanese candlestick 18
10 Hammer and Hanging man
candlestick
19
11 Bullish engulfing pattern 19
12 Bearish engulfing pattern 20
13 Piercing candlestick pattern 20
14 Morning star pattern 21
15 Evening star pattern 21
16 Support and resistance 31
17 Stop loss and take profit 31
18 Moving average 32
19 Fibonacci levels 32
20 Bollinger bands 33

LIST OF TABLES
Table no.
Title of the Table
Page no.
1 International stock exchange
2 Pivot points 33
3 Fundamental analysis 34
4 Sentimental analysis 35
5 Foreign exchange market timings 35
6 Forex commodity market 36
7 Daily data of EUR/USD 37
8 Pivot point of EUR/USD 38
9 Daily data of GBP/USD 43
10 Pivot point of GBP/USD 44
11 Daily data of USD/JPY 48
12 Pivot point of USD/JPY 49
13 Daily data of USD/CHF 52
14 Pivot point of USD/CHF 53
15 Daily data of AUD/USD 56
16 Pivot point of AUD/USD 57
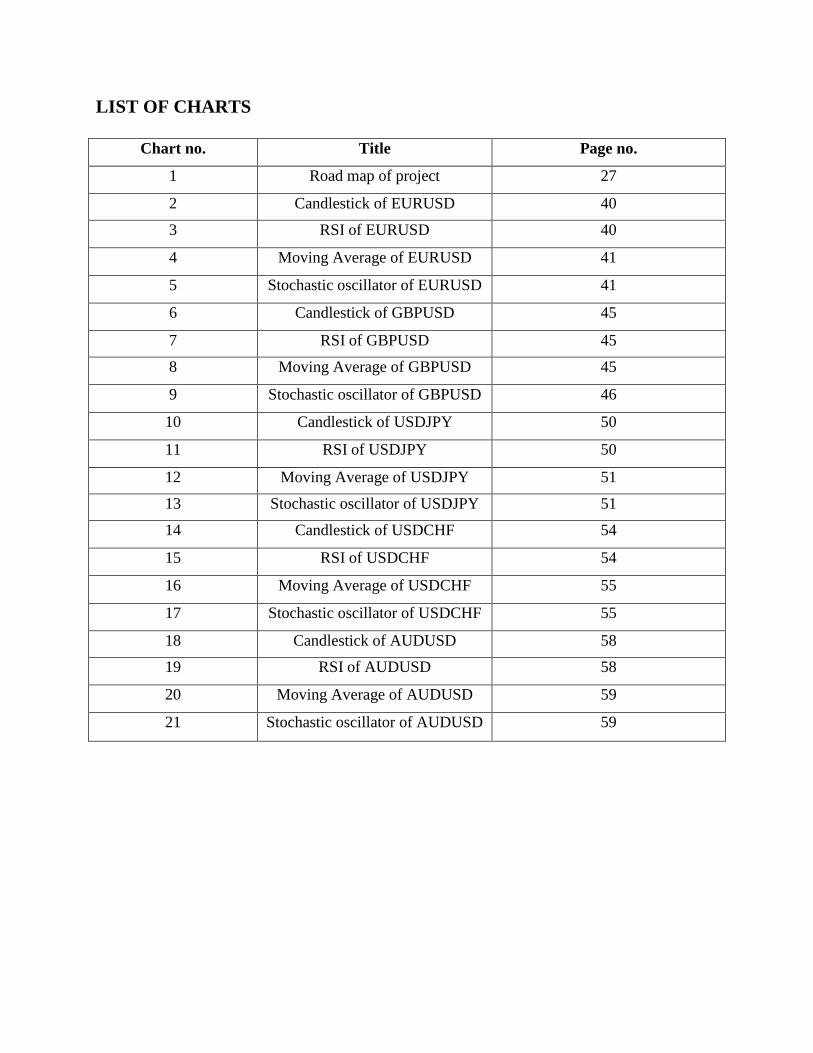
LIST OF CHARTS
Chart no. Title Page no.
1 Road map of project 27
2 Candlestick of EURUSD 40
3 RSI of EURUSD 40
4 Moving Average of EURUSD 41
5 Stochastic oscillator of EURUSD 41
6 Candlestick of GBPUSD 45
7 RSI of GBPUSD 45
8 Moving Average of GBPUSD 45
9 Stochastic oscillator of GBPUSD 46
10 Candlestick of USDJPY 50
11 RSI of USDJPY 50
12 Moving Average of USDJPY 51
13 Stochastic oscillator of USDJPY 51
14 Candlestick of USDCHF 54
15 RSI of USDCHF 54
16 Moving Average of USDCHF 55
17 Stochastic oscillator of USDCHF 55
18 Candlestick of AUDUSD 58
19 RSI of AUDUSD 58
20 Moving Average of AUDUSD 59
21 Stochastic oscillator of AUDUSD 59

1
EXECUTIVE SUMMARY
One of the fastest-paced, 24-hour markets in the world is the foreign exchange market (Forex or
FX). In the currency market, forex trading was the realm of large monetary institutions,
corporations, relevant banks, hedge budget, and extremely wealthy individuals. Now average
buyers can easily buy and sell currencies easily via online Demat accounts with the click of a
mouse.
Foreign Currency is the simultaneous buying of one foreign money and promoting of some other.
Currencies are pairs changes, for Ex: USD/JPY (US dollar vs. Japanese Yen) or AUD/USD
(Australian dollar vs. US dollar).
Until recently, forex dealing within the forex market was the area of huge financial
institutions, corporations, central banks, hedge price range and extremely wealthy individuals.
The advent of the Internet has altered all of this, and now it is feasible for common traders
and individuals to buy and sell currencies easily with the clicking of a mouse via online dealer
accounts.
The study is based on the analysis of five major currencies in their respective economy with
the US Dollar as the base currency.
The periodical reports assist the portfolio managers to take a Buy or Sell position in the
foreign money markets and deliver the first-rate timeframe to exit from the market. The report
shall be useful for now and not more than 1-week length since many modifications could be
seen in the worldwide world scenario. The file shall be useful in 'take profit' and to position
‘stop loss’ for the reason that speculators may additionally create a Bullish market (extensive
buying scenario) or Bearish market (extensive selling scenario).
The document contains the overview of training on basics of Domestic & International Trade
along with a brief look of its numerous charts and financial modeling strategies to estimate the
prices with the assistance of Fundamental and Technical Analysis.

- 2 -
CHAPTER 1
INTRODUCTION
Today, the Foreign Exchange marketplace is the world’s largest financial marketplace, with a
common daily turnover of more than US$ 6.6 trillion, making it one of the largest and most liquid
on the global market. It is so far one of the fast-paced and exciting markets around.
The company enterprise’s fundamental goal of the is to capture the trends, similarities and styles
within the FOREX & Indian Stock market’s behavior and practices in comparison its worldwide
counterparts. The goal is to help the traders (current & potential) recognize the impact of crucial
occurrence on the fluctuations in the International Forex market. This is particularly important in
the modern scenario, as the financial markets across the globe are merged into one big marketplace
and the influence of one exchange on the other exchanges. Forex market trading doesn’t require any
brokerage, commission, or any transaction prices with hidden charges; this makes forex one of the
least competitive financial markets.
This document is a study on Foreign Exchange market and analysis of 5 major currency pairs,
which are-
1. Euro - US Dollar (EUR/USD)
2. British pound - US Dollar (GBP/USD)
3. US Dollar - Japanese Yen (USD/JPY)
4. US Dollar – Swiss Franc (USD/CHF) “Swissie”
5. Australian Dollars- US Dollar (AUD/USD) “Aussie”
To provide a record on the premise of Fundamental and Technical Analysis followed by way of
interim news updates.
The report provides a 1 month summary of practice in the Demo model that offers readability on
trading terminologies. Trading on the Demo model gives the confidence and power to control
feelings and paves manner for professional trading.
The final part of the document is a reporting schedule where periodic reviews produced to the
seniors/management in a document file primarily based on Technical and Fundamental Analysis.

- 3 -
INDUSTRY PROFILE
An Overview of the Indian Securities Market
The securities market has interdependent and inseparable segments
1. Primary Market: The primary marketplace gives a possibility to the issuers of securities, both
Government and Corporations, to elevate assets to meet their requirements of Investments.
2. Secondary Market: Secondary marketplace refers to a market where securities are traded after
being presented to the public within the primary market or listed on the stock exchange.
Fig. 1 Market Segments
Market Segments:
There are 3 sorts of markets available to foreign exchange trader: a) Bull market: It is a purchase
market in which all of the investors choose to buy currencies. B) Bear market: It is a Sell
marketplace in which all of the buyers choose to sell currencies. C) Sideway marketplace: It is an
indecisive marketplace in which buyers are unable to neither promote nor purchase.
I. Wholesale Debt Market (WDM) Segment: This section provides trading structures for a
wide range of debt securities which incorporates kingdom and imperative governments
securities, T-bills, PSU Bonds, Corporate Debentures, Commercial Papers, COD
(Certificate of Deposits), etc.

- 4 -
II. Capital Market (CM) Segment: This section offers an automatic screen-based trading
system, referred to as the National Exchange for Automated Trading (NEAT) gadget.
Various kinds of securities e.g. equity stocks, warrants, debentures etc., traded on this
system.
III. Futures & Options (F&O) Segment: This segment provides trading in derivatives
like index futures, index options, stock options, and stock futures.
IV. Currency Derivatives Segment (CDS): This phase gives buying and selling in our forex
pairs like Euro-INR, Pound Sterling – INR and Japanese Yen – INR. Interest rate futures
were every other product made to be had for trading on this section.
Derivatives Market:
The term ‘Derivative’ stands for an agreement whose rate is derived from or relies upon an
underlying asset. The underlying asset could be a financial asset such as currency, stock and
market index, an interest-bearing security or a physical commodity. The demand for international
money and financial instruments increased significantly at a global level. In turn, change in
exchange quotes, interest charges and stock prices of different financial markets have increased
monetary risk to the corporate and investors globally.
Fig.2 Derivatives market
- 5 -
Forward Commitment:
These derivatives comprise of an assured occurrence in the future. The underlying asset will get
exchanged at a fixed future time, at a fixed price, agreed upon by both parties at the time of
entering into the contract. Since the exchange is fixed at a future time, it is called a Forward
Commitment.
Contingent Claim:
These derivatives comprise of an exchange subject to a certain event occurring at a future time.
If the event occurs, then the underlying asset will be exchanged at a fixed future time, at a fixed
price, agreed upon by both parties at the time of entering into the contract. Since the exchange is
contingent on the occurrence of an event, it is known as Contingent Claim.
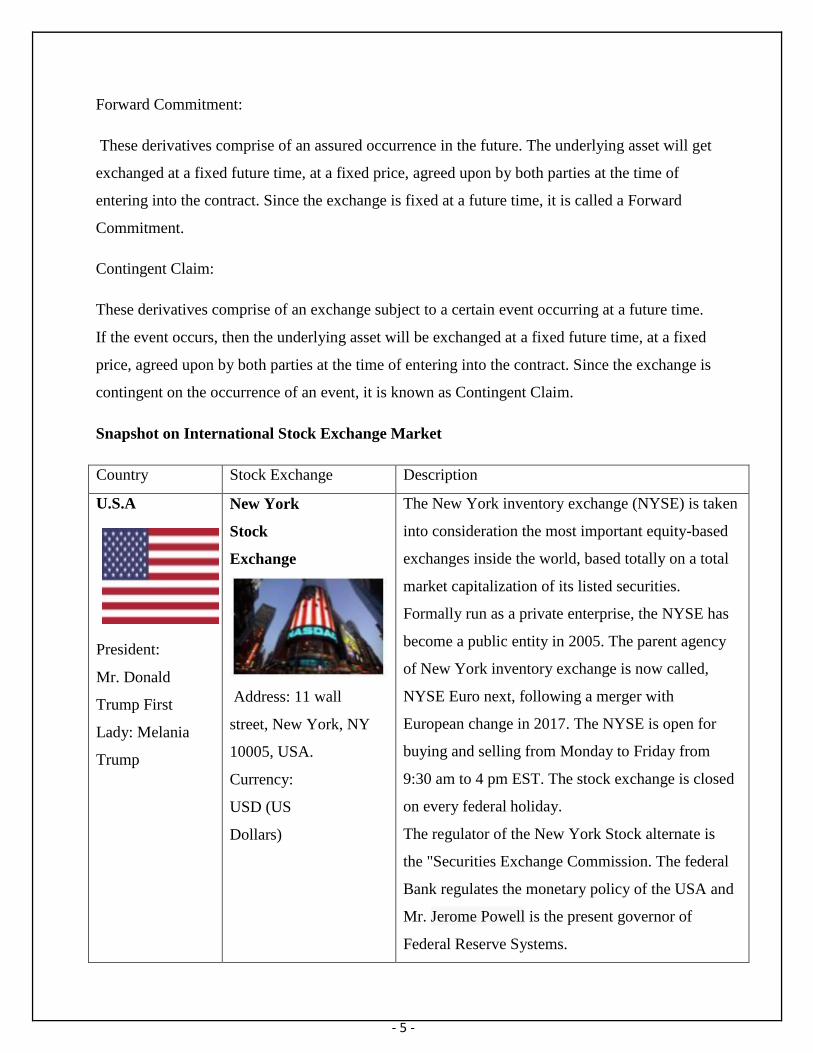
Snapshot on International Stock Exchange Market
Country Stock Exchange Description
U.S.A
President:
Mr. Donald
Trump First
Lady: Melania
Trump
New York
Stock
Exchange
Address: 11 wall
street, New York, NY
10005, USA.
Currency:
USD (US
Dollars)
The New York inventory exchange (NYSE) is taken
into consideration the most important equity-based
exchanges inside the world, based totally on a total
market capitalization of its listed securities.
Formally run as a private enterprise, the NYSE has
become a public entity in 2005. The parent agency
of New York inventory exchange is now called,
NYSE Euro next, following a merger with
European change in 2017. The NYSE is open for
buying and selling from Monday to Friday from
9:30 am to 4 pm EST. The stock exchange is closed
on every federal holiday.
The regulator of the New York Stock alternate is
the "Securities Exchange Commission. The federal
Bank regulates the monetary policy of the USA and
Mr. Jerome Powell is the present governor of
Federal Reserve Systems.

- 6 -
Great Britain
Prime Minister:
Mr. Boris
Johnson
London Stock
Exchange
Address: 10
Paternoster Row,
London EC4M 7LS,
UK Currency: Great
Britain Pound (GBP).
The number one stock exchange in the U.K. and the
biggest in Europe. Originated in 1773, the regional
exchange has been merged in 1973 to shape the
inventory alternate between Great Britain and
Ireland, later renamed "The London Stock
Exchange". The economic instances stock change
(FTSE) one hundred Share Index, or “Footsie”, is
the dominant index, containing 100 of the top blue
chips at the LSE.
China
Presiden
t: Xi
Jinping
Shanghai
Stock
Exchange
Address: 528 Pudong
S Road, Shanghai,
China. Currency:
Renminbi
The biggest stock trade in mainland China,
the Shanghai Stock Exchange is a non-
earnings organization run by using the China
Securities Regulatory Commission (CSRS).
Shanghai Stock change (SSE) is made up of all of the
A-Shares and B-shares that trade on the shanghai
stock Exchange. The index is calculated utilizing the
usage of a base length of a hundred, the first day of
reporting turned into July 15, 1991.
Current Index = Market Cap of Composite Members/
Base length * Base value.
Table no.1- International stock exchange
Basic overview of Foreign Exchange Market:
A true 24-hour market, Forex trading begins each day in Sydney, and moves around the globe as
the business day begins in each financial center followed below:
SYDNEY→ TOKYO→ INDIA→ LONDON→ NEW YORK→ SYDNEY
The FX market plays an important role in the overall International Market because the exchange
rate, the price of one currency in terms of another, is a major determinant of a nation's economic
health and hence the well-being of all people residing in it.
- 7 -
COMPANY PROFILE
JMarathon offers advisory-based total offerings for their customers to successfully monitor their
portfolio and assist them in reaching monetary goals. They also provide offerings regarding stock
market, advisory offerings, funding planning, wealth advent and insurance. The employer is
likewise engaged in educating individuals on worldwide markets to sharpen their talents to
participate in the financial markets. JMarathon Advisory Services Pvt Ltd. came alive to provide
support and guidance to newcomers to the buying and selling internationally. With the know-
how and years of experience in buying and selling, they have custom-designed the training
program and made it easy for a non-professional to recognize the financial marketplace.
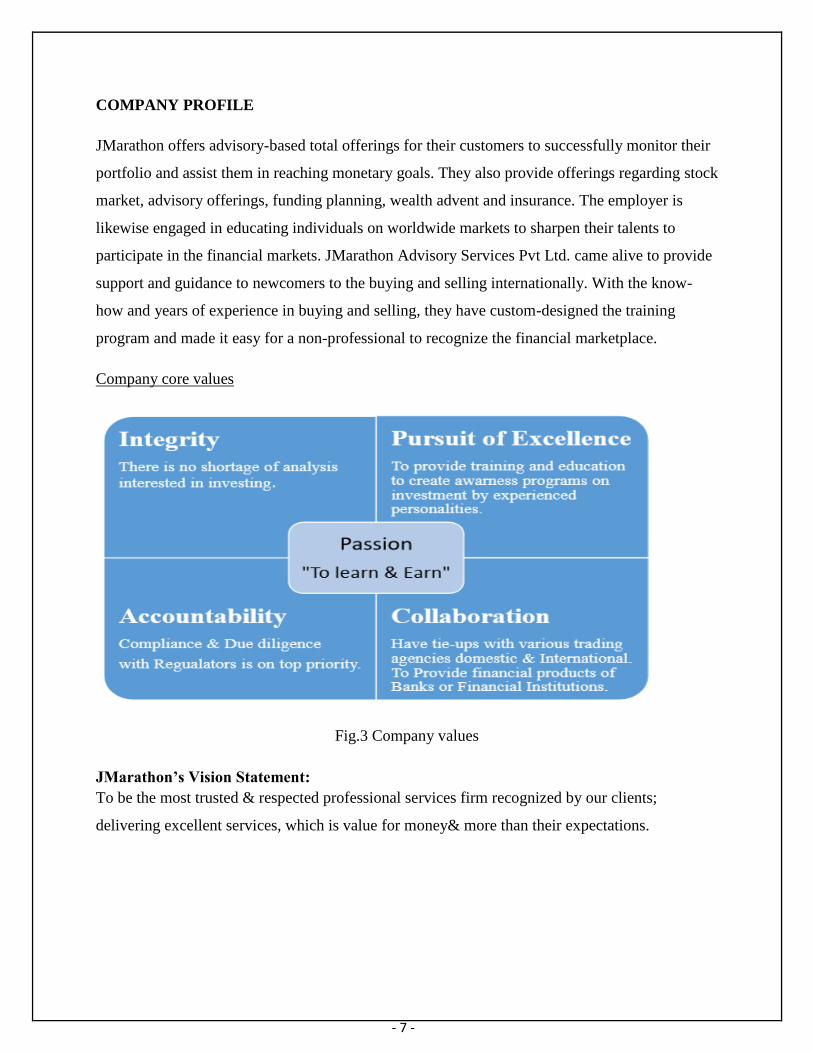
Company core values
Fig.3 Company values
JMarathon’s Vision Statement:
To be the most trusted & respected professional services firm recognized by our clients;
delivering excellent services, which is value for money& more than their expectations.

- 8 -
JMarathon’s Mission Statement:
To develop meaningful & life long relationship with the clients by providing them quality
services & address every aspect of their financial related issues.
Services Profile of JMarathon Advisory Services Pvt Ltd.:
i. Investment Planning:
To protect the destiny from any crisis; we need to make the proper form of investments to attain
certain goals in lifestyles. To invest higher and safe, we want to recognize investments, risks,
inflation, systematic planning, etc. Thus, JMarathon urge to invest in higher future planning.
ii. Indian Stock Market & International Currency Markets:
JMarathon has a tie-up with Zerodha Company to open a Demat account for its customers.
JMarathon additionally has tie-up with Grand Bloom Co Forex Limited to open the International
Forex account.
iii. Advisory Services:
To offer Advisory services like to handle and manage portfolios and other related services
around Bengaluru. A consumer with excessive net-worth investors gets the advice from
experienced and professional consultants right here at JMarathon.
- Wealth control is part of advisory services wherein JMarathon gives recommendations to
businesses for the ideal time to go into the market or IPO's.
- Portfolio control is any other region in which funds being pooled from the customers and
proposes them to invest in blue-chip shares or forex markets’
iv. Training & Development:
Training & undertaking workshops on Indian Stock Market and International Forex Markets for
students to create attention and to enlarge the business. Periodical tests and exercise in the demo
model boosts self-assurance in students to expand hobby within the area of Investment.
- 9 -
Competitor’s information
StarFing is the contender that is into the Forex market and fills in the same as JMarathon. They
give similar administrations to the individuals and the parent organization, and also using the
same trading platform.
SWOT Analysis
Strengths:
• JMarathon is a one-stop solution to investors who seek help or services in financial
planning, wealth creation, reduce tax burden, portfolio management and so on.
• The company uses various technical tools and its unique strategies to analyze the market
and make profits, gradually obtain a client base.
• It is easy to gain clients or investors who wish to invest in the stock market because of the
simple procedures involved in opening a Demat account
• Easy deposit and withdrawal without any hectic procedures.
• The company’s major strength is its loyal clients who invest at regular intervals and also
provide valuable feedback
• They offer transparency in their cost and the clients' records are maintained in a simple
and easily understandable form in order to keep track of the market
• The company has a professional and experienced team of experts who works towards
client satisfaction
• The company offers an online platform and technology-based services so that the clients
can monitor their portfolio and effectively reach their financial goals.
• The company also aims at training young minds and turning them into potential
customers/employees

- 10 -
Weaknesses:
• The company lacks in sales promotion whereby it can earn revenue by attracting
subscribes for their online coaching modules.
• JMarathon focuses mostly on HNIs of the Forex market and doesn't provide much
attention to the Indian stock market.
• The company is liable and has to take complete responsibility to answer its clients in case
of loss and take efforts to further retain them.
• High brokerage charges may sometimes lead to the loss of new clients in a short period
• The company engages in training its employees at a high cost, which is very much
necessary to ahead and trade in the live market
• The cannot handover any client’s portfolio to its employees until they are completely
trained and confident to handle the live account/trade
• Too many inactive accounts or clients may discourage the other potential customers to
invest along with the company
Opportunities
• Emerging companies with similar nature and creates awareness to investors about the
stock market and various financial and advisory services that can be availed by them.
• It is registered with Bloomberg Stock Exchange so it can target other stock exchanges as
well.
• By training and educating the students it helps the company to expand its market.
• Since the standard of living of the people is increasing, they tend to invest or save money
for the future. Here the advisory service of the company comes into picture which may
create demand in the upcoming days.
• The company is also involved in online training courses; it may lead to internal growth
opportunities.
• With the emergence of technology and digital knowledge among the people, it may be
easy to attract potential customers online

- 11 -
Threats
• There are similar companies who are already established or emerging in this industry i.e.,
major competitors in the market is one of the biggest threat
• Global news or any unpredictable situation in the economy may have a great impact on
the market and the stock prices.
• It has to abide by the rules and regulations of our country as well as foreign country
because they deal with the forex market as well.
• The major players in this industry maintain a high standard and hence, the company has
to compete with most of it.
Future growth and prospectus
The investment pattern and the behavior of individuals towards the stock market and other
financial services are increasing day by day. Most of the people are interested to contribute some
part of their earnings towards savings. Among these individuals, not many are aware of how to
save their money and earn interest/profits and also reduce tax burdens. Hence, most of these
people who earn income, seek the help of financial advisors to guide them and make wise
decisions.
JMarathon Advisory Services Pvt Ltd is one such company that works towards providing
financial services and advice to its clients. It also mainly deals with attracting customers to invest
in the Indian stock market and the forex market.
In the past few years, there several stock broking and other financial advisory companies that are
emerging at a fast pace. The company provides account activation within 24 hours and a few
simple steps to open a Demat account. Although the brokerage charges are high, it is
comparatively less compared to major companies in the industry. It provides quality services to
its clients and aims to create a good customer base.
Since the industry is growing rapidly, the company also has higher chances to grow and develop
in the upcoming years
- 12 -
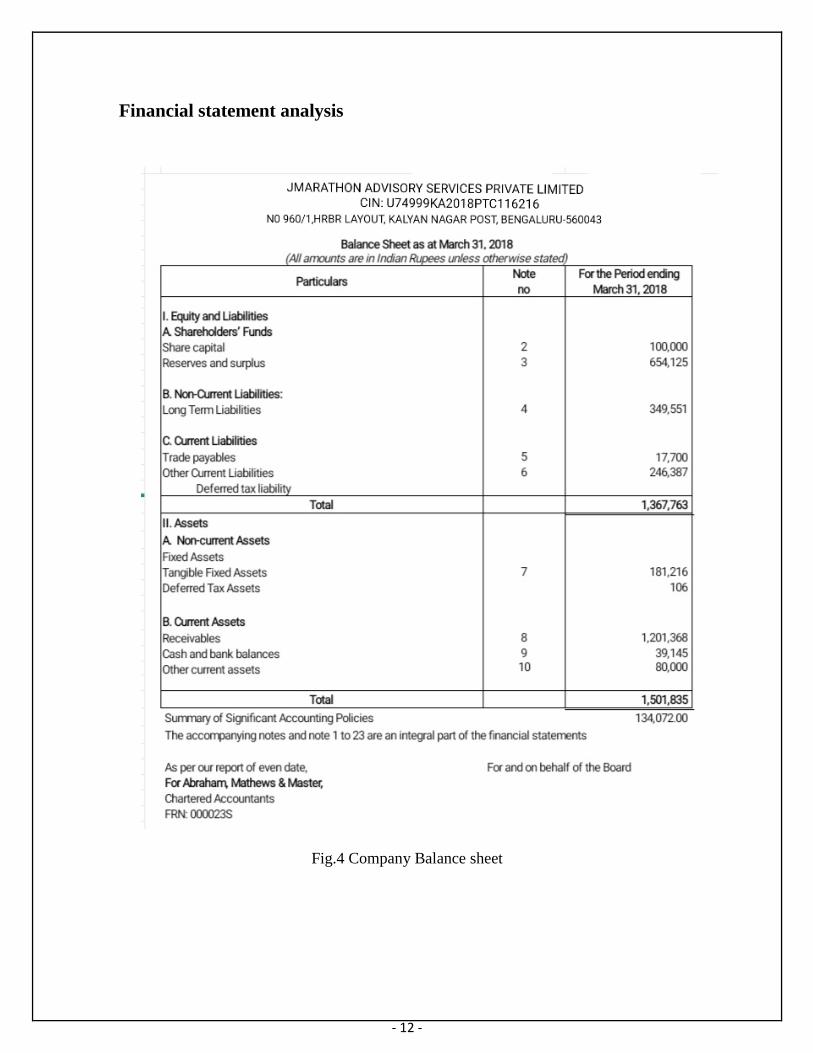
Financial statement analysis
Fig.4 Company Balance sheet

- 13 -
Fig.5 Company provisional balance sheet

- 14 -
1. Current ratio
As of March 2018
Current assets= cash and bank balance + receivables + other current assets
17562+ 600684+40000 = 658246
Current liabilities= trade payable + other current liabilities
17700+ 246387 = 264087
Current ratio= 658246/ 264087 = 2.49 times
As of March 2019
Current assets = cash and bank balance + receivables + other current assets
120496 + 800950 + 153799 = 1075245
Current liabilities= trade payable+ other current liabilities+ deferred tax liability
172900 + 534986+ 18296 = 726812
Current ratio= 1075245/ 726812 = 1.47 times
In the year 2018 (2.49 times) the current ratio is more than 2, which implies that there is a
problem in effectively managing the working capital and not using its current assets efficiently.
In the year 2019(1.47 times) the company’s capacity to meet its short-term obligation is good
and the company can meet its current liabilities efficiently. The company's financial strength is
strong. It also indicates that for every 1 rupee the company owes it has to be able to raise 1.47
rupees to meet its obligations on time.
- 15 -
2. Return on Net Assets
It helps to know how well the company can use its assets to make profits. It helps to analyze the
performance of the management.
Return on Net Assets = Net profit/ (Fixed assets + net working capital)
As of March 2018
Net working capital= current assets- current liabilities
658246-264087 = 394159
Net profit = 125823
Fixed assets = 181322
RONA= 125823/ (181322+394159)
= 0.21 or 21%
It indicates that the company can generate 21% return on its working capital.
As of March 2019
Net working capital= current assets – current liabilities
1075245 – 726812 = 348433
The company’s total expenses are more than its total income and hence it has made a loss of
Rs.141071 in the year 18-19.
3. Debt ratio (Debit-to-Asset ratio)
It measures how much assets of the company are financed by debt and the remaining with equity.
Debt ratio= Total debt/ Total Assets
As of March 2018
Total assets = 839568
Total debt= 349551
Debt ratio= 349551/839568
= 0.41 or 41%
- 16 -
As of March 2019
Total assets = 1271206
Total liabilities = 554468
Debt ratio= 554468/1271206
= 0.43 or 43%
Thus it can be interpreted that in the year 2018, 41% of the organization's property was received
through debt and in the year 2019, 43% of the company’s assets were acquired through debt and
the remaining by owner’s equity.
4. Receivables turnover ratio
It measures how effectively the company can collect its credit.
Receivables turnover ratio = Revenue/ Average account receivables
As of March 2018
Revenue= 1486717
Average account receivables= 600684
Receivables turnover ratio= 1486717/600684
=2.47
As of March 2019
Revenue = 2938262
Average account receivables= 800950
Receivables turnover ratio = 2938262/800950
= 3.6
From the above ratio calculation it can be interpreted that in the year 2017-18, the company has
collected its receivables 2 times a year. In the year 2018-19, the company has collected its
receivables 3 times a year.
A comparative analysis of the two year’s financial statements of the company, it can be observed
that the firm’s financial stability and profit earning capital is increasing. The net worth of the
company is strong and growth aspects are high. Also, the company has the ability to make
returns from its net working capital.
- 17 -
CHAPTER 2
CONCEPTUAL BACKGROUND AND LITERATURE REVIEW
Theoretical background of the study
There are four varieties of trader inside the market
• Intraday: It is a marketplace in which a trader buys and sells the securities/currencies within a
day.
• Short-time period: It is a market wherein a trader takes a role less than 365 days.
• Long-time period: It is a market in which a trader takes a position for greater than 365 days.
• Swing Trader: It is a market where the dealer holds the position for one day to fifteen days.
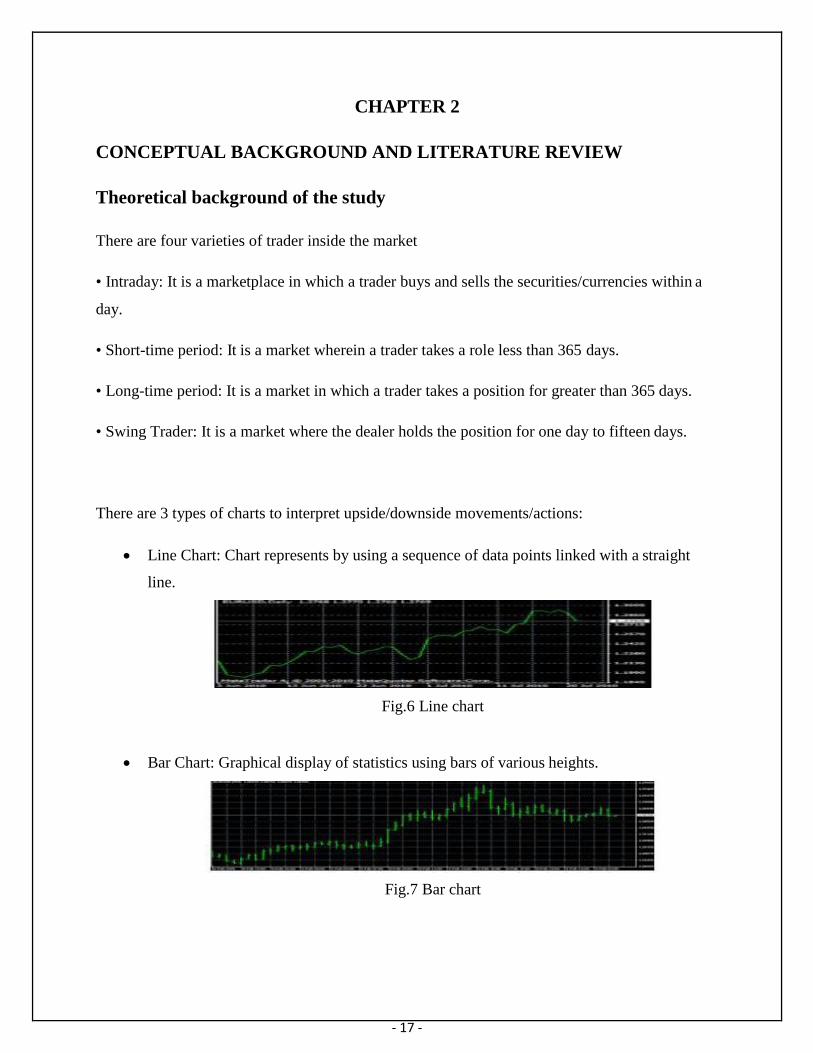
There are 3 types of charts to interpret upside/downside movements/actions:
Line Chart: Chart represents by using a sequence of data points linked with a straight
line.
Fig.6 Line chart
Bar Chart: Graphical display of statistics using bars of various heights.
Fig.7 Bar chart

- 18 -
Candle Stick Charts: Also referred to as Japanese candlesticks which describe the sorts
of technical evaluation and charting used in the stock market, foreign exchange market
and all other markets.
Fig.8 Candlestick chart
Japanese Candlesticks:
Japanese Candlesticks used for any forex period, whether it’s 30-minutes, an hour, one day,
weekly and month-to-month. They used to explain the price action during the given period.
Japanese Candlestick are formed using the open, high, low and close of the selected period.
Let us understand about how candlestick patterns works:
Fig.9 Japanese candlestick
Green Candle Sticks: It is referred to as a Bull candle or buy candle which indicates that the
stock or currency is opening at a low price and closing at a high price.
Red Candle Sticks: It is referred to as Bearish candle or sell candle which indicates that the stock
or currency is opening at a high price and closing at a low price.

- 19 -
Types of Candlestick styles:
1. Hammer Candlestick & Hanging man candlestick
Fig.10 Hammer candlestick & Hanging man candlestick
Hammer candlestick style is a bullish reversal pattern in technical evaluation. The pattern looks
similar to a hammer. It forms a downtrend and is taken into consideration as a market bottom or
support price. Hanging man candlestick pattern is a bearish reversal pattern, which forms an
uptrend and is taken into consideration as a market top or a resistance price.
2. Engulfing Candle:
Bullish engulfing pattern:
Fig.11 Bullish engulfing pattern
It is a bullish reversal style, generally happening at the bottom of a downtrend. This style
consists of two candlesticks. When a sizeable downtrend (red candle) is followed, the new
candle must make a new low and high simultaneously however the preceding candle needs to
cover inside the body. If the bullish is shaped (green candle), note that the market will shoot
up.

- 20 -
Bearish engulfing pattern:
Fig.12 Bearish engulfing pattern
It is a bearish reversal pattern, generally taking place at the top of an uptrend. The style
includes two candlesticks. When there is a huge uptrend (green candle), a new candle is
shaped which makes new high and low simultaneously but the previous candle should cover
inside the body. If the bearish is formed (red candle), note that the market will shoot
downwards.
3. Piercing Candlestick pattern:
Fig.13 Piercing candlestick pattern
Piercing candlestick serves as an indicator that it is time to both purchase a stock or closeout
short positions because the stock may be trending upward soon. As in line with the piercing
candle, the new candle (green candle) should be low and must near down 50% of the preceding
candle. If the significant downtrend follows, it's far bearish or in any other case bullish.

- 21 -
4. Morning Star Pattern:
Fig.14 Morning star pattern
The morning star is a reversal pattern of technical evaluation. This style has three candles
forming at the bottom of the downtrend. The first candle is lengthy and bearish. The second
candle is small and indecisive candlestick. The third candle is long and bullish.
5. Evening Star Pattern:
Fig.15 Evening star pattern
The evening star candlestick style is also a reversal pattern. This pattern has 3 candles. It
appears at a top of an uptrend. The first candle is long and bullish. The second candle is a small
and indecisive candlestick. The third candle is any lengthy and bearish candle.

- 22 -
REVIEW OF LITERATURE
A creation to foreign exchange market: published in the Economic Times (2016). The document
offers an in-depth description of the FOREX marketplace; they include the spot marketplace and
cover the issue of Technical Analysis with emphasis on questions of marketplace efficiency.
The article aids an investor or even a common man to understand how the forex market works 24
hours and on all days, which affords fundamental knowledge for an amateur to trade in the foreign
exchange market.
Martin and Mauer (2003) within the studies paper defined the alternate price threat consequences at
the overseas currency which might be precisely identified which has a shorter period. This sort of
publicity happens with the relevant changes inside the trade fee all through the time of settlement
for a transaction is carried out and with shipping of fee alongside the date of receipt.
Brahmasrene (2002) uncovered Thailand's bilateral exchange stability which has been affected by
using actual alternate prices amongst primary companions in buying and selling is Japan which
falls consequentially inside the change deficit. There was an extra effect in the Japanese
companies in their currency Yen which has been depreciated that still responds by watching for
the inevitable appreciation within the currency Yen. (Jayasinghe and Tsui, 2008)
Koutmos and Martin (2003) treated the exposure of economic foreign money which gave the
result that the monetary sector became having a higher hazard of publicity. The home currency
did not affect the cost of the sector, but in reaction it elevated the forex appreciation. As a
conclusion the house forex become benefitted by using the home foreign money.
E&Y (2007) directed to the examination of company treasuries to understand the special
viewpoints associated with the running of company treasuries. Likewise Mecklai and Business
Standard (2007) directed a danger administration assessment of Indian corporate. These
evaluations were for the maximum part led to understand how agencies are overseeing the
unfriendly effect of energy approximately Indian Rupee towards USD amid 2007. Besides these
opinions are confined to constrained elements of cash advent administration.

- 23 -
A research-led through Jain (2007) was sincerely constrained to Developing MIS for Foreign
Exchange Exposure Management. These opinions have been restricted just to a constrained part of
money presentation management in India though the prevailing studies are a whole overview
identifying with all components of cash presentation administration. The month-to-month facts
from the US stocks had been taken from the center for studies in protection fees became used in
empirical evaluation. The base home currency for one unit within the overseas currency is given for
change charge variable, the co-green of pricing wherein it turned into anticipated by using the use
of the alternative sensitivity coefficients with the assist of having the unrelated and nonlinear
practices.
An examination directed employing Dash and Madhava (2008) dissected the impact of valuation
for Indian rupee that came about in 2007 on Indian IT division. The exam changed into limited
simply to realize the effect of rupee gratefulness and that too simply on IT location. While the
present exam identifies with usually speaker administration of money presentation of diverse
classes of commercial enterprise endeavors.
An investigation by Sivakumar and Sarkar (2008) changed into an attempt to recognize what forms
of subsidiary gadgets are being utilized by an Indian company for supporting cash presentation. The
examination secured the simplest 8 firms and that excessively based because it had been 38 on one
12 months yearly document. While the prevailing exam covers now not just insights with
appreciation to the subsidiary instruments utilized by business ventures, yet further distinctive parts
of cash presentation management as expressed before. Besides, show observe depends on essential
statistics and take a look at estimate is likewise generous.
Malliaropulos (1998) evolved a connection in the differentials of global stock return to the US and
also a mild deviation on the purchasing power parity theory. The quarter-end 23 stock indices of
few countries were accrued and additional info of alternate rate of dollar, fee indices from the
organization for monetary corporation and development and also statistics from countrywide
money owed facts base was extracted throughout 1973 to 1992. The researcher had also advanced
a sampling distribution approach and the t-statistics via using a free bootstrap technique.
- 24 -
Grant and Marshall (1997) had a detailed have a look at the survey conducted at the UK
corporations to determine the usage of derivatives. The authors inspected the reasons for the use of
the derivatives, the quantity of chance associated with the derivatives, what kind of control
mechanism is used to analyze the reporting regions which might be being governed, to what extent
the derivatives are utilized. From the above evaluation of the survey it showed a widespread and
huge utilization of derivatives and its different sorts along with swaps, options and forward. The
primary reason for the derivatives used is to control the forex and interest charge exposures and
their pertaining risk. There changed into also a restricted utilization of the derivatives that have
been present but exceptionally, due to increase of equity and commodity risk. The treasurer turned
into more cautious because of the illiquidity in underlying assets in their firms in the use of various
types of derivatives.
Makar and Huffman (1997) inspected the use of foreign exchange derivatives which have been
given significance and being utilized by the corporations within the US to help in handling the
currency publicity. The derived outcomes confirmed the foreign exchange derivatives which have
been related to overseas forex danger. It had additionally proven that the results have not been a
complicated problem for the member states and different industries that turned into associated with
specific firms and the recording years. There became evidence where they used different strategies
in hedging which had been given.
Kedia and Mozumdar (1999) inspected the part of the traded forex within the publicity of hazard
management sports. There was a courting within the publicity of foreign charge exposure with
analysis of the denominated debt in foreign forex which became given in a sample of surveys
conducted inside the US corporations. Thus the affiliation regarding the forex denominated debt
and the publicity additionally takes location within the character currency level.
Antonious et al (1998) were analyzed the pastime of the marketplace chance of the fairness
premium within the London stock change which was beforehand of the sterling club inside the
ERM. The month-to-month information has been utilized and taken from 1980 January to 1993
august for security returns of character and variables of macroeconomic at the traded groups of
London inventory trade. From the statistics move base all of the important records turned into
collected at the diverse currencies such as pound sterling Dutch mark. In the empirical analysis of
the equity hazard premium the arbitrage pricing concept changed into used.

- 25 -
Bartov and Bodnar (1994) analyzed the required variations within the equity value and the dollar.
Here the period of the have a look at degrees from the fiscal yr 1978 to the fiscal yr 1989. For the
firms which have given generated massive losses and benefit at the foreign currencies in their
monetary annual reviews the researchers have used the COMPUSTAT Merged-Expanded Annual
Industrial file and complete coverage report. For this cause, the information turned into amassed
about the stock charges on the New York Stock Exchange (NYSE), Centre for Research in Security
Prices (CRSP), Daily Return report or the National Association of Security Dealers Automated
quotation (NASDAQ), American Stock Exchange (AMEX).
Prasad and Rajan (1995) did the initial take a look at the effect at the fluctuation on the change rate
within the diverse locations along with Germany, the United Kingdom, Japan and the United States
inside the valuation of fairness. Authors have additionally analyzed the alternate danger exposure in
the above markets.
The contracts, charts for development and boom of forex futures in futures in India were studied by
Chakravarty and Praveen (2009) from inspection in 2008. It additionally highlighted the present
connectivity between commodity and currency markets. It emphasized on better trade price with
volatility of Indian alternate price towards the US rate (INR-USD) having the capacity to adapt
with the market for extending buying and selling hours, at some stage in the traditional and non-
conventional trading hours. This study paper additionally gave guidelines for the brand new
products and additionally to contract settlement through alternative mechanisms.
Ma and Kao (1990) inspected the reactions in the direction of the stock price in affiliation with the
adjustments in alternate rates. The case with advanced international locations of six is studied
specifically in Canada, West Germany, Italy, France, Japan, and the United Kingdom. Two-
component versions were performed for empirical evaluation as the pattern period became for the
duration of1973 of January to 1983 of December.
Monthly change charges and Monthly stock indices are derived as of the Federal Reserve from the
Exchange charges and the Interest Rate Tape. The country’s forex and various stock price
movements are the two influences which had been exhibited in this paper.

- 26 -
Lois Cheirer advised the use of the machine and technique for handing over advisory answers of
forex danger management by using developing a Consistent with concepts of the prevailing
invention which has been revealed within the designated market. The disclosed machine creates a
publicity model for each individual for having regular in the consumer danger control coverage and
along with the reaction obtained from the person’s records and the outside pricing facts for the
formation of budget or pricing determination. The disclosed system is used to determine the best
size of risk and also have an associated hedge opportunity, has a manner for hedge instrument with
constant within the economic forecasts from the person.
Ma and Kao (1990) inspected the reactions closer to the inventory charge concerning the
adjustments in trade charges. The case with advanced nations of six is studied particularly in
Canada, West Germany, Italy, France, Japan, and the United Kingdom. Two aspect fashions had
been carried out for empirical evaluation as the sample length was at some point of 1973 of January
to 1983 of December. Monthly alternate fees and Monthly stock indices are derived as of the
Federal Reserve from the Exchange prices and the Interest Rate Tape. The country's foreign money
and various inventory rate movements are the effects which were exhibited in this paper.
Mun (2007) in this study paper they validated the correlation of cross-market for worldwide stock
marketplace for mature markets concerning the US market, in which they identified the greater
alternate charge variability which had greater market volatility. It later on, placed down the US
stock market volatility. There become a sturdy correlation among alternate fee publicity and the
neighborhood equity returns as opposed to US market returns. The worldwide traders tend to get
higher returns within the US inventory markets, while there is a slowdown within the
neighborhood stock market as a result there is a transfer of price range inside the nearby markets
which therefore ends in depreciation within the nearby currency.
- 27 -
Currency market
(Spot delivery)
Training on Forex market
Client acquisition
Data processing (subject
to documentation)
Incorporate Meta Trader 5
platform
Technical, Fundamental and Sentimental Analysis
sentimental analysis
Reports on Analysis- Approval
Place the order/trade
Post Analysis on orders
Commodity market
(Spot delivery)
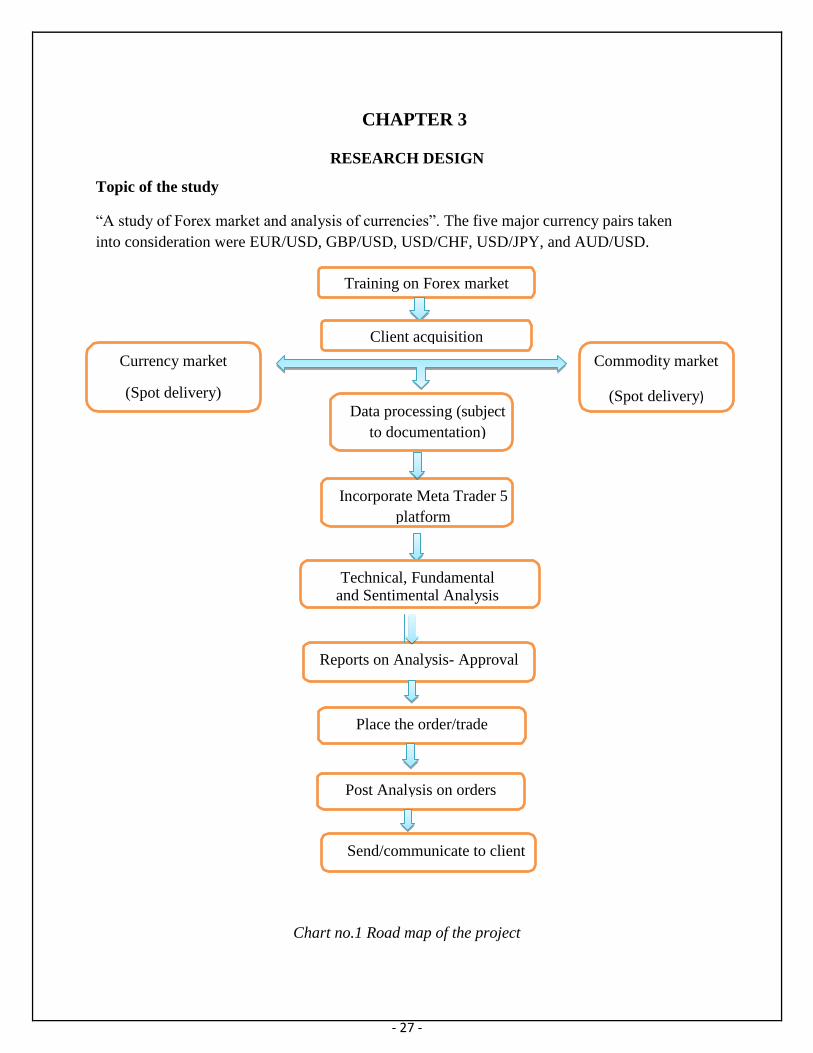
Topic of the study
CHAPTER 3
RESEARCH DESIGN
“A study of Forex market and analysis of currencies”. The five major currency pairs taken
into consideration were EUR/USD, GBP/USD, USD/CHF, USD/JPY, and AUD/USD.
Chart no.1 Road map of the project
Send/communicate to client

- 28 -
Objectives of the study:
• To learn and analyze the basics of the International foreign exchange market in a
practical environment.
• To carry out portfolio analysis of various currencies for High Net worth Investors
(HNI’s).
• To analyze the watch list and make buy or sell decision to forex derivatives Over the
Counter (OTC) based on pre-hand studies.
• To apprehend how volatility occurs in currency derivatives with the assist of technical
and fundamental analysis.
• To study forms of currencies traded in the forex market and how they alternate with the
help of forex charts, graphs and other data.
Scope & Importance of Forex Trading:
In comparison to other financial trade markets, foreign exchange day – trading or intraday trade
has several advantages; such as liquidity, 24-hour trading, leverage, taking advantage of
decreasing value of currency. Currency trading is in many ways, more beneficial than bulling
and selling futures or stocks.
The forex market is a 24-hour market. It means that the traders of forex can select their own
hours to carry out their trading business. Foreign day-trading demands a lot much less starting
capital than day stock trading, hence, buyers and investors can truly begin with little money
inside the forex market. Traders can focus on numerous main currencies handiest, as opposed to
tens and thousands of shares

- 29 -
Data Collection:
For the purpose of analyses:
Primary records are collected from the live trading market i.e., Meta trader 5 platform for forex
trade in JMarathon Advisory Services Pvt Ltd.
Secondary information is accumulated from the internet and online articles posted on platforms
such as forexfactory.com, investing.com, action forex.
Limitations of the Project:
The Company trades in 36 various currencies but intern trainees are permissible to trade
only in five major currency pairs. It is not possible to trade commodities (gold and silver)
in the demo account.
Due to speedy and high volatility in the forex market, predicting or interpretation won’t
be 100% accurate results.
Using only a few technical analysis indicators and tools won’t give the required result.
The target customers are restricted to HNI’s i.e. individuals or investors whose annual
income is more than 5 lakh.
- 30 -
CHAPTER 4
ANALYSIS AND INTERPRETATION
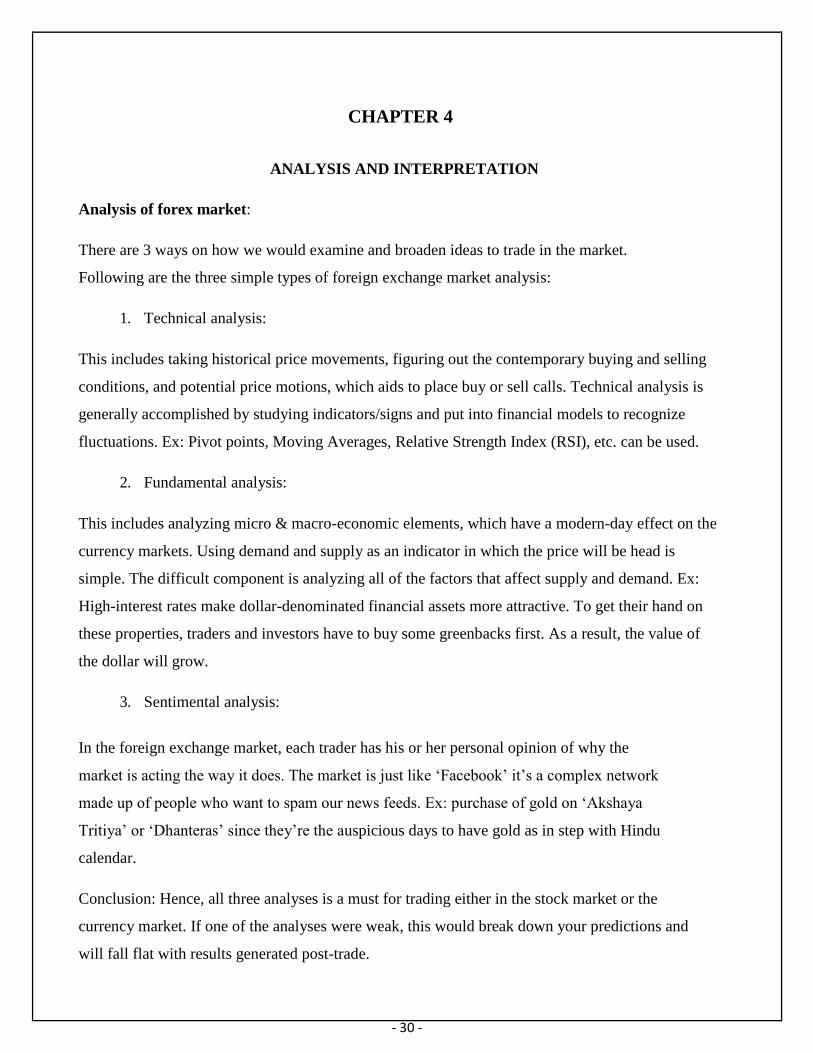
Analysis of forex market:
There are 3 ways on how we would examine and broaden ideas to trade in the market.
Following are the three simple types of foreign exchange market analysis:
1. Technical analysis:
This includes taking historical price movements, figuring out the contemporary buying and selling
conditions, and potential price motions, which aids to place buy or sell calls. Technical analysis is
generally accomplished by studying indicators/signs and put into financial models to recognize
fluctuations. Ex: Pivot points, Moving Averages, Relative Strength Index (RSI), etc. can be used.
2. Fundamental analysis:
This includes analyzing micro & macro-economic elements, which have a modern-day effect on the
currency markets. Using demand and supply as an indicator in which the price will be head is
simple. The difficult component is analyzing all of the factors that affect supply and demand. Ex:
High-interest rates make dollar-denominated financial assets more attractive. To get their hand on
these properties, traders and investors have to buy some greenbacks first. As a result, the value of
the dollar will grow.
3. Sentimental analysis:
In the foreign exchange market, each trader has his or her personal opinion of why the
market is acting the way it does. The market is just like ‘Facebook’ it’s a complex network
made up of people who want to spam our news feeds. Ex: purchase of gold on ‘Akshaya
Tritiya’ or ‘Dhanteras’ since they’re the auspicious days to have gold as in step with Hindu
calendar.
Conclusion: Hence, all three analyses is a must for trading either in the stock market or the
currency market. If one of the analyses were weak, this would break down your predictions and
will fall flat with results generated post-trade.

- 31 -
Technical Analysis in the Forex Market
The following are the technical analysis tools
1. Support and Resistance:
Fig.16 Support and resistance
From the above diagram, the zigzag style is making its way up (bull or buy market). When the
forex marketplace actions up and pulls back, the highest point reached earlier than it pulled back is
called Resistance. As the market maintains going up again, the lowest point reached before it,
started returned is called Support. These acts as a base to decide if the price goes up or down i.e.
increase or decrease in the future.
2. Stop Loss and Take Profit (S/L and T/P)
Fig.17 Stop loss and Take profit
Stop Loss or Limit order: An order positioned with the platform to promote the currency when it
reaches a certain rate.
Take Profit: It is a pending order that lets in fixing the profit automatically. A clever trader
constantly keeps stop loss and takes profit/income at the same time as executing orders.

- 32 -
3. Moving Averages:
Fig.18 Moving average
This trend allows us to forecast future prices. By looking at the slope of the moving average, we
can higher determine and predict the potential path of the market price.
4. Fibonacci:
Fig.19 Fibonacci levels
Fibonacci indicator enables one to become aware of tiers wherein the price might also rebound. For
drawing the extension, it is diagnosed that the start and end of the price movement, which we
anticipate to be extended, a new pattern is created. In the above fig. the 5-minute chart of the
USDCHF pair, a sharp movement beginning (blue arrow in diagram) from support levels is
recognized. Careful observation of the diagram on the left interprets that not only the price
rebounded numerous times at the extension tiers of the indicator, but added that these stages served
as strong attractors pulling the price closer to themselves.

- 33 -
5. Bollinger Bands:
Fig.20 Bollinger bands
Bollinger bands, a chart indicator developed by way of John Bollinger used to measure a
market’s volatility. This trend tells us whether the market is quiet or whether or not the market is
loud. When the market is quiet, the bands contract and when the market is loud, the bands
expand. If we closely take a look at the chart on the left, whilst the price is quiet, the bands are
near together and when the price movements up, the bands spread apart.
6. Pivot Points
PRICE EURUSD GBPUSD USDCHF
Open price 1.1093 1.3007 0.9678
High price 1.1098 1.3013 0.9687
Low price 1.1088 1.2994 0.9671
Close price 1.1096 1.3011 0.9677
Pivot Point 1.109375 1.300625 0.967825
Table no.2 Pivot points (PP)
The professional forex traders use pivot points to pick out potential support and resistance stages. A pivot point and its
support or resistance levels are places at which the way of price movements or actions can probably change.
The pivot point and its associated support and resistance levels are calculated by using the ultimate trading season’s
open, high, low and close price
Pivot Point (PP) = Average of (Open price+ high price+ low price + close price)
- 34 -
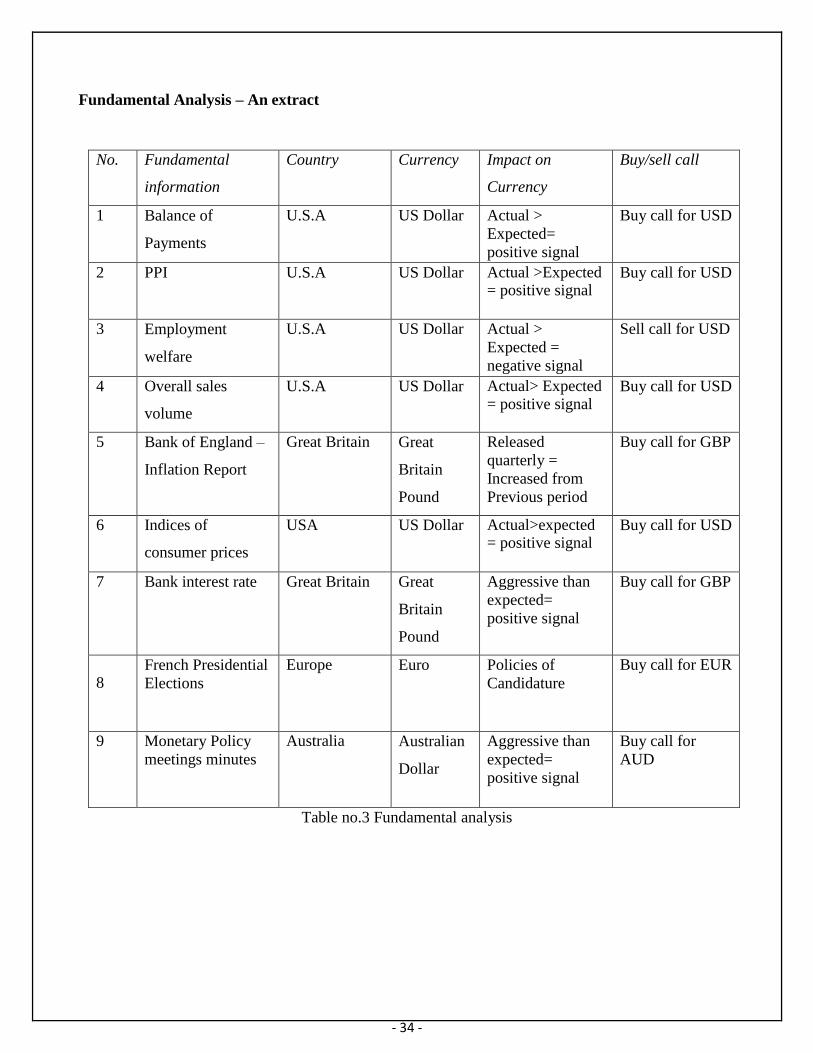
Fundamental Analysis – An extract
No. Fundamental
information
Country Currency Impact on
Currency
Buy/sell call
1 Balance of
Payments
U.S.A US Dollar Actual >
Expected=
positive signal
Buy call for USD
2 PPI U.S.A US Dollar Actual >Expected = positive signal
Buy call for USD
3 Employment
welfare
U.S.A US Dollar Actual >
Expected =
negative signal
Sell call for USD
4 Overall sales
volume
U.S.A US Dollar Actual> Expected = positive signal
Buy call for USD
5 Bank of England –
Inflation Report
Great Britain Great
Britain
Pound
Released
quarterly =
Increased from
Previous period
Buy call for GBP
6 Indices of
consumer prices
USA US Dollar Actual>expected = positive signal
Buy call for USD
7 Bank interest rate Great Britain Great
Britain
Pound
Aggressive than
expected=
positive signal
Buy call for GBP
8
French Presidential
Elections
Europe Euro Policies of
Candidature
Buy call for EUR
9 Monetary Policy
meetings minutes
Australia Australian
Dollar
Aggressive than
expected=
positive signal
Buy call for
AUD
Table no.3 Fundamental analysis

- 35 -
Sentimental Analysis
Sl. no Sentimental
information
Country Currency/
Commodity
Impact Buy/sell
1 Ganesh Chaturthi India Silverware
(silver)
Increase in
price
Buy call
2 Marriage ceremony India Jewelry
(gold)
Increase in
price
Buy call
3 Donald Trump’s
American first
coverage
USA USD Price goes up Buy call
Table no.4 Sentimental analysis
Forex market 24-hour market timings:
Country Currency Symbol Market Open (IST)
Australia Australian Dollar AUD 2.30 am
Japan Japanese Yen JPY 7.30 am
India Indian Rupees INR 9.30 am
Great Britain Great Britain Pound GBP 2.30 am
U.S.A US Dollars USD 9.30 am
Table no.5 Foreign exchange market timings
- 36 -
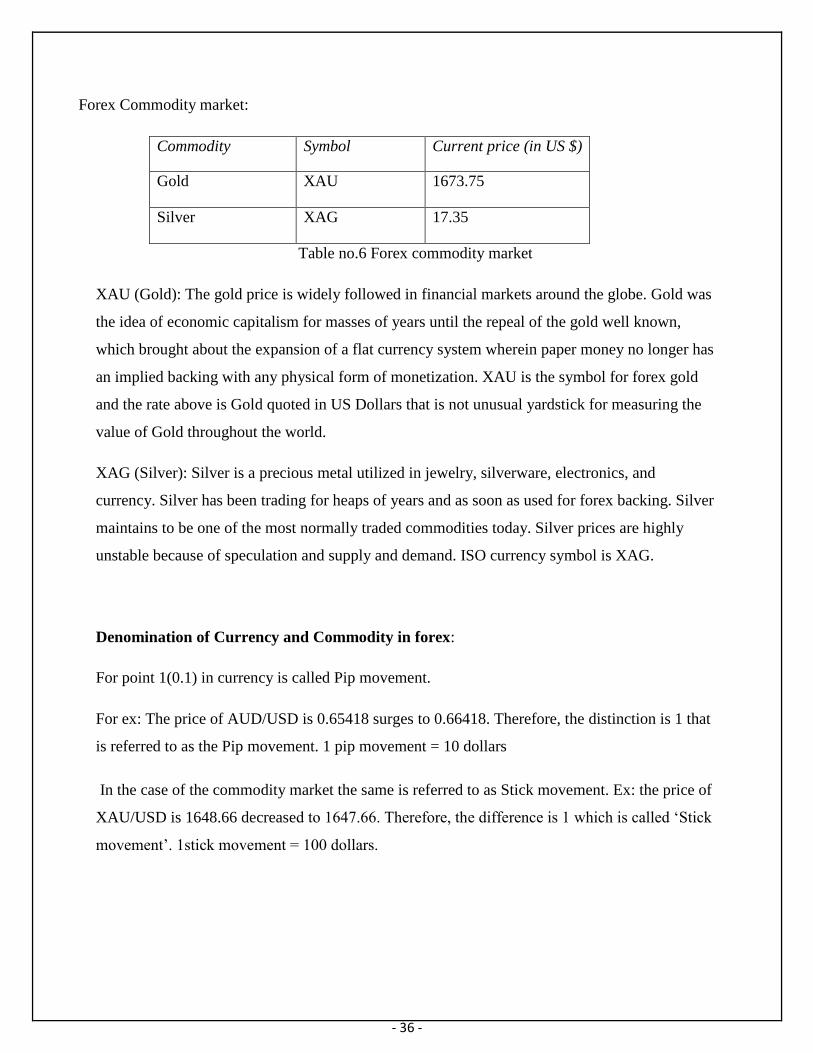
Forex Commodity market:
Commodity Symbol Current price (in US $)
Gold XAU 1673.75
Silver XAG 17.35
Table no.6 Forex commodity market
XAU (Gold): The gold price is widely followed in financial markets around the globe. Gold was
the idea of economic capitalism for masses of years until the repeal of the gold well known,
which brought about the expansion of a flat currency system wherein paper money no longer has
an implied backing with any physical form of monetization. XAU is the symbol for forex gold
and the rate above is Gold quoted in US Dollars that is not unusual yardstick for measuring the
value of Gold throughout the world.
XAG (Silver): Silver is a precious metal utilized in jewelry, silverware, electronics, and
currency. Silver has been trading for heaps of years and as soon as used for forex backing. Silver
maintains to be one of the most normally traded commodities today. Silver prices are highly
unstable because of speculation and supply and demand. ISO currency symbol is XAG.
Denomination of Currency and Commodity in forex:
For point 1(0.1) in currency is called Pip movement.
For ex: The price of AUD/USD is 0.65418 surges to 0.66418. Therefore, the distinction is 1 that
is referred to as the Pip movement. 1 pip movement = 10 dollars
In the case of the commodity market the same is referred to as Stick movement. Ex: the price of
XAU/USD is 1648.66 decreased to 1647.66. Therefore, the difference is 1 which is called ‘Stick
movement’. 1stick movement = 100 dollars.

- 37 -
Analysis of currencies
The 5 different major currency pairs were analyzed using technical analysis tools and trends
including Pivot Point, Candlesticks, Relative Strength Index (RSI), Stochastic Oscillators and
Moving Average.
A demo account was created with MetaQuotes Software Corp.; account type- Forex Hedged
USD, leverage- 1:100, and a deposit of 3000 USD.
1. EUR/USD
This currency pair indicates how many U.S. Dollars are required to get one euro currency; i.e., the quote
currency is traded with the base currency. Trading the EURUSD currency pair is also referred to as trading
the ‘euro’. The EUR/USD pair has become the widely-traded pair within the world because it constituents
two of the most important economies.
Daily data of EURUSD from 20th
Jan to 14th
Feb 2020
Date Open High Low Close
20-01-2020 1.1091 1.1103 1.1077 1.1096
21-01-2020 1.1095 1.1119 1.1080 1.1083
22-01-2020 1.1082 1.1099 1.1071 1.1095
23-01-2020 1.1093 1.1108 1.1037 1.1055
24-01-2020 1.1056 1.1062 1.1020 1.1025
27-01-2020 1.1027 1.1038 1.1010 1.1020
28-01-2020 1.1018 1.1026 1.0998 1.1021
29-01-2020 1.1023 1.1029 1.0993 1.1012
30-01-2020 1.1011 1.1040 1.1003 1.1033
31-01-2020 1.1032 1.1097 1.1018 1.1097
03-02-2020 1.1095 1.1097 1.1037 1.1062

- 38 -
04-02-2020 1.1060 1.1065 1.1033 1.1043
05-02-2020 1.1045 1.1049 1.0994 1.0999
06-02-2020 1.0998 1.1015 1.0964 1.0982
07-02-2020 1.0981 1.0986 1.0942 1.0947
10-02-2020 1.0945 1.0959 1.0909 1.0911
11-02-2020 1.0913 1.0925 1.0893 1.0917
12-02-2020 1.0917 1.0926 1.0865 1.0875
13-02-2020 1.0876 1.0891 1.0835 1.0842
14-02-2020 1.0843 1.0862 1.0829 1.0831
Table no.7 Daily data of EURUSD
Pivot Point calculation from the above data:
Date Pivot
Point
R1 S1 R2 S2 R3 S3
20-01-2020 1.109175 1.11065 1.10805 1.11178 1.10658 1.10735 1.10545
21-01-2020 1.109425 1.11085 1.10695 1.11333 1.10553 1.10905 1.10305
22-01-2020 1.108675 1.11025 1.10745 1.11148 1.10588 1.10675 1.10465
23-01-2020 1.107325 1.11095 1.10385 1.11443 1.10023 1.10355 1.09675
24-01-2020 1.104075 1.10615 1.10195 1.10828 1.09988 1.10205 1.09775
27-01-2020 1.102375 1.10375 1.10095 1.10518 1.09958 1.10105 1.09815
28-01-2020 1.101575 1.10335 1.10055 1.10438 1.09878 1.09905 1.09775
29-01-2020 1.101425 1.10355 1.09995 1.10503 1.09783 1.09865 1.09635
30-01-2020 1.102175 1.10405 1.10035 1.10588 1.09848 1.10025 1.09665
31-01-2020 1.106100 1.11040 1.10250 1.11400 1.09820 1.1011 1.0946
03-02-2020 1.107275 1.11085 1.10485 1.11328 1.10128 1.10255 1.09885
04-02-2020 1.105025 1.10675 1.10355 1.10823 1.10183 1.10305 1.10035
05-02-2020 1.102175 1.10495 1.09945 1.10768 1.09668 1.09935 1.09395
06-02-2020 1.098975 1.10155 1.09645 1.10408 1.09388 1.09635 1.09135

- 39 -
07-02-2020 1.096400 1.09860 1.09420 1.10080 1.09200 1.0942 1.0898
10-02-2020 1.093100 1.09530 1.09030 1.09810 1.08810 1.0915 1.0853
11-02-2020 1.091200 1.09310 1.08990 1.09440 1.08800 1.0887 1.0867
12-02-2020 1.089575 1.09265 1.08655 1.09568 1.08348 1.08645 1.08045
13-02-2020 1.086100 1.08870 1.08310 1.09170 1.08050 1.0839 1.0775
14-02-2020 1.084125 1.08535 1.08205 1.08743 1.08083 1.08375 1.07875
Table no.8 Pivot point of EURUSD
Pivot Point (PP) = (Open price + High price + Low price + Close price)/ 4
R1 (Resistance 1) = 2*PP – Low price
S1 (Support 1) = 2*PP – High price
R2 (Resistance 2) = PP + (High price-Low price)
S2 (Support 2) = PP- (High price- Low price)
R3 (Resistance 3) = High price +2 * (PP – Low price)
S3 (Support 3) = Low price - 2* (High price-PP)
- 40 -
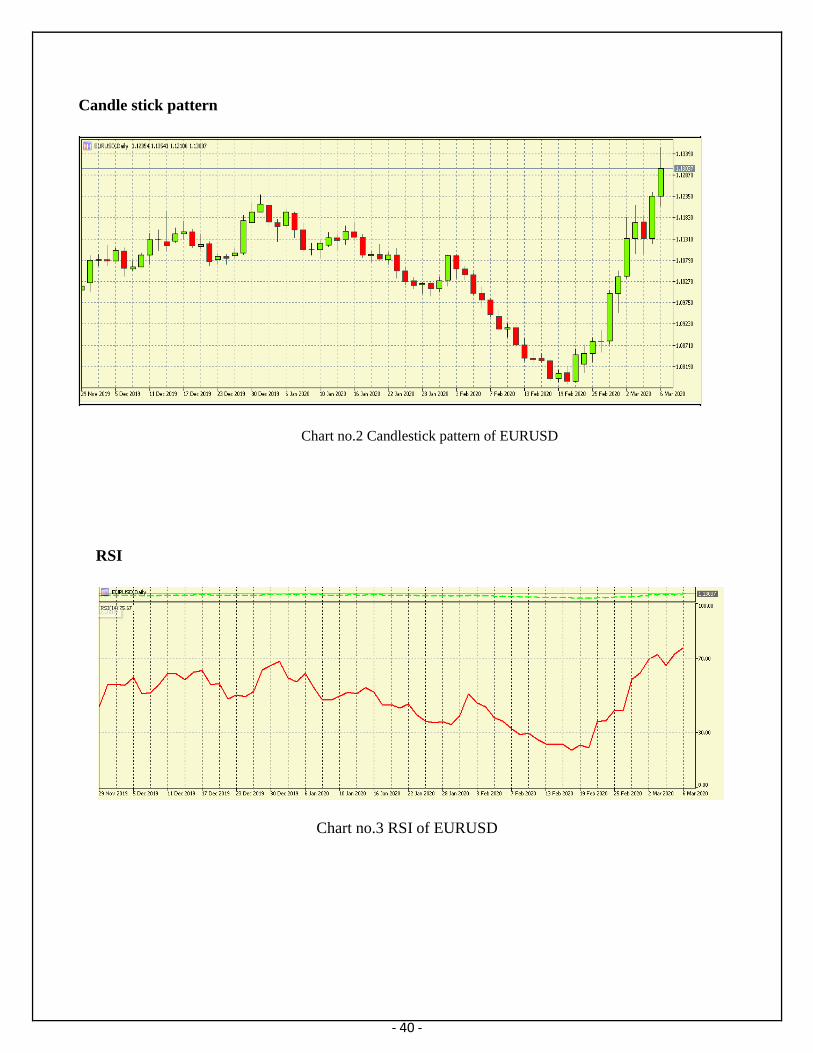
Candle stick pattern
Chart no.2 Candlestick pattern of EURUSD
RSI
Chart no.3 RSI of EURUSD

- 41 -
Moving Average
Chart no. 4 Moving average of EURUSD
Stochastic Oscillator
Chart no.5 stochastic oscillator of EURUSD

- 42 -
Transaction/ Trade history:
20.01.2020 – placed Buy order at 1.11003 and closed position at 1.10997- 3$ loss
22.01.2020- placed Buy order at 1.10839 (S/L: 1.1082 T/P: 1.10842) – 1.50$ profit
23.01.2020- placed Buy order at 1.10850 and closed position at 1.10835 – 7.50$ loss
23.01.2020- placed Sell order at 1.10829 and closed position at 1.10883 – 27$ loss
28.01.2020- placed Sell order at 1.10225 and closed position at 1.10137 – 44$ profit
30.01.2020- placed Sell order at 1.10142 and closed position at 1.10154 – 6$ loss
31.01.2020- placed Buy order at 1.10164 and closed position at 1.10241 – 38.50$ profit
03.02.2020- placed Sell order at 1.10827 and closed position at 1.10612 – 107.50$ profit
Interpretation:
The above tools were used on a daily basis to analyze and place orders (buy/sell).
One of the strategies of looking into the Stochastic Oscillator is to look out for overbought regions
(above 80) and oversold regions (below 20). The Stochastic Oscillator is below 20 for the above
chart. This is an oversold reading. However, a sign inside the market will change when the
Oscillator crosses above 20.
On 03.02.2020, EURUSD made a profit of 107.50 dollars, by placing a buy call of 0.50 at 1.10612.
This was a possible graph showed an upward signal and the current price was above the main pivot
point. The market had a bullish trend.
From 04.02.2020 the market has a bearish trend, where the graph is moving downwards. In this
situation and with proper analysis, profit can be earned if the currencies are sold according to the
current price

- 43 -
2. GBPUSD
GBP (Great Britain Pound) v/s US Dollars is one of the most traded and also the major currency
pairs across the globe. It is also commonly referred as trading the ‘cable’. It indicates how many
USD (quote currency) is required to trade (buy/sell) one British Pound (base currency).
Daily data of GBPUSD from 20th
Jan to 14th
Feb 2020
Date Open High Low Close
20-01-2020 1.3046 1.3064 1.3002 1.3045
21-01-2020 1.2961 1.307 1.2944 1.3042
22-01-2020 1.2953 1.2992 1.2937 1.296
23-01-2020 1.2915 1.2969 1.2895 1.2952
24-01-2020 1.2893 1.2946 1.2872 1.2914
27-01-2020 1.2927 1.2959 1.2881 1.2889
28-01-2020 1.3 1.3003 1.2921 1.2928
29-01-2020 1.3032 1.307 1.2956 1.3002
30-01-2020 1.2995 1.3046 1.2941 1.3031
31-01-2020 1.3204 1.3204 1.2983 1.2998
03-02-2020 1.3092 1.3209 1.3076 1.3204
04-02-2020 1.3018 1.311 1.2977 1.3093
05-02-2020 1.3029 1.3031 1.2989 1.3021
06-02-2020 1.3056 1.3066 1.2976 1.3027
07-02-2020 1.308 1.3104 1.3042 1.3058
10-02-2020 1.3122 1.3171 1.3058 1.3074
11-02-2020 1.3141 1.3152 1.3097 1.3124
12-02-2020 1.3048 1.3154 1.3035 1.3142
13-02-2020 1.301 1.3082 1.2995 1.3049
14-02-2020 1.3016 1.3016 1.2962 1.3009
Table no.9 daily data for GBPUSD

- 44 -
Pivot Point calculation:
Date PP R1 S1 R2 S2 R3 S3
20-01-2020
1.303925
1.30765
1.30145
1.31013
1.29773
1.29895
1.29525
21-01-2020 1.300425
1.30645
1.29385
1.31303
1.28783
1.29495
1.28125
22-01-2020
1.296050
1.29840
1.29290
1.30155
1.29055
1.2945
1.2874
23-01-2020
1.293275
1.29705
1.28965
1.30068
1.28588
1.28935
1.28225
24-01-2020 1.290625
1.29405
1.28665
1.29803
1.28323
1.28775
1.27925
27-01-2020
1.291400
1.29470
1.28690
1.29920
1.28360
1.2893
1.2791
28-01-2020
1.296300
1.30050
1.29230
1.30450
1.28810
1.2919
1.2841
29-01-2020
1.301500
1.30740
1.29600
1.31290
1.29010
1.2952
1.2846
30-01-2020 1.300325
1.30655
1.29605
1.31083
1.28983
1.29215
1.28555
31-01-2020
1.309725
1.32115
1.29905
1.33183
1.28763
1.29755
1.27695
03-02-2020
1.314525
1.32145
1.30815
1.32783
1.30123
1.30705
1.29485
04-02-2020
1.304950
1.31220
1.29890
1.31825
1.29165
1.2965
1.2856
05-02-2020 1.301750
1.30460
1.30040
1.30595
1.29755
1.2974
1.2962
06-02-2020
1.303125
1.30865
1.29965
1.31213
1.29413
1.29555
1.29065
07-02-2020
1.307100
1.31000
1.30380
1.31330
1.30090
1.3046
1.2976
10-02-2020
1.310625
1.31545
1.30415
1.32193
1.29933
1.30745
1.29285
11-02-2020 1.312850
1.31600
1.31050
1.31835
1.30735
1.3089
1.305
12-02-2020
1.309475
1.31545
1.30355
1.32138
1.29758
1.30345
1.29165
13-02-2020
1.303400
1.30730
1.29860
1.31210
1.29470
1.3004
1.2899
14-02-2020 1.300075
1.30395
1.29855
1.30548
1.29468
1.29385
1.29315
Table no.10- Pivot point of GBPUSD

- 45 -
Candlestick pattern
Chart no.6 Candlestick of GBPUSD
RSI
Chart no.7 RSI of GBPUSD
Moving Average
Chart no.8 Moving average of GBPUSD

- 46 -
Stochastic oscillator:
Chart no.9 stochastic oscillator for GBPUSD
Trade/ Transaction history of GBPUSD:
20.01.2020- placed BUY order at 1.2996 and closed position at 1.29852- 72 dollars (profit)
21.01.2020- placed buy order at 1.30208 and closed position at 1.30147- 30.50 dollars (loss)
21.01.2020- placed buy order at 1.30055 and closed position at 1.30086- 15.50 dollars (profit)
22.01.2020- placed buy order at 1.30568 (S/L: 1.30485 T/P: 1.30493) - 37.50 dollars (loss)
23.01.2020- placed sell order at 1.31211 and closed position at 1.31255 - 22 dollars (loss)
24.01.2020- placed buy order at 1.31350 and closed position at 1.31285- 32.50 dollars (loss)
28.01.2020- placed sell order at 1.30317 (S/L: 1.30334 and T/P: 1.30323) - 3 dollars (loss)
30.01.2020 - placed sell order at 1.30026 and closed position at 1.29824- 202 dollars (profit)
31.01.2020- placed buy order at 1.30981 and closed position at 1.30970 - 5.50 dollars (loss)
03.02.2020- places sell order at 1.31673 and closed position at 1.30606- 533.50 dollars (profit)
04.02.2020- placed sell order at 1.29481 (S/L : 1.2949) - 4.50 dollars( loss)
05.02.2020- placed buy order at 1.30189 and closed position at 1.30151 - 19 dollars (loss)
07.02.2020- placed sell order at 1.29842 and closed position at 1.29378 - 232 dollars (profit)
12.02.2020- placed buy order at 1.29410 and closed position at 1.29609- 99.50 dollars (profit)

- 47 -
Interpretation:
Most of my trades focused on GBP because it is one of the major currencies and frequently traded
currencies and the trader can make profits in intra-day trades with effective analysis. The market is
highly volatile and fluctuating, therefore if the trends are analyzed, it is easy to make money.
On 20.01.2020 a sell order was placed for GBPUSD 0.50 at 1.29905 and made a profit of 72
dollars. However, because of the sudden fall in the market, as seen in the graph, on 21.02.2020 a
buy at 1.30208 lead to a loss of 30.50 dollars. On 30.01.2020, a sell order was placed, 1.00 at
1.30026 and made a profit of 202 dollars because of the bearish trend on the market.
On 03.02.2020 there is a peak or the price reaches to 1.319000, after this period a drastic drop
can be viewed in the above graphs. The sold call was placed as per the main signal of the
stochastic oscillators, GBPUSD of 0.50 was sold at 1.31673 and the order was closed at price
1.30606 and a profit of 533.50 dollars was made because of the fall in pips and because the
support price according to main pivot point was broken.
Likewise, a sell order on 04.02.2020 at 1.30005 was able to earn a profit of 257.50 dollars at
1.29490 as per the daily pivot point calculations. Again because of the bearish trend in the market,
a sell order on 07.02.2020 made a profit of 232 dollars. On 12.02.2020, an increasing trend is seen
in the graph, so a buy order at 1.29410 which was closed at 1.29609 earned a profit of 99.50
dollars.

- 48 -
3. USDJPY
This currency pair signifies the exchange of U.S. Dollars and the Japanese Yen. It denotes how many
Japanese Yen (quote currency) is required to buy one U.S. dollar (base currency). The Japanese Yen is
additionally widely used as a reserve currency a bit like the U.S. Dollar, the USDJPY rate of exchange is
one among the foremost liquid and traded currency pair around the world.
Daily Data of USDJPY from 20th
Jan to 14th
Feb 2020
Date Open price High price Low price Close price
20-01-2020 109.82 109.91 109.7 109.77
21-01-2020 110.09 110.09 109.62 109.82
22-01-2020 109.78 110.13 109.76 110.09
23-01-2020 109.77 109.96 109.73 109.79
24-01-2020 109.73 109.88 109.56 109.77
27-01-2020 109.99 110.03 109.54 109.73
28-01-2020 109.82 110 109.77 110
29-01-2020 109.52 109.85 109.3 109.83
30-01-2020 108.69 109.55 108.55 109.52
31-01-2020 108.33 108.8 108.31 108.69
03-02-2020 108.94 109.13 108.31 108.34
04-02-2020 109.03 109.08 108.58 108.95
05-02-2020 109.15 109.27 108.98 109.02
06-02-2020 108.89 109.2 108.75 109.14
07-02-2020 109.28 109.28 108.72 108.89
10-02-2020 109.49 109.65 109.17 109.28
11-02-2020 109.84 109.87 109.27 109.49
12-02-2020 109.86 110.09 109.82 109.84
13-02-2020 110.18 110.22 109.76 109.87
14-02-2020 110.16 110.22 110.05 110.18
Table no.11- Daily data of USDJPY

- 49 -
Pivot point calculation from the data:
Date PP R1 S1 R2 S2 R3 S3
20-01-2020 109.8 109.900 109.690 110.010 109.590 109.710 109.480
21-01-2020 109.905 110.190 109.720 110.375 109.435 109.520 109.250
22-01-2020 109.94 110.120 109.750 110.310 109.570 109.770 109.380
23-01-2020 109.813 109.895 109.665 110.043 109.583 109.795 109.435
24-01-2020 109.735 109.910 109.590 110.055 109.415 109.530 109.270
27-01-2020 109.823 110.105 109.615 110.313 109.333 109.465 109.125
28-01-2020 109.898 110.025 109.795 110.128 109.668 109.745 109.565
29-01-2020 109.625 109.950 109.400 110.175 109.075 109.200 108.850
30-01-2020 109.078 109.605 108.605 110.078 108.078 108.495 107.605
31-01-2020 108.533 108.755 108.265 109.023 108.043 108.355 107.775
03-02-2020 108.68 109.050 108.230 109.500 107.860 108.390 107.410
04-02-2020 108.91 109.240 108.740 109.410 108.410 108.420 108.240
05-02-2020 109.105 109.230 108.940 109.395 108.815 109.020 108.650
06-02-2020 108.995 109.240 108.790 109.445 108.545 108.710 108.340
07-02-2020 109.043 109.365 108.805 109.603 108.483 108.635 108.245
10-02-2020 109.398 109.625 109.145 109.878 108.918 109.195 108.665
11-02-2020 109.618 109.965 109.365 110.218 109.018 109.175 108.765
12-02-2020 109.903 109.985 109.715 110.173 109.633 109.925 109.445
13-02-2020 110.008 110.255 109.795 110.468 109.548 109.725 109.335
14-02-2020 110.153 110.255 110.085 110.323 109.983 110.015 109.915
Table no.12- Pivot Point of USDJPY

- 50 -
Candlestick pattern
Chart no.10 Candlestick of USDJPY
RSI
Chart no.11 RSI of USDJPY
- 51 -
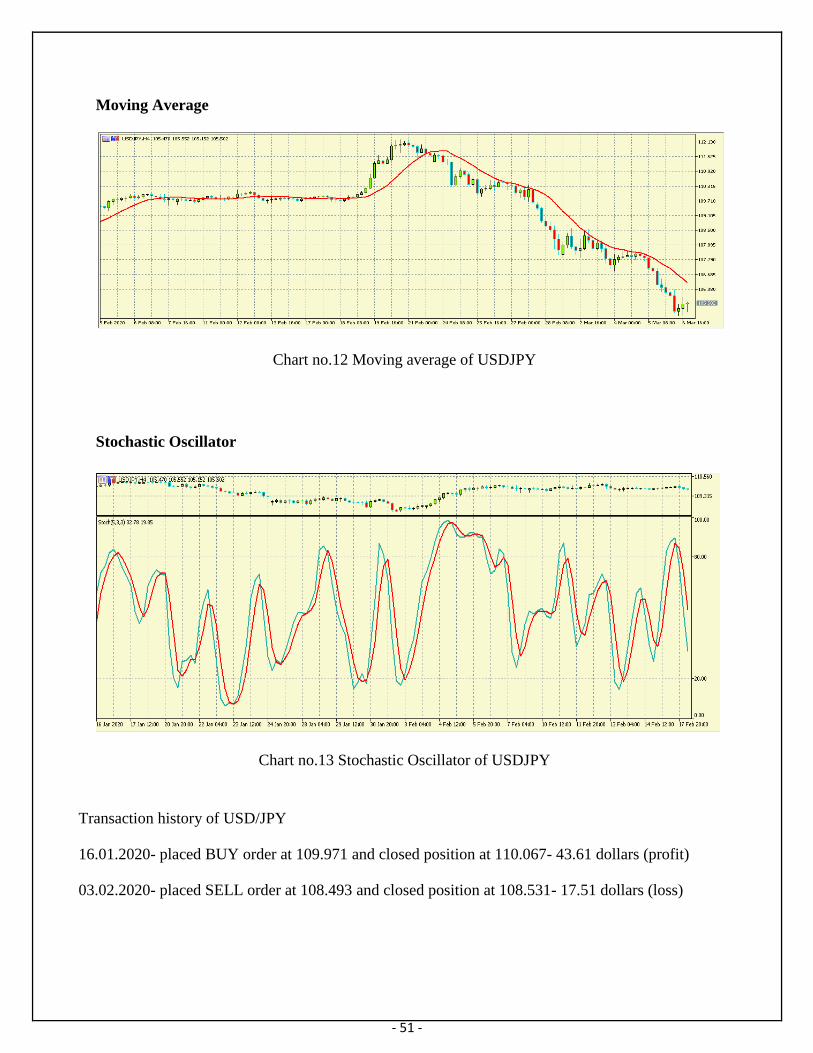
Moving Average
Chart no.12 Moving average of USDJPY
Stochastic Oscillator
Chart no.13 Stochastic Oscillator of USDJPY
Transaction history of USD/JPY
16.01.2020- placed BUY order at 109.971 and closed position at 110.067- 43.61 dollars (profit)
03.02.2020- placed SELL order at 108.493 and closed position at 108.531- 17.51 dollars (loss)

- 52 -
4. USDCHF
CHF is the code used to denote Swiss Franc. This currency pair is popularly known as trading of
‘Swissie’. It signifies how many Swiss Franc (quote currency) is required to buy one U.S. Dollar
(base currency). It considered as the fifth largest trading currency and is mostly safe because of
the country’s stable position.
Daily data of USDCHF from 20
th Jan to 14
th Feb 2020
Date Open price High price Low price Close price
20-01-2020 0.9791 0.9824 0.9785 0.982
21-01-2020 0.9781 0.9797 0.976 0.9793
22-01-2020 0.9758 0.9786 0.9741 0.9783
23-01-2020 0.9774 0.9789 0.975 0.9759
24-01-2020 0.9781 0.9785 0.9759 0.9773
27-01-2020 0.9749 0.9782 0.9739 0.9776
28-01-2020 0.9733 0.9758 0.9731 0.9746
29-01-2020 0.9692 0.9748 0.9678 0.9735
30-01-2020 0.9659 0.9705 0.9653 0.9693
31-01-2020 0.9635 0.9671 0.9629 0.966
03-02-2020 0.9694 0.9713 0.9628 0.9632
04-02-2020 0.973 0.9738 0.9679 0.9695
05-02-2020 0.9731 0.9768 0.9725 0.9732
06-02-2020 0.9696 0.9743 0.9678 0.9729
07-02-2020 0.971 0.972 0.9681 0.9695
10-02-2020 0.969 0.972 0.9684 0.9712
11-02-2020 0.9679 0.9704 0.9668 0.9688
12-02-2020 0.9686 0.973 0.9677 0.9677
13-02-2020 0.9681 0.9691 0.9661 0.9688
14-02-2020 0.968 0.97 0.967 0.9684
Table no.13 daily data of USDCHF
- 53 -
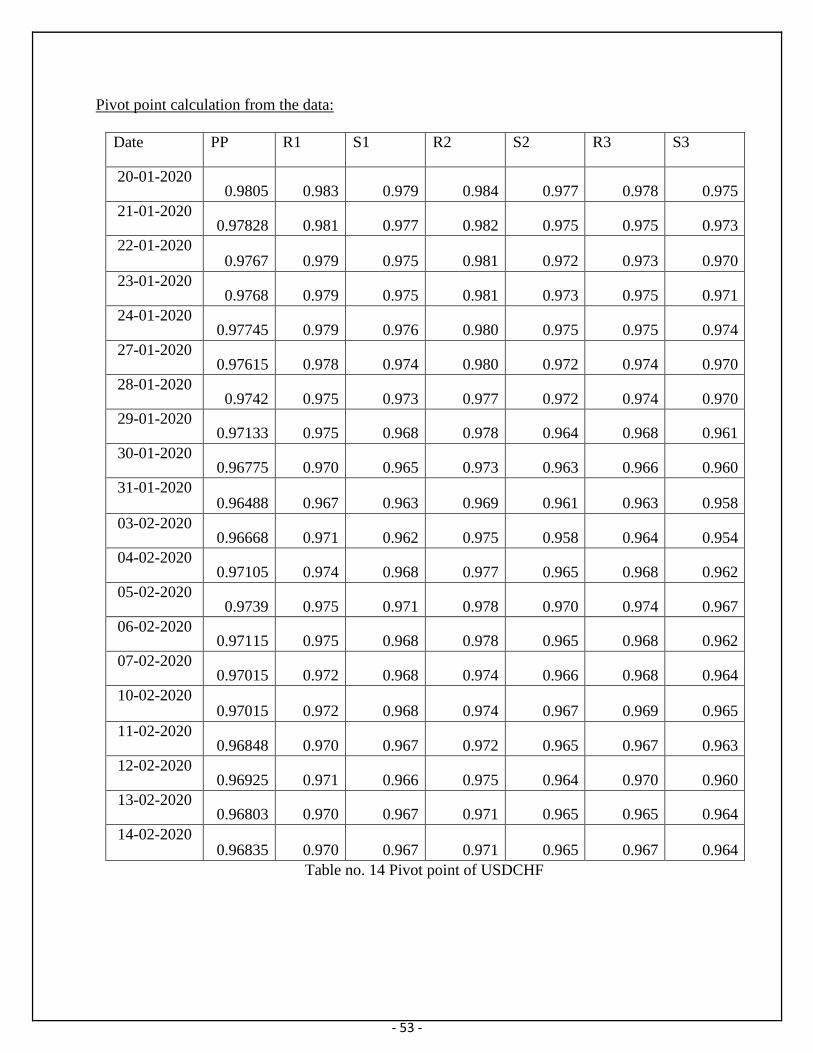
Pivot point calculation from the data:
Date PP R1 S1 R2 S2 R3 S3
20-01-2020 0.9805 0.983 0.979 0.984 0.977 0.978 0.975
21-01-2020 0.97828 0.981 0.977 0.982 0.975 0.975 0.973
22-01-2020
0.9767
0.979
0.975
0.981
0.972
0.973
0.970
23-01-2020 0.9768 0.979 0.975 0.981 0.973 0.975 0.971
24-01-2020 0.97745 0.979 0.976 0.980 0.975 0.975 0.974
27-01-2020 0.97615 0.978 0.974 0.980 0.972 0.974 0.970
28-01-2020 0.9742 0.975 0.973 0.977 0.972 0.974 0.970
29-01-2020 0.97133 0.975 0.968 0.978 0.964 0.968 0.961
30-01-2020 0.96775 0.970 0.965 0.973 0.963 0.966 0.960
31-01-2020
0.96488
0.967
0.963
0.969
0.961
0.963
0.958
03-02-2020 0.96668 0.971 0.962 0.975 0.958 0.964 0.954
04-02-2020 0.97105 0.974 0.968 0.977 0.965 0.968 0.962
05-02-2020 0.9739 0.975 0.971 0.978 0.970 0.974 0.967
06-02-2020 0.97115 0.975 0.968 0.978 0.965 0.968 0.962
07-02-2020 0.97015 0.972 0.968 0.974 0.966 0.968 0.964
10-02-2020
0.97015
0.972
0.968
0.974
0.967
0.969
0.965
11-02-2020 0.96848 0.970 0.967 0.972 0.965 0.967 0.963
12-02-2020 0.96925 0.971 0.966 0.975 0.964 0.970 0.960
13-02-2020 0.96803 0.970 0.967 0.971 0.965 0.965 0.964
14-02-2020
0.96835
0.970
0.967
0.971
0.965
0.967
0.964
Table no. 14 Pivot point of USDCHF
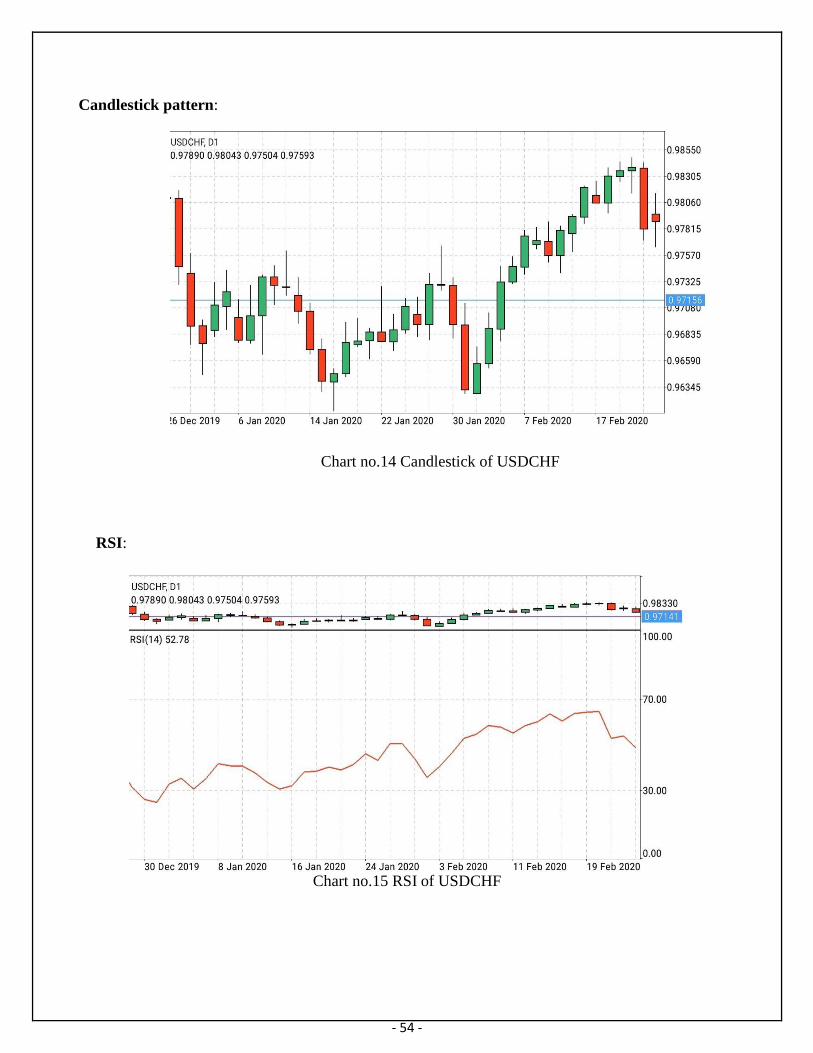
- 54 -
Candlestick pattern:
Chart no.14 Candlestick of USDCHF
RSI:
Chart no.15 RSI of USDCHF

- 55 -
Moving Average:
Chart no.16 Moving average of USDCHF
Stochastic Oscillator
Chart no.17 stochastic oscillator of USDCHF
Transaction history of USD/CHF
16.01.2020- placed buy order at 0.96413 and closed position at 0.96448- 36.29 dollars (profit)
17.01.2020- placed buy order at 0.96474 and closed position at 0.96503- 15.03 dollars (profit)
20.01.2020- placed sell order at 0.96839 and closed position at 0.96816- 11.88 dollars (profit)
22.01.2020- placed buy order at 0.96987 and closed position at 0.96974- 6.70 (loss)

- 56 -
5. AUDUSD
This is currency pair is commonly referred as trading the ‘Aussie’. The rate of exchange depicts how many
U.S. Dollars (quote currency) it costs to buy one Australian dollar (base currency). The currency market
volatility is mostly regulated by its fluctuating commodity market.
Daily data of AUD/USD from 20th
Jan to 14th
Feb 2020
Date Open price High price Low price Close price
20-01-2020 0.6719 0.6732 0.6708 0.6713
21-01-2020 0.6737 0.6746 0.6706 0.672
22-01-2020 0.6713 0.6751 0.6711 0.6738
23-01-2020 0.6687 0.6737 0.6681 0.6715
24-01-2020 0.6674 0.6708 0.6661 0.6685
27-01-2020 0.6731 0.6737 0.6662 0.6674
28-01-2020 0.6745 0.6765 0.6726 0.673
29-01-2020 0.6738 0.6775 0.6723 0.6747
30-01-2020 0.6693 0.6742 0.6678 0.6739
31-01-2020 0.6694 0.6708 0.6683 0.6692
03-02-2020 0.6722 0.673 0.6682 0.6688
04-02-2020 0.6753 0.6756 0.6699 0.672
05-02-2020 0.6761 0.6778 0.6735 0.6754
06-02-2020 0.676 0.6766 0.6736 0.6762
07-02-2020 0.6829 0.6829 0.6752 0.6762
10-02-2020 0.6847 0.6858 0.6817 0.6825
11-02-2020 0.6844 0.6879 0.6829 0.6848
12-02-2020 0.6844 0.6857 0.6826 0.6845
13-02-2020 0.6873 0.6881 0.6842 0.6846
14-02-2020 0.6873 0.6889 0.6855 0.6872
Table no.15 daily data of AUDUSD
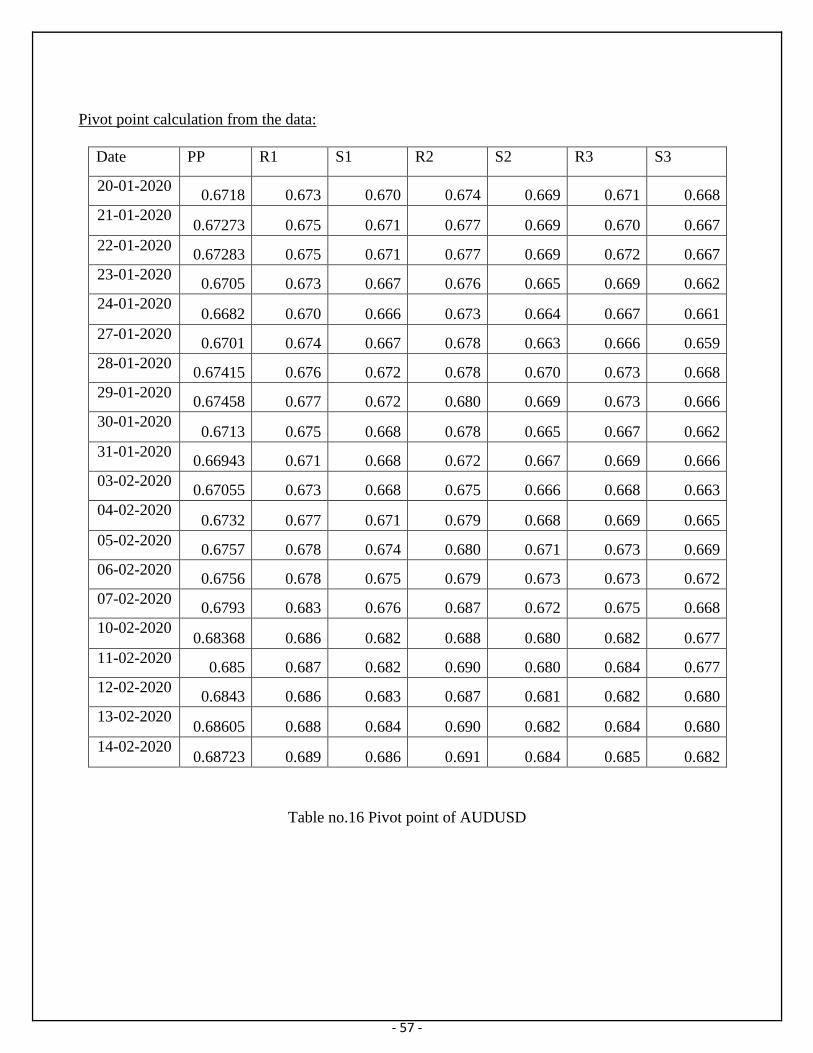
- 57 -
Pivot point calculation from the data:
Date PP R1 S1 R2 S2 R3 S3
20-01-2020 0.6718 0.673 0.670 0.674 0.669 0.671 0.668
21-01-2020 0.67273 0.675 0.671 0.677 0.669 0.670 0.667
22-01-2020 0.67283 0.675 0.671 0.677 0.669 0.672 0.667
23-01-2020 0.6705 0.673 0.667 0.676 0.665 0.669 0.662
24-01-2020 0.6682 0.670 0.666 0.673 0.664 0.667 0.661
27-01-2020 0.6701 0.674 0.667 0.678 0.663 0.666 0.659
28-01-2020 0.67415 0.676 0.672 0.678 0.670 0.673 0.668
29-01-2020 0.67458 0.677 0.672 0.680 0.669 0.673 0.666
30-01-2020 0.6713 0.675 0.668 0.678 0.665 0.667 0.662
31-01-2020 0.66943 0.671 0.668 0.672 0.667 0.669 0.666
03-02-2020 0.67055 0.673 0.668 0.675 0.666 0.668 0.663
04-02-2020 0.6732 0.677 0.671 0.679 0.668 0.669 0.665
05-02-2020 0.6757 0.678 0.674 0.680 0.671 0.673 0.669
06-02-2020 0.6756 0.678 0.675 0.679 0.673 0.673 0.672
07-02-2020 0.6793 0.683 0.676 0.687 0.672 0.675 0.668
10-02-2020 0.68368 0.686 0.682 0.688 0.680 0.682 0.677
11-02-2020 0.685 0.687 0.682 0.690 0.680 0.684 0.677
12-02-2020 0.6843 0.686 0.683 0.687 0.681 0.682 0.680
13-02-2020 0.68605 0.688 0.684 0.690 0.682 0.684 0.680
14-02-2020 0.68723 0.689 0.686 0.691 0.684 0.685 0.682
Table no.16 Pivot point of AUDUSD

- 58 -
Candlestick pattern
Chart no.17 Candlestick of AUDUSD
RSI
Chart no.18 RSI of AUDUSD

- 59 -
Moving Average
Chart no.19 Moving Average of AUDUSD
Stochastic Oscillator
Chart no.20 Stochastic Oscillator of AUDUSD
Transaction history of AUD/USD:
17.01.2020- placed BUY call at 0.69001 and closed position at 0.69017- 8 dollars (profit)
23.01.2020- placed BUY order at 0.68629 and closed position at 0.68737 - 54 dollars (profit)
The above currencies were traded in the demo account after fundamental and technical analysis
with the help of various tools and suitable decisions were taken in order to earn profits.
Thus, with a deposit of $3000, I was able to fill 154 orders in total and made a profit of $914.96.

- 60 -
CHAPTER 5
Findings and suggestions
DEMO trading account
The best way to learn and train oneself is by using a demo account where virtual money comes
into the picture and then trade in a real account. The demo account is tremendous to gain
experience about the technical components of the software and to check the functionality to
alternate. However, we are able to open a free demo account with maximum forex brokers. To
become a smart and successful forex trader, do not open a real/live account until you are assured
and continuously earn profits in the demo account.
Learning Outcomes with DEMO Trading:
Control emotions:
As a novice to the market, the Demo version plays an essential role to study the software and
also learn the primary concept to use in practice. It facilitates to increase risk-taking measures
and being you all through the times of losses.
Manage temptations:
When the market is shifting upside, trading with the Meta trader4 platform allows governing
temptations whilst one does right and plan to take a next position within the market. To come to
be a successful trader right time it is essential to make the right profits and earnings. Hence, it is
vital to manage our temptations to make gains whenever and wait for actual time.
Avoid greediness:
It is stated that 90% of individuals lose money, largely due to lack of planning, training,
discipline and having poor money management policies. One should not be grasping on money
for the reason that forex is not about getting rich in no time. Every successful dealer in the world
like Warren Buffet, Jessy Livermore becomes rich in stock after execution of proper trading
management rules.
- 61 -
Concentrate on one major currency pair:
It is way too complex to reveal a couple of currency pair while we first begin to trade in the
demo account. A better choice is to focus on one of the major currency pairs since they are
liquid, which commonly means tighter spreads and much less chance of slippage. Also, every
trader or dealer has to concentrate on improving trading strategies to become an expert in dealing
with foreign exchange market
Besides, it is important to keep in mind that there are no shortcuts in this market; because it takes
masses and plenty of practice and exercise to experience a master skill. Practice with a demo
account till you find a technique that helps you understand completely, and confidently execute
buying and selling of shares, one or more currencies, etc.
Incorporating Meta trader 5 platform for real Account
Meta trader 5 or MT5 software is a trading platform which allows and individual to access and to
execute live trades in the foreign exchange market
Advantages of using MT5:
It supports complete price charting system.
It gives almost all the technical tools required for analysis.
It helps in locating the chart pattern and expected future price of currency.
It helps to execute Buy and Sale call options with support and resistance.
It allows accessing trades through gadgets or smart phones with enable database.
Note: Meta trader5 or MT5 is not a 100% perfect trading platform and some features have to add
to it like live stock price updates or alarm calls.
Downloading Meta trader5 platform:
To access and execute a trade with a live account, the company has to consult Forex broker
where he provides the platform to trade. After receiving confirmation mail from GBCFX with
login user ID, client password and trader password( ‘Client password’ is for executing trade
whereas ‘Trader password’ is for viewing purpose only) download the Meta trader5 platform
from any ‘Android’ or ‘IOS’ mobiles to start trading journey.

- 62 -
Journey of trading starts with MT5:
MT5 creates reports after every execution of trade and provides the balance and margin
requirements daily, weekly, monthly and yearly basis.
Working with MT5:
It is a simple task to fill single and multiple orders with just a click on the mouse.
It is easy to circulate orders to new price levels by simply dragging the order line.
It is possible to edit the orders which have been placed with the right-click.
One can observe the position details and effortlessly close or reverse a position.
It is viable to place commonly used orders – indicating stop loss/ take profit.
Apart from various chart based trading software available in the market, it has easy
access through mobile phone as well
After the Technical and Fundamental analysis, a report is submitted to management concerning
taking calls in the market. After the approval of consideration, the calls are being taken and the
Client's weekly report is prepared which discloses each information of calls taken in the real
account.
Due Analysis of Calls taken:
After the due homework with regards to analysis, if any losses incurred, it must be disclosed with
due information with reasoning capability to explain the market scenario to the client based on a
call placed and stop loss is triggered.
Note: For every call taken, $1 goes to a client account and $1 goes to Company (JMarathon) as a
Commission.

Bibliography
• Technical Analysis - www.babypips.com (accessed 6th
Jan ’2020)
• Fundamental information - www.forexfactory.com (accessed 6th
Jan’ 2020)
• Meta Trader 5 Platform - www.gbcfx.com (accessed 6th
Jan’ 2020)
• Download Meta trader5 platform - www.metatrader4.com (accessed 10th Jan’ 2020)
• Daily articles and information on forex market - www.investing.com (accessed 10th
Jan’
2020)
• American Stock market coverage- www.nasdaq.com (accessed 10th
Jan’ 2020)
• Analyst respective calls and forum discussion- www.actionforex.com (accessed from 10th
Jan’ 2020)

ACTIVITY CHART
Sl.
No. Activity Activity Details Duration
1 Activity-1
Understanding the nature and functions of the organization. Training on basics of currency
market and related theoretical concepts.
Week-1
03.01.2020 to 10.01.2020
2 Activity-2
Practicing the trade mechanisms and discussion
with the guide about the research design. Week-2
13.01.2020 to 18.01.2020
3 Activity-3
Data collection from the source, tabulating and
presenting it for suggestions and further analysis. Week-3
20.01.2020 to 25.01.2020
4 Activity-4
Analysis and interpretation of data.
Week-4
27.01.2020 to 01.02.2020
5 Activity-5
Finalization of the report and presenting the same to
the guide. Week-5
03.02.2020 to 08.02.2020
6 Activity-6 Submission of final report to guide. Week-6
10.02.2020 to 15.02.2020
Name and Signature of the Student